Article

An Improved Multiaxial Low-Cycle Fatigue Life Prediction Model Based on Equivalent Strain Approach

School of Mechanical Engineering, Xinjiang University of China, Urumqi 830046, China
*
Author to whom correspondence should be addressed.
Metals 2023, 13(3), 629; https://doi.org/10.3390/met13030629
Submission received: 24 January 2023 / Revised: 16 March 2023 / Accepted: 19 March 2023 / Published: 21 March 2023
(This article belongs to the Special Issue Fracture Mechanics of Metals)

Abstract

:
The fatigue life of the materials is significantly reduced under non-proportional loading. In this study, the factors affecting additional hardening are explored, and a hardening function is proposed. Firstly, the stress and strain states of the specimen under multiaxial loading are analyzed, and the deficiencies of the equivalent strain models are discussed. Secondly, the factors affecting the additional hardening are analyzed from both stress and strain perspectives, and the effect of phase differences on fatigue life is investigated. The stress on the critical plane is considered to reflect its effect on crack initiation and growth. An improved multiaxial low-cycle fatigue life prediction model is developed based on the equivalent strain approach. Finally, experimental data from five metals are used to verify the established model and are compared with existing classical models. The results show that the proposed model has good accuracy.

1. Introduction

Engineering components are subjected to multiaxial loading in practical applications, such as hot engine components, pressure vessels and vehicles [1]. Multiaxial fatigue is one of the most dominant failure modes of these components [2,3]. Multiaxial fatigue of mechanical components can lead to the failure of the entire mechanical equipment and can result in significant economic losses. Therefore, the research on multiaxial fatigue of mechanical components has an important engineering value.
As a result of the multiaxial loads, unlike uniaxial loads, the stress–strain states of mechanical components are complex, which brings greater difficulties to the fatigue life evaluation and reliability design [4,5,6,7,8]. The early multiaxial fatigue life prediction was derived from the uniaxial fatigue theory. Those parameters cannot describe the physical mechanism of fatigue failure under non-proportional loading and will lead to large errors in fatigue life prediction. In the past few decades, fatigue life prediction of materials under multiaxial loading has been extensively studied. Currently, multiaxial fatigue life prediction models can be divided into three categories [9,10]: (1) the equivalent stress–strain models; (2) critical plane approaches; these theories assume that the fatigue damage process is related to the specific plane; and (3) energy approaches, these theories aim to reveal fatigue damage from the energy conversion.
Strain parameters have important effects on fatigue fracture: shear strain promotes initial crack initiation, normal strain promotes crack propagation, and strain size affects the shape of fatigue fracture [11]. The equivalent strain models have no material constants and have simple forms. Shang and Sun [12] proposed fatigue parameters based on VM criteria, which considered both shear strain and normal strain excursion. The equivalent strain models only consider the effects of strain on the fatigue fracture, and the models have large errors in predicting fatigue life under non-proportional loading. The critical plane method can determine the stress and strain on a random plane under fatigue loading. The normal strain and shear strain on the maximum shear strain plane were used to establish the Brown and Miller model [13] (BM). However, the BM model cannot reflect the additional hardening effect from non-proportional loading. Fatemi and Socie [14] (FS) modified the BM model, where the maximum normal stress on the maximum shear strain amplitude was used to describe the additional hardening effect caused by non-proportional loading. The FS model is suitable for proportional and non-proportional loading, and the life prediction results of various metals are more accurate. Wang and Brown [15] took into account the effect of normal strain excursion on crack growth, and new fatigue life prediction models under two cases were established. Lohr and Ellison [16] proposed a model to calculate the fatigue life of 1-Cr-Mo-V, assuming that the maximum shear strain controls the crack initiation rate. The above models all contain material constants, which are obtained by fitting experimental data under uniaxial conditions. The value of material constants has a significant impact on the prediction accuracy of the model.
Energy-based models are extensively studied. Smith, Watson and Topper [17] (SWT) considered that the stress and strain affected material fatigue fracture, and the SWT model was established. However, the SWT model only used normal stress and strain. Zhao and Jiang [18] studied the fatigue of 7075-T651 aluminum alloy and proposed the modification of the SWT model. Chen et al. [19] developed a model containing shear stress and strain based on the SWT model. Gan and Zhong [20] defined the new non-proportional factor and presented a simple energy model. Lu et al. [21] proposed a new effective energy model containing uniaxial cycle plastic work and an additional hardening effect. Xu et al. [22] proposed a model combining virtual strain energy with the critical plane method. Ince and Glinka [23] presented the fatigue damage parameters of generalized strain energy and generalized strain amplitude. Energy is a scalar quantity, and most energy-based models cannot reflect the fatigue fracture mechanisms of materials. Therefore, the combination of the energy method and the critical plane method can overcome this shortcoming. Multiaxial fatigue studies are conducted with limited experimental data. Nevertheless, fatigue fracture is a complex and random process [24], and the modes of crack initiation and early propagation are obviously different under different multiaxial loadings [25]. In this study, the effect of material properties on additional hardening is analyzed. For different non-proportional loadings, the correlation between the additional hardening and the load characteristics is investigated. A new additional hardening function is proposed, a multiaxial fatigue life prediction model is established based on the equivalent strain approach, and its validity is verified by using the experimental data of five metal materials.

2. Stress and Strain Analysis under Multiaxial Loading

The fatigue failure of the specimen under multiaxial loading is usually related to the specific plane. Before determining the critical plane, it is necessary to determine the stress–strain states of the specimen. In this section, the stress and strain states of a thin-walled tubular specimen under tension and torsion loading are analyzed, and the method of determining the critical plane is given.

2.1. Stress and Strain Analysis of Thin-Walled Tube under Tension and Torsion Loading

The thin-walled tubular specimen was subjected to a combination of tension and torsion loading, and its strain state is shown in Figure 1. Tension loading is applied in the axial direction of the specimen.
Under this loading condition, the stress–strain tensor can be expressed as
σ = ( σ x x τ x y 0 τ x y 0 0 0 0 0 ) ,
ε = ( ε x x 1 / 2 γ x y 0 1 / 2 γ x y υ e f f ε x x 0 0 0 υ e f f ε x x ) ,
where σ x x is the axial stress, τ x y is the shear stress, ε x x is the axial strain, γ x y is the shear strain, and υ e f f is the effective Poisson’s ratio, which is given by
υ e f f = υ e ε e + υ p ε p ε e + ε p .
where υ e is the elastic Poisson’s ratio, υ p is the plastic Poisson’s ratio, ε e is the elastic strain, and ε p is the plastic strain.
The normal and shear strains on the plane which make an angle α with the thin-walled tubular specimen axis are expressed as
ε α = 1 υ e f f 2 ε x x + 1 + υ e f f 2 ε x x cos 2 α + γ x y 2 sin 2 α .
γ α = ( 1 + υ e f f ) ε x x sin 2 α + γ x y cos 2 α ,
where ε α is the axial strain amplitude and γ α is the shear strain amplitude. The sinusoidal strains are applied to the specimen.
ε x x = ε α sin ω t ,
γ x y = γ α sin ( ω t φ ) ,
where φ is the phase difference between the axial and shear strains.
The normal strain and the shear strain on the maximum shear plane are given by
ε n ( t ) = ε α 2 { [ 2 ( 1 + υ e f f ) cos 2 α 2 υ e f f + λ sin 2 α cos φ ] 2 + [ λ sin 2 α sin φ ] 2 } 1 / 2 sin ( ω t ξ ) ,
γ max ( t ) = ε α { [ λ cos 2 α cos φ ( 1 + υ e f f ) sin 2 α ] 2 + [ λ cos 2 α sin φ ] 2 } 1 / 2 sin ( ω t + χ ) ,
where ξ , χ , and λ are given by Equations (10)–(12):
tan ξ = λ sin 2 α sin φ ( 1 + υ e f f ) cos 2 α + ( 1 υ e f f ) + λ sin 2 α cos φ ,
tan χ = λ cos 2 α sin φ λ cos 2 α cos φ ( 1 + υ e f f ) sin 2 α ,
λ = γ α ε α .
Therefore, the phase angle α c of maximum shear plane can be given
tan 4 α c = 2 λ ( 1 + υ e f f ) cos φ ( 1 + υ e f f ) 2 λ 2 .
The phase angle between ε n and γ max is ( ξ + χ ) , ranging between π / 2 and π / 2 . The location of the critical plane and the stress and strain on the critical plane can be calculated using the above methods. Shang et al. [26] verified the applicability of the method under different waveform loadings.

2.2. Determination of Critical Plane of Notched Specimen

Tacking the notched specimens subjected to non-sinusoidal loads, the steps to determine the maximum shear strain plane are as follows.
Step1: Finite element analysis at the root position (critical position) of the notched specimen under a given loading to determine the stress and strain tensor.
Step2: Choose the plane passed through the critical location as the candidate plane, which is determined by angles ϕ and θ . The position of the candidate plane is shown in Figure 2. X Y Z is the initial coordinate system, X Y Z is the transformed coordinate system.
Step3: Through the spatial transformation matrix M to calculate the stress–strain tensor on the candidate plane.
ε i j = M ε i j M T ,   σ i j = M σ i j M T ,
where M T is the transpose matrices of M . M is given by
M = [ cos θ sin ϕ sin θ sin ϕ cos ϕ sin θ cos θ 0 cos θ cos ϕ sin θ cos ϕ sin ϕ ] .
Step4: The maximum shear strain amplitude on candidate plane is calculated, it is expressed as
Δ γ max 2 = max 1 j p 1 j + 1 m p [ ( ε x y ( j ) ε x y ( m ) ) 2 + ( ε x z ( j ) ε x z ( m ) ) 2 ] 1 / 2 ,
where ε x y and ε x z are the strains before coordinate transformation; j and m are the load steps; p is the total number of load steps.
Step5: The maximum value of the shear strain amplitude is determined by changing the values of angles ϕ and θ , and the location of the critical plane is determined.
Step6: The normal strain ranges and maximum normal stress on the maximum shear strain amplitude planes are calculated by the following equations
Δ ε n 2 = 1 2 { max 1 j p j + 1 m p ( ε x x ( j ) ε x x ( m ) ) } ,
σ n , max = max 1 j p { | σ x ( j ) | } .
The above method can determine the location of the critical plane under complex loading conditions.

3. Multiaxial Damage Model for Low-Cycle Fatigue

The fatigue life is significantly reduced under non-proportional loading, and the phenomenon is caused by additional hardening effects. In this section, the classical multiaxial fatigue damage models are introduced. Then, the major factors affecting the additional hardening are explored, and a new multiaxial fatigue life prediction is established.

3.1. The Classical Multiaxial Fatigue Damage Models

Shear and normal strains are the most important parameters to control fatigue process. The equivalent strain Δ ε e q is obtained by combining the maximum shear strain range Δ γ max with the maximum normal strain Δ ε n on the maximum shear plane, based on the VM criteria. The equivalent strain model can be written as
Δ ε e q 2 = 1 3 ( Δ γ max 2 ) 2 + ( Δ ε n 2 ) 2 = σ f E ( 2 N f ) b + ε f ( 2 N f ) c ,
where σ f is the fatigue strength coefficient, ε f is the fatigue ductility coefficient, E is the elastic modulus, and N f is the fatigue life
Fatemi et al. [14] introduced the maximum normal stress on the maximum shear strain amplitude plane, which takes into account the additional strengthening effect and the mean stress during out-of-phase loading. The FS model is expressed as
Δ γ max 2 ( 1 + n σ n , max σ y ) = ( 1 + υ e ) σ f E ( 2 N f ) b + n 2 ( 1 + υ e ) σ f 2 E σ y ( 2 N f ) 2 b +   ( 1 + υ p ) ε f ( 2 N f ) c +   n 2 ( 1 + υ p ) ε f σ f σ y ( 2 N f ) b + c ,
where n is the material constant, which can be obtained by fitting the experimental data under uniaxial and torsional conditions. σ n , max is the maximum normal stress on the maximum shear plane; σ y is the yield strength.
Smith et al. [17] studied the relationship between stress–strain parameters and fatigue life and established the SWT model. The SWT model reflects the mean stress and additional hardening effects. It can be written as
σ max ε a = ( σ f ) 2 E ( 2 N f ) 2 b + ε f σ f ( 2 N f ) b + c ,
where σ max is the maximum axial stress and ε α is the axial strain amplitude.

3.2. A New Multiaxial Fatigue Life Prediction Model

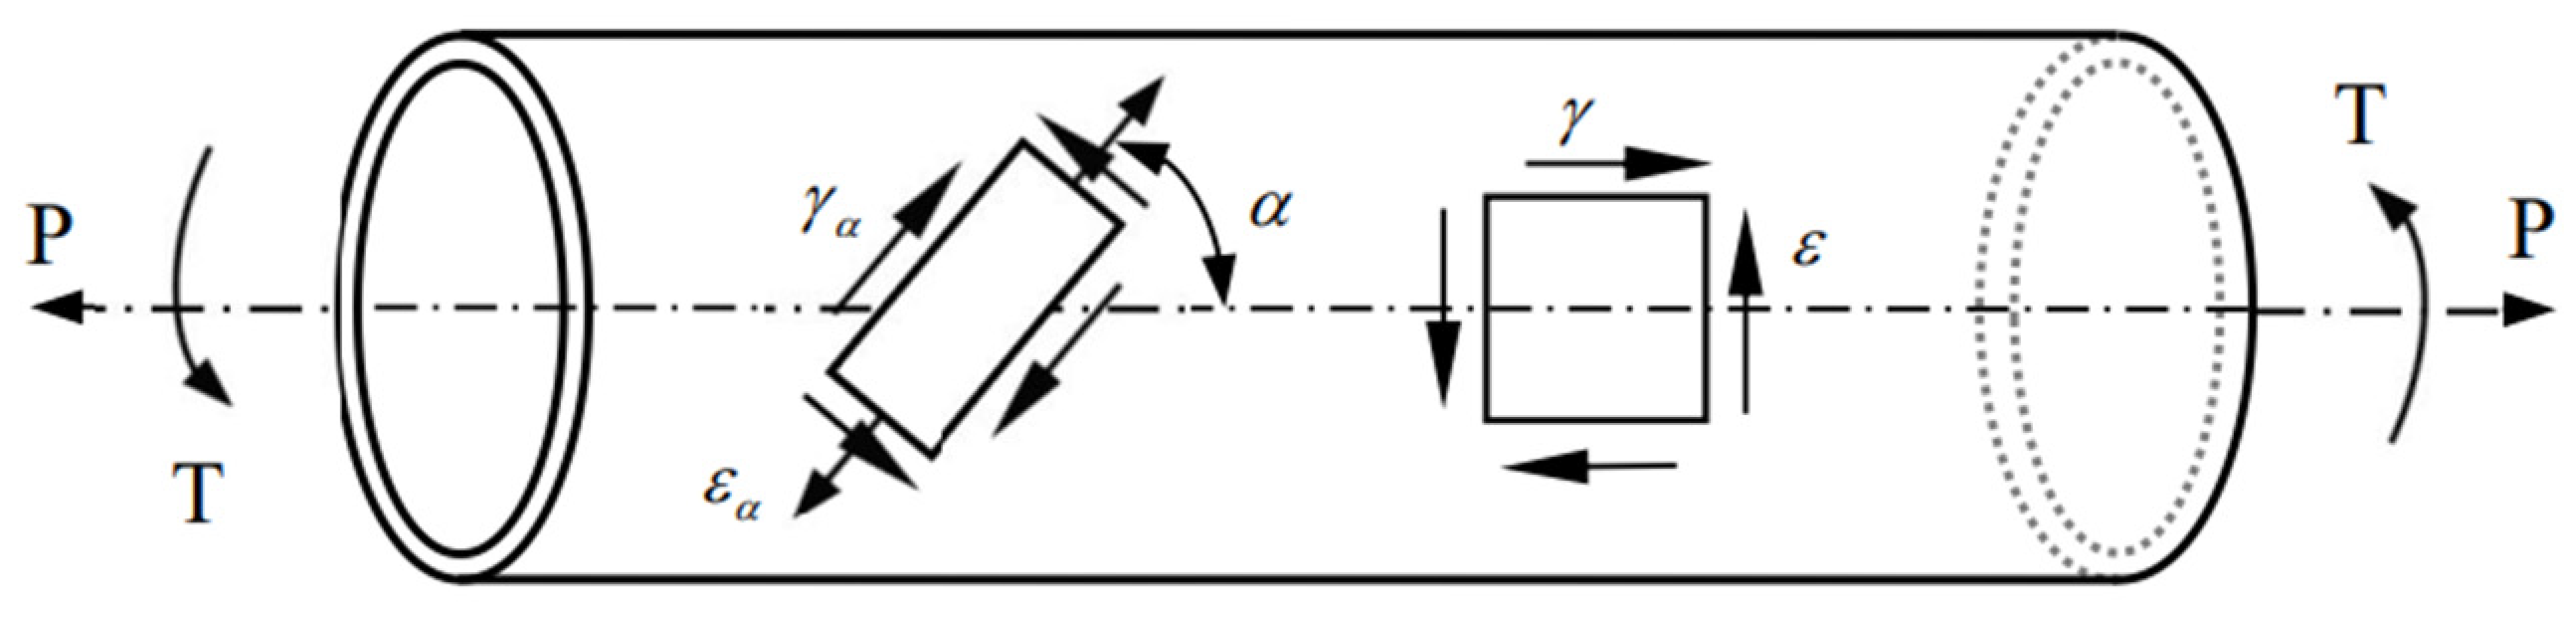
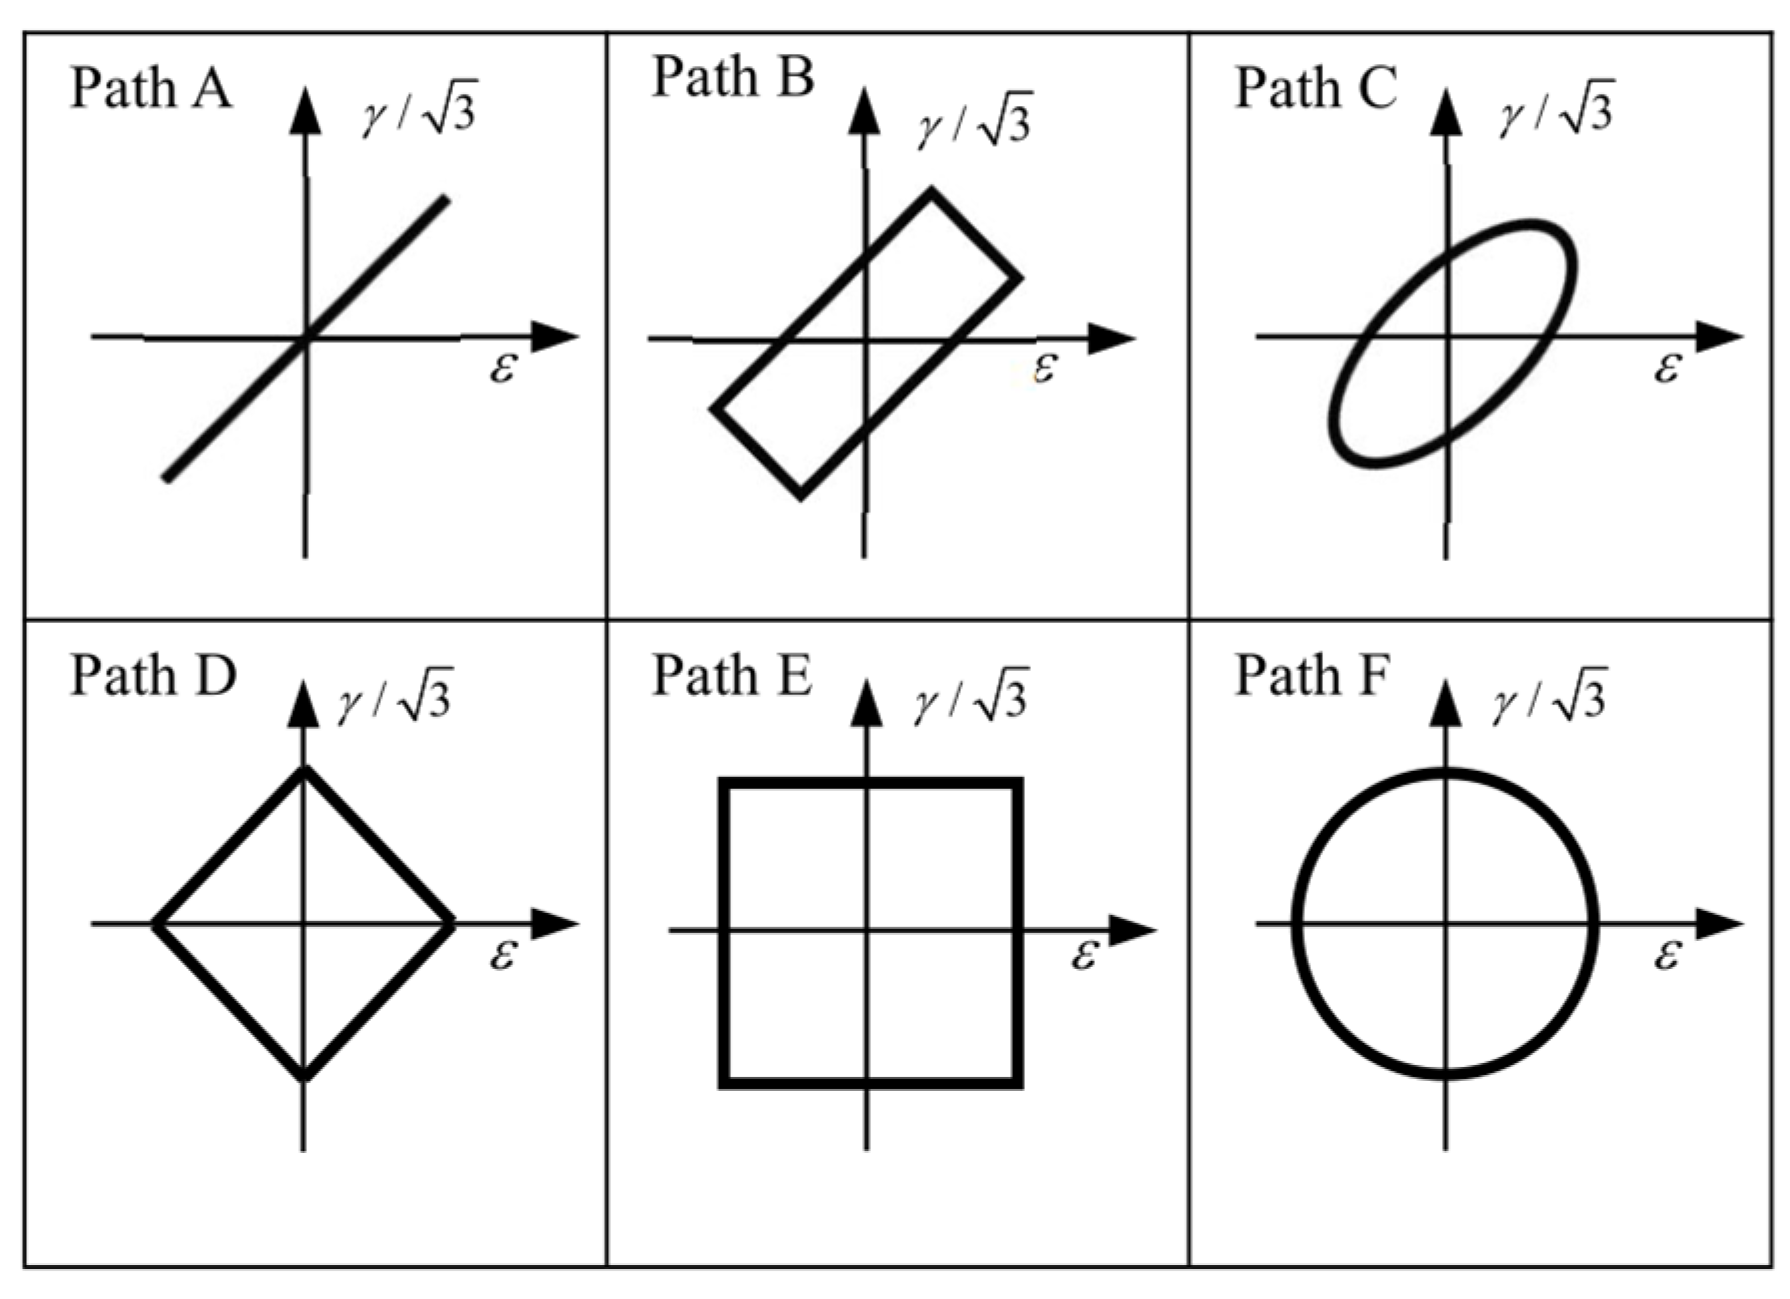
Shear strain and normal strain are two important parameters affecting fatigue life. Taking AISI 304 stainless steel [27] as an example, the correlation between shear strain range and axial strain range on the Δ γ max plane and fatigue life are shown in Figure 3. The is λ equal to 1.5 in all loading paths. ε e q is the VM equivalent strain, which can be written as:
ε e q = 1 3 γ α 2 + ε α 2 .
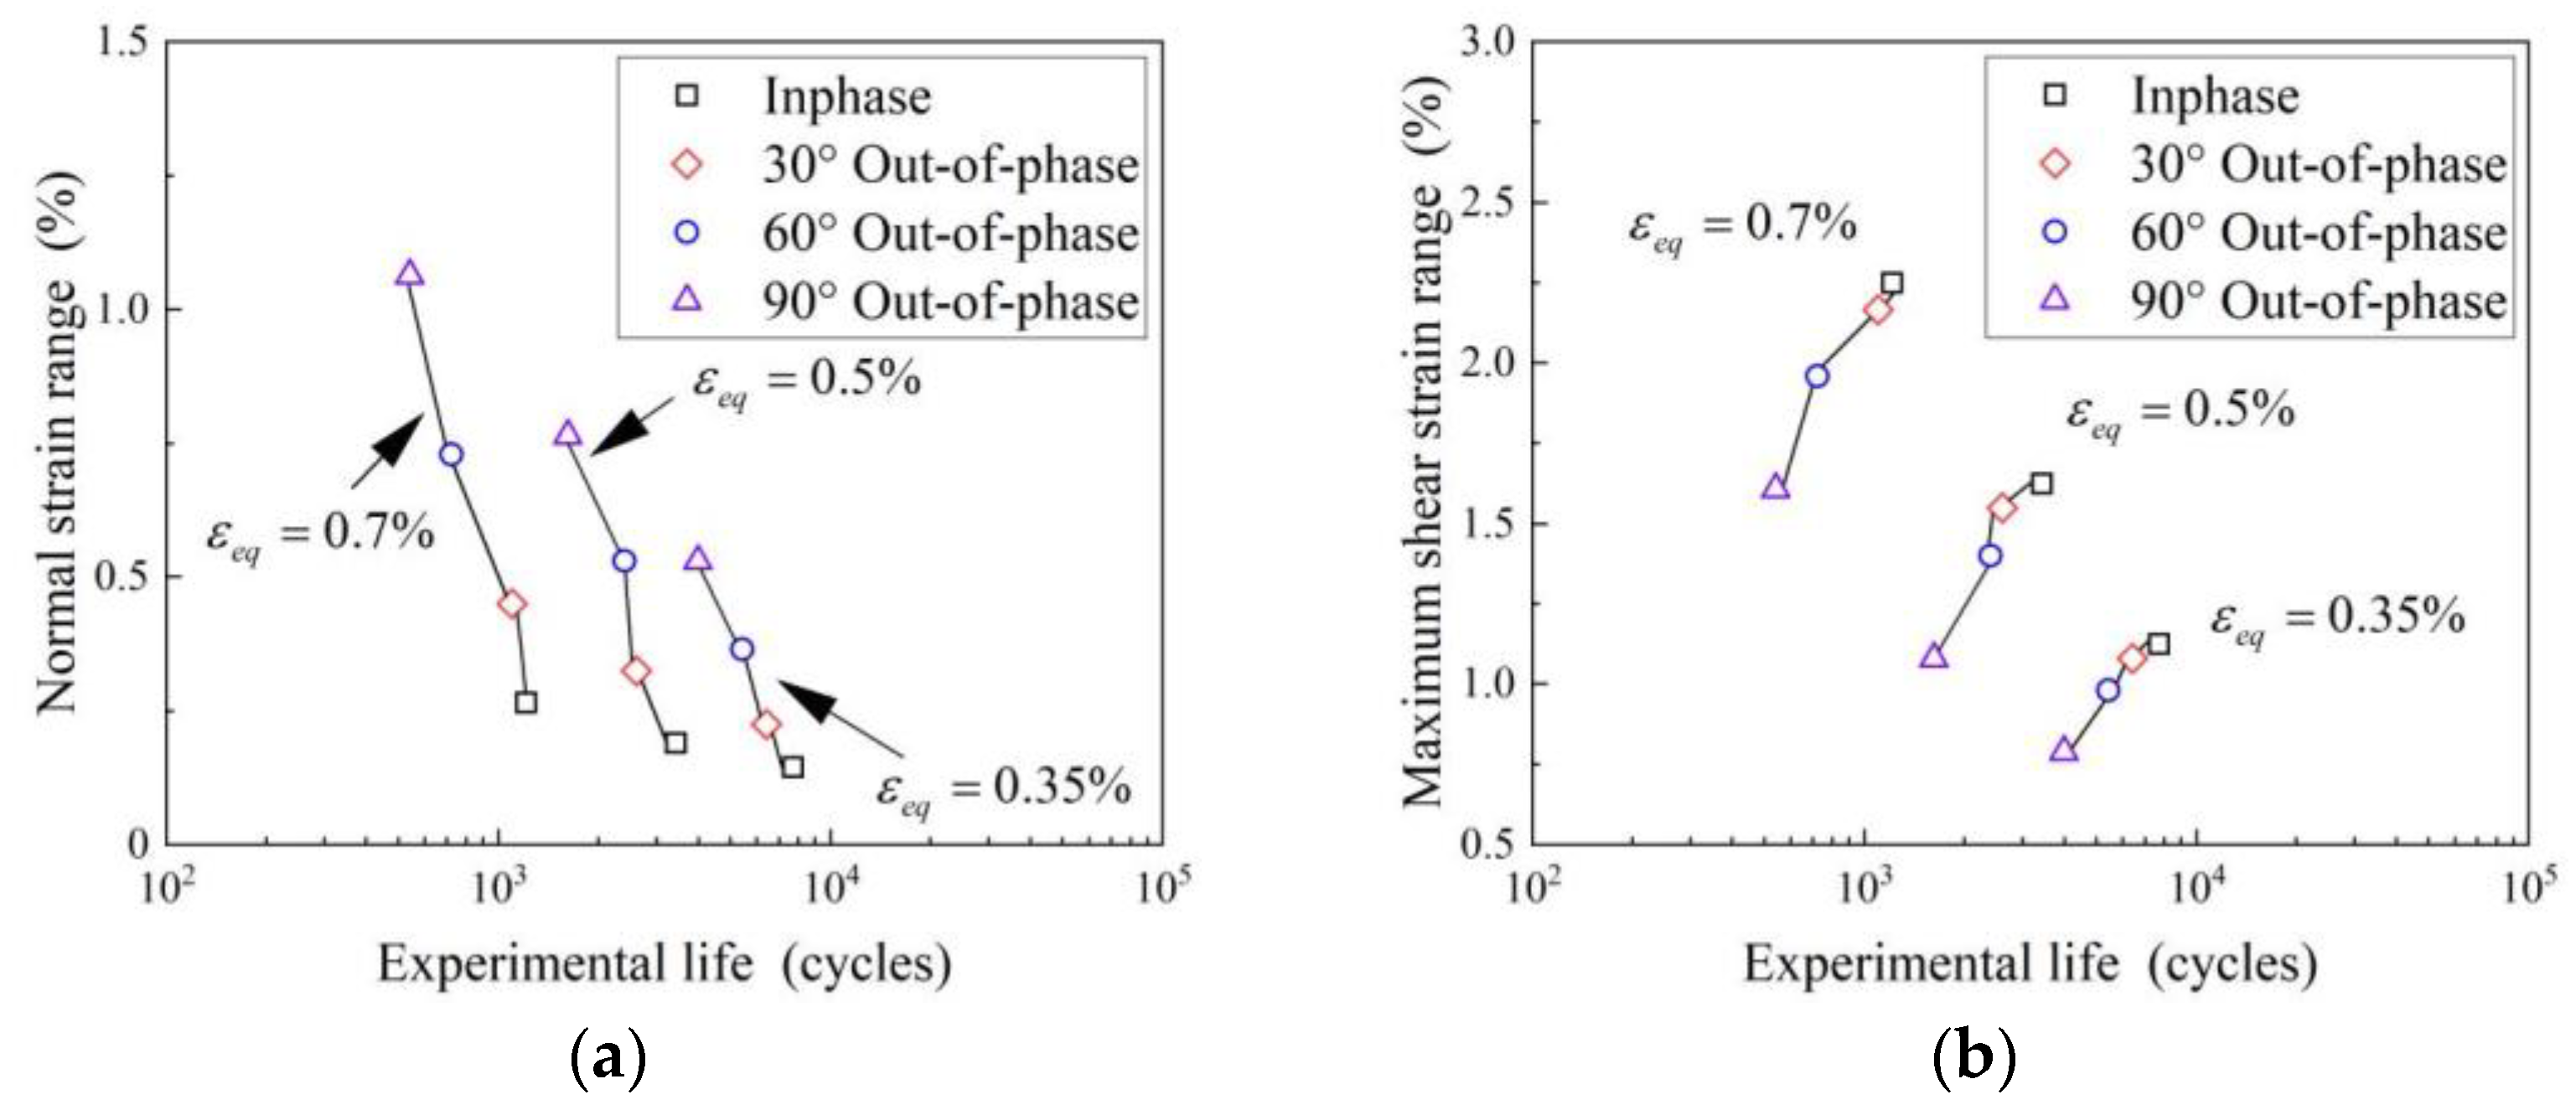
Figure 3a shows that the normal strain range increases with the increase in phase difference under the same equivalent strain. However, Figure 3b shows that the shear strain range decreases with the increase in phase difference. In addition, Figure 3 shows that the fatigue life decreases with the increase in phase difference. The additional damage effect is inconsistent with the trend of the shear strain range. Shear strain and normal strain as fatigue damage parameters cannot reflect additional damage caused by the increasing phase difference of non-proportional loading.
The fatigue life of the material under non-proportional loading is significantly reduced compared with uniaxial loading. This is due to the additional hardening effect caused by non-proportional loading. In the experimental study of 42CrMo [29], it was found that cyclic hardening of the material under non-proportional loading is the main factor for the reduced fatigue life. Under the same equivalent strain, the fatigue life is different under different cyclic loading. However, when the equivalent strains are used as the damage parameter for life prediction, the predicted fatigue life is the same under the same equivalent strain. A large error exists in predicting the fatigue life of equivalent strain models under non-proportional loading.
The degree of additional hardening depends on the materials, and the reduced fatigue life under non-proportional loading also depends on the materials [30,31]. The degree of additional hardening correlates with the micro-structure and slip system of the material. The stacking fault energy is the representative parameter to describe the degree of additional hardening. The materials with low stacking fault energy exhibit planar slip, while the materials with high stacking fault energy exhibit wavy slip [32]. Current research shows that the additional hardening of stainless steel is remarkable. However, this phenomenon is not evident in aluminum alloy material. In this paper, BT9 titanium alloy [33] and 7075-T651 aluminum alloy [18] are used to study the relationship between materials and additional hardening. The equivalent stress can be expressed as
σ e q = σ α 2 + 3 τ α 2 ,
where σ α is the axial stress and τ α is the shear stress.
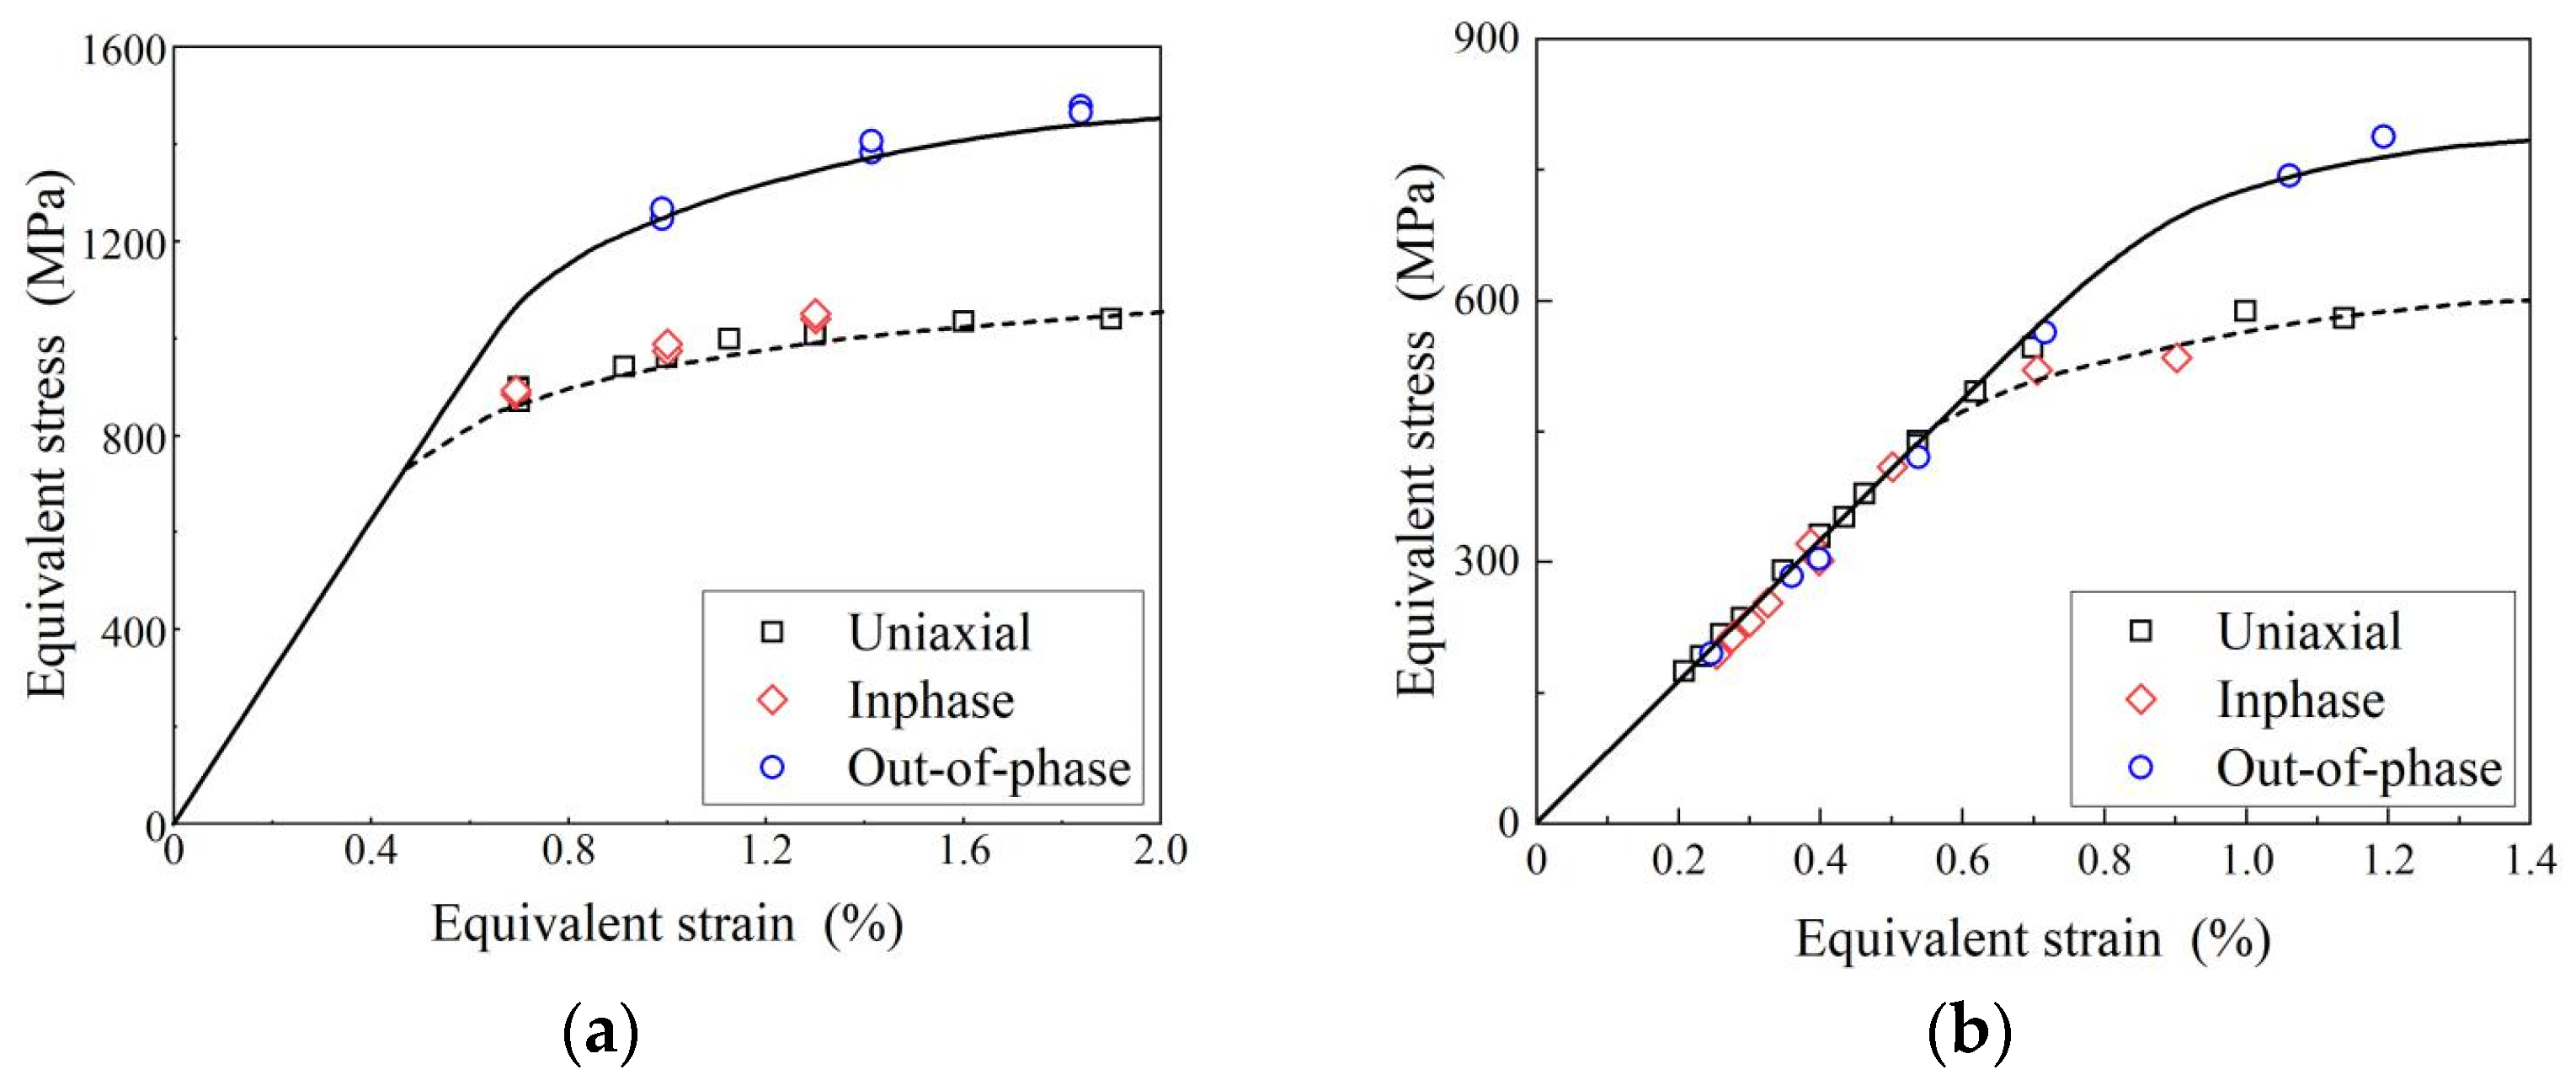
The cyclic stress–strain curve can describe the additional hardening degree of materials. The equivalent cyclic stress–strain relationship of BT9 titanium alloy and 7075-T651 aluminum alloy is shown in Figure 4. Figure 4a shows that the additional hardening effect of BT9 titanium alloy under non-proportional loading is obvious, and the additional hardening degree decreases with the decrease in equivalent strain. Figure 4b shows that the stress level is close to the same equivalent strain, and there is no additional hardening in the elastic deformation region. In the high-strain region, the stress level increases and additional hardening occurs in this region. Additional hardening effects of different materials are different. The effect of material on additional hardening should be considered in the multiaxial fatigue life prediction.
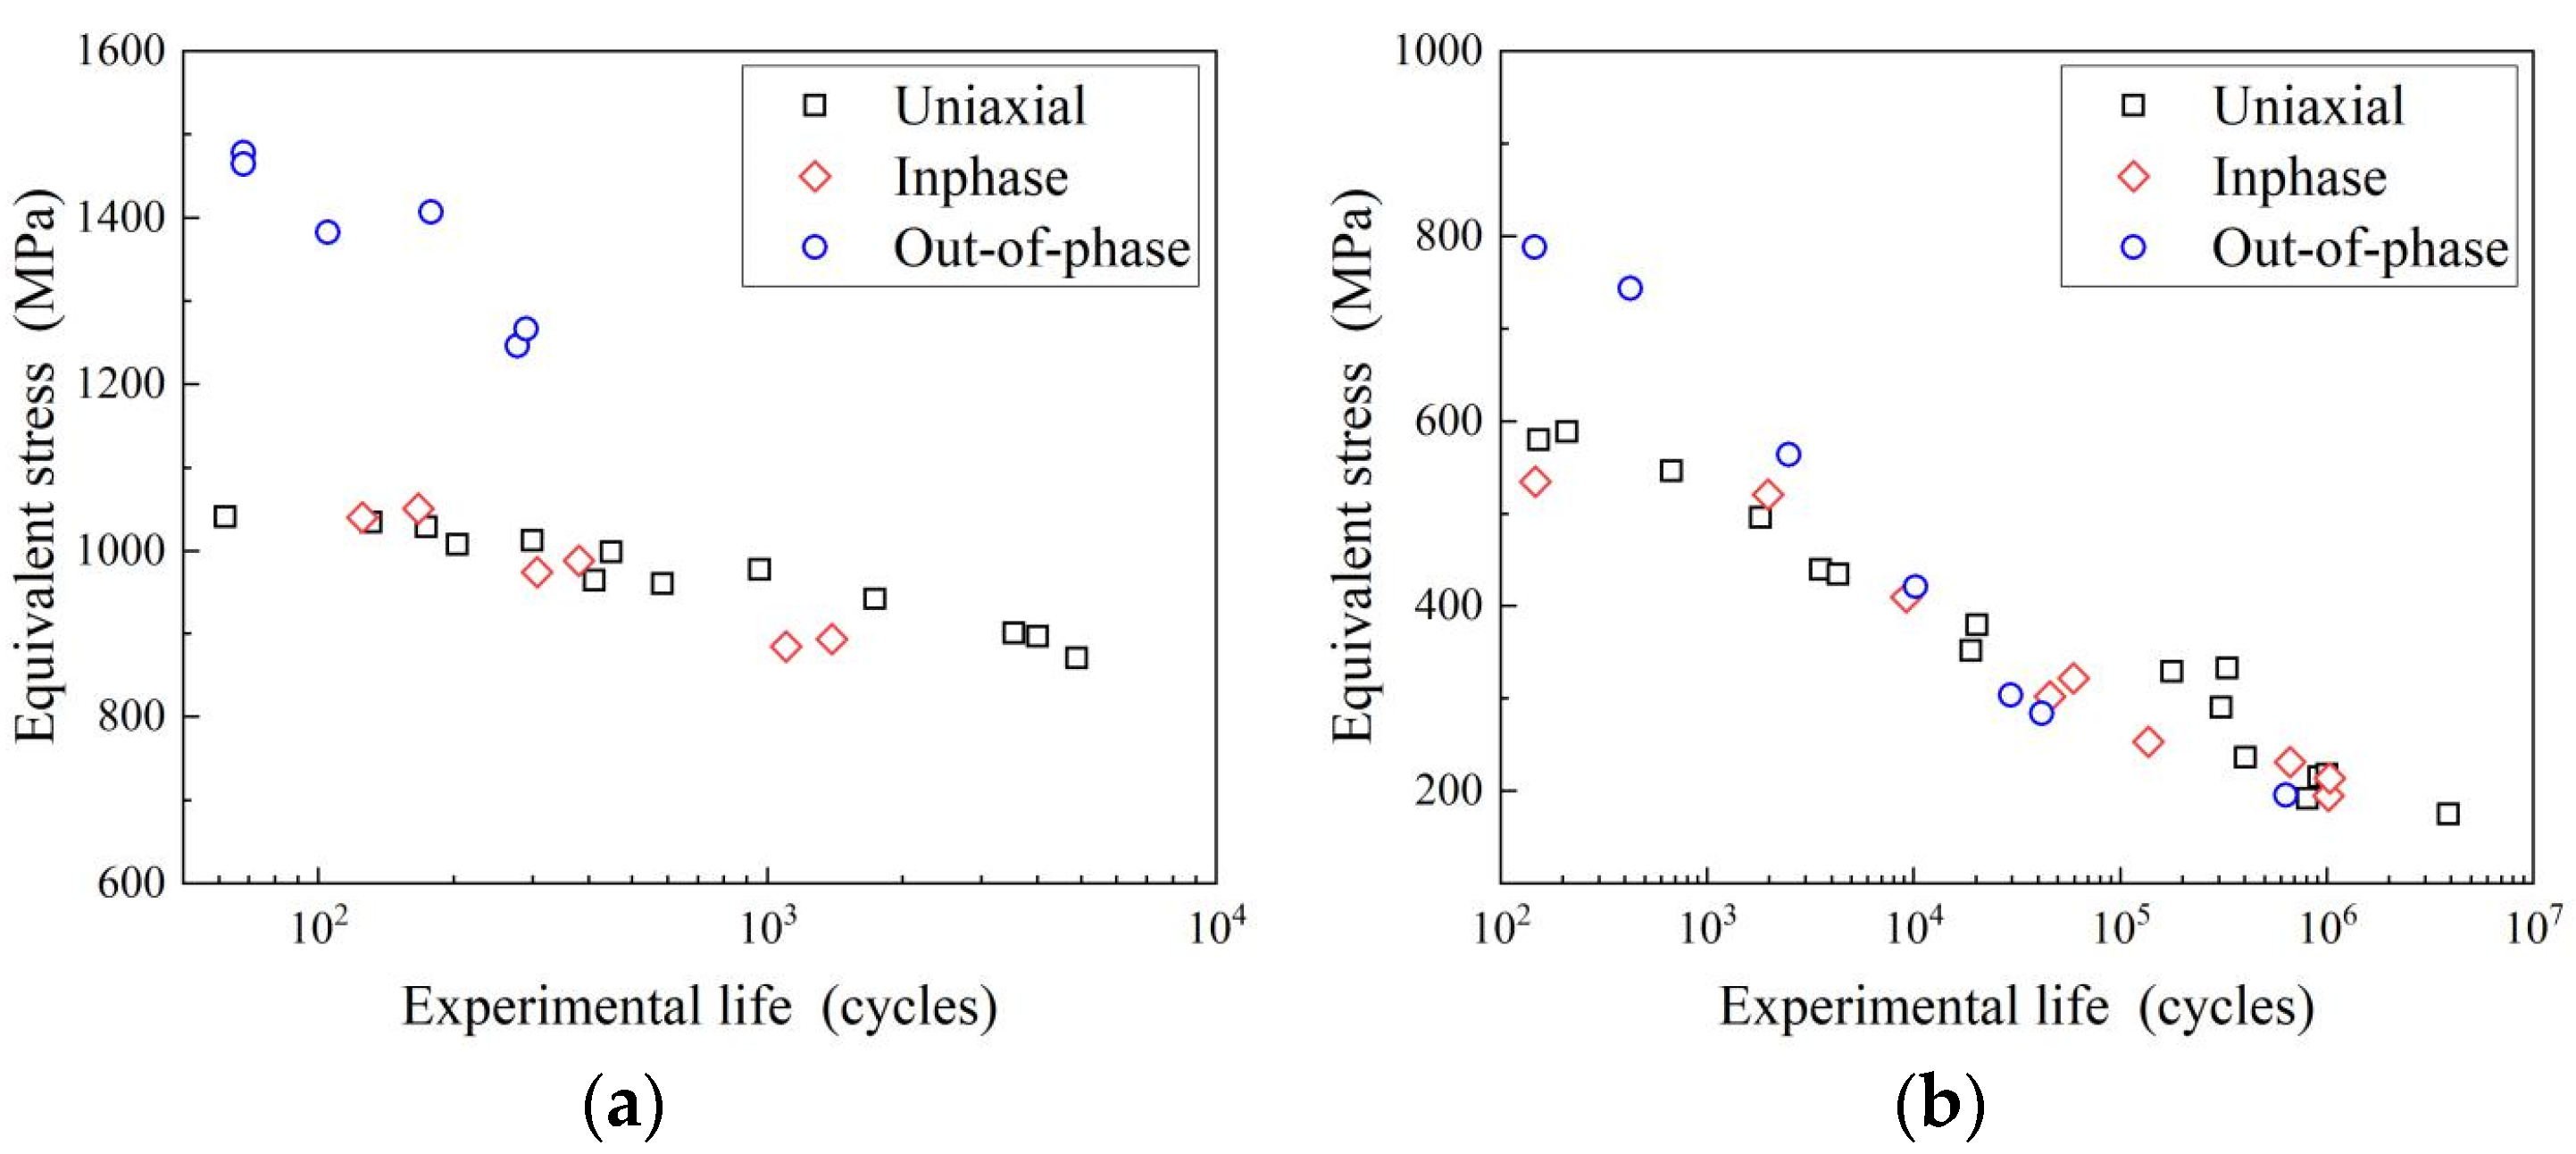
The BT9 titanium alloy has a significant additional hardening, and the equivalent stress is remarkably increased under non-proportional loading. Figure 5a shows that the fatigue life of BT9 titanium alloy is significantly reduced due to non-proportional loading. The equivalent stress increases with the degree of additional hardening. In Figure 5b, the stress amplitude is approximately linearly decreasing. From the perspective of stress amplitude, the additional hardening of aluminum alloy is not significant. Combining Figure 4 and Figure 5, it can be seen that the effect of materials on additional hardening should be considered when building the fatigue life prediction model.
The equivalent strain models cannot reflect the fatigue damage mechanism in a better way. The impact of stress on the critical plane for fatigue damage should be considered during multiaxial fatigue life prediction. The stress on the critical plane can be expressed as
Δ σ e q = K ( Δ ε e q ) n ,
where K is the cyclic strength coefficient and n is the cyclic strain hardening exponent.
Borodii [34] discussed the correlation between static material constants and additional hardening, and material constants are used to approximate the quantified levels of cyclic hardening. The above work proved that the level of additional hardening depends on the material. The yield strength and fatigue strength coefficient are used to reflect the influence of the material on the additional hardening effect. The hardening function α established can be expressed as
α = exp ( K ( Δ ε e q ) n σ y + σ f ) .
The loading path also affects the level of the additional hardening. According to Shamsaei’s [32] study, the fatigue life under out-of-phase loading is lower than under in-phase loading, even without additional hardening. The out-of-phase loading causes the stress and strain spindle axis to rotate, which changes the magnitude and direction of the stress and strain. Under the same strain level, the out-of-phase loading is more destructive than the in-phase loading. The reduction in fatigue life caused by out-of-phase loading is related to the phase difference of loading. Kida [35] studied the effect of phase difference on additional hardening. While the additional hardening effect at 90° out-of-phase is more significant than at 45° out-of-phase, it is not obvious under in-phase loading. The impact of phase difference on fatigue life is considered and the hardening function of α can be defined as
α = exp ( sin φ 4 K ( Δ ε e q ) n σ y + σ f ) .
The hardening function shows that when the proportional loading is applied, φ = 0 ° , the hardening function α = 1 , there is no additional hardening; with the increase in phase difference, the value of hardening function increases; when the 90° non-proportional loading is applied, φ = 90 ° 
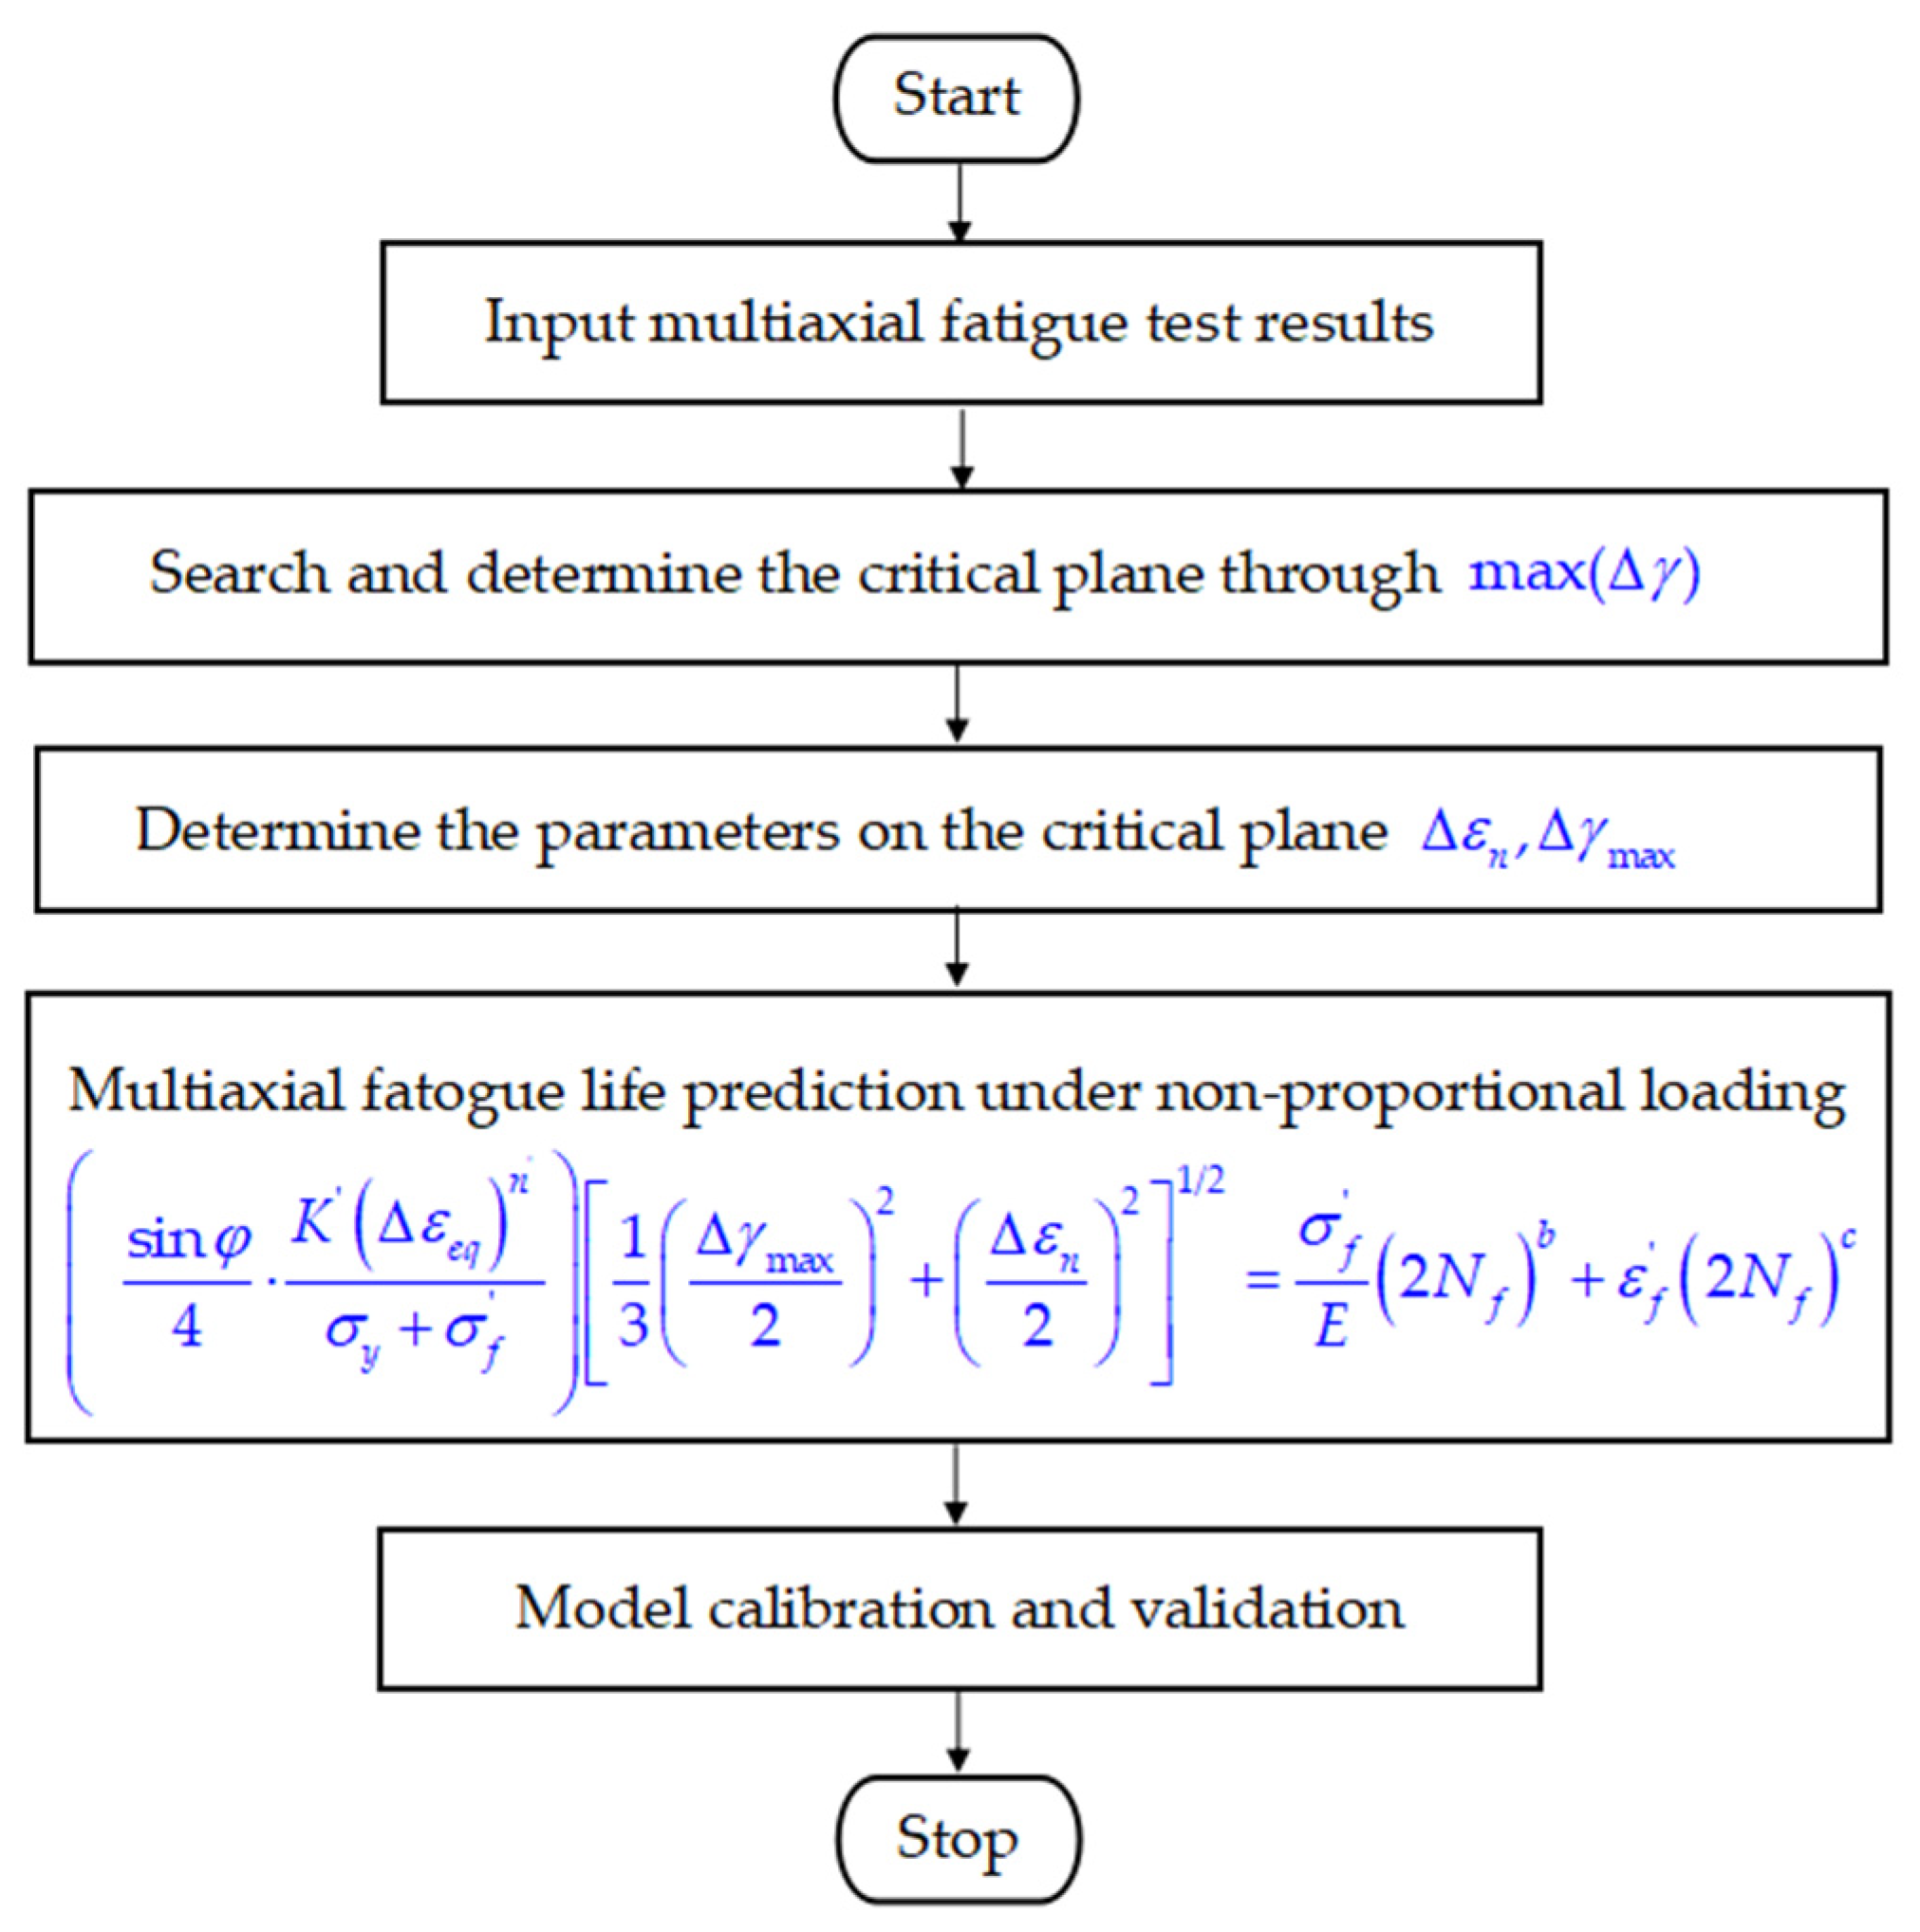
, the additional hardening effect reaches the maximum. Combining Equations (19) and (26), a new multiaxial fatigue life prediction model based on the equivalent strain is developed:
Δ ε e q * 2 = exp ( sin φ 4 K ( Δ ε e q ) n σ y + σ f ) [ 1 3 ( Δ γ max 2 ) 2 + ( Δ ε n 2 ) 2 ] 1 / 2 = σ f E ( 2 N f ) b + ε f ( 2 N f ) c .
In summary, this paper proposed a multiaxial fatigue evaluation method that considers non-proportional additional hardening. The computational procedure of the proposed model is shown in Figure 6.

4. Experimental Validation and Comparison

In order to verify the validity and accuracy of the model proposed in this study, five metal materials were selected to evaluate and validate the model. The mechanical and fatigue performance parameters of the five materials are shown in Table 1. The various loading paths used in this paper are shown in Figure 7. In additional, the classical FS model and SWT model are used for comparison and validation. The fatigue test results for the five materials are shown in Appendix A, Table A1, Table A2, Table A3, Table A4 and Table A5.

4.1. 16MnR Steel

16MnR steel is commonly used in the manufacture of pressure vessels. The experimental data are obtained from Gao [37], and the fatigue specimen is a tubular specimen, which is tested in an environment.
The prediction results of the proposed models and the comparison are shown in Figure 8a., and it can be observed from the figure that the errors in the predicted results of the proposed model are all in the range of three factors. The prediction results are better than the other two models.

4.2. GH4169 Alloy

GH41696 alloy is commonly used in the manufacture of gas turbines and turbine disks. The experimental data are obtained from Sun [38]. The fatigue specimen is a thin-walled tubular specimen, and the tests are carried out at 650 °C.
The prediction results of the proposed models and the comparisons are shown in Figure 8b, and it can be observed from the figure that the errors in the predicted results of the new model are within the range of three factors. The proposed model gives a more conservative prediction result, while the FS model and SWT model give an un-conservative prediction result.

4.3. Pure Ti

Pure Ti is a common material for aircraft components. The experimental data are obtained from Shamsaei [33]. The fatigue specimen is a thin-walled tubular specimen.
The prediction results of the proposed models and the comparisons are shown in Figure 9a, and it can be observed from the figure that the predictions of the proposed model and the FS model are more accurate, and the error is in the range of two factors. The prediction results of the SWT model have large errors.

4.4. Q235 Steel

Q235 steel is a commonly used material for engineering structural parts. The experimental data are obtained from Zhang [39]. The fatigue specimen is a thin-walled tubular specimen.
The prediction results of the proposed models and the comparison are shown in Figure 9b, and it can be observed from the figure that the predicted results of the proposed model have errors in the low-life area, and some results are outside the range of 3 error factors. The predictions of FS and SWT models are more un-conservative.

4.5. S460N Steel

Typical applications for S460N steel are high-stress steel structures. The experimental data are obtained from Jiang [40]. The fatigue specimen is a tubular specimen.
The prediction results of the proposed models and the comparisons are shown in Figure 10, and it is observed from the figure that the predicted results of the proposed model are in the range of two error factors. The prediction results of the SWT model are un-conservative.

4.6. Results and Discussions

The accuracy of the model is quantified based on the probability analysis approach, and the prediction error factor is defined as
P e r r o r = log 10 ( N e N p ) ,
where is N e the experimental life and N p is the predicted life.
The probability density function that follows a normal distribution can be defined as
f ( x ) = 1 2 π δ exp [ ( x μ ) 2 2 δ 2 ] ,
where μ is the mean value of error and δ is the standard deviation of the error. The three models of μ and δ are shown in Table 2.
Through the quantitative analysis of the mathematical and statistical approach, it can be seen from Figure 11 that the standard deviation of the model proposed in this study is small, and the prediction accuracy is better. However, the standard deviation of the life predicted by FS and SWT models is larger, and the predicted life results are not conserved.
In conclusion, the above evaluation results indicate that the established model predicts the results more accurately. The proposed hardening function can reflect the additional hardening effect produced by non-proportional loading. The proposed model has engineering practicality.

5. Conclusions

In this paper, the factors that influence the additional hardening were discussed. Subsequently, a hardening function is proposed to quantify the cycling ability of the materials. Finally, a new multiaxial fatigue life model is developed based on equivalent strain. The conclusions are summarized as follows:
(1)
A hardening function is proposed that takes into account the stress on the critical plane, phase difference, and material constants for additional hardening. This applies to various materials and does not contain any additional constants. This hardening function can reflect the effect of additional hardening on fatigue life.
(2)
Combining the hardening function with the equivalent strain models, a new multiaxial low-cycle fatigue life prediction model is developed. Experimental data for five metallic materials are used to validate the model. The predicted results are compared with the FS model and the SWT model. By analyzing the prediction results of each model through mathematical, statistical methods, the normal distribution curve of the model established in this paper is more concentrated. The results show that the predicted results of the proposed model are in good agreement with the experimental results, and the prediction results are superior to other models.

Author Contributions

P.-N.Z. developed the innovative methods and prepared this manuscript. J.-X.G. reviewed this manuscript and managed the projects. Y.-P.Y. supervised the projects. R.-X.X. and Z.-F.W. contributed to the literature investigation. All authors have read and agreed to the published version of the manuscript.

Funding

This work was supported by National Natural Science Foundation of China (Grant No. 52065062), Natural Science Foundation of Xinjiang Uygur Autonomous Region (Grant No. 2020D01C056), Start-up Foundation of Xinjiang University for Doctor (Grant No. 2020bs12), Key Research and Development Program of Xinjiang Uygur Autonomous Region (Grant No. 2021B01003).

Data Availability Statement

Data sharing not applicable.

Conflicts of Interest

The authors declare no conflict of interest.

Nomenclature

b Fatigue strength exponent
c Fatigue ductility exponent
E Young modulus
K Cyclic strength coefficient
n Cyclic strain hardening exponent
N e Experimental life
N f Number of cycles to failure
N P Predicted life
Δ γ max Maximum shear strain amplitude on the critical plane
γ α Shear strain amplitude
ε f Fatigue ductility coefficient
Δ ε n Normal strain range acting on the critical plane
ε α Normal strain range
σ f Fatigue strength coefficient
σ max Maximum normal stress on the maximum strain plane
σ n , max Maximum normal stress on the critical plane
σ y Cyclic yield stress
ν e f f Effective Poisson’s ratio
φ Phase angle between tensional strain and torsional strain

Appendix A

Table A1, Table A2, Table A3, Table A4 and Table A5 provide the fatigue test results of 16MnR [37], GH4169 [38], Pure-Ti [33], Q235 [39] and S460N [40].
Table A1. Fatigue test results of 16MnR [36].
φ ε α (%) γ α (%) Nf (Cycles) φ ε α (%) γ α (%) Nf (Cycles)
0.1060.185496,00090°0.2000.3466900
0.1360.24373,10090°0.2770.4842960
0.7071.22570090°0.4000.6921500
90°0.1000.173839,52090°0.3970.693930
90°0.1100.191185,60090°0.6001.039390
90°0.1380.24235,300
Table A2. Fatigue test results of GH4169 [37].
φ ε α (%) γ α (%) Nf (Cycles) φ ε α (%) γ α (%) Nf (Cycles)
0.4080.592154490°0.7891.260218
0.5460.88445890°0.7831.330121
45°0.3540.42044200.5400.896338
45°0.5240.7457220.5360.945161
45°0.5530.8132950.4270.6331108
45°0.7041.0901710.4480.7091370
45°0.7011.16026045°0.4780.7491048
90°0.3970.479566545°0.6251.000222
90°0.5480.83343690°0.6131.010529
90°0.5860.838563
Table A3. Fatigue test results of Pure-Ti [26].
φ ε α (%) γ α (%) Nf (Cycles) φ ε α (%) γ α (%) Nf (Cycles)
0.781.3462045°0.871.50422
0.781.3463245°0.711.23736
0.781.3463045°0.711.23744
0.591.03206245°0.530.951780
0.550.75300845°0.530.951862
0.550.75316490°1.101.91384
0.821.0790490°1.101.91398
0.781.00100090°0.901.56586
0.720.94160690°0.901.56602
0.720.94164490°0.701.211420
0.720.94184090°0.701.211466
45°0.871.50400
Table A4. Fatigue test results of Q235 [38].
φ ε α (%) γ α (%) Nf (Cycles) φ ε α (%) γ α (%) Nf (Cycles)
0.1410.24534,35590°0.20.3465784
0.2120.36712,77290°0.30.5202470
0.2830.490707290°0.40.693477
0.3540.612425890°0.50.866338
0.4240.735306990°0.150.26034,499
45°0.1530.26520,54590°0.20.3466990
45°0.2300.398752790°0.30.5204058
45°0.3060.530313790°0.40.6931569
45°0.3830.663110990°0.50.866620
45°0.4590.79558090°0.61.039265
90°0.150.26018,237
Table A5. Fatigue test results of S460N [39].
φ ε α (%) γ α (%) Nf (Cycles) φ ε α (%) γ α (%) Nf (Cycles)
0.1730.331,10090°0.2310.46570
0.1040.18521,00090°0.1440.2547,140
0.1440.25130,30090°0.1440.2551,900
45°0.1150.2218,40090°0.1150.290,700
45°0.1730.343,00090°0.1040.18574,600
45°0.1440.2555,00090°0.1440.2530,000
90°0.1730.339,67090°0.4040.7540
90°0.1730.322,800

References

  1. Niu, X.P.; Zhu, S.P.; He, J.C.; Ai, Y.; Shi, K.K.; Zhang, L.P. Fatigue reliability design and assessment of reactor pressure vessel structures: Concepts and validation. Int. J. Fatigue 2021, 153, 106524. [Google Scholar] [CrossRef]
  2. You, B.R.; Lee, S.B. A critical review on multiaxial fatigue assessments of metals. Int. J. Fatigue 1996, 18, 235–244. [Google Scholar] [CrossRef]
  3. Babaei, S.; Ghasemi-Ghalebahman, A. Damage-based modification for fatigue life prediction under non-proportional loadings. Int. J. Fatigue 2015, 77, 86–94. [Google Scholar] [CrossRef]
  4. Li, X.Q.; Song, L.K.; Bai, G.C. Recent advances in reliability analysis of aero engine rotor system: A review. Int. J. Struct. Integ. 2022, 13, 1–29. [Google Scholar] [CrossRef]
  5. Narayanan, G. Probabilistic fatigue model for cast alloys of aero engine applications. Int. J. Struct. Integ. 2021, 12, 454–469. [Google Scholar] [CrossRef]
  6. Li, Y.Z.; Zhu, S.P.; Liao, D.; Niu, X.P. Probabilistic modeling of fatigue crack growth and experimental verification. Eng. Fail. Anal. 2020, 118, 104862. [Google Scholar] [CrossRef]
  7. Yuan, R.; Liao, D.; Zhu, S.P.; Yu, Z.Y.; Correia, J.; Jesus, A.D. Contact stress analysis and fatigue life prediction of turbine disc-blade attachment with fir-tree tenon structure. Fatigue Fract. Eng Mater. Struct. 2021, 44, 1014–1026. [Google Scholar] [CrossRef]
  8. Luo, P.; Yao, W.X.; Susmel, L.; Wang, Y.Y.; Ma, X.X. A survey on multiaxial fatigue damage parameters under non-proportional loadings. Fatigue Fract. Eng. Mater. Struct. 2017, 40, 1323–1342. [Google Scholar] [CrossRef]
  9. Yu, Z.Y.; Zhu, S.P.; Liu, Q.; Liu, Y.H. Multiaxial fatigue damage parameter and life prediction without any additional material constants. Materials 2017, 10, 923. [Google Scholar] [CrossRef] [Green Version]
  10. Shang, D.G.; Wang, D.J. A new multiaxial fatigue damage model based on the critical plane approach. Int. J. Fatigue 1998, 20, 241–245. [Google Scholar]
  11. Macek, W.; Tomczyk, A.; Branco, R.; Dobrzyński, M.; Seweryn, A. Fractographical quantitative analysis of EN-AW 2024 aluminum alloy after creep pre-strain and LCF loading. Eng. Fract. Mech. 2023, 282, 109182. [Google Scholar] [CrossRef]
  12. Sun, G.Q.; Shang, D.G.; Bao, M. Multiaxial fatigue damage parameter and life prediction under low cycle loading for GH4169 alloy and other structural materials. Int. J. Fatigue 2010, 32, 1108–1115. [Google Scholar] [CrossRef]
  13. Brown, M.W.; Miller, K.J. A theory for fatigue failure under multiaxial stress-strain conditions. Proc. Inst. Mech. Eng. 1973, 187, 745–755. [Google Scholar] [CrossRef]
  14. Fatemi, A.; Socie, D.F. A critical plane approach to multiaxial fatigue damage including out-of-phase loading. Fatigue Fract. Eng. Mater. Struct. 1988, 11, 149–165. [Google Scholar] [CrossRef]
  15. Wang, C.H.; Brown, M.W. A path-independent parameter for fatigue under proportional and non-proportional. Fatigue Fract. Eng. Mater. Struct. 1993, 16, 1285–1298. [Google Scholar] [CrossRef]
  16. Lohr, R.D.; Ellison, E.G. A simple theory for low-cycle multiaxial fatigue. Fatigue Fract. Eng. Mater. Struct. 1980, 3, 1–17. [Google Scholar] [CrossRef]
  17. Smith, K.N.; Watson, P.; Topper, T.H. A stress-strain function for the fatigue of metals. J. Mater. 1970, 5, 767–778. [Google Scholar]
  18. Zhao, T.W.; Jiang, Y.Y. Fatigue of 7075-T651 aluminum alloy. Int. J. Fatigue 2008, 30, 834–849. [Google Scholar] [CrossRef]
  19. Chen, X.; Xu, S.; Huang, D. A critical plane-strain energy density criterion for multiaxial low cycle fatigue life under non-proportional loading. Fatigue Fract. Eng. Mater. Struct. 1999, 22, 679–686. [Google Scholar] [CrossRef]
  20. Gan, L.; Wu, H.; Zhong, Z. Use of an energy-based/critical plane model to assess fatigue life under low-cycle multiaxial cycles. Fatigue Fract. Eng. Mater. Struct. 2019, 42, 2694–2708. [Google Scholar] [CrossRef]
  21. Lu, Y.; Wu, H.; Zhong, Z. A simple energy-based model for nonproportional low-cycle multiaxial fatigue life prediction under constant-amplitude loading. Fatigue Fract. Eng. Mater. Struct. 2018, 41, 1402–1411. [Google Scholar] [CrossRef]
  22. Xu, S.; Zhu, S.P.; Hao, Y.Z.; Liao, D.; Qian, G.A. A new critical plane-energy model for multiaxial fatigue life prediction of turbine disc alloys. Eng. Fail. Anal. 2018, 93, 55–63. [Google Scholar] [CrossRef] [Green Version]
  23. Ince, A.; Glinka, G. A generalized fatigue damage parameter for multiaxial fatigue life prediction under proportional and non-proportional loadings. Int. J. Fatigue 2014, 62, 34–41. [Google Scholar] [CrossRef]
  24. Salari, M. Fatigue crack growth reliability analysis under random loading. Int. J. Struct. Integ. 2020, 11, 157–168. [Google Scholar] [CrossRef]
  25. Kumar, R.; Chohan, J.S.; Goyal, R.; Chauhan, P. Impact of process parameters of resistance spot welding on mechanical properties and micro hardness of stainless steel 304 weldments. Int. J. Struct. Integr. 2021, 12, 366–377. [Google Scholar] [CrossRef]
  26. Shang, D.G.; Sun, G.Q.; Yan, C.L.; Chen, J.H.; Cai, N. Creep-fatigue life prediction under fully-reversed multiaxial loading at high temperatures. Int. J. Fatigue 2007, 29, 705–712. [Google Scholar] [CrossRef]
  27. Nitta, A.; Ogata, T.; Kuwabara, K. Fracture mechanisms and life assessment under high-strain biaxial cyclic loading of type 304 stainless steel. Fatigue Fract. Eng. Mater. Struct. 1989, 12, 77–92. [Google Scholar] [CrossRef]
  28. Li, J.; Zhang, Z.P.; Sun, Q.; Li, C. Low-cycle fatigue life prediction of various metallic materials under multiaxial loading. Fatigue Fract. Eng. Mater. Struct. 2010, 34, 280–290. [Google Scholar] [CrossRef]
  29. Chen, X.; Gao, Q.; Sun, X.F. Damage analysis of low-cycle fatigue under non-proportional loading. Int. J. Fatigue 1994, 16, 221–225. [Google Scholar] [CrossRef]
  30. Itoh, T.; Nakata, T.; Sakane, M. Nonproportional low cycle fatigue of 6061 aluminum alloy under 14 strain paths. Euro. Struct. Integ. Soc. 1999, 25, 41–54. [Google Scholar]
  31. Itoh, T.; Yang, T. Material dependence of multiaxial low cycle fatigue lives under non-proportional loading. Int. J. Fatigue 2011, 33, 1025–1031. [Google Scholar] [CrossRef] [Green Version]
  32. Shamsaei, N.; Fatemi, A. Effect of microstructure and hardness on non-proportional cyclic hardening coefficient and predictions. Mater. Sci. Eng. A 2010, 527, 3015–3024. [Google Scholar] [CrossRef]
  33. Shamsaei, N.; Gladskyi, M.; Panavovskyi, K.; Shukaev, S.; Fatemi, A. Multiaxial fatigue of titanium including step loading and load path alteration and sequence effects. Int. J. Fatigue 2010, 32, 1862–1874. [Google Scholar] [CrossRef]
  34. Borodii, M.V.; Shukaev, S.M. Additional cyclic strain hardening and its relation to material structure, mechanical characteristics, and lifetime. Int. J. Fatigue 2007, 29, 1184–1191. [Google Scholar] [CrossRef]
  35. Kida, S.; Itoh, T.; Sakane, M.; Ohnami, M.; Socie, D.F. Dislocation structure and non-proportional hardening of type 304 stainless steel. Fatigue Fract. Eng. Mater. Struct. 1997, 20, 1375–1386. [Google Scholar] [CrossRef] [Green Version]
  36. Li, J.; Zhang, Z.P.; Sun, Q.; Li, C.W. Multiaxial fatigue life prediction for various metallic materials based on the critical plane approach. Int. J. Fatigue 2011, 33, 90–101. [Google Scholar] [CrossRef]
  37. Gao, Z.L.; Zhao, T.W.; Wang, X.G.; Jiang, Y.Y. Multiaxial fatigue of 16MnR steel. Int. J. Pres. Ves. Tech. 2009, 131, 021403. [Google Scholar] [CrossRef]
  38. Sun, G.Q.; Shang, D.G. Prediction of fatigue lifetime under multiaxial cyclic loading using finite element analysis. Mater. Design 2010, 31, 126–133. [Google Scholar] [CrossRef]
  39. Zhang, X.Y. Research on Multiaxial Low Cycle Fatigue and Life Evaluation for Q235 Steel. Master’s Thesis, Guangxi University, Guilin, China, 2013. (In Chinese). [Google Scholar]
  40. Jiang, Y.Y.; Hertel, O.; Vormwald, M. An experimental evaluation of three critical plane multiaxial fatigue criteria. Int. J. Fatigue 2007, 29, 1490–1502. [Google Scholar] [CrossRef]
Figure 1. Strain state of the tension-torsion thin-walled specimen.
Metals 13 00629 g001
Figure 2. The strains acting on the candidate plane in three-dimensional coordinate systems.
Metals 13 00629 g002
Figure 3. Correlations between the fatigue life and the parameters on the Δ γ max plane: (a) Δ ε n , (b) Δ γ max Figure reprinted with permission from Ref. [28]. Copyright 2023 John Wiley and Sons.
Metals 13 00629 g003
Figure 4. Equivalent cyclic stress–strain relations: (a) BT9 titanium alloy, (b) 7075-T651 aluminum alloy.
Metals 13 00629 g004
Figure 5. Correlations between equivalent stress and fatigue life: (a) BT9 titanium alloy, (b) 7075-T651 aluminum alloy.
Metals 13 00629 g005
Figure 6. Proposed procedure for multiaxial fatigue life prediction.
Metals 13 00629 g006
Figure 7. Various loading paths used in this study.
Metals 13 00629 g007
Figure 8. Comparison of the experimental life with predicted life: (a) 16MnR steel; (b) GH4169 alloy.
Metals 13 00629 g008
Figure 9. Comparison of the experimental life with predicted life: (a) Pure Ti, (b) Q235 steel.
Metals 13 00629 g009
Figure 10. Comparison of the experimental life with predicted life of S460N steel.
Metals 13 00629 g010
Figure 11. Probability density functions of model prediction errors.
Metals 13 00629 g011
Table 1. Summary of the investigated materials and their static and fatigue properties [36].
Materials E , GPa σ y , MPa K , MPa n σ f , MPa ε f , MPa b c Loading Paths
16MnR212.5324.411060.186966.40.842−0.101−0.618A, F
GH416918265019330.148614760.162−0.09−0.58A, B, D
Pure-Ti112475668.80.05156470.548−0.033−0.646A, C, F
Q235206235969.60.1824630.71.188−0.08−0.661A, C, D, F
S460N208.550011150.1618340.1572−0.0793−0.4927A, C, F
Table 2. Calculation results of δ and μ .
ModelProposed ModelFS ModelSWT Model
μ −0.01445−0.2278−0.6456
δ 0.2230.3120.315
Disclaimer/Publisher’s Note: The statements, opinions and data contained in all publications are solely those of the individual author(s) and contributor(s) and not of MDPI and/or the editor(s). MDPI and/or the editor(s) disclaim responsibility for any injury to people or property resulting from any ideas, methods, instructions or products referred to in the content.

