Article

Uptake of Silver by Jarosite and Natrojarosite Family Compounds at 22 °C, 97 °C and 140 °C

by
Peter F. Cogram
1,
Mark D. Welch
2 and
Karen A. Hudson-Edwards
3,*
1
Department of Earth and Planetary Sciences, Birkbeck, University of London, Malet St., London WC1E 7HX, UK
2
Department of Earth and Planetary Sciences, The Natural History Museum, London SW7 5BD, UK
3
Camborne School of Mines, University of Exeter, Penryn TR10 9FE, UK
*
Author to whom correspondence should be addressed.
Metals 2023, 13(3), 627; https://doi.org/10.3390/met13030627
Submission received: 15 February 2023 / Revised: 10 March 2023 / Accepted: 14 March 2023 / Published: 21 March 2023

Abstract

:
The jarosite family of minerals are part of the alunite supergroup with the general formula AB3(TO4)2(OH)6. Jarosite family minerals are known to incorporate silver (Ag), but the extent to which this occurs, and at what temperature range, is not well constrained. To address this knowledge gap, jarosite compounds with the A site filled with K, Na, Ag and H3O were synthesised at 22 °C, 97 °C and 140 °C to simulate low-, moderate- and high-temperature environments, respectively. The compounds were characterised by XRD, SEM, chemical analysis and Raman spectroscopy. All of the synthesised compounds took up Ag. In general, higher temperatures of synthesis increased alkali and Ag occupancy of the A site of the products. Silver contents increased with the increasing concentration of Ag in the starting solutions at all temperatures. The order of preference for occupancy of the A site in the synthesised solids is K > Na > H3O > Ag at all temperatures, which is consistent with the reported order of ΔGf of −3309 kJ/mol, −3270 kJ/mol, −3247 kJ/mol and −2948 kJ/mol for jarosite, natrojarosite, hydroniumjarosite and argentojarosite, respectively. The results of this study show that Ag can be incorporated in jarosite and natrojarosite at low-to-high temperatures, and therefore, jarosite family minerals can be important stores of Ag in in natural and engineered environments.

1. Introduction

The alunite supergroup consists of more than 40 minerals with the general formula AB3(TO4)2(OH)6, where A represents cations with a coordination number greater than or equal to 9, and B and T represent cation sites with octahedral and tetrahedral coordination, respectively [1,2] (Figure 1). In an ideal jarosite [KFe3(SO4)2(OH)6], the B site cation is Fe3+, the A site is occupied by K+ in 12-fold coordination, and the T site is filled with S6+, forming a sulfate anion (SO42−) (Figure 1). The A site can also be filled by Na, forming natrojarosite [NaFe3(SO4)2(OH)6], or by hydronium (H3O+), forming end-member [(H3O)Fe3(SO4)2(OH)6]. In non-stoichiometric jarosites where there are deficiencies in A-site occupancy, studies often assume the site is occupied by hydronium [3], but H3O+ is not necessarily present and there may be vacancies in the site [4]. In addition, a vacancy in the B site may be compensated for by the addition of 4 H+ (protonation) at the B site, so H3O in the A site is not necessary for charge balance, hence, vacancies in the A site are commonly seen [5]. These considerations have resulted in a modified general chemical formula being proposed for jarosite compounds: A1−x(H3O)xFe3−y[(OH)6−3y(H2O)3y(SO4)2] [6].
Solid wastes generated from the processing or natural weathering of sulfide ores can contain precious metals such as silver that escaped extraction or were mobilised in the natural environment. Silver can completely substitute in the A site of the jarosite structure, forming end-member argentojarosite [AgFe3(SO4)2(OH)6]. Several studies have explored how Ag is incorporated in jarosite and natrojarosite [7,8,9,10,11,12,13], and some have shown the existence of a K-Ag-jarosite solid solution series in the presence of hydronium [14]. However, none have explored the possibility of a Na-Ag-(H3O)-jarosite solid solution series, nor compared the capacity of Ag uptake in natrojarosite and jarosite compounds synthesised at a low temperature (22 °C, ‘room’ temperature and the average surface temperatures in areas where natural jarosites form) with medium (97 °C) or high (140 °C) temperatures typical of hydrothermal systems or metallurgical processes. Such knowledge is important for predicting the ways that Ag can be released from jarosite for the recycling of mine wastes and for predicting the environmental behaviour of Ag-bearing jarosite minerals. To this end, the aims of this study are to determine and compare the capacity of synthetic natrojarosite and jarosite compounds for Ag, the characters of the Ag-bearing jarosite compounds synthesised and the influence of synthesis temperature on these characteristics.

2. Materials and Methods

2.1. Synthesis of Jarosite Compounds

Jarosite group compounds with A sites filled with K, Na, Ag and H3O were synthesised in 10 series using the volumes, reagents and temperatures listed in Table 1. The initial pH value of each solution was adjusted to 1.5–1.6 by the addition of H2SO4 or LiCO3. The prepared compounds were poured into polypropylene beakers, covered with filter paper and left for 12–16 months at room temperature (22 °C, to simulate laboratory room temperatures and Earth-surface environments) or poured into Teflon-lined steel vessels and heated to 97 °C or 140 °C in an oven (to simulate hydrothermal and metallurgical environments). During the syntheses at room temperature, the pH of each solution was monitored periodically and adjusted to ensure the value was 1.0–1.6. The precipitate formed was filtered, washed in ultra-pure water (18 MΩ cm−1) and dried at 22 °C (22 °C experiments) and 110 °C (97 °C and 140 °C experiments). These temperatures are typical of those used in other jarosite synthesis studies. The reagents used in the syntheses were AnalaR Normapur or Alfa Aesar grade.

2.2. X-ray Diffraction

Powder X-ray diffraction (XRD) analysis of the samples was carried out by collecting patterns in Bragg–Brentano reflection geometry using a Philips PW1876 powder diffractometer (Philips, Amsterdam, the Netherlands) and analysing with PC-APD software (version 1, Philips, Amsterdam, the Netherlands) and X’Menu graphics software (version 1, Malvern Panalytical, Malvern, UK). The anode material used was Cu, which has a Kα1 wavelength of 1.54056 Å and Kα2 wavelength of 1.54439 Å, and the α21 radiation intensity ratio was 0.5. The generator tension was 40 kV, the current was 30 mA and the instrument was operated at room temperature. The X-ray tube was a long fine-focus type (0.8 mm × 12 mm) and a monochromator was used. Continuous X-ray scans were used, which had a start angle of 10.01° 2θ and an end angle of 69.97° 2θ, a step size of 0.02° 2θ and a time per step of 1.0 s. Before analysis, each sample was ground into a powder using a mortar and pestle.
XRD patterns produced from the samples were compared with reference patterns in the Joint Committee for Powder Diffraction Spectrometry (JCPDS) database. The JCPDS patterns were jarosite 10-0443 and (synthetic) 22-0827; hydroniumjarosite (synthetic) 36-0427; natrojarosite 11-0302, 30-1203 and (synthetic) 36-0425; argentojarosite (synthetic) 25-1327 and 41-1398; and hydroniumjarosite (synthetic) 21-0932 and 31-0650. Cu radiation (Kα1 λ = 1.54056 Å) was used to produce the profiles from the samples, which all contained Al peaks from the diffractometer’s sample holder; these peaks were at ~38.40° 2θ (Kα1 d-value ~2.34) and ~44.60° 2θ (Kα1 d-value ~2.03) [15].
A problem that is caused by the use of Cu radiation for the XRD analysis of Fe-bearing minerals such as jarosite is that the X-rays are strongly absorbed, causing a loss of X-ray intensity and high backgrounds as a result of fluorescence. This problem makes the identification and quantification of Fe-rich phases difficult using Cu radiation. For this reason, CoKα (λ = 1.78890 Å) or FeKα (λ = 1.93604 Å) X-ray radiation is preferable for Fe-rich phases. Relatively high background intensities were especially noticeable, for example, in the XRD results of JS24, JS26, JS28, JS30, JS49, JS55, JS60, JS72 and JS78. For these samples, additional XRD analysis was carried out using a PANalytical X’Pert Pro diffractometer (Malvern Panalytical, Malvern, UK) with a graphite monochromator. The instrument was fitted with an MPPC generator, PW3376/00 X-ray tube, PW3064 reflection-transmission spinner, PW3050/60 goniometer, X’Celerator detector, X’Pert Data Collector, Data Viewer and Database32, and X’Pert HighScore Plus software version 1. The instrument was operated at room temperature. Co radiation (Kα1 λ = 1.78897 Å, Kα2 λ = 1.79285 Å and α21 intensity ratio = 0.5) was used for the analyses of the synthesised samples, which were run in reflection mode, and a graphite monochromator I was used. Continuous X-ray scans were used with a start angle of 10.00° 2θ and an end angle of 100.00° 2θ, a step size of 1.00° 2θ and a time per step of 40.0 s, except for the additional scans of two samples using a time per step of 80 s. Before analysis, each sample was ground into a powder using a mortar and pestle.

2.3. Chemical Analysis

For the quantitative total elemental analysis of the Ag-bearing jarosite compounds, approximately 90 mg of each dried synthetic compound was dissolved by adding 3 mL of HF (38 wt. %) plus 1 mL of HNO3 (67 wt. %) in a Savillex vial with cap and heated at 150 °C for 16 h. The resulting solutions were then evaporated at 110 °C to incipient dryness. Subsequently, 1 mL of HNO3 was added to each, and the resulting solutions were evaporated at 110 °C to incipient dryness. Following this, 3 mL of HNO3 and 1 mL of ultra-pure water were added. After digestion, the solutions were made up to 100 mL with ultra-pure water. Following the acid digestion procedure, no visible solid remained. Following this, 10 mL of each solution was put in a 50 mL vial by pipette and 40 mL of ultra-pure water was added. The resulting solutions were analysed for Ag, Na, K, Fe and S by inductively coupled plasma atomic emission spectrometry (ICP-AES) on a Varian 720-ES instrument (Varian, Baden, Switzerland) fitted with both a monochromator and a polychromator.

2.4. Scanning Electron Microscopy

Scanning electron microscopy (SEM) with secondary electron imaging (SEI) was used to determine the crystal morphology of the synthetic jarosite compounds. The SEM analysis was carried out using a Jeol JSM-6480LV Variable Pressure Analytical Scanning Electron Microscope (SEM) (Jel, Tokyo, Japan) with a high resolution of 3.0 nm, equipped with Oxford Link EDS system and electron backscatter diffraction (EBSD) system (Oxford Instruments, Oxford, UK), and using Co Kα radiation. The synthetic jarosite compounds were mounted on Leit carbon double-sided adhesive tabs on 5 mm-diameter aluminium stubs and then coated with Au. A cobalt sample was used to calibrate the SEM. Secondary electron imaging of Au-coated samples using 7 kV accelerating voltage, 3.0 μm spot size and a working distance (WD) of 11 mm was used to obtain high-quality images of the synthetic jarosite compounds.

2.5. Raman Spectroscopy

Laser Raman microspectroscopic analyses were carried out using a Renishaw RM1000 Raman spectrometer (Renishaw, Wotton-under-Edge, UK) and other analyses used a Renishaw inVia Raman spectrometer (Renishaw, Wotton-under-Edge, UK), both of which were equipped with a thermoelectrically cooled charge coupled device (CCD) detector and a 514.5 nm Ar ion laser. The instruments were calibrated daily on a silicon standard at 520.5 cm−1. The Renishaw RM1000 system was operated in confocal mode with the laser focused on the sample through the objective lens (magnification 50×) of an Olympus petrological microscope, and the Renishaw inVia system used a Leica DM2500 M microscope (Renishaw, Wotton-under-Edge, UK). Under these conditions, the laser beam for analysis was restricted to an area of <2 μm diameter. The initial sample burn at 100% because of the hydrous content of the samples meant that the laser beam power of the Renishaw RM1000 system was reduced from 100% to 25%. The laser power was reduced using neutral density filters and was typically between 1 mW and ~220 μW at the sample surface. The laser beam power of the Renishaw inVia system was reduced to 10% and was 6.76 mW at the sample surface. Following the reduction in beam power, the samples were inspected optically for any laser damage and none was observed.
Spectra were recorded over the frequency range 100 to 4000 cm−1, using integration times of 60 s (except 120 s for one sample). The errors on the spectra were <0.1 cm−1. Peak fitting was performed using Galactic GRAMS/32 software (version 1, Galactic, Bradford, UK) with the Renishaw RM1000 spectrometer (Renishaw, Wotton-under-Edge, UK) and WIRE 3.3 software (version 1, Renishaw, Wotton-under-Edge, UK) with the Renishaw inVia spectrometer (Renishaw, Wotton-under-Edge, UK), both of which use a mixed Gaussian–Lorentzian curve. Depending on the quality of the spectra, between one and four spectra were obtained over the full frequency range. The variation between the different spectra of individual samples was small, and therefore, the samples were assumed to be homogeneous.

3. Results and Discussion

3.1. Morphology of Synthetic Jarosite Compounds

The end members K-H3O-jarosites, Na-H3O-jarosites and Ag-H3O-jarosites synthesised at 22 °C, 97 °C and 140 °C have distinctive morphologies (Figure 2). K-Ag and Na-Ag jarosite solid solutions display transitional forms between the end-member morphologies (images not shown). Crystal sizes increase as the synthesis temperatures increase. K-H3O jarosite crystals generally comprise rounded hexagonal plates on {0001} [15] and discs, usually intergrown and in compact texture, with grain sizes of 1–20 µm, and as aggregates. The K-H3O end-member jarosites synthesised at 140 °C have intergrown dipyramidal rhomb morphologies (Figure 2). Na-H3O jarosite crystals are intergrown with pyramidal {01–12} and {0001} faces and rhombohedral {01–12} faces, in compact texture, with grain sizes of 1–20 µm. Ag-H3O jarosite crystals comprise intergrown hexagonal plates on {0001} and dipyramidal (octahedral) rhombs with {01–12} and {0001} faces [16], both sometimes rounded, and in compact texture, with grain sizes of 4–25 µm.

3.2. X-ray Diffraction Analysis of Synthetic Jarosite Compounds

XRD data provide information on unit-cell dimensions and the degree of cation substitution in crystal structures and have been used to characterise jarosite subgroup minerals [17]. XRD can be used because variations in unit-cell dimensions are caused by differences between the ionic radii of elements contained in end members of the jarosite subgroup [18]. Therefore, unit-cell variations can be used to estimate the elemental ratios in solid solution between end members, that is, the extent of element substitutions [17,19]. Peak positions in XRD diffractograms can be used to determine unit-cell edge lengths, with shifts in XRD peak positions used to deduce structural incorporation of substituting cations in isomorphous minerals. The substitution of a smaller cation leads to a smaller unit cell, as indicated by shifts in all peaks towards higher 2θ angles. Theoretically, the unit-cell edge lengths of mixed phases (solid solution) should lie in a straight line between those of two end members, according to Vegard’s rule.
Jarosite phases were identified in all the synthesised samples using the X’Menu software. These synthetic jarosite phases were all consistent with the cations (K, Na and/or Ag) that were present in the starting solutions. No impurities were detected in the samples listed in Table 2. Representative examples of XRD diffractograms of the samples are shown in Figure 3.
The issue of changes in peak positions with cation substitution relates to mineral identification using JCPDS patterns because these patterns are based on minerals that are not necessarily end-member jarosite subgroup phases—for example, the JCPDS pattern 25-1327 of argentojarosite represents data for synthesised products reported by May et al. [7], for which the chemical formula is Ag0.89-3Fe2.93-3(SO4)2(OH)6, and JCPDS pattern 30-1203 of natrojarosite represents data for synthesised products reported by Dutrizac and Kaiman [8], for which the chemical formula is Na0.82Fe2.80(SO4)2(OH)6. This is problematic for the matching of standard patterns with peaks in synthesised jarosites of varying chemical compositions containing different proportions of cations.
The strongest intensity peaks of the JCPDS patterns of jarosite (22-0827) (3.08 Å), natrojarosite (30-1203) (3.06 Å), argentojarosite (25-1327) (3.062 Å) and hydronium jarosite (31-0650) (5.10 Å) are closely comparable with the main peaks of the synthesised K-Ag-H3O and Na-Ag-H3O jarosite products of this study. For example, the K-Ag-H3O jarosite series of samples JS22, JS24, JS26, JS28 and JS30, which has declining K content and increasing Ag content, has the strongest peaks of 3.090 Å, 3.069 Å, 3.070 Å, 3.045 Å and 3.061 Å, respectively, which are consistent with the changing A-site occupation. In addition, Na-H3O, the strongest peak of sample JS32, is at 5.066 Å, which is consistent with the strongest peak (5.10 Å) of hydronium jarosite (31-0650), rather than the strongest peak (3.06 Å) of natrojarosite (30-1203), and so are also consistent with the high proportion of H3O in the samples indicated by the calculation of the mineral formula (Table 2).
The differences between the peak positions of the 003 and 006 (hkl) reflections (2θ degree angles) of jarosite, natrojarosite, hydroniumjarosite and mixtures of these end members are shown on X-ray diffractograms, and these results from the respective c-axis dimensions of the unit cells have been compared [3]. In theory, these c-axis parameters should vary according to the proportions of cations with different ionic radii occupying the A site. Table 2 lists the different positions (d-values) of the 003 and 006 reflections of the K-Ag-H3O and Na-Ag-H3O jarosite samples. In 12-fold coordination, the ionic radius of Na+ is 1.39 Å and K+ is 1.64 Å [20], that of Ag+ is 1.48 Å [21] and that of H3O+ is 1.52 Å [5]. However, Groat et al. [22], in a study of the refined crystal structure of end-member argentojarosite, reported that Ag+ had an ionic radius of 1.35–1.36 Å, which was closer to 9-fold coordination than to 12-fold coordination, for which the predicted ionic radius was 1.48–1.56 Å.
The positions of the 003 and 006 reflections of jarosite (22-0827), natrojarosite (30-1203), argentojarosite (25-1327) and hydronium jarosite (31-0650) are closely comparable with those of the K, Na and Ag jarosite analogues synthesised in this study (Table 2). The positions of the 003 and 006 reflections in samples JS22–JS30 (the series of K-Ag-H3O jarosite compounds synthesised at 97 °C), for example, show generally declining d-spacing values from 5.721 Å and 2.853 Å, respectively; for the jarosite product (JS22) containing K-H3O only to 5.523 Å and 2.768 Å, respectively; and for the jarosite product (JS30) containing Ag-H3O only. These results are consistent with the smaller radius of the Ag+ cation compared with K+ in 12-fold coordination. The other series of K-Ag jarosite analogues—JS55–JS61 (synthesised at 140 °C) and JS72–JS76 (synthesised at 22 °C)—show similar generally declining trends of 003 and 006 reflection d-spacings. However, the sample showing a significant deviation from this trend is JS72, a jarosite product containing Ag-H3O only, which has unexplained anomalously large d-spacings for 003 and 006 reflections of 5.74 Å and 2.855 Å, respectively.
The Na-Ag jarosite analogues in sample series JS30–JS38 (synthesised at 97 °C) show a generally declining trend of d-values for the 003 and 006 reflections from 5.58 Å and 2.791 Å, respectively; in the product with Na-H3O only in the A site to 5.523 Å and 2.768 Å, respectively; and in the product with Ag-H3O only in the A site. These results are consistent with the Ag+ cation having a smaller radius than Na+ and, therefore, being in 9-fold coordination. The Na-Ag jarosite analogues in sample series JS71 and JS85-JS88 (synthesised at 140 °C) show a generally increasing trend of d-values for 003 and 006 reflections from 5.613 Å and 2.787 Å, respectively; in the product with Na-H3O only in the A site to 5.627 Å and 2.792 Å, respectively; and in the product with Ag-H3O only in the A site. These results are consistent with the Ag+ cation having a larger radius than Na+ and, therefore, being in 12-fold coordination. The Na-Ag jarosite analogue series JS49–JS54 and JS61 (synthesised at 140 °C) shows d-values increasing from the product with Na-H3O only in the A site to the first intermediate product (lowest amount of Ag in the starting solution), then declining in the product series, and finally increasing again to the product with Ag-H3O only in the A site. These results provide contradictory evidence on the cation sizes. The Na-Ag jarosite analogue series JS72 and JS77–JS80 (synthesised at 22 °C) has d-values that are anomalously high in samples JS72 and JS78, which complicates evidence of any pattern; however, there is a trend of increasing d-values in last three patterns in the series. Overall, this contradictory evidence from the d-values for 003 and 006 peaks about the respective sizes of the ionic radii of the Na and Ag cations and, therefore, whether Ag is in 9-fold or 12-fold coordination, may be the result of the presence of H3O or vacancies in the A site.

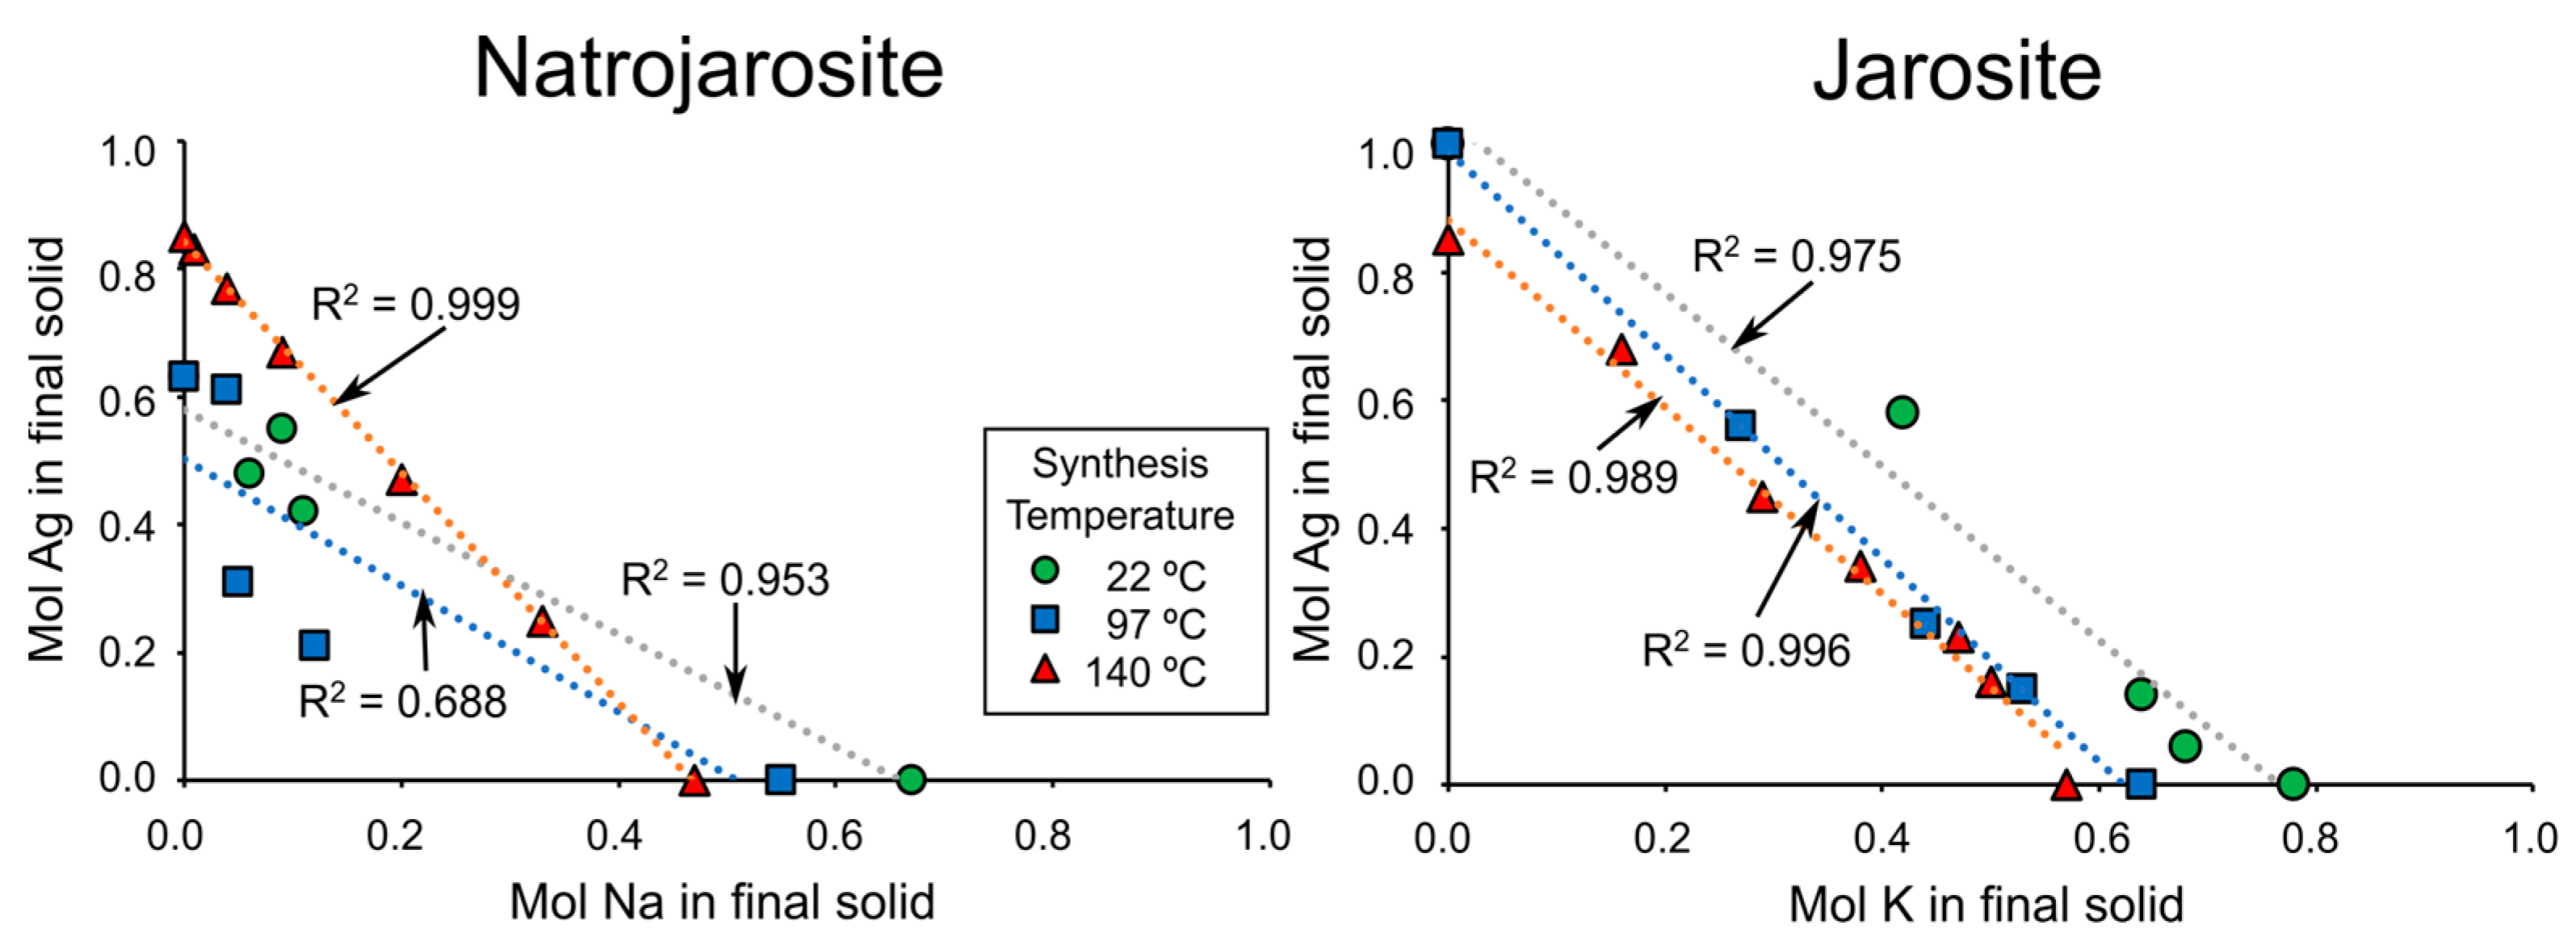
3.3. Compositions of the Synthetic K-Ag-H3O and Na-Ag-H3O Compounds

Atomic percentages of the A-, B- and T-site elements were determined using the wet chemical data. The molecular compositions of the synthetic natrojarosites and jarosites, calculated using the modified formula of Kubisz [6] that sets the SO4 in the structure to 2, are shown in Table 2. Almost all samples contained hydronium and had lower than expected Fe occupation at the B-site (i.e., less than the ideal of 3.00). The reason for the low Fe occupancy is as follows: If alkali ions are insufficient or depleted then hydronium ions (H3O+) can substitute for them, resulting in a product with the general composition Ax(H3O)1−xFe3(SO4)(OH)6 (0 < x < 1). During this reaction, incomplete hydrolysis often results in substitution of H2O for OH-, leading to an excess positive charge. Every three such disorders can result in the displacement of one Fe3+ ion, leading to Fe deficiency and the general composition for jarosite of Kx(H3O)1−xFe3−y(H2O)3y(OH)6−3y(SO4)2, where y > 0 (and for natrojarosite of Nax(H3O)1−xFe3−y(H2O)3y(OH)6−3y(SO4)2).
The compositional results show a generally declining content of K and Na in the jarosite compounds with a declining alkali cation concentration in the starting solutions of each series with different initial synthesis temperatures (Table 2; Figure 4), suggesting that the starting-solution alkali content strongly influences the alkali content in the final product. Accompanying the trends of declining K and Na contents is a complementary trend of increasing Ag content as the concentration of Ag increases in the starting solutions (Table 2). The synthesised Na-H3O- and K-H3O-jarosites all incorporate Ag (Table 2; Figure 4). The degree of Ag incorporation increased with increasing synthesis temperature. A higher degree of Ag incorporation with the lowest initial concentration of Ag in the starting solution was achieved with the compounds synthesised at 140 °C compared to those synthesised at 97 °C and 22 °C. The Na-H3O-jarosite compounds synthesised at 140 °C incorporated more Ag than the K-H3O-jarosites for the same amounts of Ag in the starting solutions, as shown by the downward-facing curve in the former compared to the upward-facing curve in the latter in the molar Ag in Figure 4. This could be due to the preferential incorporation of K in jarosites compared to Ag and Na (Dutrizac and Jambor, 2000); K will be taken up preferentially to Ag, giving higher K:Ag ratios than analogous Na:Ag ratio in the Na-jarosites, which in turn could incorporate more Ag. Similar upward-facing curves are recorded for the K-H3O-Ag-jarosite compounds synthesised at 97 °C and 22 °C, and for the Na-H3O-Ag-jarosite compounds synthesised at 22 °C. By contrast, the Na-H3O-Ag-jarosite compound curve is sigmoidal, due mainly to an anomalous molar Ag in the final solid value for sample JS36.
The different series of compounds generally show good linear relationships between the content of the alkali and Ag cations in the products (Figure 5). For example, the K-Ag-H3O jarosite series 55–61, synthesised at 140 °C, has an R2 value of 0.989; series 22–30, synthesised at 97 °C, has an R2 value of 0.996; and series 72–76, synthesised at 22 °C, has an R2 value of 0.975 (Figure 5). The R2 values of Na-Ag-H3O series 49–54 and 61, synthesised at 140 °C, has an R2 value of 0.999, but the other two Na-Ag-H3O series have poorer linear relationships (R2 = 0.688 for series 32–38 and 30, synthesised at 97 °C and R2 = 0.953 for series 77–80 and 72, synthesised at 97 °C). The poorer R2 values for the latter may be due to excess hydronium in the Na-Ag-H3O jarosites made at these lower temperatures, or to an analytical error. The strong trends confirm that the Na-Ag-jarosite and K-Ag-jarosite solid solution series can form in the presence of H3O, as previously shown by others for medium-to-high temperatures [9,14]. Our results also show that the solid solutions can exist at 22 °C.
The K A-site contents of samples synthesised at 97 °C vary from 0.64 in sample JS22 (ideal site occupancy 1.0), from an initial solution concentration of 0.22 M K (and 0.00 M Ag) (and an Fe:K ratio in the starting solution of 4.64:1, so with excess Fe compared with the stoichiometric ratio of 3:1), to 0.27 in JS28, from a starting-solution K concentration of 0.055 M (and 0.165 M Ag) (Fe:K ratio 18.55:1). An increase in K content is seen moving from sample JS22 (0.64) to JS24 (0.53), in the series, sample JS06, in parallel with the decrease in the concentration of K in the starting solution of the latter, when Ag is first added to samples in the series. This phenomenon is also seen in samples JS55 and JS56 of series JS55-JS61, and in the Na-Ag-H3O sample series synthesised at 22 °C and 140 °C, but not at 97 °C (Table 2).
Sample JS32, synthesised at 97 °C from an initial solution concentration of 0.22 M Na (0.00 M Ag) (Fe:Na ratio in 4.64:1), has an anomalously low Na content of 0.02. Similarly low Na contents are found in samples JS36 (Na content 0.03) and JS38 (Na content 0.04), both also synthesised at 97 °C, but from lower starting-solution Na concentrations of 0.11 M (and 0.11 M Ag) and 0.055 M (and 0.165 M Ag), respectively, and higher Fe:K ratios of 9.27:1 and 18.55:1, respectively, as well as in sample 80 (Na content 0.03), synthesised at 22 °C from a starting-solution Na concentration of 0.055 M (and 0.165 M Ag) (Fe:Na ratio 18.55:1). By contrast, sample JS34, synthesised at 97 °C from an initial solution concentration of 0.165 M Na (and 0.055 M Ag) (Fe:Na ratio 6.18:1), has an Na content of 0.47, respectively. The improved Na A-site content as a result of higher temperature of synthesis is indicated by the samples of series JS49-54, synthesised at 140 °C, which have high Na contents relative to their Fe:Na ratios in the starting solutions, compared with the products synthesised at 22 °C and 97 °C. This is likely to be a result of synthesis at 140 °C being above the boiling point of water, so limiting the amount of hydronium entering the A site.
Of the products synthesised at 97 °C, sample 30 has an Ag content of 1.00, from a starting-solution concentration of 0.22 M Ag with no alkali cations. The declining A-site occupancy of Ag in the products at a faster rate than the concentration of Ag in the synthesis solutions may be a result of the competition from the H3O cation, which has a greater preference for this site than Ag in the jarosite crystal structure [1].
The A-site occupancy data (Table 2), which indicate higher temperatures of synthesis, generally have a tendency to increase the alkali and Ag occupancy of the A site of the products. The samples synthesised at 140 °C have relatively high K and Ag contents, and correspondingly lower H3O contents, compared with the samples synthesised at lower temperatures, with regard to the cation concentrations in the starting solutions. Synthesised at 140 °C, sample 49 has an Na content of 0.47 and sample 50 has an Na content of 0.16, from starting-solution concentrations of 0.12 M (with no Ag) (Fe:Na ratio 2.5:1) and 0.10 M Na (and 0.02 M Ag) (Fe:Na ratio 3:1), respectively, which compare with 0.02 in sample 32, synthesised at 97 °C using 0.22 M Na (with no Ag) (Fe:Na ratio 4.64:1). Synthesised at 140 °C, sample 61 has an Ag content of 0.76, from an initial solution concentration of 0.12 M Ag (and no K or Na) (Fe:Ag ratio 2.5:1), which compares with Ag contents of 0.63 in sample 30, synthesised at 97 °C using 0.22 M Ag (and no alkali cations) (Fe:Ag ratio 4.64:1).
In the products synthesised at 22 °C, the K contents are higher than those synthesised at 97 °C. The products synthesised at 22 °C have lower Na contents compared with those synthesised at 97 °C; for example, sample JS78 has an Na content of 0.09 compared to 0.47 in sample JS34. The Ag-H3O jarosites synthesised at 22 °C and 97 °C have similar Ag contents of 0.74 and 0.63, respectively. These are lower than the Ag content (0.76) in the product synthesised at 140 °C.
In the K-Ag jarosite compounds, the K content is consistently higher than the Ag content. The residual H3O contents are high, and this may be a result of the excess Fe in the starting solutions, with the Fe:K ratio 4.64:1 compared with the stoichiometric jarosite ratio of 3:1. Some of the synthesised samples have high K contents compared to starting K concentrations in the starting solutions: examples are samples JS56 and JS57, which have K contents of 0.50 and 0.47, respectively; from starting solutions with K concentrations of 0.10 M and 0.08 M, respectively; and Fe:K ratios of 3:1 and 3.75:1, respectively. In the same series, samples JS60 and JS61 have Ag contents of 0.68 and 0.85, respectively, from starting solutions with Ag concentrations of 0.10 M and 0.12 M, respectively. In almost all of the Na-Ag jarosite compounds, the Ag content is higher than the Na content.
The results suggest that, at all temperatures, the order of cation preference for occupancy of the A site in the synthesised compounds is K > Na > H3O > Ag, which is consistent with the reported order of preference for incorporation into the A site of the jarosite structure [1]. The order is also consistent with Gibb’s free energy data of −3309 kJ/mol, −3270 kJ/mol, −3247 kJ/mol and −2948 kJ/mol for jarosite, natrojarosite, hydroniumjarosite and argentojarosite, respectively [23].

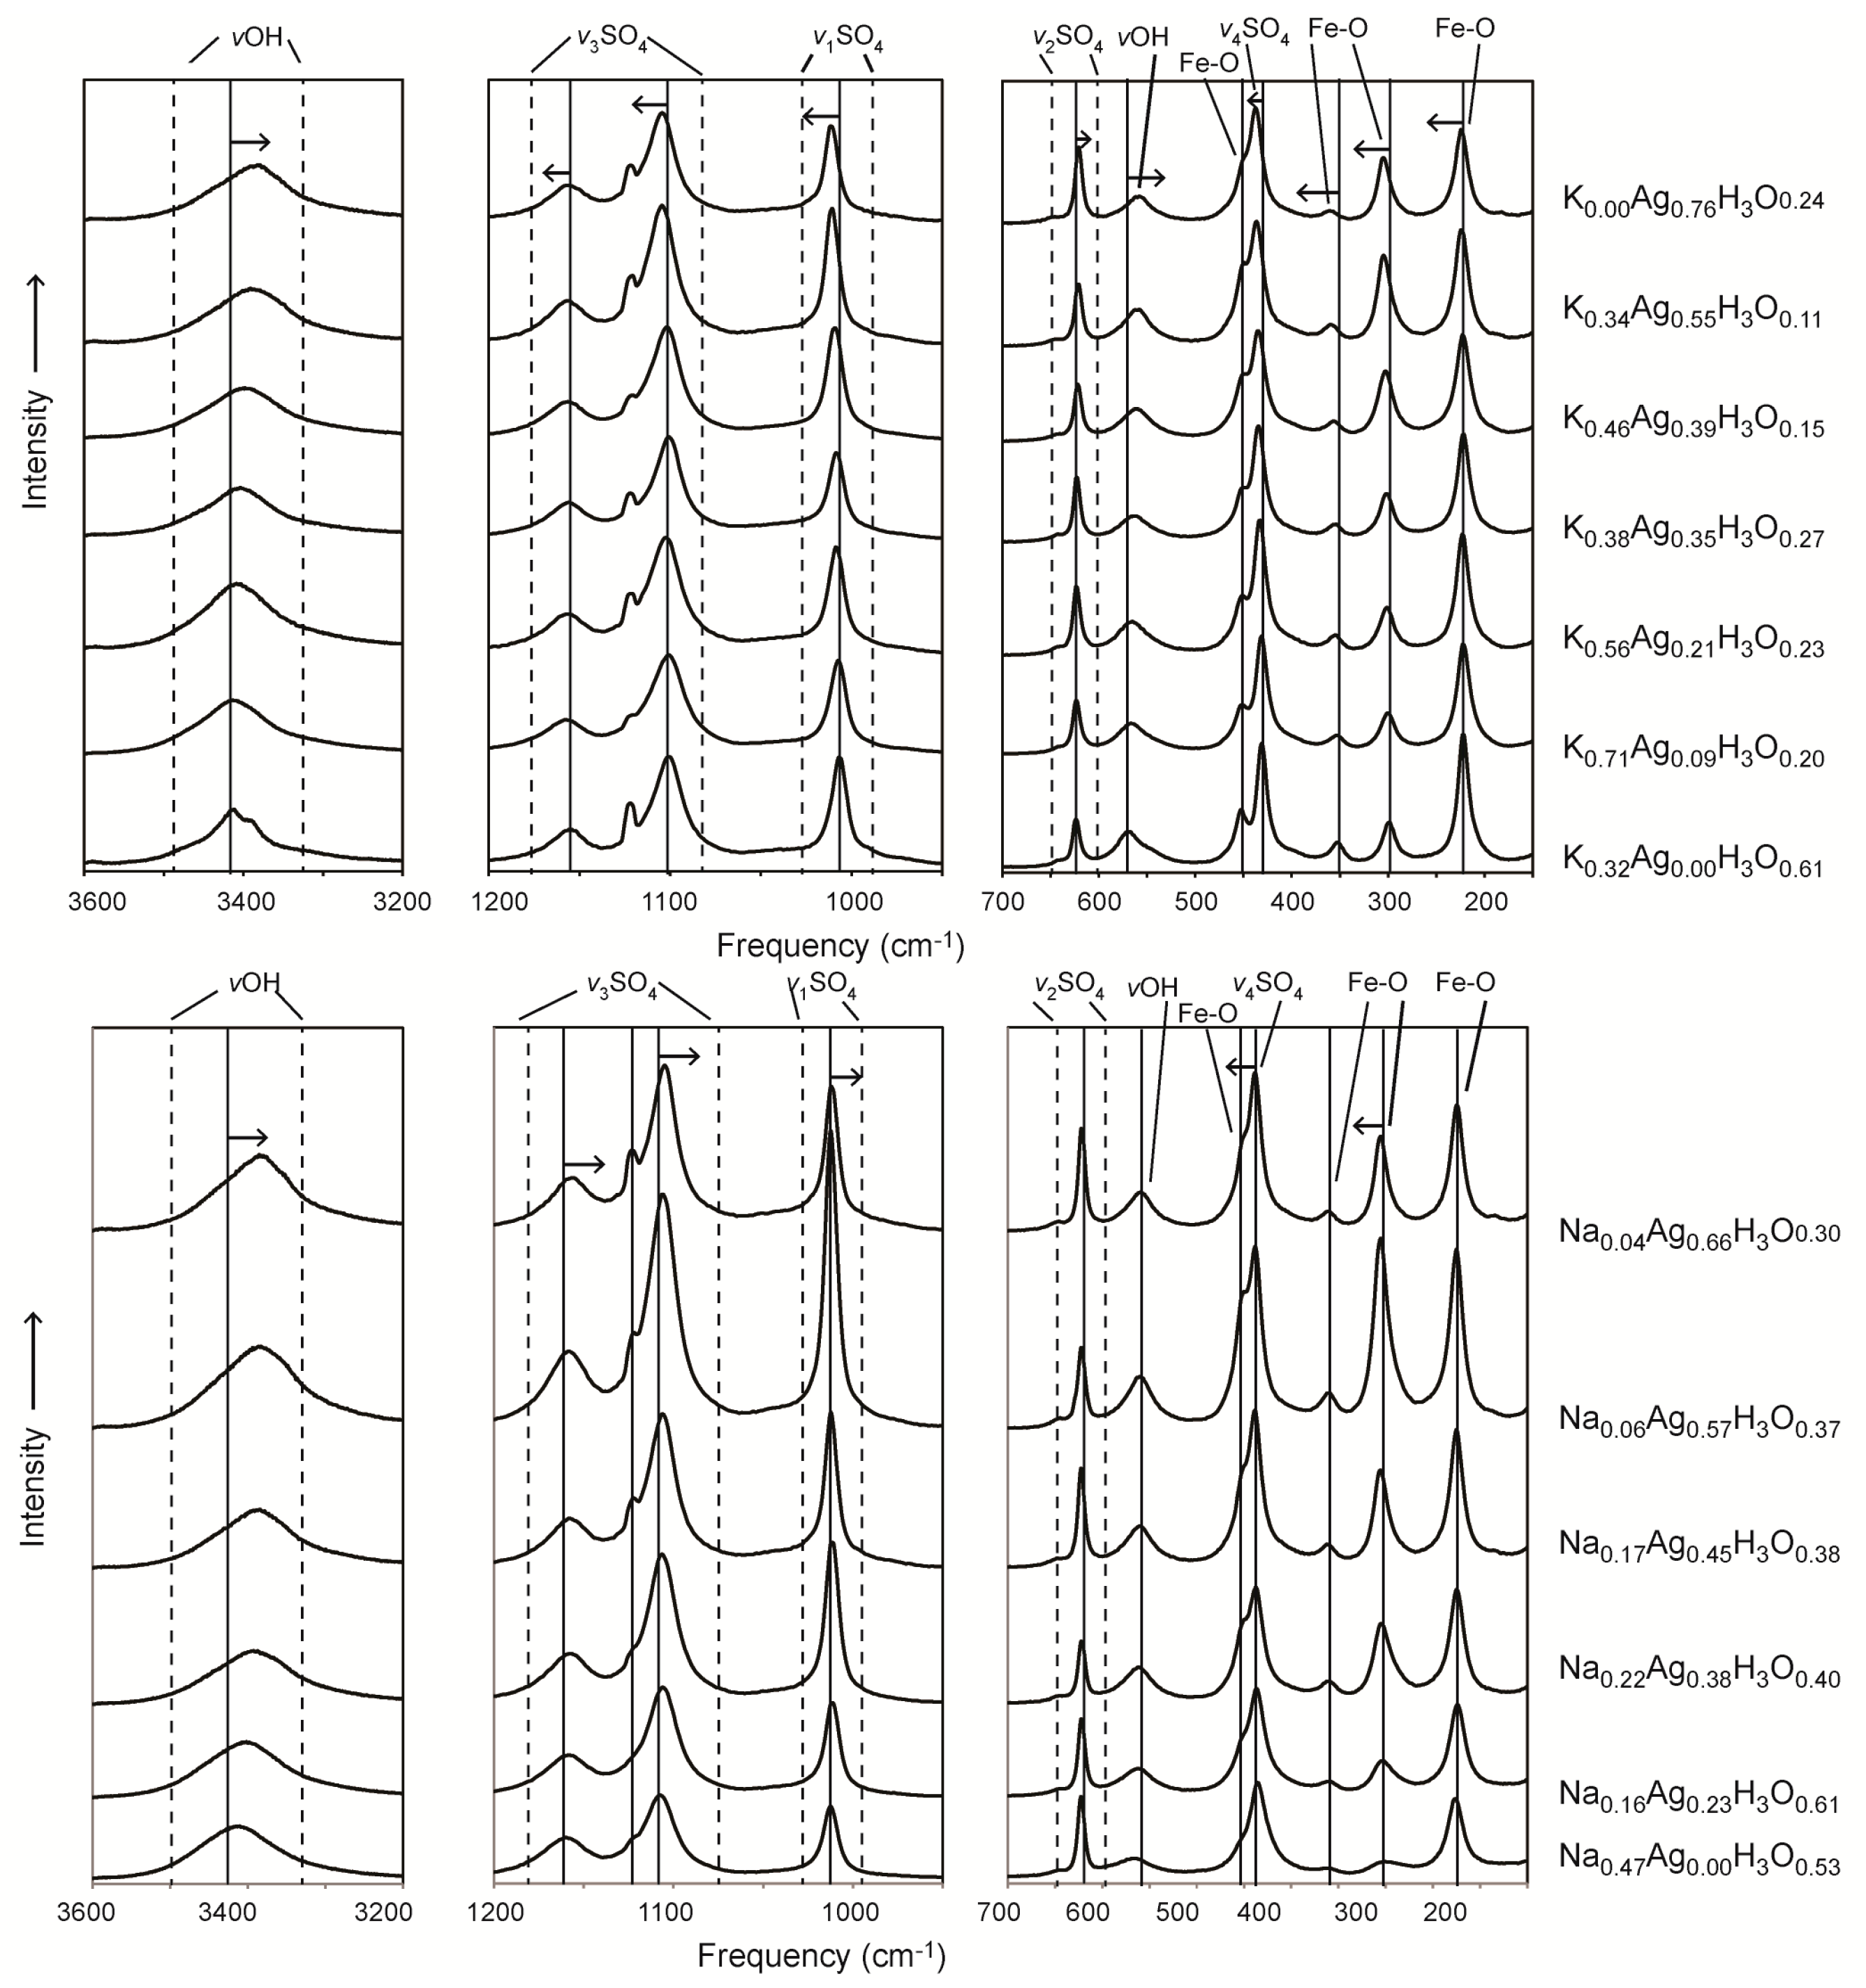
3.4. The Raman Spectra

Jarosite exhibits spectral features as a result of the vibrational frequencies of the molecular bonds of sulfate groups, hydroxyl groups and metal-oxygen bonds, as well as lattice vibrations and iron excitations [24]. Sulfate tetrahedra in an aqueous solution possess Td symmetry and vibrational frequencies which occur as a result of v1(SO42−) symmetric stretching, v2(SO42−) symmetric bending, v3(SO42−) asymmetric stretching and v4(SO42−) asymmetric bending, which are all Raman active [25,26]. The symmetric vibrational modes produce more intense bands compared with the other sulfate vibrations because of changes in polarizability [26]. Sulfates of jarosite have C3v symmetry (monodentate, corner-sharing) and one v1, one v2, two v3 and two v4 frequencies are exhibited [24,26]. Fundamental frequencies and combinations and overtones are all observed [24]. In jarosites, other vibrational frequencies occur as a result of hydroxyl v(OH) stretching, δ(OH) in-plane bending and γ(OH) out-of-plane bending, as well as cation bonding in Fe-O and Fe-OH [25,27,28,29].
The Raman spectroscopic analyses of some of the synthetic jarosite compounds enabled the detected vibrational frequencies (wavenumbers, cm−1) of the spectral peaks to be assigned to particular modes, which are shown in Table 3 and Figure 6. These assignments were made on the basis of comparison with reported frequencies and assigned modes [26,27,28,29,30] and comparison with detected peaks in samples of the RRUFF Project database of Raman spectra at the University of Arizona (see Table 3). For the synthesised K-Ag-H3O jarosites of this study, the modes assigned to the detected ranges of vibrational frequencies (wavenumbers) are: Fe-O 221.1–228.4 cm−1, 274.1–307.0 cm−1, 353.3–371.9 cm−1, 432.4–438.1 cm−1; v2(SO4) 432.44–438.26, 451.3–458.8 cm−1; Fe-OH 556.9–576.1 cm−1; v4(SO4) 620.9–627.3 cm−1; v1(SO4) 965.8–1013.6 cm−1; v3(SO4) 1082.6–1110.1 cm−1, 1120.2–1125.2 cm−1, 1140.4–1166.8 cm−1; and v(OH) 3378.5–3419.9 cm−1 (Table 4). For the synthesised Na-Ag jarosites, the vibrational frequencies and assigned modes are: Fe-O 224.6–228.4 cm−1, 296.0–309.8 cm−1, 358.9–371.9 cm−1, 435.9–441.4 cm−1; v2(SO4) 435.87–441.41, 450.7–458.8 cm−1; Fe-OH 555.4–570.6 cm−1; v4(SO4) 621.8–625.8 cm−1; v1(SO4) 966.6–1016.2 cm−1; v3(SO4) 1088.0–1114.3 cm−1, 1122.2–1125.2 cm−1, 1140.4–1165.3 cm−1; and v(OH) 3378.5–3417.2 cm−1 (Table 5).
The Raman spectra of the synthesised K-Ag and Na-Ag jarosites also contain bands that have not been reported in previous Raman studies (Table 4 and Table 5). These include peaks at 3581.8–3595.3 cm−1 in K-Ag samples and 3578.3–3593.5 cm−1 in Na-Ag samples. Of these, the only strong band strength was in the Ag sample JS72 at 3592.4 cm−1; in all the other samples, the band strengths were weak. These peaks have been assigned to a hydroxyl stretching mode, v(OH), or water stretching mode, v(H2O), on the basis of evidence from other studies. Raman peaks at 3515 cm−1 were assigned to v(OH) in Sasaki et al. [25], whereas IR peaks at 3501 cm−1 were assigned to v(H2O) in Powers et al. [31]. IR peaks at ~3550 cm−1 (medium band strength) in synthetic Na-jarosite and K-jarosite and ~3550 cm−1 (weak band strength) in natural jarosite were assigned to v(H2O) in Bishop and Murad [24]. A study of the IR spectrum of K-jarosite reports a broad profile centred on 3356 cm−1 with overlapping bands of v(OH) (hydroxyl stretching) modes and adsorbed water extending from 3590 to 2600 cm−1; however, Raman analysis does not show bands of adsorbed water [28]. IR spectral bands at ~3600 cm−1 have been assigned to v(OH) bands in the sulfates gypsum and ettringite [26].
Spectral bands were detected at 3075.1–3080.1 cm−1 in K-Ag samples and 3075.1–3082 cm−1 in Na-Ag samples. Strong band strengths were present in Ag-jarosite samples JS72 and JS61, and in K-Ag samples JS24, JS26, JS55, JS57, JS58, JS59, JS60, JS74 and JS76; medium strength peaks were present in Na-Ag samples JS34, JS49, JS51, JS52, JS53, JS78 and JS80, and all other peaks were weak. These peaks have been assigned to v(OH), on the basis of the IR study of K-jarosite by Frost et al. [28], reporting a broad profile centred on 3356 cm−1 with overlapping bands of v(OH) modes from 3590 to 2600 cm−1. For the same reason, two further band ranges have been assigned to v(OH). The first are peaks at 2760.2–2762.5 cm−1 in K-Ag samples and 2752.5–2760.2 cm−1 in Na-Ag samples. Ag-jarosite sample JS72 has a medium-strength band at 2760.2 cm−1; all other bands in the range are weak. The second are peaks at 2573.6–2580.5 cm−1 in K-Ag samples and 2574.9–2583.1 cm−1 in Na-Ag samples. Again, only Ag-jarosite sample JS72 has a medium-strength band; all other bands in the range are weak.
Spectral bands were present at 1668.0–1690.5 cm−1 in K-Ag samples and 1598.4–1687.5 cm−1 in Na-Ag samples. These have been assigned to 2v3(SO42−)/2δOH, on the basis of reported IR bands at 1634s cm−1 in synthetic K-jarosite and at 1639s cm−1 in synthetic Na-jarosite and at 1630 cm−1 in natural K-jarosite, which were assigned to δ(H2O) (in-plane bending) [25]. In addition, RRUFF Project jarosite samples R060113 (K-jarosite), R070493 (K-jarosite), R050289 (Na-jarosite), R050471 (Na-jarosite) and 060097 (Ag-jarosite) show weak, broad peaks at 1672.5–1692.2 cm−1.
Raman frequency differences in vibrational modes with different A-site substitutions in the jarosite structure may be caused by the heaviness (atomic number) of the elements present [30]. These frequency differences may be due to differences in the bonding to the metal cations, thus revealing small but important structural differences with cation substitution, which may be due to the different electronic configurations of Ag (a transition metal) and K and Na (alkali metals) [30]. In some of the synthesised products in this study, the assigned vibrational modes of the K-H3O-synthesised products have higher wavenumbers (cm−1) than their Ag-H3O equivalents, which is consistent with some reported modes but not with others [25,27,28,30]: compounds JS22 and JS30 (97 °C), vOH (3411.7 and 3393.7), v3SO4 (lower reading, 1104.5 and 1088), v1SO4 (lower reading, 1009.3 and 972.12) and v4SO4 (627.16 and 624.4). Therefore, these results are not consistent with predicted stronger bonds for heavier elements [30]; this could be due to the contents of H3O in the synthetic compounds produced in this study. In some other cases, the K-H3O products have lower wavenumbers than their Ag-H3O equivalents, thereby providing evidence of stronger bonds for Ag: compounds JS22 and JS30 (97 °C), v3SO4 (upper reading, 1158.4 and 1163.9) and v2SO4 (432.6 and 438.12); compounds JS55 and JS61 (140 °C), v3SO4 (1101.22 and 1104.39; 1154.93 and 1156.51), v1SO4 (1007.2 and 1012) and v2SO4 (432.44 and 437.58); and products JS73 and JS72 (22 °C), v3SO4 (lower reading, 1103.18 and 1104.77), v1SO4 (1007.58 and 1012.39) and v2SO4 (432.85 and 437.99).
In all cases, the assigned modes of Ag-H3O products do not have higher wavenumbers than their Na-H3O equivalents, but some have the same wavenumbers, which is consistent with some reported modes but not with others (Table 4 and Table 5) ([25,28] RRUFF projects 060097 and 060098). The Na-H3O modes with higher wavenumbers than their Ag-H3O equivalents are: compounds JS32 and JS30 (97 °C), vOH (3399.2 and 3393.7), v3SO4 (1108.7 and 1088; 1165.3 and 1163.9), v4SO4 (625.78 and 624.4) and v2SO4 (439.5 and 438.12); compounds JS49 and JS61 (140 °C), vOH (3405.3 and 3384.97) and v3SO4 (1106.35 and 1104.39; and 1158.46 and 1156.51); and compounds JS77 and JS72 (22 °C), vOH (3401.76 and 3373.43), v3SO4 (1107.94 and 1104.77; 1156.88 and 1122.18), v4SO4 (624.21 and 622.53) and v2SO4 (441.41 and 437.99). Therefore, these results are also not consistent with the predicted stronger bonds for heavier elements [30], which again could be due to the H3O incorporated in this study’s synthetic compounds.
In many of the series of synthesised K-Ag-H3O and Na-Ag-H3O jarosite products, no clear trend is discernible in the wavenumbers of the assigned modes. The K-Ag-H3O series in which trends may be observed are: JS22–JS30 (97 °C), v4SO4 (decreasing cm−1); JS55–JS61 (140 °C), vOH (decreasing cm−1), v3SO4 (increasing cm−1) and v1SO4 (increasing cm−1); and 72–76 (22 °C), vOH (decreasing cm−1), v1SO4 (increasing cm−1) and v2SO4 (increasing cm−1). The Na-Ag-H3O series in which trends may be observed are: JS30–JS38 (97 °C), v3SO4 (increasing cm−1, except the Na-H3O and Ag-H3O products) and v2SO4 (increasing cm−1, except the Na-H3O product); JS49–JS54 and JS61 (140 °C), vOH (decreasing cm−1) and v3SO4 (decreasing cm−1); and JS72 and JS77–80 (22 °C), v2SO4 (decreasing cm−1).
In the Fe-O modes, the K-Ag-synthesised products have lower ranges of frequencies than the Na-Ag products, which is not consistent with some reported modes ([28,29] RRUFF project R050471), but is with other reported modes ([25,30] RRUFF project R060113). Therefore, these results provide contradictory evidence on any relationship between Fe-O bonding and A-site substitution. It is likely that there is a relationship; however, the lack of consistency with previous research suggests that products of different compositions were analysed compared to those in our study, or that the presence of hydronium in the solids affected the mode frequencies.

4. Conclusions

Jarosite compounds with the A site filled with K, Na, Ag and H3O were synthesised at 22 °C, 97 °C and 140 °C, and these were characterised by XRD, SEM, chemical analysis and Raman spectroscopy. The jarosite and natrojarosite compounds all took up Ag, especially in the 140 °C synthesis. Silver is the least favoured, however, of K, Na and H3O to occupy the A site in the synthesized compounds due to the lower stability it infers on the solids. Despite this, the compounds took up increasing amounts of Ag that correlated with the amounts of Ag in the starting solutions, despite high degrees of H3O incorporation, especially in the lower temperature syntheses. The SEM, XRD and Raman characterisation methods were effective at distinguishing the different jarosite compounds, and the resultant database will be useful for predicting the capacity of jarosite family minerals for the uptake of Ag in natural and engineered environments.

Author Contributions

Conceptualization, K.A.H.-E. and P.F.C.; methodology, P.F.C., K.A.H.-E. and M.D.W.; formal analysis, P.F.C., K.A.H.-E. and M.D.W.; investigation, P.F.C., K.A.H.-E. and M.D.W.; resources, K.A.H.-E. and M.D.W.; data curation, K.A.H.-E.; writing—original draft preparation, P.F.C.; writing—review and editing, P.F.C., K.A.H.-E. and M.D.W.; visualization, P.F.C., K.A.H.-E. and M.D.W.; supervision, K.A.H.-E. and M.D.W.; project administration, K.A.H.-E.; funding acquisition, K.A.H.-E. All authors have read and agreed to the published version of the manuscript.

Funding

This research was funded by a postgraduate studentship to P.F. Cogram granted by Birkbeck, University of London.

Data Availability Statement

Data for this paper can be found in this article and at https://eprints.bbk.ac.uk/id/eprint/40262/ (accessed on 2 February 2023).

Acknowledgments

This work was funded through a Birkbeck postgraduate research studentship to P.F. Cogram. We thank A. Beard for assistance with electron microprobe analysis, S. Hirons for help with XRD analysis, J. Davy for help with SEM analysis, P. Murphy and S. Crust for assistance with Raman analysis, G. Tarbuck for assistance with acid digestion and ICP-OES analysis, and A. Osborn for help with the synthesis of jarosite compounds.

Conflicts of Interest

The authors declare no conflict of interest. The funders had no role in the design of the study; in the collection, analyses, or interpretation of data; in the writing of the manuscript; or in the decision to publish the results.

References

  1. Jambor, J.L. Nomenclature of the alunite supergroup. Can. Mineral. 1999, 37, 1323–1341. [Google Scholar]
  2. Hawthorne, F.C.; Krivovichev, S.V.; Burns, P.C. Crystal chemistry of sulphate minerals. Rev. Mineral. Geochem. 2000, 40, 405–452. [Google Scholar] [CrossRef]
  3. Desborough, G.A.; Smith, K.S.; Lowers, H.A.; Swayze, G.A.; Hammarstrom, J.M.; Diehl, S.F.; Leinz, R.W.; Driscoll, R.L. Mineralogical and chemical characteristics of some natural jarosites. Geochim. Cosmochim. Acta 2010, 74, 1041–1056. [Google Scholar] [CrossRef] [Green Version]
  4. Majzlan, J.; Stevens, R.; Boerio-Goates, J.; Woodfield, B.F.; Navrotsky, A.; Burns, P.C.; Crawford, M.K.; Amos, T.G. Thermodynamic properties, low-temperature heat-capacity anomalies, and single-crystal X-ray refinement of hydronium jarosite, (H3O)Fe3(SO4)2(OH)6. Phys. Chem. Miner. 2004, 31, 518–531. [Google Scholar] [CrossRef]
  5. Basciano, L.C.; Peterson, R.C. Crystal chemistry of the natrojarosite–jarosite and natrojarosite–hydronium jarosite solid solution series: A synthetic study with full iron site occupancy. Am. Mineral. 2008, 93, 853–862. [Google Scholar] [CrossRef]
  6. Kubisz, J. Studies on synthetic alkali-hydronium jarosites: I. Synthesis of jarosite and natrojarosite. Mineral. Polonica 1970, 1, 47–59. [Google Scholar]
  7. May, A.; Sjoberg, J.J.; Baglin, E.G. Synthetic argentojarosite: Physical properties and thermal behaviour. Am. Mineral. 1973, 58, 936–941. [Google Scholar]
  8. Dutrizac, J.E.; Kaiman, S. Synthesis and properties of jarosite-type compounds. Can. Mineral. 1976, 14, 151–158. [Google Scholar]
  9. Dutrizac, J.E.; Jambor, J.L. Formation and characterization of argentojarosite and plumbojarosite and their relevance to metallurgical processing. In Proceedings of the Second International Congress on Applied Mineralogy in the Minerals Industry, Los Angeles, CA, USA, 22–25 February 1984; Park, W.D., Hausen, D.M., Hagni, R.D., Eds.; AIME: New York, NY, USA, 1984; pp. 507–530. [Google Scholar]
  10. Dutrizac, J.E.; Jambor, J.L. The behavior of arsenic during jarosite precipitation: Arsenic precipitation at 97 degrees from sulfate or chloride media. Can. Metall. Q. 1987, 26, 91–101. [Google Scholar] [CrossRef]
  11. Patino, F.; Salinas, E.; Cruells, M.; Roca, A. Alkaline decomposition cyanidation kinetics of argentian natrojarosite. Hydrometallurgy 1998, 49, 323–336. [Google Scholar] [CrossRef]
  12. Calla-Choque, D.; Lapidus, G.T. Acid decomposition and silver leaching with thiourea and oxalate from an industrial jarosite sample. Hydrometallurgy 2020, 192, 105289. [Google Scholar] [CrossRef]
  13. Islas, H.; Flores, M.U.; Juárez, J.C.; Reyes, M.; Blanco, A.; Gutiérrez, E.; Aguilar, J.; Nolasco, M.C.; Rodríguez, I.; Reyes, I.A. Silver leaching from jarosite-type compounds using cyanide and non-cyanide lixiviants: A kinetic approach. Miner. Eng. 2021, 174, 107250. [Google Scholar] [CrossRef]
  14. Ildefonse, J.P.; Le Toullec, C.; Perrotel, V. About the synthetic lead–silver jarosite solid solution. In Experimental Mineralogy and Geochemistry, International Symposium; Nancy: San Francisco, CA, USA, 1986; pp. 72–73. [Google Scholar]
  15. Anthony, J.W.; Bideaux, R.A.; Bladh, K.W.; Nichols, M.C. Handbook of Mineralogy; Mineralogical Society of America: Chantilly, VA, USA, 2003. [Google Scholar]
  16. Gasharova, B.; Gottlicher, J.; Becker, U. Dissolution at the surface of jarosite: An in-situ AFM study. Chem. Geol. 2005, 215, 499–516. [Google Scholar] [CrossRef]
  17. Desborough, G.A.; Smith, K.S.; Lowers, H.A.; Swayze, G.A.; Hammarstrom, J.M.; Diehl, S.F.; Driscoll, R.L.; Leinz, R.W. The use of synthetic jarosite as an analog for natural jarosite. In Proceedings of the Seventh International Conference on Acid Rock Drainage (ICARD 7), St Louis, MO, USA, 26–30 March 2006; pp. 458–475. [Google Scholar]
  18. Brophy, G.P.; Sheridan, M.F. Sulphate studies IV: The jarosite-natrojarosite-hydronium jarosite solid solution series. Am. Mineral. 1965, 50, 1595–1607. [Google Scholar]
  19. Papike, J.J.; Karner, J.M.; Shearer, C.K. Implications of Martian and terrestrial jarosite: A crystal chemical perspective. Geochim. Cosmochim. Acta 2006, 70, 1309–1321. [Google Scholar] [CrossRef]
  20. Shannon, R.D. Revised effective radii and systematic studies of interatomic distances in halides and chalcogenides. Acta Crystal. 1976, A32, 751–767. [Google Scholar] [CrossRef]
  21. Dutrizac, J.E.; Jambor, J.L. Jarosites and their application in hydrometallurgy. Rev. Mineral. Geochem. 2000, 40, 405–452. [Google Scholar] [CrossRef]
  22. Groat, L.A.; Jambor, J.L.; Pemberton, B.C. The crystal structure of argentojarosite, AgFe3(SO4)2(OH)6. Can. Mineral. 2003, 41, 921–928. [Google Scholar] [CrossRef]
  23. Gaboreau, S.; Vieillard, P. Prediction of Gibbs free energies of formation of minerals of the alunite supergroup. Geochim. Cosmochim. Acta 2004, 68, 3307–3316. [Google Scholar] [CrossRef]
  24. Bishop, J.L.; Murad, E. The visible and infrared spectral properties of jarosite and alunite. Am. Mineral. 2005, 90, 1100–1107. [Google Scholar] [CrossRef]
  25. Sasaki, K.; Tanaike, O.; Konno, H. Distinction of jarosite-group compounds by Raman spectroscopy. Can. Mineral. 1998, 36, 1225–1235. [Google Scholar]
  26. Myneni, S.C.B. X-ray and vibrational spectroscopy of sulphate in earth materials. Rev. Mineral. Geochem. 2000, 40, 113–172. [Google Scholar] [CrossRef]
  27. Serna, C.J.; Parada Cortina, C.; Garcia Ramos, J.V. Infrared and Raman study of alunite-jarosite compounds. Spectrochim. Acta 1986, 42A, 729–734. [Google Scholar] [CrossRef] [Green Version]
  28. Frost, R.; Wills, R.-A.; Weier, M.; Martens, W. A Raman spectroscopic study of selected natural jarosites. Spectrochim. Acta 2006, 63, 1–8. [Google Scholar] [CrossRef] [Green Version]
  29. Casas, J.M.; Paipa, C.; Godoy, I.; Vargas, T. Solubility of sodium-jarosite and solution speciation in the system Fe(III)–Na–H2SO4–H2O at 70 °C. J. Geochem. Explor. 2007, 92, 111–119. [Google Scholar] [CrossRef]
  30. Murphy, P.J.; Smith, A.M.L.; Hudson-Edwards, K.A.; Dubbin, W.E.; Wright, K. Raman and IR spectroscopic studies of alunite-supergroup compounds containing Al, Cr3+, Fe3+ and V3+ at the B site. Can. Mineral. 2009, 47, 663–681. [Google Scholar] [CrossRef] [Green Version]
  31. Powers, D.A.; Rossman, G.R.; Schugar, H.F.; Gray, N.B. Magnetic behavior and infrared spectra of jarosite, basic iron sulfate, and their chromate analogs. J. Solid State Chem. 1975, 13, 1–13. [Google Scholar] [CrossRef]
Figure 1. The structure of Na/K/Ag jarosite (monoclinic, space group C2/m). Left: A polyhedral representation of the B layer of edge-sharing Fe(OH)4O2 octahedra and an overlying SO4A(Na, K, Ag) layer. Right: Ball-and-spoke diagram showing the alternating layers of Fe(OH)4O2 octahedra (Fe brown) and SO4 tetrahedra (S yellow). Oxygen atoms of hydroxyl groups are shown in pale blue, other oxygen atoms are red. Na/K/Ag atoms are grey. The apical oxygen of the SO4 tetrahedron (S=O) receives three hydrogen bonds from three hydroxyl groups. The three oxygen Odonor(-H)…Oacceptor distances are ~2.75 Å (two) and ~2.95 Å (one). H atoms are omitted for clarity. Centre: A-site atoms (Na/K/Ag) occupy large dodecahedral cavities within the polyhedral framework and are located in the SO4 layer. (b) The coordination polyhedron of Na/Ag-O6(OH)6. Projections of the jarosite unit cell are shown in red.
Metals 13 00627 g001
Figure 2. Photomicrographs of end-member K-H3O, Na-H3O and Ag-H3O synthesised at 22 °C, 97 °C and 140 °C.
Metals 13 00627 g002
Figure 3. XRD diffractograms of synthetic end-member K-Ag-H3O jarosite compounds at 22 °C, 97 °C and 140 °C.
Metals 13 00627 g003
Figure 4. Comparison of moles of Na, K and Ag in the starting solutions with moles of Na, K and Ag in the final synthesised natrojarosite and jarosite solids.
Metals 13 00627 g004
Figure 5. Moles Ag in the final synthesised natrojarosite and jarosite solids compared to moles Na and K in the final solids, respectively.
Metals 13 00627 g005
Figure 6. Raman spectra for K-Ag-H3O and Na-Ag-H3O compounds synthesised at 140 °C and dried at 110 °C.
Metals 13 00627 g006
Table 1. Conditions of the synthesis of synthetic jarosite group compounds.
CompoundSolution VolumeReagents K/Na + AgFeT of
Synthesis (°C)
Temperature of Drying/AnnealingDuration
K-Ag100 mL0.11–0 M K2SO4 and 0–0.11 M Ag2SO4 (5-step series)0.51 M Fe2(SO4)3.5H2O2222 °C12 months
Na-Ag100 mL0.11–0.0275 M Na2SO4 and 0–0.0825 M Ag2SO4 (3-step series)0.51 M Fe2(SO4)3.5H2O2222 °C12 months
Ka-Ag100 mL0.11–0 M K2SO4 and 0–0.11 M Ag2SO4 (5-step series)0.51 M Fe2(SO4)3.5H2O97110 °C for 1 h4 h
Na-Ag100 mL0.11–0.0275 M Na2SO4 and 0–0.0825 M Ag2SO4 (5-step series)0.51 M Fe2(SO4)3.5H2O97110 °C for 1 h4 h
Ka-Ag100 mL0.06–0 M K2SO4 and 0–0.06 M Ag2SO4 (7-step series)0.51 M Fe2(SO4)3.5H2O140110 °C for 1 h4 h
Na-Ag100 mL0.06–0.01 M Na2SO4 and 0–0.05 M Ag2SO4 (7-step series)0.51 M Fe2(SO4)3.5H2O140110 °C for 1 h4 h
Table 2. Starting solutions, site occupancy and XRD peaks of synthetic K-Ag-H3O and Na-Ag-H3O jarosite compounds. Peak shifts should be most pronounced of c parameters, which are indicated by hkl indices of 003 and 006 peaks.
SampleStarting SolutionTypeNaKAgH3OFeFormulahkl 003hkl 006
K-Ag-H3O-jarosite compounds
Solutions containing 0.51 M Fe2(SO4)3.5H2O heated at 97 °C and products dried at 110 °C
JS220.22 M K, 0.00 M AgK-H3O0.000.640.000.362.59K0.64(H3O)0.36Fe2.59(H2O)1.23(OH)4.77(SO4)25.7212.853
JS240.165 M K, 0.055 M AgK-Ag-H3O0.000.530.150.322.62K0.53Ag0.15(H3O)0.32Fe2.62(H2O)1.14(OH)4.86(SO4)25.6292.824
JS260.11 M K, 0.11 M AgK-Ag-H3O0.000.440.250.312.74K0.44Ag0.25(H3O)0.31Fe2.74(H2O)0.78(OH)5.22(SO4)25.6062.809
JS280.055 M K, 0.165 M AgAg-K-H3O0.000.270.560.172.57K0.27Ag0.56(H3O)0.17Fe2.57(H2O)1.29(OH)4.71(SO4)25.5192.774
JS300.00 M K, 0.22 M AgAg-H3O0.000.001.000.002.62Ag1.00(H3O)0.00Fe2.62(H2O)1.14(OH)4.86(SO4)25.5232.768
Solutions containing 0.15 M Fe2(SO4)3.5H2O heated at 140 °C and products dried at 110 °C
JS550.12 M K, 0.00 M AgK-H3O0.000.570.000.432.75K0.57(H3O)0.43Fe2.75(H2O)0.75(OH)5.25(SO4)25.7382.860
JS560.10 M K, 0.02 M AgK-Ag-H3O0.000.500.160.342.33K0.50Ag0.16(H3O)0.34Fe2.33(H2O)2.01(OH)3.99(SO4)25.7232.854
JS570.08 M K, 0.04 M AgK-Ag-H3O0.000.470.230.302.80K0.47Ag0.23(H3O)0.30Fe2.80(H2O)0.60(OH)5.40(SO4)25.6792.835
JS580.06 M K, 0.06 M AgK-Ag-H3O0.000.380.340.282.82K0.38Ag0.34(H3O)0.28Fe2.82(H2O)0.54(OH)5.46(SO4)25.7162.834
JS590.04 M K, 0.08 M AgK-Ag-H3O0.000.290.450.262.83K0.29Ag0.45(H3O)0.26Fe2.83(H2O)0.51(OH)5.49(SO4)25.6362.810
JS600.02 M K, 0.10 M AgAg-K-H3O0.000.160.680.162.96K0.16Ag0.68(H3O)0.16Fe2.96(H2O)0.12(OH)5.88(SO4)25.5892.781
JS610.00 M K, 0.12 M AgAg-H3O0.000.000.850.152.93Ag0.85(H3O)0.15Fe2.93(H2O)0.21(OH)5.79(SO4)25.5432.767
Solutions containing 0.51 M Fe2(SO4)3.5H2O prepared at 22 °C and products air-dried at 22 °C
JS730.22 M K, 0.00 M AgK-H3O0.000.780.000.222.40K0.78(H3O)0.22Fe2.40(H2O)1.80(OH)4.20(SO4)25.7122.842
JS740.165 M K, 0.055 M AgK-Ag-H3O0.000.680.060.262.52K0.68Ag0.06(H3O)0.26Fe2.52(H2O)1.44(OH)4.56(SO4)25.6762.831
JS750.11 M K, 0.11 M AgK-Ag-H3O0.000.640.140.222.49K0.64Ag0.14(H3O)0.22Fe2.49(H2O)1.53(OH)4.47(SO4)25.6792.830
JS760.055 M K, 0.165 M AgK-Ag-H3O0.000.420.580.002.99K0.42Ag0.58(H3O)0.00Fe2.99(H2O)0.03(OH)5.97(SO4)25.6132.789
JS720.00 M M+,2+, 0.22 M AgAg-H3O0.000.001.000.002.88Ag1.00(H3O)0.00Fe2.88(H2O)0.36(OH)5.64(SO4)25.7402.855
Na-Ag-H3O-jarosite compounds
Solutions containing 0.51 M Fe2(SO4)3.5H2O heated at 97 °C and products dried at 110 °C
JS320.22 M Na, 0.00 M AgNa-H3O0.020.000.000.982.87Na0.02(H3O)0.98Fe2.87(H2O)0.39(OH)5.61(SO4)25.5802.791
JS340.165 M Na, 0.055 M AgNa-Ag-H3O0.470.000.430.102.97Na0.47Ag0.43(H3O)0.10Fe2.97(H2O)0.09(OH)5.91(SO4)25.5762.773
JS360.11 M Na, 0.11 M AgAg-Na-H3O0.030.000.610.362.83Na0.03Ag0.61(H3O)0.36Fe2.83(H2O)0.51(OH)5.40(SO4)25.5682.778
JS380.055 M Na, 0.165 M AgAg-Na-H3O0.040.000.610.352.59Na0.04Ag0.61(H3O)0.35Fe2.59(H2O)1.23(OH)4.77(SO4)25.5382.772
JS300.00 M Na, 0.22 M AgAg-H3O0.000.001.000.002.62Ag1.00(H3O)0.00Fe2.62(H2O)1.14(OH)4.86(SO4)25.5232.768
Solutions containing 0.15 M Fe2(SO4)3.5H2O heated at 140 °C and products dried at 110 °C
JS490.12 M Na, 0.00 M AgNa-H3O0.470.000.000.532.64Na0.47(H3O)0.53Fe2.64(H2O)0.39(OH)5.61(SO4)25.5972.801
JS500.10 M Na, 0.02 M AgAg-Na-H3O0.160.000.230.613.04Na0.16Ag0.23(H3O)0.61Fe3(OH)6(SO4)25.6132.800
JS510.08 M Na, 0.04 M AgAg-Na-H3O0.220.000.380.402.90Na0.22Ag0.38(H3O)0.40Fe2.90(H2O)0.30(OH)5.70(SO4)25.6032.778
JS520.06 M Na, 0.06 M AgAg-Na-H3O0.170.000.450.382.93Na0.17Ag0.45(H3O)0.38Fe2.93(H2O)0.21(OH)5.79(SO4)25.5642.773
JS530.04 M Na, 0.08 M AgAg-Na-H3O0.060.000.570.372.98Na0.06Ag0.57(H3O)0.37Fe2.98(H2O)0.06(OH)5.94(SO4)25.5592.777
JS540.02 M Na, 0.10 M AgAg-Na-H3O0.040.000.660.302.98Na0.04Ag0.66(H3O)0.30Fe2.98(H2O)0.06(OH)5.94(SO4)25.5312.768
JS610.00 M Na, 0.12 M AgAg-H3O0.000.000.850.152.93Ag0.85(H3O)0.15Fe2.93(H2O)0.21(OH)5.79(SO4)25.5432.767
Solutions containing 0.51 M Fe2(SO4)3.5H2O prepared at 22 °C and products air-dried at 22 °C
JS780.165 M Na, 0.055 M AgAg-Na-H3O0.090.000.610.302.88Na0.09Ag0.61(H3O)0.30Fe2.88(H2O)0.36(OH)5.64(SO4)25.7602.868
JS800.055 M Na, 0.165 M AgAg-Na-H3O0.030.000.680.293.02Na0.03Ag0.68(H3O)0.29Fe3(OH)6(SO4)25.5662.773
JS720.00 M M+,2+, 0.22 M AgAg-H3O0.000.001.000.002.84Ag1.00(H3O)0.00Fe2.88(H2O)0.36(OH)5.64(SO4)25.7402.855
JPDP standards
Jarosite 22-0827 5.7202.861
Natrojarosite 30-1203 5.5702.783
Hydroniumjarosite 31-0650 5.6702.835
Argentotjarosite 5.5502.763
Table 3. Reported Raman frequencies (wavenumbers, cm−1) and mode assignments in synthetic jarosite compound end members, and in jarosite-family compounds reported in other studies. Key: 1 = [27]; 2 = [25]; 3 = [29] [Na0.53(H3O)0.47Fe1.79(OH)6(SO4)2]; 4 = [28] (natural jarosite); 5 = RRUFF project R060113; 6 = RRUFF project R070493; 7 = RRUFF project R050289; 8 = RRUFF project R050471; 9 = RRUFF project 060097; 10 = RRUFF project 060098. s = strong; w = weak; sh = shoulder; b = broad; sp = sharp. † = http://www.sci.qut.edu.au/sci_schps.html (accessed on 14 February 2016); RRUFF Project (integrated database of Raman spectra, XRD and chemistry data at the University of Arizona): http://rruff.info/jarosite/display=default/ (accessed on 14 February 2016).
ModeJS22K 1K 2K 5K 6JS32Na 1Na 2Na 3Na 7Na 8JS30Ag 2Ag 4Ag 9Ag 10H3O 1H3O 4
vOH
vOH
3417.2 3440.3 3452.0
vOH3411.7 3410.67 s3412.36 s3408.9 3401.95 s 3410.9
vOH 3399.23399 33943388.85 s 3393.7 3394.23380.52 s3384.38 s 3383.2
vOH 3368 3378.5 w 3371.6 3372.0
Unassigned3077.7 w
Unassigned 2215.73 w
Unassigned 2006.74 w2012.29 w 2005.74 w 2017.10 w
Unassigned 1688.55 w1692.17 w 1672.52 w1679.83 w 1679.62 w
v3(SO42−)
v3(SO42−)
1158.411611153.331154.361159.91 s1165.3
1159.7
11601154.24 w1152 w1153.761155.291163.9
1140.4
1160.58 w1153.61157115711631154.3
v3(SO42−)1125.2
v3(SO42−)1110.111121102.63 s1102.29 s1109.77 s1108.711141112.5911051109.41 s1105.15 s1110.11107.161104.51110.72 s1108.7910991102.9
v3(SO42−)
v3(SO42−)
1104.5
1088
v1(SO42−)1013.510151006.671009.73 s1013.351013.510141012.1010071012.98 s1010.651013.51012.1010111016.22 s1016.2210111007.3
v1(SO42−)1009.3
v1(SO42−) † 974.41 sh 972.12 975.73 w
Unassigned 840.95 b
v4(SO42−) 652 648.9 642.6
v4(SO42−)627.16625624.61 s625.96631.51625.78627624.61 sp617 sp625.36 s623.03624.4622.80 sp627.6626.67 s624.75619624.3
v4(SO42−) 621.0
v4(SO42−) 614.2
γOH 560576.63 w573.89591.01 w570.59571570.29 w559 w567.51 w563.25592.67573.91 w 576.53 w578.46 w563576.4
O-Fe 563.69 562.7
Fe-OH 562.31 558.5 554.7
O-Fe573.35 530
v2(SO42−) 476.9 465.7
v2(SO42−)456.06 453.50 450.78 sh 458.82 451.4 453.4
v2(SO42−) 442 444.54 s 445 445 sh444.09 s441.76 s 448.97 sh440.6445.40 s445.40 s 433.6
O-Fe432.6 434.49 s436.97 s 439.5 444.44 s437 s 438.12441.73 s
O-Fe 406 371.89
O-Fe363.61 357.53 w354.05 364.99365367.49 w357 w365.02 w356.90 w360.85362.96 w 368.26 w 382
O-Fe302.9 301.40300.05303.67 w309.79303 307.04305.93 sp 308.48 s310.41
O-Fe 296295298.68288295.59299.05
O-Fe228.38 223.54 s222.91 s230.39 s228.38228227.16220224.24 s219.98 s227228.07224.8229.41 s227.48 224.1
Unassigned 188.91 w
Unassigned 147.47 w 142 139.39 w140.91 142.63 w142.63 sw
Unassigned 110
Table 4. Raman frequencies (wavenumber, cm−1) and mode assignment for synthetic K-Ag-H3O jarosite compounds. Key: B-O * = B-O (or OH-O, [28]); † = similar peak and assignment reported at http://www.sci.qut.edu.au/sci_schps.html (accessed on 14 February 2016); # assigned to δ(H2O) in the mid-IR study of synthetic K-jarosite in Bishop and Murad [24]; s = strong; w = weak; sh = shoulder; b = broad; sp = sharp.
ModeJS22JS73JS55JS24JS74JS26JS75JS28JS76JS56JS57JS58JS59JS60JS30JS72JS61
Formula by chemistryK0.64
H3O0.36
K0.78
H3O0.22
K0.57
H3O0.43
K0.53
Ag0.15
H3O0.32
K0.68
Ag0.06
H3O0.26
K0.44
Ag0.25
H3O0.31
K0.64
Ag0.14
H3O0.22
K0.27
Ag0.56
H3O0.17
K0.42
Ag0.58
H3O0.00
K0.50
Ag0.16
H3O0.34
K0.47
Ag0.23
H3O0.30
K0.38
Ag0.34
H3O0.28
K0.29
Ag0.45
H3O0.26
K0.16
Ag0.68
H3O0.16
Ag1.00
H3O0.00
Ag1.00
H3O0.00
Ag0.85
H3O0.15
Temp of Formation97 °C22 °C140 °C97 °C22 °C97 °C22 °C97 °C22 °C140 °C140 °C140 °C140 °C140 °C97 °C22 °C140 °C
Temp of drying110 °C22 °C110 °C110 °C22 °C110 °C22 °C110 °C22 °C110 °C110 °C110 °C110 °C110 °C110 °C22 °C110 °C
Unassigned 3586.4 w3595.3 w3586.4 w3586.37 w 3592.4 w3584.1 w3585.2 w3586.4 w3581.8 w3585.2 2592.4 s3584.1 w
vOH 3417.3
vOH3411.73414.73412.08 3413.26 3410.013410.43411.183416.783408.5 s
vOH 3407.6 3406.19 3407.6 3403.84
vOH 3399.3
vOH 3395.2 3397.95
vOH 3384.973393.73373.433384.97
Unassigned 3123.4 3378.5
Unassigned3077.7 w3080.1 w3077.3 s3075.1 s3078.5 s3077.3 s3078.8 w 3077.6 s3079.8 w3078.5 s3078.5 s3078.5 s3078.5 s 3080.1 s3078.5 s
Unassigned 2762.5 w 2760.2
Unassigned 2578.8 w 2576.2 w2573.6 w 2577.8 w 2577.5 w2477.5 w 2576.2 w 2580.52574.9 w
Unassigned 2409.882409.55 2410.92409.55 2413.92 2412.2 s2408.212409.552410.9 2413.922408.21
Unassigned 2292.76 2294.132296.87 2295.83 2292.76 2299.93
Unassigned 2206.08 2204.692206.08 2205.022207.462206.082204.692207.462203.31 2207.792204.69
Unassigned 2167.24 2165.852167.242165.85 2167.572167.242165.852165.852165.852165.85 2167.572165.85
Unassigned 2167.572103.01 2104.422104.422103.01 2104.752103.012103.012103.012103.012103.01 2104.752104.42
Unassigned 2103.352008.52 2007.12012.772014.192015.612012.77 2011.36
Unassigned
2v3(SO42−)/2δOH # 1681.611682.74 1690.12 1690.48 1682.741679.781673.871672.391676.83 1667.95
2v3(SO42−)/2δOH 1404.72 s
HOH 1232.12
v3(SO42−)
v3(SO42−) 1162.6 1163.9
v3(SO42−)1158.41158.461154.93 1154.931159.661156.8811531158.461156.511156.511156.511156.511156.51 1156.51
v3(SO42−) 1140.4
v3(SO42−)1125.2 1123.381122.61123.381121.81121.8 1122.18 1121.81121.8 1120.22 1122.18
v3(SO42−)1110.1 1108.8 1110.1
v3(SO42−)1104.51103.181101.221106.11102.11104.391104.77 1104.771101.221102.811101.221101.221104.39 1104.771104.39
v3(SO42−) 1100.5 1082.56 1088.
v1(SO42−)1013.5 1013.6 1012.2 1013.5
v1(SO42−)1009.31007.581007.21006.71007.21008.81009.181009.51009.181007.21008.81008.81008.81010.4 1012.391012
v1(SO42−)† 972.26965.82 972.12969.04
v4(SO42−)627.16 627.3
v4(SO42−) 624.21623.81 623.81623.81624.21623.16620.85623.81623.81622.13622.13622.13624.4622.53622.13
Unassigned 592.32 592.67
B-OH573.35572.12570.04572.11573.41 572.12 570.44
B-OH 564.98 561.07 566.66564.98563.29561.6563.29562.31562.01559.92
B-OH
v2(SO42−)456.06453.27452.96 454.67451.26 452.06456.79451.26451.26 458.82
v2(SO42−)432.6432.85432.44438.26432.44432.44432.85435.5434.56430.73432.44434.16434.16437.58438.12437.99437.58
B-O 371.89
B-O363.61357.21353.34 356.8356.8 358.23360.66353.34355.07353.34356.8358.52360.85362.39360.25
B-O302.9300.05 304.28303.04301.37301.7301.79304.42301.79 301.37301.37303.11304.85307.04305.26
B-O 299.64 299.64
B-O 274.06
B-O *228.38223.27222.85227223.01224.6225.8225.02225.77226.77222.85222.85221.1222.85224.6227226.77
Unassigned 138.75138.33 140.1 140.52 138.75138.33138.33138.33138.33138.33 138.75
Table 5. Raman frequencies (wavenumber, cm−1) and mode assignment for synthetic Na-Ag-H3O jarosite compounds. Key: B-O * = B-O (or OH-O, Frost et al., 2006b); † = similar peak and assignment reported at http://www.sci.qut.edu.au/sci_schps.html (accessed on 14 February 2016); # assigned to δ(H2O) in the mid-IR study of synthetic K-jarosite in Bishop and Murad [24]; s = strong; w = weak; sh = shoulder; b = broad; sp = sharp.
ModeJS32JS49JS34JS78JS36JS38JS80JS50JS51JS52JS53JS54JS30JS72JS61
Formula by chemistryNa0.02
H3O0.98
Na0.47
H3O0.53
Na0.47
Ag0.43
H3O0.10
Na0.09
Ag0.61
H3O0.30
Na0.03
Ag0.61
H3O0.36
Na0.04
Ag0.61
H3O0.35
Na0.03
Ag0.68
H3O0.29
Na0.16
Ag0.23
H3O0.61
Na0.22
Ag0.38
H3O0.40
Na0.17
Ag0.45
H3O0.38
Na0.06
Ag0.57
H3O0.37
Na0.04
Ag0.66
H3O0.30
Ag0.63
H3O0.37
Ag0.74
H3O0.26
Ag0.76
H3O0.24
Temp of Formation97 °C140 °C97 °C22 °C97 °C97 °C22 °C140 °C140 °C140 °C140 °C140 °C97 °C22 °C140 °C
Temp of drying110 °C110 °C110 °C22 °C110 °C110 °C22 °C110 °C110 °C110 °C110 °C110 °C110 °C22 °C110 °C
Unassigned 3578.6 w3578.3 w3585.5 w 3586.6 w3585.5 w3585.5 w3584.4 w 3592.4 s3584.1 w
vOH3417.2
vOH3408.93405.3 3401.76
vOH3399.2 3396.77 3398.23
vOH 3392.053389.693393.83388.23388.79 3384.073382.893393.513393.73373.433384.97
vOH 3378.5 w
Unassigned 3078.83076.13078.83082 w3081.9 w3078.83078.8 w3078.83080.13077.63078.8 s 3080.1 s3078.5 s
Unassigned 2752.5 w 2760.2
Unassigned 2576.5 w 2581.8 w2579.2 w2583.1 w2475.2 w 2580.52574.9 w
Unassigned 2409.882410.9 2411.222412.572408.532412.57 2413.922408.21
Unassigned 2295.83 2291.72 2299.93
Unassigned 2206.41 2205.022207.792205.022206.41 2207.792204.69
Unassigned 2166.182167.24 2167.572166.182167.572167.57 2167.572165.85
Unassigned 2104.752103.012167.57 2167.57 2104.752103.352103.352103.35 2104.752104.42
Unassigned 2020.2 2103.35 2103.352015.952018.782014.532017.372013.11 2011.36
Unassigned
Unassigned 1687.521673.871680.14 1681.611687.521678.661684.571680.141666.82 1667.95
2v3(SO42−)/2δOH #
HOH 1232.12
v3(SO42−)1165.3 1163.9 1160.031163.9
v3(SO42−)1159.71158.461158.081158.461159.91154.21156.881158.461158.461158.461158.46 1156.51
v3(SO42−) 1140.4
v3(SO42−) 1123.38 1122.18 1122.18
v3(SO42−)1108.7 1107.41110.1 1110.1
v3(SO42−) 1106.351105.971106.35 1106.351106.351106.351106.351106.351104.77 1104.771104.39
v3(SO42−) 1088
v3(SO42−)1013.51012.3910121012.391012.21013.51012.391012.391012.391012.391012.391012.391013.51012.391012
v1(SO42−) † 966.61 972.12969.04
v4(SO42−)652
v4(SO42−)625.78622.53622.13622.53621.78624.4622.53622.53622.53622.53622.53622.53624.4622.53622.13
Unassigned 592.67
B-OH570.59
B-OH563.69563.69 563.69561.07567.83562.01562.01562.01560.32560.32 562.31562.01559.92
B-OH 558.23 558.17 558.63
v2(SO42−) 458.82
v2(SO42−)439.5437.99435.87439.7436.88438.12437.99437.99436.28437.99437.99437.99438.12437.99437.58
B-O 366.51366.37 371.89
B-O364.99360.66360.25362.39 359.47365.84360.66360.66362.39358.94362.39360.85362.39360.25
B-O309.79300.05303.11307304.42308.42307303.53305.26305.26305.26305.26307.04305.26304.85
B-O296
B-O *228.38225.02224.6226.77227.15228.38226.77226.77225.02225.02225.02225.02227226.77224.6
Unassigned 136.98138.33138.75 140.52136.98138.75138.75138.75138.75 138.75138.33
Disclaimer/Publisher’s Note: The statements, opinions and data contained in all publications are solely those of the individual author(s) and contributor(s) and not of MDPI and/or the editor(s). MDPI and/or the editor(s) disclaim responsibility for any injury to people or property resulting from any ideas, methods, instructions or products referred to in the content.

