Article

Influence of the Dross Formation of the Laser-Cut Edge on the Fatigue Strength of AISI 304

1
Fraunhofer Institute for Material and Beam Technology IWS, 01277 Dresden, Germany
2
Institute of Materials Science, Technische Universität Dresden, 01069 Dresden, Germany
3
Fraunhofer Institute for Nondestructive Testing IZFP, 66123 Saarbrucken, Germany
*
Author to whom correspondence should be addressed.
Metals 2023, 13(3), 624; https://doi.org/10.3390/met13030624
Submission received: 20 February 2023 / Revised: 14 March 2023 / Accepted: 17 March 2023 / Published: 20 March 2023
(This article belongs to the Special Issue Laser-Assisted Processing of Metals and Alloys)

Abstract

:
Laser cutting is a thermal cutting process based on material melting that results in characteristic features of the cut edge. The dross in particular is a crucial quality-determining feature which occurs especially when processing higher sheet thicknesses. The influence of the dross geometry on the fatigue behavior of AISI 304 was investigated in this work. Using iterative experimental design, samples with different dross geometries were produced by varying laser cutting parameters. Four characteristic dross geometries were identified and used to classify manufacturing parameters: dross-free, small droplets, large droplets and very coarse dross. Fatigue tests were performed up to 107 load cycles and revealed a dependence of the fatigue behavior on the dross geometries due to their different notch effects. It was found that the dross dominated the fatigue strength only above a certain dross height. At low dross heights, the surface relief of the cut edge dominated fatigue strength. The different cut edge properties (surface relief and dross) depend on the process parameters during laser cutting. Gas pressure and feed rate in particular showed a significant influence. The findings of this work provide information about the fatigue behavior’s dependence on dross geometry, which can be transferred to higher sheet thicknesses or complex sample geometries.

1. Introduction

Laser cutting as a thermal cutting process offers an efficient solution for the processing of sheet metal components. Compared with other cutting processes such as punching, laser cutting offers a high amount of flexibility in terms of material selection, material utilization, shaping and an easy integration into industrial processes [1,2]. The quality of the laser cut edge is typically evaluated by determining roughness, dross adhesion and heat-affected zone. In the context of laser cutting, dross refers to incompletely ejected, re-solidified material at the lower cutting edge of the workpiece. The differentiation between the dross shapes and the dross-free cutting edge is not uniformly defined [3]. Classifications from literature include dross-free, very coarse dross and droplets [4,5]. One of the reasons for this is that the edge characteristics of a component are often application-related.
The dross formation originates from the laser cutting process. When the laser beam contacts the workpiece, a cut kerf is formed, separating the material into two parts and resulting in two cut surfaces. Olsen described the fundamental mechanisms leading to the formation of the cut kerf and thereby to the appearance of three different zones during laser cutting [6,7]: the zone of energy input, the zone of bulk material and the so-called melt film, which is the interface between the solid and liquid material. The latter includes the cutting front and the direct interaction zone between the laser, gas beam and material. The melt film and cutting front are illustrated in Figure 1 and result in a fine grooved surface with dross adhered to the lower end.
Melting and resolidification lead to a finer-grained microstructure, which can be observed on the surface of the laser cut edge and therefore differs fundamentally from mechanical cut edges, where effects such as work hardening can occur because of the introduction of plastic deformation into the material [8,9]. This leads to an increase of dislocation density in the cutting area [10,11].
The laser cutting process is strongly dependent on the selected process parameters. Although there has been a lot of progress in the optimization of these parameters, challenging cutting geometries and higher sheet thicknesses and materials result in dross formation [12]. The decisive aspect here is the ratio between molten material volume, i.e., the melt film thickness and the material removal rate [13]. If the amount of molten material cannot be ejected sufficiently, dross formation is the consequence. The melt film thickness is mainly determined by laser power, feed rate and focal position. High power, low feed rate and a large spot size on top of the material lead to large melt film thickness. The material removal is dependent on the gas jet conditions inside the cut kerf. A combination of a thick melt film together with insufficient gas pressure can lead to minor melt ejection because excessively low shear stress is exerted to the melt film, which results in dross attachment [14,15,16]. Furthermore, the feed rate determines the inclination of the cutting front. If the feed rate increases, the inclination angle rises, which leads to a strongly curved and turbulent gas jet. As a result, the melt removal becomes irregular, resulting in pronounced dross formation [17,18,19].
Tani et al. related the dross formation to the temperature fields of the melt film [20]. It was argued that the temperature decreases from the cut kerf entry to the exit. Furthermore, when increasing the cutting speed, a temperature gradient from the inside of the melt film to the edges was observed. The temperatures in the edge areas were close to the re-solidification temperature of the material, which led to dross adhesion.
With regards to the dross shape, Yilbas and Schuöcker demonstrated that surface tension was an important force leading to the formation of droplets [12,21]. Whether these droplets detached from the lower cut edge was dependent on the pressure balance in the droplet [21]. If a droplet was already formed at the lower cut edge, detachment of the droplet was favored by increasing the gas pressure. This could also reduce droplet diameters. It was also found that droplets which were initially sheared off by the gas flow could not form a spherical shape, but took on a very coarse shape.
The cut edge phenomena resulting from the laser cutting process act as manufacturing-induced defects and accelerate fatigue crack initiation, which causes a reduction in the fatigue strength [22,23]. This was intensively investigated on laser-cut AISI 304. Pessoa et al. showed that dross adhesion at the laser cut edge dominated as the fatigue crack initiation site [24,25]. A comparison of laser-cut and polished specimens showed a 38% drop in the fatigue strength of the material. The crack initiation sites of the specimens with dross were located at the dross and the crack initiation sites of the polished specimens were located at inclusions near or on the specimen surface. In the investigations of Mateo et al., dross-affected samples of the metastable austenitic steel AISI 301LN showed a strength loss of 17% compared with polished samples [26]. Wanski et al. observed that applying a pre-deformation resulted in detachment of droplets [27]. The detachment behavior of the droplets was influenced by the connection of the droplets to the base material. Accordingly, weakly attached droplets detached during pre-deformation. This resulted in the material showing higher fatigue strength. The detachment effect occurred mainly in the first 20% elongation during preforming. Zeuner et al. observed that at significantly higher deformation levels, the melt adhesions partially detached, leading to the formation of notches [28]. These served as the origin of crack initiation under cyclic loading and significantly reduced the fatigue strength. After the removal of the dross, the surface relief of the laser-cut edge takes over the role of the dominant crack initiation site [26]. Deburred specimens showed a 21% strength decrease compared with polished material [24,25]. Thomas et al. argued that an irregular surface relief led to sharp valleys on the cut edge, which could lead to an increase in stress [29].
The studies cited show that the condition of the laser cutting edge has a decisive influence on the cyclic load capacity. The dross adhesion is of particular interest since the notch effect causes a significant fatigue strength decrease. However, when comparing the results of Pessoa et al. and Mateo et al. it is noticeable that the strength-reducing effect showed significant differences. No accurate characterization of the dross was performed, which makes it difficult to interpret the reason for the high differences in fatigue strength loss.
Therefore, this work investigated in more detail how different cutting parameters and accordingly different dross conditions influence the fatigue strength. It was shown that the dross geometry is the dominating crack initiation site above a critical dross height and this has so far not been addressed systematically enough. While there are studies on the influence of different cutting parameters on the cyclic loading capacity of laser cut AISI 304, the present work addressed this question from a novel angle by emphasizing the influence of the dross parameters rather than the manufacturing parameters. Dross topographies where quantified by digital light microscopy and laser-cut surfaces classified according to the degree of dross formation before determining the fatigue behavior for each dross classification. This results in a more generalized understanding of the impact that dross formation has on fatigue properties and is especially useful for complex manufacturing processes and high sheet thicknesses where not only the manufacturing parameters, but specifically the application, material and target geometry influence dross formation.

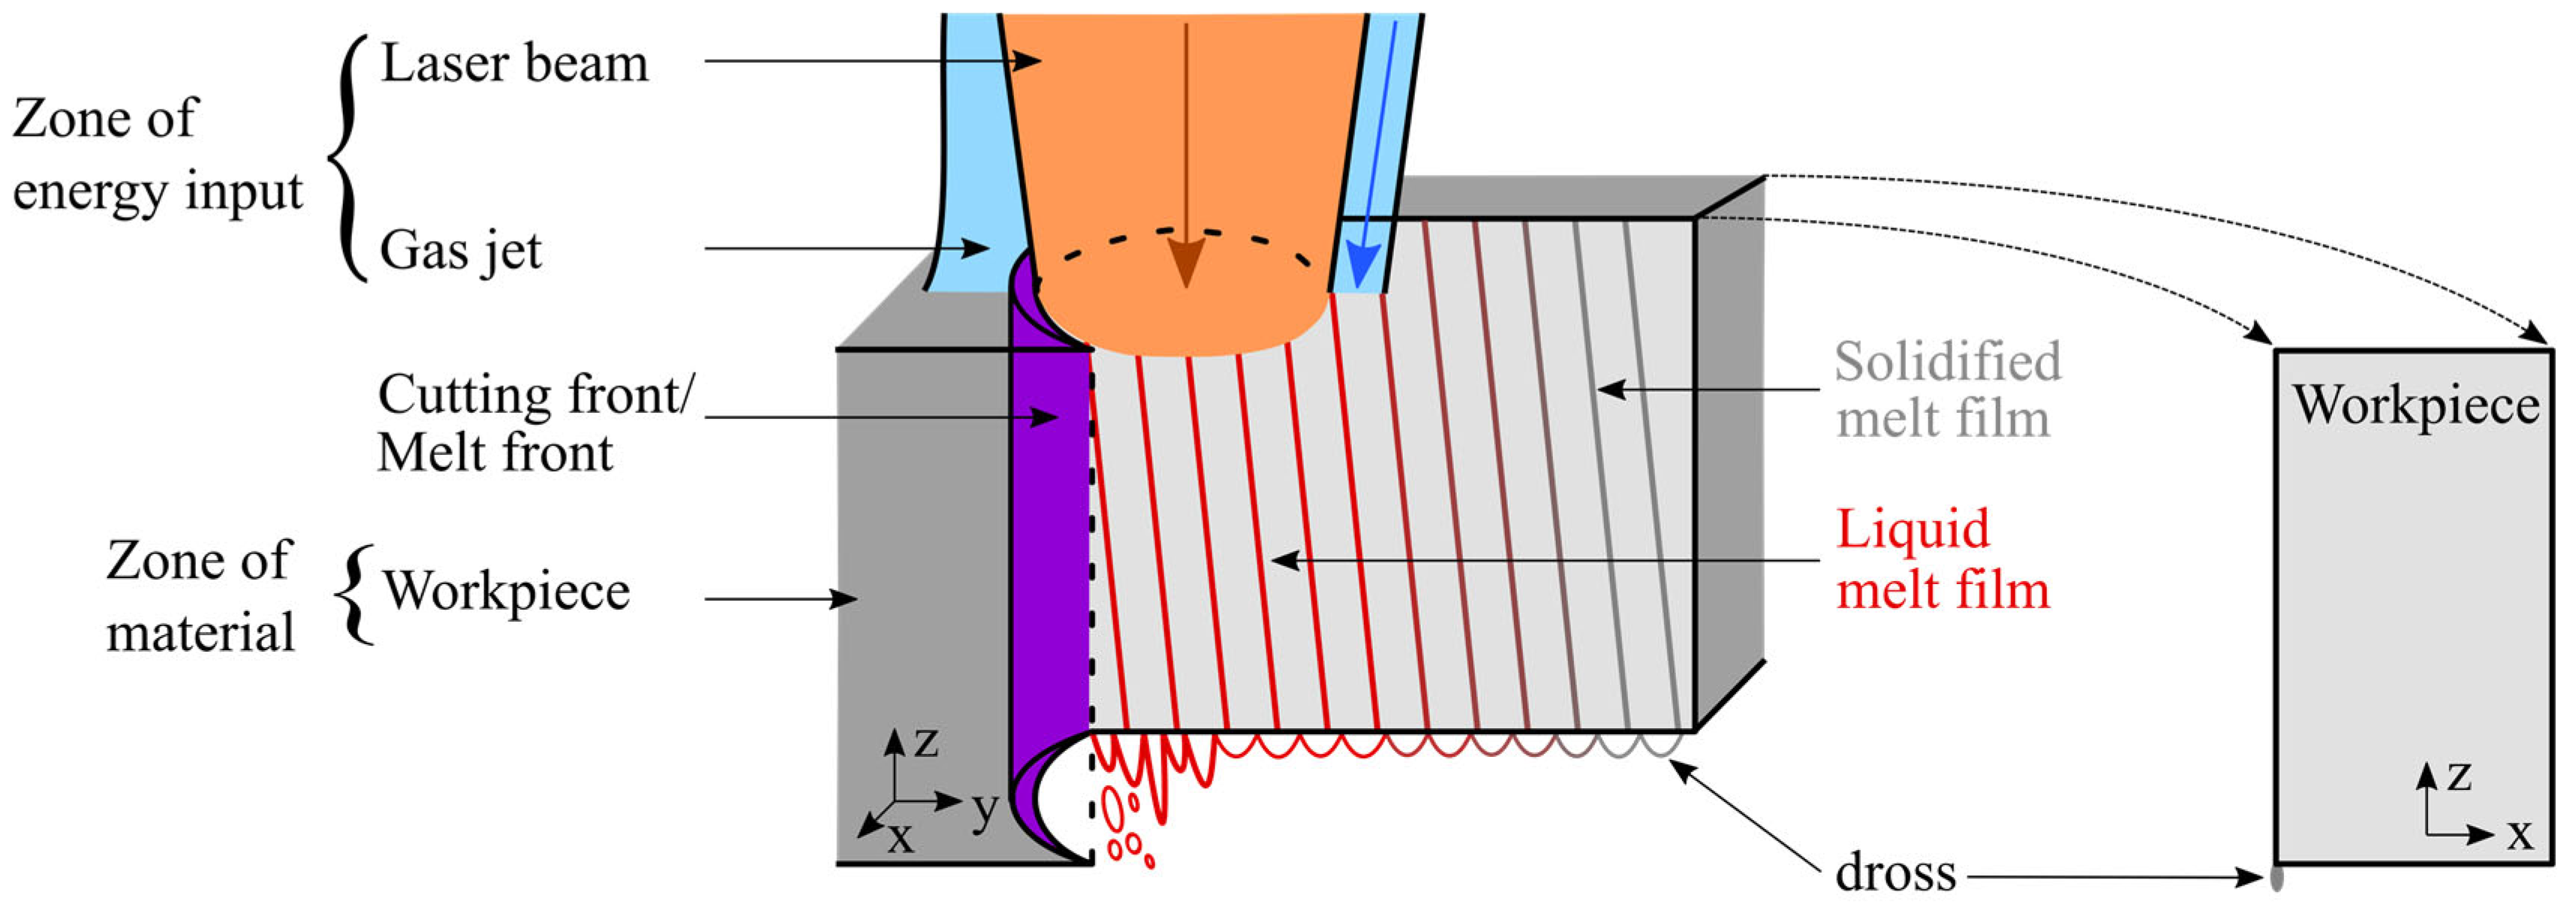
2. Materials and Methods

The experiments can be separated into two phases. The first phase focusses on the generation of different dross shapes by process parameter variation. The aim was to generate droplets, very coarse dross and dross-free laser-cut edges which were highlighted in Section 1. Based on those results, representative dross geometries for further investigations were selected in phase two to prepare samples to be used for fatigue testing.

2.1. Sample Preparation and Laser Cutting Parameters

The object of investigation was the influence of the dross shape on the fatigue strength which is relevant for high sheet thicknesses. The tests should be carried out up to 107 load cycles to investigate the transition area between high cycle fatigue and very high cycle fatigue. Therefore, to perform the tests in a time-effective manner, a resonance testing machine was used. However, the loads that would be necessary for testing high sheet thicknesses cannot be met by the testing machine. Therefore, tests were carried out exemplarily on 2 mm thick stainless steel sheets. By means of intensive parameter variation, dross shapes, as they can occur on thick sheets, were realized. In this way, the results can be transferred to higher sheet thicknesses. The chemical composition of the 2 mm thick material is shown in Table 1. All samples were taken from the same batch.
The laser cutting experiments were performed with a disk laser of the type TruDisk 5001 (Trumpf, Ditzingen, Germany). The laser beam was transmitted by an optical fiber with a diameter of 100 μm. The beam collimation was performed with a 100 mm collimation lens and a 200 mm focusing lens. The characteristics of the laser beam were determined by beam diagnostics using the FocusMonitor FM+ (PRIMES, Pfungstadt, Germany) and are listed in Table 2.
The test plan with process parameter variations for phase one is summarized in Table 3 with the aim to generate droplets, very coarse dross and dross-free laser cut edges. This classification was used for the work to define the representative dross geometries. In this work, cut edges with dross adhesions below 50 μm were considered as dross free. The tests were carried out iteratively within the defined limits of the test plan. A conical nozzle with a diameter of 1.8 mm was used. For the focal position, positive values and negative values were defined as above and within the specimen’s surface, respectively.
The manufactured laser cut edges were examined with a digital light microscope of the type VHX-5000 (Keyence, Osaka, Japan). From the numerous cut edges with different dross geometries, representative dross geometries were selected for fatigue testing in phase two.
In the following, specimens were pre-deformed to a total elongation of 28%. This was carried out to correspond to the characteristic material behavior of AISI 304, which shows a deformation induced phase transformation of face-centered cubic (fcc) γ-austenite into a body-centered cubic (bcc) α’-martensite [30] and pays tribute to the likely process history of sheet metals in application. Furthermore, because of the investigations of Wanski et al., it is known that the dross can detach because of a pre-deformation [27]. Since in the present work the influence of the dross shape on fatigue was in the focus of the investigation, any such effect had to be avoided. Therefore, prior to fatigue testing, an examination of the attachment of the dross to the base material after pre-deformation was carried out. For this purpose, three specimens were manufactured for every realized dross geometry and tensile testing was conducted. In addition to the dross shape, the requirement that the dross did not detach as a result of pre-deformation was the second selection criterion for the laser-cut parameter sets. From the numerous cut edges with different dross geometries, representatives which did not show detachment of dross in the tensile tests were selected for fatigue testing. The application of a uniform pre-deformation process ensured that all specimens were comparable, as they were manufactured from the same sheet and therefore had the same chemical composition. Light microscopic images of the laser-cut edges were taken before and after pre-deformation [31]. Furthermore, it should be noted that very strong adiabatic heating occurs in AISI 304 during the fatigue testing at high test frequencies. However, pre-deformation counteracts this adiabatic heating [32].
After the selection of the dross geometries for further investigations in phase two, a series of 15 to 25 specimens were manufactured for fatigue testing with the specimen geometry shown in Figure 2. In order to qualitatively compare the cut edges of the respective dross geometries, the average dross heights h were determined as cut edge characteristics. The dross height is the distance between the full volume of the sample and the maximum distance to the most pronounced dross adhesion at the lower cutting edge as depicted in Figure 3 over the parallel length of 15 mm and was determined using the distance-measuring tool of the light microscope.
To evaluate the effect of the dross shapes in comparison to the strength of the base material, a reference specimen series was manufactured, which was polished after cutting using different grits of sandpaper up to P2500 to remove the laser-cut edge and ensure a uniform specimen surface.

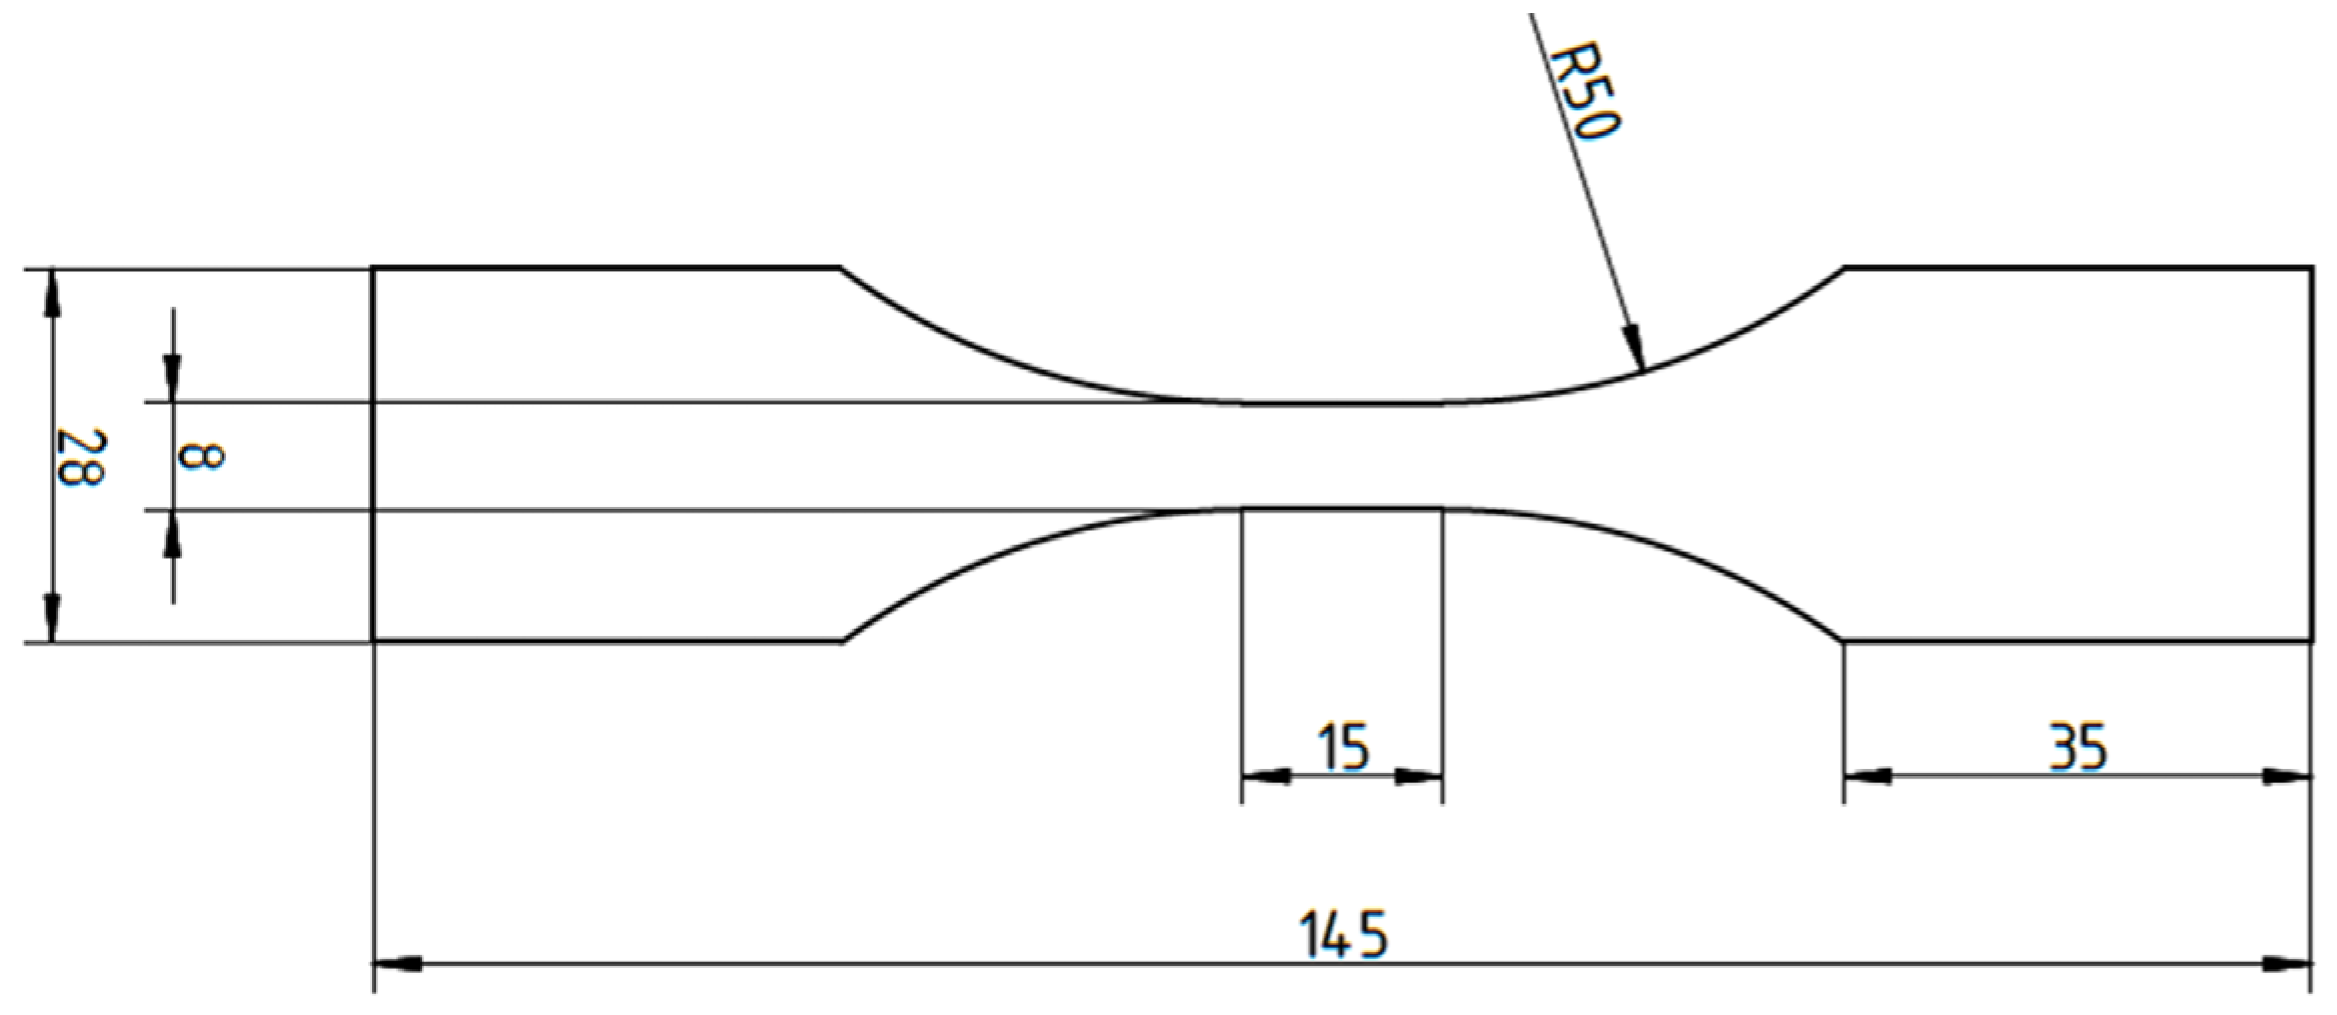
2.2. Fatigue Testing

Fatigue tests were executed according to DIN EN 50100. The experiments were carried out on the TESTRONIC resonance testing machine (Russenberger Prüfmaschinen, Neuhausen am Rheinfall, Switzerland) at a test frequency of f~80 Hz. The specimens were clamped by means of a hydraulic clamping device and cooled with compressed air to avoid pronounced heating of the specimens during fatigue testing. This was controlled by a pyrometer (Fluke Process Instruments, Berlin, Germany). The fatigue tests were carried out at a stress ratio of R = 0.1. As a failure criterion, a frequency drop of 2 Hz was chosen. After reaching at least 107 load cycles without significant frequency drop, the test was assessed as run out. The results were plotted in a S-N diagram and if two specimens at a load level reached the limit load cycle number 107, this load level was considered to be an estimate for the fatigue strength. When a run-out and a break resulted at one load level, a lower load level was tested to verify that two run-outs resulted. However, this is not a statistically validated value. Failed samples were investigated by means of fracture surface analysis using a JSM 6610LV (JEOL, Tokyo, Japan) scanning electron microscope (SEM) in order to determine the crack initiation location of the samples.

3. Results and Discussion

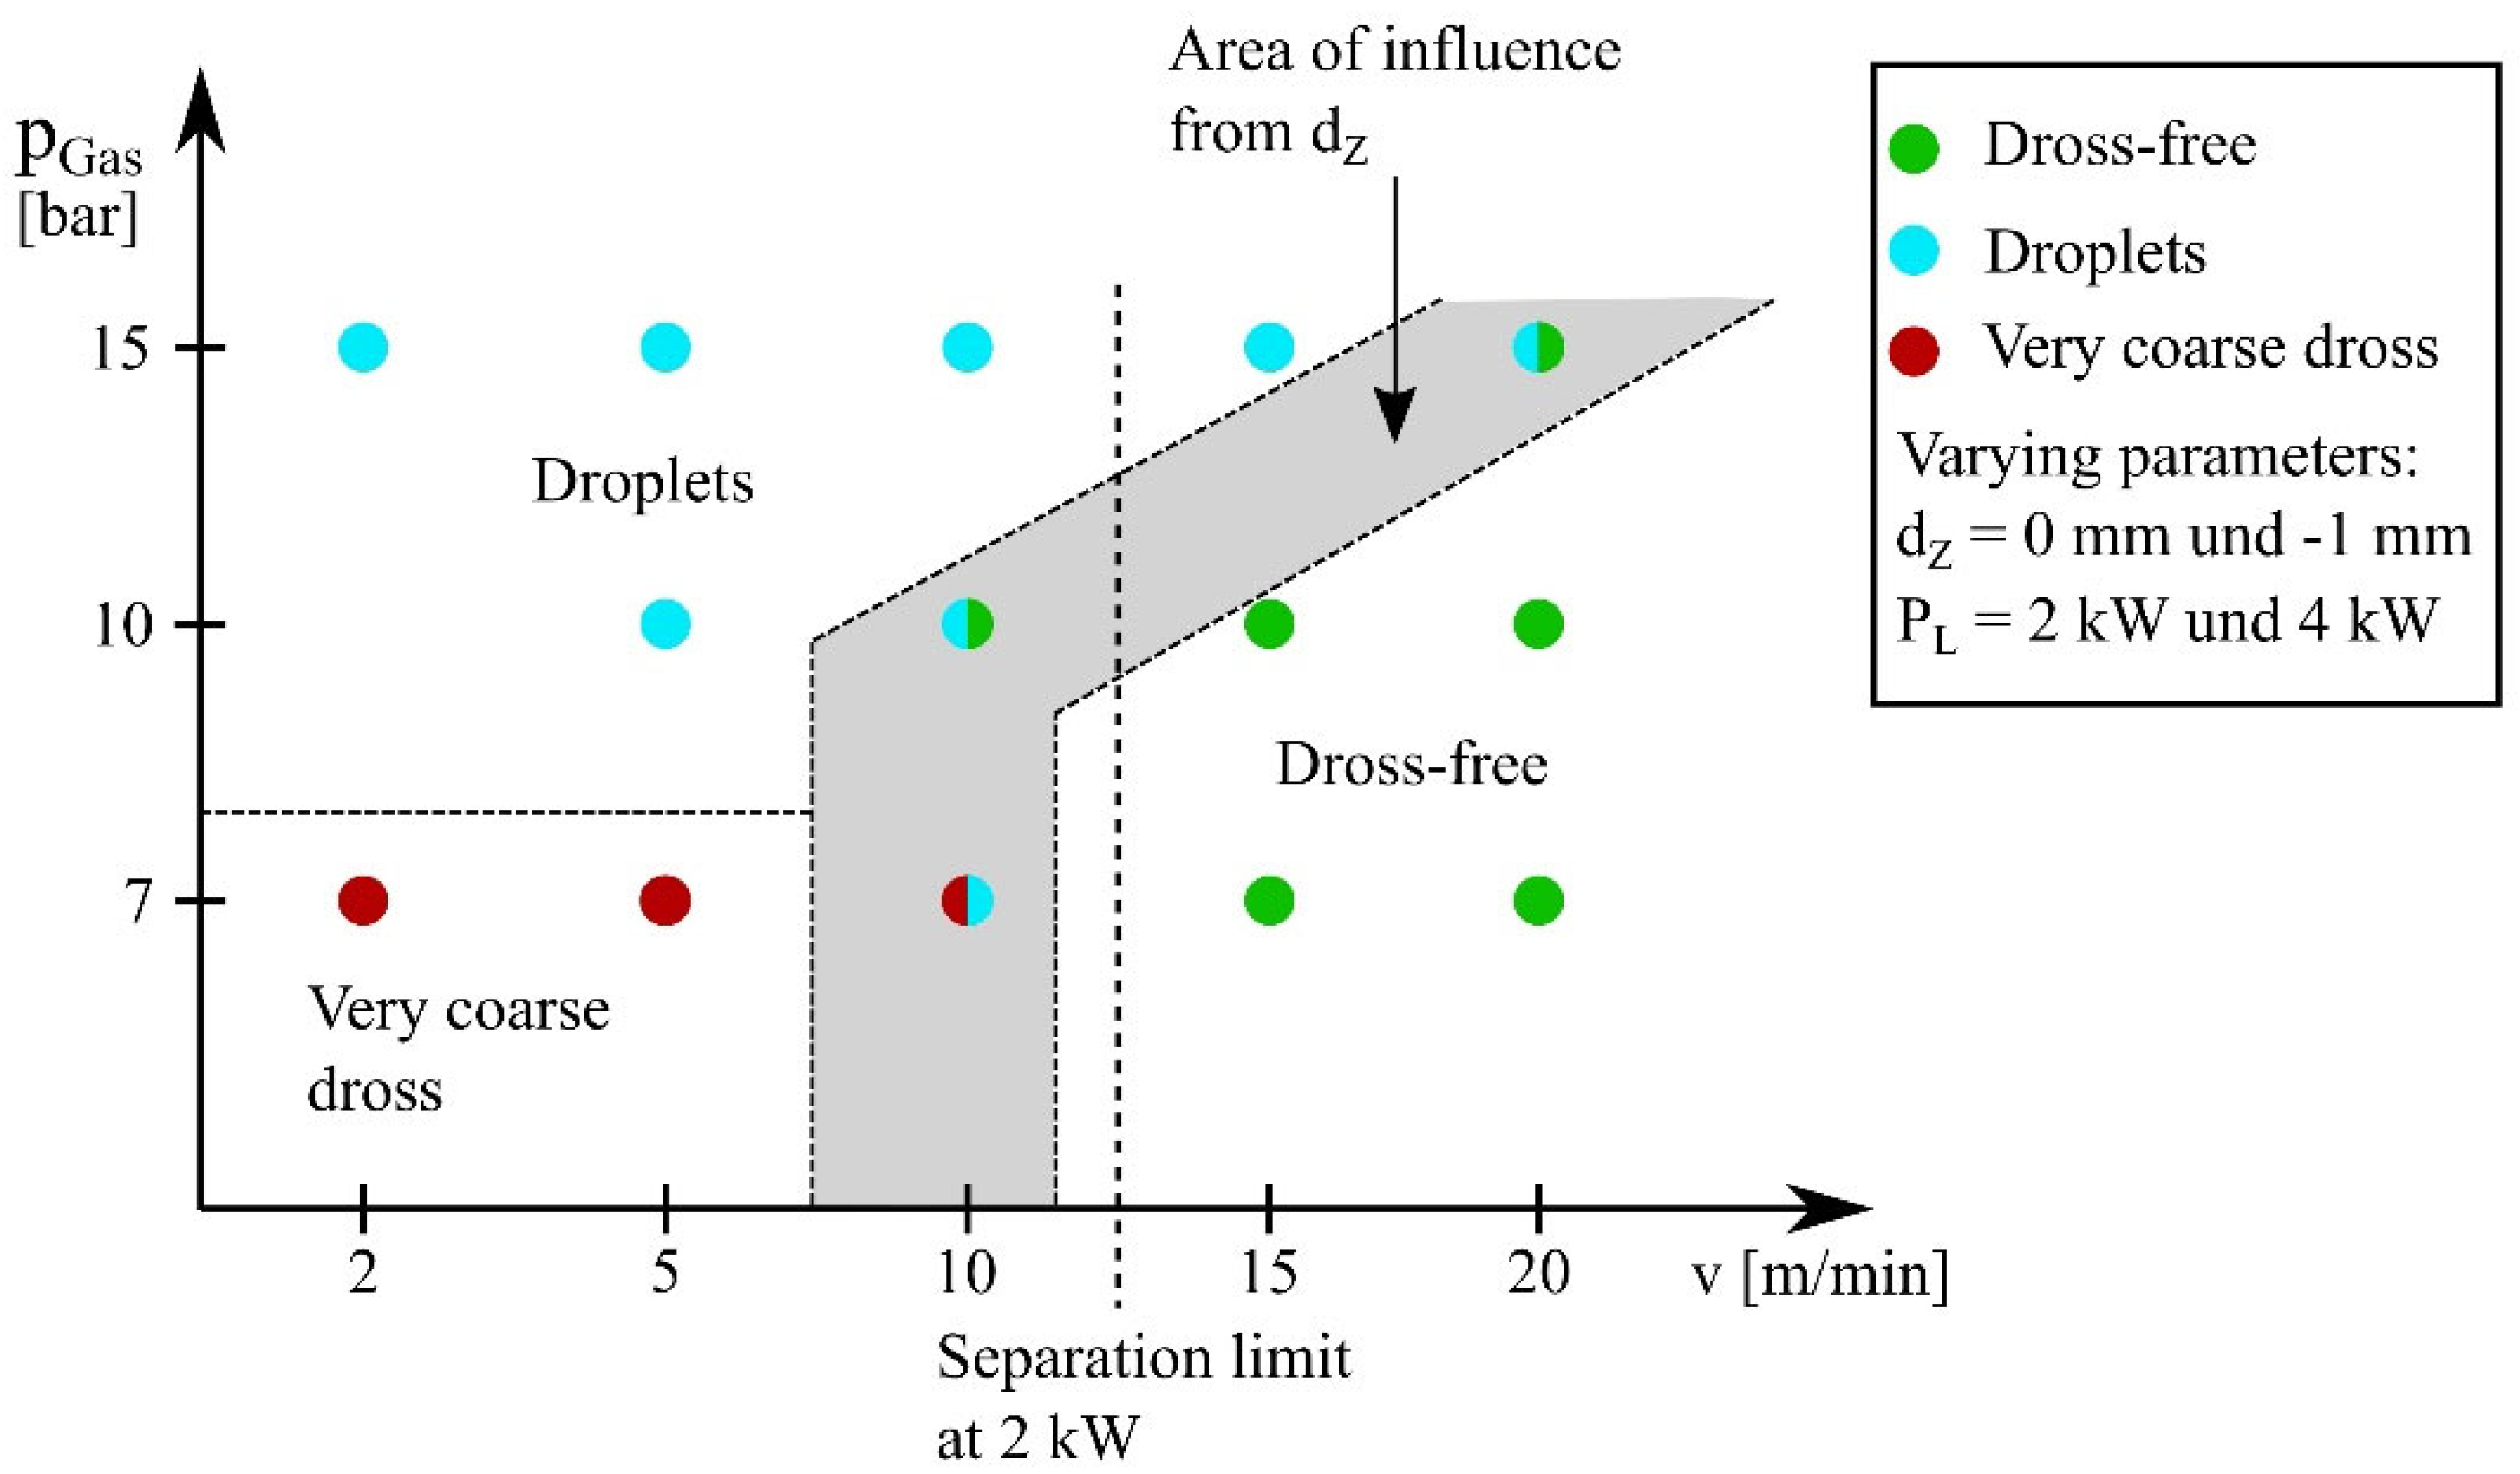
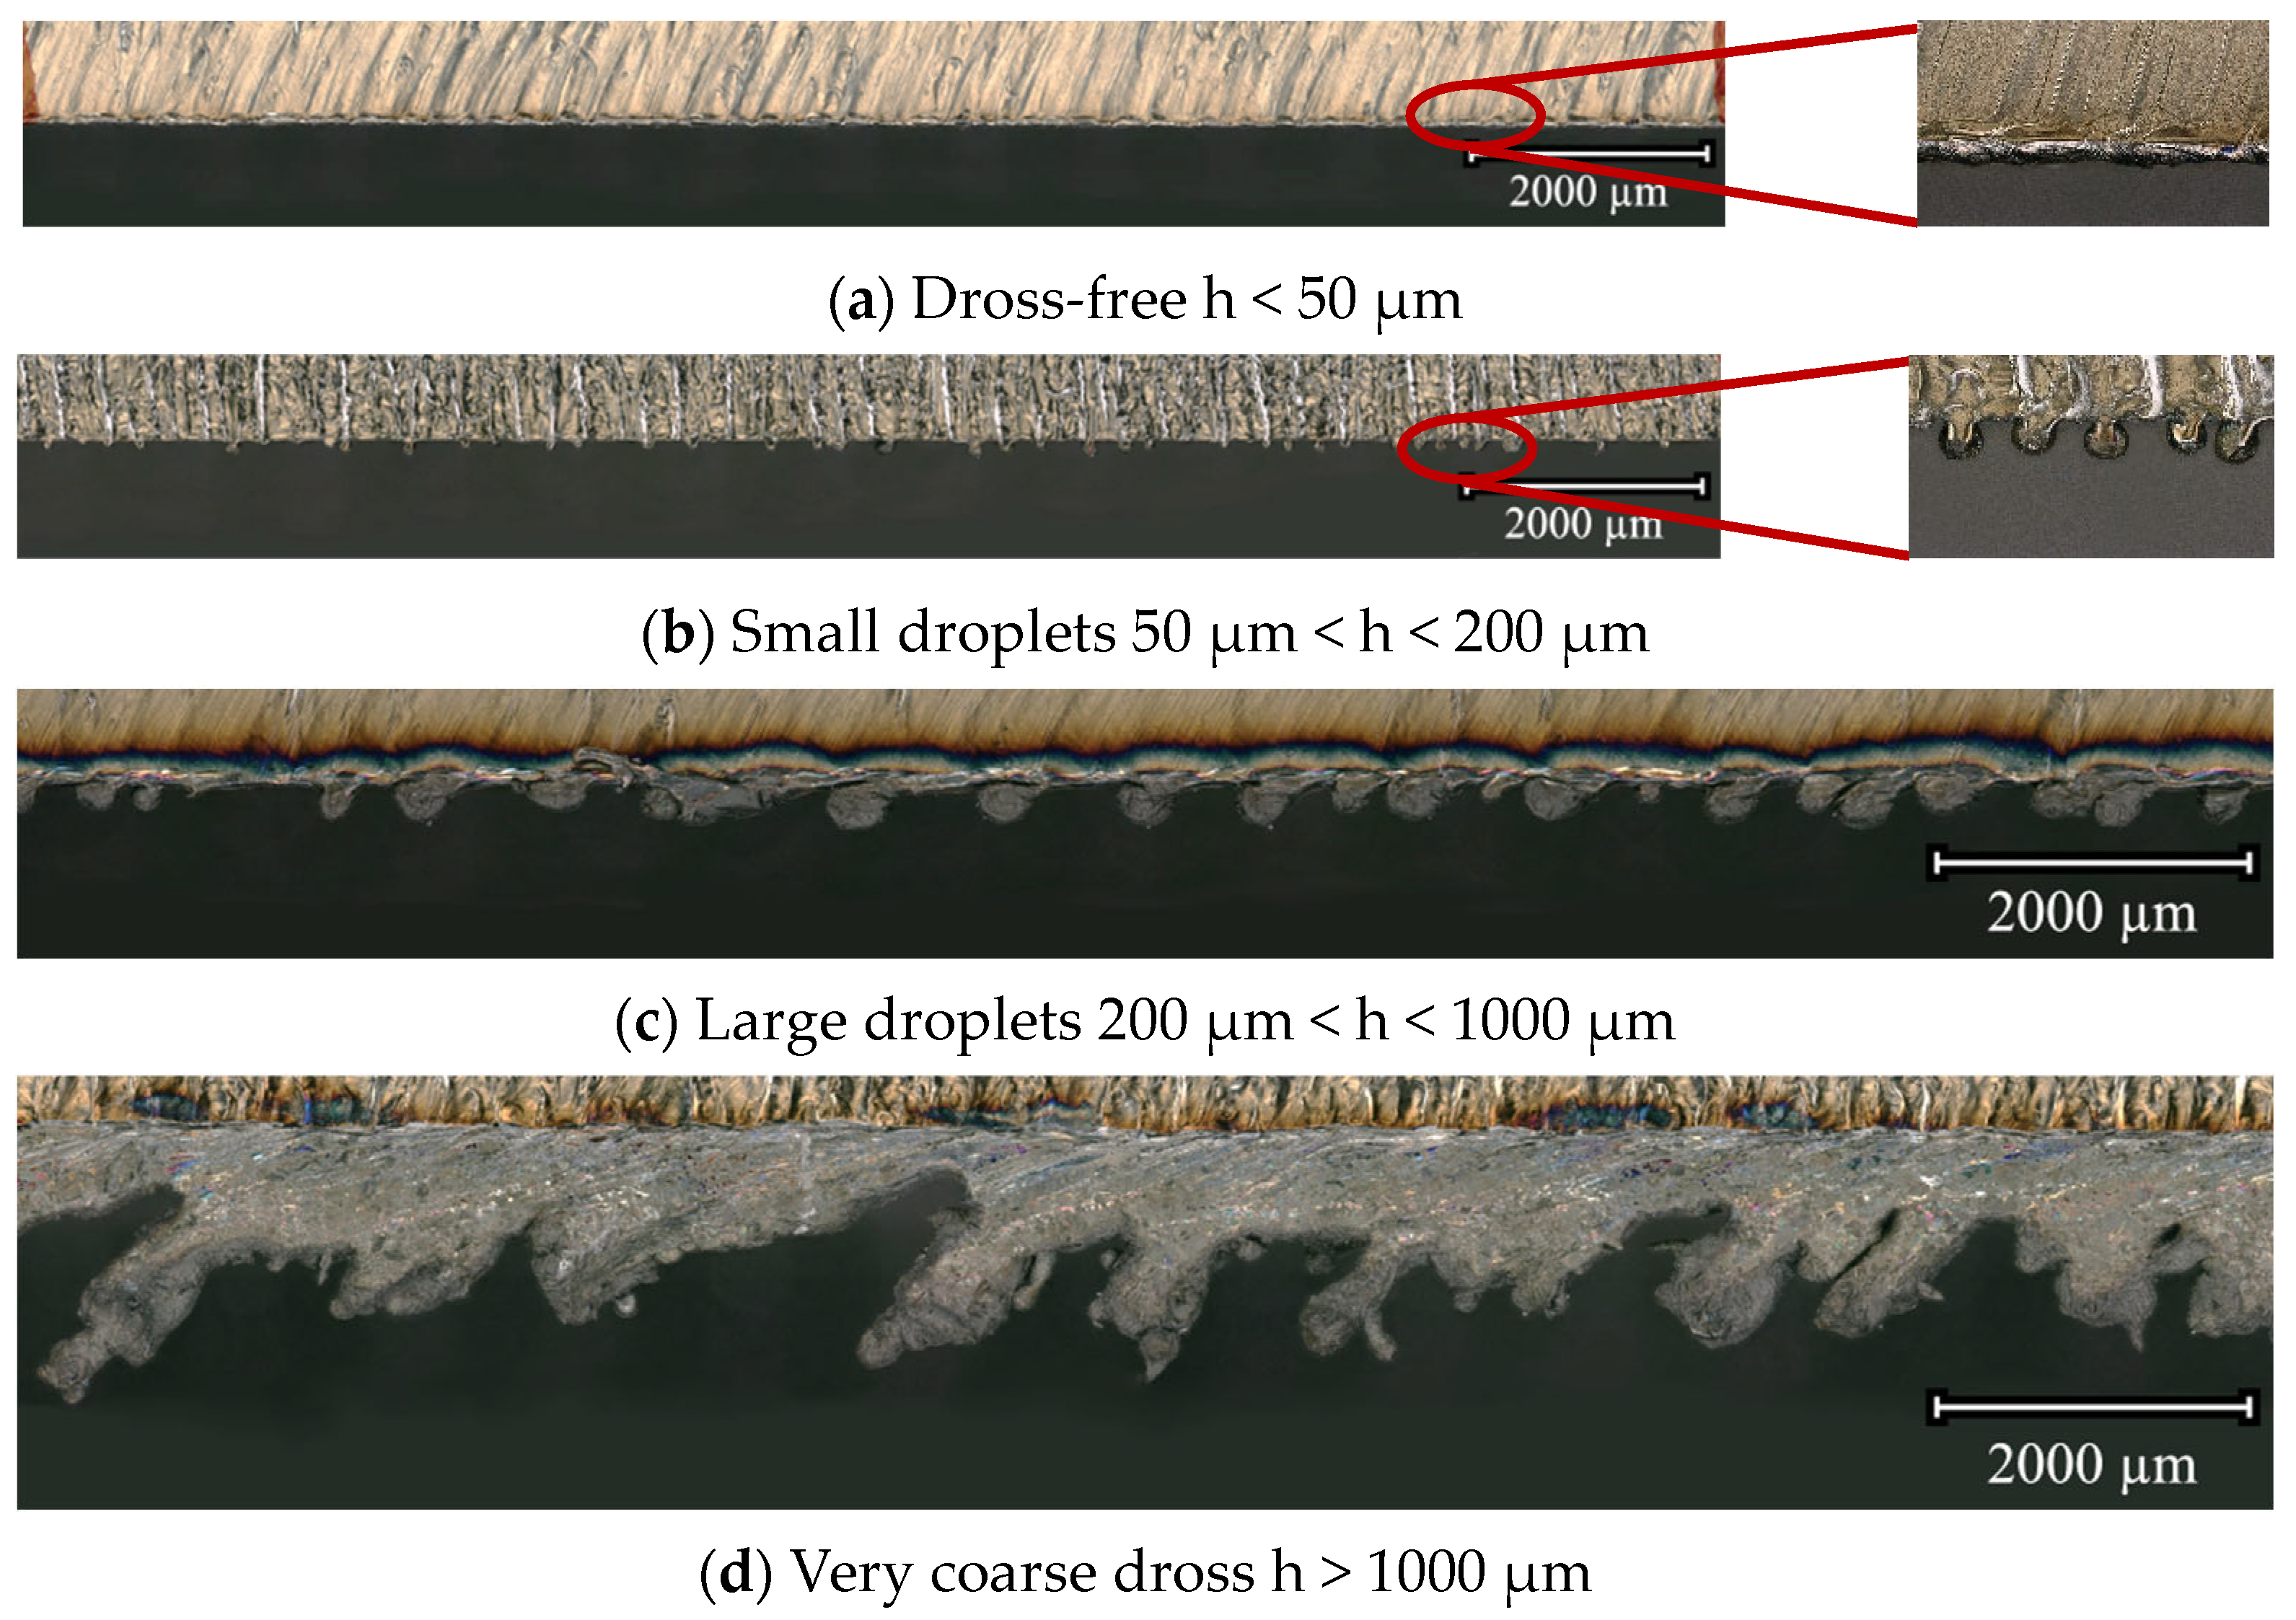
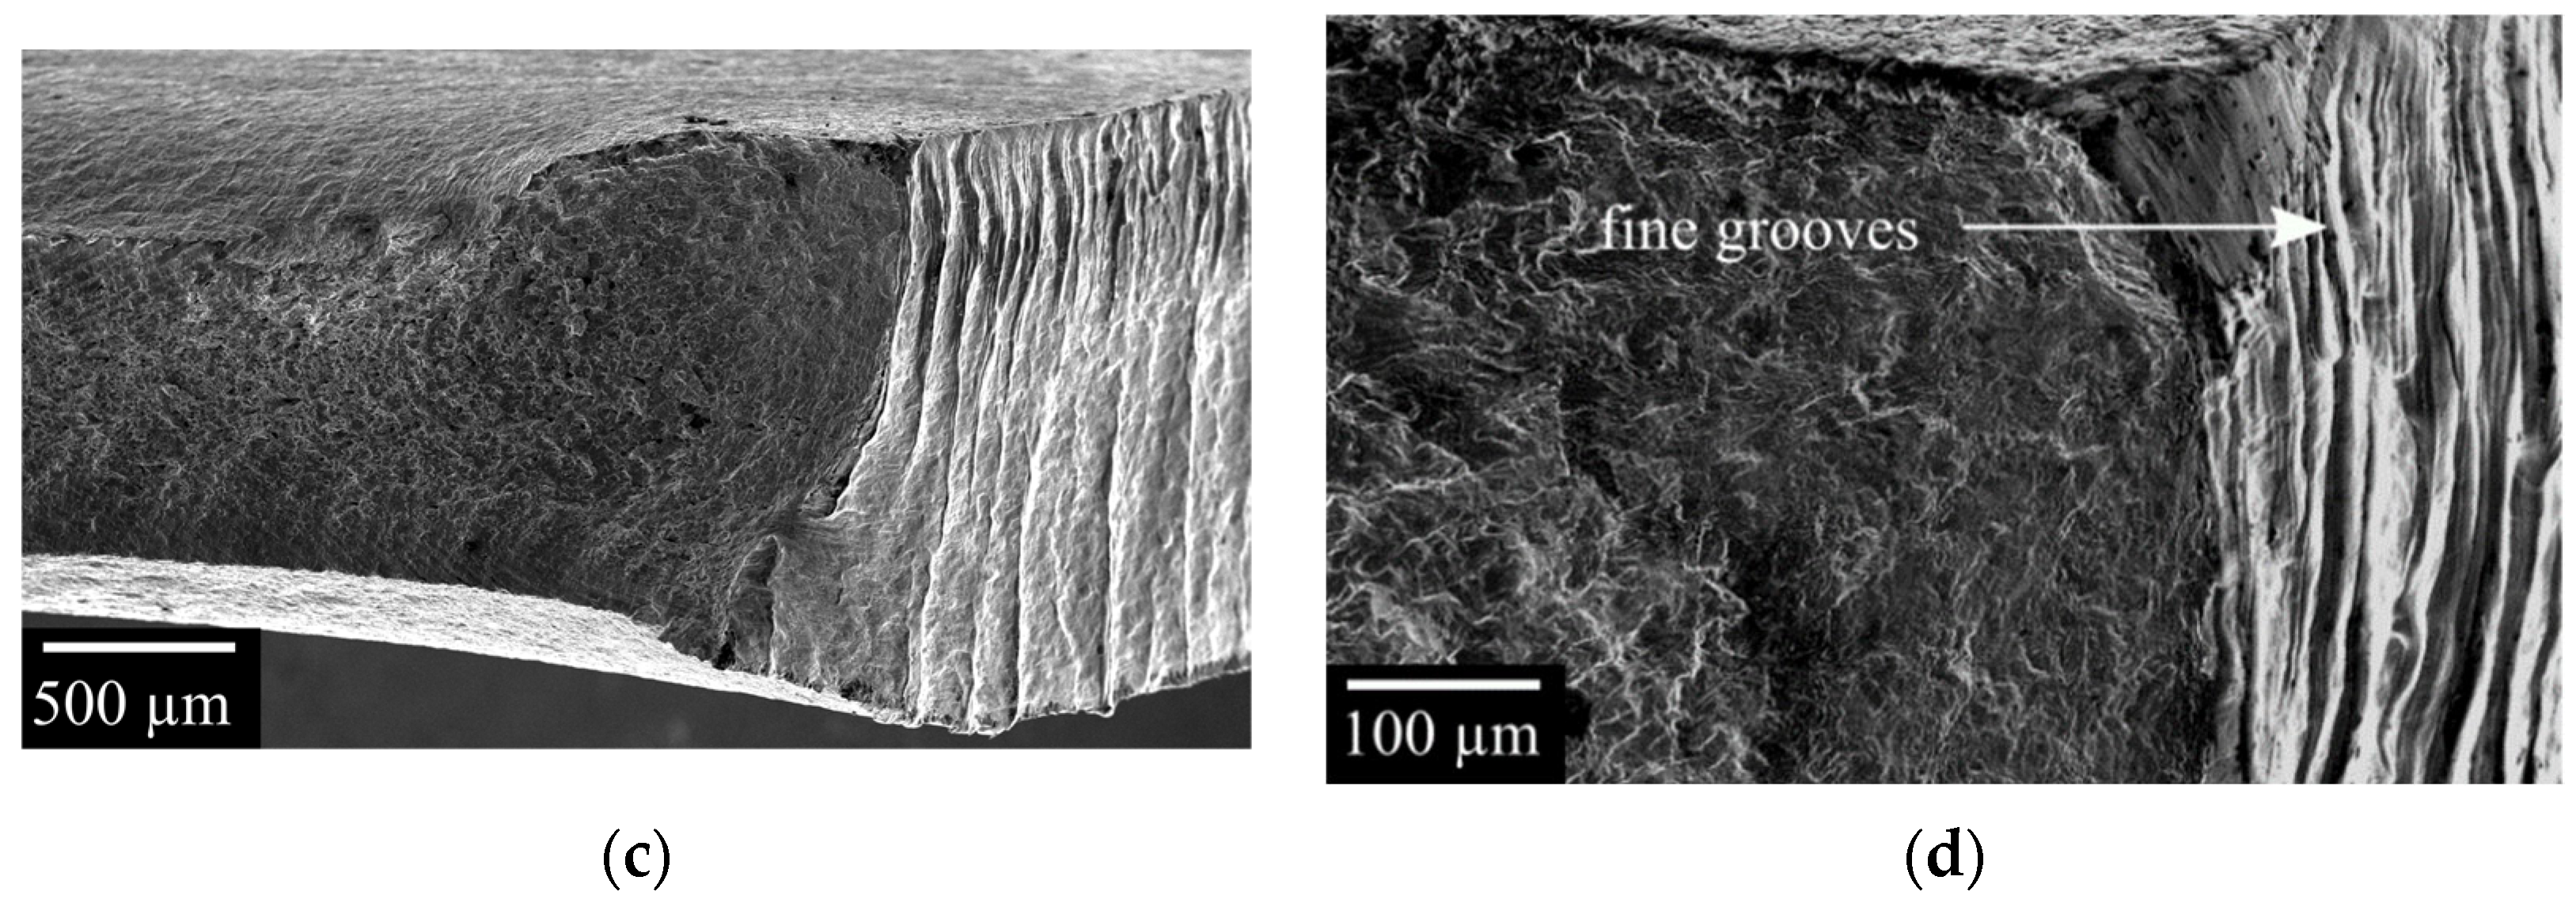
3.1. Phase One: Systematic Production of Different Dross Shapes and Influence of the Laser Cutting Parameters on Dross Geometry

In phase one, different dross shapes were successfully produced with the applied range of process parameters and divided into three classes based on the average dross height h of the left and right cutting edge:
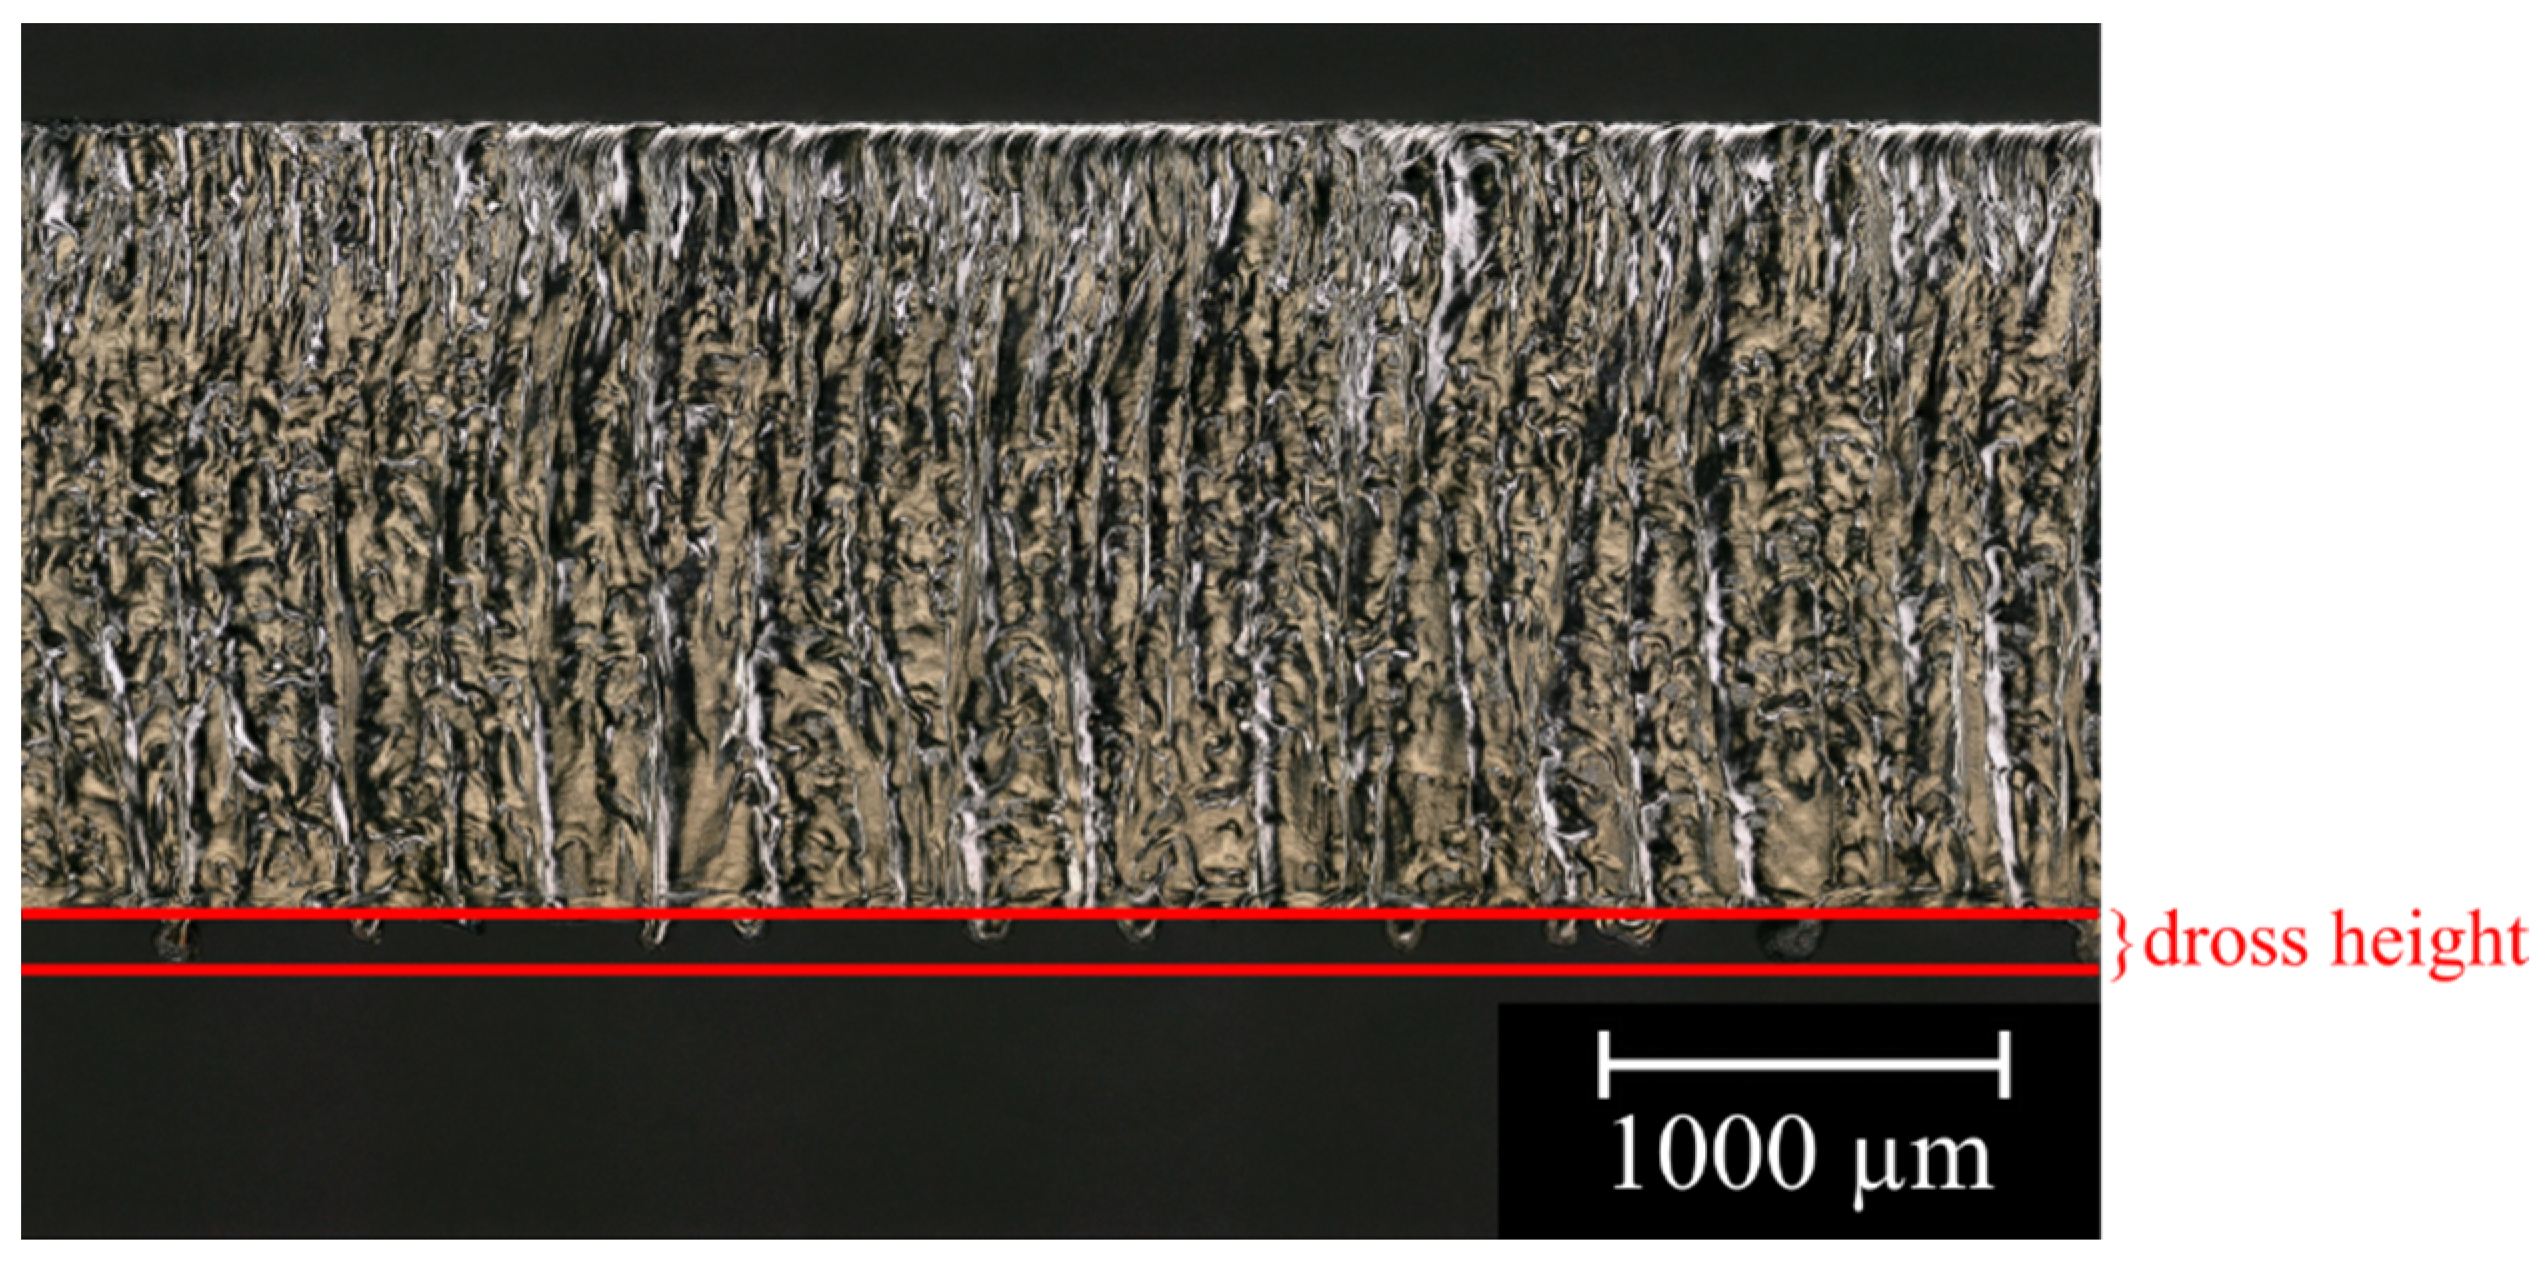
  • Dross-free h < 50 μm;
  • Droplets 50 μm < h < 1000 μm;
  • Very coarse dross h > 1000 μm.
The diagram in Figure 4 depicts the resulting dross shapes for varying process parameters. Here, a dot shows the resulting dross geometry at constant feed and gas pressure, but at varying focal positions and laser powers. It can be seen that the parameters gas pressure, feed rate, focus position and laser power had an impact on the resulting dross geometry. While feed rate and gas pressure had an impact on the dross shape across the whole tested parameter space, laser power and focus position only led to significant geometry changes in the process parameter area highlighted in gray. The dashed line on the feed axis symbolizes the separation limit at a laser power of 2 kW. This means that at feed rates above v = 10 m/min and a laser power of 2 kW, the cutting was impossible.
The following relations can be inferred from the diagram:
  • Feeds below 15 m/min led to laser-cut edges with dross;
  • In the range of feed rates below 15 m/min, decreasing gas pressures led to higher dross volume;
  • In the range of feed rates above 15 m/min, decreasing gas pressures led to lower dross volumes or dross-free cutting edges.
It could be seen that the dross volume decreased with increasing feed rate. If the feed rate remained unchanged, the gas pressure was the decisive factor as to whether drossed or dross-free cut edges were produced. The diagram shown in Figure 4 shows the transition from droplets (light blue) or a very coarse dross (red) to a cut edge defined as dross free (green). Whether droplets or very coarse dross are produced during laser cutting depends on the ratio between molten and removed material [33]. The feed rate determines the interaction time between the laser beam and the material. As the feed rate decreased, the interaction time between the laser beam and the material increased, leading to an increase in energy input. As a result, the amount of material or the melt film thickness in the cut kerf also increased. It is possible that the material ejection was too low for the amount of material and resulted in the formation of droplets or very coarse dross on the lower cut edge. Another observation in the diagram shown was that at higher feed rates from v = 15 m/min, increasing the gas pressure to pGas = 15 bar caused a transition from a dross-free cut edge to a cut edge with attached droplets. An increase in pressure at the cut kerf exit resulted in a very high pressure difference with respect to the atmospheric pressure. Duan et al. pointed out that excessively high pressure differences result in not ejecting the melt tangentially from the cutting kerf, but pushing it against the side walls [19]. This possibly prevented the droplets from detaching from the lower cutting edge, resulting in droplets being formed despite high gas pressure. In contrast, at lower feed rates below v = 10 m/min, a reduction of the gas pressure to pGas = 7 bar resulted in a higher dross volume and thus led to very coarse dross. Therefore, the material removal provided by the gas flow was too small for the amount of molten material, which led to the formation of very coarse dross. Consequently, it can be stated that the process parameters feed rate and gas pressure, especially in combination, have a decisive influence on the dross formation and geometry.
Regarding the investigated laser power of 2 kW and 4 kW, it can be stated that no significant influence on the dross shape could be observed in the tests carried out here. However, in the diagram in Figure 4, a separation limit at 2 kW is marked on the feed axis. This means that no cuts could be produced at PL = 2 kW with a feed rate above v = 10 m/min. The applied power was too low at these feed rates, so that the material could not be separated. At high feed rates, the interaction time between the laser beam and the workpiece decreases, which means that less energy is available for the melting process [34]. Thus, a laser power of 4 kW enabled a larger process window, but this had no influence on the dross shape.
The focal position showed an influence in the transition area of the dross shapes. At the point v = 10 m/min and pGas = 7 bar, droplets or dross-free cut edges were observed at a focal position of dZ = −1 mm, whereas very coarse dross was visible at a focal position of 0 mm. A focus position of dZ = 0 mm caused a higher intensity of the laser beam on the workpiece surface and caused a narrower cut kerf. It is possible that a narrow kerf resulted in inefficient gas injection. This caused a more viscous melt film and led to dross adhesion. Furthermore, significantly higher dross volumes were observed at a focus position of dZ = +2 mm compared with the focus positions dZ = −1 mm and dZ = 0 mm. A focus position above the workpiece surface causes a wider cut kerf, which increases the amount of material and thus the melt film thickness in the cut kerf [33,34]. Therefore, the material removal was too low to efficiently discharge the molten material volume, which led to larger dross volumes.

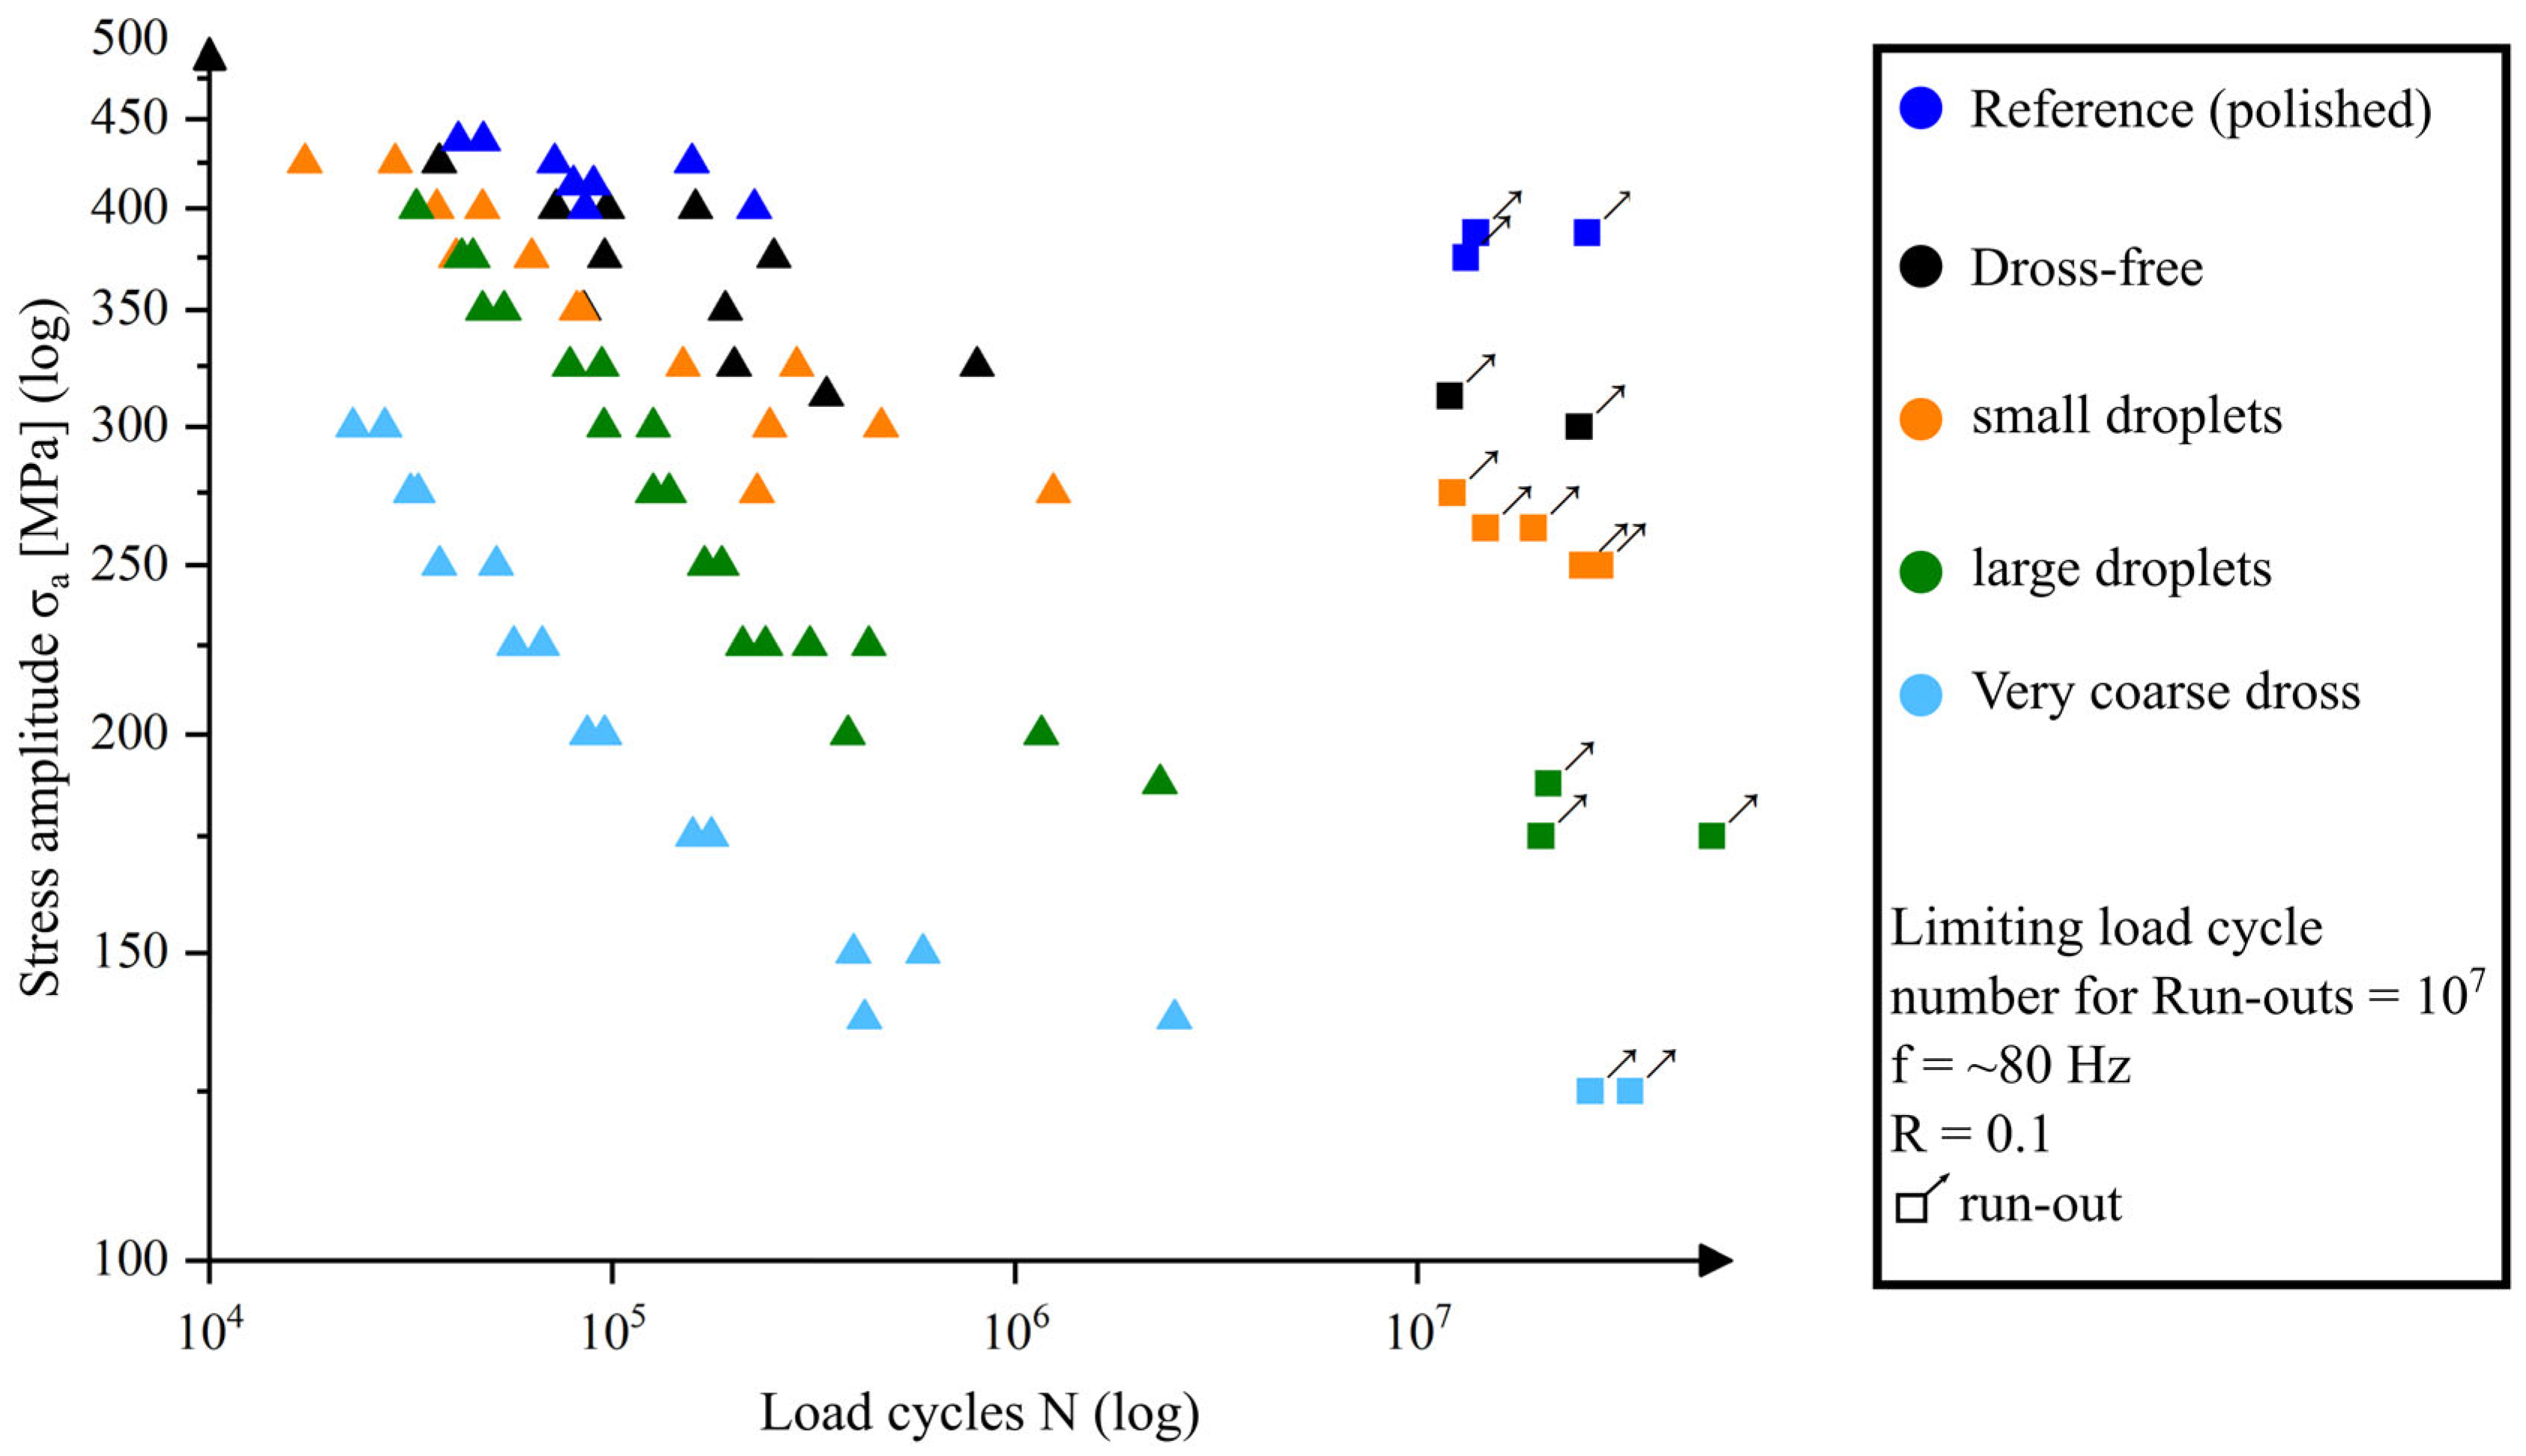
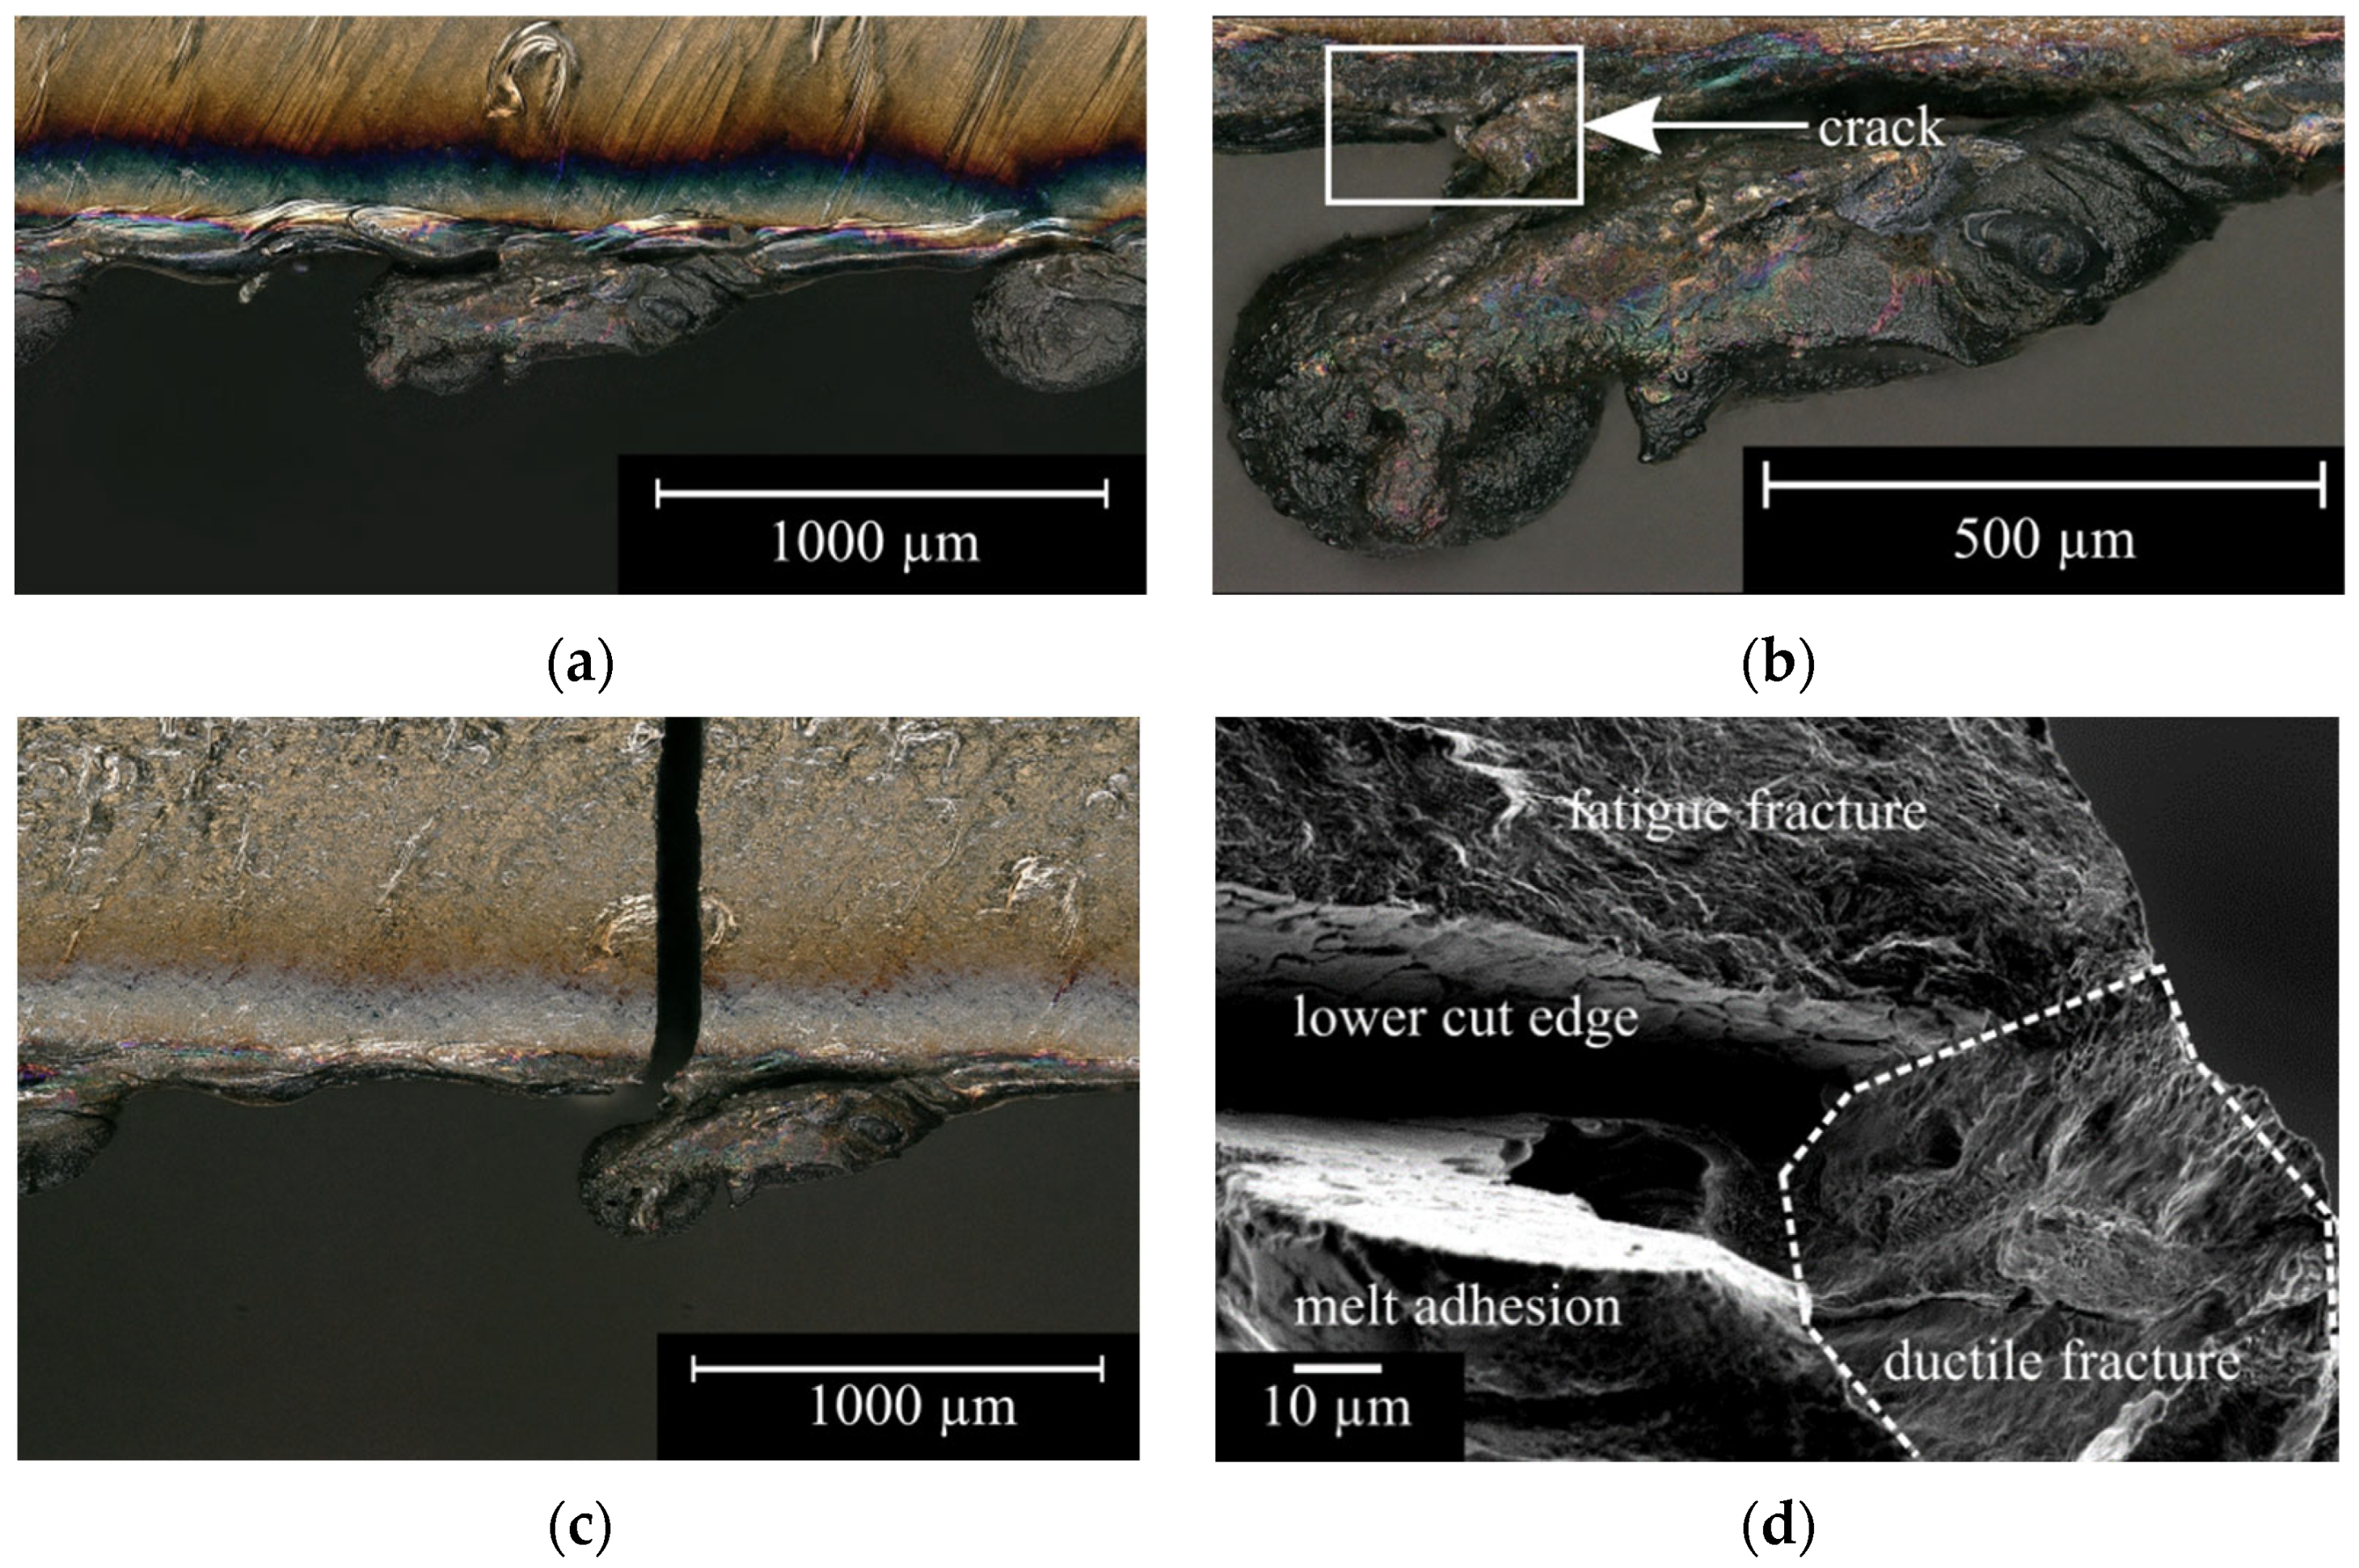
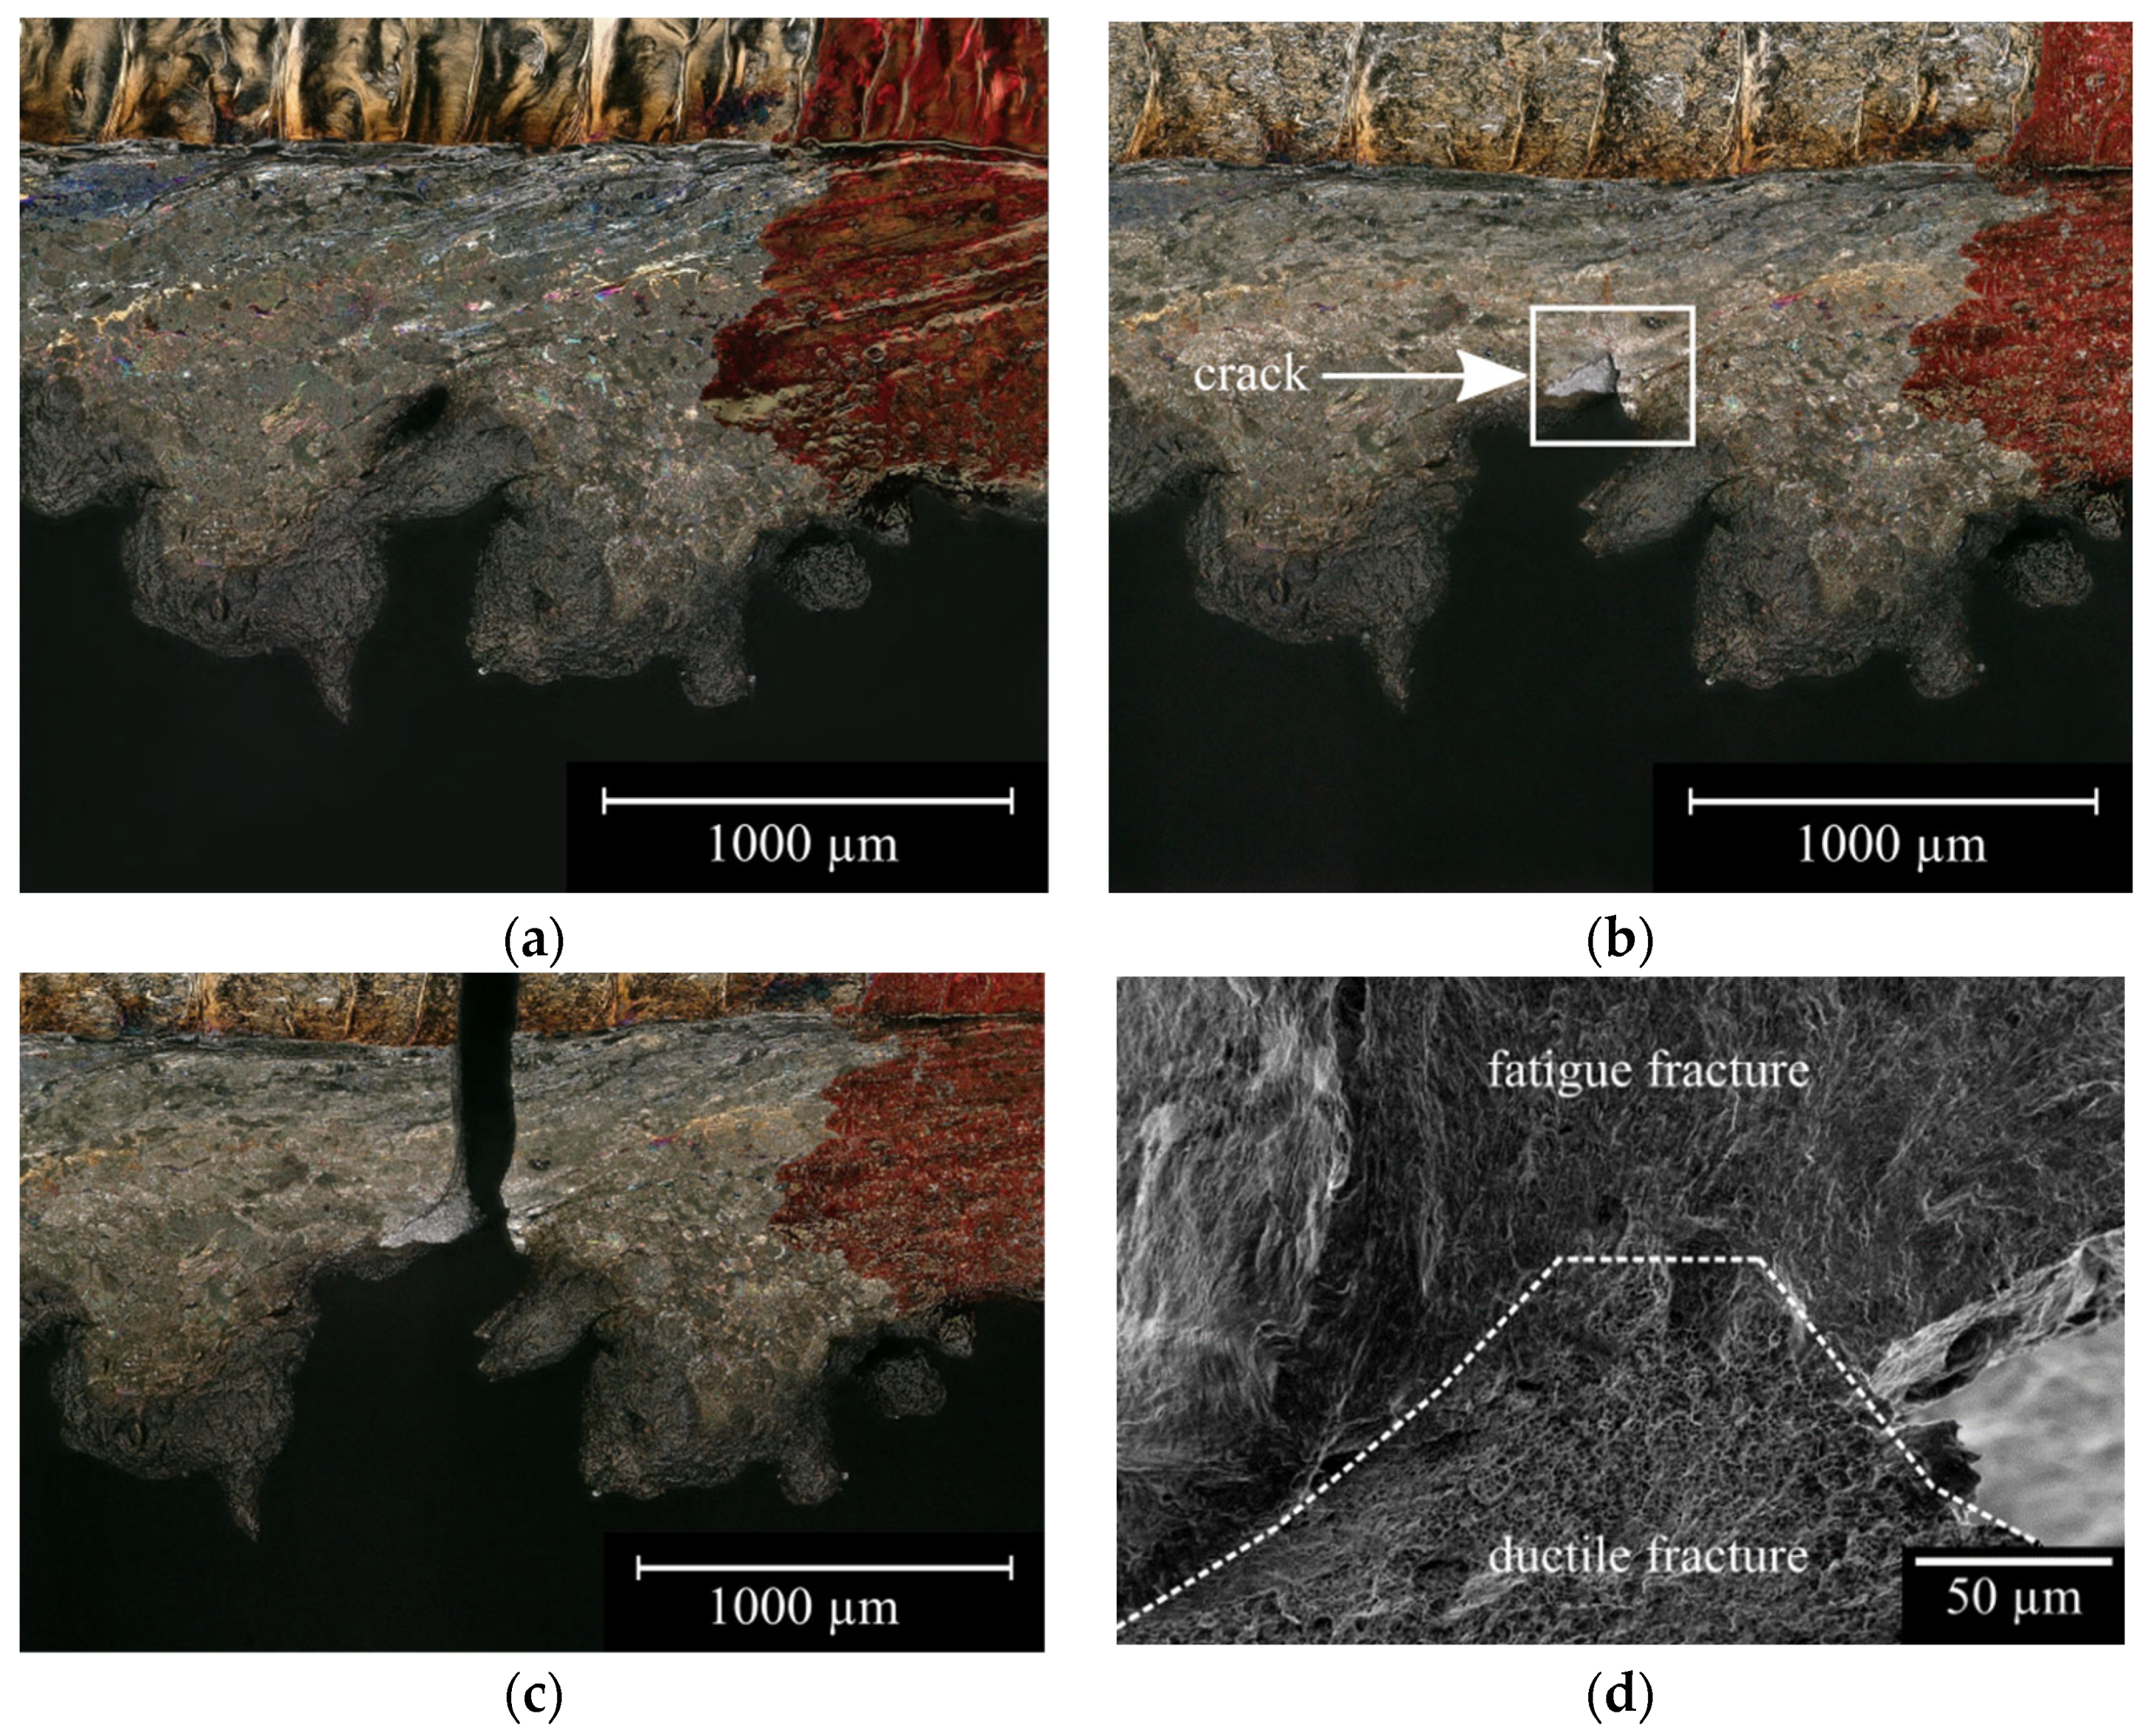
3.2. Phase Two: Fatigue Behavior of the Representative Dross Geometries

In the second phase of this work, different dross shapes were selected for fatigue testing. Since it was noticed that the diameters and the average dross height h of the droplets differed considerably, an additional subdivision of the droplets into large droplets and small droplets was made. The selected dross shapes are shown in Figure 5 and consisted of (a) dross-free, (b) small droplets, (c) large droplets and (d) very coarse dross.
Figure 6 shows the different S-N curves for the individual specimen batches classified according to their different dross geometries, where the stress amplitude σa is plotted over the number of load cycles N in a double logarithmic scale. Fractured specimens are marked with a triangle, whereas specimens that reached the number of 107 load cycles without significant frequency drop and were hence considered as run-outs are indicated by a square with an arrow in the diagram. It can clearly be seen that there were differences between the investigated laser-cut edge conditions regarding fatigue strength. The polished reference specimen batch showed the highest fatigue strength of 387.5 MPa. The dross-free specimen showed about 23% reduction in fatigue strength compared with the reference. The small and large droplets led to a further reduction of the fatigue strength by 32% and 55% compared with the reference, respectively. The specimens with very coarse dross had the lowest fatigue strength at about 125 MPa with a strength loss of 68%. The fatigue strength of all specimens and its reduction compared with the polished reference batch are summarized in Table 4.
Furthermore, it was noticed that the specimen sets with large droplets and very coarse dross showed a low scatter and steeper slope of the curve at the individual load levels, whereas the specimen sets with small droplets as well as the dross-free and reference specimen sets showed a higher scatter and lower slope of the curve.
In the following, the results of the fracture surface analysis of representative dross shapes is presented. In case of the dross-free specimen set, the crack initiation sites were at melt adhesions centered on the laser-cut edge as shown in Figure 7. Figure 7a shows a specimen after cutting (before pre-deformation), where melt adhesions can be seen on the laser-cut surface of the specimen. After pre-deforming (Figure 7b) the melt adhesions were still clearly visible after the strong plastic deformation of the specimen. These melt adhesions were crack initiation sites as proven in the SEM images in Figure 7c,d.
The fatigue crack initiation site at the laser-cut surface edge of the specimens with small droplets started at different locations. Few specimens failed at the lower cut edge. However, the majority of the specimens failed in an area consisting of fine grooves towards the laser beam entrance edge, as is shown in Figure 8. Here, Figure 8a shows a specimen before pre-deformation and after cutting. A distinct groove pattern is visible on the cut edge. Figure 8b depicts the same specimen after pre-deformation and despite strong plastic deformation of the cut edge, the distinct groove pattern is still clearly visible. There was an area of very fine grooves in the direction of the laser beam entrance edge, which was the crack initiation site. This is shown in the SEM images in Figure 8c as an overview and in Figure 8d with a higher magnification.
The specimens with large droplets failed exclusively at the dross. Figure 9 shows an example of the fracture of a specimen with large droplets in different states. Here, Figure 9a,b show the crack initiation site before pre-deformation and after pre-deformation, respectively. In Figure 9b a pre-deformation-induced crack is depicted. The specimen failed at this crack, as is shown in Figure 9c. The SEM image of the fracture surface is shown in Figure 9d. The fracture surface of the specimen shows a ductile fracture area, which was induced due to the pre-deformation, as well as a low-deformation fatigue fracture, which extends from the ductile fracture region.
The specimen set with very coarse dross showed similar fatigue behavior as the specimen set with large droplets. In this batch, pre-deformation induced cracking also led to specimen failure, which is shown in Figure 10. Here, Figure 10a shows the area where later on the crack initiation was situated before pre-deformation while Figure 10b depicts the crack initiation after pre-deformation. The pre-deformation-induced crack seen in Figure 10b acted as the crack initiation site during fatigue loading of the specimens, see Figure 10c. This can be verified again in the SEM image as depicted in Figure 10d, where the pre-deformation-induced ductile fracture region can clearly be separated from the fatigue fracture region.
In summary, the experiments performed showed that the different dross shapes or dross volumes had a prominent influence on the fatigue behavior. In particular, higher dross volumes (large droplets and very coarse dross) were observed to show significantly lower fatigue strength than the specimens with small dross volumes (small droplets and dross free). The lower fatigue strength of the specimens with high dross volumes was caused by pre-deformation-induced cracks in the dross layer. These served as initial cracks from which fatigue cracks could propagate into the material under cyclic loading. Accordingly, the crack initiation process was completely skipped and the fatigue strength was dominated by the crack growth stage. For smaller dross volumes below 200 μm, no pre-deformation induced cracks were observed in this work. However, this does not mean that the pre-deformation did not cause material damage to these specimens.
It was observed that, because of lower dross volumes, in several cases, other cut edge features, i.e., the surface relief acted as crack initiation sites. This means that there is competition between the different cut edge features for the most critical notch effect, which is related to the dross height and shape. Furthermore, the laser cutting experiments of phase one showed that the formation of the dross shape and dross height depends on the process parameters of laser cutting. The dross formation was caused by the inefficient ratio between molten and removed material. In this work, this was mainly influenced by the parameters gas pressure and feed rate. However, it cannot be completely rejected that other process parameters have an influence on the dross shape. Since the dross shape and dross volume had an influence on the fatigue strength, it can be said that the fatigue strength also depends on the process parameters of laser cutting and, further, that the fatigue strength is influenced by the material melting and ejection behavior during the cutting process. While no direct correlation between process parameters and fatigue strength were established in this paper, the distinguishing features of the irregular surface condition of the laser cut edge were identified and can therefore be regarded as quality criteria for laser-cut sheet metal structures subjected to cyclic loading. In particular, the identified significance of the different types of dross adhesions to the fatigue strength, ranging from 32 to 68% of strength losses, illustrates the potential of a process adaption with regard to the structural reliability. These results place earlier work such as that of Mateo et al. or Pessoa et al. in context and explain why studies on fatigue behavior of comparable processes and materials have resulted in significantly different fatigue strengths. The fatigue properties depend primarily on the dominant detrimental crack-inducing defect and the laser cutting process is strongly dependent on a large number of influencing variables that contribute to the formation of these defects. Accordingly, it is crucial to consider not only the parameters themselves but the resulting cut edge features and not just to refer to a so called “as-cut” condition.

4. Conclusions

Specimens of AISI 304 with different dross geometries were produced by laser cutting and pre-deformed and fatigue tested. The objectives of the work were to highlight different dross geometries from the laser cutting process and to investigate the influence of the dross geometries on fatigue strength. The investigations led to the following findings:
  • Different dross geometries could be systematically realized and categorized by process parameter variation;
  • The different dross geometries showed significantly different fatigue behavior;
  • Dross geometries with low dross volumes showed higher fatigue strength than dross geometries with higher dross volumes;
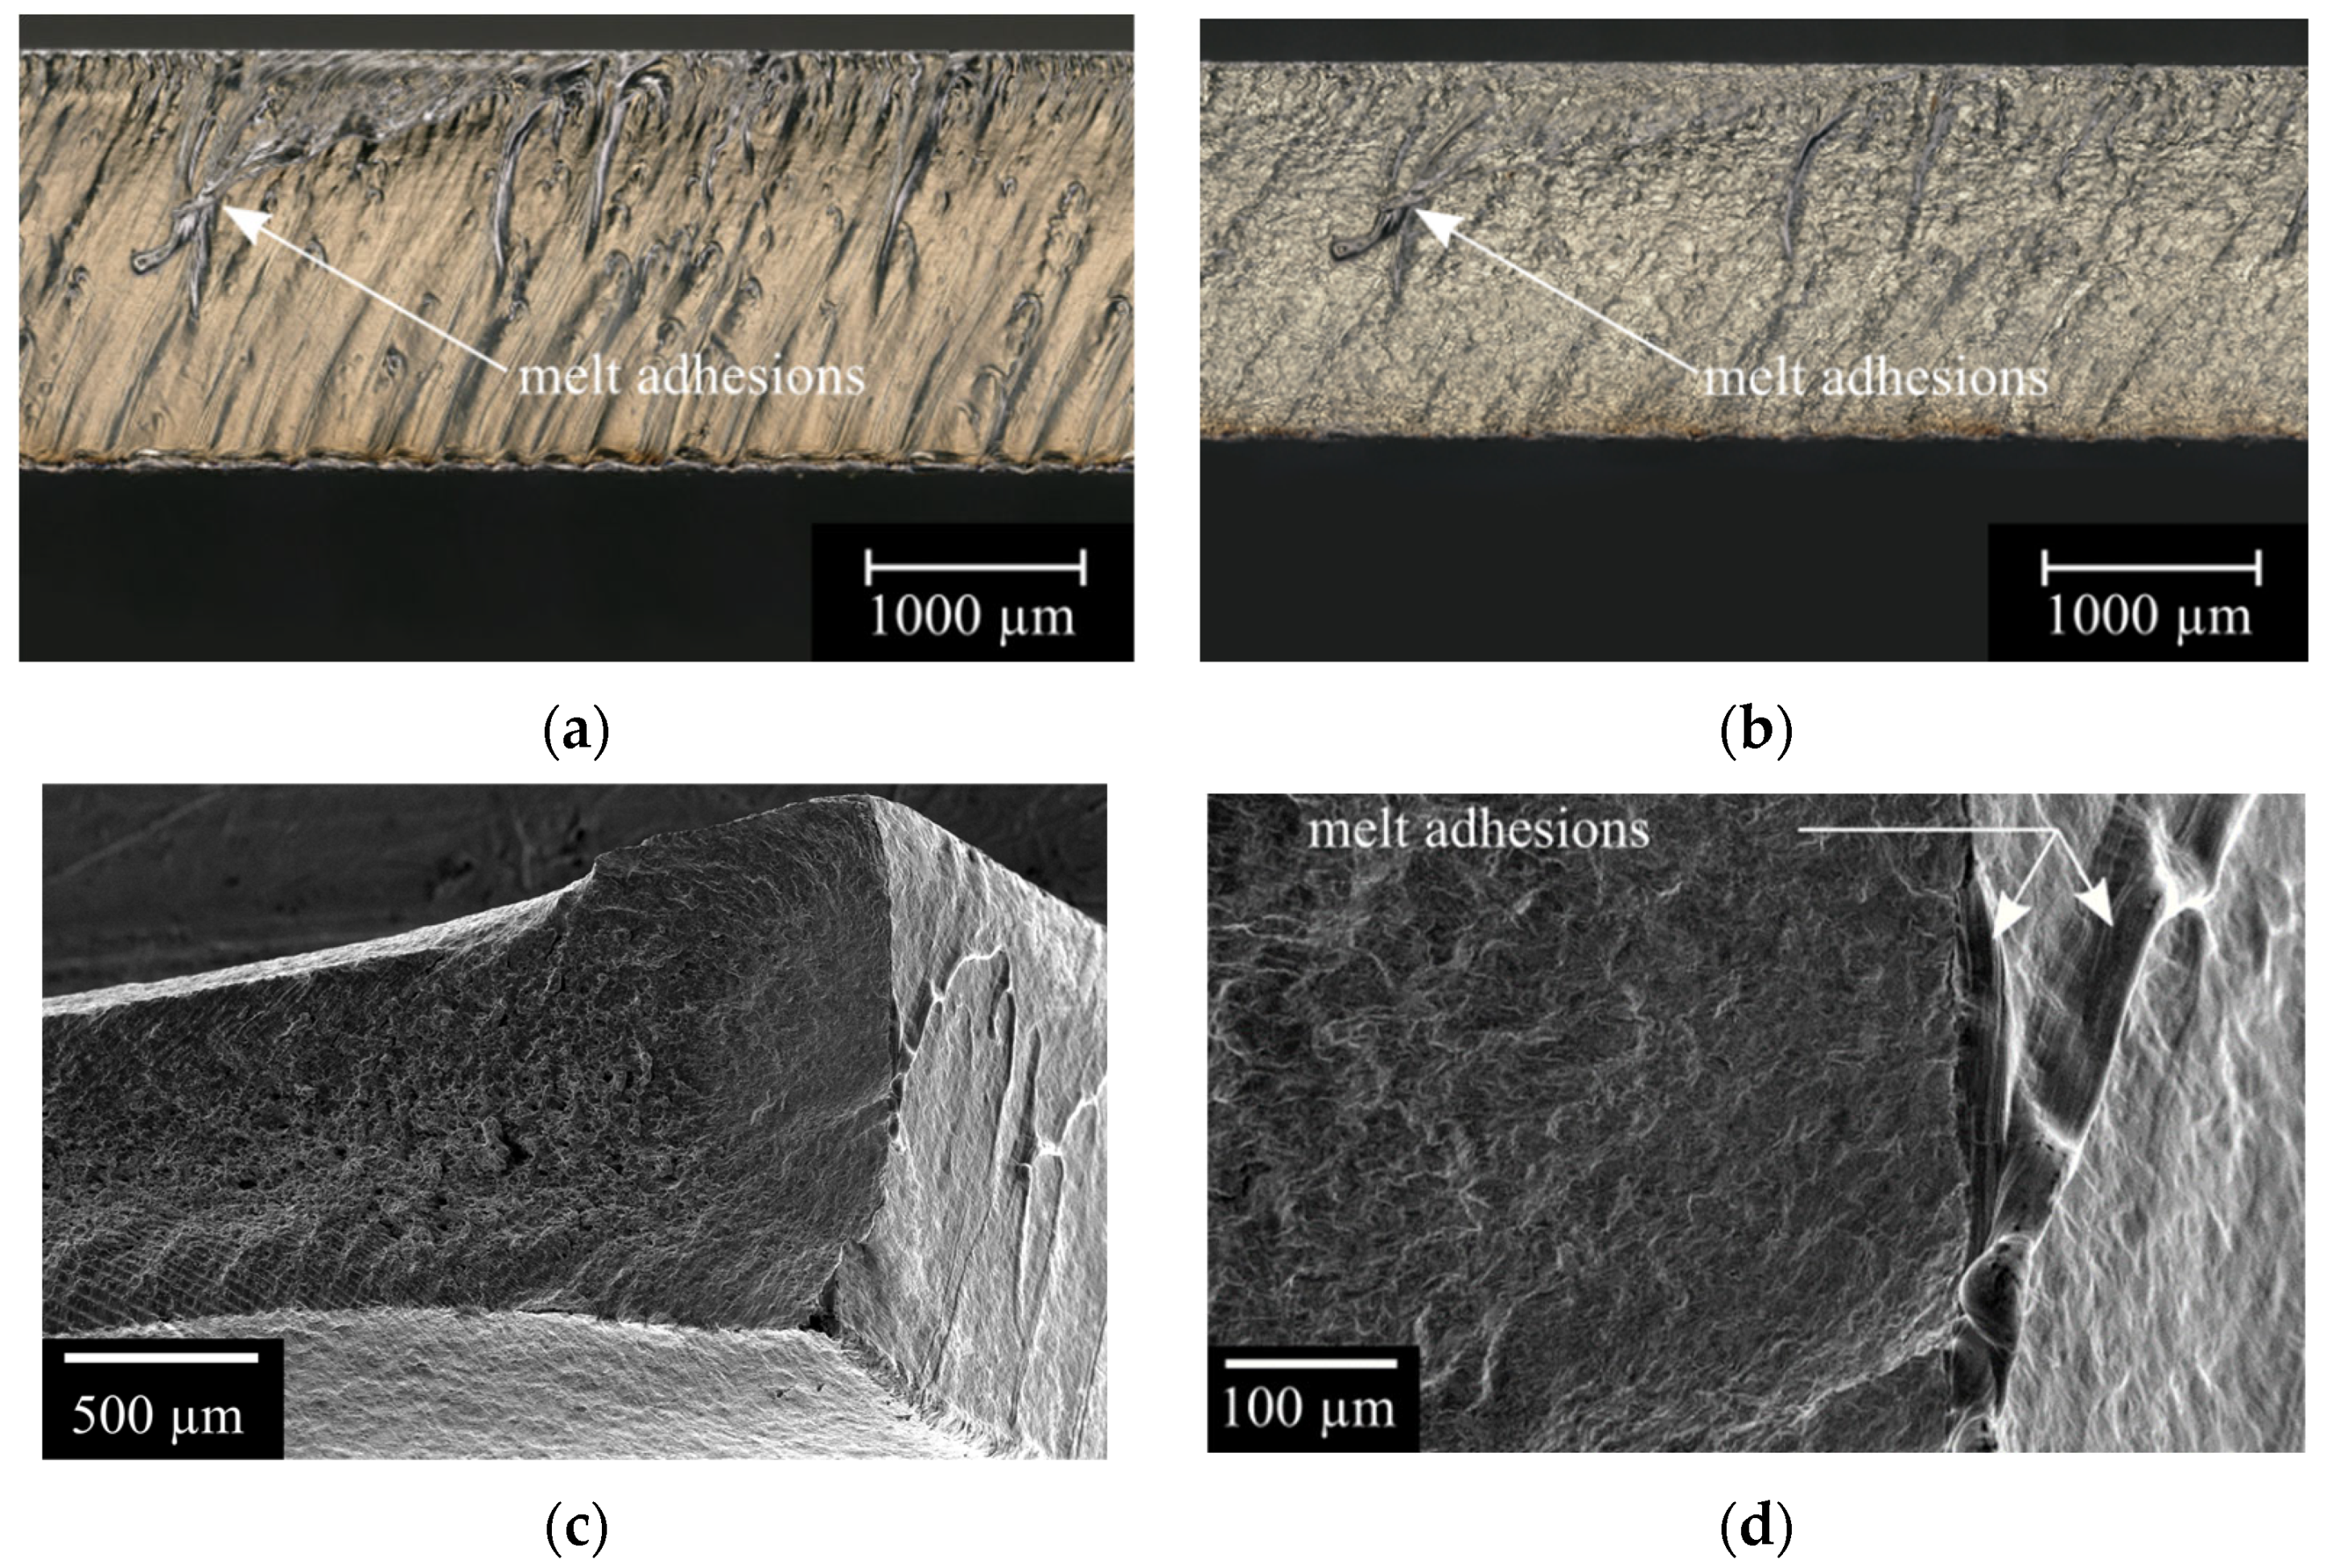
  • The defect leading to failure in the specimens with high dross volumes was predeformation-induced cracking in the dross layer;
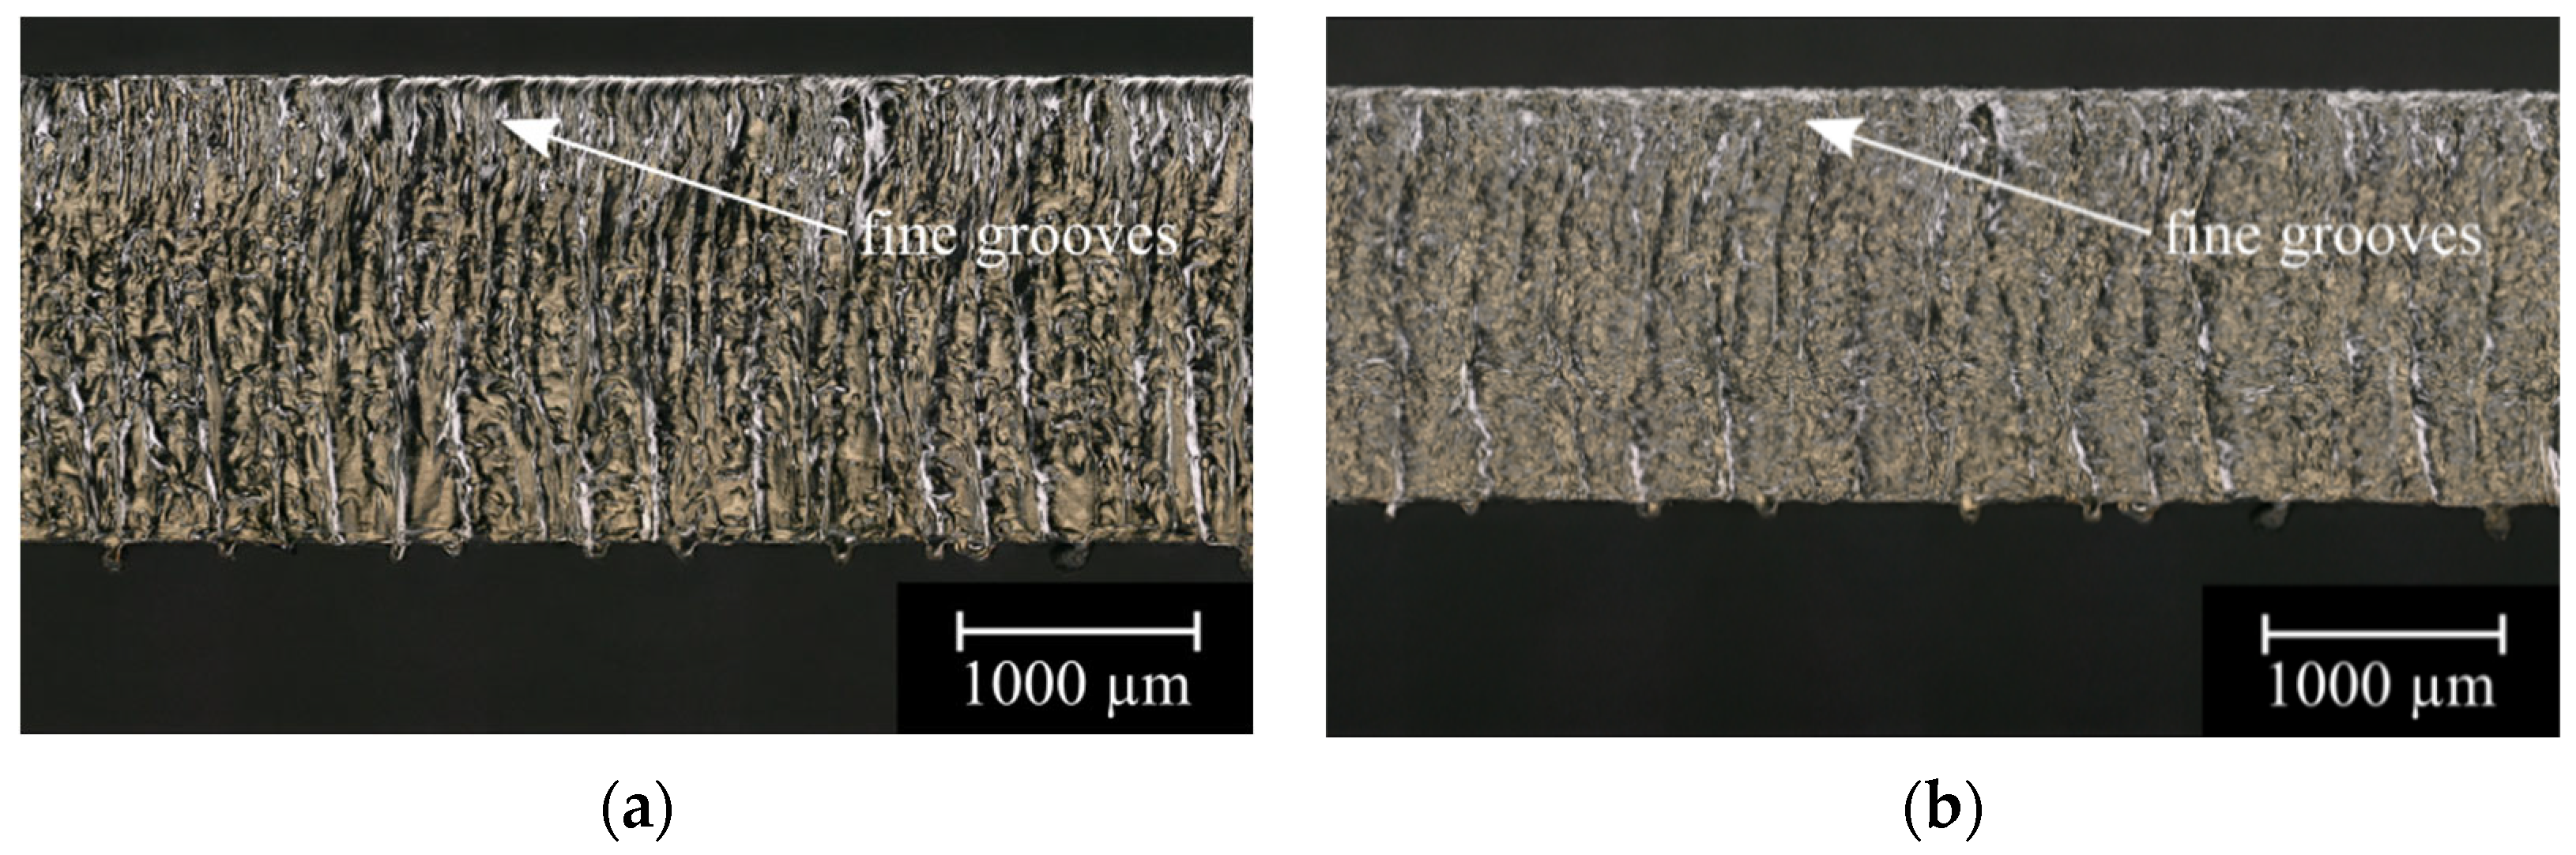
  • The defect leading to failure in the specimens with lower dross volumes was mainly the surface relief of the cutting edge;
  • For estimation of the fatigue strength of laser-cut materials, the average dross height is a simple yet promising feature and should be systematically included in future studies;
  • The results shown in this work allow a preliminary estimation of the influence of dross and surface relief on fatigue strength in more complex cutting geometries or thicker plates.
It can be said that laser cutting as a manufacturing process does not lead to a general loss of fatigue strength of the material. The quality criteria of the cut edge are decisive. The cut edge phenomena of surface relief and dross formation, which led to the strength loss of the specimens in this work, are related to the melt film. An investigation of the influence of the melt film thickness as well as the melt flow rate on the fatigue strength could provide further insights.

Author Contributions

Conceptualization, J.B., A.T.Z., S.C.L.F., P.H. and M.Z.; methodology, J.B., A.T.Z., T.W. and P.H.; validation, A.T.Z., S.C.L.F. and M.Z.; formal analysis, A.T.Z., S.C.L.F. and P.H.; investigation, J.B. and T.W.; writing—original draft preparation, J.B.; writing—review and editing, A.T.Z., T.W., S.C.L.F., P.H. and M.Z.; visualization, J.B. and A.T.Z.; supervision, P.H. and M.Z.; project administration, M.Z.; funding acquisition, P.H. and M.Z. All authors have read and agreed to the published version of the manuscript.

Funding

Funded by Deutsche Forschungsgemeinschaft (DFG, German Research Foundation): ZI 1006/15-1—Project-ID 413507401.

Data Availability Statement

The data presented in this study are available on request from the corresponding author.

Conflicts of Interest

The authors declare no conflict of interest.

References

  1. Hügel, H.; Graf, T. Laser in Der Fertigung; Springer: Berlin/Heidelberg, Germany, 2009. [Google Scholar]
  2. Förster, R.; Förster, A. (Eds.) Einteilung Der Fertigungsverfahren Nach Din 8580. In Einführung in Die Fertigungstechnik; Springer: Berlin/Heidelberg, Germany, 2018; pp. 23–136. [Google Scholar]
  3. Aurich, J.; Dornfeld, D.; Arrazola, P.; Franke, V.; Leitz, L.; Min, S. Burrs—Analysis, Control And Removal. Cirp Ann. 2009, 58, 519–542. [Google Scholar] [CrossRef] [Green Version]
  4. Din, E. Thermisches Schneiden. Einteilung Thermischer Schnitte. Geom. Prod. Und Qual. 2003, 9013, 2003–2007. [Google Scholar]
  5. Bliedtner, J.; Müller, H.; Barz, A. Lasermaterialbearbeitung: Grundlagen-Verfahren-Anwendungen-Beispiele; Carl Hanser Verlag Gmbh Co Kg: Munich, Germany, 2013. [Google Scholar]
  6. Olsen, F.; Alting, L. Cutting Front Formation in Laser Cutting. Cirp Ann. 1989, 38, 215–218. [Google Scholar] [CrossRef]
  7. Olsen, F. Fundamental Mechanisms of Cutting Front Formation in Laser Cutting. In Laser Materials Processing: Industrial and Microelectronics Applications; Beyer, E., Cantello, M., La Rocca, A., Laude, L., Olsen, F., Sepold, G., Eds.; Spie: Washington, DC, USA, 1994. [Google Scholar]
  8. Safyari, M.; Moshtaghi, M. Dependence of The Mechanical Properties of Metastable Austenitic Stainless Steel In High-Pressure Hydrogen Gas on Machining-Induced Defects. Mater. Lett. 2023, 340, 134149. [Google Scholar] [CrossRef]
  9. Tekiner, Z.; Yeşilyurt, S. Investigation of The Cutting Parameters Depending on Process Sound During Turning of Aisi 304 Austenitic Stainless Steel. Mater. Des. 2004, 25, 507–513. [Google Scholar] [CrossRef]
  10. Moshtaghi, M.; Sato, S. Characterization of Dislocation Evolution in Cyclically Loaded Austenitic And Ferritic Stainless Steels Via Xrd Line-Profile Analysis. Isij Int. 2019, 59, 1591–1598. [Google Scholar] [CrossRef] [Green Version]
  11. Kumagai, M.; Akita, K.; Kuroda, M.; Harjo, S. In Situ Diffraction Characterization on Microstructure Evolution in Austenitic Stainless Steel During Cyclic Plastic Deformation and Its Relation to The Mechanical Response. Mater. Sci. Eng. A 2021, 820, 141582. [Google Scholar] [CrossRef]
  12. Yilbas, B.; Aleem, B. Dross Formation During Laser Cutting Process. J. Phys. D Appl. Phys. 2006, 39, 1451–1461. [Google Scholar] [CrossRef]
  13. Schulz, W.; Kostrykin, V.; Nießen, M.; Michel, J.; Petring, D.; Kreutz Ew Poprawe, R. Dynamics of Ripple Formation and Melt Flow in Laser Beam Cutting. J. Phys. D Appl. Phys. 1999, 32, 1219. [Google Scholar] [CrossRef]
  14. Ghany, K.; Newishy, M. Cutting of 1.2 Mm Thick Austenitic Stainless Steel Sheet Using Pulsed And Cw Nd: Yag Laser. J. Mater. Process. Technol. 2005, 168, 438–447. [Google Scholar] [CrossRef]
  15. Amaral, I.; Silva, F.; Pinto, G.; Campilho, R.; Gouveia, R. Improving The Cut Surface Quality By Optimizing Parameters in the Fibre Laser Cutting Process. Procedia Manuf. 2019, 38, 1111–1120. [Google Scholar] [CrossRef]
  16. Tani, G.; Tomesani, L.; Campana, G. Prediction of Melt Geometry in Laser Cutting. Appl. Surf. Sci. 2003, 208, 142–147. [Google Scholar] [CrossRef]
  17. Duan, J.; Man, H.; Yue, T. Modelling The Laser Fusion Cutting Process: I. Mathematical Modelling of The Cut Kerf Geometry For Laser Fusion Cutting of Thick Metal. J. Phys. D Appl. Phys. 2001, 34, 2127. [Google Scholar] [CrossRef]
  18. Duan, J.; Man, H.; Yue, T. Modelling The Laser Fusion Cutting Process: II. Distribution of Supersonic Gas Flow Field inside the Cut Kerf. J. Phys. D Appl. Phys. 2001, 34, 2135. [Google Scholar] [CrossRef]
  19. Duan, J.; Man, H.; Yue, T. Modelling The Laser Fusion Cutting Process: III. Effects of Various Process Parameters on Cut Kerf Quality. J. Phys. D Appl. Phys. 2001, 34, 2143. [Google Scholar] [CrossRef]
  20. Tani, G.; Tomesani, L.; Campana, G.; Fortunato, A. Quality Factors Assessed By Analytical Modelling in Laser Cutting. Thin Solid Film. 2004, 453, 486–491. [Google Scholar] [CrossRef]
  21. Schuöcker, D.; Aichinger, J.; Majer, R. Dynamic Phenomena In Laser Cutting and Process Performance. Phys. Procedia 2012, 39, 179–185. [Google Scholar] [CrossRef] [Green Version]
  22. Lara, A.; Picas, I.; Casellas, D. Effect of The Cutting Process on The Fatigue Behaviour of Press Hardened And High Strength Dual Phase Steels. J. Mater. Process. Technol. 2013, 213, 1908–1919. [Google Scholar] [CrossRef]
  23. Thomas, D. A Review of Fatigue Failure Properties From Edge Defects. J. Fail. Anal. Prev. 2017, 17, 802–811. [Google Scholar] [CrossRef]
  24. Pessoa, D.; Grigorescu, A.; Herwig, P.; Wetzig, A.; Zimmermann, M. Influence of Notch Effects Created by Laser Cutting Process on Fatigue Behavior of Metastable Austenitic Stainless Steel. Procedia Eng. 2016, 160, 175–182. [Google Scholar] [CrossRef]
  25. Pessoa, D.; Herwig, P.; Wetzig, A.; Zimmermann, M. Influence of Surface Condition Due to Laser Beam Cutting on The Fatigue Behavior of Metastable Austenitic Stainless Steel Aisi 304. Eng. Fract. Mech. 2017, 185, 227–240. [Google Scholar] [CrossRef]
  26. Mateo, A.; Fargas, G.; Calvo, J.; Roa, J. Influence of Laser Cutting on The Fatigue Limit of Two High Strength Steels. Mater. Test. 2015, 57, 136–140. [Google Scholar] [CrossRef]
  27. Wanski, T.; Zeuner At Schöne, S.; Herwig, P.; Mahrle, A.; Wetzig, A.; Zimmermann, M. Investigation of The Influence of A Two-Step Process Chain Consisting of Laser Cutting and Subsequent Forming on The Fatigue Behavior of Aisi 304. Int. J. Fatigue 2022, 159, 106779. [Google Scholar] [CrossRef]
  28. Zeuner, A.; Wanski, T.; Schettler, S.; Fell, J.; Wetzig, A.; Kühne, R.; Fischer, S.; Zimmermann, M. Influence of A Pronounced Pre-Deformation on The Attachment of Melt Droplets and The Fatigue Behavior of Laser-Cut Aisi 304. Metals 2023, 13, 201. [Google Scholar] [CrossRef]
  29. Thomas, D.; Whittaker, M.; Bright, G.; Gao, Y. The Influence of Mechanical and Co2 Laser Cut-Edge Characteristics on The Fatigue Life Performance of High Strength Automotive Steels. J. Mater. Process. Technol. 2011, 211, 263–274. [Google Scholar] [CrossRef]
  30. Smaga, M.; Walther, F.; Eifler, D. Deformation-Induced Martensitic Transformation in Metastable Austenitic Steels. Mater. Sci. Eng. A 2008, 483–484, 394–397. [Google Scholar] [CrossRef]
  31. Müller-Bollenhagen, C.; Zimmermann, M.; Christ, H.-J. Very High Cycle Fatigue Behaviour of Austenitic Stainless Steel and The Effect of Strain-Induced Martensite. Int. J. Fatigue 2010, 32, 936–942. [Google Scholar] [CrossRef]
  32. Chen, A.; Ruan, H.; Wang, J.; Chan, H.; Wang, Q.; Li, Q.; Lu, J. The Influence of Strain Rate on The Microstructure Transition of 304 Stainless Steel. Acta Mater. 2011, 59, 3697–3709. [Google Scholar] [CrossRef]
  33. Wandera, C. Fiber Lasers in Material Processing Fiber Laser; IntechOpen: London, UK, 2016. [Google Scholar]
  34. Wandera, C.; Kujanpaa, V. Characterizations of The Melt Removal Rate In Laser Cutting of Thick-Section Stainless Steel. J. Laser Appl. 2010, 22, 62–70. [Google Scholar] [CrossRef]
Figure 1. Schematic illustration of the laser cutting process highlighting the important zones: zone of energy input (laser beam and gas jet), zone of the material and cutting front (violet) and melt film (red) acc. to [5].
Metals 13 00624 g001
Figure 2. Geometry of the fatigue specimen, sizes in mm.
Metals 13 00624 g002
Figure 3. Measurement of the dross height.
Metals 13 00624 g003
Figure 4. Influence of process parameters on the dross geometry with varying powers of 2 kW and 4 kW and focus positions of −1 mm and 0 mm.
Metals 13 00624 g004
Figure 5. Selected representative dross shapes for the fatigue tests: (a) dross-free, (b) small droplets, (c) large droplets and (d) very coarse dross.
Metals 13 00624 g005
Figure 6. S-N curves for the representative dross geometries.
Metals 13 00624 g006
Figure 7. Crack initiation origin of a representative specimen with dross-free cut edge in the states (a) before pre-deformation and (b) after pre-deformation. (c) SEM image of the crack initiation region with melt adhesions. (d) Enlarged SEM image of the crack initiation site.
Metals 13 00624 g007
Figure 8. Crack initiation origin of a representative specimen with small droplets in the states (a) before pre-deformation and (b) after pre-deformation. (c) SEM image of the crack initiation region. (d) Enlarged SEM image of the crack initiation site with fine grooves.
Metals 13 00624 g008aMetals 13 00624 g008b
Figure 9. Crack initiation origin of a representative specimen with large droplets in the states (a) before pre-deformation and (b) after pre-deformation. (c) The fatigue crack origin starting from the dross. (d) SEM image of the crack initiation site with different fracture surface characteristics.
Metals 13 00624 g009
Figure 10. Crack initiation origin of a representative specimen with very coarse dross in the states (a) before pre-deformation and (b) after pre-deformation. (c) The fatigue crack origin starting from the dross. (d) SEM image of the crack initiation site with different fracture surface characteristics.
Metals 13 00624 g010
Table 1. Chemical composition of AISI 304 acc. to the manufacturer.
ElementCSiMnPSNCrNi
wt.%0.02620.3611.4120.03110.00380.045518.078.032
Table 2. Characteristics of the beam source.
CharacteristicsData
Beam parameter product/mm mrad4.4
Focal diameter/μm192
Rayleigh length/mm2.1
Beam quality M213.0
Table 3. Process parameters and their limits for exploration of dross parameter space in phase one of testing.
ParameterLimits
Laser power PL/kW2 and 4
Assist gas pressure ρGas/barFrom 7 to 15
Feed rate v/m·min−1From 2 to 20
Focal position dZ/mmFrom +2 to −1
Stand-off distance/mm0.5 and 3
Table 4. Fatigue strength of the representative dross geometries and their reduction in fatigue strength compared with the reference (polished).
Specimen BatchFatigue Strength at 107
Load Cycles (MPa)
Strength Loss Compared to Reference (%)
reference (polished)387.5-
dross-free30023
dmall droplets262.532
large droplets17555
very coarse dross12568
Disclaimer/Publisher’s Note: The statements, opinions and data contained in all publications are solely those of the individual author(s) and contributor(s) and not of MDPI and/or the editor(s). MDPI and/or the editor(s) disclaim responsibility for any injury to people or property resulting from any ideas, methods, instructions or products referred to in the content.

