Article

Microstructure Evolution, Mechanical Properties, and Corrosion Resistance of Hot Rolled and Annealed Ti-Mo-Ni Alloy

1
Faculty of Materials Science and Engineering, Kunming University of Science and Technology, Kunming 650093, China
2
National−Local Joint Engineering Laboratory for Technology of Advanced Metallic Solidification Forming and Equipment, Kunming University of Science and Technology, Kunming 650093, China
3
Yunnan Titanium Industry Co., Ltd., Chuxiong 651209, China
*
Author to whom correspondence should be addressed.
Metals 2023, 13(3), 566; https://doi.org/10.3390/met13030566
Submission received: 15 February 2023 / Revised: 9 March 2023 / Accepted: 9 March 2023 / Published: 11 March 2023

Abstract

:
The effects of annealing time on microstructure, mechanical properties, and corrosion resistance of Ti-0.3Mo-0.8Ni (TA10) titanium alloy hot-rolled sheets are investigated. With the increase in annealing time, the α → β phase transition occurs, and the grain size grows gradually. The strength deteriorates, and elongation increases. The grains grow up, the number of grain boundaries decreases, and intergranular corrosion decreases. With the increase in the annealing time, the corrosion kinetics and thermodynamics are enhanced. When annealed at 780 °C for 2 h, TA10 alloy sheets exhibit the best comprehensive properties, and its microstructure is composed of fine equiaxed α phase. The mechanical properties and corrosion resistance are improved.

1. Introduction

With the development of the country and the progress of society, all walks of life have higher requirements for the performance of products, resulting in demand for new materials. Compared with other metals, titanium and titanium alloy, due to their high strength, corrosion resistance, heat resistance, and other excellent performance characteristics, are widely used in aerospace, vehicle manufacturing, high-precision equipment, marine field, biomedicine, and other fields [1,2,3,4,5,6,7]. The molybdenum and nickel elements added in the Ti-0.3Mo-0.8Ni (TA10) titanium alloy are relatively low price in the market and show good comprehensive performance, which can replace the expensive Ti-0.2Pd (TA9) alloy. So, it is widely used in hydrochloric acid steam heat exchangers, reactors, chlor-alkali industrial brine systems, and vacuum salt-making devices [8,9,10].
Luo et al. [11] studied transformation characteristics of temperature and phases within Ti-6Al-4V (TC4) aeroengine drum in hot forging and air-cooling procedures. It shows a simple and effective modeling approach to predict the transformation characteristics of temperature and phases during TC4 drum hot forging and air-cooling processes. Davari et al. [12] studied the effects of annealing temperature and quenching medium on the microstructure, mechanical properties, and fatigue behavior of TC4 alloy. The results show that with the increase in annealing temperature, the length, width, and volume fraction of the primary α phase decrease significantly, and the contents of the transformed β phase and residual β phase increase significantly. In addition, the α colony size and effective slip length decrease significantly, leading to an increase in hardness and tensile strength. Wang et al. [13] studied the microstructure evolution and static recrystallization of the hot-rolled Ti-6Al-2Zr-2Sn-2Mo-1.5Cr-2Nb (TC21) titanium alloy with equiaxed structure during annealing. The results show that uniform and fine microstructure can be obtained for hot-rolled TC21 titanium alloy when the annealing temperature is 880 °C. Vrancken et al. [14] studied the heat treatment structure and mechanical properties of TC4 prepared by selective laser melting and found that the effects of several heat treatments on the microstructure and mechanical properties of laser sintering TC4 were studied. The effects of these treatments on the hot forging and subsequent rolling annealing of the original equiaxed TC4 were compared.
Sandenbergh et al. [8] studied the use of Tafel back extrapolation to clarify the influence of Ru and Pa elements on the corrosion behavior of titanium in concentrated hydrochloric acid. It was found that the Ru and Pa elements stimulated the cathodic reaction but that the anodic behavior of the titanium was unchanged, and the corrosion of the titanium was increased by the small amount of alloying as the catalysis of the hydrogen reduction reaction was not strong enough to cause passivity of the titanium under these conditions. Su et al. [15] studied the corrosion behavior of annealing Ti-6Al-3Nb-2Zr-1Mo (Ti80) alloy in 3.5wt. % NaCl and 5 M HCl solution. The results show that with the increase in annealing temperature, the corrosion resistance of Ti80 alloy will be improved due to the higher volume fraction of β phase and secondary α phase. β phase has higher corrosion resistance than the α phase because of the higher contents of Nb, Mo, and Zr in the β phase. Meng et al. [16] studied the effects of annealing temperature on the microstructure and corrosion behavior of Ti80 alloy in a hydrochloric acid solution. The results show that Ti80 alloy has similar corrosion behavior after being annealed at different temperatures. With the increase in annealing temperature from 800 °C to 960 °C, the corrosion rate increases, and the lowest corrosion rate occurs when the temperature reaches 1040 °C. Wang et al. [17] studied the corrosion behavior of pure titanium and its alloys in fluorinated sulfuric acid. The results show that in TA10 alloy, the addition of Ni can accelerate the cathodic reaction, while the addition of Mo can inhibit the anodic reaction, which is the reason for the excellent corrosion resistance of TA10 alloy, but the depletion of Mo and Ni may lead to an unstable system.
At present, compared with previous studies, TA10 alloy is mainly smelted in vacuum arc remelting (VAR) furnaces, but there are few studies on TA10 alloy smelted in Electron Beam Cold Hearth Melting furnaces (EB furnaces). The effects of annealing time on microstructure, mechanical properties, and corrosion properties of TA10 alloy are rarely studied, and the actual production is generally based on experience to choose the annealing time.
TA10 alloy ingots were produced by EB technology, then hot rolled and annealed. The influences of annealing time on the microstructure evolution and properties of TA10 alloy sheets were investigated to provide theoretical guidance and a scientific basis for the formulation of the corrosion-resistant titanium alloy annealing process.

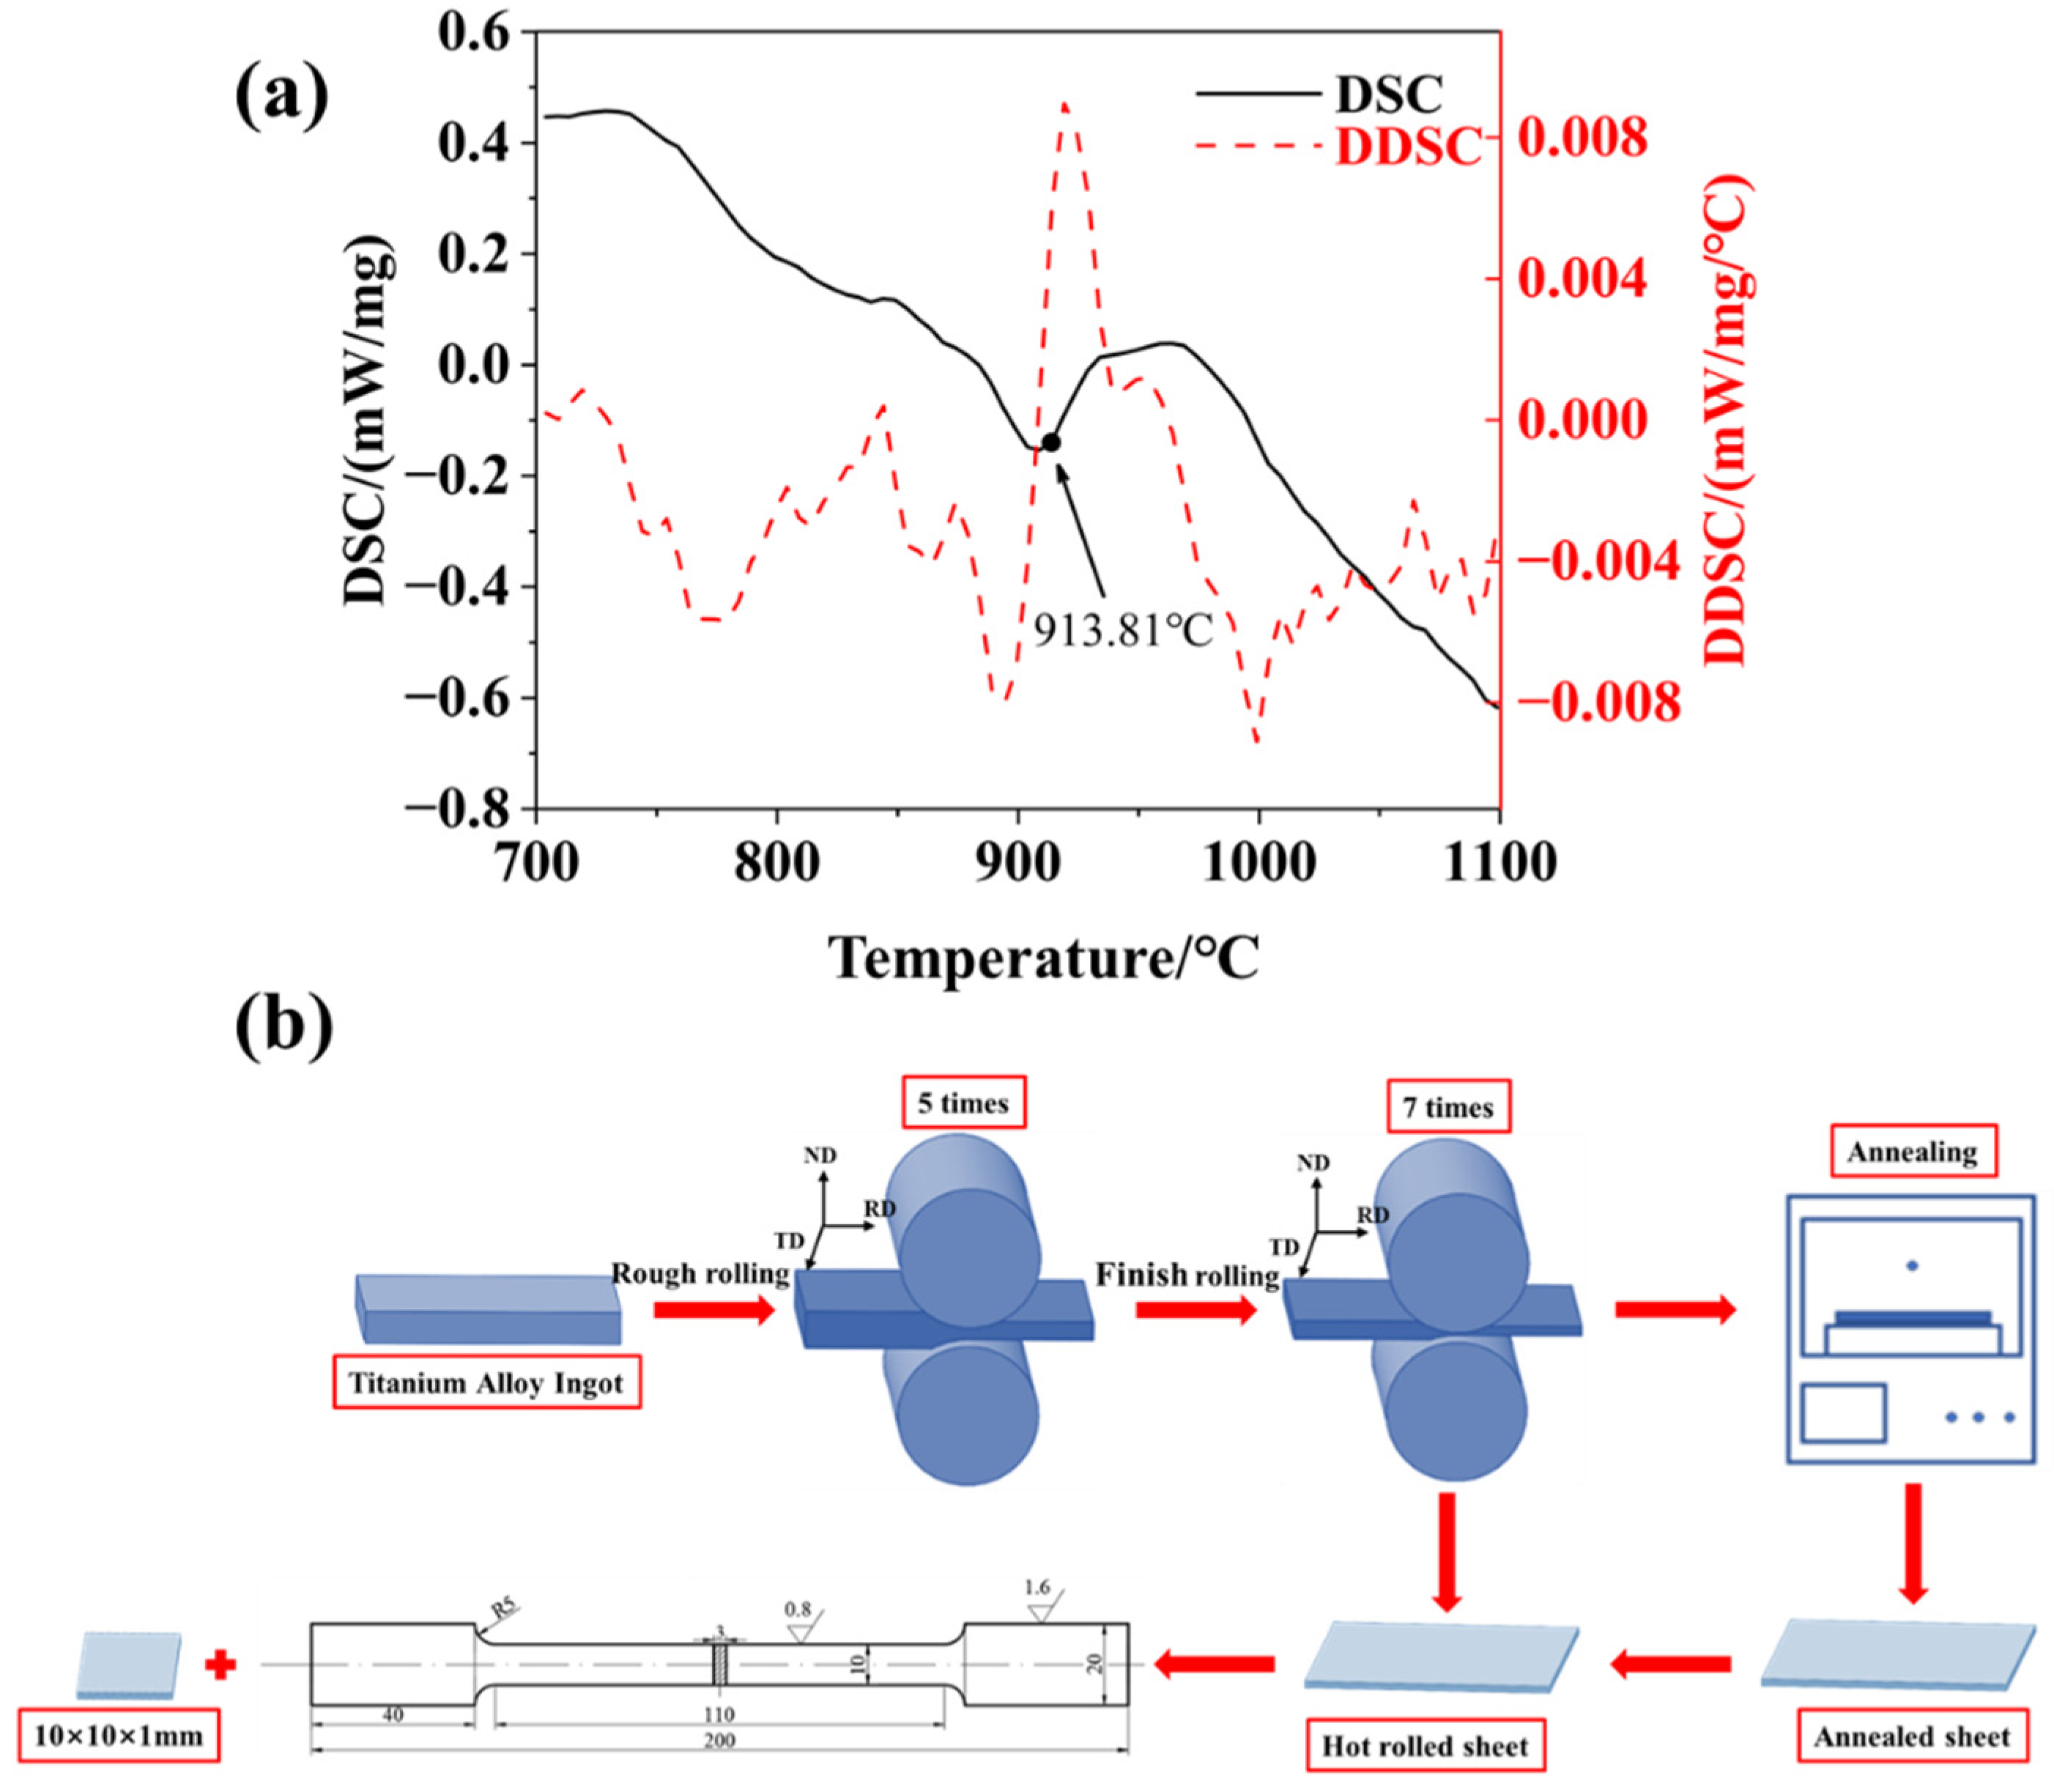
2. Experimental Materials and Methods

The EB furnace smelting process has a shorter smelting cycle and requires only one smelting, so this method is chosen for refining TA10 titanium ingot. At 900 °C, the ingot with a thickness of 200 mm was hot-rolled to a thickness of 3 mm by 5 rough passes and 7 finished passes.
Table 1 shows the chemical composition of titanium alloy ingot measured by PerkinElmer 8300 inductively coupled plasma (ICP) spectrogenerator (Error range: ±0.5). Figure 1a shows the test results of its β transformation temperature by differential scanning calorimetry (DSC) and the first derivative of the DSC curve (DDSC). The temperature of the β transformation of the TA10 alloy is 913.81 °C (Error range: ±0.5). Then, the hot-rolled TA10 alloy sheets were annealed at 780 °C for 0.5, 1, 2, and 4 h.
TA10 alloy sheets were cut into 10 × 10 × 3 mm3 (Error range: ±0.3) metallographic samples, sanded, and mechanically polished with Kroll reagent (HF:HNO3:H2O = 2:3:15), and then the metallographic structure of the TA10 alloy sheets was observed by Nikon ECLIPSE MA200 optical microscope. Phase analysis of the TA10 alloy sheets was performed by a PANalytical Empyrean X-ray diffractometer (XRD) with Cu target Kα radiation at a scanning rate of 10°/min. The unidirectional tensile test was carried out by SHT4305 microcomputer electro-hydraulic servo universal testing machine, and the tensile rate was 10 mm/min. Figure 1b shows the experimental process and the size of the tensile sample and metallographic sample. The tensile sample was a dumbbell shape, and the size was set in accordance with GB/T 228.1-2010. The fracture morphology of the sample was analyzed by ZEISS EVO18 scanning electron microscope. The Vickers hardness of the TA10 sheets was measured by HMV-G21S Vickers hardness tester with a load of 100 g and a loading time of 15 s. Each sample was tested seven times, and the final hardness values were the average value after removing the highest and lowest values. The electron backscattered diffraction (EBSD) test was carried out by a HitachiS-3400N scanning electron microscope. The sample was polished first, and then the stress layer was removed after 3 h of vibration polishing.
The electrochemical corrosion sample was cut into 10 × 10 × 3 mm3 (Error range: ±0.3) by an electric spark wire cutting machine, and the 10 × 10 mm2 surface was used as the working surface. The working surface was polished to ensure that the surface was bright and without scratches.
The open-circuit potential (OCP), polarization curve, and impedance graph test in this experiment were all completed in the three-electrode system electrochemical workstation, in which the sample was the working electrode. An amount of 3.5% NaCl was used as the corrosion solution. After these samples were put into the working area, the stability time was set at 1800 s; then, we conducted the OCP test. The impedance graph test was conducted after 1800 s, and finally, the polarization curve test was conducted after 3600 s. The OCP test time was 3600 s. The impedance test time was 1800 s, the polarization curve test potential ranged from −1.5 V to 1.5 V, and the scanning rate was 0.001 V/s. Although 1 mV/s is adopted in this stage of the experimentations, it is remarked that this selection is based on the fact that no substantial distortions were provided in the polarization curves obtained. In this sense, it is worth noting that potential scan rate has an important role in order to minimize the effects of distortion in Tafel slopes and corrosion current density analyses, as previously reported [18,19,20,21].

3. Results and Discussions

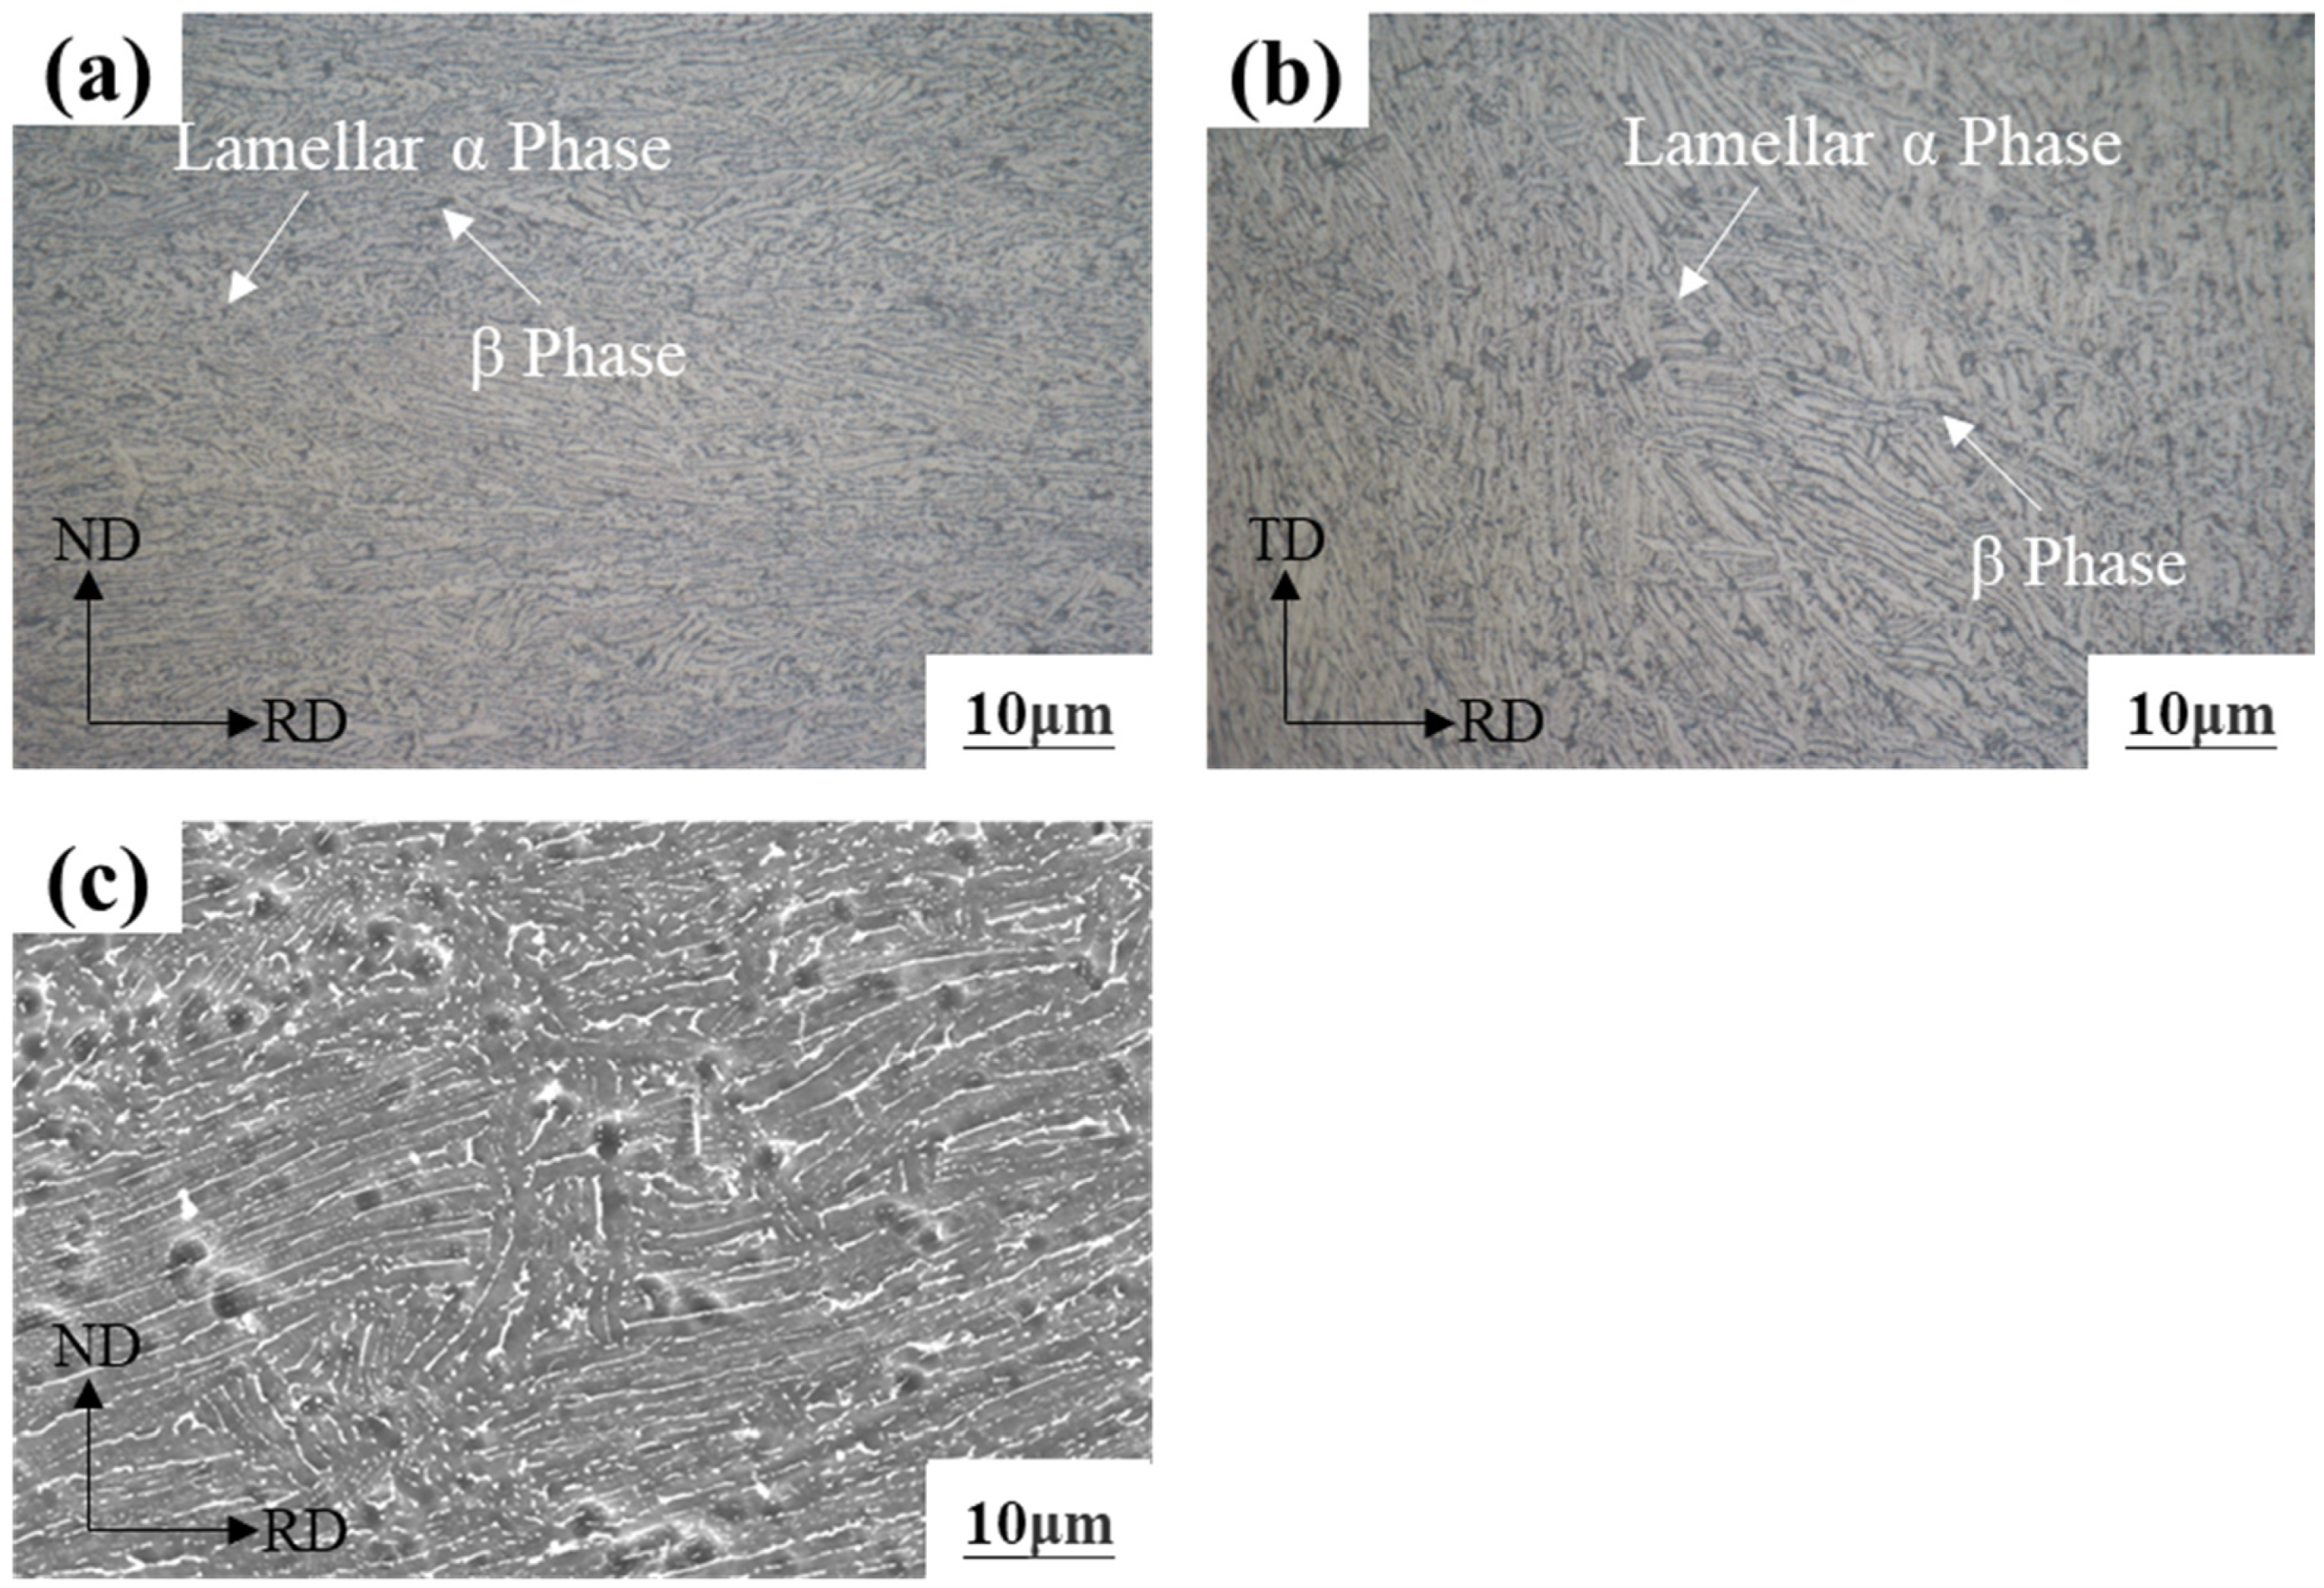
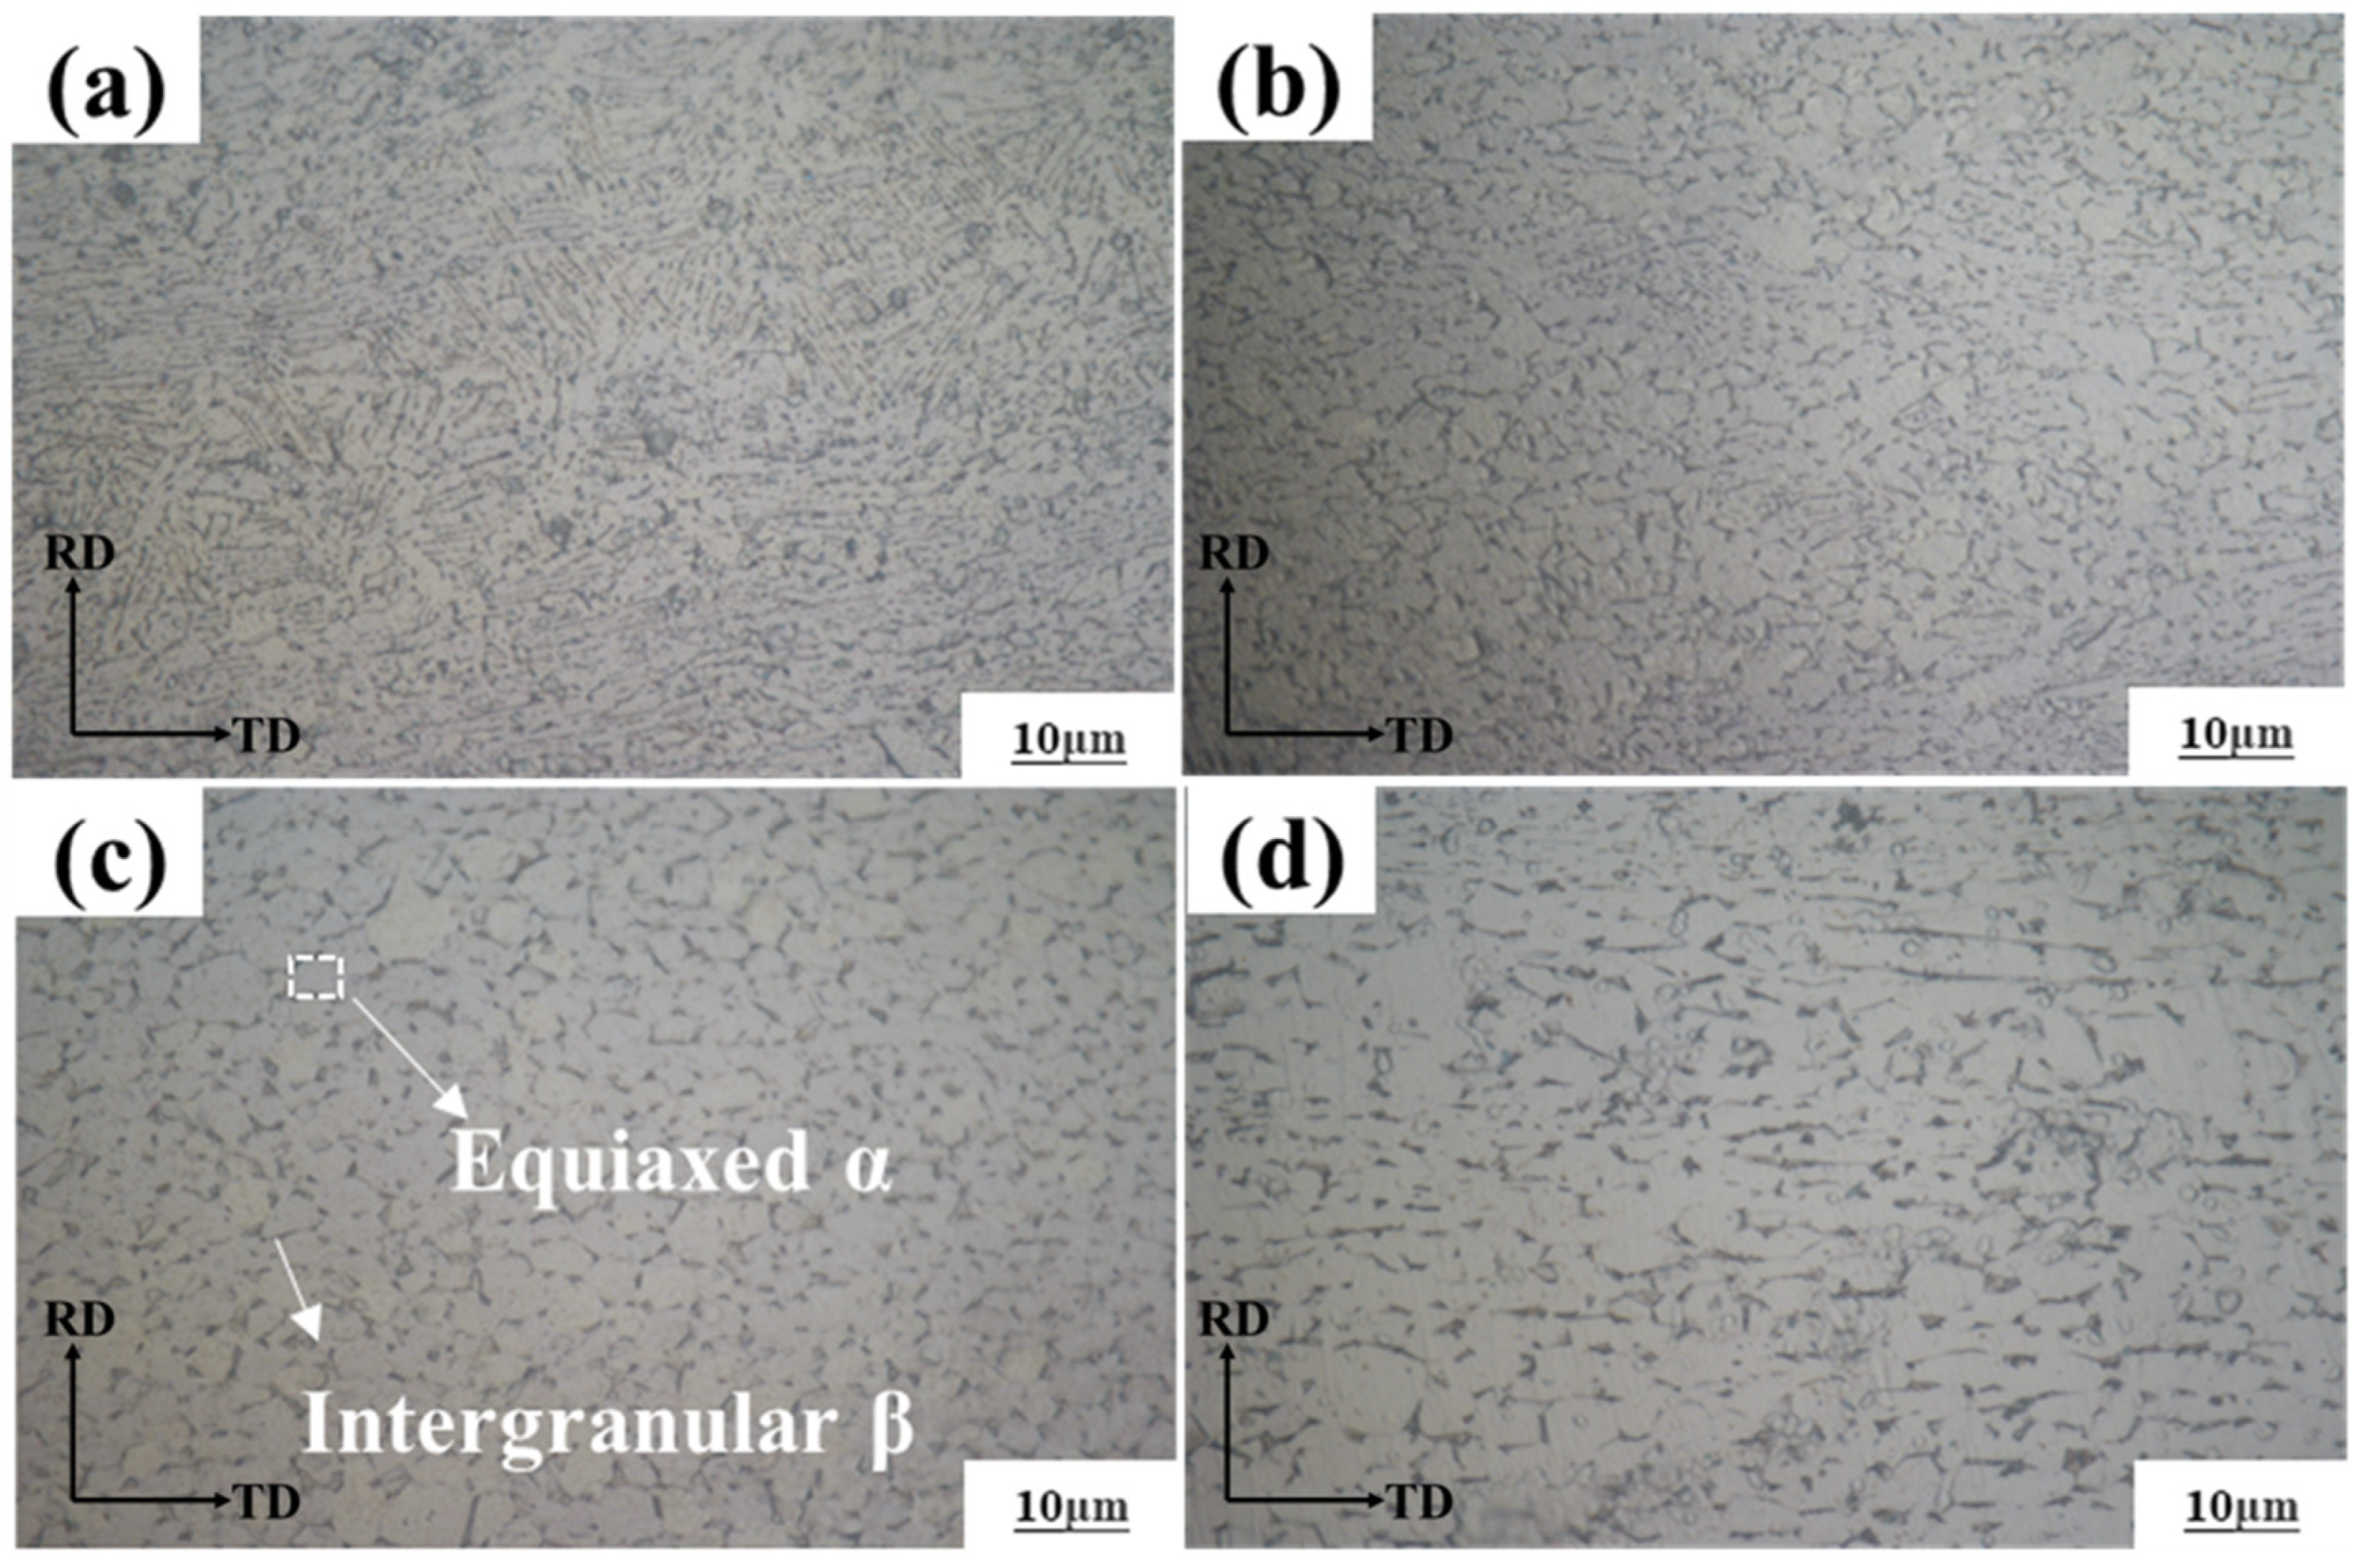
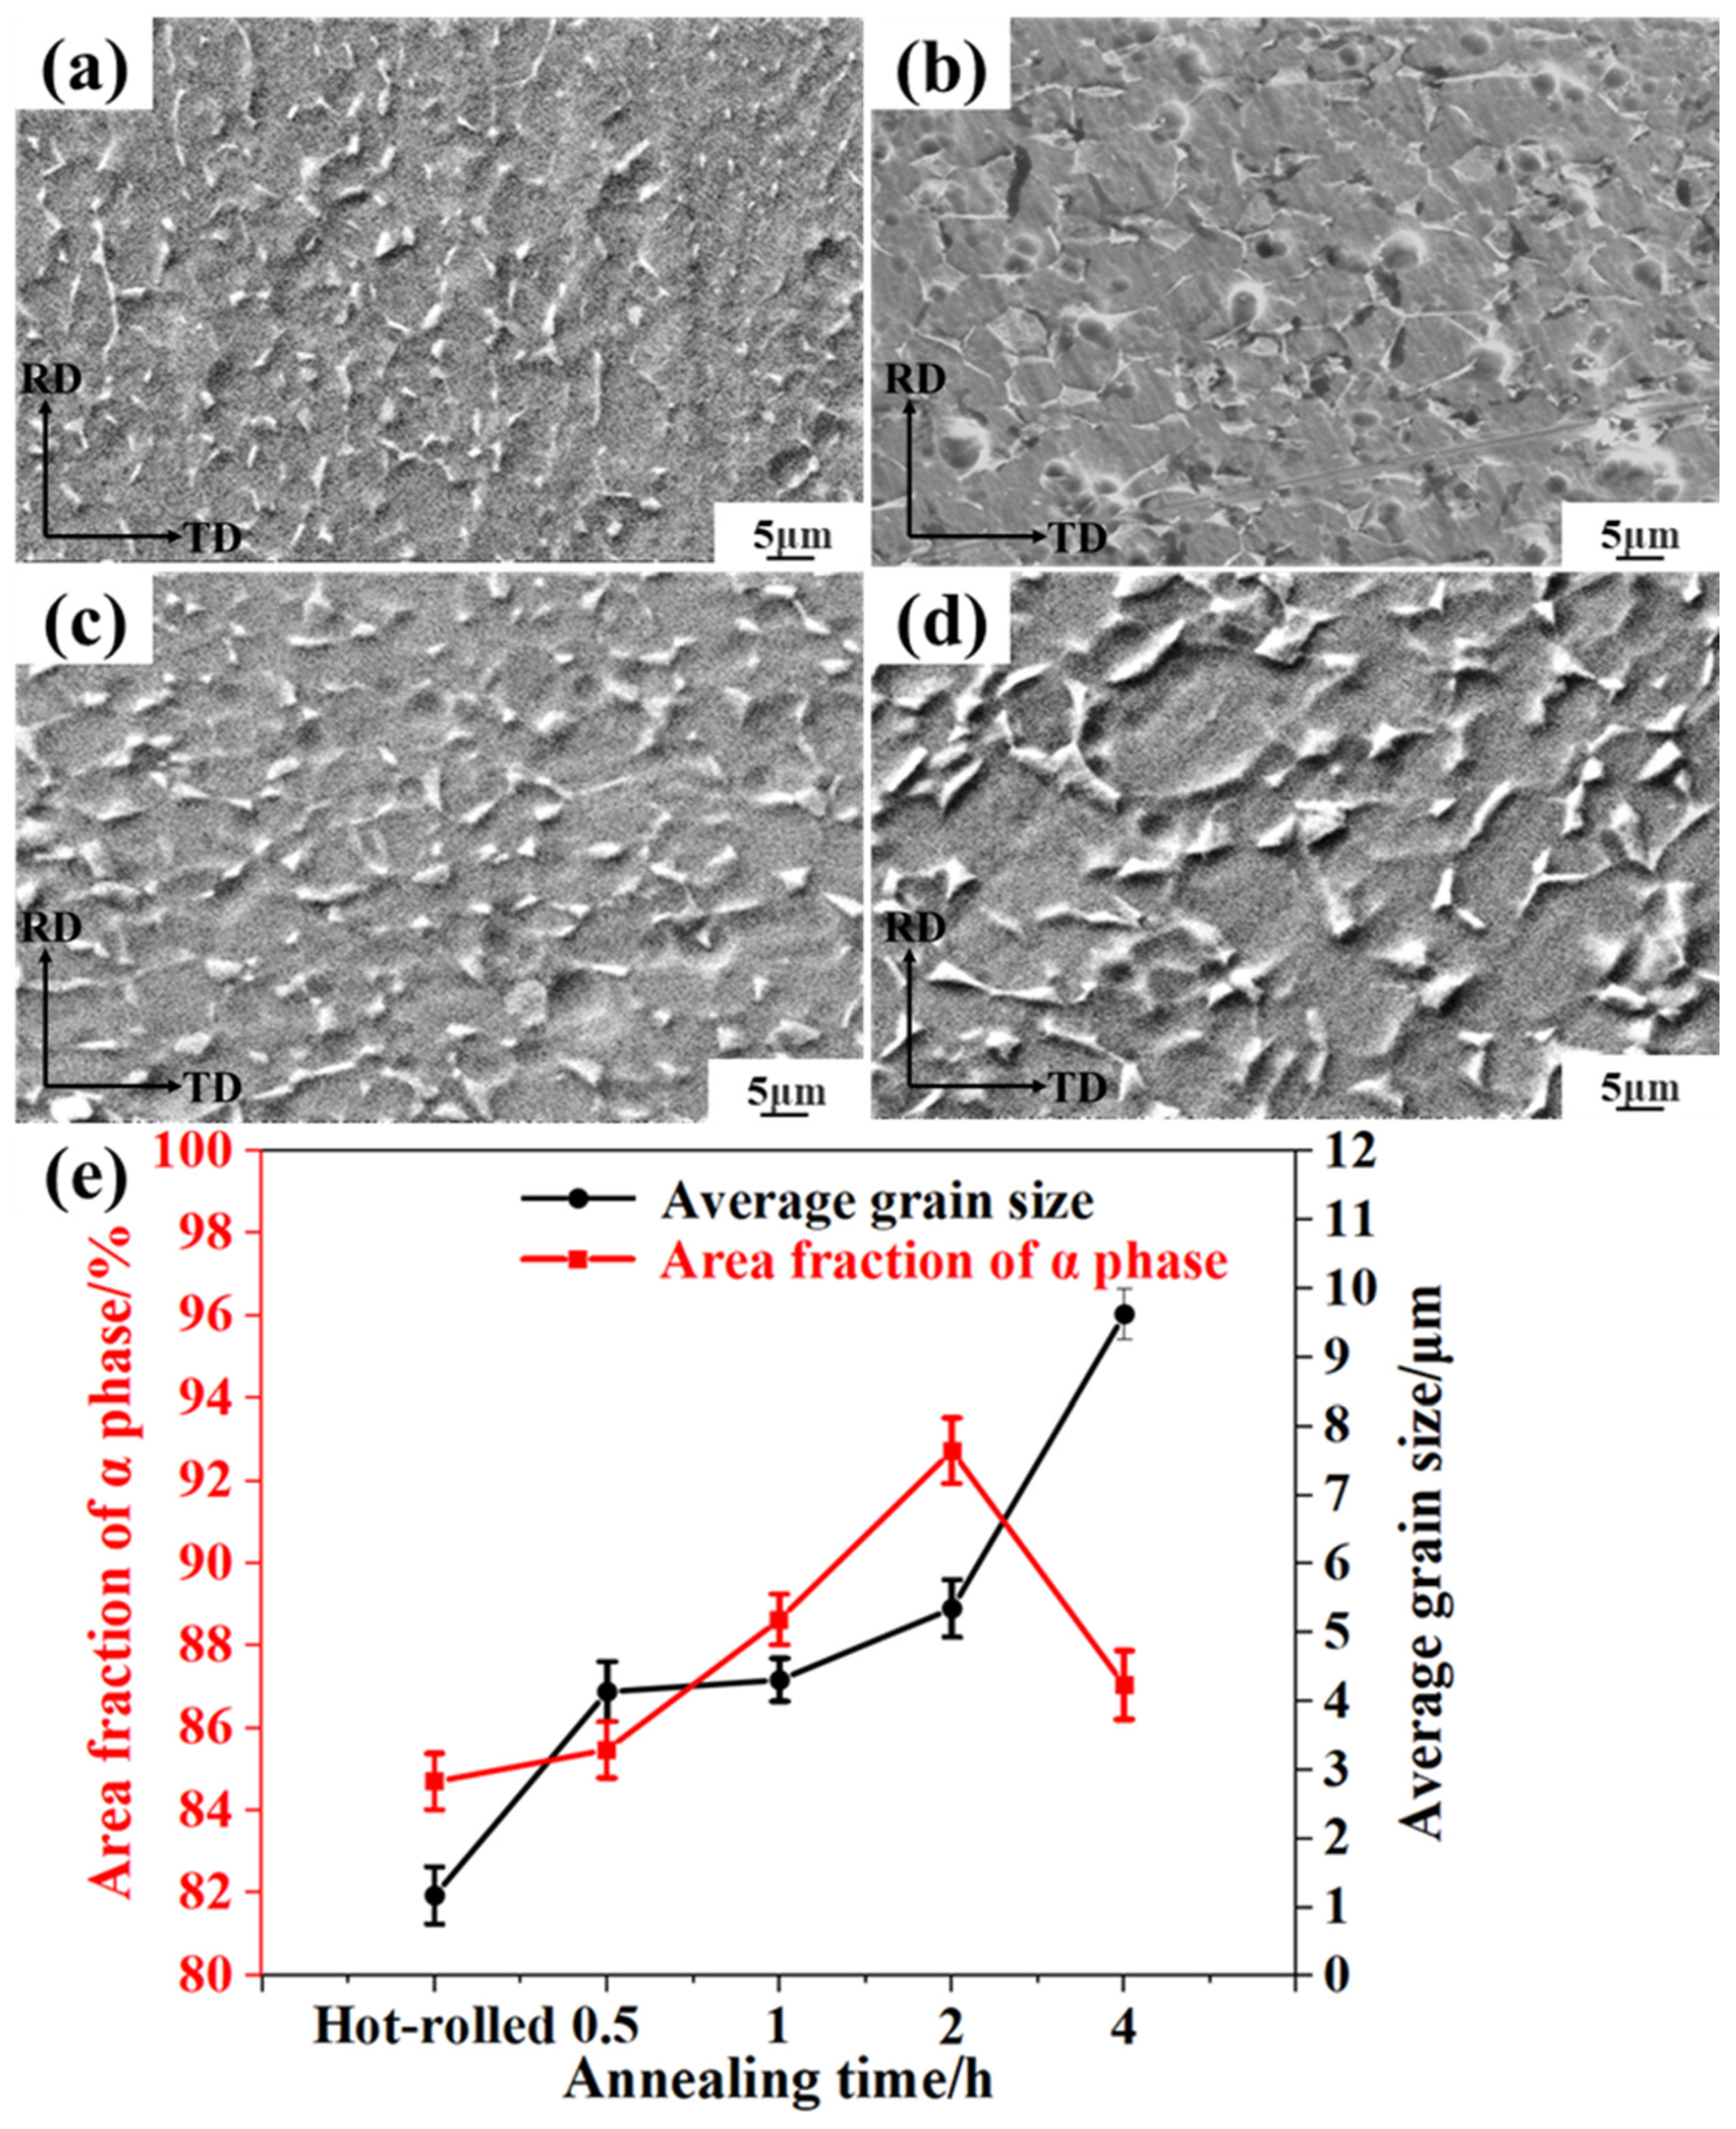
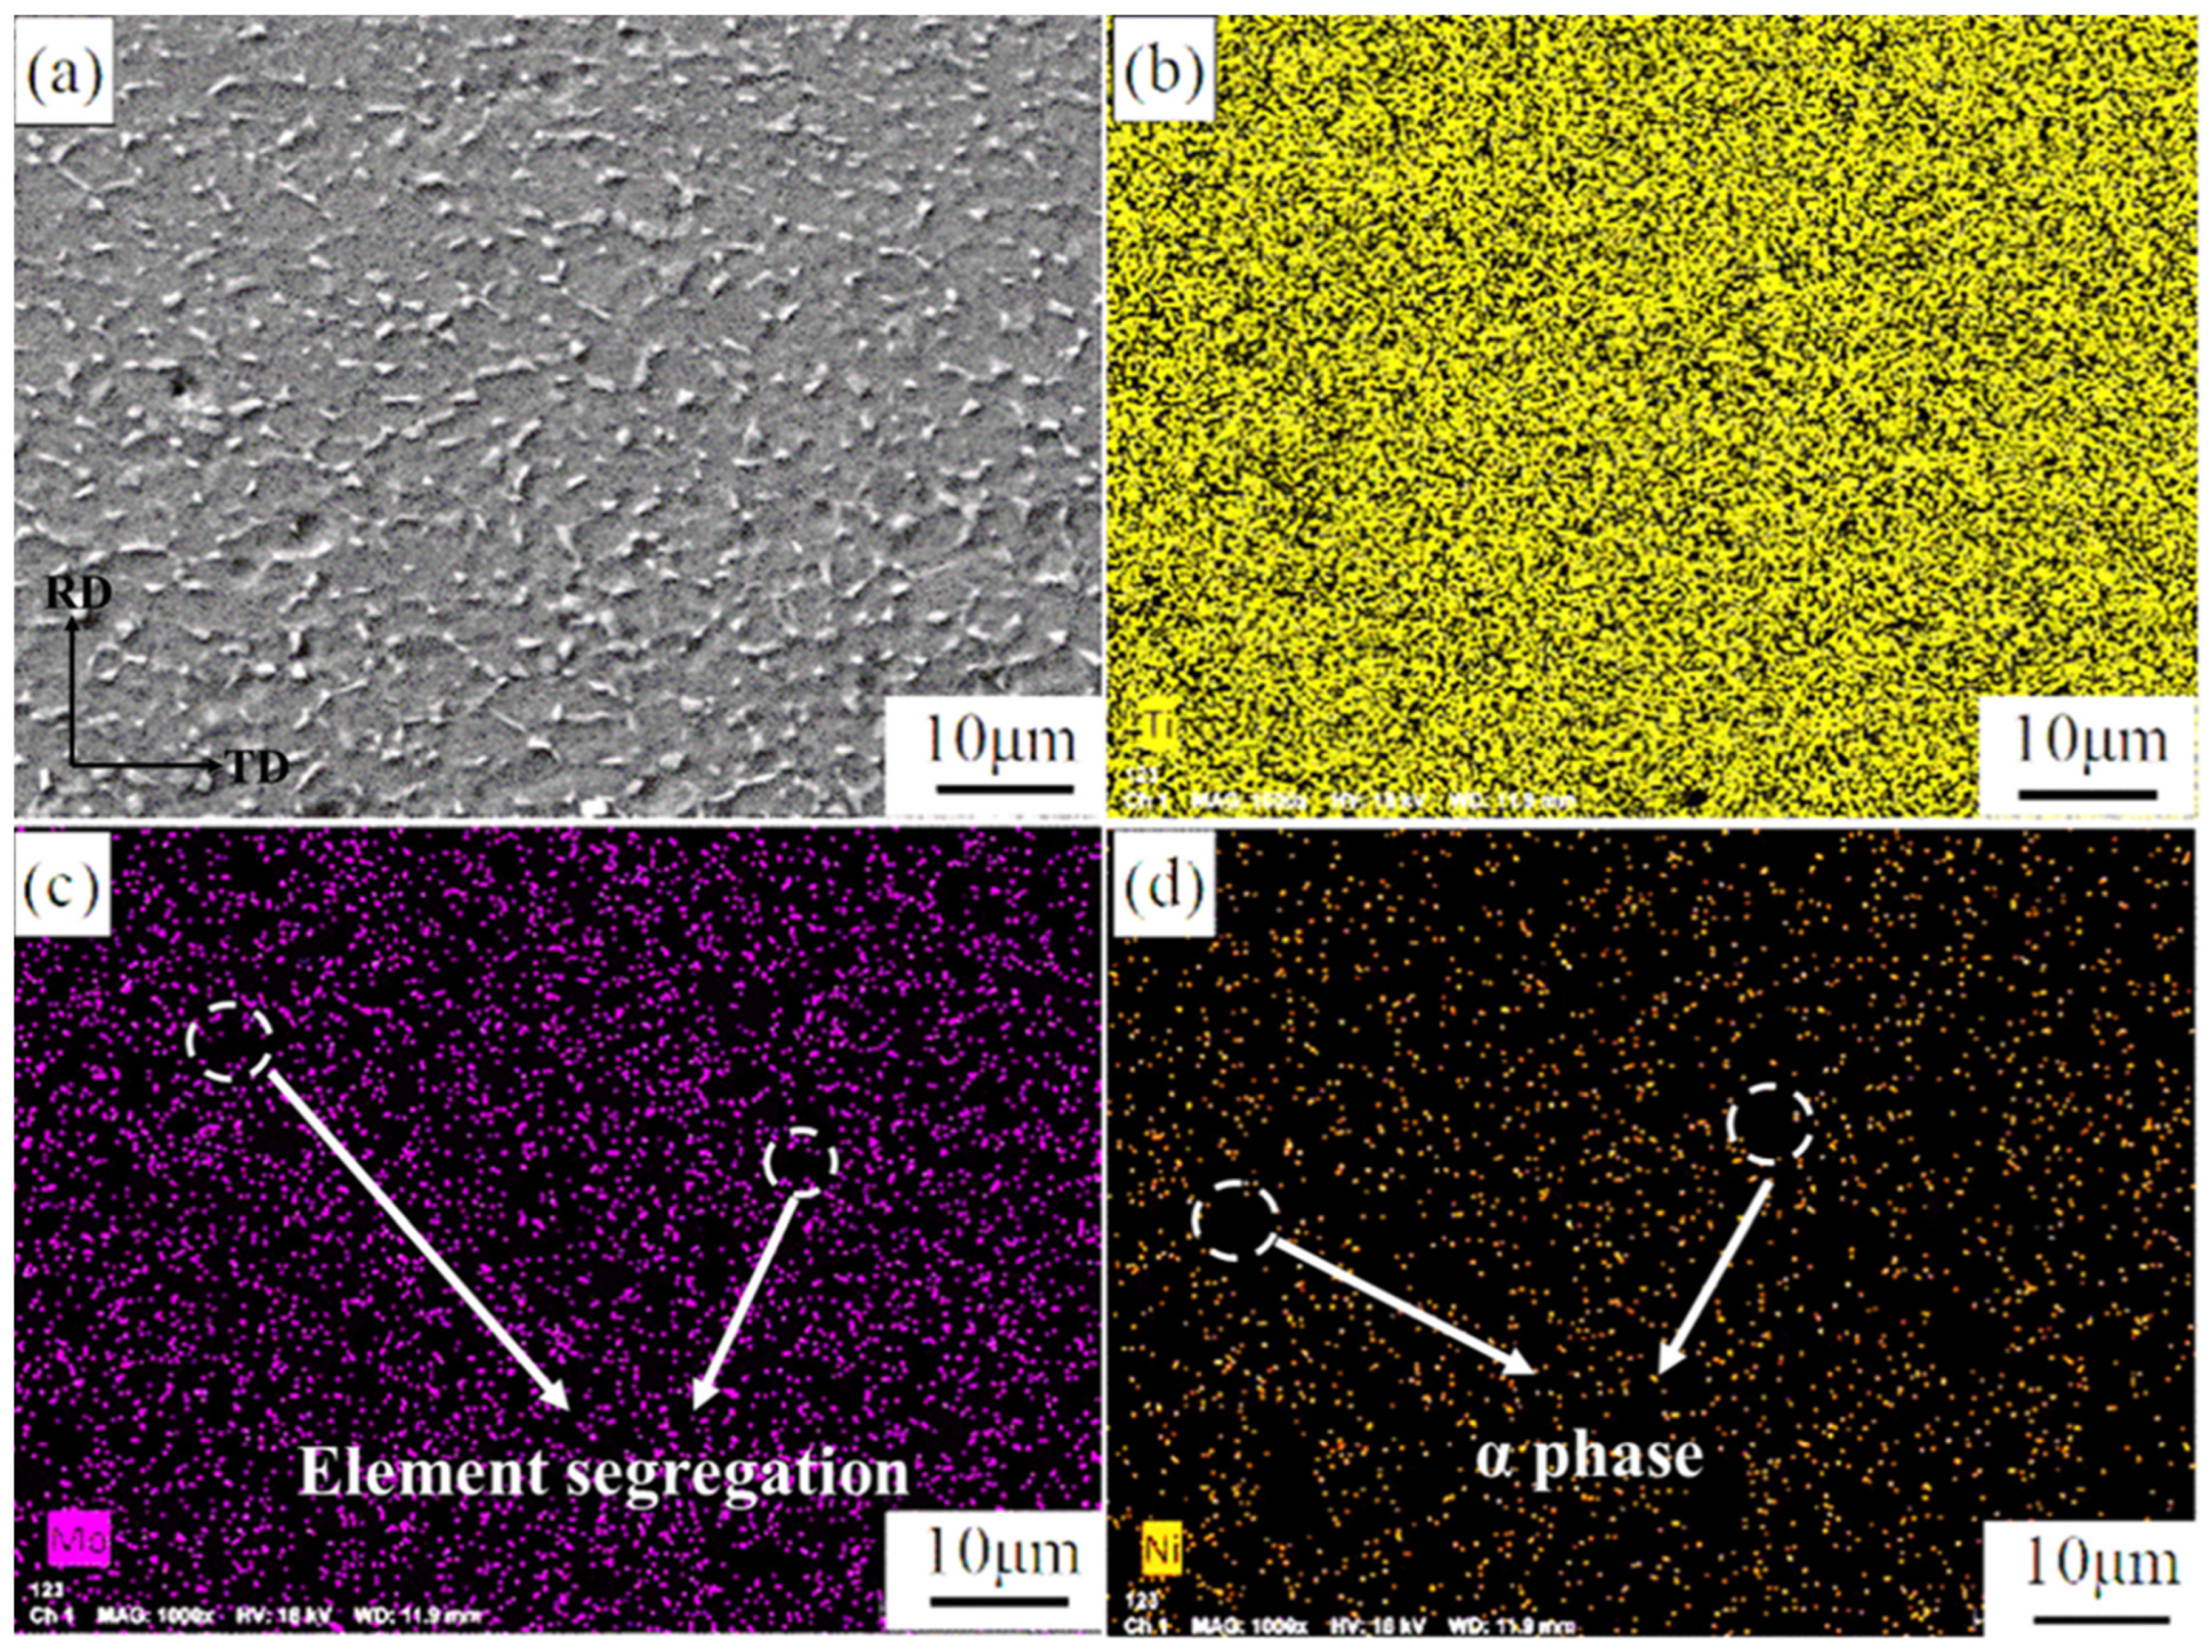
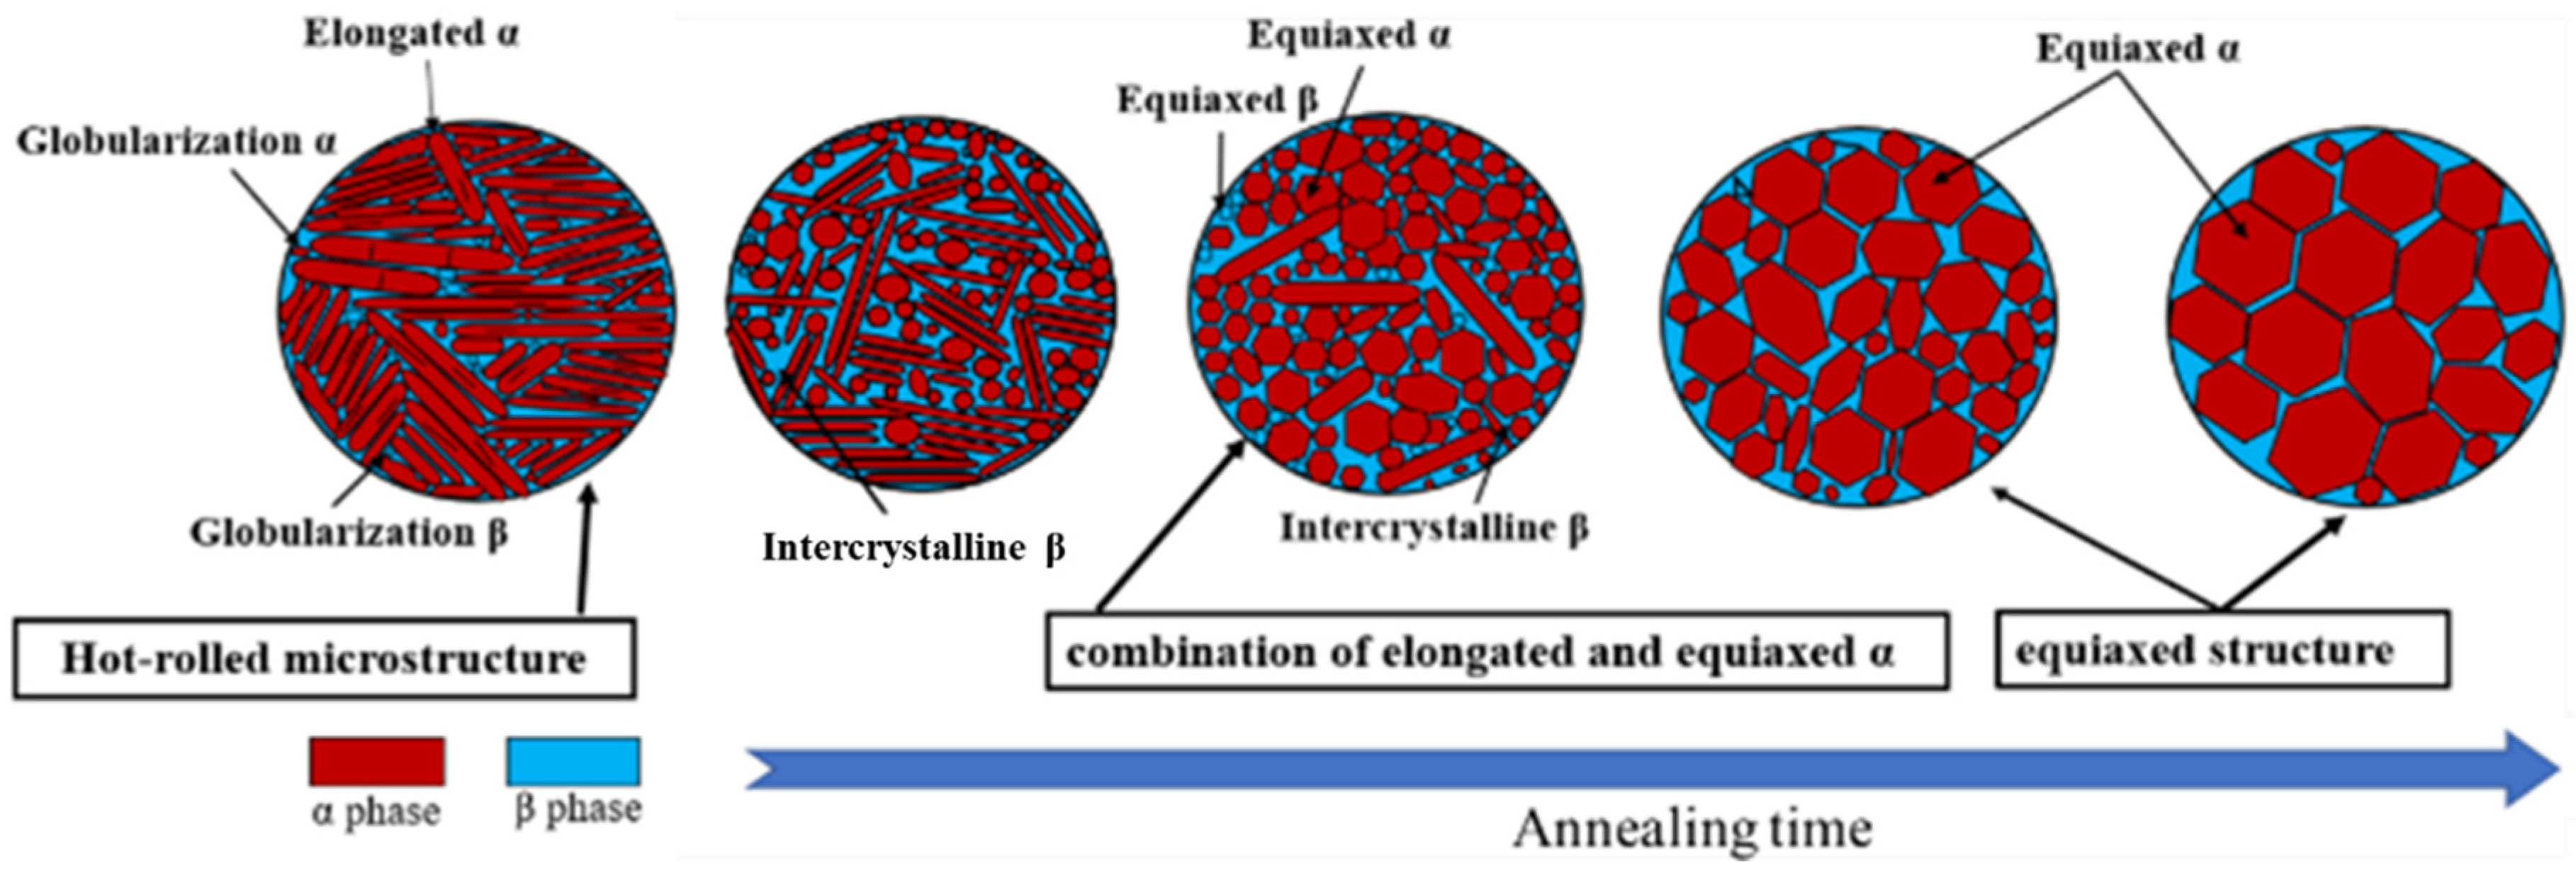
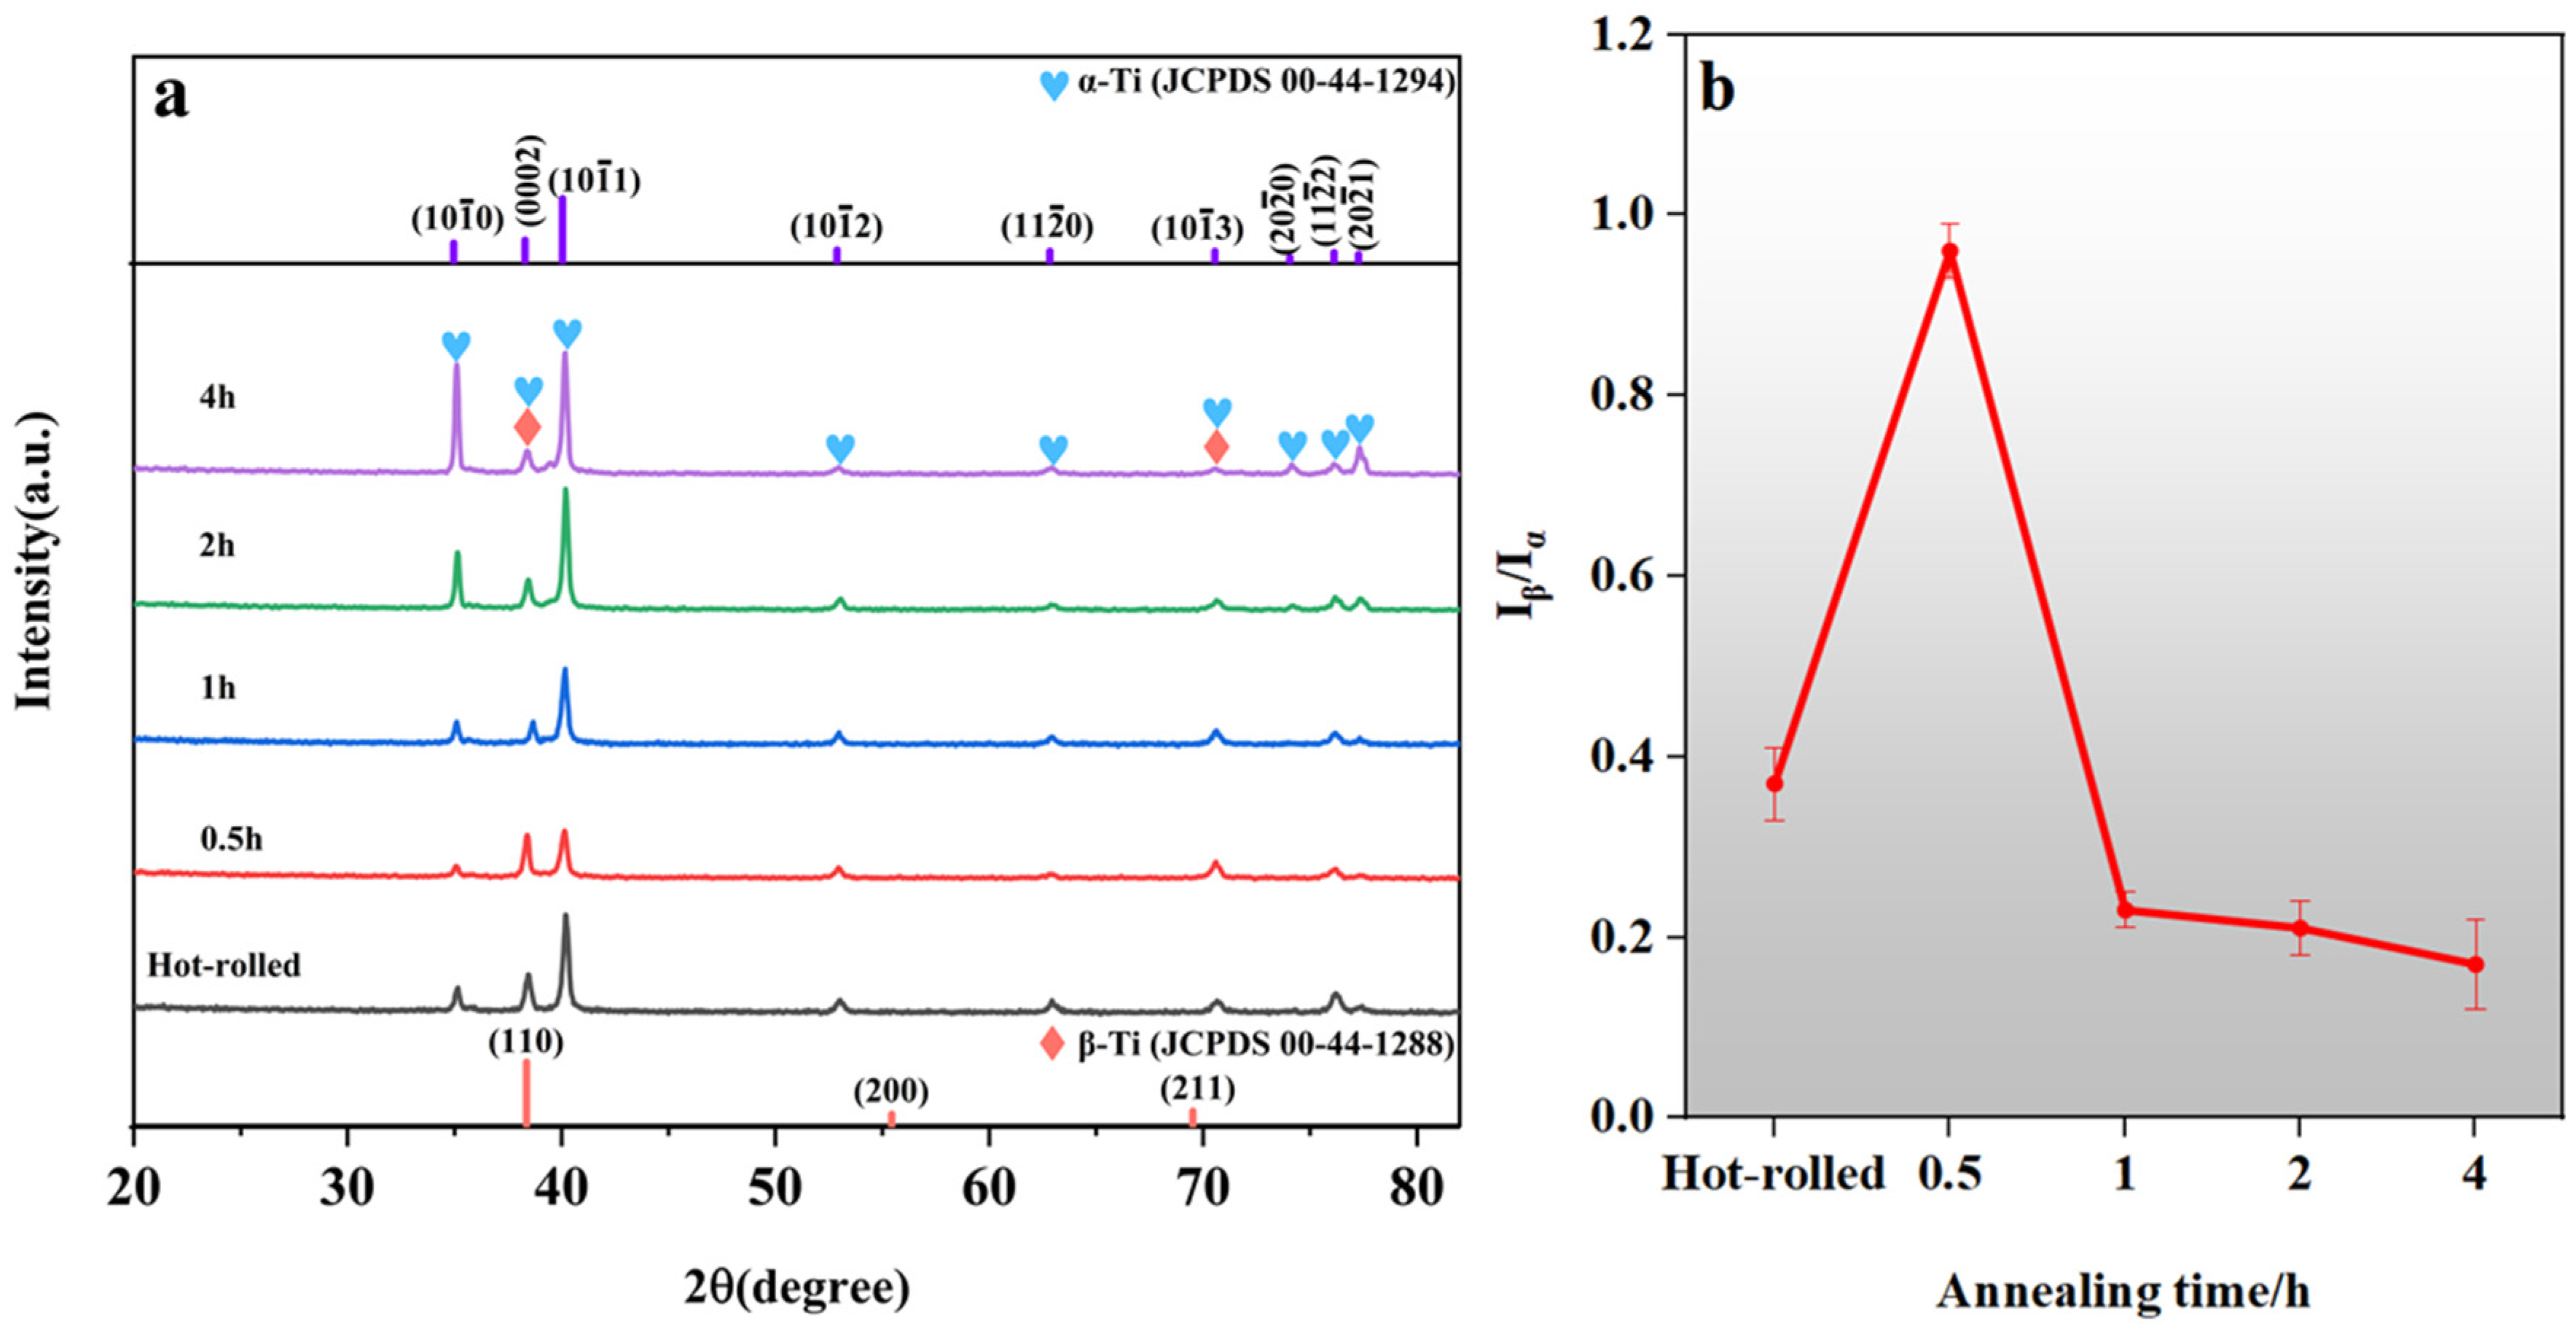
3.1. Microstructure of TA10 Alloy

Figure 2 shows the microstructure of hot-rolled TA10 alloy sheets. As shown in Figure 2a,b, the microstructure is dominated by α phase (gray area) with a small amount of β phase (black bar area) diffused. The calculation results of Image Pro software show that the volume fraction of the α phase is 84.7%. The structure of the α phase is dominated by crisscross strips with a length–width ratio greater than 10 without obvious regularity. Figure 2c shows the scanning electron microscope (SEM) microstructure of the rolling surface. The gray-black region is the α phase, and the gray-white thin bands are the β phase, which is dispersed in the α phase.
Figure 3 shows the microstructure of the cross-section of TA10 alloy annealed at 780 °C for different annealing times. Figure 3a and Figure 4a show the microstructure of the cross-section of TA10 alloy sheets after annealing at 780 °C for 0.5 h. It can be observed that there are still some rolling streamline and elongated α phases, indicating that there are still obvious deformation structures and obvious plastic deformation characteristics in the TA10 alloy. The grain size of the primary α phase was not uniform, and the β phase was dispersed among the primary α phases. In addition, a part of the primary α phase with an elliptic shape can be clearly observed in the microstructure, which indicates that a certain degree of recrystallization has occurred. Figure 3b and Figure 4b show the microstructure of the cross-section of TA10 alloy sheets after annealing at 780 °C for 1 h. It can be observed that the microstructure is composed of evenly distributed equiaxed α phase and a small amount of intergranular β phase. The results show that β phase content gradually decreased and α phase content gradually increased. The grain size of the equiaxed α phase is different, and the content of the α phase is 88.63% at an annealing temperature 780 °C for 1 h. Compared with the hot rolling microstructure, it increased by 3.88%. The thickness of sheets α phase in a hot rolling state widened from 1.17 μm to 4.14 μm when annealed at 780 °C for 0.5 h and tended to spheroidize gradually. The microstructure of annealing at 780 °C for 2 h is shown in Figure 3c and Figure 4c. It can be seen from Figure 4e that it is composed of an equiaxed α phase and intergranular β phase. After calculation, the grain size of the equiaxed α phase is 5.35 μm and the content of α phase is 92.73%. Compared with holding for 1h, the average grain size increases, and the size of the equiaxed α phase tends to be uniform. Figure 3d and Figure 4d show the microstructure of the cross-section of TA10 alloy sheets after annealing at 780 °C for 4 h. It can be seen from Figure 4e that the size of equiaxed α phase grain increases significantly, and the number of equiaxed small grains decreases, with the average grain size of 9.63 μm, indicating that the degree of recrystallization increases, accompanied by the absorption of small grains by large grains, and obvious grain coarsening occurs. The results show that when the annealing temperature is 780 °C, the driving force of recrystallization increases with the increase in annealing time, and the α and β grains have sufficient time for recrystallization. Therefore, the size of the equiaxed α phase gradually increased, and the size of the β phase dispersed between α phases increased. Static recrystallization takes place. The average grain size of the equiaxed α phase is 5.35 μm, and the α phase content is 93.18%.
Figure 5 shows the surface scanning energy spectrum of the cross-section of TA10 alloy annealed at 780 °C × 2 h. Compared with Figure 5a,b, it can be seen that the Ti element is uniformly distributed in the microstructure of TA10 alloy. The α and β phases in the structure are mainly composed of Ti element atoms. Comparing with Figure 5a,c, we can see that microscopically, Mo elements are concentrated at the grain boundaries of the α phase. Compared with Figure 5d, the distribution of Ni elements is the same as that of Mo elements. This phenomenon of element segregation is due to the static recrystallization of the alloy annealed at 780 °C—2h; however, there are some residual β phases between equiaxed α grains, and both Mo and Ni elements are β phase stable elements, so there is segregation of Mo and Ni elements between grains. The segregation of this element will affect the mechanical properties and corrosion resistance of TA10 alloy. Figure 6 shows the possible microstructure evolution of different annealing times at 780 °C. As can be seen from the figure, the microstructure under hot rolling conditions gradually changes from a long strip with a length–width ratio greater than 10 to an equiaxed shape through different annealing times. With the increase in annealing time, the transformation process can be roughly divided into three parts: incomplete recrystallization, complete recrystallization, and grain growth. The recrystallization driving force is enhanced, and the phenomenon of large grains absorbing small grains occurs when the annealing time is too long. With the increase in annealing time, the volume fraction of α phase decreases with the increase in the β phase dispersed between α phases.
Figure 7a shows the XRD patterns of TA10 alloy sheets at 780 °C for different annealing times. It can be seen the phase is composed of α/α’-Ti and β-Ti. The diffraction peak intensity of each phase of TA10 alloy under 780 °C × 4 h annealing process is significantly higher than that of the other three annealing processes, and the α phase peak ( 10 1 ¯ 0 ) is the most obvious, with little difference from the peak ( 10 1 ¯ 1 ) α phase peak height. The reason is that with the extension of annealing time, the grain is fully equiaxed, so it leads to the increase in its peak value. The diffraction peak intensity of α/α’ phase is the highest at about 40° ( 10 1 ¯ 1 ) , and due to the homogenization of the microstructure, the peak difference decreases with the extension of annealing time. By using Jada software calculation, the peak difference of 780 °C × 4 h was obviously smaller than other annealing processes, indicating that the grain coarsening and growth were consistent with the above metallographic structure. Figure 7b depicts that When annealed at 780 °C for 0.5 h, it has the highest β-phase content; it may be that the β phase is not decomposed into α phase in time due to the short annealing time. The peak intensity ratio (Iβ/Iα) decreases with the increase in annealing time, mainly due to the β → α phase transformation in sufficient time.
The results show that the equiaxed α phase increases gradually with the increase in annealing time. Due to the α→β phase transformation, the grain size gradually decreases. With the increasing annealing time, the β phase gradually grows. When annealed at 780 °C for 2 h, the microstructures of TA10 alloy sheets are the most uniform, and the microstructure is basically composed of fine equiaxed α phase.

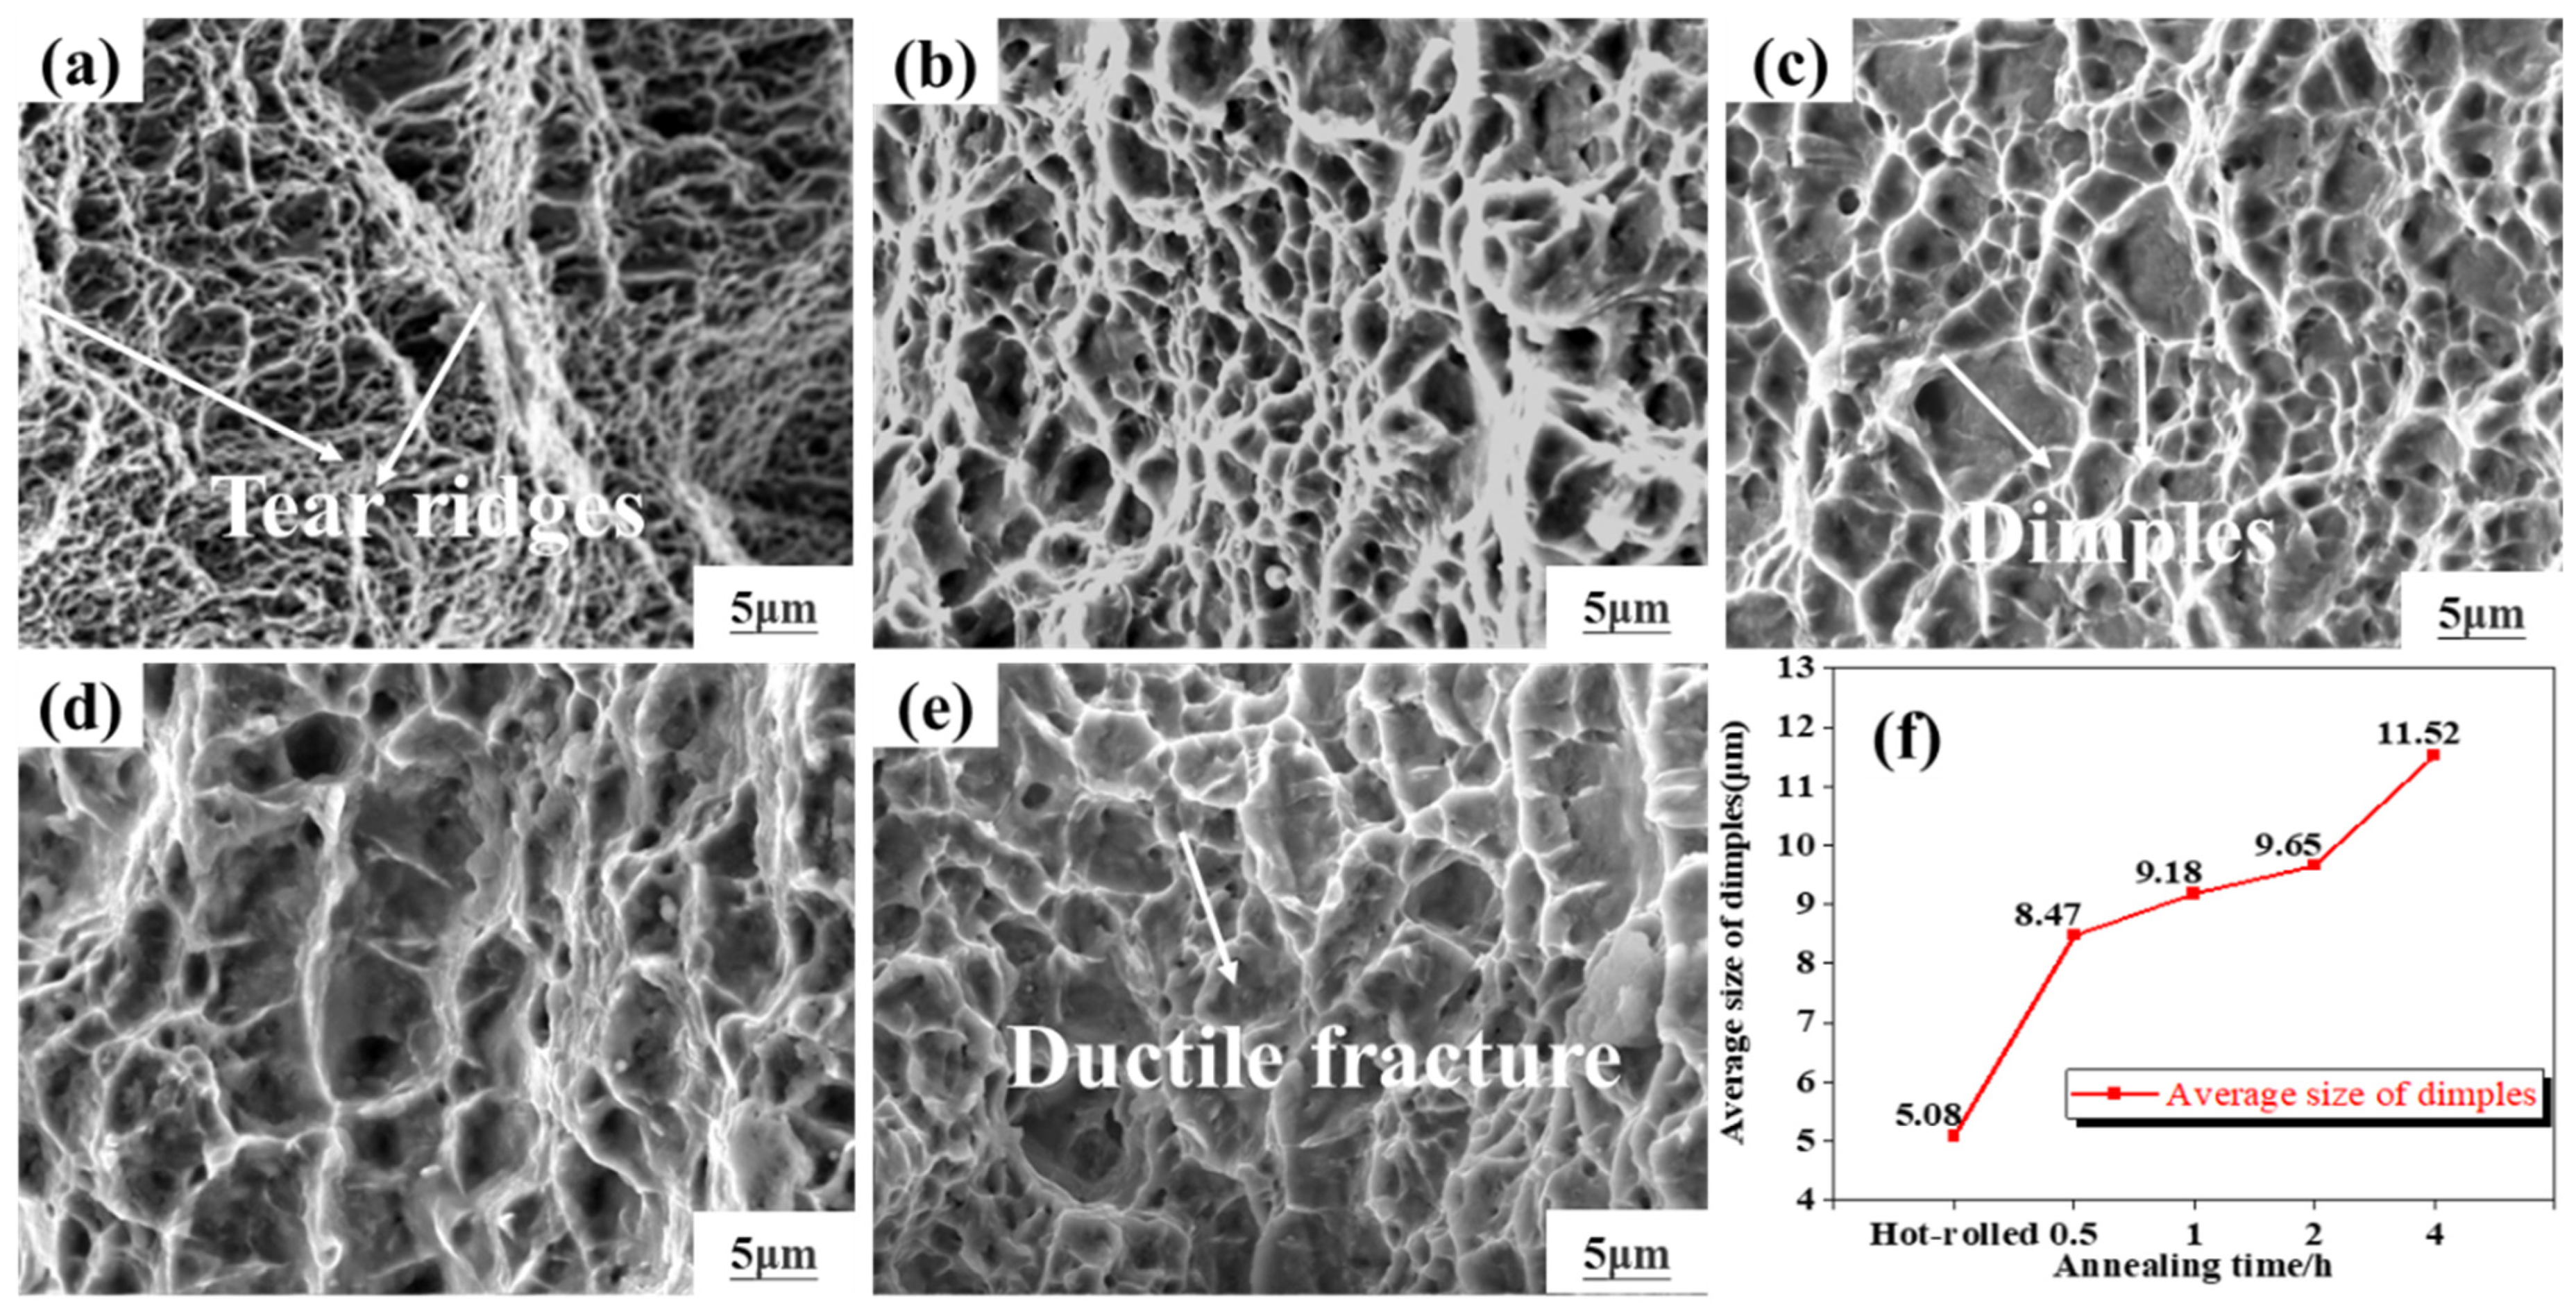
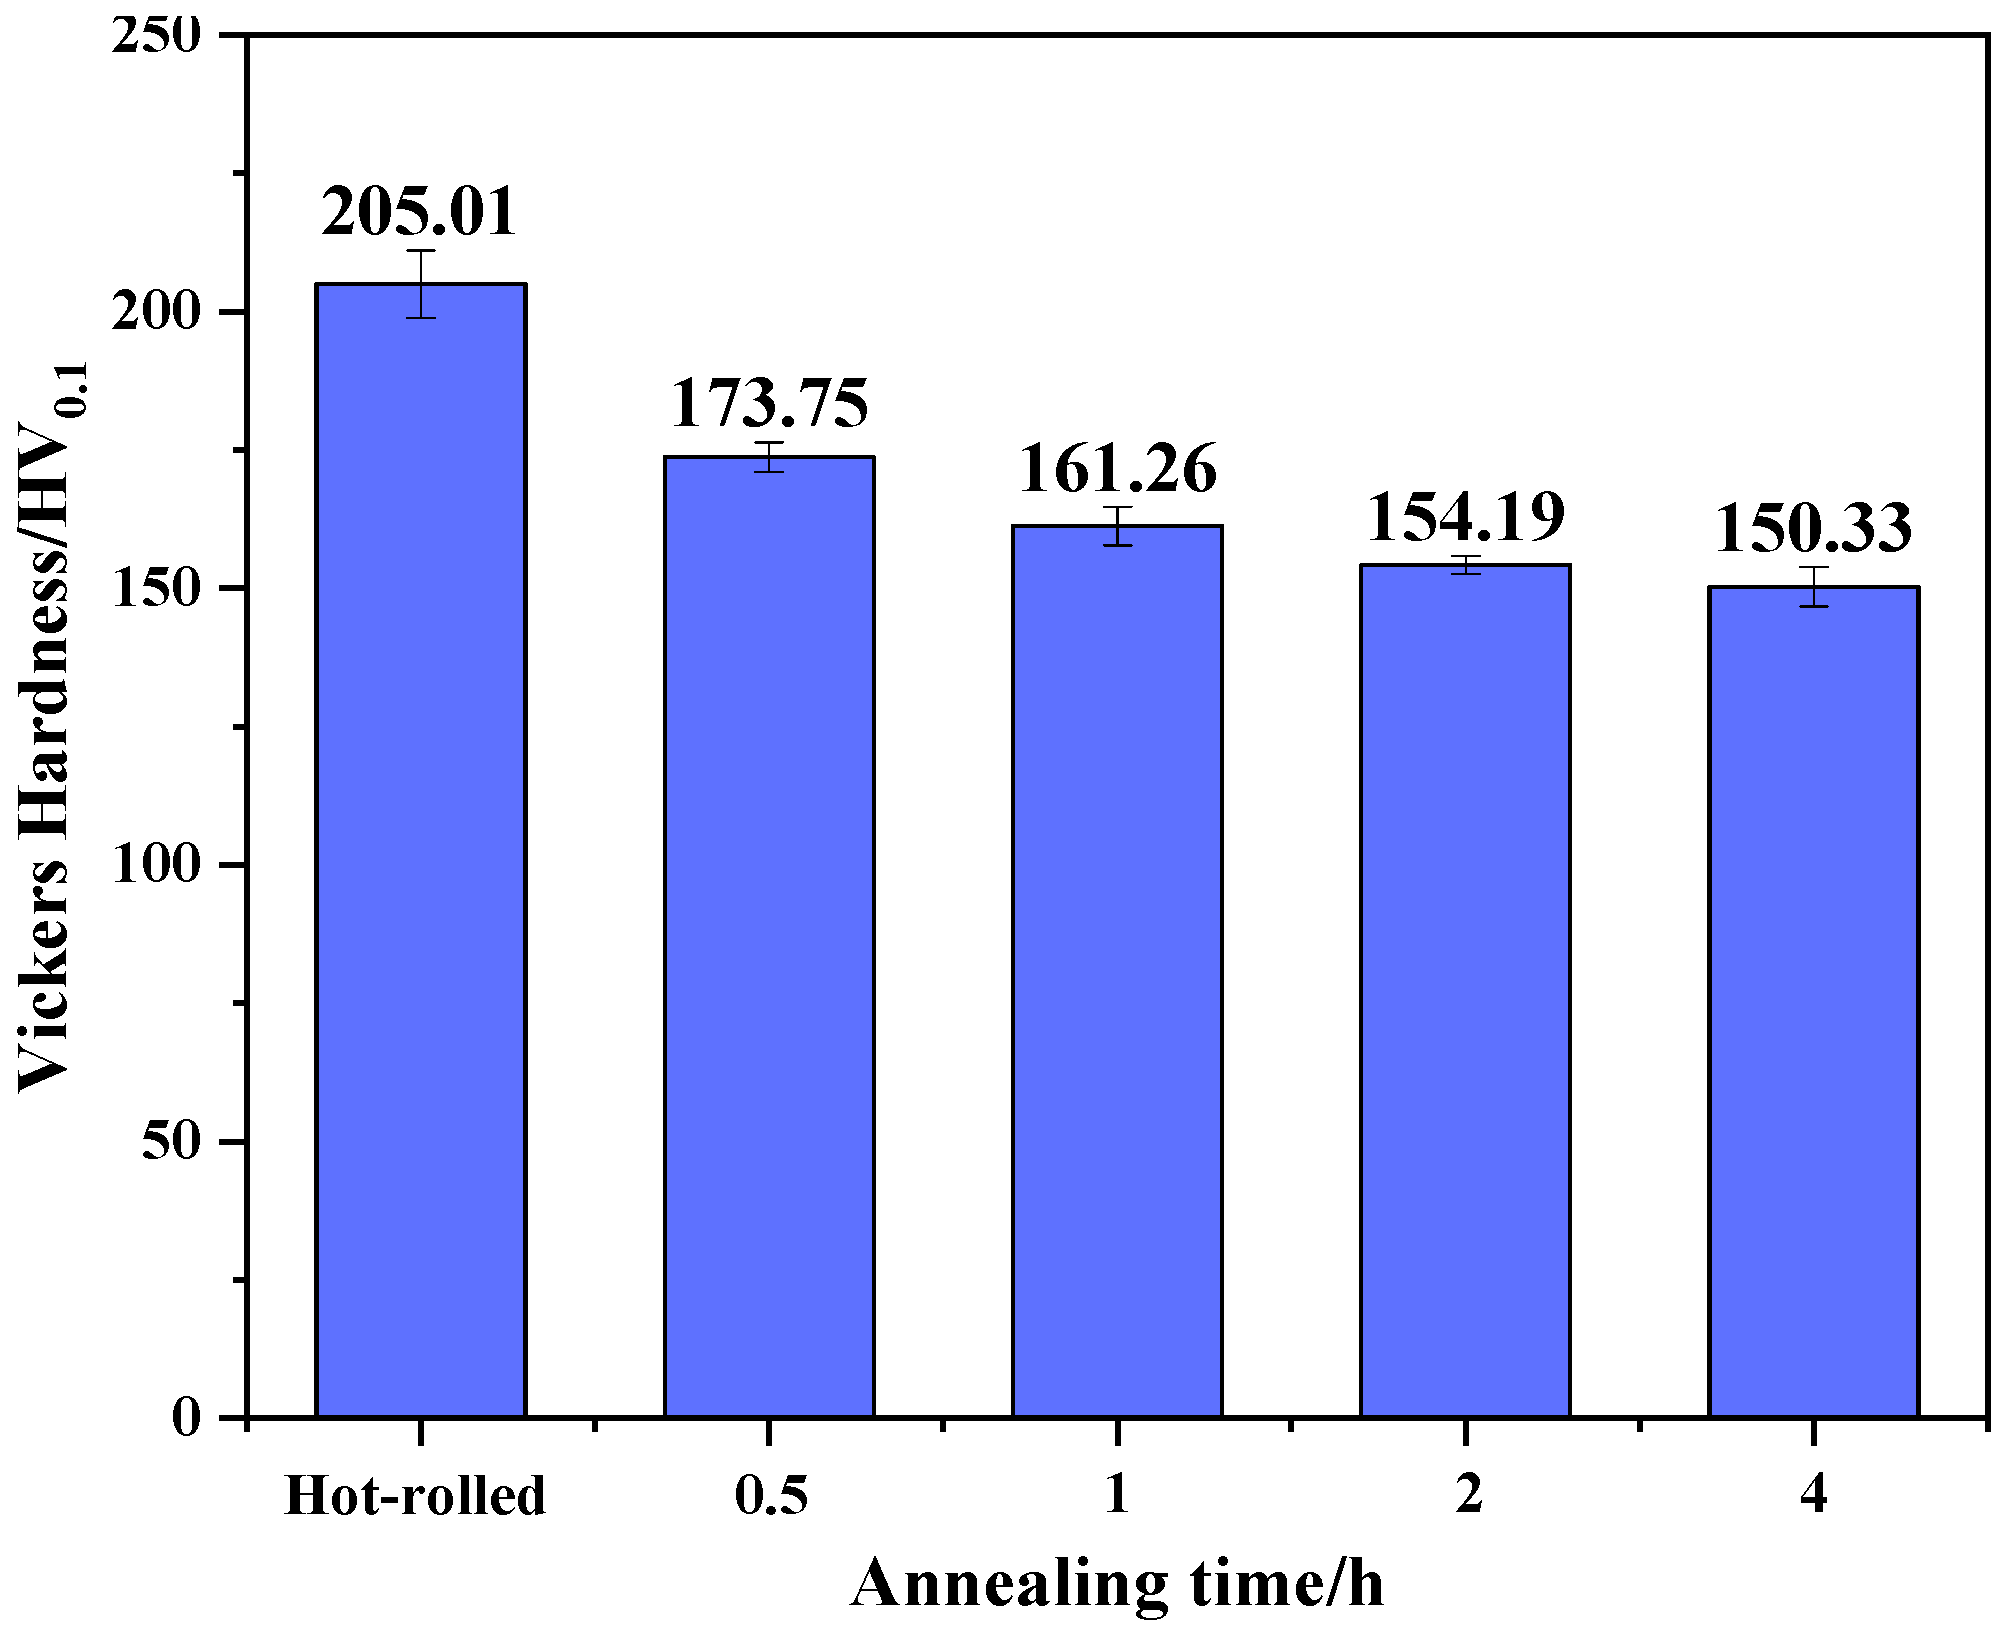
3.2. Mechanical Properties of TA10 Alloy

Figure 8a shows the tensile strength, yield strength, and elongation of TA10 alloy sheets at different annealing times. It can be seen from Figure 8 that the tensile strength of the sample annealed at 780 °C for different annealing times is lower than that of hot rolled, but the plasticity is higher than that of the hot rolled state. With the increase in annealing time, the tensile strength decreases, and the plasticity increases gradually. The reason for this phenomenon is because of the increase in annealing time; the recrystallization driving force is further enhanced. So, the degree of recrystallization is enhanced. The microstructure is equiaxed α phase. Compared with the microstructure of hot-rolled, the microstructure becomes more uniform and compact, the grain is more complete, and the degree of work hardening is eliminated to a certain extent. Figure 8b shows the stress–strain curves of TA10 alloy at 780 °C for different annealing times. The true stress–strain curves of all TA10 alloys show the characteristics of elastic-plastic stress–strain curves. Elastic deformation occurs first, and there is the obvious yield on the curve, and then uniform plastic deformation occurs under continuous external force loading. The tensile strength of specimens obtained from different annealing processes is lower than that of the hot-rolled state, while the plasticity is obviously improved, in which the elongation increases from 12.0% to 29.7%. With the extension of the annealing time, the strength decreased, elongation increased, and plasticity increased. The reasons are that the equiaxed α structures of the annealed sheets become more uniform and denser, the grains are more complete, and the internal stress is eliminated [12,22]. Through the analysis of comprehensive performance, when annealed at 780 °C for 2 h, and the tensile strength, yield strength, and elongation are 527.28 MPa,495.7 MPa, and 28.4%, respectively.
Figure 9 shows the fracture morphology of TA10 alloy hot-rolled sheets tensile specimens in RD direction under different annealing times (0.5–4 h) at 780 °C. It can be seen from Figure 9 that the fractures of the sample with different annealing times are composed of dimples of different sizes, all of which belong to ductile fracture. With the extension of the annealing time, the dimples at the fracture gradually become larger, and the larger dimples contain a few small dimples. Furthermore, the dimples gradually tend to be equiaxed in size. There were more small dimples at 0.5 h and 1 h, while large dimples and small dimples were interlaced and overlapped at 2 h. Figure 9 shows that the fracture dimples of 780 °C × 1 h are larger than those of 780 °C × 0.5 h, and the larger dimples contain a few small dimples, which are typical ductile fracture morphology. When the annealing time is 2 h and 4 h, the microstructure of the fracture is composed of many large and deep dimples, and the large dimples contain a few small dimples, which is typical ductile fracture morphology. Compared with the fracture dimples of these four-annealing time, the dimples of 780 °C × 4 h is the largest. The average size of fracture dimples is 11.52 μm at 780 °C × 4 h.
Figure 10 shows the Vickers hardness of TA10 alloy sheets at 780 °C for different annealing times. As can be seen from Figure 10, TA10 alloy sheets with an annealing process of 780 °C × 0.5 h had the highest Vickers hardness of 173.75 HV0.1. With the rise of annealing time, the Vickers hardness value decreases gradually (the Vickers hardness value for 1 h, 2 h, and 4 h: 161.26 HV0.1, 154.19 HV0.1, and 150.33 HV0.1, error range: ±8 HV0.1). The reason for the lower Vickers hardness is that with the extension of the annealing process, the degree of recrystallization increases, and the impact of work hardening gradually decreases. At the same time, the α-β phase transformation occurs, the area fraction of α phase decreases, and the hard α phase decreases, so the hardness decreases. By comparing the Vickers hardness value with the tensile properties mentioned above, it can be seen that with the increase in annealing time, the Vickers hardness value decreases gradually, which is consistent with the change law of tensile and yield strength, and contrary to the change law of elongation.

3.3. Recrystallization Analysis of TA10 Alloy

In order to investigate the recrystallization, grain boundary, and texture changes of the sheets after annealing treatment, the hot-rolled sheets and the best annealing time (2 h) were characterized by the EBSD test. Figure 11a,b show the recrystallization diagram of TA10 alloy sheets after hot rolling and annealing treatment. In these figures, blue is the fully recrystallized crystal nucleus, yellow is the substructure, and red is the deformed matrix. It can be seen from Figure 11a,b that after annealing, the recrystallized crystal nuclei and substructures of the sheets are significantly increased, and the deformation matrix structure is significantly reduced. Figure 11c shows the proportion of recrystallized crystal nucleus, substructure, and deformed matrix. Figure 11c shows that the recrystallized nuclei of hot-rolled sheets increased from 2.13% to 65.5%. The substructures of hot-rolled sheets increased from 19.4% to 28.46%. The deformation matrix structure of hot-rolled sheets decreased from 78.4% to 6.4%. After annealing at 780 °C for 2 h, the deformation matrix structure of the sheets disappeared, mainly consisting of recrystallized crystal nuclei and substructures. The reason for the recrystallization nucleation is that the recrystallization of TA10 alloy hot-rolled sheets occurred when the appropriate temperature and reasonable annealing time are reached in the annealing process, and the recrystallization driving force is strong under the annealing temperature and annealing time. During annealing treatment, a certain grain boundary penetrates into the grain with large residual strain, the deformation storage energy disappears, and many strain-free recrystallized nuclei are formed. Moreover, through the merger of grain boundaries or subgrain boundaries, a more recrystallized crystal nucleus is formed.

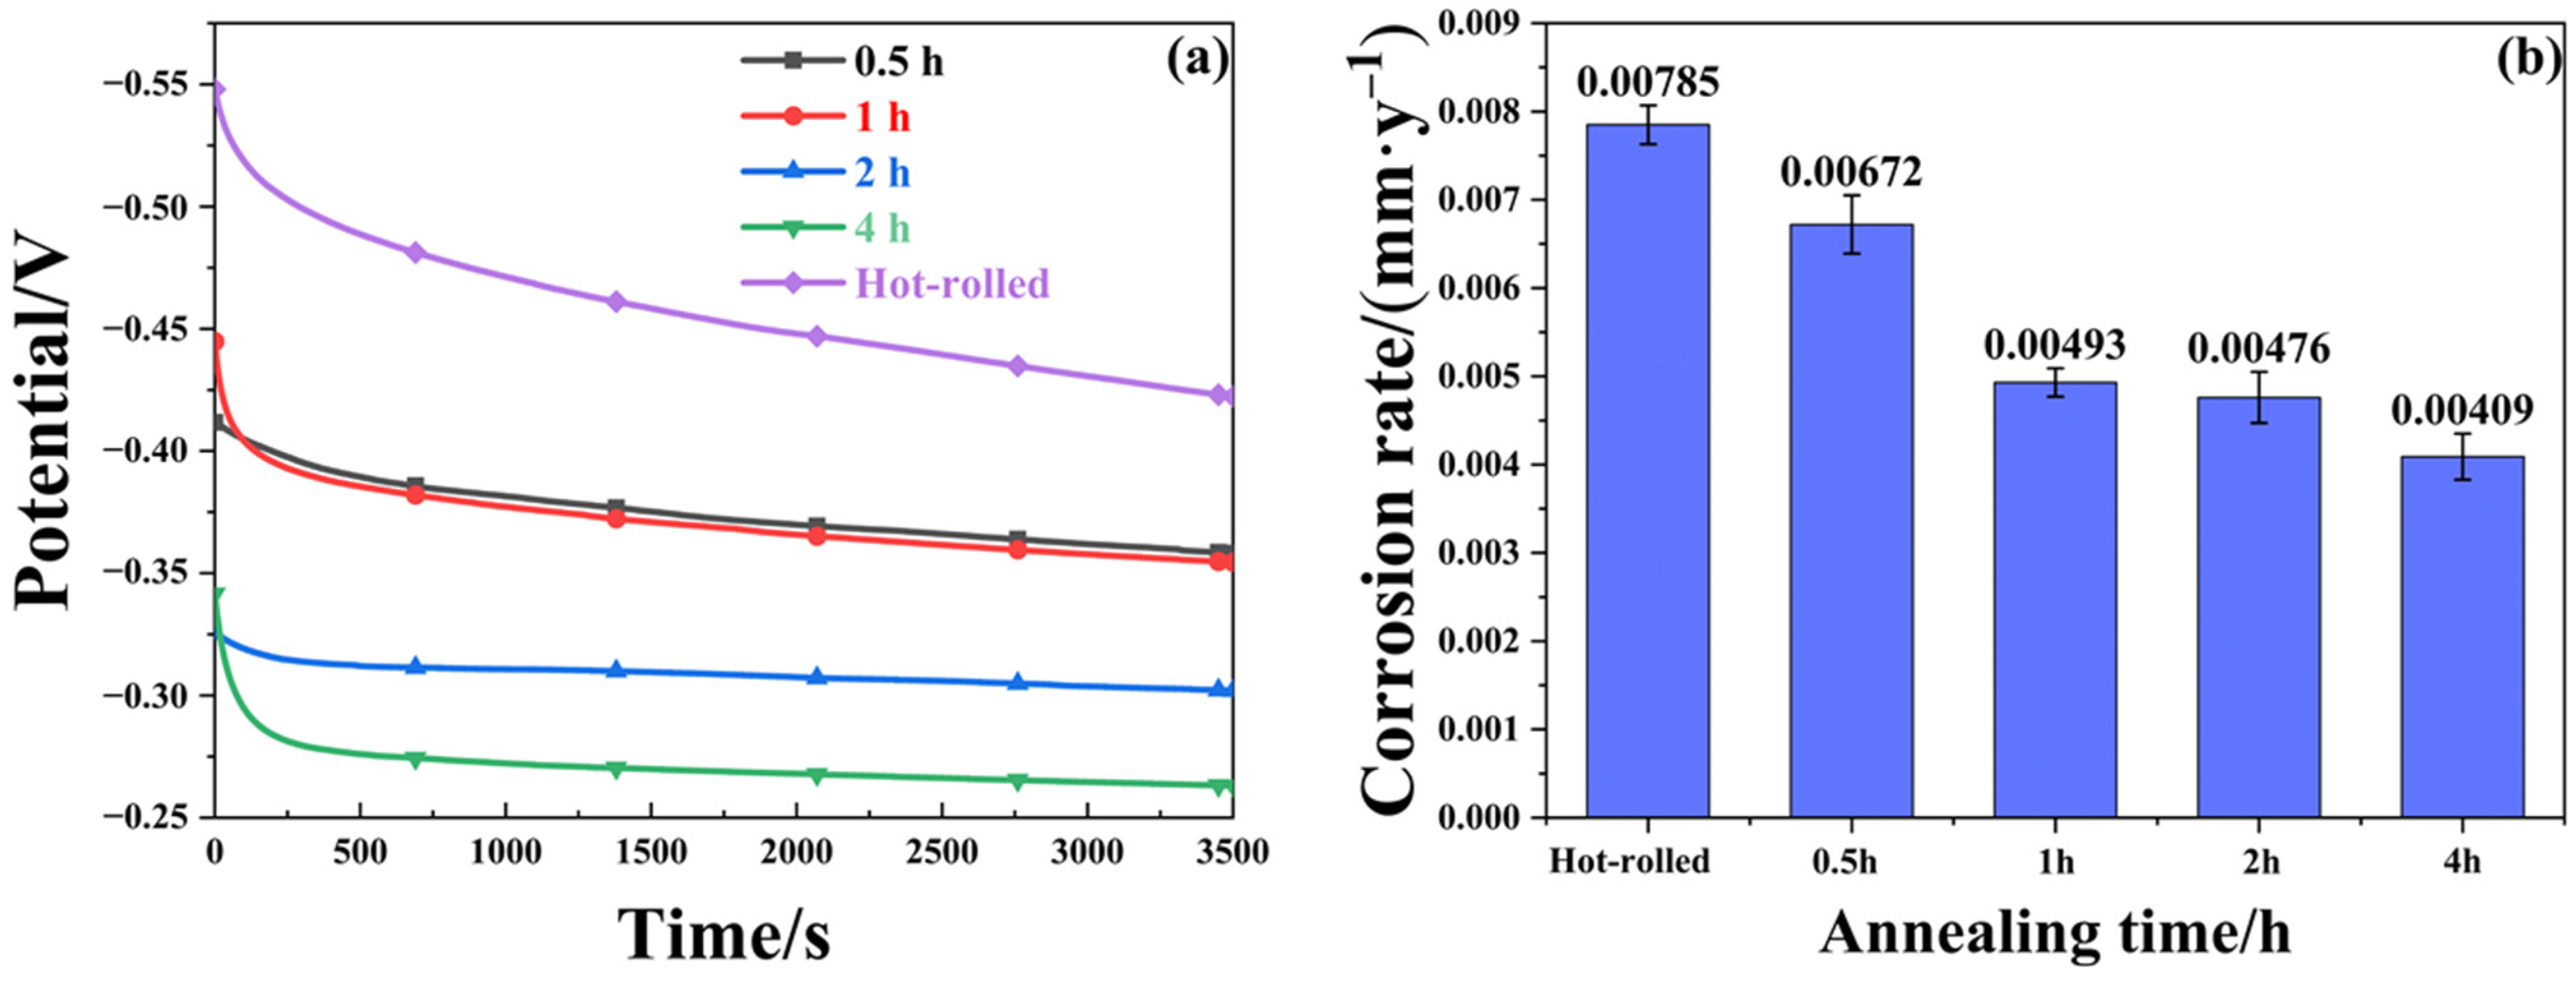
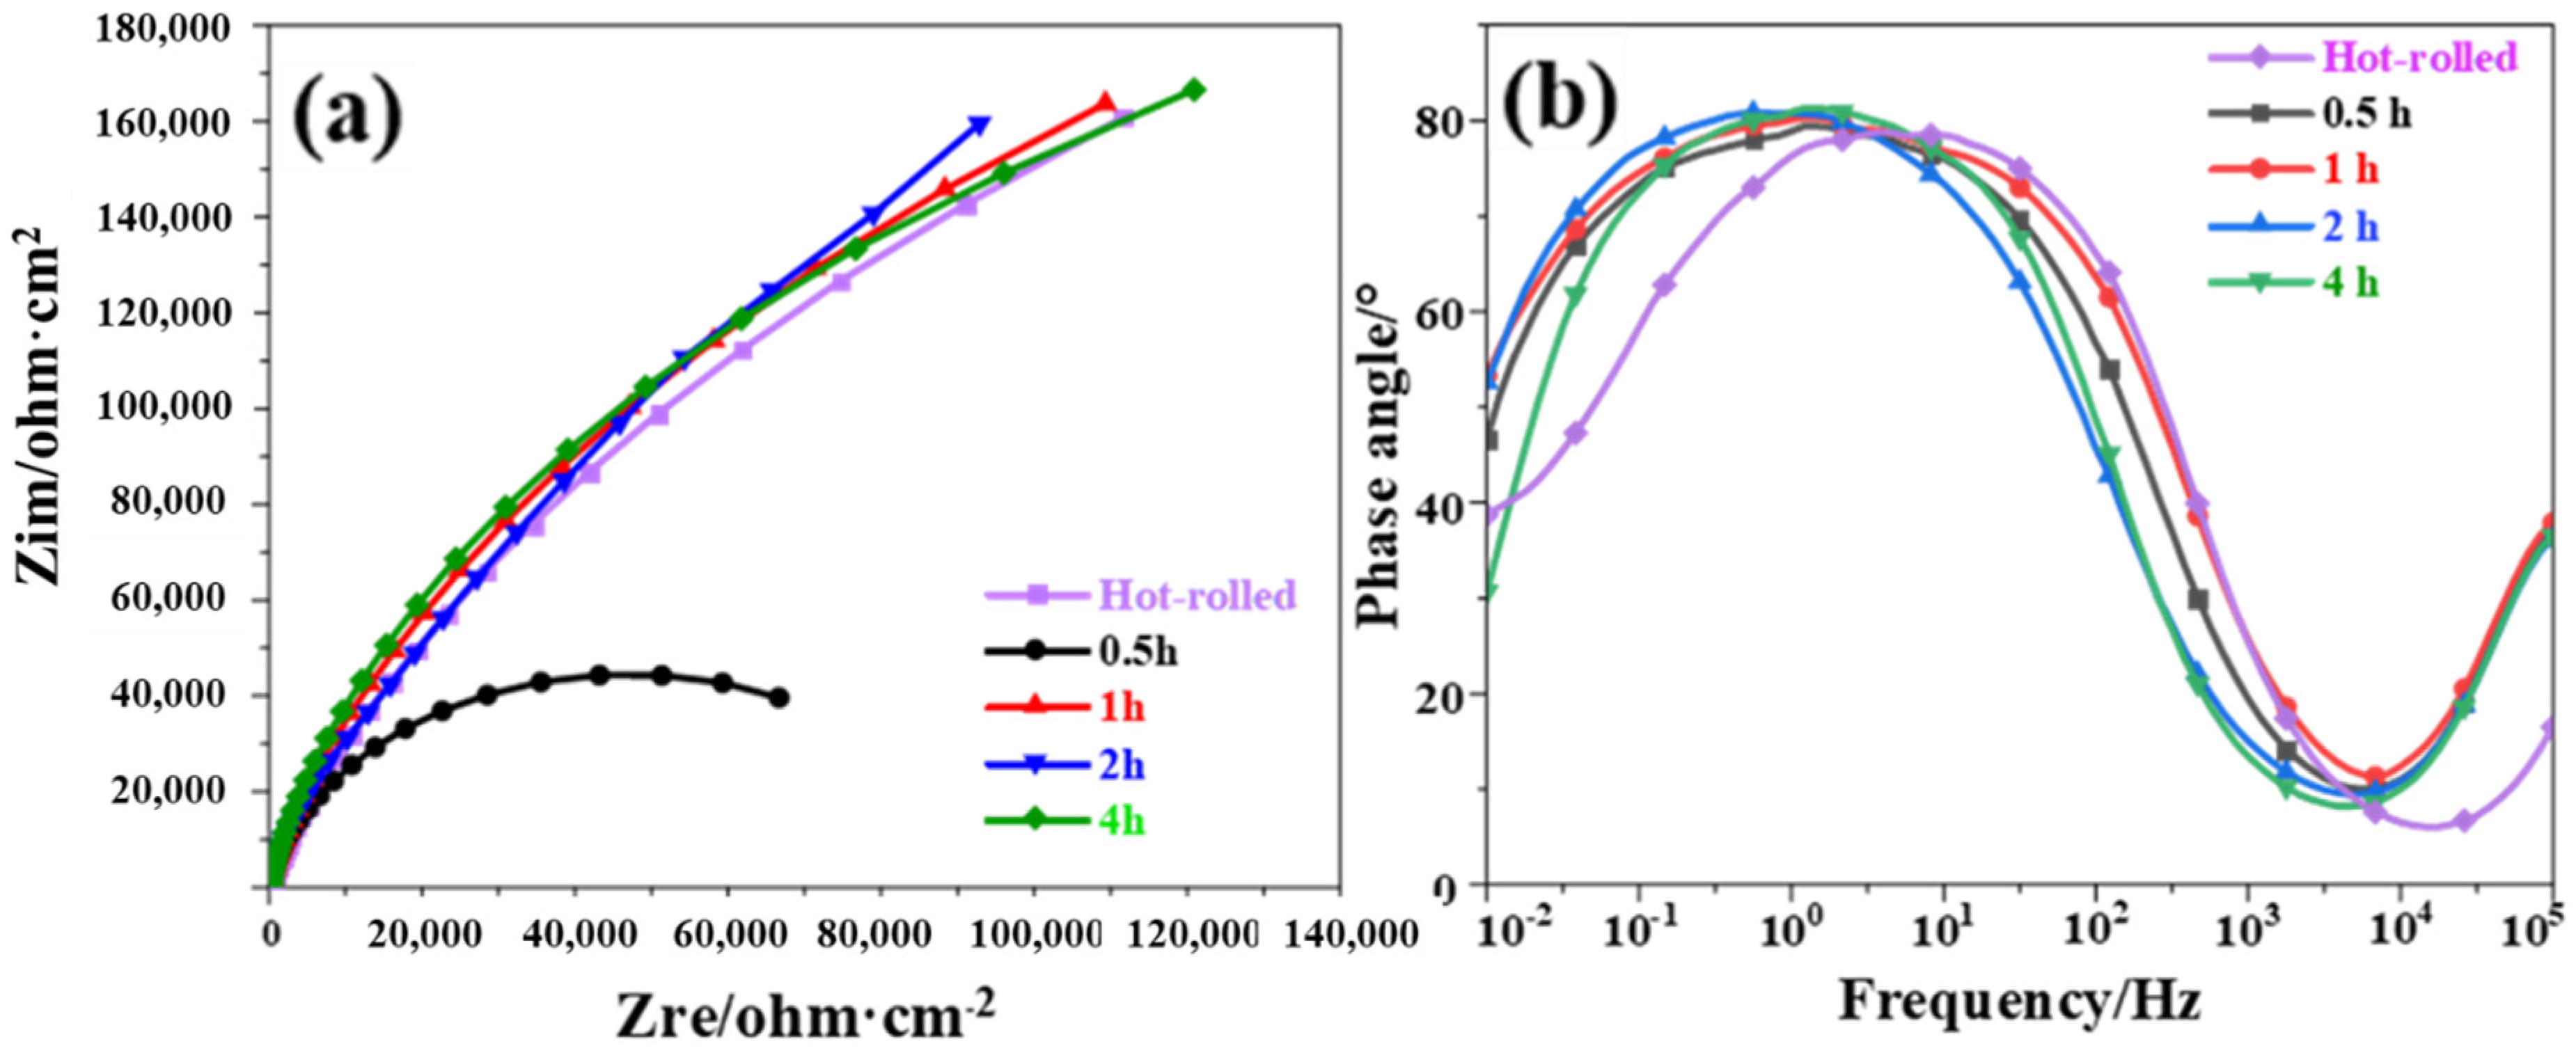
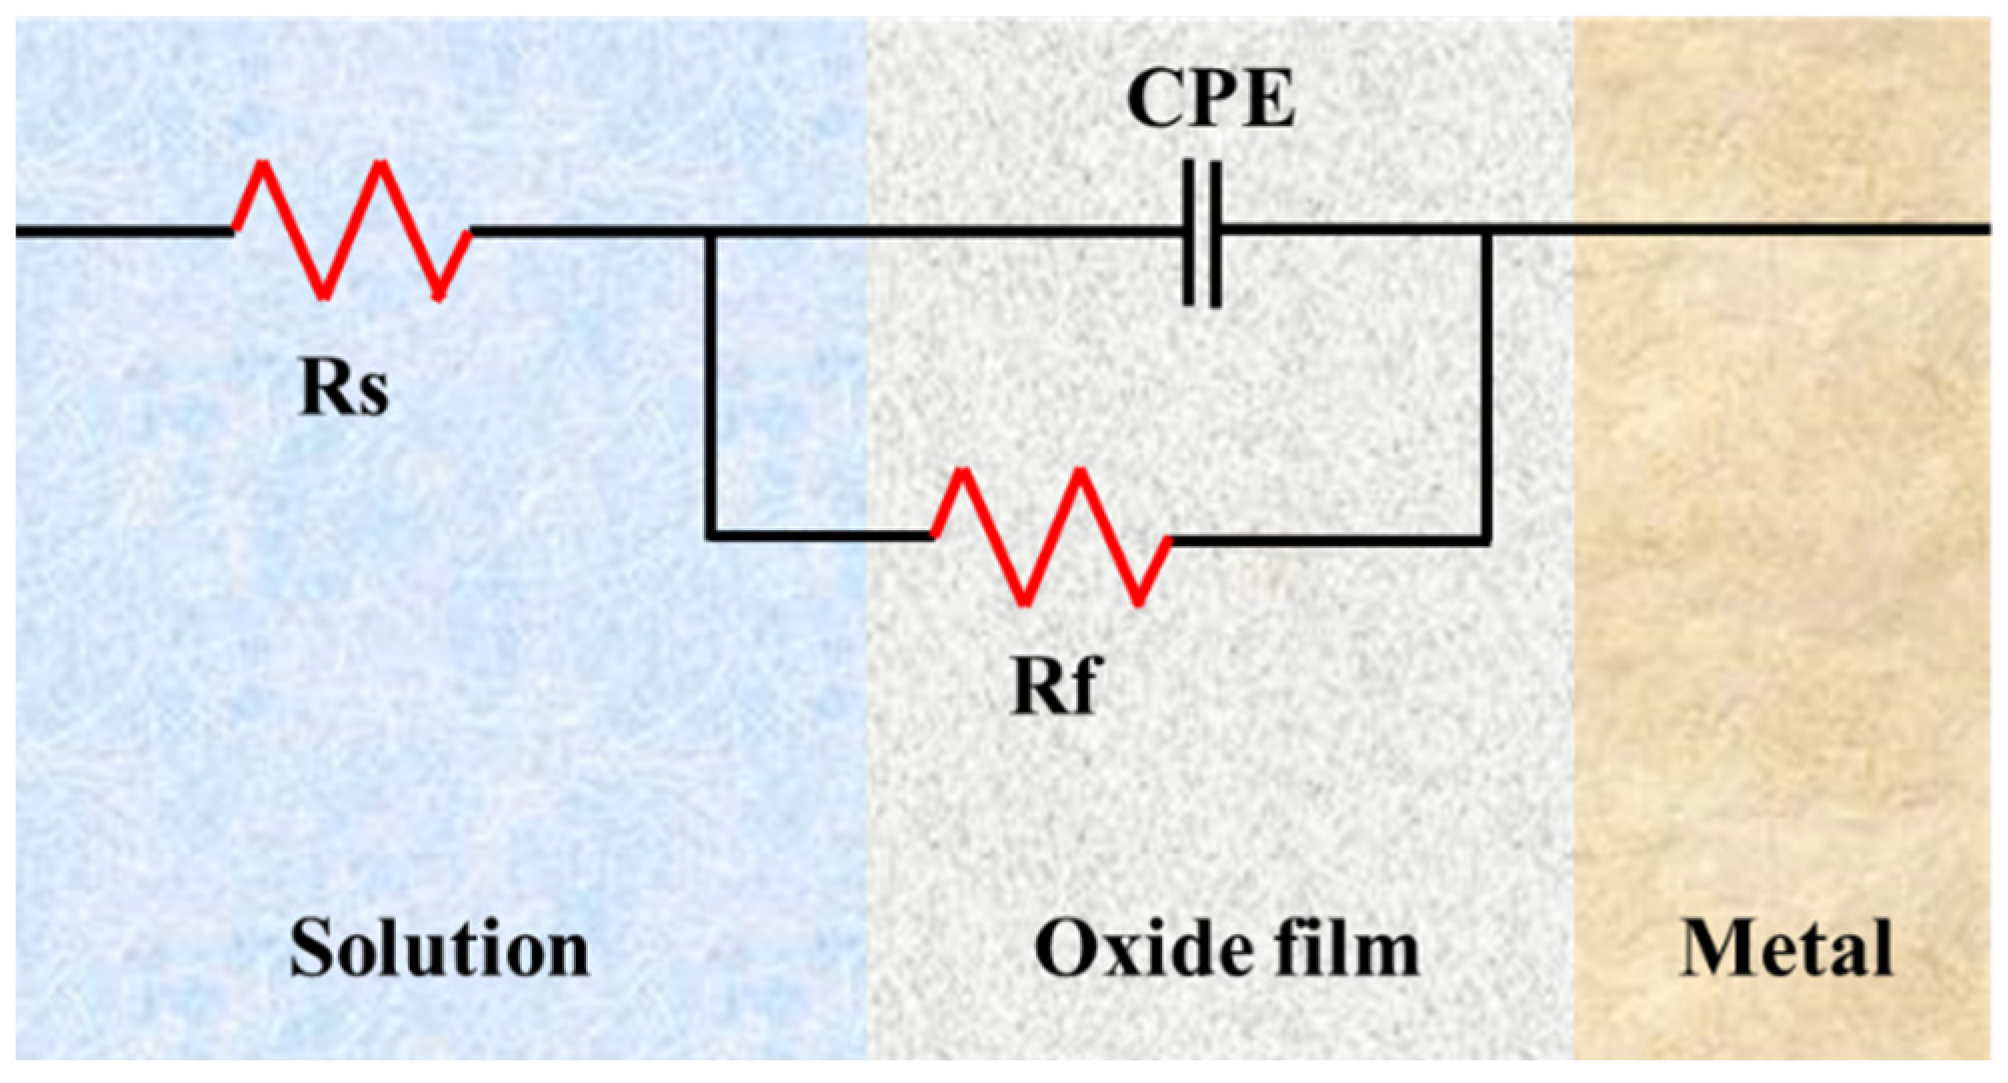
3.4. Electrochemical Properties of TA10 Alloy

Figure 12a shows the curve of OCP of TA10 alloy sheet in 3.5% NaCl solution with time after different annealing times at 780 °C. As shown in Figure 12a, the trends of the OCP variability are similar for the TA10 alloys treated with different thermal processing processes. At the initial stage of the potential test, the OCP curves showed a positive trend and decreased rapidly. With the extension of the test time, the change rate of the OCP curves gradually slowed down until it reached a relatively stable state at last. The OCP curves changed to the positive direction in the initial stage, indicating that the titanium alloy was in an active state at this time. It can be seen from Figure 12a that the OCP curves of TA10 alloy treated by different annealing times have a similar trend. It takes about 500 s to reach the potential stability state, and the activation time is short. However, the potential after stabilization is significantly different. When the OCP reaches stability, the OCP of hot rolled TA10 alloy is −0.3574 V, and the OCP of the alloy is −0.2628 V when the annealing process is 780 °C × 4 h. The potential of the alloy at 780 °C × 1 h and 780 °C × 2 h is −0.3539 V and −0.2982 V. The results show that when the annealing process is 780 °C × 4 h, the corrosion resistance of TA10 alloy is better than others, and the corrosion resistance of the alloy in the hot rolling state is the worst.
For uniform corrosion, the corrosion rate can be calculated using the following formula [23]:
R = 8.76 × 1 0 4 × W W t S T D
R is corrosion rate, mm/y; W is the sample quality before soaking, g. Wt is the sample quality after soaking, g. S is the total surface area of the sample, cm2. T is the test time, h. D is the density of the sample, g/cm3.
The corrosion rate of hot-rolled and TA10 alloy sheets with different annealing times (0.5–4 h) at 780 °C were calculated as shown in Figure 12b. It can be seen from Figure 12b that the corrosion rate of hot-rolled is the highest,0.00785 mm/y. When the annealing treatment was 780 °C × 0.5 h, the corrosion rate was 0.00672 mm/y. When the annealing treatment is 780 °C × 1 h and 780 °C × 2 h, the corrosion rates are 0.00493 mm/y and 0.00476 mm/y. The corrosion rate is the slowest when the annealing process is 780 °C × 4 h, which is 0.00409 mm/y. In conclusion, after annealing at 780 °C, the corrosion rate decreases gradually with the extension of the annealing time; this is because, with the prolongation of the annealing time, the grain size gradually increases, resulting in weakened intergranular corrosion, so the corrosion rate decreased.
Figure 13 shows the polarization curve of TA10 alloy in 3.5% NaCl after different annealing times. With the increase in potential, the current density increases rapidly first. When the potential is greater than −0.2 V, the increase in current density is inhibited, and the current enters the stable region. The reason is that the formation of a new passivation film on the surface of TA10 alloy has a protective effect on the alloy. When the formation and consumption rates of the new and initial passivation films reach a balance, the current density tends to be stable, which is consistent with the test results of OCP. It can be concluded from Table 2 that with the increase in annealing time, the corrosion potential increases from -0.482 V to −0.420 V, and the corrosion current density decreases from 1.734 μA/cm2 to 1.388 μA/cm2. The results show that the corrosion resistance of the material is enhanced kinetically and thermodynamically with the increase in annealing temperature. At the annealing temperature of 780 °C, with the extension of annealing time, the corrosion resistance of TA10 alloy is the worst at 780 °C × 0.5 h, while the corrosion resistance of TA10 alloy is the best at 780 °C × 4 h.
Since an equivalent circuit is used in order to determine the simulated values and compare them with experimental data, a CNLS (complex non-linear least squares) simulation is used, as previously reported [24,25,26] was carried out. Figure 14a is the Nyquist diagram of TA10 alloy in 3.5% NaCl after annealing at 780 °C for different annealing times. It can be seen from Figure 14a that TA10 alloy exhibits a typical single capacitor-reactance arc after being annealed at different annealing times. Therefore, all the oxide film structures on its surface are monolayer structures, which is caused by the formation of highly stable and compact oxide film on its surface [15]. According to the comparison in Figure 14a, the impedance map radius of TA10 alloy is the largest when the annealing process is 780 °C × 4 h, and the impedance map radius of TA10 alloy is the smallest when the annealing process is 780 °C × 0.5 h. This phenomenon is probably due to the difference in the microstructure of TA10 alloy after annealing at different temperatures, which is mainly manifested in the change of α and β phase content and grain size. Figure 14b shows the Bode diagram of TA10 alloy after hot rolling and annealing treatment at different annealing temperatures. As can be seen from Figure 14b, when the annealing process is 780 °C × 4 h, its phase angle is 81.3°, showing the best corrosion resistance. The phase angle is 79.4° when the annealing process is 780 °C × 0.5 h, showing the worst corrosion resistance. The phase angle of TA10 alloy at 780 °C × 1 h and 780 °C × 2 h is between the first two, 80.6° and 80.8°, respectively, indicating that the longer the annealing time, the better the corrosion resistance. The phase angle of TA10 alloy under different annealing times at 780 °C has only one peak, indicating that the surface of TA10 alloy is a single electric layer structure. The model curves in its Bode diagram are smooth and stable, with no obvious fluctuation in slope. The oxide film on its surface is uniform, compact, and complete, basically free of defects. This proves that when the annealing temperature is 780 °C, the corrosion process is uniform even if the annealing time is different.
Figure 15 is the impedance fitting circuit diagram. ZSimpWin software was used to fit the equivalent circuit of TA10 alloy after annealing treatment at 780 °C for different annealing times. Its equivalent circuit parameters are shown in Table 3. The bilayer layer on the metal interface has the ability to accumulate charge, but the corrosion process at the interface is complicated by structural defects and uneven surface roughness. Therefore, a constant phase element (CPE) must be used to compensate for the deviation from the ideal capacitor. The impedance of CPE can be calculated by the following formula [27,28]:
ZCPE = [Q()n]−1
Q is the CPE parameter; n is the CPE index related to surface roughness and the existence of defects; ω is the angular frequency, at which the imaginary part of the impedance is the largest; Rs is the resistance of the solution; The Rp value is mainly affected by the characteristics of passivation film of titanium alloy, the destruction of the passivation film is more difficult to occur. The corrosion resistance of the alloy increases with the increase of Rp.
The equivalent circuit of TA10 alloy is indicated that the corrosion reaction process of TA10 alloy in 3.5% NaCl is basically the same after different annealing times. The different parameters of each element in the equivalent circuit indicate that after annealing treatment with different annealing times, the reaction speed of TA10 alloy in 3.5% NaCl is different, so the corrosion resistance is different. The parameters of each component after fitting are shown in Table 3.
As can be seen from Table 3, after annealing at different times, the Rp value of TA10 alloy is much higher than Rs, indicating that the corrosion resistance of TA10 alloy mainly comes from the protection of the passivation film. The damage severity of NaCl on TA10 alloy passivation film decreased with Rp value, which makes the alloy exhibit poor corrosion resistance. Therefore, when the annealing process is 780 °C × 4 h, it shows the best corrosion resistance, while when the annealing process is 780 °C × 0.5 h, the corrosion resistance is the worst.

4. Conclusions

With the increase in annealing time, the equiaxed α phase increases gradually, the grain size increases, the strength of the sheets decreases, and the plasticity improves. When annealed at 780 °C for 2 h, TA10 alloy sheets have the best performance, the microstructures of TA10 alloy sheets are basically composed of fine equiaxed α phase.
With the increase in annealing time, the best mechanical properties were obtained when annealed at 780 °C for 2 h, and the Vickers hardness, tensile strength, yield strength, and elongation are 154.19 HV0.1, 527.28 MPa, 495.7 MPa, and 28.4%, respectively.
With the increase in annealing time, grain size increases, the number of grain boundaries decreases, and the nucleation location of the passivation film decreases. When annealed at 780 °C for 4 h, TA10 alloy sheets exhibit the best corrosion resistance. With the increase in annealing time, the corrosion kinetics and thermodynamics enhance the corrosion resistance of the alloy.

Author Contributions

H.X. and R.Z. conceived the idea and set the research direction. H.H. and Y.X. provided the experimental material level method. K.L., H.Z., M.X. and Z.H. characterized the material properties. K.L. and H.X. analyzed the data and drafted the manuscript. Discussed and edited the manuscript with H.X., K.L., H.Z. and Z.H. reconfirmed the microstructure and mechanical properties of the experimental materials. H.X. supervised the work. All authors have read and agreed to the published version of the manuscript.

Funding

Yunnan Provincial Major Science and Technology Special Plan of China, No. 202202AB080016.

Data Availability Statement

Not applicable.

Acknowledgments

This work was supported by the Yunnan Provincial Major Science and Technology Special Plan of China (No. 202202AB080016).

Conflicts of Interest

The authors declare that they have no conflict of interest.

References

  1. Wang, D.; Fan, Q.; Cheng, X.; Zhou, Y.; Shi, R.; Qian, Y.; Wang, L.; Zhu, X.; Gong, H.; Chen, K.; et al. Texture evolution and slip mode of a Ti-5.5Mo-7.2Al-4.5Zr-2.6Sn-2.1Cr dual-phase alloy during cold rolling based on multiscale crystal plasticity finite element model. J. Mater. Sci. Technol. 2022, 111, 76–87. [Google Scholar] [CrossRef]
  2. Prakash, D.L.; Honniball, P.; Rugg, D.; Withers, P.; da Fonseca, J.Q.; Preuss, M. The effect of β phase on microstructure and texture evolution during thermomechanical processing of α + β Ti alloy. Acta Mater. 2013, 61, 3200–3213. [Google Scholar] [CrossRef]
  3. Gornakova, A.S.; Straumal, A.B.; Khodos, I.I.; Gnesin, I.B.; Mazilkin, A.A.; Afonikova, N.S.; Straumal, B.B. Effect of composition, annealing temperature, and high pressure torsion on structure and hardness of Ti-V and Ti-V-Al alloys. J. Appl. Phys. 2019, 125, 082522. [Google Scholar] [CrossRef]
  4. Huang, T.-D.; Wu, S.-Y.; Jiang, H.; Lu, Y.-P.; Wang, T.-M.; Li, T.-J. Effect of Ti content on microstructure and properties of TixZrVNb refractory high-entropy alloys. Int. J. Miner. Met. Mater. 2020, 27, 1318–1325. [Google Scholar] [CrossRef]
  5. Javadinejad, H.R.; Shin, G.; Lee, H.; Choi, M.-S.; Park, J.; Yoon, J.; Kim, J.H. Origin of surface ridging in Ti-6Al-4V sheets produced by pack rolling and its effect on microstructural and mechanical properties. J. Mater. Process. Technol. 2021, 297, 117228. [Google Scholar] [CrossRef]
  6. Li, Z.; Li, C.; Qiu, S.; Wang, D.; Guo, T. Biological evaluation of TAMZ alloy implanted surgically. Rare Met. Mater. Eng. 1998, 27, 59–62. [Google Scholar]
  7. Sun, Z.; He, G.; Meng, Q.; Li, Y.; Tian, X. Corrosion mechanism investigation of TiN/Ti coating and TC4 alloy for aircraft compressor application. Chin. J. Aeronaut. 2020, 33, 1824–1835. [Google Scholar] [CrossRef]
  8. Sandenbergh, R.; Van der Lingen, E. The use of Tafel back extrapolation to clarify the influence of ruthenium and palladium alloying on the corrosion behaviour of titanium in concentrated hydrochloric acid. Corros. Sci. 2005, 47, 3300–3311. [Google Scholar] [CrossRef]
  9. Santhy, K.; Kumar, K.H. Thermodynamic assessment of Mo-Ni-Ti ternary system by coupling first-principle calculations with CALPHAD approach. Intermetallics 2010, 18, 1713–1721. [Google Scholar] [CrossRef]
  10. Shoesmith, D.; Noël, J.; Annamalai, V. Corrosion of titanium and its alloys. Ref. Modul. Mater. Sci. Mater. Eng. 2016, 3, 2042–2052. [Google Scholar] [CrossRef]
  11. Luo, S.; Yao, J.; Zou, G.; Li, J.; Jiang, J.; Yu, F. Transformation characteristics of temperature and phases within Ti-6Al-4V aeroengine drum in hot forging and air cooling procedures. J. Mater. Res. Technol. 2020, 9, 8235–8244. [Google Scholar] [CrossRef]
  12. Davari, N.; Rostami, A.; Abbasi, S.M. Effects of annealing temperature and quenching medium on microstructure, mechanical properties as well as fatigue behavior of Ti-6Al-4V alloy. Mater. Sci. Eng. A 2017, 683, 1–8. [Google Scholar] [CrossRef]
  13. Wang, K.; Wu, M.; Yan, Z.; Li, D.; Xin, R.; Liu, Q. Microstructure evolution and static recrystallization during hot rolling and annealing of an equiaxed-structure TC21 titanium alloy. J. Alloys Compd. 2018, 752, 14–22. [Google Scholar] [CrossRef]
  14. Vrancken, B.; Thijs, L.; Kruth, J.-P.; Van Humbeeck, J. Heat treatment of Ti6Al4V produced by Selective Laser Melting: Microstructure and mechanical properties. J. Alloys Compd. 2012, 541, 177–185. [Google Scholar] [CrossRef] [Green Version]
  15. Su, B.; Luo, L.; Wang, B.; Su, Y.; Wang, L.; Ritchie, R.O.; Guo, E.; Li, T.; Yang, H.; Huang, H.; et al. Annealed microstructure dependent corrosion behavior of Ti-6Al-3Nb-2Zr-1Mo alloy. J. Mater. Sci. Technol. 2021, 62, 234–248. [Google Scholar] [CrossRef]
  16. Meng, K.; Guo, K.; Yu, Q.; Miao, D.; Yao, C.; Wang, Q.; Wang, T. Effect of annealing temperature on the microstructure and corrosion behavior of Ti-6Al-3Nb-2Zr-1Mo alloy in hydrochloric acid solution. Corros. Sci. 2021, 183, 109320. [Google Scholar] [CrossRef]
  17. Wang, Z.; Hu, H.; Zheng, Y.; Ke, W.; Qiao, Y. Comparison of the corrosion behavior of pure titanium and its alloys in fluoride-containing sulfuric acid. Corros. Sci. 2016, 103, 50–65. [Google Scholar] [CrossRef]
  18. Osório, W.R.; Freitas, E.S.; Garcia, A. EIS and potentiodynamic polarization studies on immiscible monotectic Al–In alloys. Electrochim. Acta 2013, 102, 436–445. [Google Scholar] [CrossRef]
  19. Osório, W.R.; Peixoto, L.C.; Moutinho, D.J.; Gomes, L.G.; Ferreira, I.L.; Garcia, A. Corrosion resistance of directionally solidified Al–6Cu–1Si and Al–8Cu–3Si alloys castings. Mater. Des. 2011, 32, 3832–3837. [Google Scholar] [CrossRef]
  20. Zhang, X.; Jiang, Z.; Yao, Z.; Song, Y.; Wu, Z. Effects of scan rate on the potentiodynamic polarization curve obtained to determine the Tafel slopes and corrosion current density. Corros. Sci. 2009, 51, 581–587. [Google Scholar] [CrossRef]
  21. McCafferty, E. Validation of corrosion rates measured by the Tafel extrapolation method. Corros. Sci. 2005, 47, 3202–3215. [Google Scholar] [CrossRef]
  22. Gil, F.J.; Ginebra, M.-P.; Manero, J.M.; Planell, J.A. Formation of α-Widmanstätten structure: Effects of grain size and cooling rate on the Widmanstätten morphologies and on the mechanical properties in Ti6Al4V alloy. J. Alloys Compd. 2001, 329, 142–152. [Google Scholar] [CrossRef]
  23. Yang, Y.; Xia, C.; Feng, Z.; Jiang, X.; Pan, B.; Zhang, X.; Ma, M.; Liu, R. Corrosion and passivation of annealed Ti–20Zr–6.5Al–4V alloy. Corros. Sci. 2015, 101, 56–65. [Google Scholar] [CrossRef]
  24. Duarte, T.; Meyer, Y.A.; Osório, W.R. The Holes of Zn Phosphate and Hot Dip Galvanizing on Electrochemical Behaviors of Multi-Coatings on Steel Substrates. Metals 2022, 12, 863. [Google Scholar] [CrossRef]
  25. Meyer, Y.A.; Bonatti, R.S.; Bortolozo, A.D.; Osório, W.R. Correction to: Electrochemical behavior and compressive strength of Al-Cu/xCu composites in NaCl solution. J. Solid State Electrochem. 2021, 25, 2455. [Google Scholar] [CrossRef]
  26. Meyer, Y.A.; Menezes, I.; Bonatti, R.S.; Bortolozo, A.D.; Osório, W.R. EIS Investigation of the Corrosion Behavior of Steel Bars Embedded into Modified Concretes with Eggshell Contents. Metals 2022, 12, 417. [Google Scholar] [CrossRef]
  27. Hamadou, L.; Aïnouche, L.; Kadri, A.; Yahia, S.A.A.; Benbrahim, N. Electrochemical impedance spectroscopy study of thermally grown oxides exhibit-ing constant phase element behaviour. Electrochim. Acta 2013, 113, 99–108. [Google Scholar] [CrossRef]
  28. Sotniczuk, A.; Kuczyńska-Zemła, D.; Królikowski, A.; Garbacz, H. Enhancement of the corrosion resistance and mechanical properties of nanocrystalline titanium by low-temperature annealing. Corros. Sci. 2019, 147, 342–349. [Google Scholar] [CrossRef]
Figure 1. (a) DSC and DDSC curve of TA10 alloy; (b) experimental process.
Metals 13 00566 g001
Figure 2. Microstructure of hot-rolled TA10 alloy sheets: (a) longitudinal section; (b) cross-section; (c) SEM.
Metals 13 00566 g002
Figure 3. OM images of annealed TA10 alloy at different times (a) 0.5 h, (b) 1 h, (c) 2 h, and (d) 4 h.
Metals 13 00566 g003
Figure 4. SEM images of annealed TA10 alloy at different times (a) 0.5 h, (b) 1 h, (c) 2 h, (d) and 4 h; (e) area fraction of α phase and average grain size.
Metals 13 00566 g004
Figure 5. The surface scanning energy spectrum of TA10 alloy sheets annealed at 780 °C for 2 h (a) scanning surface, (b) Ti, (c) Mo, and (d) Ni.
Metals 13 00566 g005
Figure 6. Microstructure evolution of TA10 annealed sheet.
Metals 13 00566 g006
Figure 7. XRD results of TA10 annealed sheets: (a) XRD patterns; (b) the peak intensity ratio Iβ/Iα.
Metals 13 00566 g007
Figure 8. Tensile properties of TA10 annealed sheets: (a) elongation and strength; (b) stress–strain curves.
Metals 13 00566 g008
Figure 9. Fracture morphology of TA10 annealed sheets: (a) hot-rolled, (b) 0.5 h, (c) 1 h, (d) 2 h, (e) 4 h, and (f) average size of dimples.
Metals 13 00566 g009
Figure 10. Vickers hardness of TA10 alloy.
Metals 13 00566 g010
Figure 11. Recrystallization diagram of TA10 alloy: (a) hot-rolled, (b) 780 °C 2 h, (c) proportion of recrystallization, substructure, and deformation.
Metals 13 00566 g011
Figure 12. Corrosion resistance of TA10 alloy (a) OCP, (b) corrosion rate.
Metals 13 00566 g012
Figure 13. Polarization curves of TA10 alloy.
Metals 13 00566 g013
Figure 14. Impedance Spectrum of TA10 alloy: (a) Nyquist of TA10 alloy; (b) Bode diagram of TA10 alloy.
Metals 13 00566 g014
Figure 15. Impedance fitting circuit diagram.
Metals 13 00566 g015
Table 1. Chemical composition of TA10 ingot (wt. %).
TiMoNiFeHNCO
Bal.0.2820.7690.0780.0010.0160.0210.052
Table 2. Corrosion potential and corrosion current density of TA10 alloy.
Annealing Time (h)Hot-Rolled0.5124
The corrosion potential (Ecorr/V)−0.482−0.477−0.422−0.421−0.420
Corrosion current density (Icorr/μA·cm−2)1.7341.6411.4211.3931.388
Table 3. Equivalent circuit parameters of TA10 alloys.
Rs (Ω cm2)Q (F cm−2)nRp (Ω cm2)χ2
Hot-rolled22.731.661 × 10−50.8571.879 × 1053.47 × 10−3
0.5 h27.811.568 × 10−50.8523.126 × 1053.42 × 10−3
1 h21.561.469 × 10−50.8743.329 × 1053.02 × 10−3
2 h20.531.441 × 10−50.8813.463 × 1053.01 × 10−3
4 h24.311.385 × 10−50.8943.801 × 1054.74 × 10−3
Disclaimer/Publisher’s Note: The statements, opinions and data contained in all publications are solely those of the individual author(s) and contributor(s) and not of MDPI and/or the editor(s). MDPI and/or the editor(s) disclaim responsibility for any injury to people or property resulting from any ideas, methods, instructions or products referred to in the content.

