

Corrosion Behavior of Refractory High-Entropy Alloys in FLiNaK Molten Salts

Department of Material Science and Engineering, University of North Texas, Denton, TX 76203, USA
*
Author to whom correspondence should be addressed.
Metals 2023, 13(3), 450; https://doi.org/10.3390/met13030450
Submission received: 25 December 2022
/
Revised: 9 February 2023
/
Accepted: 20 February 2023
/
Published: 22 February 2023
(This article belongs to the Topic Materials for Extreme Environments)
Abstract
:Refractory high-entropy alloys (RHEAs) have recently attracted widespread attention due to their outstanding mechanical properties at elevated temperatures, making them appealing for concentrating solar power and nuclear energy applications. Here, the corrosion behavior of equimolar HfTaTiVZr and TaTiVWZr RHEAs was investigated in molten FLiNaK eutectic salt (LiF-NaF-KF: 46.5−11.5−42 mol.%) at 650 °C. Potentiodynamic polarization, electrochemical impedance spectroscopy (EIS), and immersion test measurements were carried out for these two RHEAs and compared with Inconel 718 (IN718) superalloy and SS316 stainless steel under identical test conditions. Both TaTiVWZr and HfTaTiVZr refractory high-entropy alloys exhibited an order of magnitude lower corrosion rate than SS316. IN718 and TaTiVWZr showed similar corrosion rates. Corrosion products enriched with noble alloying elements formed in the case of TaTiVWZr and IN718 were stable and protective on the substrate. SS316 showed the lowest corrosion resistance and void formation along the exposed surface due to the active dissolution of Cr and Fe, which provided diffusion paths for the corroded species. The surface analysis results showed that IN718 underwent pitting corrosion, while TaTiVWZr experienced selective dissolution in the inter-dendritic area. In contrast, HfTaTiVZr and SS316 experienced corrosion at the grain boundaries.
1. Introduction
Molten salts were initially considered suitable for nuclear energy production due to their advantageous physical and chemical properties, such as excellent heat transfer capabilities, resistance to radiation, and high boiling point. [1,2,3]. Additionally, it was discovered that molten salts could be utilized in various settings, including high-temperature heat transfer, as core coolants for solid fuels, or as liquid fuels in Molten Salt Reactors (MSRs) [4,5,6]. The appeal and advantages of MSR are discussed in the Generation IV International Forum [7]. The use of molten fluoride salts as a heat transfer media is of great interest because of their excellent thermo-physical properties and stability at high temperatures [8,9,10]. Molten fluoride salts are used as heat transfer media because of their exceptional characteristics, such as high heat capacity, low viscosity, high thermal conductivity, low melting point, high boiling point, and chemical inertness [11,12].
The use of molten salt technology as a working fluid necessitates the use of high-temperature corrosion-resistant materials to ensure uninterrupted long-term use, an issue that has been of concern for many years. Studies of high-temperature corrosion began as early as the 1940s for applications such as gas turbines, boilers, and industrial water treatment systems. Additionally, with growing interest in the nuclear industry, Oak Ridge National Laboratory (ORNL-USA) conducted a comprehensive study on material compatibility and corrosion behavior in molten salts during the 1950s to 1970s [13,14,15]. Similarly, the National Aeronautics and Space Administration (NASA) examined the corrosion characteristics of various alloys in fluoride salts for use in thermal storage applications [16]. Since then, there has been a persistent increase in corrosion studies in molten salts reported in various conditions and types of salts. Several challenges are associated with the structural materials used in molten salts-based reactors due to the highly corrosive nature of molten salts at high temperatures [17,18]. Unlike the protective oxides formed on the surface of alloys in an oxygen-containing environment, corrosion products formed in the molten-salt environment are unstable and dissolve easily [19,20]. A study by NASA determined that in molten salts, the active alloying elements are prone to selective dissolution [3,16]. Nickel-based alloys typically show the best corrosion resistance in molten fluoride salts (FLiBe, FLiNaK) compared to other structural materials and are thus widely used in MSR applications [21,22,23]. However, nickel-based alloys and stainless steels have been shown to undergo intergranular corrosion with the diffusion of Cr and Fe along grain boundaries to form soluble metallic fluorides in the MSR environment [23,24,25,26].
Refractory high-entropy alloys (RHEAs) with multiple principal elements have been recently proposed as promising candidates for high-temperature applications with enhanced mechanical, irradiation, and oxidation resistance [27]. RHEAs offer a potentially disruptive and transformative material solution for high-temperature applications beyond nickel-based superalloy as the next generation of high-temperature materials [25,28,29]. RHEAs have gained increasing attention because of their high-temperature strength and corrosion resistance, in some cases surpassing the performance of commercial superalloys such as Haynes 230 and Inconel 718 [30,31,32,33]. We have recently reported the exceptional ability of two RHEAs (HfTaTiVZr and TaTiVWZr) to resist corrosion in a high-temperature environment containing molten chloride salt [34]. In this study, we investigated the corrosion behavior of the same alloys in molten FLiNaK salt at 650 °C to determine their suitability for use in nuclear systems. Potentiodynamic polarization and immersion tests were combined with Electrochemical Impedance Spectroscopy (EIS) studies to investigate the electrochemical behavior of HfTaTiVZr and TaTiVWZr in comparison with IN718 and SS316 as benchmark alloys. Recent studies indicate impedance measurements correlated well with corrosion processes [35,36,37,38,39]. Dissolution mechanisms for both the RHEAs in molten FLiNaK salt are also discussed based on microscopy, elemental analysis, and X-ray diffraction.
2. Materials and Methods
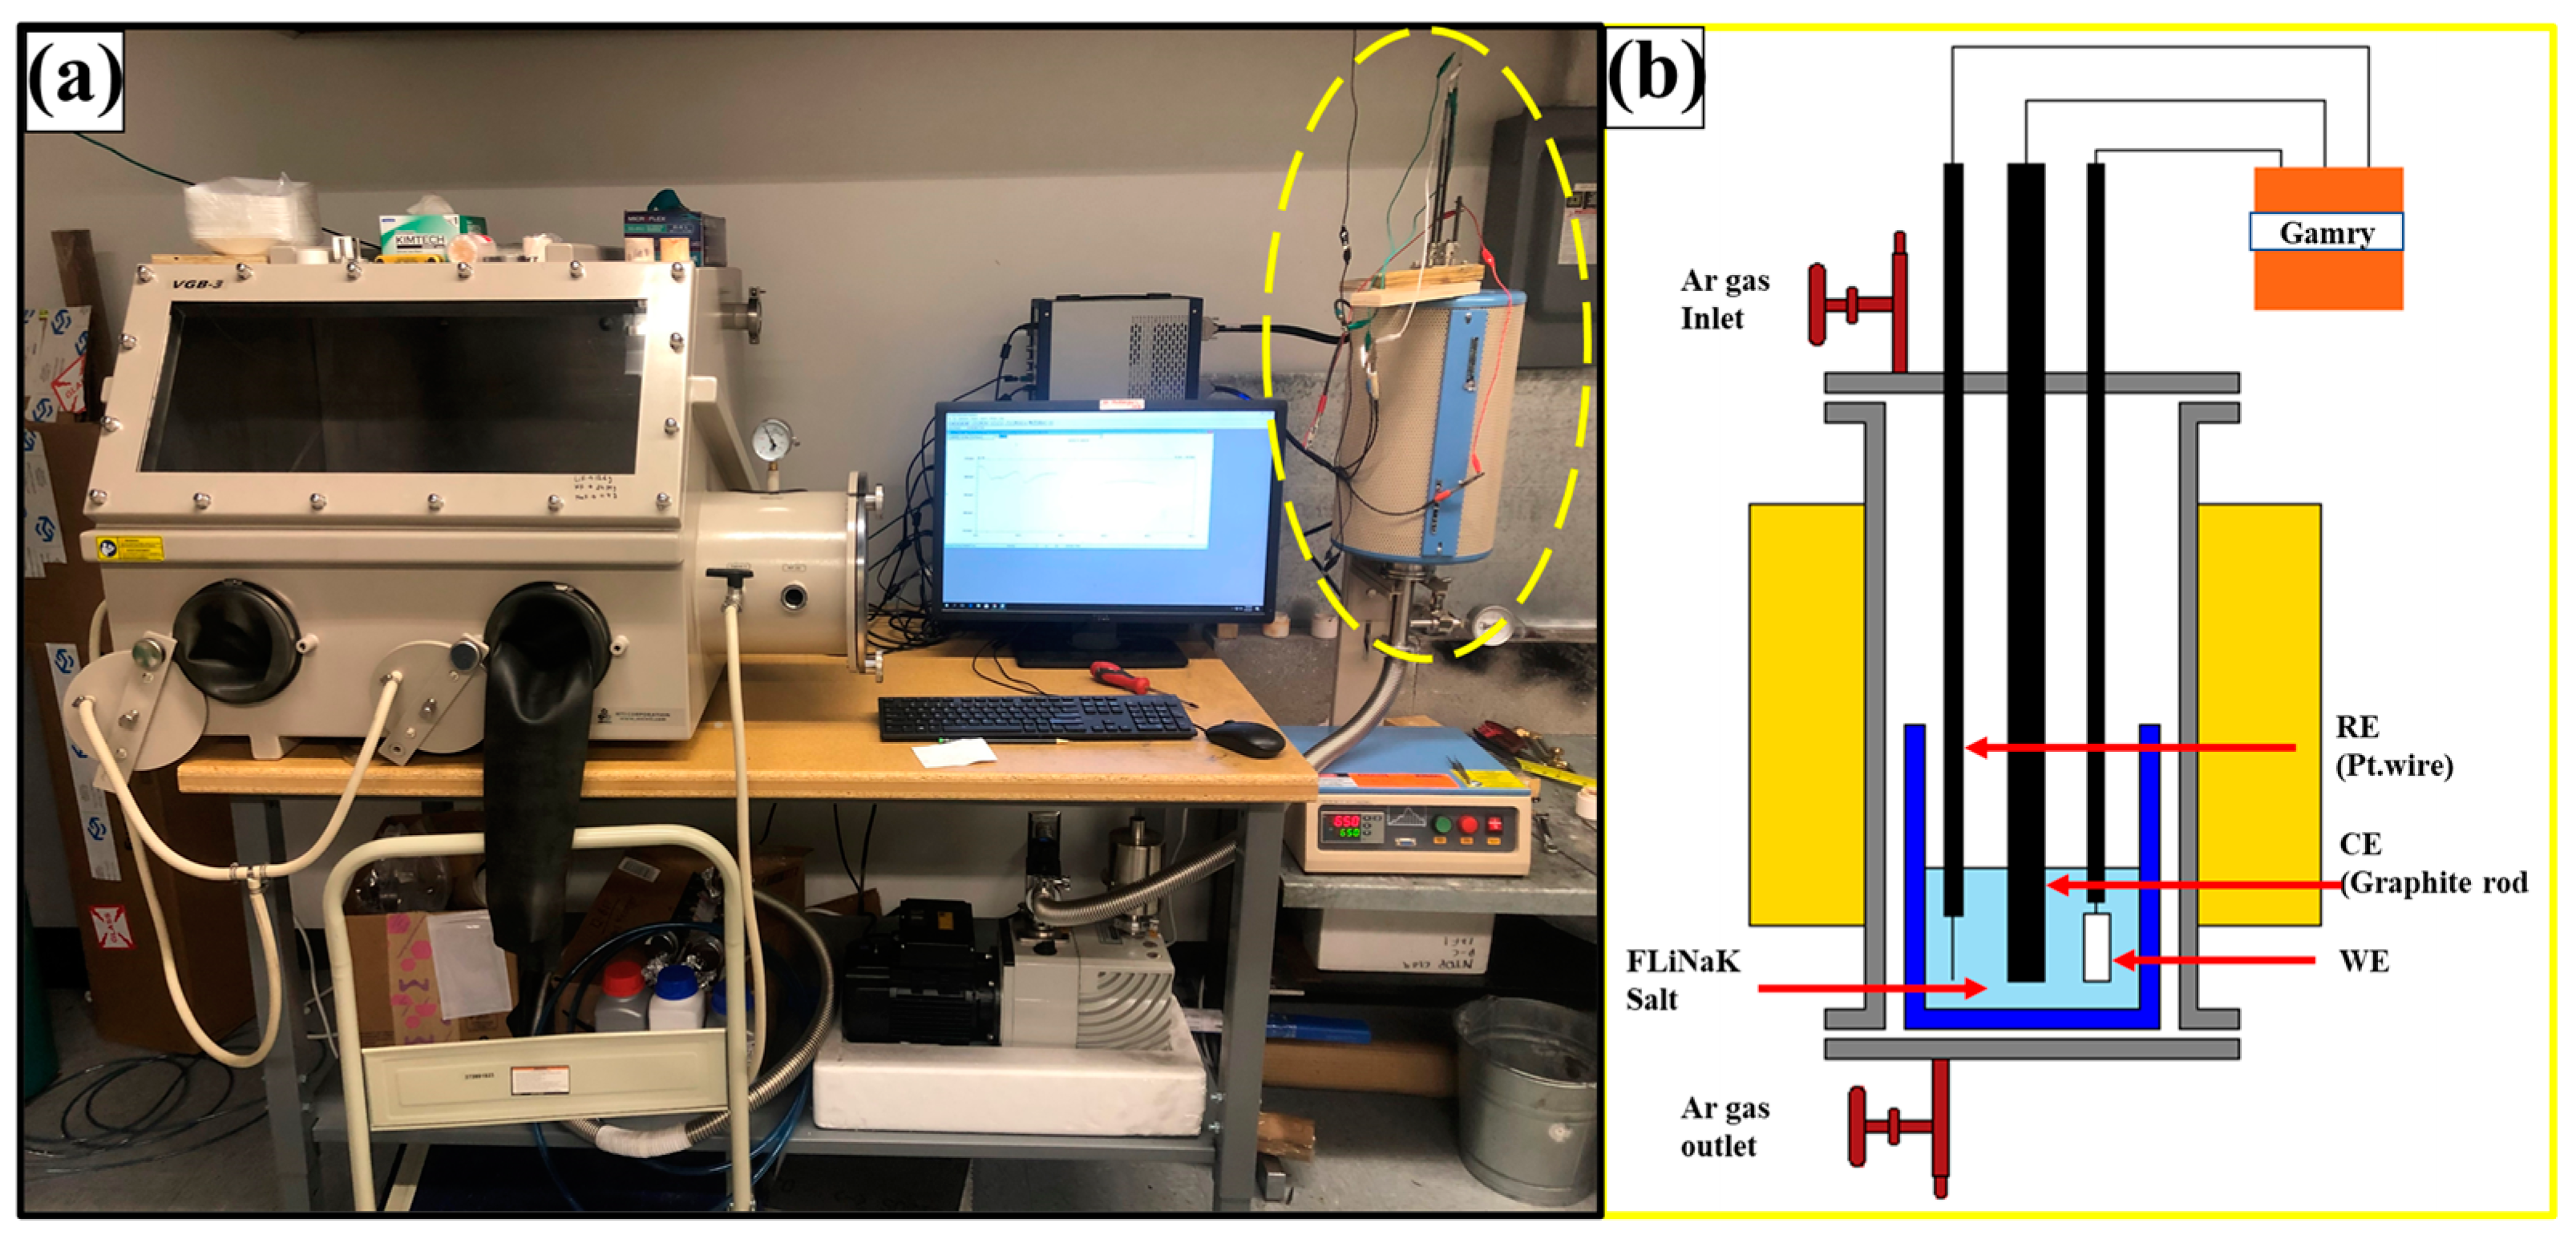
High-purity LiF, NaF, and KF salts from Sigma-Aldrich were mixed in a glove box under an argon atmosphere (with oxygen and water concentration less than 1 ppm) in an Alumina crucible to obtain FLiNaK salt, a eutectic mixture of LiF (46.5 mol.%)–NaF (11.5 mol.%)–KF (42.0 mol.%). A fresh batch of salt was used for every corrosion experiment. To reduce the moisture content of the salt, the crucible filled with FLiNaK salt was inserted into a furnace preheated to 150 °C and further dried at 400 °C for 5 h under flowing high purity Ar. Then, the temperature was raised gradually to 650 °C at a rate of 2 °C/min. The alloys were made by melting the constituent elements (99.99% purity) using an arc-melting process in an argon atmosphere. The melted pellets were then re-melted and turned several times to ensure homogeneity. Before the corrosion tests, the samples were cut from the homogenized pellet and underwent mechanical polishing. Prior to the corrosion tests, the alloys were cut into the dimensions of 20 mm × 5 mm × 3 mm, and the specimens were polished using 1200-grit silicon carbide paper, rinsed in distilled water, and subjected to ultrasonic degreasing using acetone, and subsequently dried. The experimental arrangement for the molten-salt corrosion testing and a diagram of the three-electrode electrochemical cell can be seen in Figure 1a,b. The sample was used as the working electrode (W.E.), pure platinum wire as the pseudo-reference electrode (R.E.), and graphite rod as the counter electrode (C.E.). To insulate the electrodes from the cell body during the electrochemical tests, all the electrodes were sealed in glass tubes using high-temperature Rutland refractory cement. A vertical electrical furnace (VF-1200 D8, MTI Corporation, Richmond, CA, USA) was used, as shown in Figure 1a. The electrochemical measurements were performed using a potentiostat/galvanostat (Reference 3000, Gamry, Warminster, PA, USA).
The electrochemical corrosion tests were carried out under an Ar-gas atmosphere. The corrosion tests included open circuit potential (OCP) measurement, electrochemical impedance spectroscopy (EIS), potentiodynamic polarization (PDP), and weight-loss immersion measurement. For each test, a new working electrode was used. The EIS was carried out over a range of frequencies from 10 kHz to 1 mHz with an A.C. voltage amplitude of ±10 mV versus the established OCP. The PDP test was conducted over the potential range of −500 to +1500 mV versus the established OCP. The immersion tests were carried out at 650 °C for 60 h. The concentration of the ions dissolved from the working electrode was measured by Inductively Coupled Plasma Optical Emission Spectroscopy (ICP-OES) technique. To analyze the crystal structure of the alloys and the resulting surface products after corrosion, a Rigaku III Ultima X-ray diffractometer (XRD, Rigaku Corporation, Tokyo, Japan) was used, employing a wavelength of 1.54 Å Cu-Ka radiation. Additionally, the microstructure of the as-cast alloys and the morphology of the surface post-corrosion were examined through a FEI Quanta scanning electron microscope (SEM) that was equipped with in-built energy dispersive spectroscopy (EDS).
3. Results
3.1. Microstructural Characterization
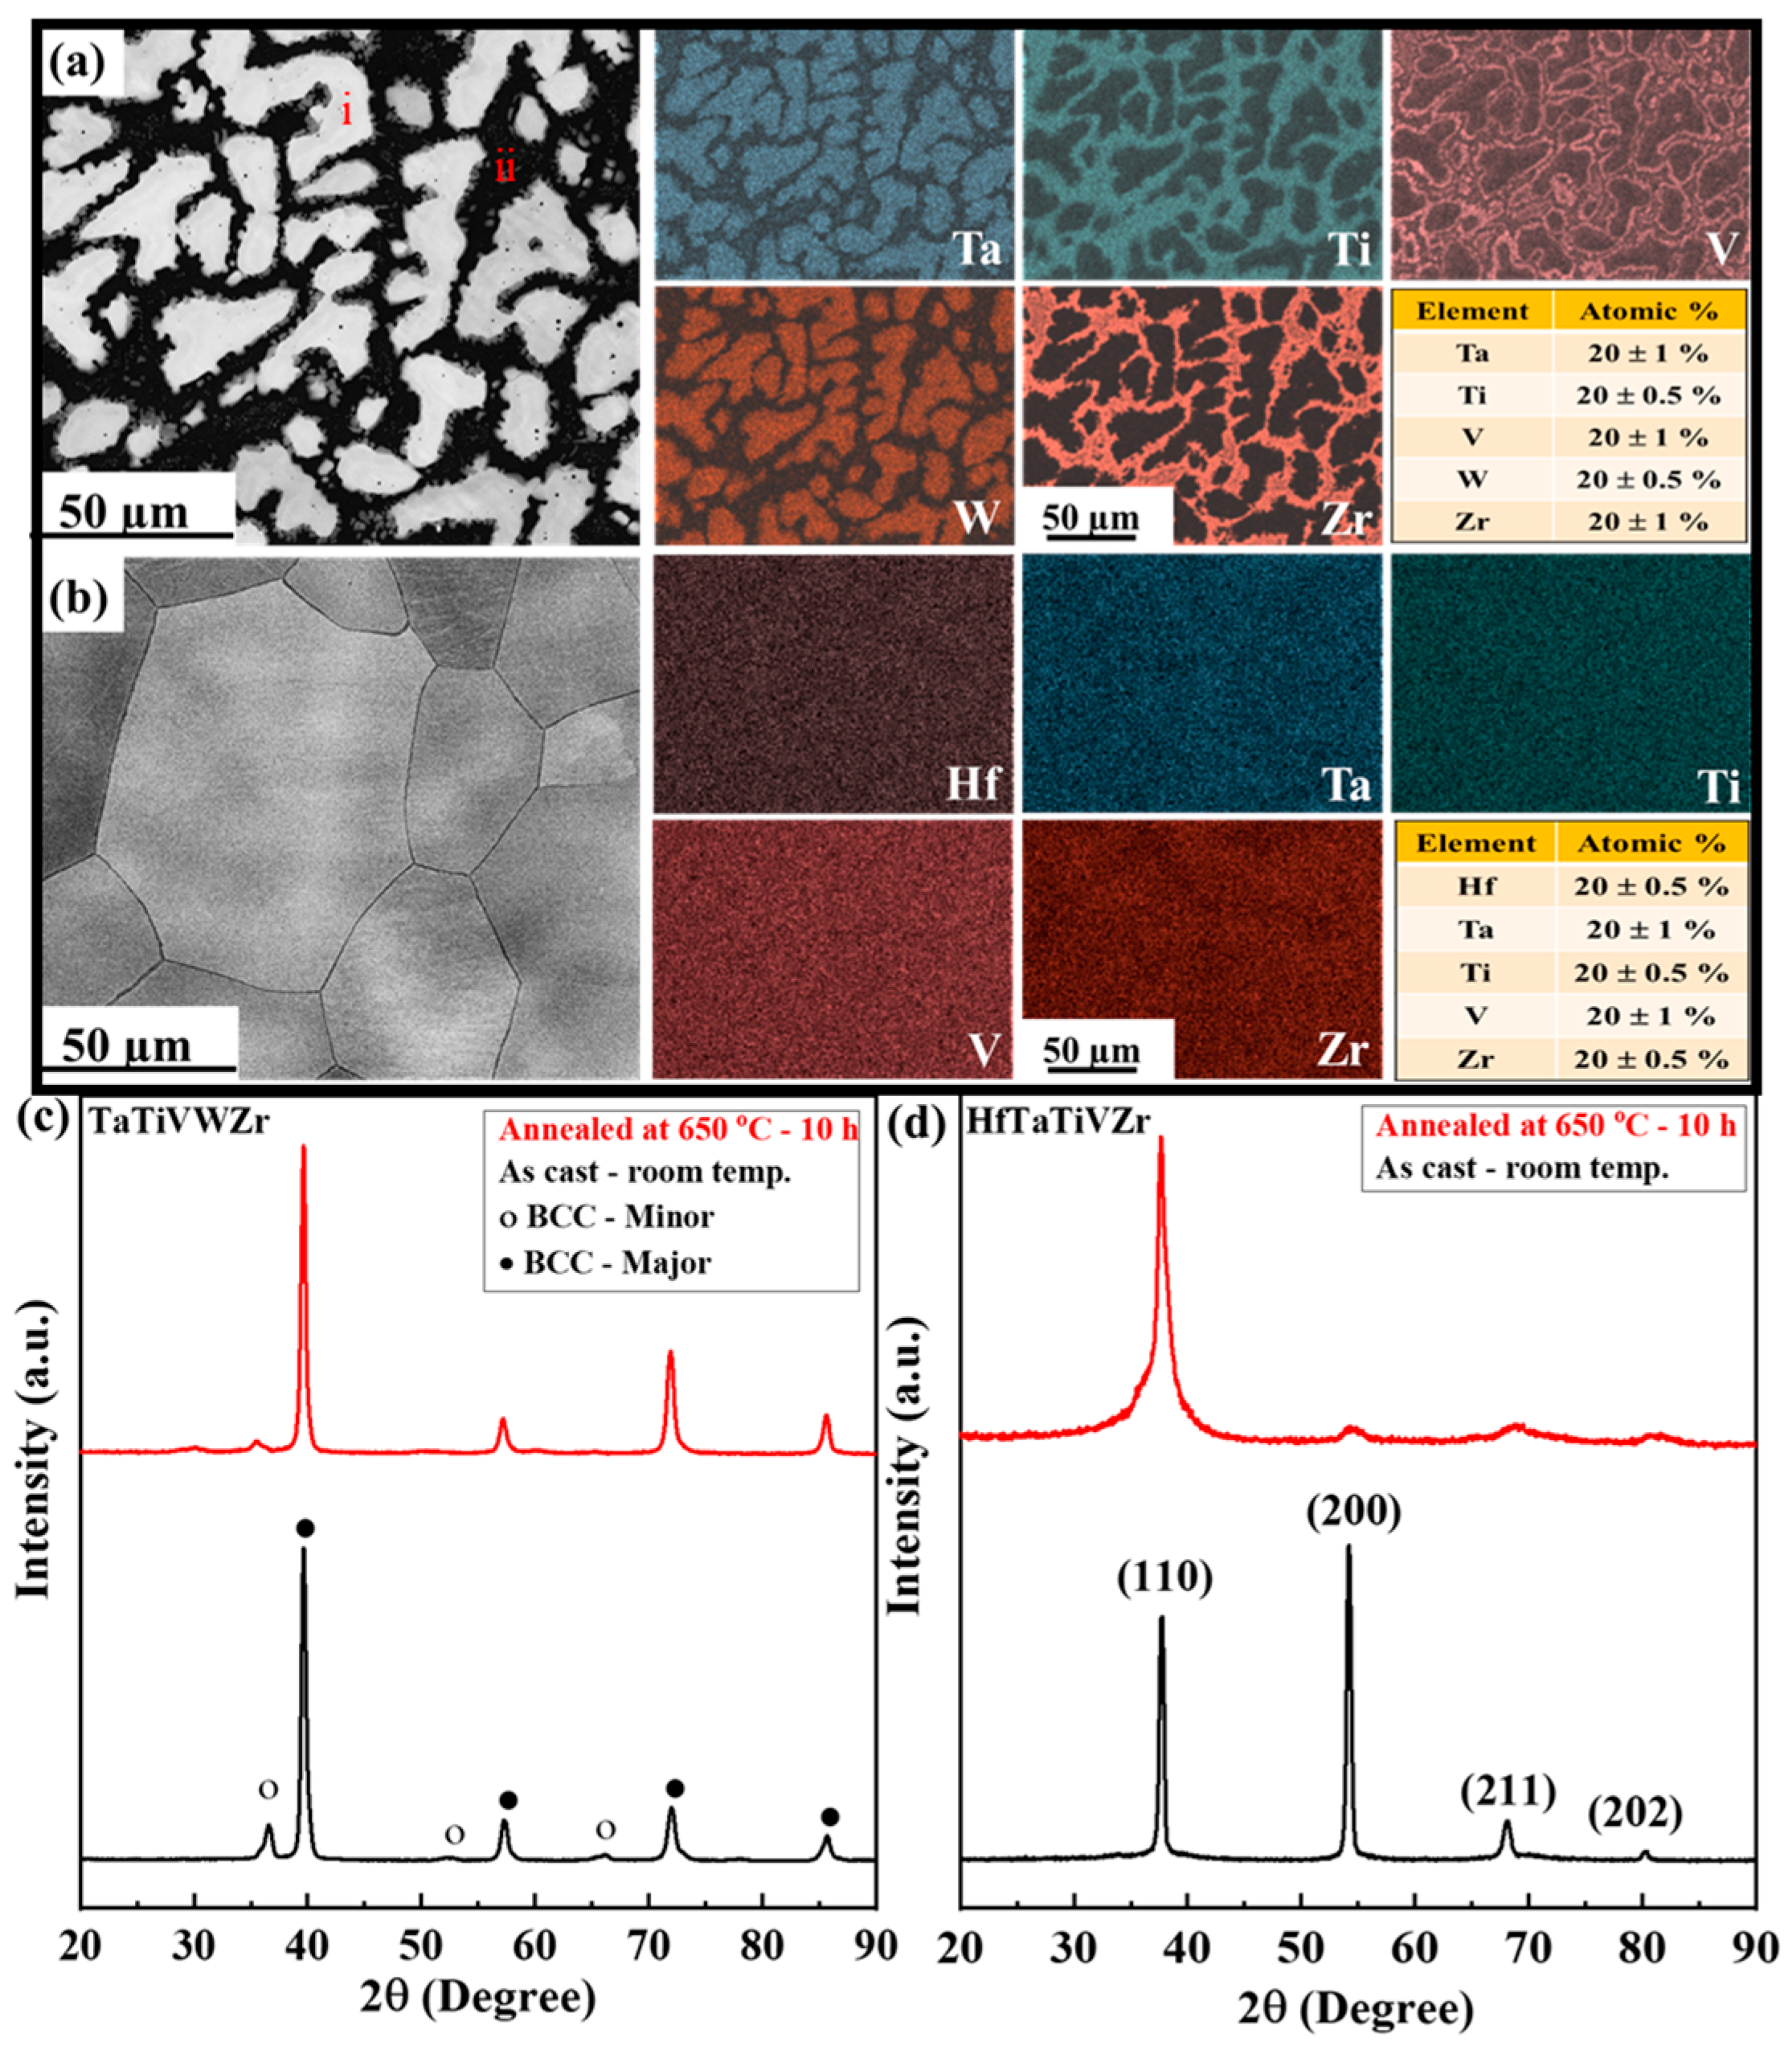
The backscattered SEM micrographs and EDS maps for TaTiVWZr and HfTaTiVZr RHEAs are displayed in Figure 2a,b. Figure 2a shows that TaTiVWZr has two distinct phases: (i) a bright dendritic phase that is rich in Ta and W, and (ii) an inter-dendritic phase that is rich in Ti, V, and Zr. On the other hand, Figure 2b indicates that HfTaTiVZr displays a single-phase equiaxed microstructure, with an average grain size of ~250 µm and a homogenous distribution of elements, without any segregation or secondary phases. As seen in Figure 2c, the XRD pattern verified the presence of BCC minor (inter-dendritic region) and BCC major (dendritic region) phases in the as-cast TaTiVWZr. As depicted in Figure 2d, the XRD pattern obtained for the as-cast HfTaTiVZr confirmed the existence of a single-phase BCC microstructure. Additionally, both alloys demonstrated excellent thermal stability, with no structural changes observed post-heat treatment at 650 °C for several hours.
3.2. Electrochemical Behavior
3.2.1. Electrochemical Impedance Spectroscopy
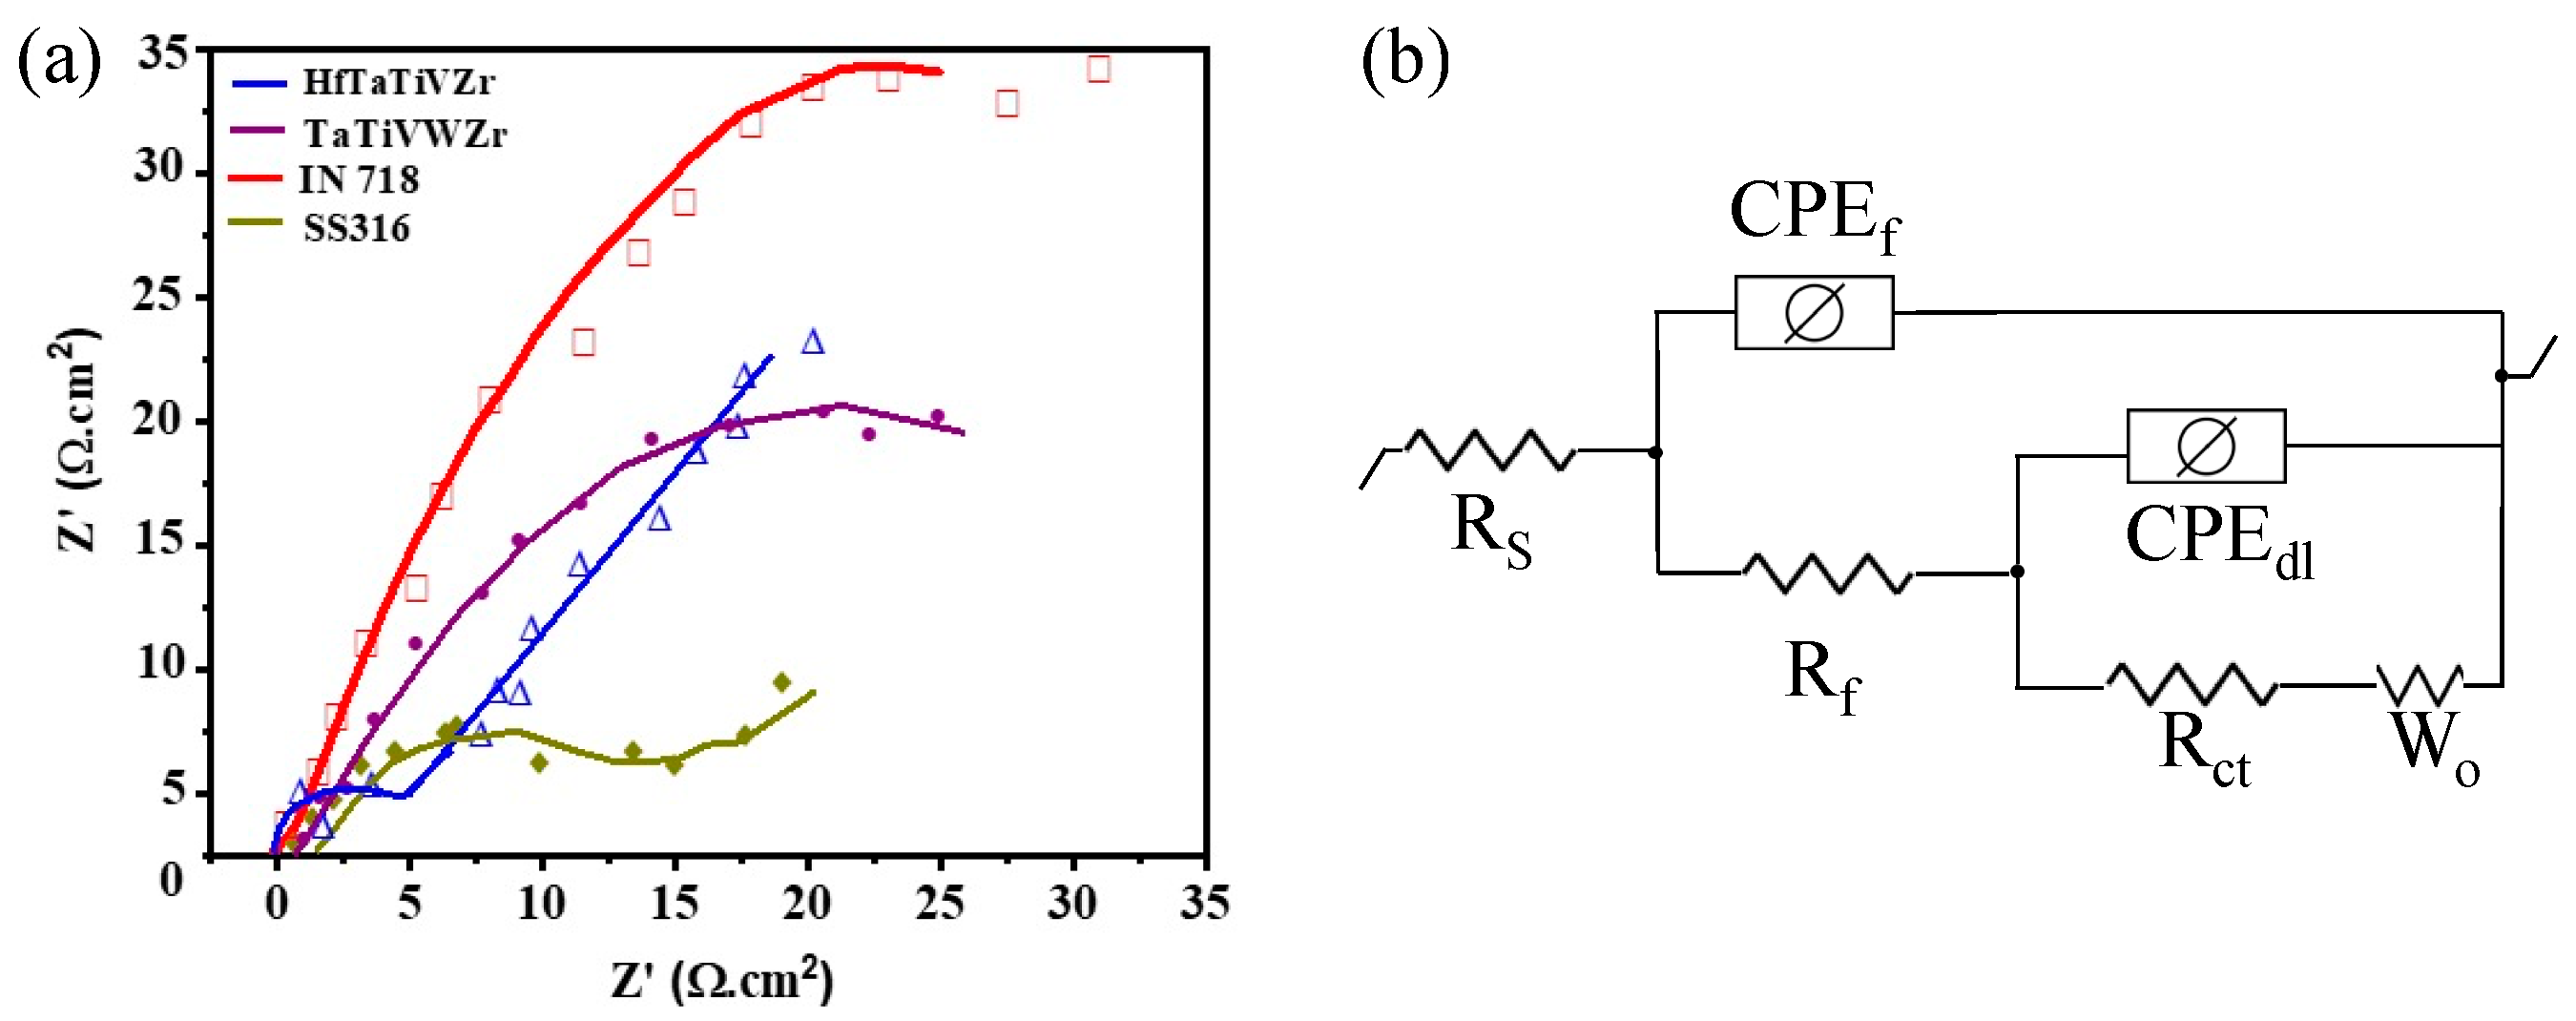
The Electrochemical Impedance Spectroscopy (EIS) technique was employed to probe the impedance characteristics of the corrosion product layer formed after immersion of the alloys in the molten salt. Figure 3a shows the Nyquist plots of the samples after 1 h immersion at 650 °C. An appropriate equivalent circuit with two-time constants was used for fitting the impedance data and is shown in Figure 3b. A constant phase element (CPE) was used instead of ideal double-layer capacitance Cdl to account for the non-ideal behavior of the double layer associated with surface roughness and variation in corrosion product layer thickness [26,40]. The CPE (ZCPE) may be represented as follows [41]:
where Yo is a proportional factor, j is an imaginary number, ω is the angular frequency, and n is the CPE exponent. The value of parameter n lies within the range of zero to one, representing a non-ideal capacitance loop, considering the surface roughness. [42]. The capacitance (C) of the passive layer was obtained from the impedance data using the following equation [41,43]:
The equivalent circuit used in this study included circuit elements that corresponded to the solution resistance (Rs), salt layer capacitance (CPEf), the resistance of the salt layer resistance (Rf), double-layer capacitance (CPEdl), charge transfer resistance (Rct), and Warburg element (W). The Warburg element was introduced to account for the diffusion of species in the corrosion product layer. The polarization resistance, Rp = Rct + Rf − Rs, gives the total resistance of the passive film.
The equivalent circuit values are summarized in Table 1. The polarization resistance (Rp) is a corrosion rate test parameter inversely related to electron transfer across the surface. IN 718 showed the highest polarization resistance (Rp ~56.9 Ω·cm2), followed by HfTaTiVZr (Rp ~47.8 Ω·cm2) and TaTiVWZr (Rp ~41.9 Ω·cm2) RHEAs. Among the alloys studied, SS316 showed the lowest polarization resistance (Rp ~29.06 Ω·cm2). Both the RHEAs showed similar polarization resistance in molten FLiNaK at 650 °C, while SS316 showed the lowest value of polarization resistance suggesting the least protective passive film. The impedance data suggest that the passive layer formed on IN718 was more protective than the other alloys.
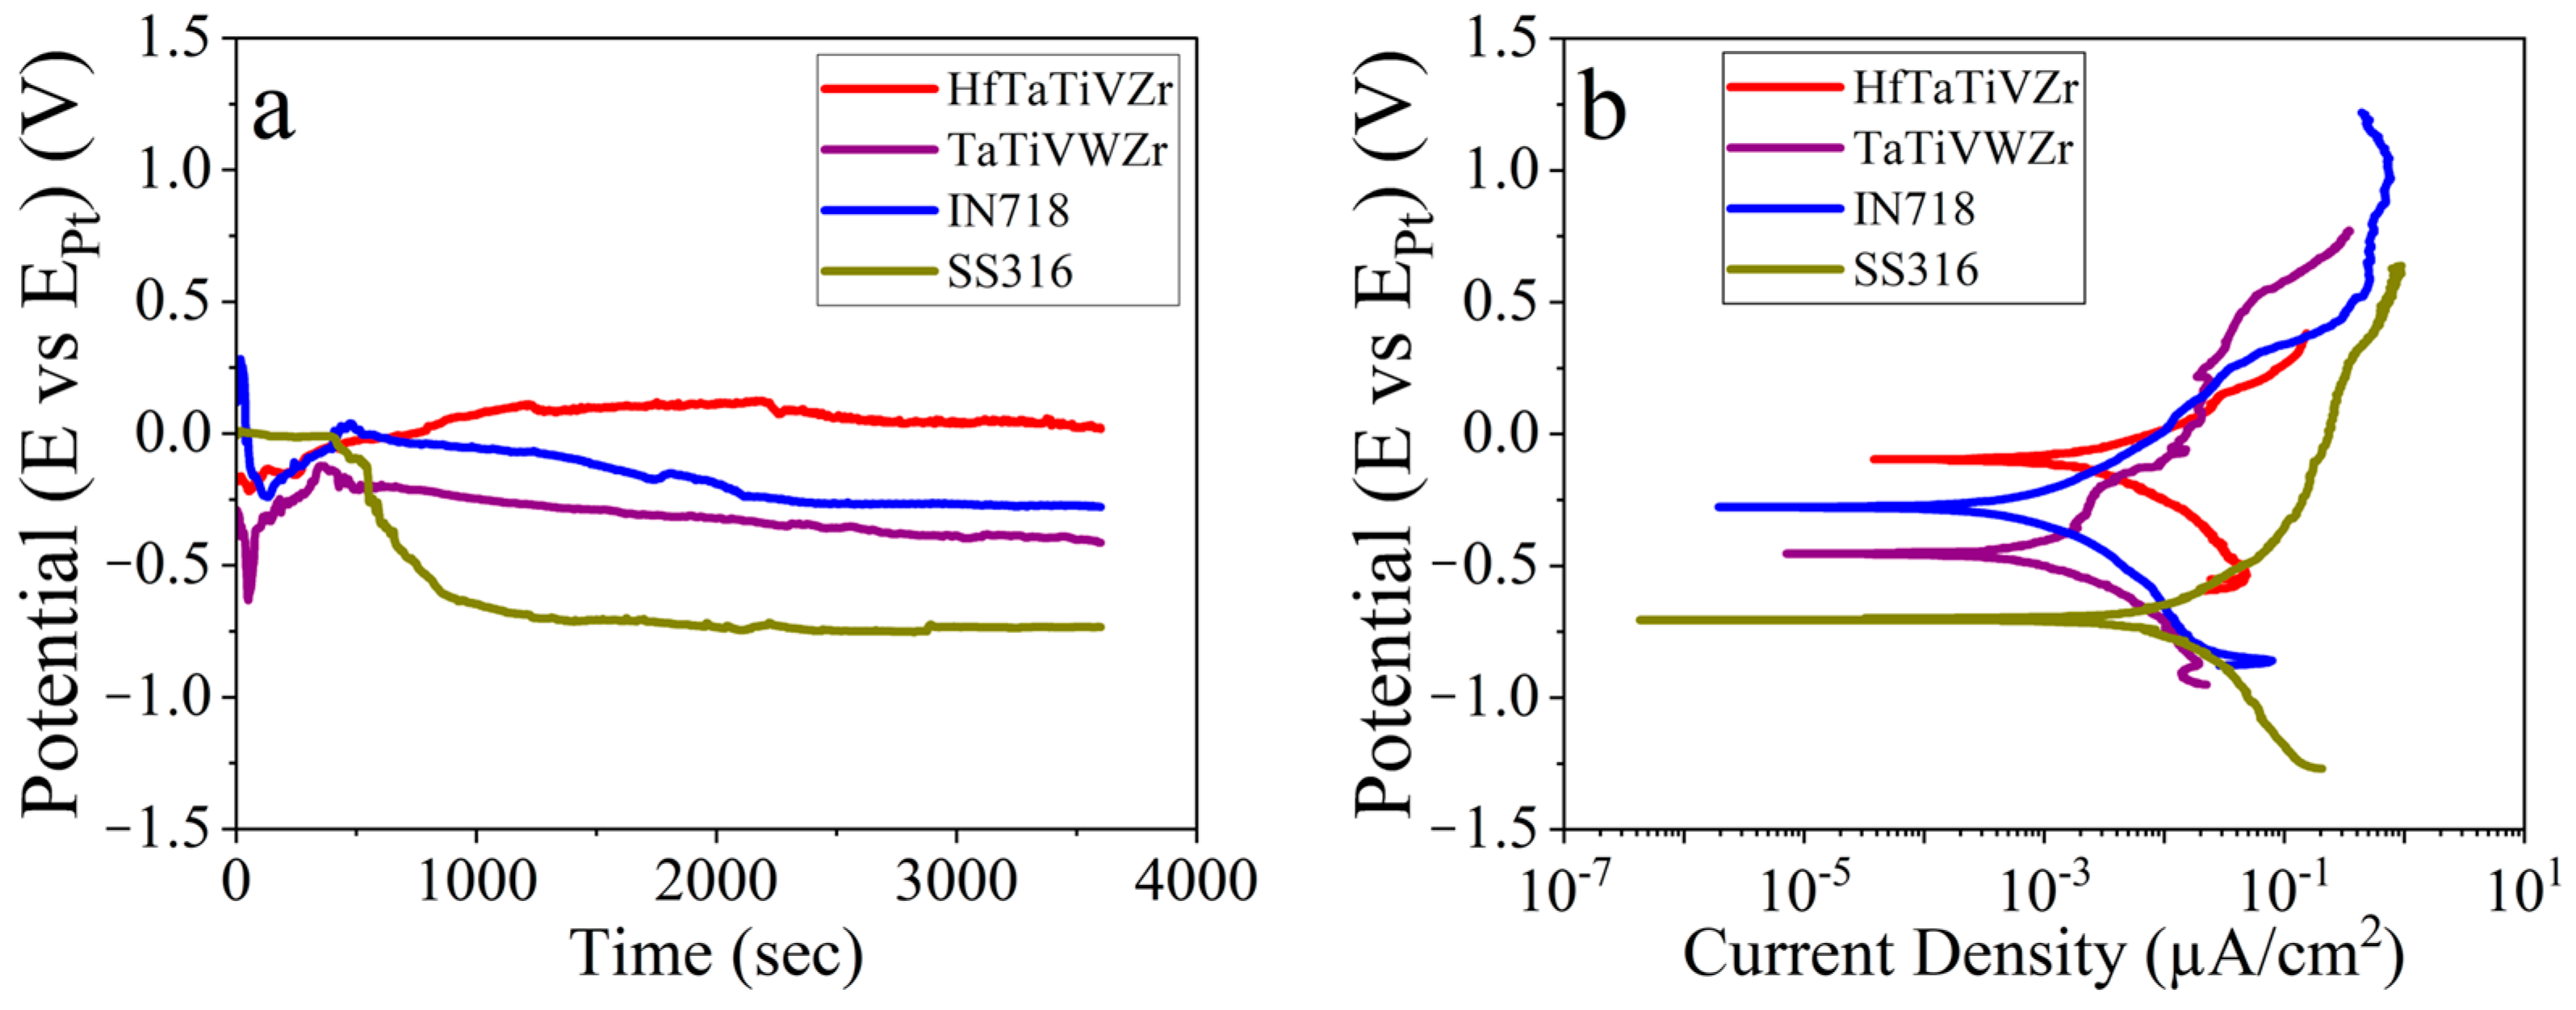
3.2.2. Potentiodynamic Polarization and Immersion Testing
The results of the open circuit potential test, with an exposure time of 1 h in molten FLiNaK salt at a temperature of 650 °C, are presented in Figure 4a. All the alloys achieved stable EOCP values after ~15 min. The HfTaTiVZr (17 mV vs. EPt) RHEA exhibited more positive EOCP compared to the other alloys, followed by IN718 (−280 mV vs. EPt), TaTiVWZr (−410 mV vs. EPt) and SS316 (−735 mV vs. EPt). Figure 4b displays the potentiodynamic polarization (PDP) curves for the alloys. The polarization curves for IN718, HfTaTiVZr, and SS316 showed active dissolution behavior with no passivation. TaTiVWZr RHEA showed a passive region with a pitting potential of around −190 mV, after which there was a sudden increase in current density. The corrosion current density (jcorr) and corrosion potential (Ecorr) of all the alloys were determined through Tafel extrapolation and are presented in Table 2. The corrosion rate (CR), listed in Table 2, was calculated using the following equation [40,44]:
The constant K, with a value of 3.27 × 10⁻³ [mm/(μA.cm.year)], is multiplied by the product of the equivalent weight (EW) and density (ρ) to calculate the corrosion rate in units of [mm/year]. The corrosion current density (jcorr) is measured in units of [μA/cm2]. The corrosion rate increased in the following order: IN 718 < TaTiVWZr < HfTaTiVZr < SS316. IN718 showed the lowest corrosion rate of ~19 mmpy, followed by TaTiVWZr RHEA with CR ~23 mmpy. The corrosion rate for HfTaTiVZr RHEA (~43 mmpy) was almost twice that of TaTiVWZr. SS316 showed the highest corrosion rate of ~114 mmpy, indicating that both RHEAs were significantly better than SS316 in terms of resistance to corrosion in molten fluoride salt.
where, k is constant 8.76 × 10⁴, mass loss is in (mmpy), which is taken from ASTM G31, mloss is the mass loss (g) of the metal in time t (h), A is the surface area of the material exposed (cm2), and ρ is the density of the material (g/cm3). Table 2 summarizes the outcomes of the static mass loss measurements, which were performed after the sample was submerged in FLiNaK salt for 60 h. The mass loss measurements followed the order of corrosion as: IN 718 < RHEAs (TaTiVWZr, HfTaTiVZr) < SS316, which was consistent with the potentiodynamic polarization results. Significant mass loss for SS316 in molten FLiNaK salt could be attributed to the active dissolution of Cr and Fe along the grain boundaries [45]. The RHEAs (TaTiVWZr and HfTaTiVZr) showed a similar mass loss in molten FLiNaK salt.
3.3. Surface Analysis
3.3.1. Inductively Coupled Plasma Optical Emission Spectroscopy (ICP-OES)
The concentration of the dissolved alloying elements in the molten FLiNaK salt after the potentiodynamic test is shown in Table 3. A fresh batch of salt was used for every corrosion experiment. HfTaTiVZr RHEA had a relatively higher dissolution of Hf, Ti, Zr, and V, while Ta dissolution was relatively less. TaTiVWZr RHEA had a relatively higher dissolution of Zr and Ti compared to W, V, and Ta. For both the RHEAs, Ti and Zr showed more propensity for dissolution in the molten FLiNaK salt, while Ta showed greater resistance to leaching (possibly due to stable passive film). V showed a greater degree of dissolution from HfTaTiVZr, while it was more resistant to leaching from TaTiVWZr, possibly due to the synergistic effect of the other constituent elements. For IN 718 and SS316, the concentration of dissolved Ni was roughly similar; however, the concentration of dissolved Cr and Fe was different. Cr and Fe dissolution from IN 718 in molten FLiNaK salt were relatively low, while that from SS316 was very high, which is consistent with the literature on SS316, where the active dissolution of Cr and Fe has been reported due to intergranular corrosion [45].
3.3.2. Surface Microstructure
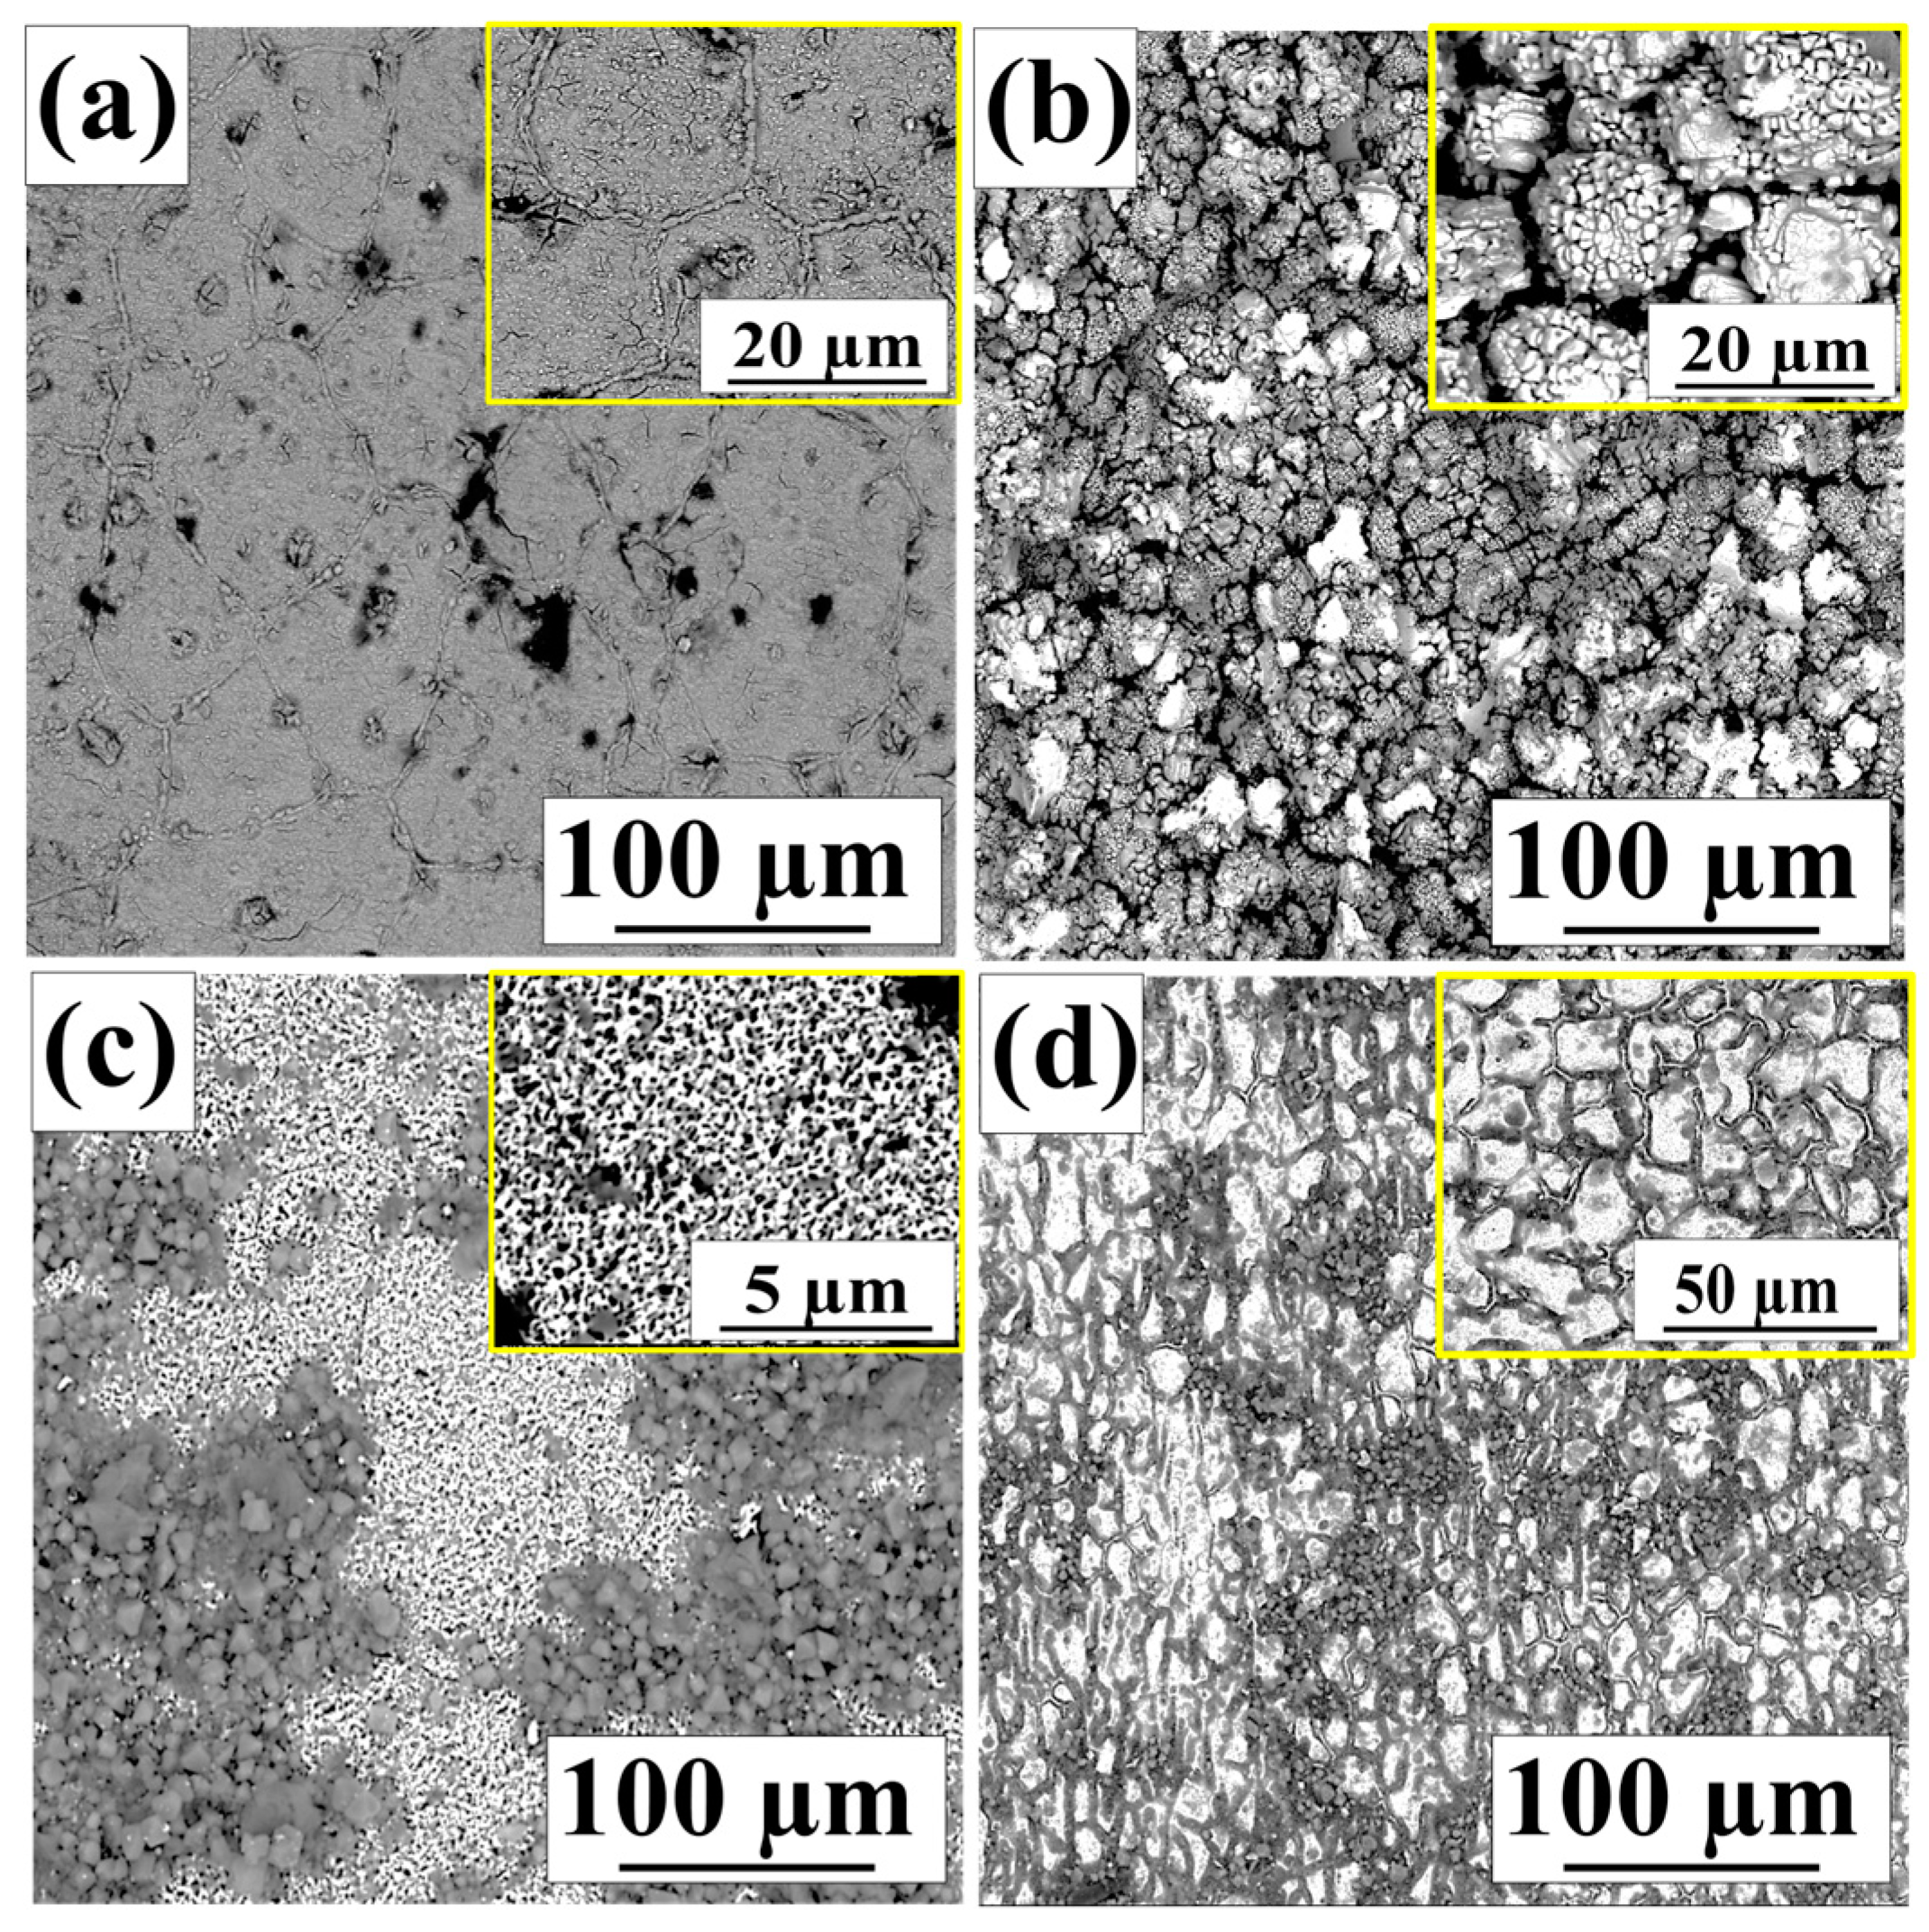
The surface microstructure of the alloys after the corrosion test was characterized using a scanning electron microscope (SEM) and shown in Figure 5. The HfTaTiVZr RHEA showed lesser grain boundary corrosion (Figure 5a) compared to extensive grain boundary corrosion seen for SS316 (Figure 5d). The corroded surface for TaTiVWZr (Figure 5b) showed selective leaching of an interdendritic region rich in Ti, V, and Zr. The dendritic region in TaTiVWZr showed relatively lesser dissolution because of a higher concentration of Ta and W. The corroded surface for IN 718 showed uniform pitting (Figure 5c).
3.3.3. Cross-Sectional Morphology and Element Distribution
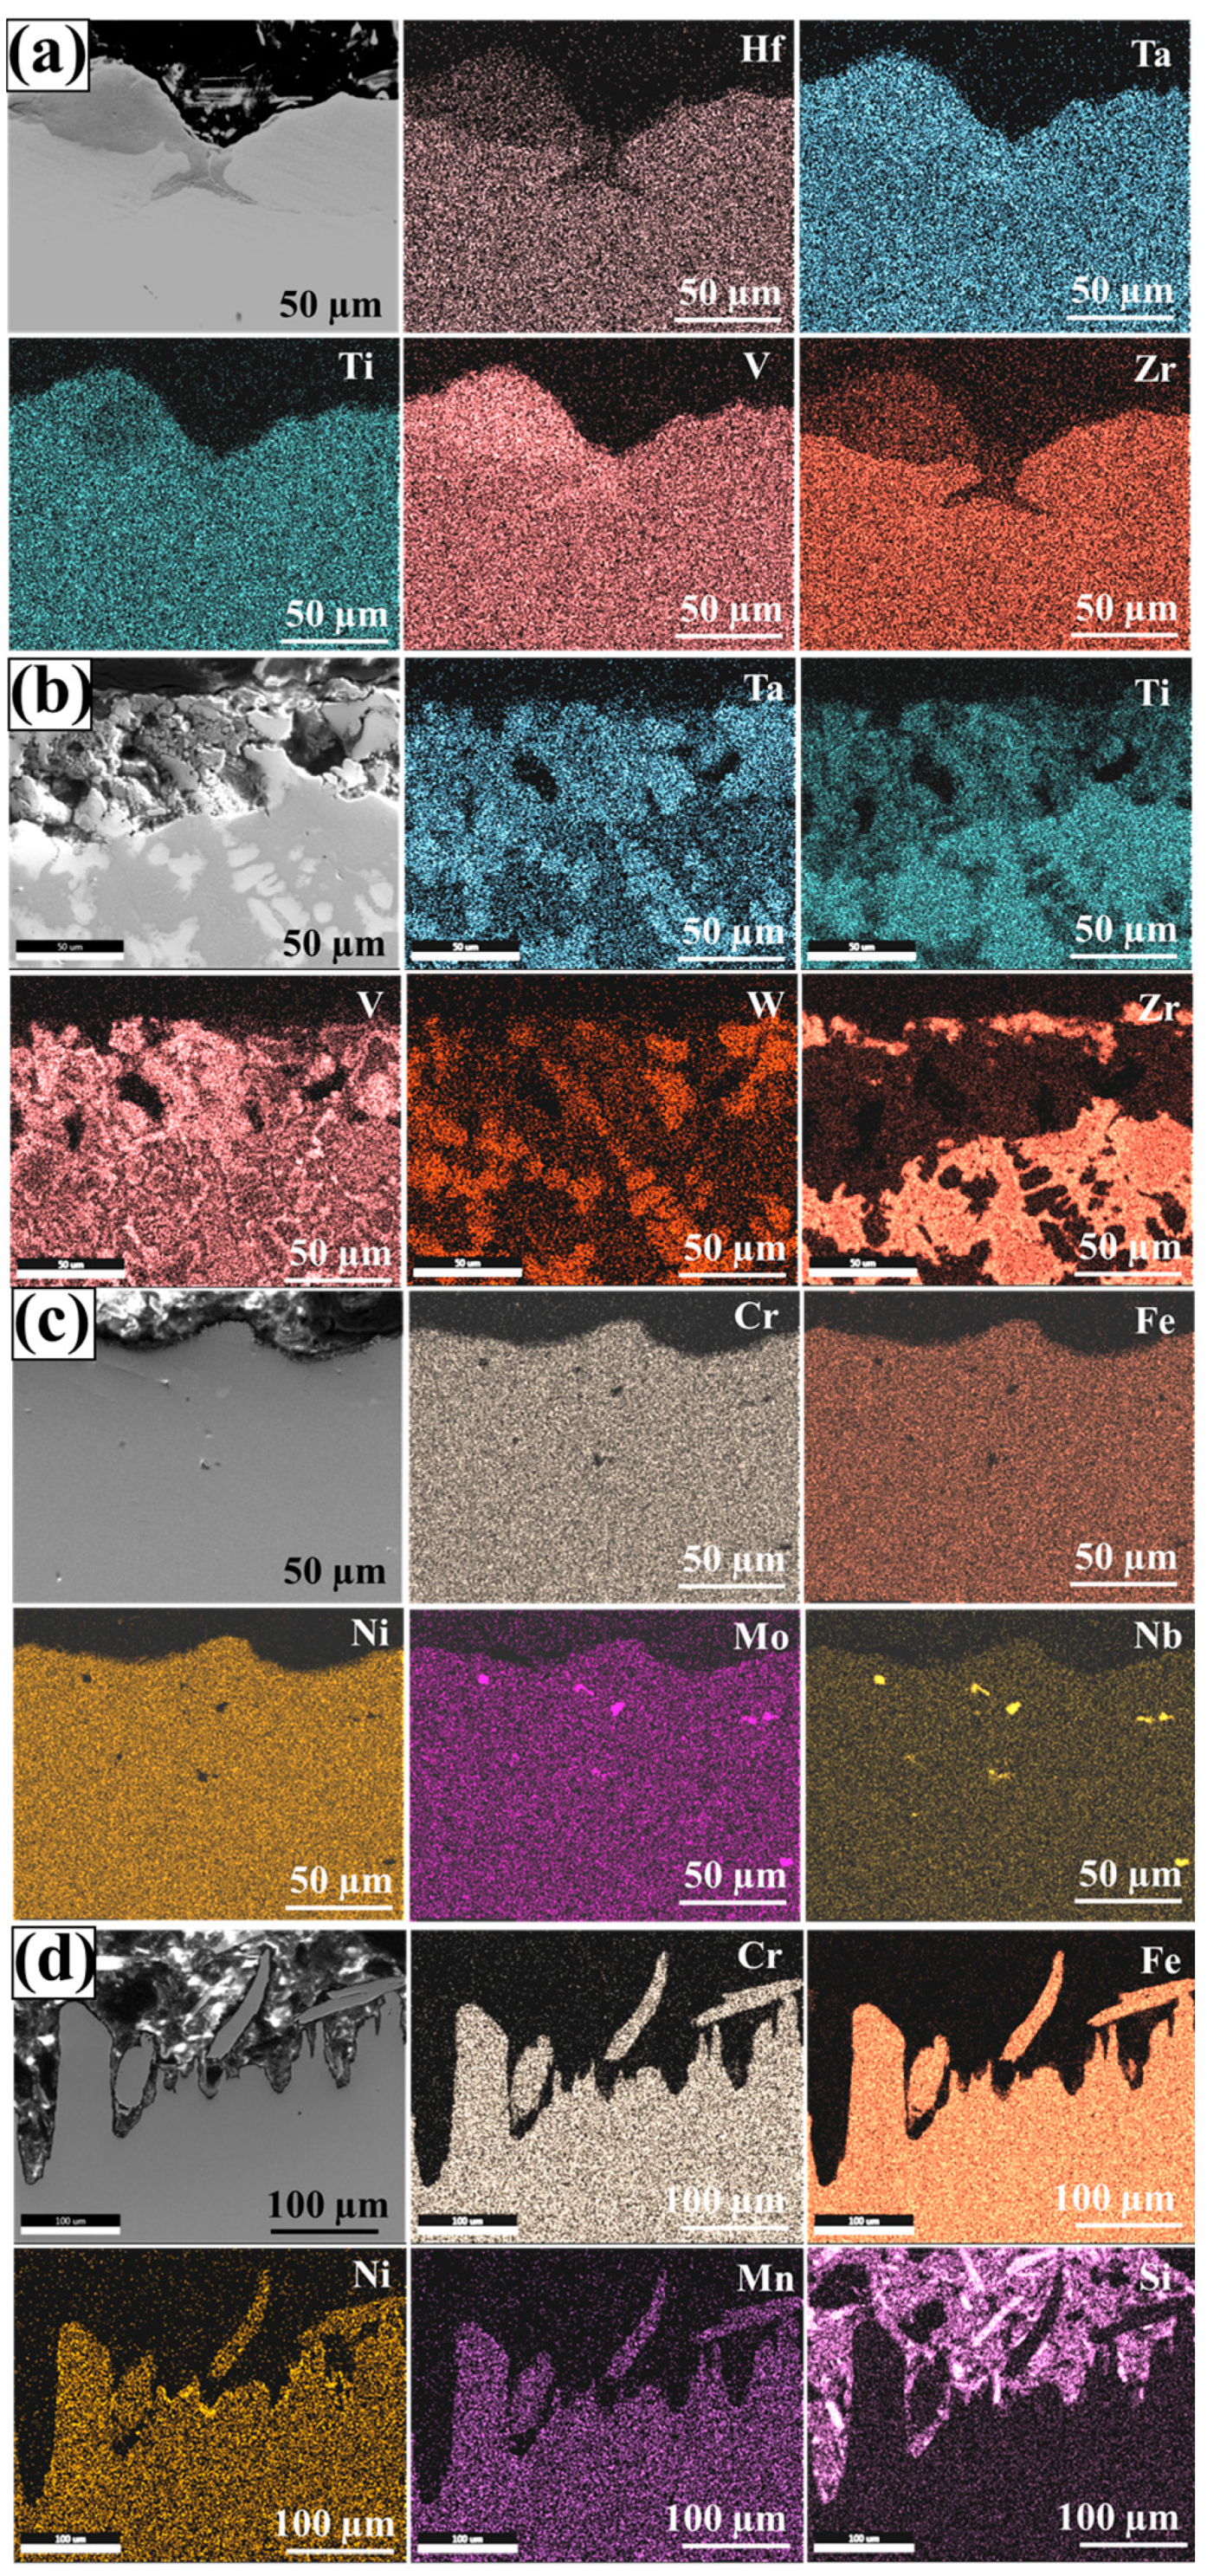
Figure 6a–d displays the morphology and distribution of elements across the cross-sections of four samples—HfTaTiVZr (a), TaTiVWZr (b), IN718 (c), and SS 316 (d)—after they were immersed in molten FLiNaK salt for 60 h at a temperature of 650 °C. The corrosion products for HfTaTiVZr RHEA were rich in Ta, and V. TaTiVWZr RHEA showed they depleted inter-dendritic region de-alloyed of Ti and Zr resulting in void formation. For IN718 and SS304, the corrosion products dissolved in the salt by fluxing action. However, some undissolved corrosion products were found on the surface of IN718, with enrichment of Mo/Nb and depletion of Cr. Intergranular corrosion was observed in the cross-section image for HfTaTiVZr with a thin layer of non-adherent corrosion product along the exposed surface (Figure 6a). The surface layer for HfTaTiVZr was divided into two regions: the top region rich in oxygen and the bottom region consisting of all alloying elements except Ti. The cross-section morphology for TaTiVWZr exposed to the molten salt exhibited more corrosion of the inter-dendritic region compared to the dendritic region. The affected depth of corrosion was ~15 µm in the interdendritic region and ~5 µm in the dendritic region (Figure 6b). Rct value was higher for TaTiVWZr compared to HfTaTiVZr because of the strong dissolution resistance of the Ta–W-rich dendrite region. IN718 showed no prominent corrosion voids or intergranular corrosion in the cross-section (Figure 6c). In contrast, SS316 showed extensive pitting, intergranular corrosion, and subsurface voids (Figure 6d).
3.3.4. XRD Analysis
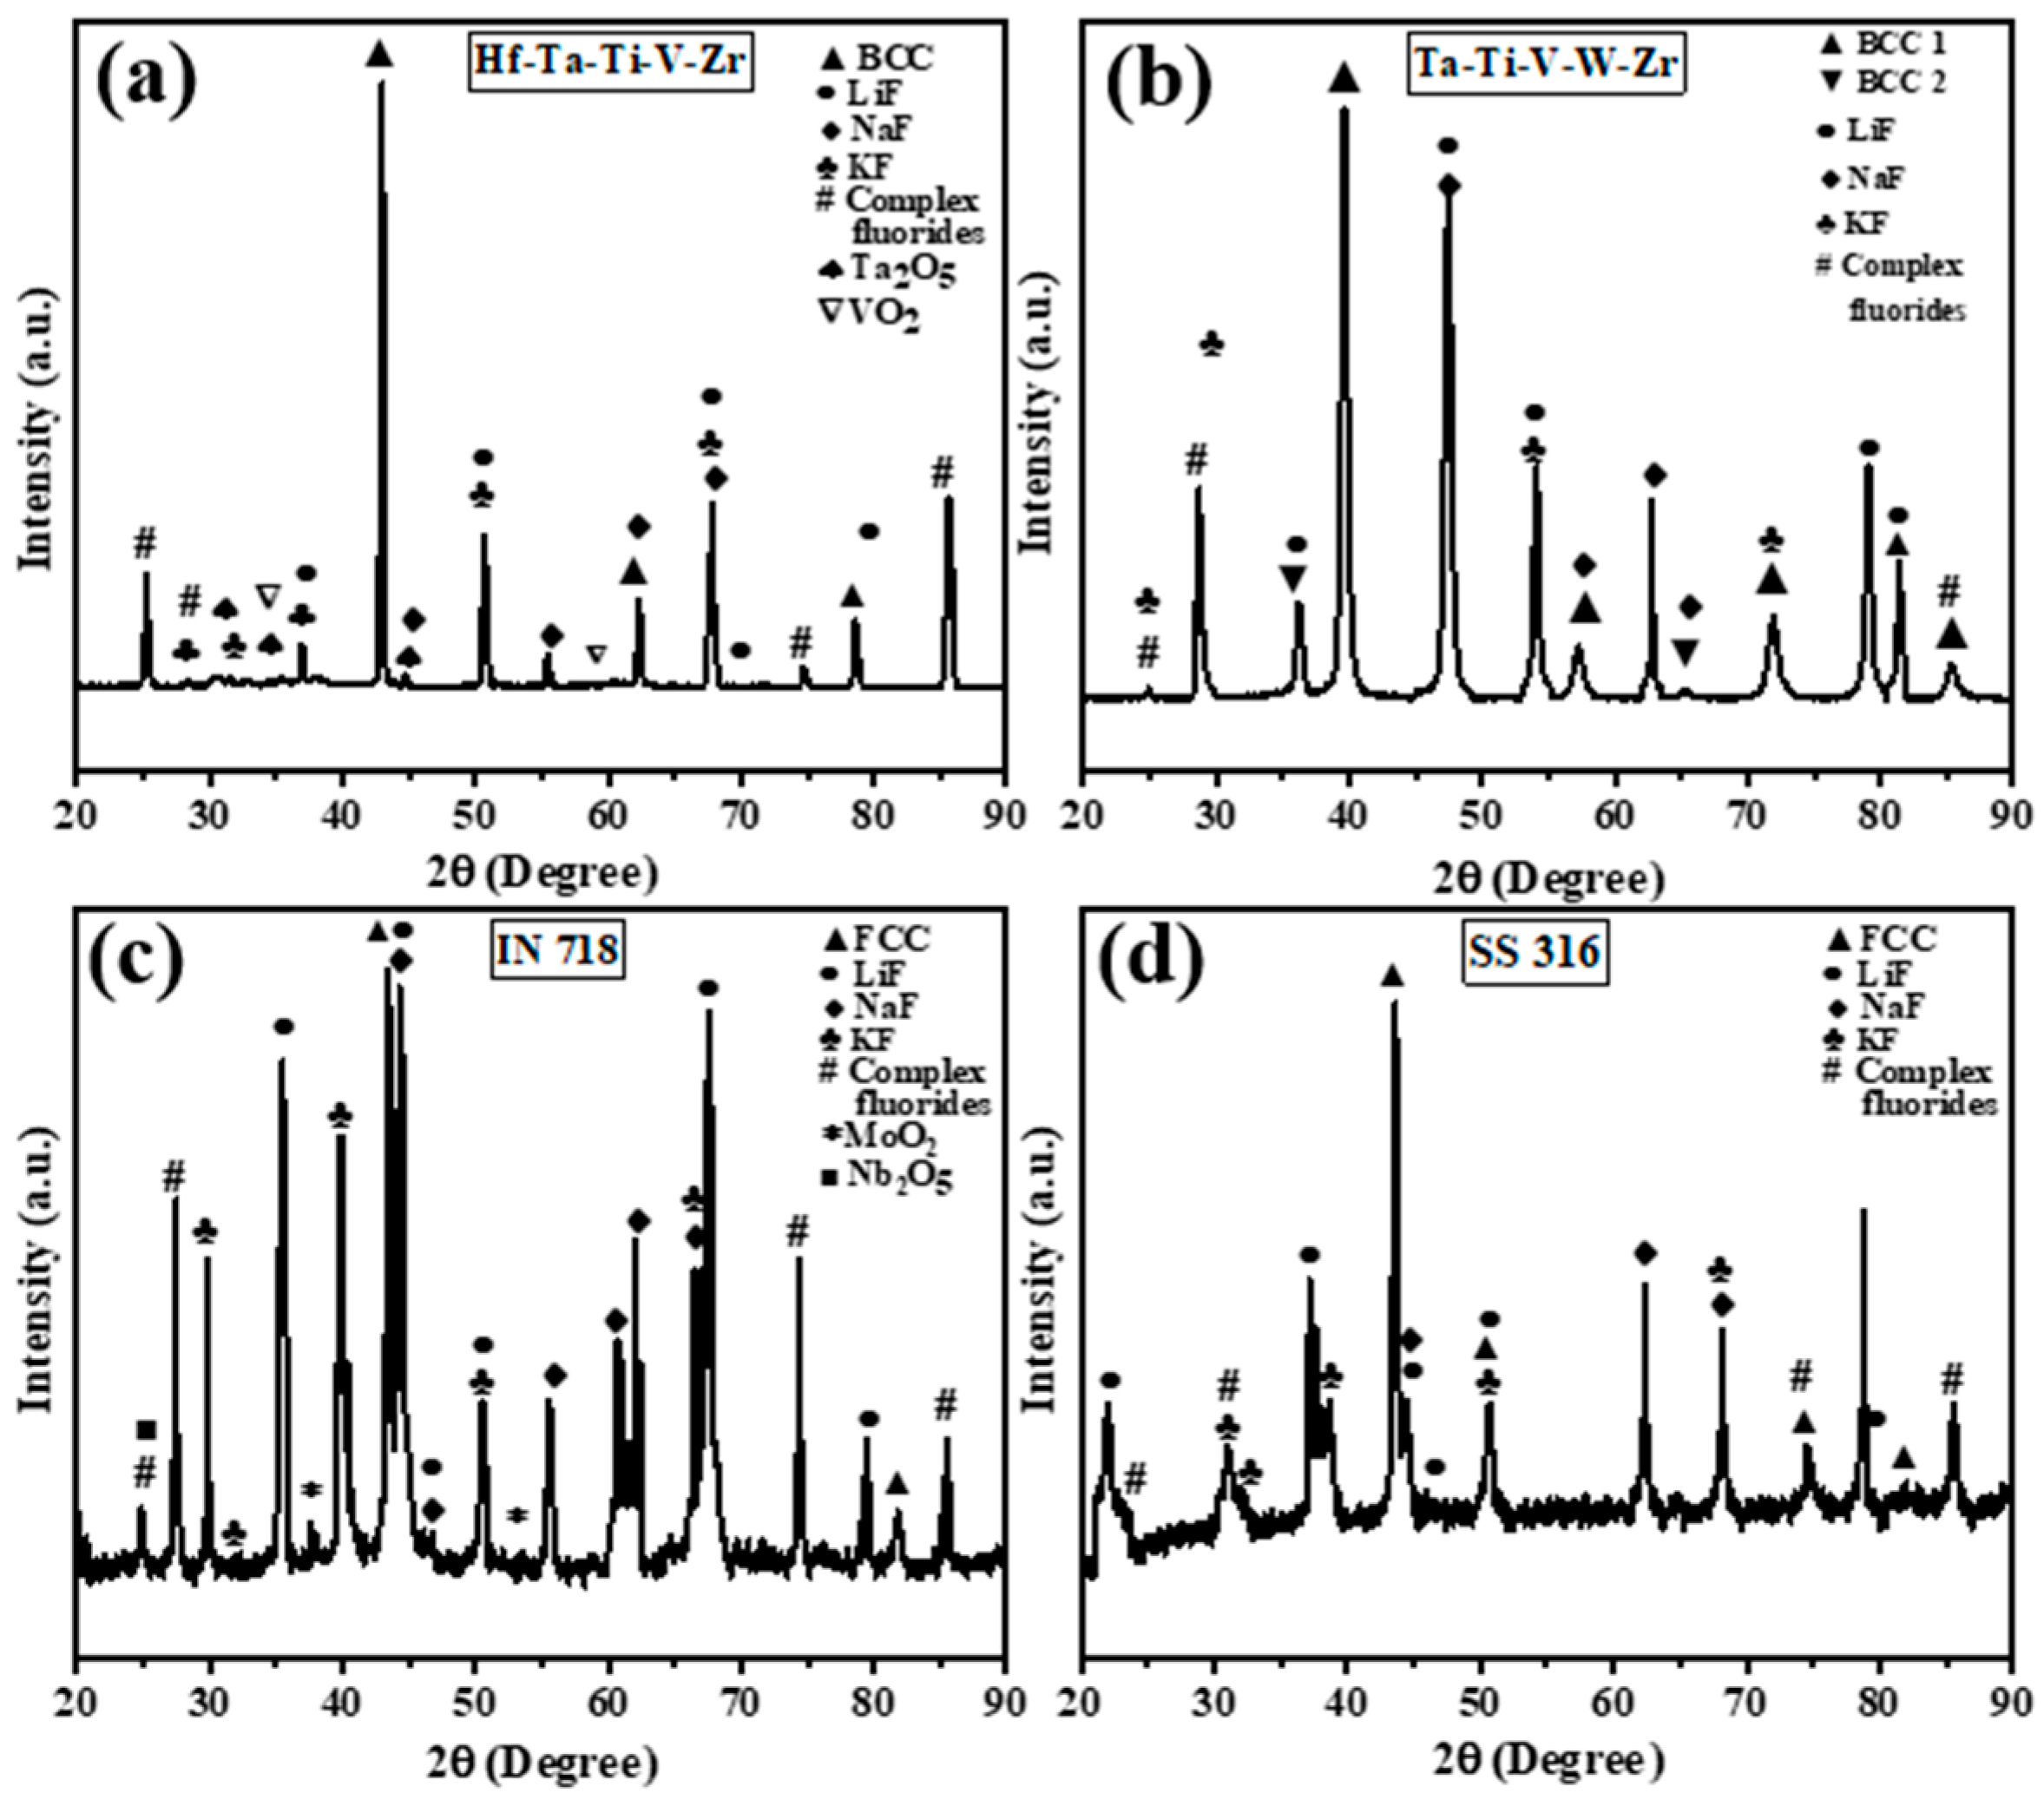
Figure 7a–d shows the XRD patterns after the immersion test for HfTaTiVZr, TaTiVWZr, IN 718, and SS316. Both the RHEAs showed peaks corresponding to BCC in HfTaTiVZr (Figure 7a) and BCC1 + BCC2 in TaTiVWZr (Figure 7b). The XRD peak analysis for HfTaTiVZr indicated that the corrosion products were in the form of Ta2O5 and VO2. For TaTiVWZr, the corrosion products mostly dissolved in the molten salt, and the presence of some complex fluorides was detected. For IN 718, a mixture of MoO2 and Nb2O5 was detected on the exposed surface. For SS 316, there was no indication of Ni–Cr–Fe oxide phases suggesting extensive dissolution of the alloying elements and lack of surface passivation layer. In addition to the salt constituents, other complex fluorides and unstable oxides were detected.
4. Discussion
The Gibbs free energy of the formation of potential corrosion products between the four alloys studied here and the molten salt constituents (LiF, NaF, KF) are shown in Table 4. The Gibbs free energy of formation was calculated with FactSage software (version 8.0, FactPS database, Montreal, QC, Canada) [46]. Impurities like moisture and metallic fluorideslead to thermodynamically driven corrosion mechanisms [10,22]. The diffusion rate of reactive alloying elements to the alloy-salt interface may further affect the molten salt corrosion process. The fluorination reaction between a metallic constituent of the alloy and the salt to form a metal fluoride can be described by the following reaction [20,47]:
where, Me is an alloying element (Me = Hf, W, Cr, V, Zr, Ni, Ti, Fe, Ta, etc.) and MF is a salt constituent. Unlike in oxygen-rich environments, surface passivation layers for commonly used alloys are chemically unstable and readily dissolve in molten fluoride salts. Table 4, Hf is prone to preferential dissolution in the molten salt due to the highest negative Gibbs free energy of fluoride formation. Among the RHEAs, HfTaTiVZr showed intergranular corrosion (Figure 6a), while TaTiVWZr showed non-uniform corrosion between the dendritic and inter-dendritic regions. The Ti–V–Zr-rich inter-dendritic region showed extensive pitting, while the Ta–W-rich dendritic region showed less corrosion (Figure 6b), possibly due to the less negative Gibbs free energy of tungsten fluoride formation. Mo- and Nb-based corrosion products in IN718 provide resistance against the de-alloying of less noble elements such as Cr and Fe. However, Mo and Nb do not form stable film but accumulate in the Cr-depleted regions in IN718. The value of Rct was highest for IN718 among all the tested alloys, indicating strong resistance against corrosion. In contrast, SS316 showed the lowest value of Rct, roughly half that of IN718, because of the active dissolution of the alloying elements and non-protective film on the surface.
5. Conclusions
The corrosion behavior and degradation mechanisms of HfTaTiVZr, TaTiVWZr, IN 718, and SS 316 were studied in molten FLiNaK salt under an Ar gas atmosphere at 650 °C. The main conclusions are as follows:
- The alloys’ overall corrosion rate followed the sequence of IN718 < TaTiVWZr < HfTaTiVZr < SS316. The TaTiVWZr refractory high-entropy alloy exhibited a corrosion rate similar to that of IN718.
- The corrosion products formed for IN718 and TaTiVWZr showed enrichment of noble alloying elements after the dissolution of less noble elements in molten FLiNaK salt.
- Analysis of the corroded surface indicated grain boundary corrosion for HfTaTiVZr and SS316 in contrast to pitting corrosion for IN718 and selective dissolution of the inter-dendritic region in TaTiVWZr.
Author Contributions
K.P.: Conceptualization, Validation, Formal analysis, Investigation, Writing—original draft. C.M.: Formal analysis, Investigation, Writing—original draft. S.M. (Saideep Muskeri): Formal analysis, Investigation. S.M. (Sundeep Mukherjee): Conceptualization, Validation, Supervision, Writing—review & editing. All authors have read and agreed to the published version of the manuscript.
Funding
This research did not receive any external funding.
Data Availability Statement
All the data obtained for this work are available upon request from the corresponding author.
Acknowledgments
We acknowledge the Advanced Materials and Manufacturing Processes Institute (AMMPI) and Materials Research Facility (MRF) at UNT.
Conflicts of Interest
The authors declare no conflict of interest.
References
- Murty, K.L.; Charit, I. Structural Materials for Gen-IV Nuclear Reactors: Challenges and Opportunities. J. Nucl. Mater. 2008, 383, 189–195. [Google Scholar] [CrossRef]
- Uhlíř, J. Chemistry and Technology of Molten Salt Reactors—History and Perspectives. J. Nucl. Mater. 2007, 360, 6–11. [Google Scholar] [CrossRef]
- Williams, D.F.; Toth, L.M.; Clarno, K.T. Assessment of Candidate Molten Salt Coolants for the Advanced High-Temperature Reactor (AHTR); United States Department of Energy: Washington, DC, USA, 2006; pp. 1–69. [Google Scholar]
- Bhatnagar, P.; Siddiqui, S.; Sreedhar, I.; Parameshwaran, R. Molten Salts: Potential Candidates for Thermal Energy Storage Applications. Int. J. Energy Res. 2022, 46, 17755–17785. [Google Scholar] [CrossRef]
- Le Brun, C. Molten Salts and Nuclear Energy Production. J. Nucl. Mater. 2007, 360, 1–5. [Google Scholar] [CrossRef] [Green Version]
- Patel, K.; Hasannaeimi, V.; Sadeghilaridjani, M.; Muskeri, S.; Mahajan, C.; Mukherjee, S. Molten Salt Corrosion Behavior of Dual-Phase High Entropy Alloy for Concentrating Solar Power Systems. Entropy 2023, 25, 296. [Google Scholar] [CrossRef]
- Kelly, J.E. Generation IV International Forum: A Decade of Progress through International Cooperation. Prog. Nucl. Energy 2014, 77, 240–246. [Google Scholar] [CrossRef]
- Wang, Y.; Liu, H.; Yu, G.; Hou, J.; Zeng, C. Electrochemical Study of the Corrosion of a Ni-Based Alloy GH3535 in Molten (Li,Na,K)F at 700 °C. J. Fluor. Chem. 2015, 178, 14–22. [Google Scholar] [CrossRef]
- Zhu, Y.; Qiu, J.; Hou, J.; Liu, W.; Chen, H.; Ai, H.; Yu, G.; Wang, J.; Zhou, X. Effects of SO42− Ions on the Corrosion of GH3535 Weld Joint in FLiNaK Molten Salt. J. Nucl. Mater. 2017, 492, 122–127. [Google Scholar] [CrossRef]
- Sohal, M.S.; Ebner, M.A.; Sabharwall, P.; Sharpe, P. Engineering Database of Liquid Salt Thermophysical and Thermochemical Properties; Idaho National Laboratory: Idaho Falls, ID, USA, 2010. [Google Scholar] [CrossRef] [Green Version]
- Patel, N.S.; Pavlík, V.; Boča, M. High-Temperature Corrosion Behavior of Superalloys in Molten Salts–A Review. Crit. Rev. Solid State Mater. Sci. 2017, 42, 83–97. [Google Scholar] [CrossRef]
- Khanna, A.S. Introduction to High Temperature Oxidation and Corrosion; ASM International: Almere, The Netherlands, 2002; p. 324. [Google Scholar]
- Koger, J.W. Effect of FeF2 Addition on Mass Transfer in a Hastelloy N: LiF--BeF2--UF4 Thermal Convection Loop System; Oak Ridge National Lab: Oak Ridge, TN, USA, 1972. [Google Scholar]
- Grimes, W.R. Molten-Salt Reactor Chemistry. Nucl. Appl. Technol. 1970, 8, 137–155. [Google Scholar] [CrossRef]
- Reiser, J.R.; DeVan, J.H.; Lawrence, E.J. Compatibility of Molten Salts with Type 316 Stainless Steel and Lithium. J. Nucl. Mater. 1979, 85–86, 295–298. [Google Scholar] [CrossRef] [Green Version]
- Misra, A.K.; Whittenberger, J.D. Fluoride Salts and Container Materials for Thermal Energy Storage Applications in the Temperature Range 973 to 1400 K; NASA Lewis Technical Memorandum; American Institute of Aeronautics and Astronautics: Reston VA, USA, 1987. [Google Scholar] [CrossRef] [Green Version]
- Olson, L.C.; Ambrosek, J.W.; Sridharan, K.; Anderson, M.H.; Allen, T.R. Materials Corrosion in Molten LiF-NaF-KF Salt. J. Fluor. Chem. 2009, 130, 67–73. [Google Scholar] [CrossRef]
- Raiman, S.S.; Lee, S. Aggregation and Data Analysis of Corrosion Studies in Molten Chloride and Fluoride Salts. J. Nucl. Mater. 2018, 511, 523–535. [Google Scholar] [CrossRef]
- Ye, X.X.; Ai, H.; Guo, Z.; Huang, H.; Jiang, L.; Wang, J.; Li, Z.; Zhou, X. The High-Temperature Corrosion of Hastelloy N Alloy (UNS N10003) in Molten Fluoride Salts Analysed by STXM, XAS, XRD, SEM, EPMA, TEM/EDS. Corros. Sci. 2016, 106, 249–259. [Google Scholar] [CrossRef]
- Sridharan, K.; Allen, T.R. Corrosion in Molten Salts. In Molten Salts Chemistry; Elsevier: Amsterdam, The Netherlands, 2013; pp. 241–267. [Google Scholar] [CrossRef]
- Danon, A.E.; Muránsky, O.; Karatchevtseva, I.; Zhang, Z.; Li, Z.J.; Scales, N.; Kruzic, J.J.; Edwards, L. Molten Salt Corrosion (FLiNaK) of a Ni–Mo–Cr Alloy and Its Welds for Application in Energy-Generation and Energy-Storage Systems. Corros. Sci. 2020, 164, 108306. [Google Scholar] [CrossRef]
- Xue, W.; Yang, X.; Ye, X.X.; Han, L.; Wang, J.; Ignatiev, V.; Zhou, X. Effects of Silicon Carbide on the Corrosion of Metallic Materials in Molten LiF-NaF-KF Salt. Corros. Sci. 2018, 143, 157–165. [Google Scholar] [CrossRef]
- Muránsky, O.; Yang, C.; Zhu, H.; Karatchevtseva, I.; Sláma, P.; Nový, Z.; Edwards, L. Molten Salt Corrosion of Ni-Mo-Cr Candidate Structural Materials for Molten Salt Reactor (MSR) Systems. Corros. Sci. 2019, 159, 108087. [Google Scholar] [CrossRef]
- Wang, Y.; Wu, J.; Wang, C.; Zhang, S. Electrochemical Corrosion Behavior of 316L Stainless Steel in Molten Fluorides with a Temperature Gradient. Electrochem. Commun. 2019, 109, 106612. [Google Scholar] [CrossRef]
- Miracle, D.B.; Senkov, O.N. A Critical Review of High Entropy Alloys and Related Concepts. Acta Mater. 2017, 122, 448–511. [Google Scholar] [CrossRef] [Green Version]
- Qiu, J.; Macdonald, D.D.; Schoell, R.; Han, J.; Mastromarino, S.; Scully, J.R.; Kaoumi, D.; Hosemann, P. Electrochemical Study of the Dissolution of Oxide Films Grown on Type 316L Stainless Steel in Molten Fluoride Salt. Corros. Sci. 2021, 186, 109457. [Google Scholar] [CrossRef]
- Chen, B.; Zhuo, L. Latest Progress on Refractory High Entropy Alloys: Composition, Fabrication, Post Processing, Performance, Simulation and Prospect. Int. J. Refract. Met. Hard Mater. 2023, 110, 105993. [Google Scholar] [CrossRef]
- Couzinié, J.P.; Senkov, O.N.; Miracle, D.B.; Dirras, G. Comprehensive Data Compilation on the Mechanical Properties of Refractory High-Entropy Alloys. Data Brief 2018, 21, 1622–1641. [Google Scholar] [CrossRef]
- Xiong, W.; Guo, A.X.Y.; Zhan, S.; Liu, C.-T.; Yeh, J.-W.; Cao, S.C. Refractory High-Entropy Alloys: A Focused Review of Preparation Methods and Properties. J. Mater. Sci. Technol. 2023, 142, 196–215. [Google Scholar] [CrossRef]
- Senkov, O.N.; Wilks, G.B.; Scott, J.M.; Miracle, D.B. Mechanical Properties of Nb25Mo25Ta 25W25 and V20Nb20Mo 20Ta20W20 Refractory High Entropy Alloys. Intermetallics 2011, 19, 698–706. [Google Scholar] [CrossRef]
- Senkov, O.N.; Miracle, D.B.; Chaput, K.J.; Couzinie, J.P. Development and Exploration of Refractory High Entropy Alloys—A Review. J. Mater. Res. 2018, 33, 3092–3128. [Google Scholar] [CrossRef] [Green Version]
- Indacochea, J.E.; Smith, J.L.; Litko, K.R.; Karell, E.J. Corrosion Performance of Ferrous and Refractory Metals in Molten Salts under Reducing Conditions. J. Mater. Res. 1999, 14, 1990–1995. [Google Scholar] [CrossRef]
- Dimiduk, D.M.; Perepezko, J.H. Mo-Si-B Alloys: Developing a Revolutionary Turbine-Engine Material. MRS Bull. 2003, 28, 639–645. [Google Scholar] [CrossRef]
- Patel, K.; Sadeghilaridjani, M.; Pole, M.; Mukherjee, S. Hot Corrosion Behavior of Refractory High Entropy Alloys in Molten Chloride Salt for Concentrating Solar Power Systems. Sol. Energy Mater. Sol. Cells 2021, 230, 111222. [Google Scholar] [CrossRef]
- Gao, G.; Stott, F.H.; Dawson, J.L.; Farrell, D.M. Electrochemical Monitoring of High-Temperature Molten-Salt Corrosion. Oxid. Met. 1990, 33, 79–94. [Google Scholar] [CrossRef]
- Wu, Y. Measurements of Double-Layer Capacitance at the Preoxidized Ni/Fused Na2SO4 Interface. J. Electrochem. Soc. 1991, 138, 2342–2344. [Google Scholar] [CrossRef]
- Zheng, X.; Rapp, R.A. Electrochemical Impedance of a Platinum Electrode in Fused Na2SO4 Melts in SO2-O2 Environments. J. Electrochem. Soc. 1993, 140, 2857–2862. [Google Scholar] [CrossRef]
- Nishina, T.; Uchida, I.; Selman, J.R. Gas Electrode Reactions in Molten Carbonate Media: Part V. Electrochemical Analysis of the Oxygen Reduction Mechanism at a Fully Immersed Gold Electrode. J. Electrochem. Soc. 1994, 141, 1191–1198. [Google Scholar] [CrossRef]
- Liu, C.; Devereux, O.F. Impedance Characteristics of Anodic Oxide Films Formed on NiAl in Molten Na2CO3. J. Electrochem. Soc. 1991, 138, 3349–3354. [Google Scholar] [CrossRef]
- Mahajan, C.; Hasannaeimi, V.; Pole, M.; Kautz, E.; Gwalani, B.; Mukherjee, S. Corrosion Mechanisms in Model Binary Metallic Glass Coatings on Mild Steel and Correlation with Electron Work Function. Corros. Sci. 2022, 207, 110578. [Google Scholar] [CrossRef]
- Brug, G.J.; Van Den Eeden, A.L.G.; Sluyters-rehbach, M.; Sluyters, J.H. The Analysis of Electrode Impedances Complicated by the Presence of a Constant Phase Element. J. Electroanal. Chem. 1984, 176, 275–295. [Google Scholar] [CrossRef]
- Ashassi-Sorkhabi, H.; Es’haghi, M. Corrosion Resistance Enhancement of Electroless Ni-P Coating by Incorporation of Ultrasonically Dispersed Diamond Nanoparticles. Corros. Sci. 2013, 77, 185–193. [Google Scholar] [CrossRef]
- Rodríguez, M.A.; Carranza, R.M. Properties of the Passive Film on Alloy 22 in Chloride Solutions Obtained by Electrochemical Impedance. J. Electrochem. Soc. 2011, 158, C221–C230. [Google Scholar] [CrossRef]
- Ren, J.; Mahajan, C.; Liu, L.; Follette, D.; Chen, W.; Mukherjee, S. Corrosion Behavior of Selectively Laser Melted CoCrFeMnNi High Entropy Alloy. Metals 2019, 9, 1029. [Google Scholar] [CrossRef] [Green Version]
- Weinstein, M.; Falconer, C.; Doniger, W.; Bailly-Salins, L.; David, R.; Sridharan, K.; Couet, A. Environmental Degradation of Electroplated Nickel and Copper Coated SS316H in Molten FLiNaK Salt. Corros. Sci. 2021, 191, 109735. [Google Scholar] [CrossRef]
- Bale, C.W.; Bélisle, E.; Chartrand, P.; Decterov, S.A.; Eriksson, G.; Gheribi, A.E.; Hack, K.; Jung, I.H.; Kang, Y.B.; Melançon, J.; et al. FactSage Thermochemical Software and Databases, 2010–2016. Calphad 2016, 54, 35–53. [Google Scholar] [CrossRef] [Green Version]
- Guo, S.; Zhang, J.; Wu, W.; Zhou, W. Corrosion in the Molten Fluoride and Chloride Salts and Materials Development for Nuclear Applications. Prog. Mater. Sci. 2018, 97, 448–487. [Google Scholar] [CrossRef]
Figure 1.
(a) Glove box and vertical tube furnace used as an electrochemical cell for molten-salt corrosion experiments; (b) schematic of the electrochemical cell with three electrodes for potentiodynamic polarization studies in molten FLiNaK salt.
Figure 1.
(a) Glove box and vertical tube furnace used as an electrochemical cell for molten-salt corrosion experiments; (b) schematic of the electrochemical cell with three electrodes for potentiodynamic polarization studies in molten FLiNaK salt.

Figure 2.
Backscattered SEM micrographs and respective EDS area map for (a) TaTiVWZr and (b) HfTaTiVZr refractory high-entropy alloys; XRD patterns for as-cast (c) TaTiVWZr and (d) HfTaTiVZr refractory high-entropy alloys [34]. Copyright 2021 Elsevier.
Figure 2.
Backscattered SEM micrographs and respective EDS area map for (a) TaTiVWZr and (b) HfTaTiVZr refractory high-entropy alloys; XRD patterns for as-cast (c) TaTiVWZr and (d) HfTaTiVZr refractory high-entropy alloys [34]. Copyright 2021 Elsevier.

Figure 3.
(a) Nyquist plots of HfTaTiVZr, TaTiVWZr, IN718, and SS316 alloys exposed to FLiNaK salt medium at 650 °C in Ar gas, (b) Equivalent circuit of impedance spectroscopy for the Nyquist plots of HfTaTiVZr, TaTiVWZr, IN718, and SS316.
Figure 3.
(a) Nyquist plots of HfTaTiVZr, TaTiVWZr, IN718, and SS316 alloys exposed to FLiNaK salt medium at 650 °C in Ar gas, (b) Equivalent circuit of impedance spectroscopy for the Nyquist plots of HfTaTiVZr, TaTiVWZr, IN718, and SS316.

Figure 4.
(a) Open Circuit Potential (EOCP) curves of the alloys for 1 h of exposure time and (b) potentiodynamic polarization curves in molten FLiNaK salt at 650 °C in an Ar gas atmosphere.
Figure 4.
(a) Open Circuit Potential (EOCP) curves of the alloys for 1 h of exposure time and (b) potentiodynamic polarization curves in molten FLiNaK salt at 650 °C in an Ar gas atmosphere.

Figure 5.
SEM image of the surface after electrochemical test at 650 °C for: (a) HfTaTiVZr, (b) TaTiVWZr, (c) IN718, and (d) SS316; the insets in figures (a) through (d) show a zoomed-in view of the corroded surface indicating grain boundary corrosion for HfTaTiVZr and SS316 in contrast to pitting corrosion for IN718 and selective corrosion of inter-dendritic region in TaTiVWZr.

Figure 6.
Cross-section EDS maps of the alloys exposed to molten FLiNaK salt under Ar atmosphere at 650 °C for: (a) HfTaTiVZr, (b) TaTiVWZr, (c) IN718, and (d) SS316.
Figure 6.
Cross-section EDS maps of the alloys exposed to molten FLiNaK salt under Ar atmosphere at 650 °C for: (a) HfTaTiVZr, (b) TaTiVWZr, (c) IN718, and (d) SS316.

Figure 7.
The XRD spectra obtained from the surface of (a) HfTaTiVZr, (b) TaTiVWZr, (c) IN718, and (d) SS316 alloys after immersion test in molten FLiNaK salt at a temperature of 650 °C for a duration of 60 h.
Figure 7.
The XRD spectra obtained from the surface of (a) HfTaTiVZr, (b) TaTiVWZr, (c) IN718, and (d) SS316 alloys after immersion test in molten FLiNaK salt at a temperature of 650 °C for a duration of 60 h.


Table 1.
Equivalent circuit parameters from EIS study in molten FLiNaK salt at 650 °C.
| Alloy | Rs Ω·cm2 | Rf Ω·cm2 | Rct Ω·cm2 | Rp Ω·cm2 | CPEdl S·sn | ndl | Cdl F/cm2 |
|---|---|---|---|---|---|---|---|
| HfTaTiVZr | 0.785 | 12.3 | 36.2 | 47.8 | 19.84 | 0.605 | 117.6 |
| TaTiVWZr | 0.750 | 10.4 | 32.24 | 41.9 | 20.18 | 0.576 | 146.2 |
| IN718 | 0.861 | 15.94 | 41.84 | 56.9 | 16.38 | 0.626 | 78.9 |
| SS316 | 0.532 | 9.12 | 20.44 | 29.06 | 25.6 | 0.485 | 401.6 |
Table 2.
Summary of potentiodynamic polarization results in FLiNaK salt at 650 °C in Ar gas atmosphere.
Table 2.
Summary of potentiodynamic polarization results in FLiNaK salt at 650 °C in Ar gas atmosphere.
| Alloy | EOCP (mV) | Ecorr (mV) | jcorr (mA/cm2) | CR (mmpy) | Mass Loss (mmpy) |
|---|---|---|---|---|---|
| HfTaTiVZr | 17 | −160 | 5.8 | 43 ± 6 | 72 ± 5 |
| TaTiVWZr | −410 | −480 | 2.1 | 23 ± 3 | 76 ± 4 |
| IN718 | −280 | −252 | 1.7 | 19 ± 1 | 39 ± 2 |
| SS316 | −735 | −744 | 12.4 | 114 ± 8 | 113 ± 5 |
Table 3.
Dissolved metal concentration (in ppm) determined by ICP-OES after corrosion test at 650 °C with reference to the salt before the corrosion test (i.e., immediately following salt pre-conditioning); error ± 5%.
Table 3.
Dissolved metal concentration (in ppm) determined by ICP-OES after corrosion test at 650 °C with reference to the salt before the corrosion test (i.e., immediately following salt pre-conditioning); error ± 5%.
| Material Studied | Hf | Ta | Ti | V | W | Zr | Cr | Fe | Ni | Mo |
|---|---|---|---|---|---|---|---|---|---|---|
| Salt | <0.1 ± 0.005 | <0.1 ± 0.005 | <0.1 ± 0.005 | 0.89 ± 0.04 | <0.1 ± 0.005 | 0.64 ± 0.03 | 5.38 ± 0.2 | 8.45 ± 0.4 | 12.64 ± 0.5 | 1.32 ± 0.06 |
| HfTaTiVZr | 11.68 ± 0.5 | 1.94 ± 0.09 | 8.34 ± 0.4 | 5.1 ± 0.2 | - | 5.18 ± 0.26 | - | - | - | - |
| TaTiVWZr | - | 1.65 ± 0.08 | 4.12 ± 0.2 | 1.3 ± 0.06 | 0.69 ± 0.03 | 6.82 ± 0.4 | - | - | - | - |
| IN718 | - | - | - | - | - | - | 0.5 ± 0.1 | 0.76 ± 0.04 | 8.56 ± 0.4 | 1.25 ± 0.06 |
| SS316 | - | - | - | - | - | - | 27.27 ± 1.1 | 8 ± 0.36 | 9.48 ± 0.5 | - |
Table 4.
Gibbs free energy of formation (ΔfGo) of metal fluorides and potential corrosion products per mol of F2 evaluated at 650 °C.
Table 4.
Gibbs free energy of formation (ΔfGo) of metal fluorides and potential corrosion products per mol of F2 evaluated at 650 °C.
| Fluoride | ΔfGo (kJ/mol F2) |
|---|---|
| LiF (l) | −1056.8 |
| NaF (l) | −956.5 |
| KF (l) | −935.0 |
| HfF4 (g) | −802.65 |
| VF2 (l) | −773.22 |
| ZrF2 (g) | −737.82 |
| TiF2 (g) | −701.46 |
| TaF5 (g) | −628.39 |
| CrF2 (l) | −578.32 |
| FeF2 (l) | −520.74 |
| NiF2 (l) | −435.26 |
| WF6 (g) | −473.58 |
| MoF6 (g) | −423.86 |
Disclaimer/Publisher’s Note: The statements, opinions and data contained in all publications are solely those of the individual author(s) and contributor(s) and not of MDPI and/or the editor(s). MDPI and/or the editor(s) disclaim responsibility for any injury to people or property resulting from any ideas, methods, instructions or products referred to in the content. |
© 2023 by the authors. Licensee MDPI, Basel, Switzerland. This article is an open access article distributed under the terms and conditions of the Creative Commons Attribution (CC BY) license (https://creativecommons.org/licenses/by/4.0/).
Share and Cite
MDPI and ACS Style
Patel, K.; Mahajan, C.; Muskeri, S.; Mukherjee, S. Corrosion Behavior of Refractory High-Entropy Alloys in FLiNaK Molten Salts. Metals 2023, 13, 450. https://doi.org/10.3390/met13030450
AMA Style
Patel K, Mahajan C, Muskeri S, Mukherjee S. Corrosion Behavior of Refractory High-Entropy Alloys in FLiNaK Molten Salts. Metals. 2023; 13(3):450. https://doi.org/10.3390/met13030450
Chicago/Turabian StylePatel, Kunjal, Chaitanya Mahajan, Saideep Muskeri, and Sundeep Mukherjee. 2023. "Corrosion Behavior of Refractory High-Entropy Alloys in FLiNaK Molten Salts" Metals 13, no. 3: 450. https://doi.org/10.3390/met13030450
Note that from the first issue of 2016, this journal uses article numbers instead of page numbers. See further details here.