
Influence of FeS2 and FeSi75 in Double-Chamber Sample Cup on Thermal Analysis Curve and Graphite Morphology of Molten Iron


1
School of Materials Science and Engineering, Shandong University, Jinan 250061, China
2
School of Materials and Chemistry, University of Shanghai for Science and Technology, Shanghai 200093, China
3
Qiqihar Heavy Casting Co., Ltd., Qiqihaer 161005, China
4
School of Mechanical and Energy Engineering, Shanghai Technical Institute of Electronics and Information, Shanghai 201411, China
*
Author to whom correspondence should be addressed.
Metals 2023, 13(2), 302; https://doi.org/10.3390/met13020302
Submission received: 29 December 2022
/
Revised: 28 January 2023
/
Accepted: 29 January 2023
/
Published: 1 February 2023
(This article belongs to the Special Issue Advanced Tundish Metallurgy and Clean Steel Technology)
Abstract
:In the production of vermicular graphite cast iron, the allowable range of residual magnesium content in molten iron after treatment is very narrow, amounting to only 0.008%. Therefore, thermal analysis technology was used to quickly evaluate the vermiculation and inoculation level of molten iron at the furnace itself, thus allowing the molten iron to be adjusted in time. The additives in the sample cups play a crucial role in obtaining cooling curves with remarkable characteristics. In this study, either FeS2 or FeSi75 additives were added to one chamber of a double-chamber sample cup made of resin sand, in which the cavities of the double chambers were spherical with diameters of 30 mm. The thermal analysis curves of molten iron in the double-chamber sample cup were acquired using a double channel temperature recorder, and the solidified spherical samples were analyzed quantitatively. The influence of FeS2 or FeSi75 additives on both the cooling curves of molten iron and the graphite morphology were investigated. The experiment’s results indicated that when 0.05% FeS2 is added to one chamber of the sample cup, the cooling curve changes to the solidification pattern of gray cast iron. The continuous increase in the FeS2 additive has little influence on the shape of cooling curves, and the graphite changes form from vermicular to flaked. When the amount of FeS2 is increased from 0.05% to 0.10%, the resulting graphite changes from D-type and E-type to A-type and B-type. When the amount of FeS2 reaches 0.20%, the morphology of graphite is short and thick. With the increase in the amount of FeSi75 additive, the amount of spherical graphite in the sample cup increases gradually, and the vermicularity decreases gradually from 89% to 46%. With the increase in FeSi75 additive from 0 to 0.45%, we observed that the average diameter of graphite decreases from 23 μm to 19 μm and then increases to 22 μm. The eutectic recalescence temperature shows a decreasing trend, and the cooling curve gradually changes from a hypoeutectic to a eutectic pattern. The addition of 0.05% FeS2 or 0.45% FeSi75 to one chamber is more appropriate for a double-chamber sample cup with two spherical cavities with diameters of 30 mm. This lays a foundation for the optimization of additives when using the double-chamber sample cup for thermal analysis of vermicular graphite cast iron.
1. Introduction
The tensile strength and hardness of vermicular graphite cast iron are between that of nodular graphite cast iron and gray cast iron, but the heat fatigue resistance and machinability are better than those of nodular graphite cast iron [1,2,3]. Moreover, the good casting performance, wear resistance, and compactness make it widely used in working environments of high mechanical thermal stress, such as in large diesel engines with high power density [4,5,6]. Vermicularity is one of the most important parameters for evaluating vermicular graphite cast iron. Generally, the vermicularity must be higher than 80% [7]. However, because the residual magnesium content of qualified vermicular graphite cast iron is only 0.01–0.018%, the narrow range makes the production process relatively complex [8]. It is therefore necessary to evaluate the vermiculation effect of molten cast iron, and thus accurately adjust the amount of vermicular agent in order to obtain qualified products with 80% or higher vermicularity.
Due to its advantages of rapidity, simplicity and accuracy, the thermal analysis method is widely used in foundries for purposes such as the determination of carbon equivalent and carbon silicon content in molten iron, the evaluation of graphite morphology in nodular graphite cast iron, and the prediction of the chemical composition and mechanical properties of gray cast iron [9,10,11]. Presently, it is also one of the most common methods that can be used to quickly predict the vermiculation and inoculation effect in vermicular graphite cast iron [12], but its insufficient prediction accuracy and slow prediction speed are urgent problems to be solved. In thermal analysis technology of SinterCast, a special metal sample cup was used for immersion in molten iron for sampling, and the inoculation index and modification index were used to present the quality of molten iron. Its key technological aim is to achieve a rapid prediction in front of the furnace through the corresponding relationship between its inoculation index, modification index and vermicularity [13,14]. For OCC thermal analysis, an appropriate amount of molten iron was poured into a special sand sample cup to predict and analyze the vermiculation and inoculation level [15]. If the vermiculation and inoculation indices reached the predetermined required range, the molten iron was allowed to enter the production line; otherwise, the opposite was true. Obviously, during the process of thermal analysis, the sample cup occupies an extremely important role which directly determines the accuracy of the measuring results [16,17]. Cree et al. [18] investigated four different thermal analysis sample cup types for the control of ductile base iron. Through comparative testing of each cup type to gage repeatability and reproducibility, it was concluded that when the cups are used for real-time control of the respective carbon equivalent, carbon, and silicon contents of ductile base iron, the “round and plain” and “square and tellurium” cups perform superiorly to the “round and tellurium” and “square and plain” cups. Shi et al. [19] studied the feasibility of achieving cooling curves with obvious characteristic points using a wet sample cups made of green sand. Taking full consideration of the thermocouple position in addition to the volume and thickness of the sample cups, a set of molds was designed to make wet sample cups of differing dimensions. The results showed that the wet sample cup is feasible only for specific alloys, and that the cooling curves of eutectic Al-Si alloys and LY12 aluminum alloys can be obtained. Kanno et al. [20] developed one-cup thermal analysis and investigated if the quality of molten metal in ductile cast iron can be predicted. The results showed that one-cup thermal analysis is a good method for predicting the graphite nodule count and shrinkage tendency (even in ductile cast iron) prior to pouring.
When the structure of the sample cup is fixed, the additive becomes an important factor of obtaining different thermal analysis curves [21]. Kanno et al. [22] used three cups with an inoculant, Tellurium, and a null modifier, respectively, to investigate the relationship between the thermal analysis curve and chill depth, concluding that a thermal analysis consisting of three cups can serve as an efficient method for the rapid prediction of the chilling tendency of cast iron melts. Boonmee et al. [23] also predicted the chill formation of gray cast iron by simultaneously pouring the tellurium-containing cup and non-tellurium cup. The tellurium addition ensured the iron carbide formation which, in turn, provided the metastable eutectic temperature of the melts, resulting in differences between the cooling curves.
On the basis of the above analysis, there are few studies on the influence that the type and amount of additive in the double-chamber sample cup have on the cooling curves and graphite morphology, which is very important for obtaining clear cooling curve characteristic points and for effectively predicting the vermiculation effect of molten iron. Therefore, in this study, the influences of FeS2 and FeSi75 in a double-chamber sample cup were investigated using experiments, and the optimal additive was ascertained. The 0.05% FeS2 or 0.45% FeSi75 additives are most appropriate for the double-chamber sample cup.
2. Experimental Section
The experiments were conducted in a workshop involved in the production of vermicular graphite cast iron. The main raw materials used in experiments were pig iron Q10 and scrap steel Q235A. Graphite carburizer, ferrosilicon, and ferromanganese were used to adjust the carbon content, silicon content, and manganese content of molten iron, respectively. The nominal chemical compositions of vermicular graphite cast iron are shown in Table 1.
A medium-frequency induction furnace was used for melting cast iron, and the amount of molten iron was 30 kg. The molten iron was tapped from the furnace into a ladle at 1450 °C ± 10 °C, and was then vermiculated and inoculated using the sandwich treatment method. A modifier of FeSiMg5RE1 with chemical compositions of Mg 5–6%, RE 0.5–1.5%, Ca 1.5–2.5%, Si 40–44%, and Al 0.8–1.0% was used as the vermicular agent, and 75# ferrosilicon was used as the inoculant. The sizes of the vermicular agent and inoculant were 3–5 mm, and the vermicular agent was coved by the inoculant in order for the boiling effect produced by the reaction between the vermicular agent and molten iron at high temperature to make the distribution of inoculant more uniform, and thus achieve a good inoculation effect.
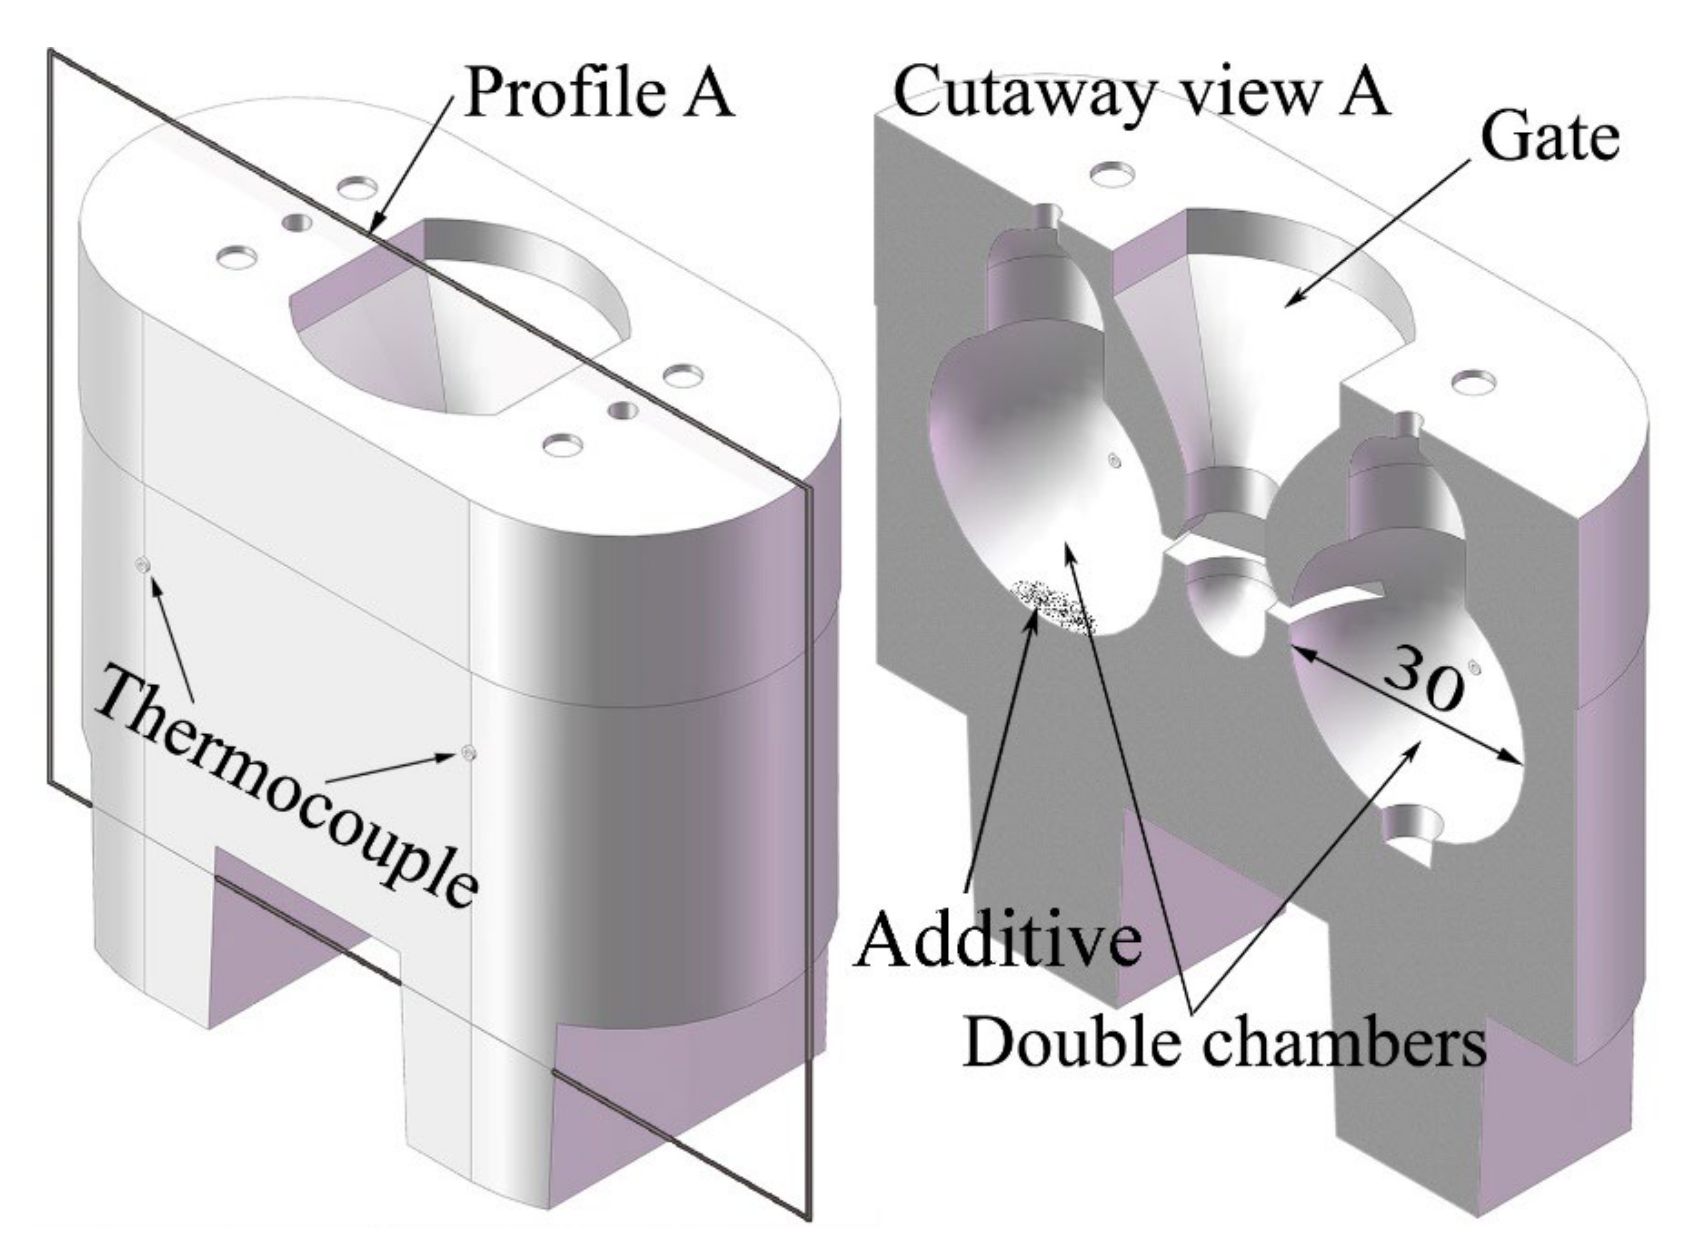
Two K-type thermocouples were mounted at the geometric center of the two chambers of the sample cup, with the cavity of the two chambers each being spherical, with diameters of 30 mm. The analytical reagents of FeS2 or FeSi75 were used as additives, and were affixed to the inner surface of one chamber in order to investigate the influences of additives on the thermal analysis curves and graphite morphology. The structure and size of the double-chamber sample cup is shown in Figure 1. The properties and amounts of additives are shown in Table 2.
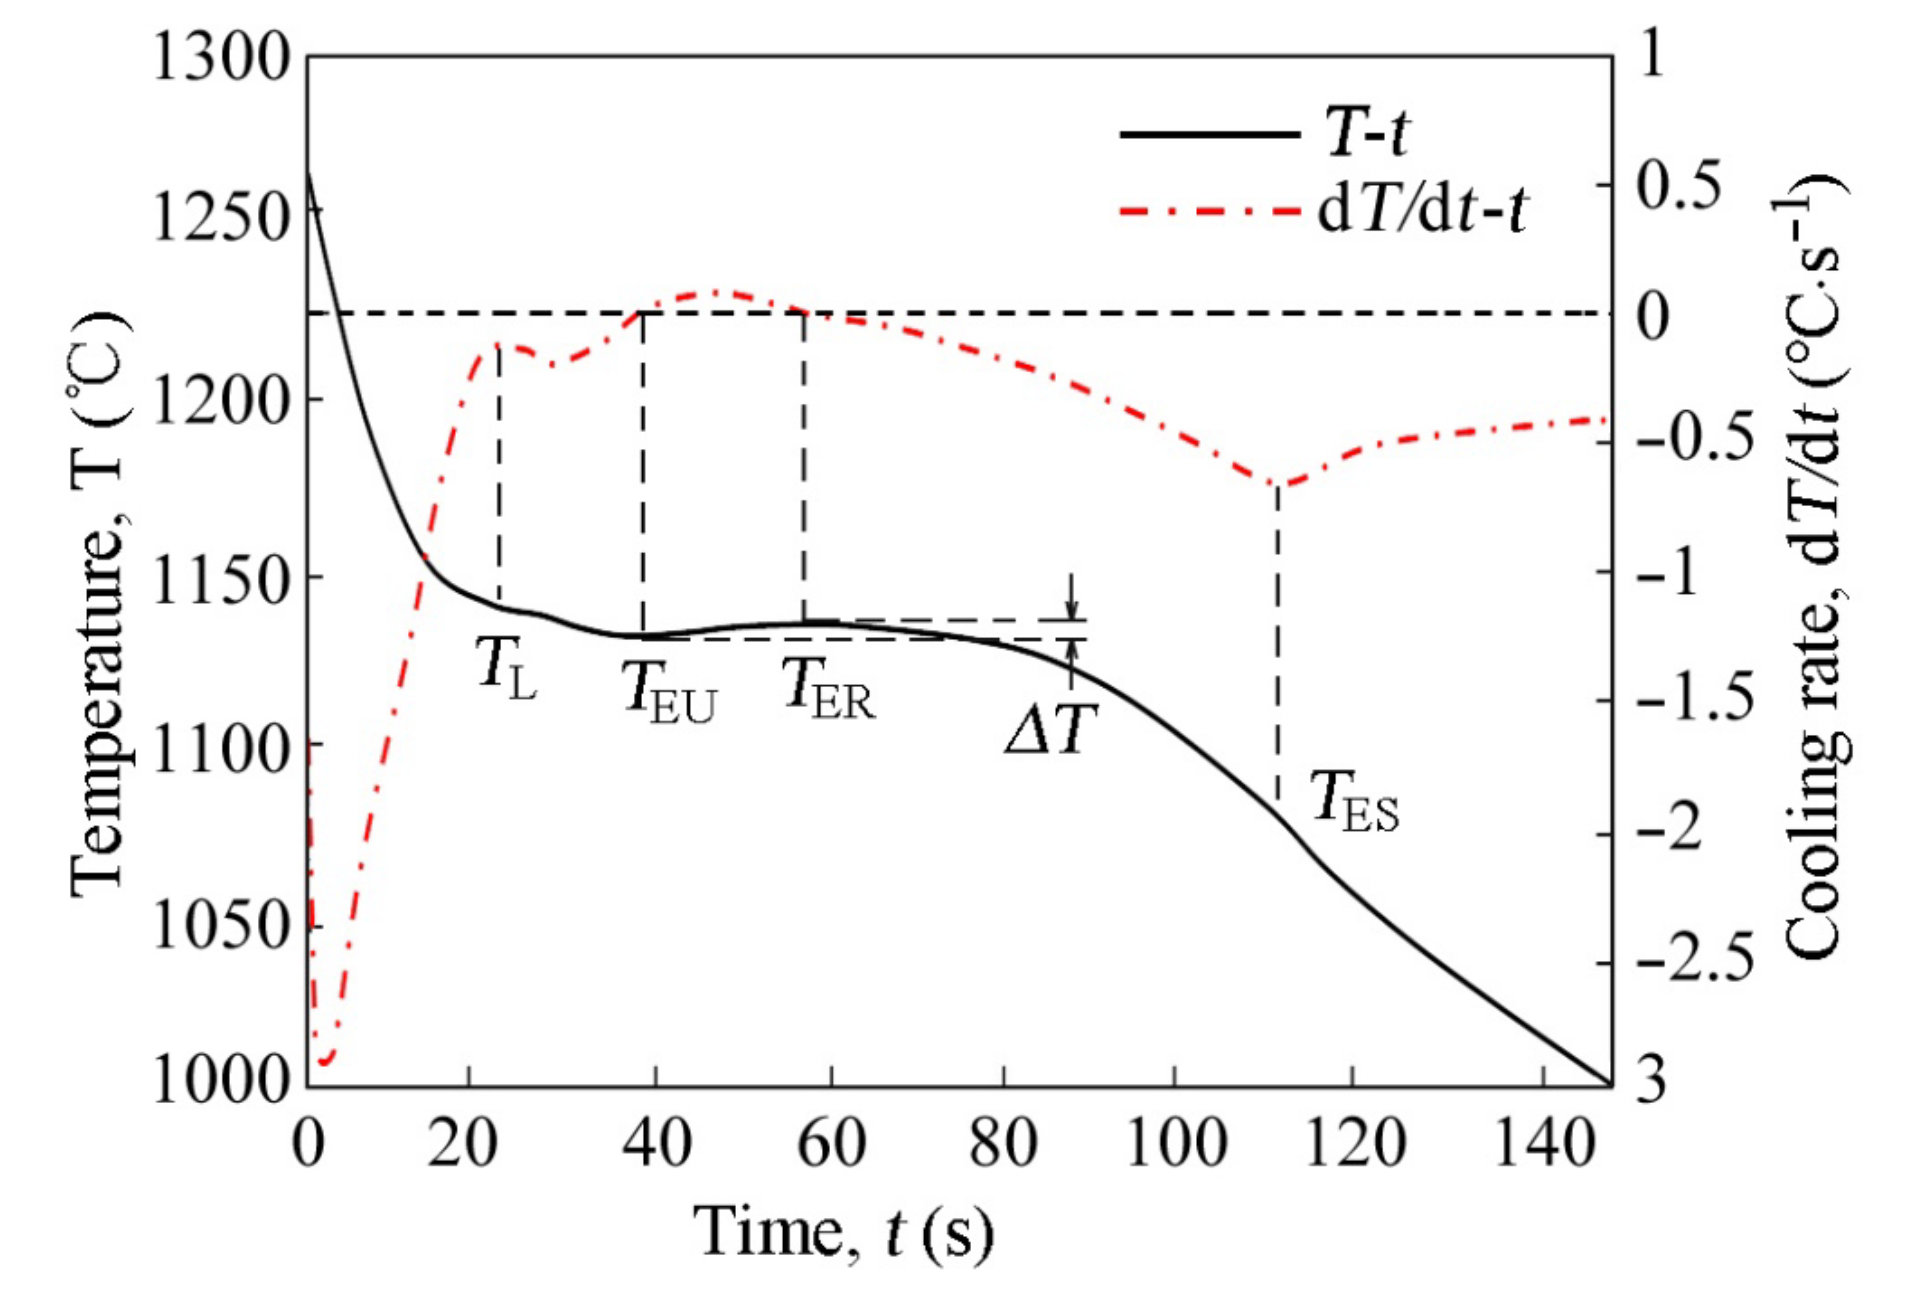
During the experiments, the molten iron after vermiculation and inoculation was poured into the double-chamber sample cup, and the thermal analysis curves were acquired using a double channel temperature recorder (HF-08T, Tianjin Huifeng Thermo Sensor Equipment Co. Ltd., Tianjin, China). The typical cooling curves (T-t) and differential curves (dT-dt) with the thermal analysis characteristic temperatures are shown in Figure 2, and the meaning of each characteristic temperature is shown in Table 3.
After solidification, a metallographic sample was taken from the middle of the cast iron sphere, and the vermicularity and graphite average size were measured using a metallurgical microscope FL8000 with the quantitative metallographic software JX2015 (Jinan Fengzhi Test Instrument Co. Ltd., Jinan, China) based on GB/T 26656 and GB/T 6394 of China, respectively. When the vermicularity was measured using JX2015, the metallographic sample was magnified by 100 times, with a field diameter of no less than 70 mm. The graphite cut with the field boundary was ignored. The vermicularity was then calculated according to the area method, namely:
where η is the vermicularity, Avermiculars is the area of particles classified as vermicular graphite (similar to form III, according to ISO 945-1), Aintermediates is the area of particles classified as intermediate forms of graphite (similar to form IV and form V, according to ISO 945-1); Aall particles is the area of all graphite particles greater than or equal to 10 μm.
3. Results and Discussions
3.1. Influence of FeS2 Additive on Thermal Analysis Curves and Graphite Morphology
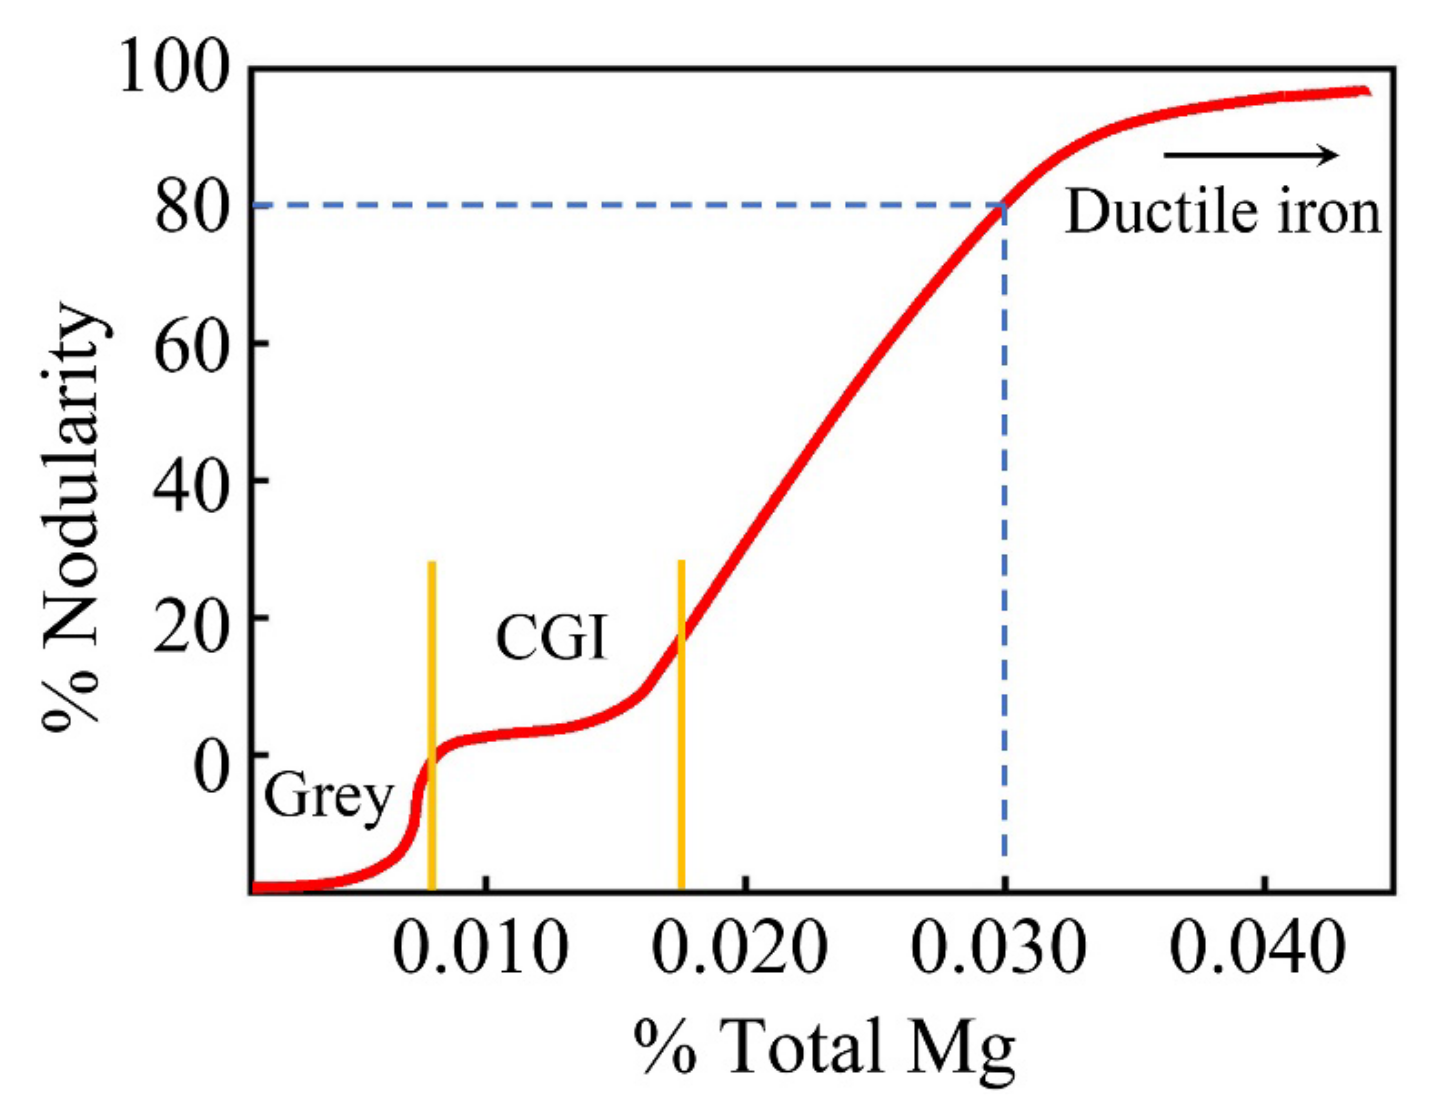
The purpose of adding FeS2 into one chamber of the sample cup is to consume the residual magnesium in the molten iron by increasing the sulfur content. With the decrease in residual magnesium content, the graphite will change from spherical to vermicular and then to flaked, as shown in Figure 3 [24]. The cooling curves will also change accordingly. The vermiculating and inoculation effects of molten iron were investigated by analyzing the difference between the cooling curves obtained from the two chambers.
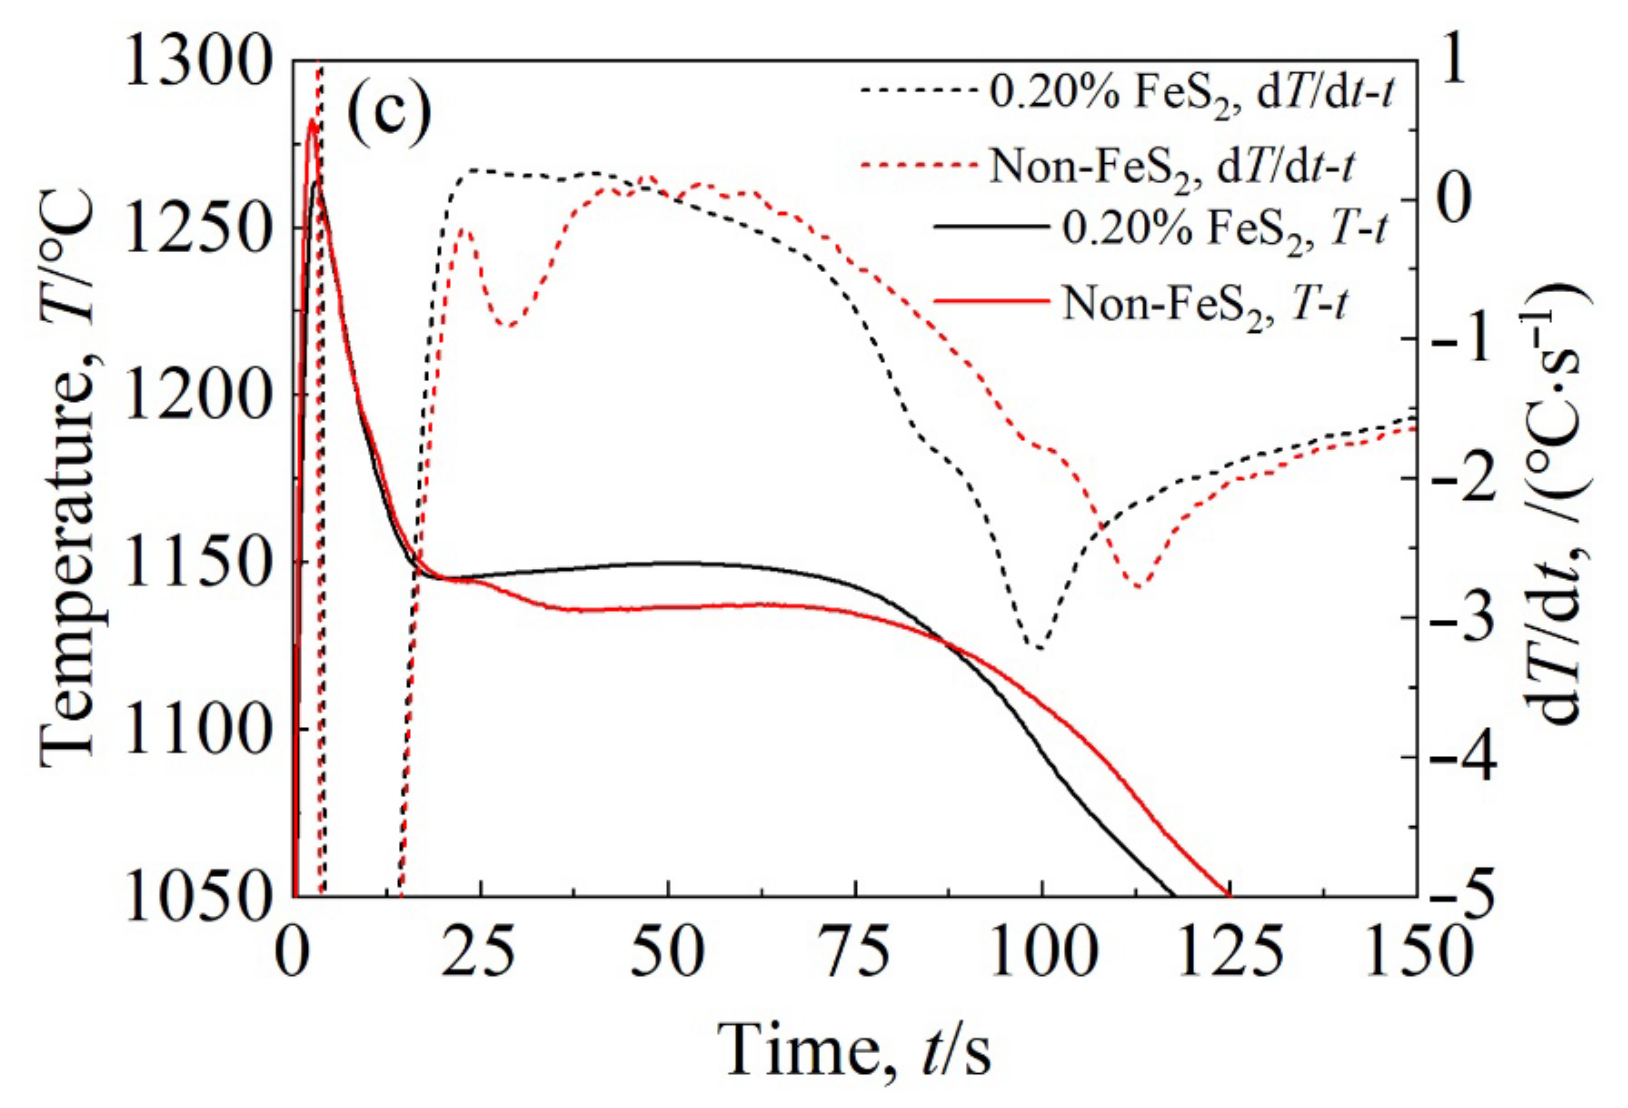
Figure 4 shows the cooling curves (T-t) and differential curves (dT-dt) obtained using the double-chamber sample cup with different amounts of the FeS2 additive. As can be seen from Figure 4, since the same molten iron was poured into the double-chamber sample cup with different amounts of the FeS2 additive. The cooling curves of the one chamber without FeS2 are almost the same, but the cooling curves and differential curves of the chamber with FeS2 additive show a significant change. Furthermore, the key characteristic parameters extracted from the thermal analysis curves are shown in Table 4, and the graphite morphologies of the central area of the thermal analysis sample, which correspond to the different cooling curves, are shown in Figure 5.
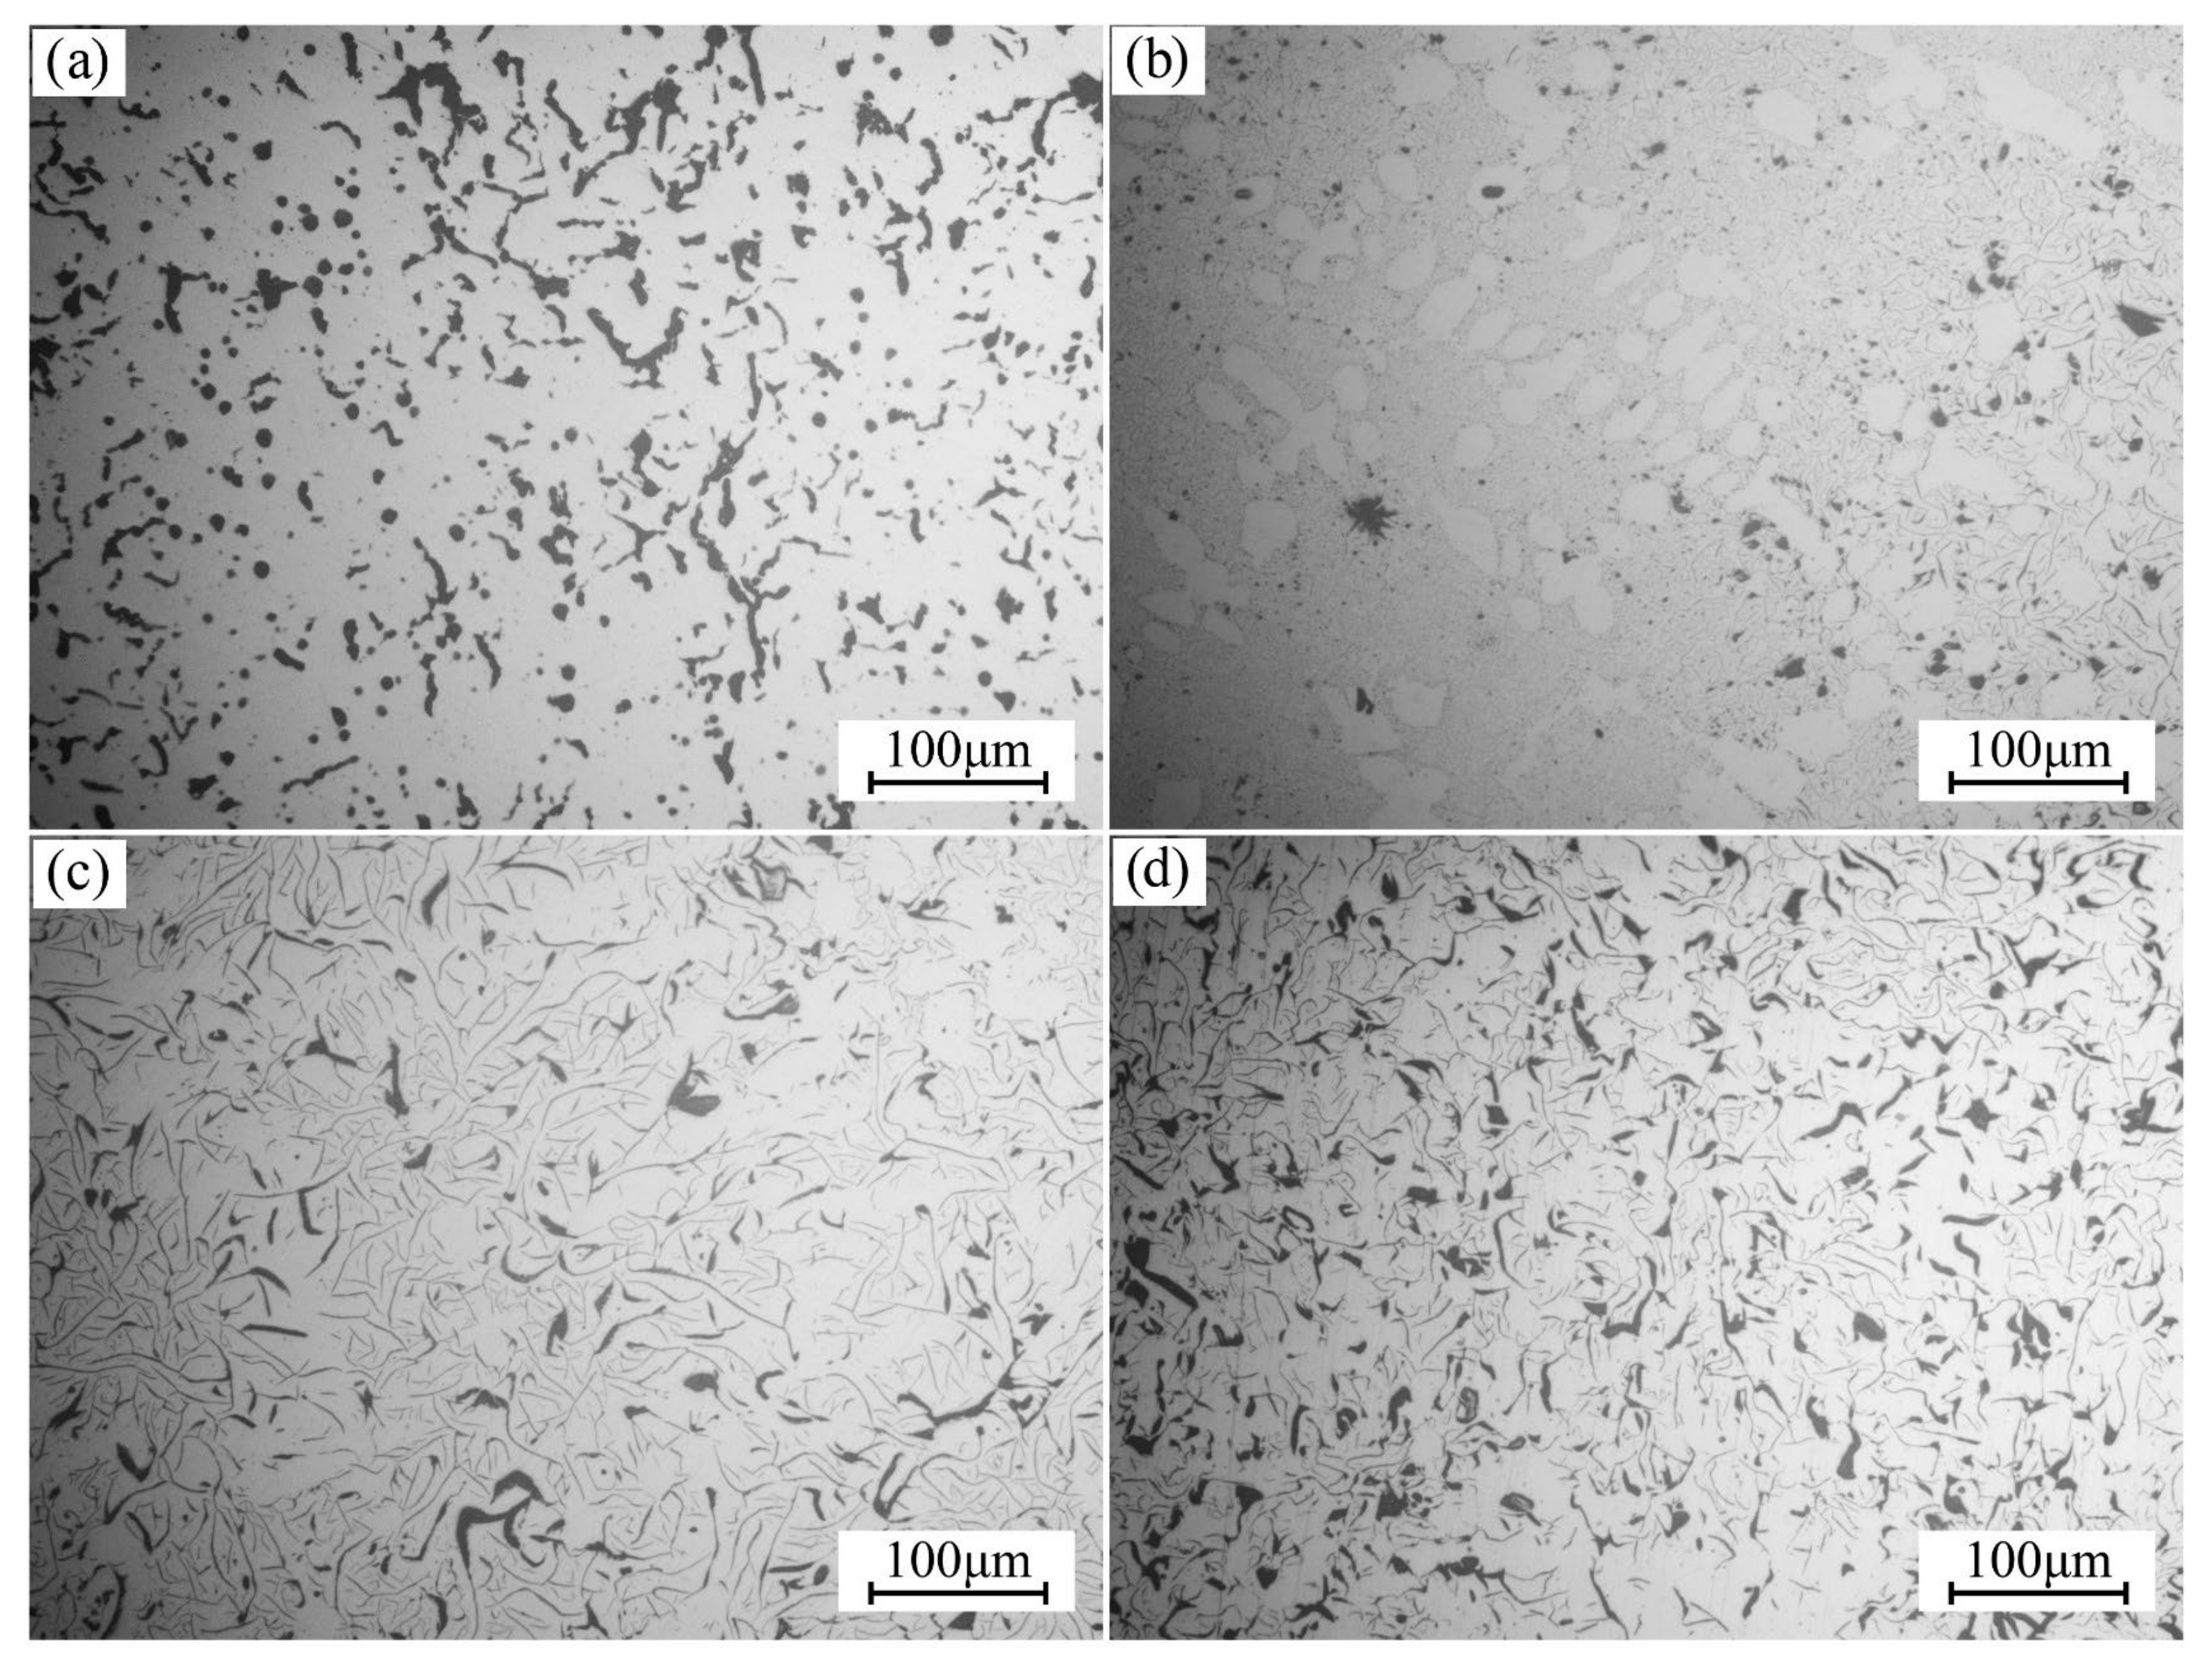
Figure 5 indicates that the graphite morphology changed significantly after the FeS2 additive was added. When the FeS2 additive increased from 0% to 0.05%, the vermicular graphite and spherical/nodular graphite changed into long strip graphite and star/point graphite, as shown in Figure 5b. At that time, the matrix structure appeared more dendritic in its development, and there was more D-type and E-type graphite in the microstructure. When the FeS2 additive increased to 0.10%, there was no obvious dendrite in the resulting matrix, and the morphology of D-type and E-type graphite disappeared. After that, the graphite was mainly composed of A-type, partial B-type, and a small amount of point graphite, as shown in in Figure 5c. When the 0.20% FeS2 was added into the sample cup, the graphite morphology presented a short, thick shape. It can also be seen from Table 3 that after the FeS2 was added, the difference between ΔT2 and ΔT1 gradually increased, and the liquidus temperature TL was consistent with the lowest eutectic temperature TEU; furthermore, the TL and TEU measured in one chamber with FeS2 additive were basically the same, indicating that different contents of FeS2 additive have little influence on the cooling curves of molten iron.
The above variation can be explained as follows: the graphite in the chamber without FeS2 additive grows in the form of vermicular mode, while the graphite for the FeS2-containing chamber grows in the form of flakes. Comparatively, the vermicular graphite has a slow release of crystallization latent heat, and thus the inflection point of TL and eutectic undercooling occurs on the cooling curve. When the FeS2 additive is added to the sample cup, the sulfur reacts with the vermicular elements in molten iron to produce sulfide, which provides a heterogeneous nucleation core for the growth of graphite. Due to the adsorption and segregation, sulfur has a very high concentration at the crystal interface, so the carbon solubility is reduced, the activity is increased and, thus, a large number of carbon atoms precipitate from the molten iron, providing favorable conditions for graphite nucleation and growth. Moreover, sulfur can reduce the surface tension of molten iron, and thus reduce the interfacial energy between molten iron and graphite, increasing the starting temperature of the eutectic reaction. As a result, the liquidus temperature TL, lowest eutectic temperature TEU, and highest eutectic temperature TER of the thermal analysis curves will increase.
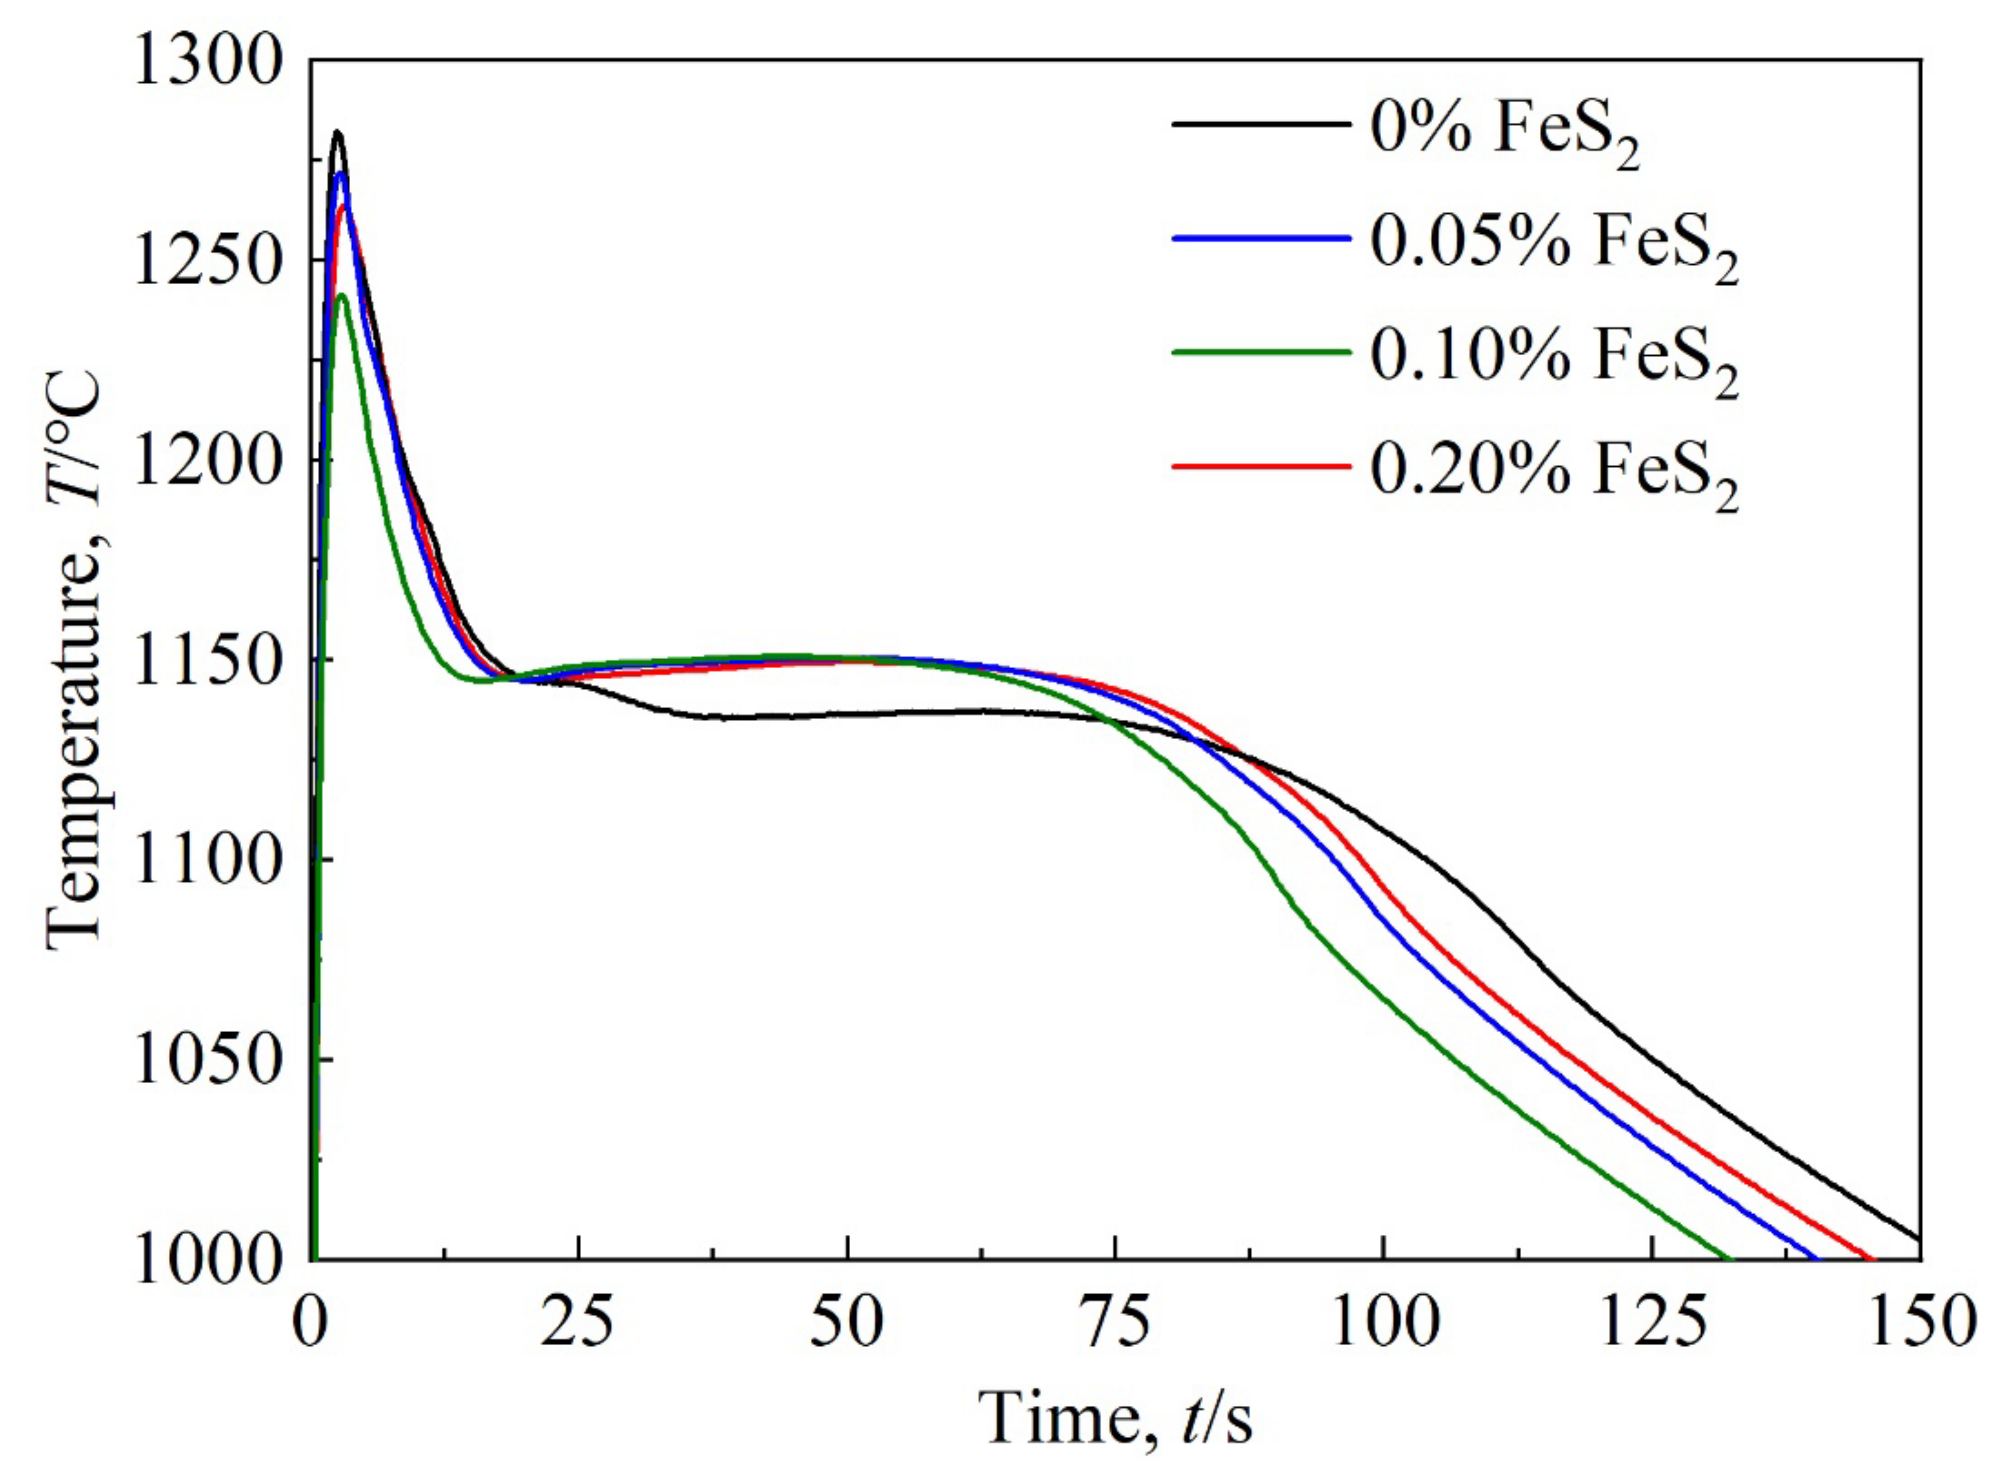
In order to facilitate observation and analysis, three groups of cooling curves are plotted together, as shown in Figure 6.
Figure 6 indicates that the influence of FeS2 content on the eutectic stage of cooling curves is not obvious, and the cooling curves present are typical of those of gray cast iron. According to Figure 3, if the residual magnesium content is less than 0.008%, the molten iron will turn to the same solidification as gray cast iron. When the molten iron after vermiculation and inoculation treatment is poured into the cavity containing the FeS2 additive, sulfur will first react with the dissolved magnesium in the molten iron to form the magnesium sulfide, which reduces the residual magnesium content to below 0.008%, resulting in the solidification of molten iron in the form of gray cast iron. It can be seen from Figure 6 that after 0.05% FeS2 was added, the molten iron in the sample cup completely changed into the solidification mode of gray cast iron, and the continuous increase in FeS2 additive had little influence on the shape of cooling curves. Therefore, 0.05% FeS2 in the thermal analysis sample cup can meet the demand and achieve the purpose of obtaining thermal analysis curves with remarkable characteristics.
3.2. Influence of FeSi75 Additive on Thermal Analysis Curves and Graphite Morphology
Ferrosilicon inoculant can increase the nucleus for forming the graphite, refine the graphite, and increase the amount of graphite in the molten iron. The increase in graphite precipitation raises the release of crystallization latent heat, which changes the shape of the cooling curve at the eutectic reaction stage.
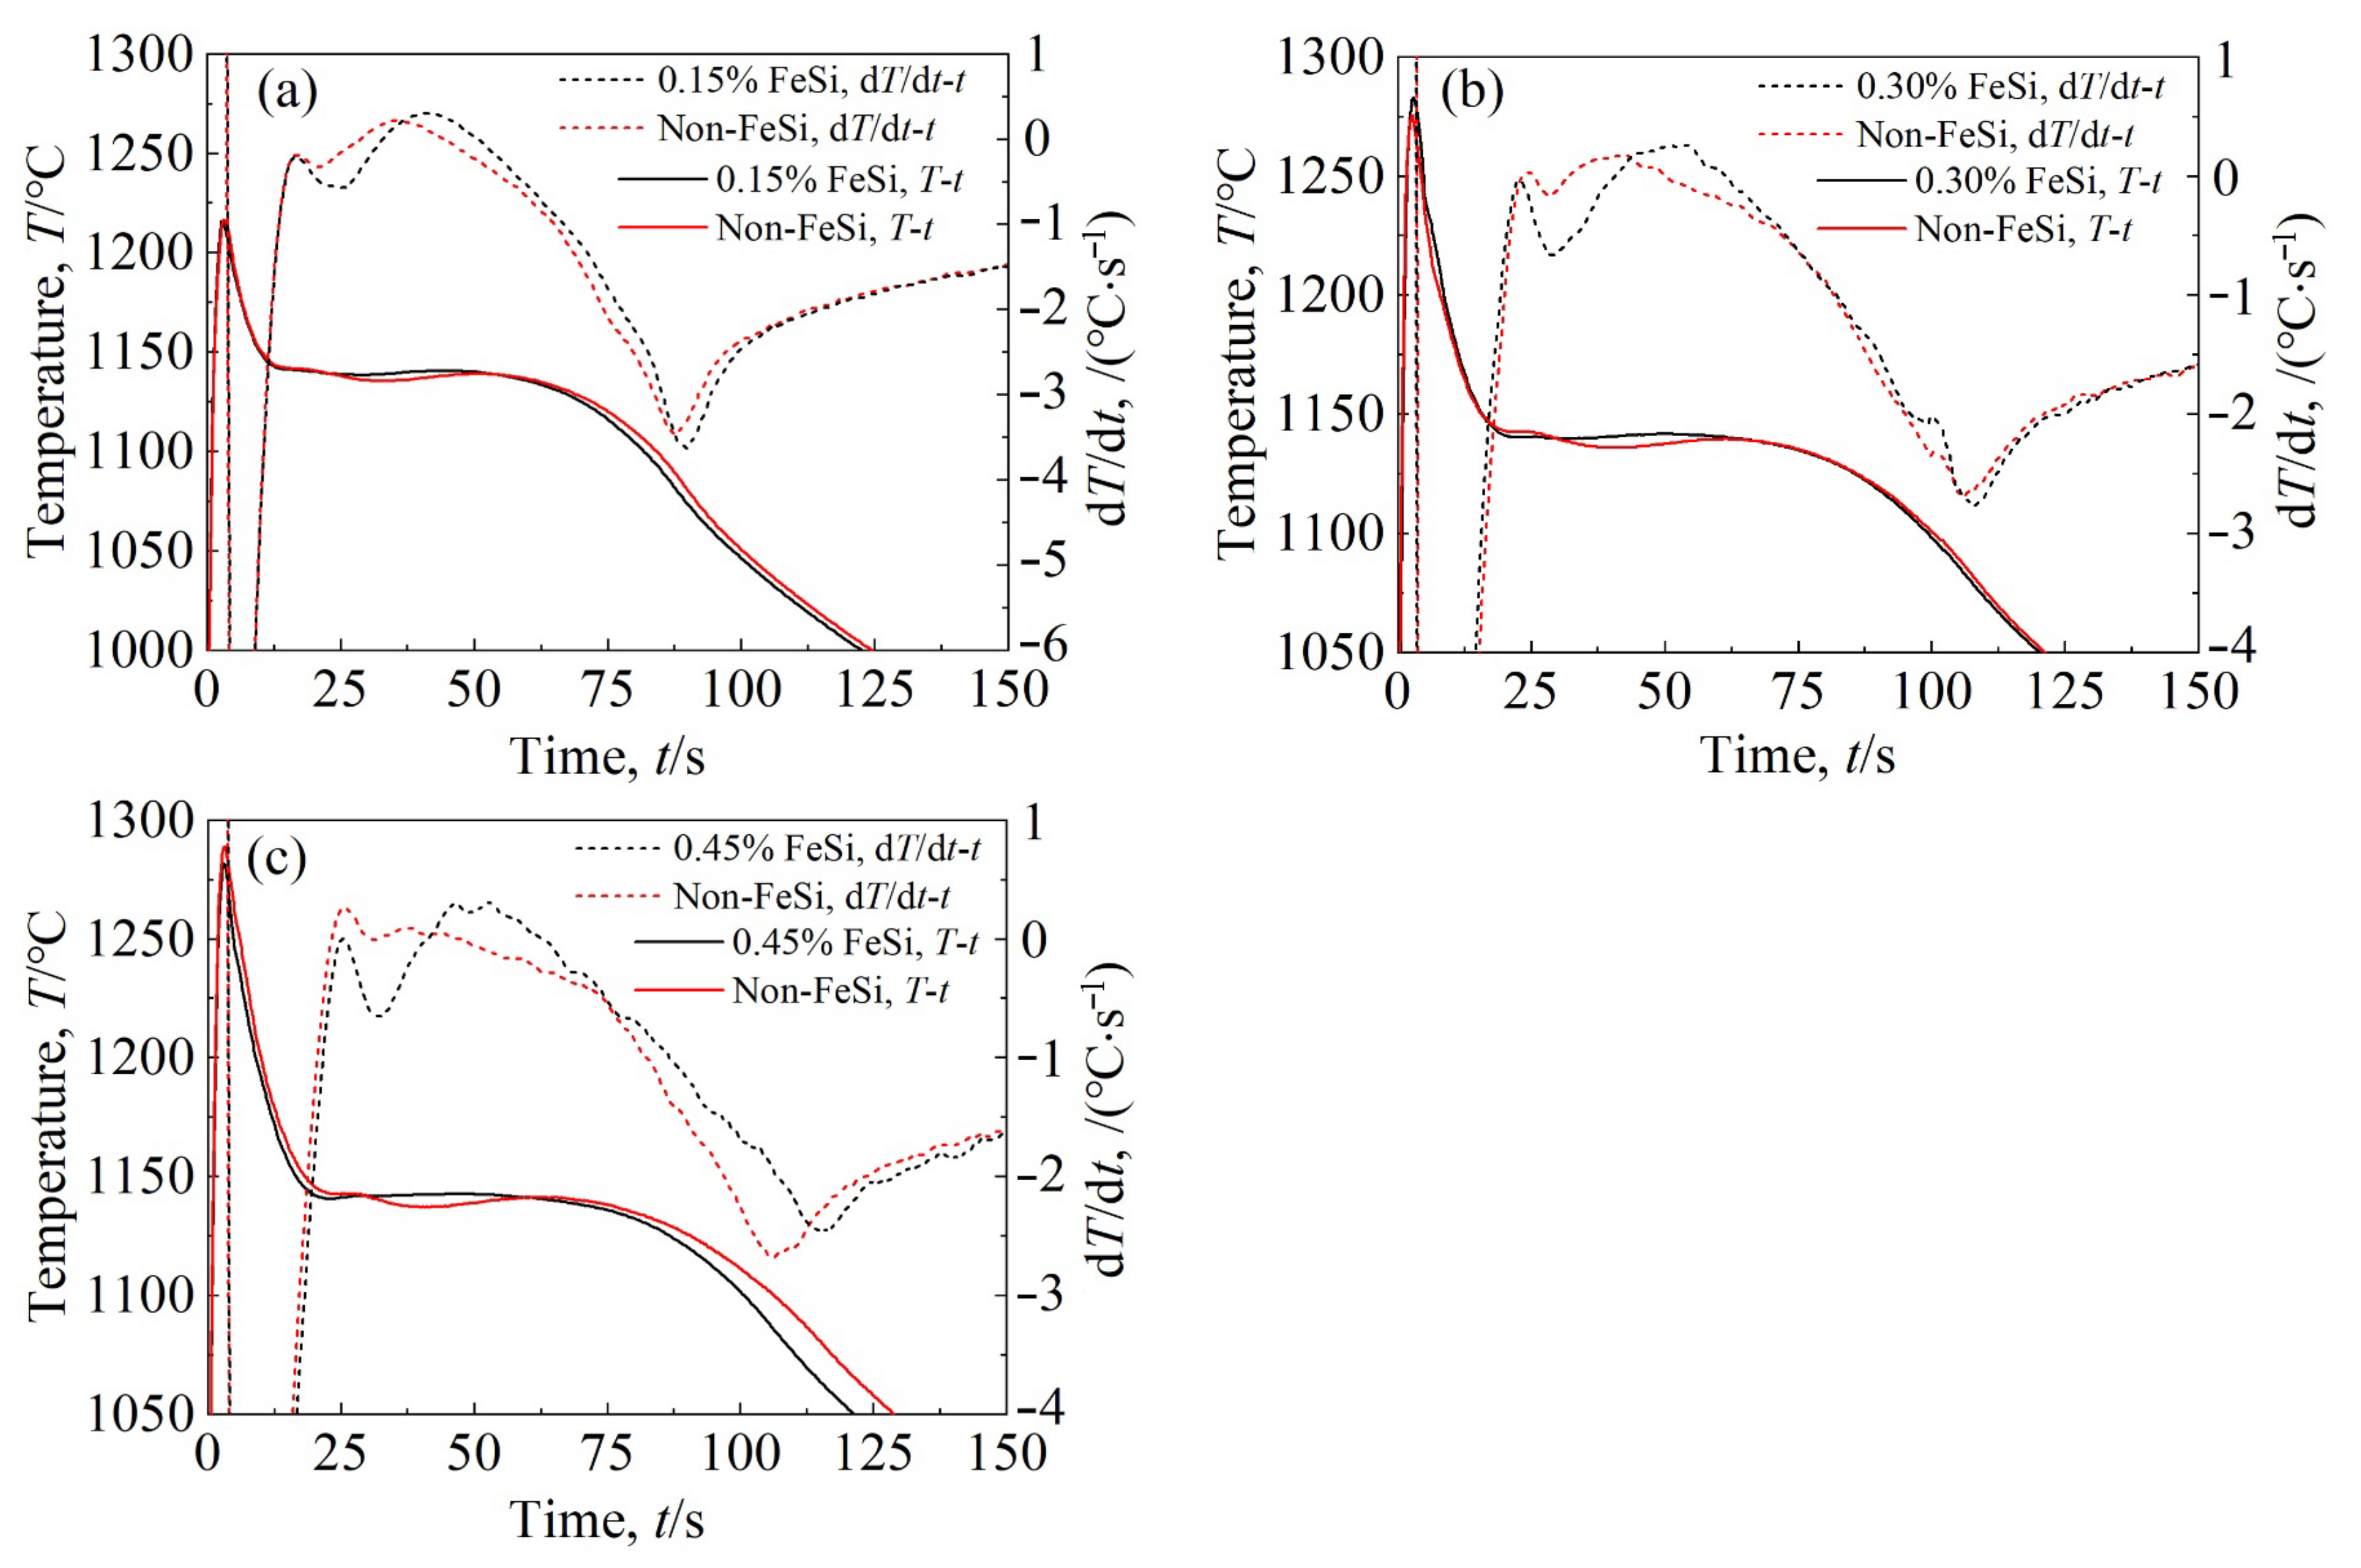
Figure 7 shows the cooling curves (T-t) and differential curves (dT-dt) obtained from the same molten iron when they were poured into the double-chamber sample cup with different amounts of FeSi75 additive. Compared with the thermal analysis curves without the FeSi75 additive, the FeSi75 addition changed the shape and characteristics of the curves, but the degree of change differed depending on the different FeSi75 additive. For further analysis, some important characteristic values of thermal analysis curves were extracted and are shown in Table 5. The microstructure of the central area of the thermal analysis sample, corresponding to three groups of cooling curves, is shown in Figure 8, and the area fraction of the graphite was measured using Image Pro Plus (version 6.0, Media Cybernetics, Rockville, USA).
It can be seen from Figure 8 that with the increase in FeSi75 additive in the sample cup, the spherical graphite measurably increases, and the vermicularity decreases gradually from 89% to 46%. When the FeSi75 additive increases from 0% to 0.3%, the amount of small spherical graphite increases greatly, the vermicularity decreases from 89% to 58%, and the average diameter of graphite decreases from 23 μm to 19 μm, accordingly. At the level of 0.3% FeSi75, the amount of spherical graphite increases, the area fraction of graphite is the smallest, and the graphite becomes relatively fine. When the FeSi75 additive increases to 0.45%, the spherical graphite becomes relatively big, and the vermicularity decreases to 46% while the average diameter of graphite increases to 22 μm. This indicates that over-inoculation occurs. Comparing the characteristic values in Table 4, it can be found that the eutectic recalescence temperature ΔT2 for the molten iron with FeSi75 is less than ΔT1 for the molten iron without FeSi75. With the increase in FeSi75 additive, the eutectic recalescence temperature ΔT2 gradually decreases while the difference between ΔT2 and ΔT1 increases gradually.
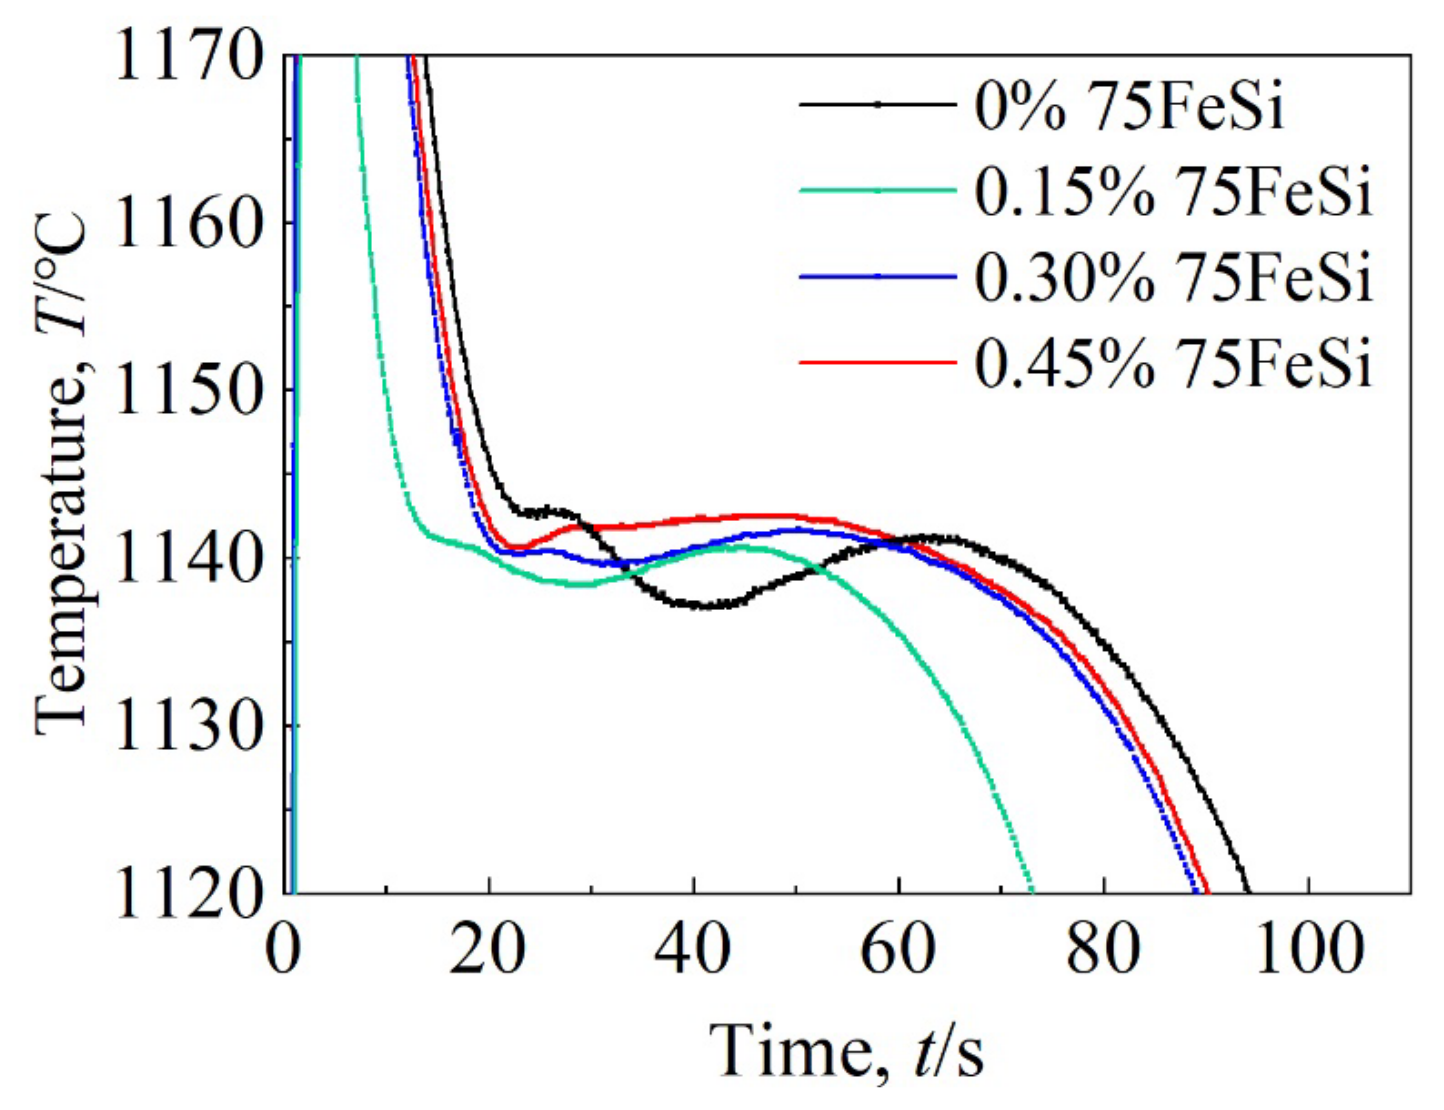
In order to further compare the influence of FeSi75 additive on the thermal analysis curves of molten iron, the eutectic sections of cooling curves for different amounts of FeSi75 additive were replotted together in Figure 9.
Figure 9 indicates that when 0.15% and 0.30% FeSi75 are added in the sample cup, the cooling curves are those of the hypoeutectic solidification state, and the lowest eutectic temperature and the highest eutectic temperature increase comparable to those of the molten iron without FeSi75. This can be explained as follows: after the FeSi75 additive is added, silicon occupies the position of a carbon atom in the molten iron, and thus the solubility of carbon will reduce, and the carbon activity will increase. Therefore, the silicon addition is equivalent to an increase in the carbon content. This increases the precipitation of graphite. At the same time, the silicon compound can also increase the nucleus of the graphite, which shortens the diffusion path of carbon, reduces the nucleation driving force of eutectic graphite, and increases the release rate of crystallization latent heat.
When the FeSi75 additive increases to 0.30%, the cooling curves have a tendency to turn to the eutectic solidification. This is because the silicon additive not only increases the number of graphite nucleation cores, but also increases the eutectic transformation temperature. As a result, the eutectic point moves to the left, and the molten iron with hypoeutectic composition gradually changes to the eutectic solidification mode. Compared with the curves of 0.15% FeSi75, the lowest eutectic temperature will increase, while the eutectic recalescence temperature will decrease for the curves of 0.30% FeSi75. The FeSi75 additive increases the amount of small spherical graphite and decreases the vermicular graphite. The growth rate of small spherical graphite is slower than that of vermicular graphite, and the spherical graphite is surrounded by austenite during growth, reducing the amount of heat released. Therefore, this further reduces the range of the eutectic recovery temperature. When the FeSi75 additive was increased to 0.45%, the primary crystal point (which represents the formation and growth of primary austenite during solidification) disappeared. Because the increase in FeSi75 improves the carbon equivalent of molten iron to a certain extent, the molten iron may change to a hypereutectic solidification state, and the graphite nucleation in molten iron becomes the leading phase. The graphite nucleation will release more crystallization latent heat (about 3600 J/g) than that of austenite (about 200 J/g), which makes the primary crystal point disappear. With the growth of the graphite, an austenite shell will be formed around the graphite, which hinders the further growth of graphite. The release of crystallization latent heat will be significantly reduced, and most of the graphite will precipitate in a spherical form. Therefore, the crystallization latent heat and the heat emitted from the eutectic recovery stage can reach a balance, and a long eutectic platform will appear. The 0.45% 75FeSi additive is most appropriate for a double-chamber sample cup with the chamber diameters of 30 mm.
4. Conclusions
- (1)
- Compared with the cooling curves of molten iron in one chamber without additives, the cooling curves and differential curves changed significantly after the FeS2 additive was added. When 0.05% FeS2 additive was added into the sample cup, the cooling curve changed to the solidification pattern of gray cast iron. The influence of increasing the amount of FeS2 additive on the cooling curve is not measurable. With the increase in FeS2 additive from 0.05% to 0.10%, the graphite morphology changed from D-type and E-type to A-type and B-type graphite. When the FeS2 additive reached 0.20%, the morphology of graphite became short and thick.
- (2)
- After the FeSi75 additive was added into the sample cup, the amount of spherical graphite increased significantly. With the increase in the FeSi75 additive, the vermicularity decreased gradually from 89% to 46%, and the average diameter of graphite decreased from 23 μm to 19 μm and then increased to 22 μm. In addition, the cooling curve changed from a hypoeutectic to a eutectic solidification state. When the FeSi75 additive was increased, the lowest eutectic temperature increased, while the eutectic recalescence temperature decreased. When 0.45% FeSi75 additive was added, the molten iron reached eutectic solidification, and a longer eutectic platform appeared on the cooling curve.
- (3)
- The 0.05% FeS2 or 0.45% FeSi75 additives are most appropriate for the double-chamber sample cup with chamber diameters of 30 mm.
Author Contributions
Conceptualization, A.J. and X.T.; methodology, A.J.; software, A.J. and D.L.; validation, A.J. and D.L.; formal analysis, A.J. and X.T.; investigation, A.J. and G.G.; resources, A.J. and D.S.; data curation, A.J. and G.G.; writing—original draft preparation, A.J. and D.S.; writing—review and editing, A.J. and D.S.; visualization, A.J.; supervision, X.T.; project administration, D.S.; funding acquisition, D.L. All authors have read and agreed to the published version of the manuscript.
Funding
This research was funded by the Key Basic Research Program of Shandong Natural Science Foundation (ZR2021ZD22) and the Special Project of Chinese Government Guidance on Local Scientific and Technological Development of Heilongjiang (SBZY2021E071).
Institutional Review Board Statement
Not applicable.
Informed Consent Statement
Not applicable.
Data Availability Statement
Not applicable.
Conflicts of Interest
The authors declare no conflict of interest.
References
- Megahed, H.; El-Kashif, E.; Shash, A.Y.; Essam, M.A. Effect of holding time, thickness and heat treatment on microstructure and mechanical properties of compacted graphite cast iron. J. Mater. Res. Technol. 2019, 8, 1188–1196. [Google Scholar] [CrossRef]
- Shi, G.Q.; Yang, Z.; Li, J.P.; Sun, S.; Ma, Z.J. Investigation into the evolution of microstructure and mechanical properties of compacted graphite iron under elevated temperature. J. Mater. Eng. Perform. 2021, 30, 8479–8489. [Google Scholar] [CrossRef]
- Lopez-Covaleda, E.A.; Ghodrat, S.; Kestens, L.A.I. Lifetime and damage characterization of compacted graphite iron during thermo-mechanical fatigue under varying constraint conditions. Metall. Mater. Trans. A 2020, 51, 226–236. [Google Scholar] [CrossRef]
- Meng, F.; Zhang, Z.; Wu, B.; Hu, W.; Ai, X.; Meng, X.; Ding, Z.; Zhang, L. Turning processes and mechanism of compacted graphite iron used for high performance engine. J. Manuf. Process. 2021, 68, 951–960. [Google Scholar] [CrossRef]
- Ghodrat, S.; Kestens, L.A.I. Microstructural dependence of tensile and fatigue properties of compacted graphite iron in diesel engine components. Steel Res. Int. 2015, 87, 772–779. [Google Scholar] [CrossRef]
- Dawson, S. Compacted graphite iron-a material solution for modern diesel engine cylinder blocks and heads. China Foundry 2009, 7, 241–246. [Google Scholar]
- Shi, D.; Kang, K.; Gao, G.; Miao, S. System and experiment on fast testing vermicular graphite percent in cast iron based on ultrasonic longitudinal wave. Mater. Trans. 2016, 57, 544–548. [Google Scholar] [CrossRef]
- Hernando, J.C.; Domeij, B.; Gonzalez, D.; Amieva, J.M.; Dioszegi, A. New experimental technique for nodularity and Mg fading control in compacted graphite iron production on laboratory scale. Metall. Mater. Trans. A 2017, 48, 5432–5441. [Google Scholar] [CrossRef]
- Cojocaru, A.M.; Riposan, I.; Stan, S. Solidification influence in the control of inoculation effects in ductile cast irons by thermal analysis. J. Therm. Anal. Calorim. 2019, 138, 2131–2143. [Google Scholar] [CrossRef]
- Stefanescu, D.M. Thermal analysis-theory and applications in metalcasting. Int. J. Met. 2015, 9, 7–22. [Google Scholar] [CrossRef]
- Li, D.; Xu, Z.; Ma, X.; Shi, D. Review of current research and application of ductile cast iron quality monitoring technologies in Chinese foundry industry. China Foundry 2015, 12, 239–250. [Google Scholar]
- Jiang, A.; Tian, X.; Song, H.; Gao, G.; Wu, Q.; Shi, D.; Xu, Z.; Wu, Y. Evaluation of vermicularity of compacted graphite iron based on multiple characteristic points of thermal analysis. Mater. Trans. 2021, 62, 675–679. [Google Scholar] [CrossRef]
- Dawson, S. Process control for the reliable series production of compacted graphite iron. Indian Foundry J. 2006, 52, 21–24. [Google Scholar]
- Liu, J. A reliable and consistent production technology for high volume compacted graphite iron castings. China Foundry 2014, 11, 339–350. [Google Scholar]
- Stefanescu, D.M.; Suarez, R.; Kim, S.B. 90 years of thermal analysis as a control tool in the melting of cast iron. China Foundry 2020, 17, 69–84. [Google Scholar] [CrossRef]
- Dioszegi, A.; Svensson, I.L. On the problems of thermal analysis of solidification. Mater. Sci. Eng. A 2005, 413–414, 474–479. [Google Scholar] [CrossRef]
- Wang, L.; Nakae, H. Influence of factors on thermal analysis parameter θ predicting shrinkage tendency. J. Jpn. Foundry Eng. Soc. 2019, 91, 213–220. [Google Scholar] [CrossRef]
- Cree, J.; Grybush, I.; Robles, M.; Sorrell, R.; Hoover, A.; Cruse, J.; Krause, K.; Frigm, G. Statistical comparisons of four (4) different thermal analysis sample cup types for chemistry control of ductile base iron. Int. J. Met. 2021, 15, 729–746. [Google Scholar] [CrossRef]
- Shi, D.Q.; Tang, H.Y.; Li, C.; Gao, G.L.; Li, D.Y.; Wang, L.H. The feasibility of acquiring a thermal analysis cooling curve by wet sample cup made of green sand. JOM 2011, 63, 35–38. [Google Scholar] [CrossRef]
- Kanno, T.; Iwami, Y.; Kang, I. Prediction of graphite nodule count and shrinkage tendency of spheroidal graphite cast iron by one cup thermal analysis. Mater. Trans. 2018, 59, 456–461. [Google Scholar] [CrossRef]
- Liu, J.H.; Yan, J.S.; Zhao, X.B.; Fu, B.G.; Xue, H.T.; Zhang, G.X.; Yang, P.H. Precipitation and evolution of nodular graphite during solidification process of ductile iron. China Foundry 2020, 17, 260–271. [Google Scholar] [CrossRef]
- Kanno, T.; You, Y.; Kang, I.; Morinaka, M.; Nakae, H. Prediction of chilling tendency in cast iron using three cups thermal analysis system. J. Jpn. Foundry Eng. Soc. 1998, 70, 773–778. [Google Scholar] [CrossRef]
- Boonmee, S.; Worakhut, K.; Pheatphain, P.; Buahombura, P. Prediction of chill formation in gray irons by thermal analysis. Key Eng. Mater. 2020, 845, 87–93. [Google Scholar] [CrossRef]
- Suarez, R.; Sertucha, J.; Larranaga, P.; Lacaze, J. Active Mg estimation using thermal analysis: A rapid method to control nodularity in ductile cast iron production. Metall. Mater. Trans. B 2016, 47, 2744–2753. [Google Scholar] [CrossRef] [Green Version]
Figure 1.
Structure and size of the double-chamber sample cup.

Figure 2.
Typical cooling curve (T-t), differential curves (dT-dt) and characteristic temperatures of vermicular graphite iron.
Figure 2.
Typical cooling curve (T-t), differential curves (dT-dt) and characteristic temperatures of vermicular graphite iron.

Figure 3.
Relationship between total residual magnesium content and nodularity.

Figure 4.
Cooling curves and differential curves with different amounts of FeS2: (a) 0.05% FeS2, (b) 0.10% FeS2, (c) 0.20% FeS2.
Figure 4.
Cooling curves and differential curves with different amounts of FeS2: (a) 0.05% FeS2, (b) 0.10% FeS2, (c) 0.20% FeS2.


Figure 5.
Graphite morphology at the central area of thermal analysis sample when FeS2 additive was used: (a) 0% FeS2, (b) 0.05% FeS2, (c) 0.10% FeS2, (d) 0.20% FeS2.
Figure 5.
Graphite morphology at the central area of thermal analysis sample when FeS2 additive was used: (a) 0% FeS2, (b) 0.05% FeS2, (c) 0.10% FeS2, (d) 0.20% FeS2.

Figure 6.
Comparison of cooling curves with different content of FeS2.

Figure 7.
Cooling curves and differential curves with different amounts of FeSi75: (a) 0.15% FeSi75, (b) 0.30% FeSi75, (c) 0.45% FeSi75.
Figure 7.
Cooling curves and differential curves with different amounts of FeSi75: (a) 0.15% FeSi75, (b) 0.30% FeSi75, (c) 0.45% FeSi75.

Figure 8.
Graphite morphology at the central area of thermal analysis samples with different amounts of FeSi75: (a) 0% FeSi75, vermicularity 89%, area fraction of graphite 0.115, (b) 0.15% FeSi75, vermicularity 78%, area fraction of graphite 0.113, (c) 0.30% FeSi75, vermicularity 58%, area fraction of graphite 0.102, (d) 0.45% FeSi75, vermicularity 46%, area fraction of graphite 0.104.

Figure 9.
Eutectic sections of cooling curves with different amounts of FeSi75 additive.


Table 1.
Nominal chemical compositions of vermicular graphite cast iron (wt.%).
| C | Si | Mn | S | P | Cu | Mg |
|---|---|---|---|---|---|---|
| 3.7~3.8 | 2.0~2.4 | ≤0.6 | 0.01~0.02 | ≤0.06 | 0.3~0.6 | 0.010~0.018 |
Table 2.
Type and amount of additive in one chamber of double-chamber sample cup.
| Type | Size (Mesh) | Purity (%) | Content of Si (wt.%) | Addition Amount (wt.%) |
|---|---|---|---|---|
| FeS2 | 80 | 99.9 | — | 0.05 0.10 0.20 |
| FeSi75 | 80 | 99.7 | Si: 74–80 | 0.15 0.30 0.45 |
Table 3.
Meaning of each thermal analysis characteristic temperature.
| Characteristic Temperature | Meaning |
|---|---|
| TL | Liquidus temperature: the temperature of initial austenite formation, responding to the first peak of dT/dt |
| TEU | Lowest eutectic temperature: responding to dT/dt = 0 |
| TER | Highest eutectic temperature: responding to dT/dt = 0 |
| ΔT | Eutectic recovery temperature: ΔT = TER − TEU |
| TES | Temperature at final solidification point |
Table 4.
Key characteristic values of the curves when FeS2 additive was added in one chamber of the sample cup.
Table 4.
Key characteristic values of the curves when FeS2 additive was added in one chamber of the sample cup.
| FeS2 Content (wt.%) | Characteristic Temperature of the Chamber without FeS2 (°C) | Characteristic Temperature of the Chamber with FeS2 (°C) | ||||||
|---|---|---|---|---|---|---|---|---|
| TL | TEU | TER | ΔT1 | TL | TEU | TER | ΔT2 | |
| 0.05 | 1141.4 | 1133.8 | 1137.6 | 3.8 | 1144.9 | 1144.9 | 1150.4 | 5.5 |
| 0.10 | 1142.0 | 1134.6 | 1138.2 | 3.6 | 1144.9 | 1144.9 | 1150.8 | 5.9 |
| 0.20 | 1144.1 | 1135.7 | 1137.2 | 1.5 | 1145.0 | 1145.0 | 1149.5 | 4.5 |
Table 5.
Important characteristic values of the curves with different amounts of FeSi75.
| FeSi75 Content (wt.%) | Characteristic Temperature of the Chamber without FeSi75 (°C) | Characteristic Temperature of the Chamber with FeSi75 (°C) | ||||||
|---|---|---|---|---|---|---|---|---|
| TL | TEU | TER | ΔT1 | TL | TEU | TER | ΔT2 | |
| 0.15 | 1141.6 | 1135.4 | 1138.9 | 3.5 | 1140.8 | 1138.4 | 1140.6 | 2.2 |
| 0.30 | 1142.6 | 1136.0 | 1139.6 | 3.6 | 1140.3 | 1139.6 | 1141.7 | 2.1 |
| 0.45 | 1142.5 | 1137.1 | 1141.2 | 4.1 | 1140.6 | 1140.6 | 1142.5 | 1.9 |
Disclaimer/Publisher’s Note: The statements, opinions and data contained in all publications are solely those of the individual author(s) and contributor(s) and not of MDPI and/or the editor(s). MDPI and/or the editor(s) disclaim responsibility for any injury to people or property resulting from any ideas, methods, instructions or products referred to in the content. |
© 2023 by the authors. Licensee MDPI, Basel, Switzerland. This article is an open access article distributed under the terms and conditions of the Creative Commons Attribution (CC BY) license (https://creativecommons.org/licenses/by/4.0/).
Share and Cite
MDPI and ACS Style
Jiang, A.; Tian, X.; Shi, D.; Li, D.; Gao, G. Influence of FeS2 and FeSi75 in Double-Chamber Sample Cup on Thermal Analysis Curve and Graphite Morphology of Molten Iron. Metals 2023, 13, 302. https://doi.org/10.3390/met13020302
AMA Style
Jiang A, Tian X, Shi D, Li D, Gao G. Influence of FeS2 and FeSi75 in Double-Chamber Sample Cup on Thermal Analysis Curve and Graphite Morphology of Molten Iron. Metals. 2023; 13(2):302. https://doi.org/10.3390/met13020302
Chicago/Turabian StyleJiang, Ailong, Xuelei Tian, Dequan Shi, Dan Li, and Guili Gao. 2023. "Influence of FeS2 and FeSi75 in Double-Chamber Sample Cup on Thermal Analysis Curve and Graphite Morphology of Molten Iron" Metals 13, no. 2: 302. https://doi.org/10.3390/met13020302
Note that from the first issue of 2016, this journal uses article numbers instead of page numbers. See further details here.