Article

Effect of Solid Concentration and Particle Size on the Flotation Kinetics and Entrainment of Quartz and Hematite

1
Département de Géologie, Université Officielle de Bukavu, Site de Karhale, Bukavu 570, Democratic Republic of the Congo
2
The Robert M. Buchan Department of Mining Engineering, Queen’s University, 25 Union Street, Kingston, ON K7L 3N6, Canada
3
Department of Petroleum and Mining Engineering, Shahjalal University of Science and Technology, Sylhet 3114, Bangladesh
4
Facultad de Ingeniería y Ciencias, Universidad Adolfo Ibáñez, Diagonal Las Torres 2640, Peñalolén, Santiago 7941169, Chile
5
Waste Science & Technology, Luleå University of Technology, SE 971 87 Luleå, Sweden
*
Author to whom correspondence should be addressed.
Metals 2023, 13(1), 53; https://doi.org/10.3390/met13010053
Submission received: 23 November 2022 / Revised: 10 December 2022 / Accepted: 18 December 2022 / Published: 24 December 2022

Abstract

:
Despite the importance of solid concentration in froth flotation, its effect on flotation kinetics and entrainment has rarely been studied. In this study, the flotation kinetics and entrainment in quartz and hematite single-mineral flotation systems as a function of the solid concentration and particle size were investigated using dodecylamine acetate as a collector. Kinetics modeling showed that the Gamma distribution achieved the best agreement with the experimental data, whereas the Classical and Klimpel models poorly fit the data (e.g., RMSE). The flotation rate constants (k) of both quartz and hematite at a higher solid concentration showed a concave shape, with the inflexion point at the middle-size range, whereas this trend altered at lower solid concentrations. Overall, quartz exhibited higher equilibrium recoveries (R) than hematite, which indicates its better overall rate constants. The degree of water recovery in both the quartz and hematite systems was higher at higher solid concentrations, but the hematite system exhibited higher water R than the quartz system, meaning that the entrainment of gangue could be higher in direct hematite flotation than the reverse one. Therefore, a higher solid concentration is associated with better overall quartz recovery and can reduce hematite loss by entrainment during reverse flotation. An inverse relationship was identified between the solid concentration and particle size in terms of the ratio of water recovery to the concentrate. In the reverse flotation of iron ore, refraining from achieving equilibrium recovery could help limit entrainment, but this was not necessarily the case in direct flotation. No entrainment model or method other than the Warren and Ross model approximated the overall trends of flotation at the finest size range (−38 µm). However, extending the Warren method to polynomial distribution led to an improved fit with the experimental results. In addition to the solid concentration, particle density and size were revealed to be key to developing new entrainment models. Finally, after the fast recovery period (true flotation) was over, the slow recoveries were mainly driven by the slow-floating water fraction.

1. Introduction

Froth flotation is one of the most-used routes for iron ore beneficiation, especially in cases of low-grade, finely grained ores with iron-bearing silicate content. It is also useful as a cleaning step of the concentration process for the production of the so-called “superconcentrates” and can be performed as a reverse or direct process [1,2,3]. In direct flotation (e.g., [4]), the valuable iron mineral is collected and recovered in the froth zone, whereas in reverse flotation it is recovered in the underflow, thereby allowing the gangue to be driven to the overflow. Among the exploited iron ores, banded iron formations are among the most dominant [5], and in terms of their processing through flotation, hematite is the main valuable mineral and quartz the main gangue [6]. There are three main flotation methods applied in iron ore flotation [1,6], namely, the direct anionic flotation of hematite and reverse anionic or cationic flotation of activated and non-activated quartz. The selection of an appropriate route depends on the ore’s geometallurgical characteristics, which are intrinsic to each ore; the proportion of gangue; the technological capacity of the operation; and the process costs. For instance, Pereira et al. [3] demonstrated the feasibility of the direct flotation of hematite using a biosurfactant and were able to achieve up to 44% grade and 65% recovery, with a reduced environmental footprint. However, reverse cationic flotation remains by far the most widely used flotation route both in laboratories and industry, owing to the higher selectivity and process rate performance than direct flotation [2,6].
A flotation system involves three phases, namely, an aqueous solution, gas bubbles, and solid particles. Flotation performance is controlled by the interaction of these phases at their interfaces as well as the complex relationship between various flotation reagents and the different processes operating conditions governing hydrodynamics [7,8]. Flotation performance, in terms of particle recovery and its rates, varies over time and differs for each mineral and operating condition. Any changes to one of the working variables can significantly impact flotation performance [9,10]. In a flotation system, the variation in process performance for different mineral components can be studied by the flotation kinetics, which provide the degree of variability in the process rates and the mineral recoveries over time [11]. The foundation of flotation kinetics was first introduced in 1935 by Zúñiga [12], who showed that mineral recovery is an exponential function of time (Equation (1)):
d P d t = k P ,
where P is the number of mineral particles in the flotation cell at time t, and k (referred to as the rate constant) is the speed at which particles float, considered to be the engineering measure of floatability. The minus sign indicates the removal of the floatable particles with time.
Based on this chemical-reaction-kinetics-type analogy, several flotation kinetics models have since been developed to account for the flotation process response [13]. Due the lack of agreement among researchers on a single, ideal kinetic model capable of fitting all flotation operations [13,14], four commonly successful models were selected and tested in this study (Table 1), namely, the Classical, Kelsall, discretized rectangular (Klimpel), and Gamma models [14]. The description of these models is presented in Section 2.2.
Entrainment in a flotation process is the mechanism by which, independently from hydrophobicity, mineral particles are unselectively transported from the pulp zone to the flotation froth zone and then to the concentrate by water hydrodynamics processes [17,18,19,20,21,22,23]. Entrainment decreases the value of quartz recovery in the case of reverse iron flotation due to fine iron minerals transporting to the froth product, while it decreases the grade of iron in the case of direct iron ore flotation due to fine silicate minerals transporting to the concentrate. Thus, water recovery and its kinetics have also been studied and assumed herein in order to represent the floatable gangue [24]. Single mineral flotation studies have revolutionized flotation science by enabling the determination of each single mineral’s intrinsic behavior, which is key to the optimization of iron ore beneficiation. For instance, Braga et al. [2] studied changes in the kinetics of the reverse flotation of iron ore and unraveled a competing degree of adsorption of amine collectors on quartz and hematite, which they ascribed to the differences in the flotation kinetics observed for different size fractions. However, water kinetics were not considered in their study, which could account for the vector of fine hematite (74 to 212 µm) observed during coarse quartz flotation (212 to 600 µm). In addition, the effect of particle size on flotation performance has been well established [25,26], and the relevant studies commonly involve iron ore flotation. The significance of particle size and, to a limited extent, that of the solid concentration on flotation performance was first reported by Trahar in 1981 [15], who examined both plant survey data and associated batch flotation tests. Through that work, he demonstrated that the recovery–size curves constitute an invaluable method for evaluating flotation performance, since the minimum hydrophobicity of a mineral depends on its particle size. The shape of recovery–size curves as well as their evolution with time are valuable diagnostics for assessing flotation data. More recently, Safari et al. [27] showed that the decrease in the solid concentration does not affect quartz recovery but leads to a significantly reduced loss in fine hematite during reverse pneumatic flotation. However, so far, little research has emphasized the combined impact of the size range and solid concentration on flotation performance in terms of kinetics and entrainment.
In this study, the flotation kinetics of quartz and hematite single mineral systems were studied for a range of particle sizes at different solid concentrations in order to understand their respective flotation behaviors and implications for entrainment during iron ore flotation. In addition, kinetic and entrainment models and entrainment evaluation methods were tested.

2. Materials and Methods

2.1. Experimental Procedure

Quartz (from Fontainebleau, France) and hematite (from Brazil purchased through Minerama) were used for this investigation. Their ball-milled products in four typical flotation size fractions (−38, +38–75, +75–150, and +150–300 µm) were prepared and used. Ceramic ball mill was used to grind quartz while the combination of jaw crusher, gyratory crusher, roll mill, and iron ball mill were used to crush and grind hematite. Following a previously reported procedure, 37% hydrochloric acid and 30% NaOH were used to clean quartz [28].
A 2 L laboratory mechanical flotation cell was used for flotation experiments. Flotation experiments were conducted on the four size fractions of quartz at 5 and 10 vol% and hematite at 2.5 and 5 vol% solid concentrations. The solid concentrations of hematite and quartz were selected based on observations of particle behavior under different solid concentrations in the mechanical flotation cell to assure adequate particle dispersion. Experiments were conducted at pH 10, while the pH was adjusted by using 0.1 M KOH aqueous solution and is the common pH value for reverse flotation of iron oxide [29,30]. A 200 g/t of dodecylamine acetate (DDA) aqueous solution was added as a collector. A 0.1 M DDA stock solution was first prepared by mixing 1.89 g of 98% purity dodecyamine (i.e., 0.1 M in 100 mL), 10 mL of 1 M acetic acid, and 20 mL of demineralized water, and then massing the mixture up to 100 mL with demineralized water; a small portion of this stock solution was then added to the 2 L flotation cell in order to yield 200 g/t. A 10 g/t of MIBC (methylisobutyl carbinol) was added as a frother. Upon the initiation of air injection, froth was collected at 0.5, 1, 2, 4, and 8 min, and the cumulative flotation recovery was then calculated. All experiments were performed two times, and their average values were used in this study.

2.2. Flotation Kinetics Models

Based on an analogy to a chemical reaction, in the kinetics of flotation process, the reactants are assumed to be the air bubbles and mineral particles, and the product is the bubble–particle aggregate. Ever since flotation kinetics was first introduced (Equation (1)), efforts have been made to provide a better description of the flotation process by incorporating several factors affecting the flotation performance. A more general expression of Equation (1) is given in Equation (6) [31], where the rate constant k can implicitly include additional parameters:
d P ( t ) d t = k ( t ) P n ( t ) B m ( t ) ,
where P, k, B, and t denote the particle concentration, the distributed rate constant, the concentration of bubbles, and flotation time, respectively. The exponents n and m represent the order of the process. It is widely acknowledged that the first order flotation kinetics models (n = 1) explain most of flotation processes, assuming that the number of bubbles in the flotation cell remains constant [32]. Integrating Equation (6) into P and introducing R = (P0P)/P0—where R and P0 denote the particle recovery fraction and the initial particle concentration—produces the relation in Equation (2). R represents the equilibrium recovery, also called maximum recovery or ultimate recovery, which can be achieved in the case of prolonged flotation (t = ∞). This equation represents the classical flotation kinetics model.
Despite continuous improvement, no single model can explain all flotation processes, and different models are always compared to find the best fit. In this study, owing to their widespread success in several studies, four models were tested (Table 1). In particular, the Kelsall model is used to separate fast- and slow-floating fractions and aids the interpretation of entrainment. In order to limit overfitting, which is responsible for reduced predictability in most modeling studies [13], only models with a maximum of three parameters are considered in this study, since only five data pairs were collected during each flotation test. For instance, the modified Kelsall model can be implemented with up to six parameters, which very often leads to models being over-fitted to the experimental data [2].
The classical and Kelsall models are discrete models, and the others are distributed models, but discretized forms of the latter are used herein with the intent of facilitating comparison. In particular, the Kelsall model, also called the floatability component model (FCM), has an advantage of separating slow-(θ) and fast (1 − θ)-floating fractions and their associated rate constants (ks and kf), and can be used to relate water and particle flotation kinetics [24], and it also allows for entrainment to be studied.
The flotation kinetics rate constants (k) and equilibrium recoveries (R) were computed using non-linear regression with constrained optimization using the optimization toolbox in MATLAB [33]. For this tool, the equilibrium recovery of experimental data is constrained to match the lower bound of the modeled equilibrium recovery of the considered model. The best model fit was estimated by minimizing the root-mean-square errors (RMSE) between experimental and modeled data [31], as well as the non-linear correlation coefficient (r). Interpreting kinetic parameters (R and k) separately can be misleading because a change applied to one operating condition in a laboratory operation can significantly affect this parameter but not the other. For instance, modifying gas flow rate may lead to significant change in the mass recovery rate from flotation, without any effect on the equilibrium recovery. Likewise, the equilibrium recovery can be significantly impacted by a change in the collector dosage, but not the rate constant, thus maintaining the required flotation time [34]. In this study, R and k are first calculated separately but interpreted together.

2.3. Entrainment

The non-selective mass transfer of fine particles to the froth zone by water hydrodynamics, rather than true flotation, is referred to as entrainment. Therefore, the total recovery includes two components: true flotation and flotation by mechanical and hydraulic entrainment [35]. In this study, any physical entrapment/carrier flotation is not considered separately and is assumed to be part of the overall entrainment. Recovery by true flotation is related to particles’ hydrophobicity and its efficiency is known to be size-dependent, among other factors. Hydrophobic particles exhibit strong floatability in the intermediate size range (typically 20–100 µm) [36] and lower floatability at finer (<20 µm) and coarser particle size ranges (>100 µm) due to low bubble–particle collision probability and low attachment stability, respectively [27]. Entrainment in iron ore flotation can be estimated based on water recovery and residence time [37]. Although the entrainment can be limited by the experimental set-up design [38], the recovery by entrainment is usually proportional to the percentage of fine particles present in the slurry and flotation time but decreases with particle density [39]. The latter aspect plays a critical role in this study due to the density difference between quartz (2.65 g/cm3) and hematite (5.3 g/cm3). The main factors influencing entrainment include water recovery, particle size, solid concentration, froth structure, froth residence time, and mineral density [22,40,41]. However, none of the existing methods and models consider all these factors simultaneously, hence the necessity of testing different methods/models to find a good approximation.
It is widely recognized that there is a strong relationship between water recovery and the recovery by entrainment. This correlation is close to linear above a minimum degree of water recovery [19,42,43] and parabolic for lower water recovery [44]. On the other hand, the degree of entrainment increases with the decrease in particle size. The size below which the degree of entrainment (generally below 50 µm) becomes significant depends on froth properties [41]. Thus, this study focused on the two finest particle size fractions, namely, −38 µm and +38–75 µm, which were considered fine particle size fractions in previous and similar studies (e.g., [45]).
Wang et al. [20] published a critical review of existing entrainment models as well as the methods for measuring and calculating the degree of entrainment and the recovery by entrainment. Among these models/methods, some were selected (Table 2) and tested in this study. The choice of the tested models was based on the availability of data on parameters involved in the model, as well as their frequency of use in the literature. Furthermore, polynomial fitting was also compared to linear fitting in our discussion. In the Warren model [19], Rm, Tm, Wwater, and Rg denote the total recovery of hydrophobic particles, the recovery of hydrophobic particles by true flotation, water recovery, and gangue recovery, respectively. The factors em and eg are the entrainment factors of the valuable and gangue minerals in the considered system. However, because we are only considering the case of single mineral flotation, only em was used in this study. In Maachar and Dobby’s model [43], Re, Rw, ∆ρ, and di, denote the recovery of entrained particles, water recovery, difference in density of the mineral and water, and particle size, respectively. In the Ross method (cited by [41]), P, Cw, W, and Cp, are the cumulative mass of entrained particles (g), cumulative mass of recovered water (g), water concentration in pulp (g/L), and particle concentration in pulp (g/L), respectively. As to the Rahal [40] model, a and b are the model parameters, with a = 0.2 and b varying between 1.27 and 1.41. Finally, in the Ross and Van Deventer model [20], ENT is the degree of entrainment of the ith size fraction, di (m) is the particle diameter, and ρ (g/cm3) is the density of particles. However, the last model was developed for column flotation; thus, its application to cell flotation in this work was approached with caution.

3. Results and Discussion

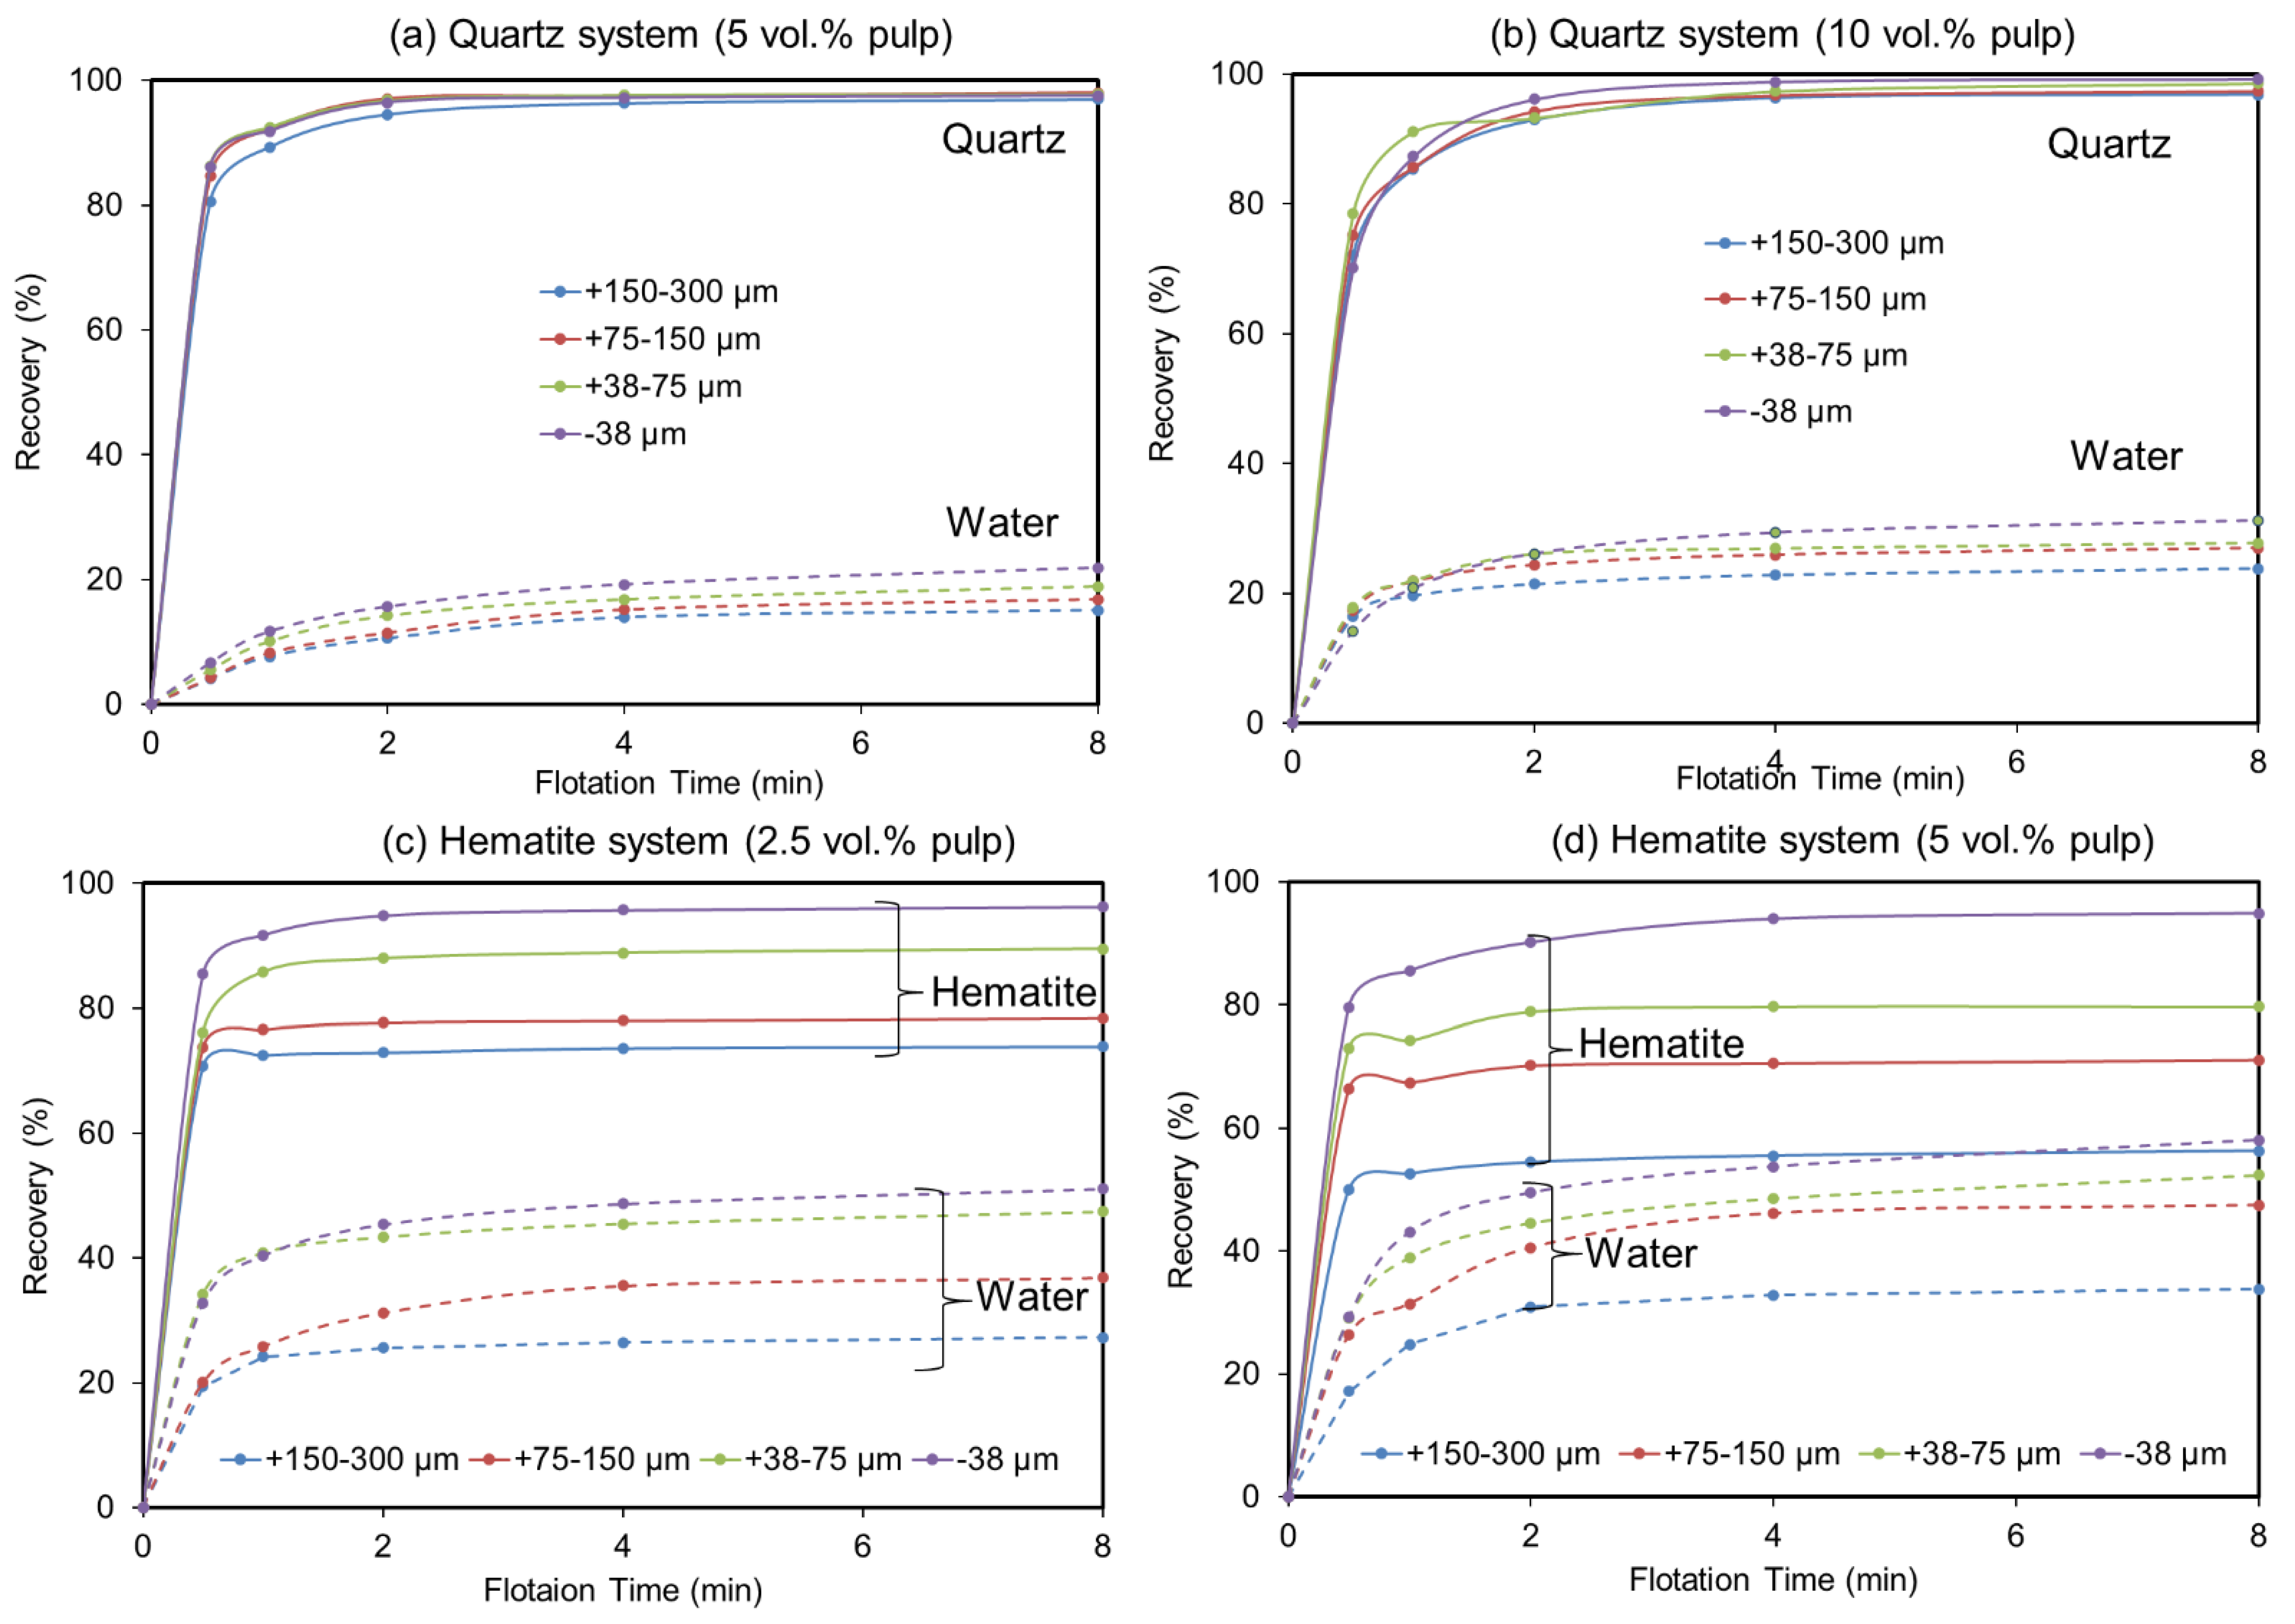
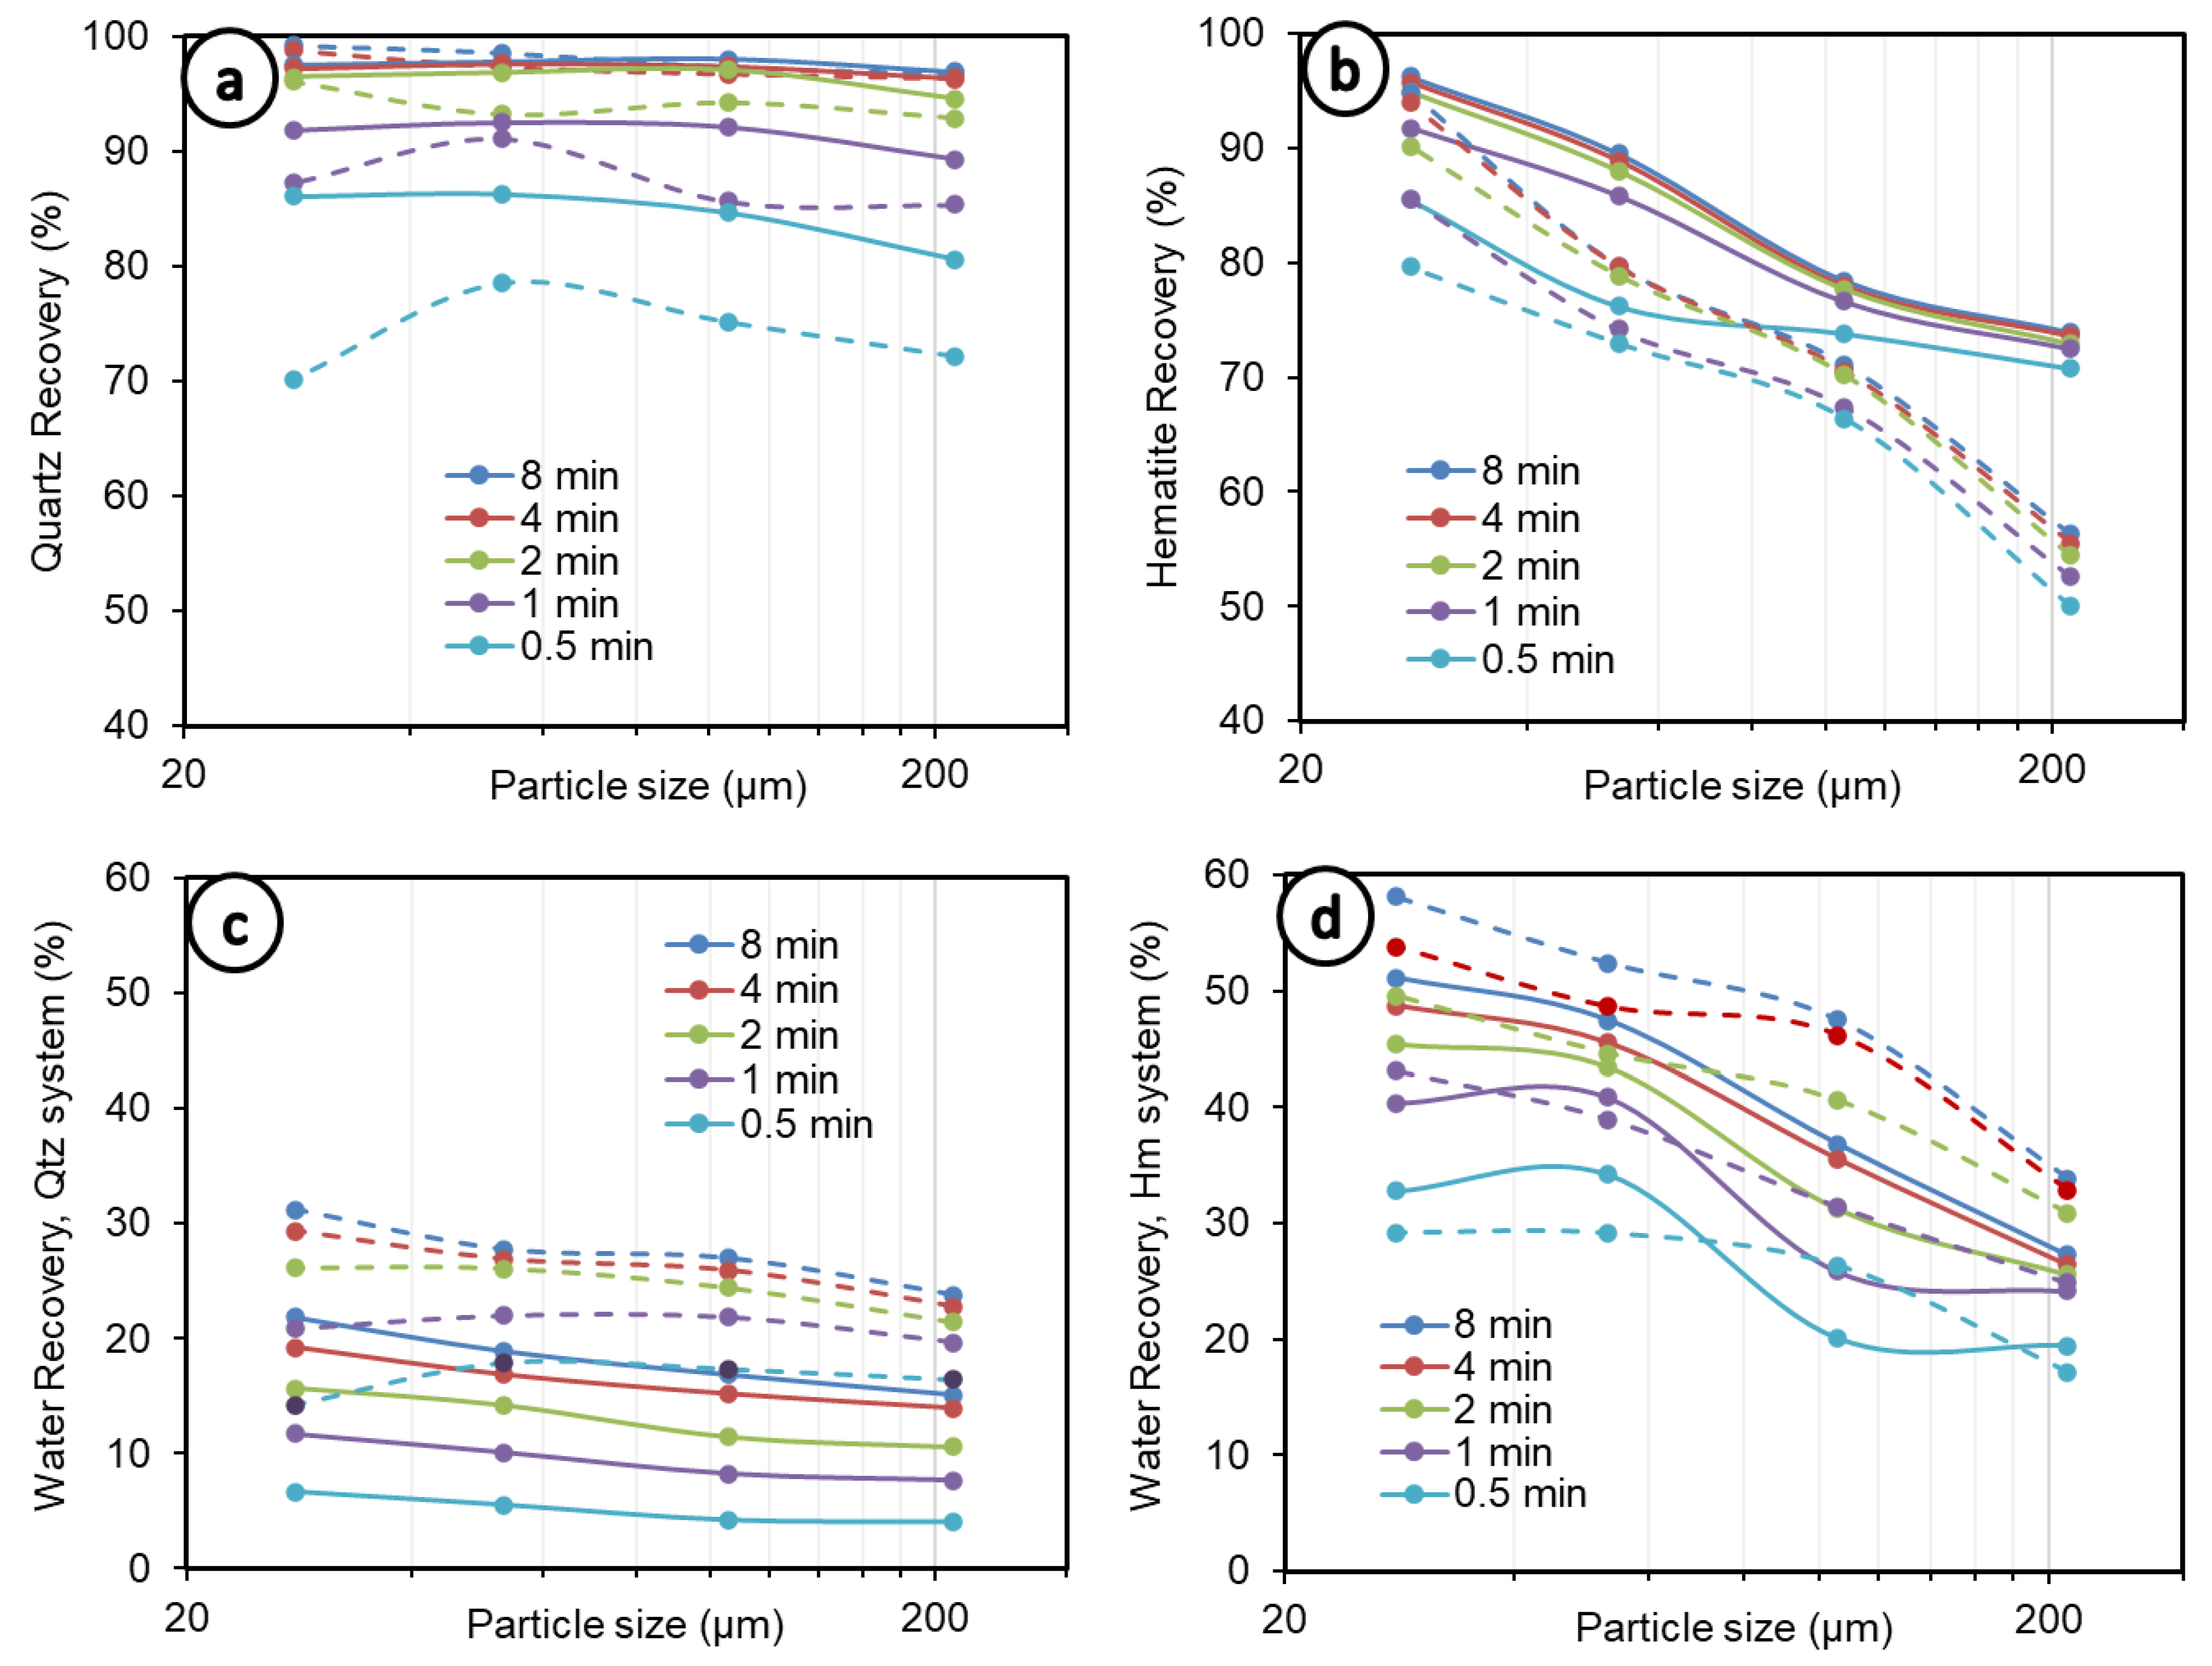
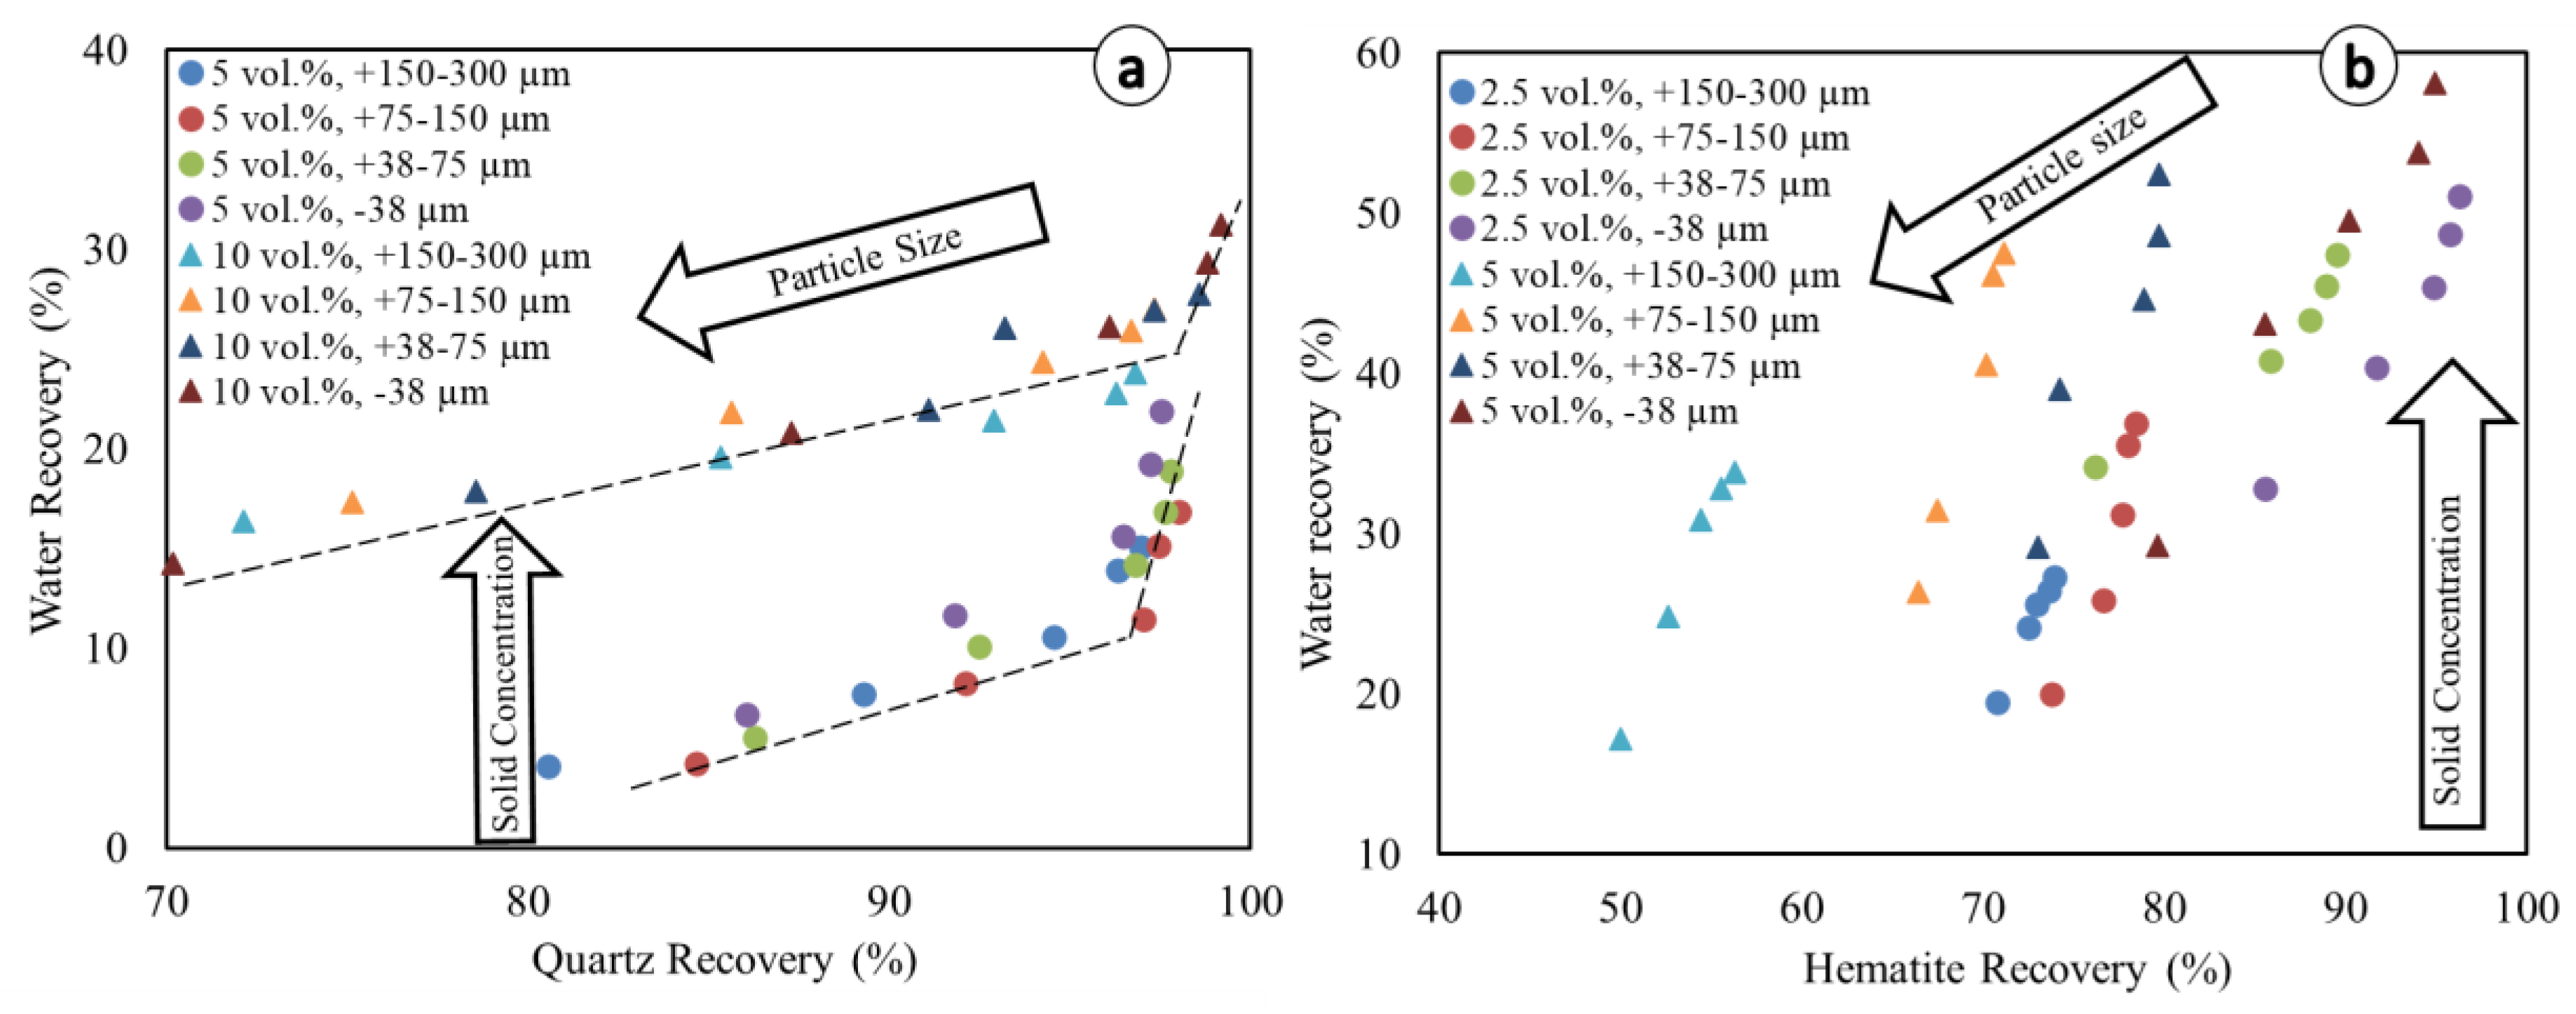
3.1. Effect of Particle Size and Solid Concentration

Figure 1 presents the cumulative recoveries over time, for both quartz and hematite flotation systems, corresponding to all size fractions and solid concentrations. Overall, in the quartz flotation system, a higher solid concentration (10 vol.%) and lower particle size ranges exhibit higher cumulative recoveries (96.82–99.19%) along with higher water cumulative recoveries (23.80–31.28) over time (Figure 1a,b). At a lower solid concentration (5 vol.%), those values are in the ranges of 96–97.51% for quartz cumulative recoveries and 15.06–21.88% for water recovery. In the hematite flotation system, on the other hand, over time, higher hematite recoveries (73.10–96.25%), together with lower water cumulative recoveries (27.27–51.10%), are exhibited at a lower solid concentration (2.5 vol.%) (Figure 1c,d). In contrast, at a higher solid concentration (5 vol.%), hematite cumulative recoveries drop (56.30–94.89%), whereas water cumulative recoveries appear to increase (33.84–58.10%).
The results regarding the higher water recoveries at fine particle sizes in all situations were expected since fine particle recoveries are known to correlate well with water recovery [19]. However, in the hematite system, water recovery reaches a maximum of almost 60% at the finest particle size fraction (−38 µm) at the higher solid concentration (5 vol.%) compared to only 30% in the case of quartz at 10 vol.% for the same size range. This suggests that, in a direct hematite flotation, a great quantity of water would be recovered by the hematite concentrate, along with a higher amount of entrained gangue (quartz), but in reverse flotation, less water would be recovered by quartz concentrate; therefore, there would be decreased hematite loss by entrainment. These observations supported reverse flotation, targeting silicate minerals, as the best flotation route applicable to iron ore beneficiation over direct flotation, which targets hematite. This was further supported by our result showing higher quartz recovery at the higher solid concentration (10 vol.%), reaching over 99% against a maximum of only 96% hematite recovery at the lower solid concentration (2.5 vol.%). In short, a high solid concentration is associated with higher quartz recovery and can reduce hematite loss during reverse flotation.
Figure 2 summarizes the experimental recoveries per size fraction, at different times, from 0.5 to 8 min. The overall analysis of Figure 2a,b shows that the curves of mineral recovery by size tend to display a concave shape at the early times of flotation (0 to 1 min), especially in the quartz system (Figure 2a). This shape is quickly altered after 1 min, which can be explained by the increasing fine particle recoveries due to entrainment as the flotation time increases. This tends to lead to an inverse linear relation between mineral particle recovery and particle size, especially in the case of hematite (Figure 2b). A concave relationship is generally recognized between mineral recovery and particle size (e.g., [15]). In this study, this typical trend was also observed, where, in the case of quartz, it was always (0.5 to 8 min) observed for the lower solid concentrations (5 vol.%) (Figure 2a, solid lines). The degree of water recovery under the same conditions (quartz at 5 vol.%, shown in Figure 2c with solid lines) shows curves that are all rather linear and nearly horizontal, with only a slightly low negative slope. This means that significant entrainment does not occur, whatever the size fraction.
For quartz at 10 vol.% (Figure 2a, dashed lines), the concave relationship disappears after 1 min of flotation. Beyond one minute, the cumulative recovery of fine particles increases more quickly than coarse particles, reaching a total value of 99.18% of the −38 µm fraction—which can be compared to 96.82% of the +150–300 µm fraction—at 8 min of flotation, and the curve becomes close to inverse-linear in nature. Concerning water recovery under the same conditions (quartz at 10 vol.%, Figure 2c, dashed lines), a concave shape was observed at up to 1 to 2 min. Beyond 2 min, there is high entrainment of the fine size fractions, and the curve becomes obviously inverse-linear. At 8 min of flotation, a total water recovery of 31.22% in the −38 µm system is achieved, which can be compared to 23.80% in the flotation of the +150–300 µm quartz.
The difference in behaviors between quartz and hematite at different size ranges can be attributed in part to the particle densities as well as the solid concentration. Indeed, the density of particles in the flotation cell plays a crucial role in particle–bubble collision. As demonstrated by numerical simulations [46], higher particle density can increase or decrease the efficiency of particle–bubble encounters, depending on the region in the flotation cell.
The solid concentration, on the other hand, is known to increase particle–bubble encounter efficiency, which may lead to better recoveries such as that for quartz in this study but can negatively impact collision frequency due to the increased viscosity of the pulp [36,47]. The increase in viscosity, especially at fine particle sizes, is caused by an increase in interaction forces between particles, explaining the poor flotation performance observed for the finer particles and higher solid concentrations in the case of quartz in this study. It is important to note, especially over a long flotation period (over 2 min) and at higher solid concentrations, that mineral recovery tracks water recovery in general, which suggests a high contribution of entrainment to mineral recovery, as discussed above. This behavior is even more noticeable in the case of hematite (Figure 2b,d). High entrainment can be a major contributing factor to the breaking of the classical concave relationship expected between recovery and particle size.
The comparison of quartz and hematite (Figure 2a–d) indicates a strong detachment of hematite at coarser particle sizes, which is exacerbated at a higher solid concentration (5 vol.%). This is because hematite’s density is almost double that of quartz (5.3 vs. 2.65 g/cm3), making it heavier and readily detachable [22]. Moreover, the collector used in this study, DDA, is of a cationic nature: at pH 10, which was used in the present study, the surface charge of quartz (Figure 3a) is far more negative than hematite [48,49,50,51], entailing much stronger collector adsorption on quartz mineral surfaces by electrostatic interaction; therefore, quartz is less susceptible to detachment than hematite, which is also heavier. This entails greater quartz recovery than hematite, as observed in this study and in the literature (Figure 3b), with everything else remaining equal. Overall, both the quartz and hematite systems, at finer fractions and lower solid concentrations, show increased water recovery. The exception to this is in the quartz flotation system, which exhibited up to 1 min of flotation (Figure 2c, dashed lines). This has implications for entrainment, for which the results are discussed further in the Section 3.3 of this paper.

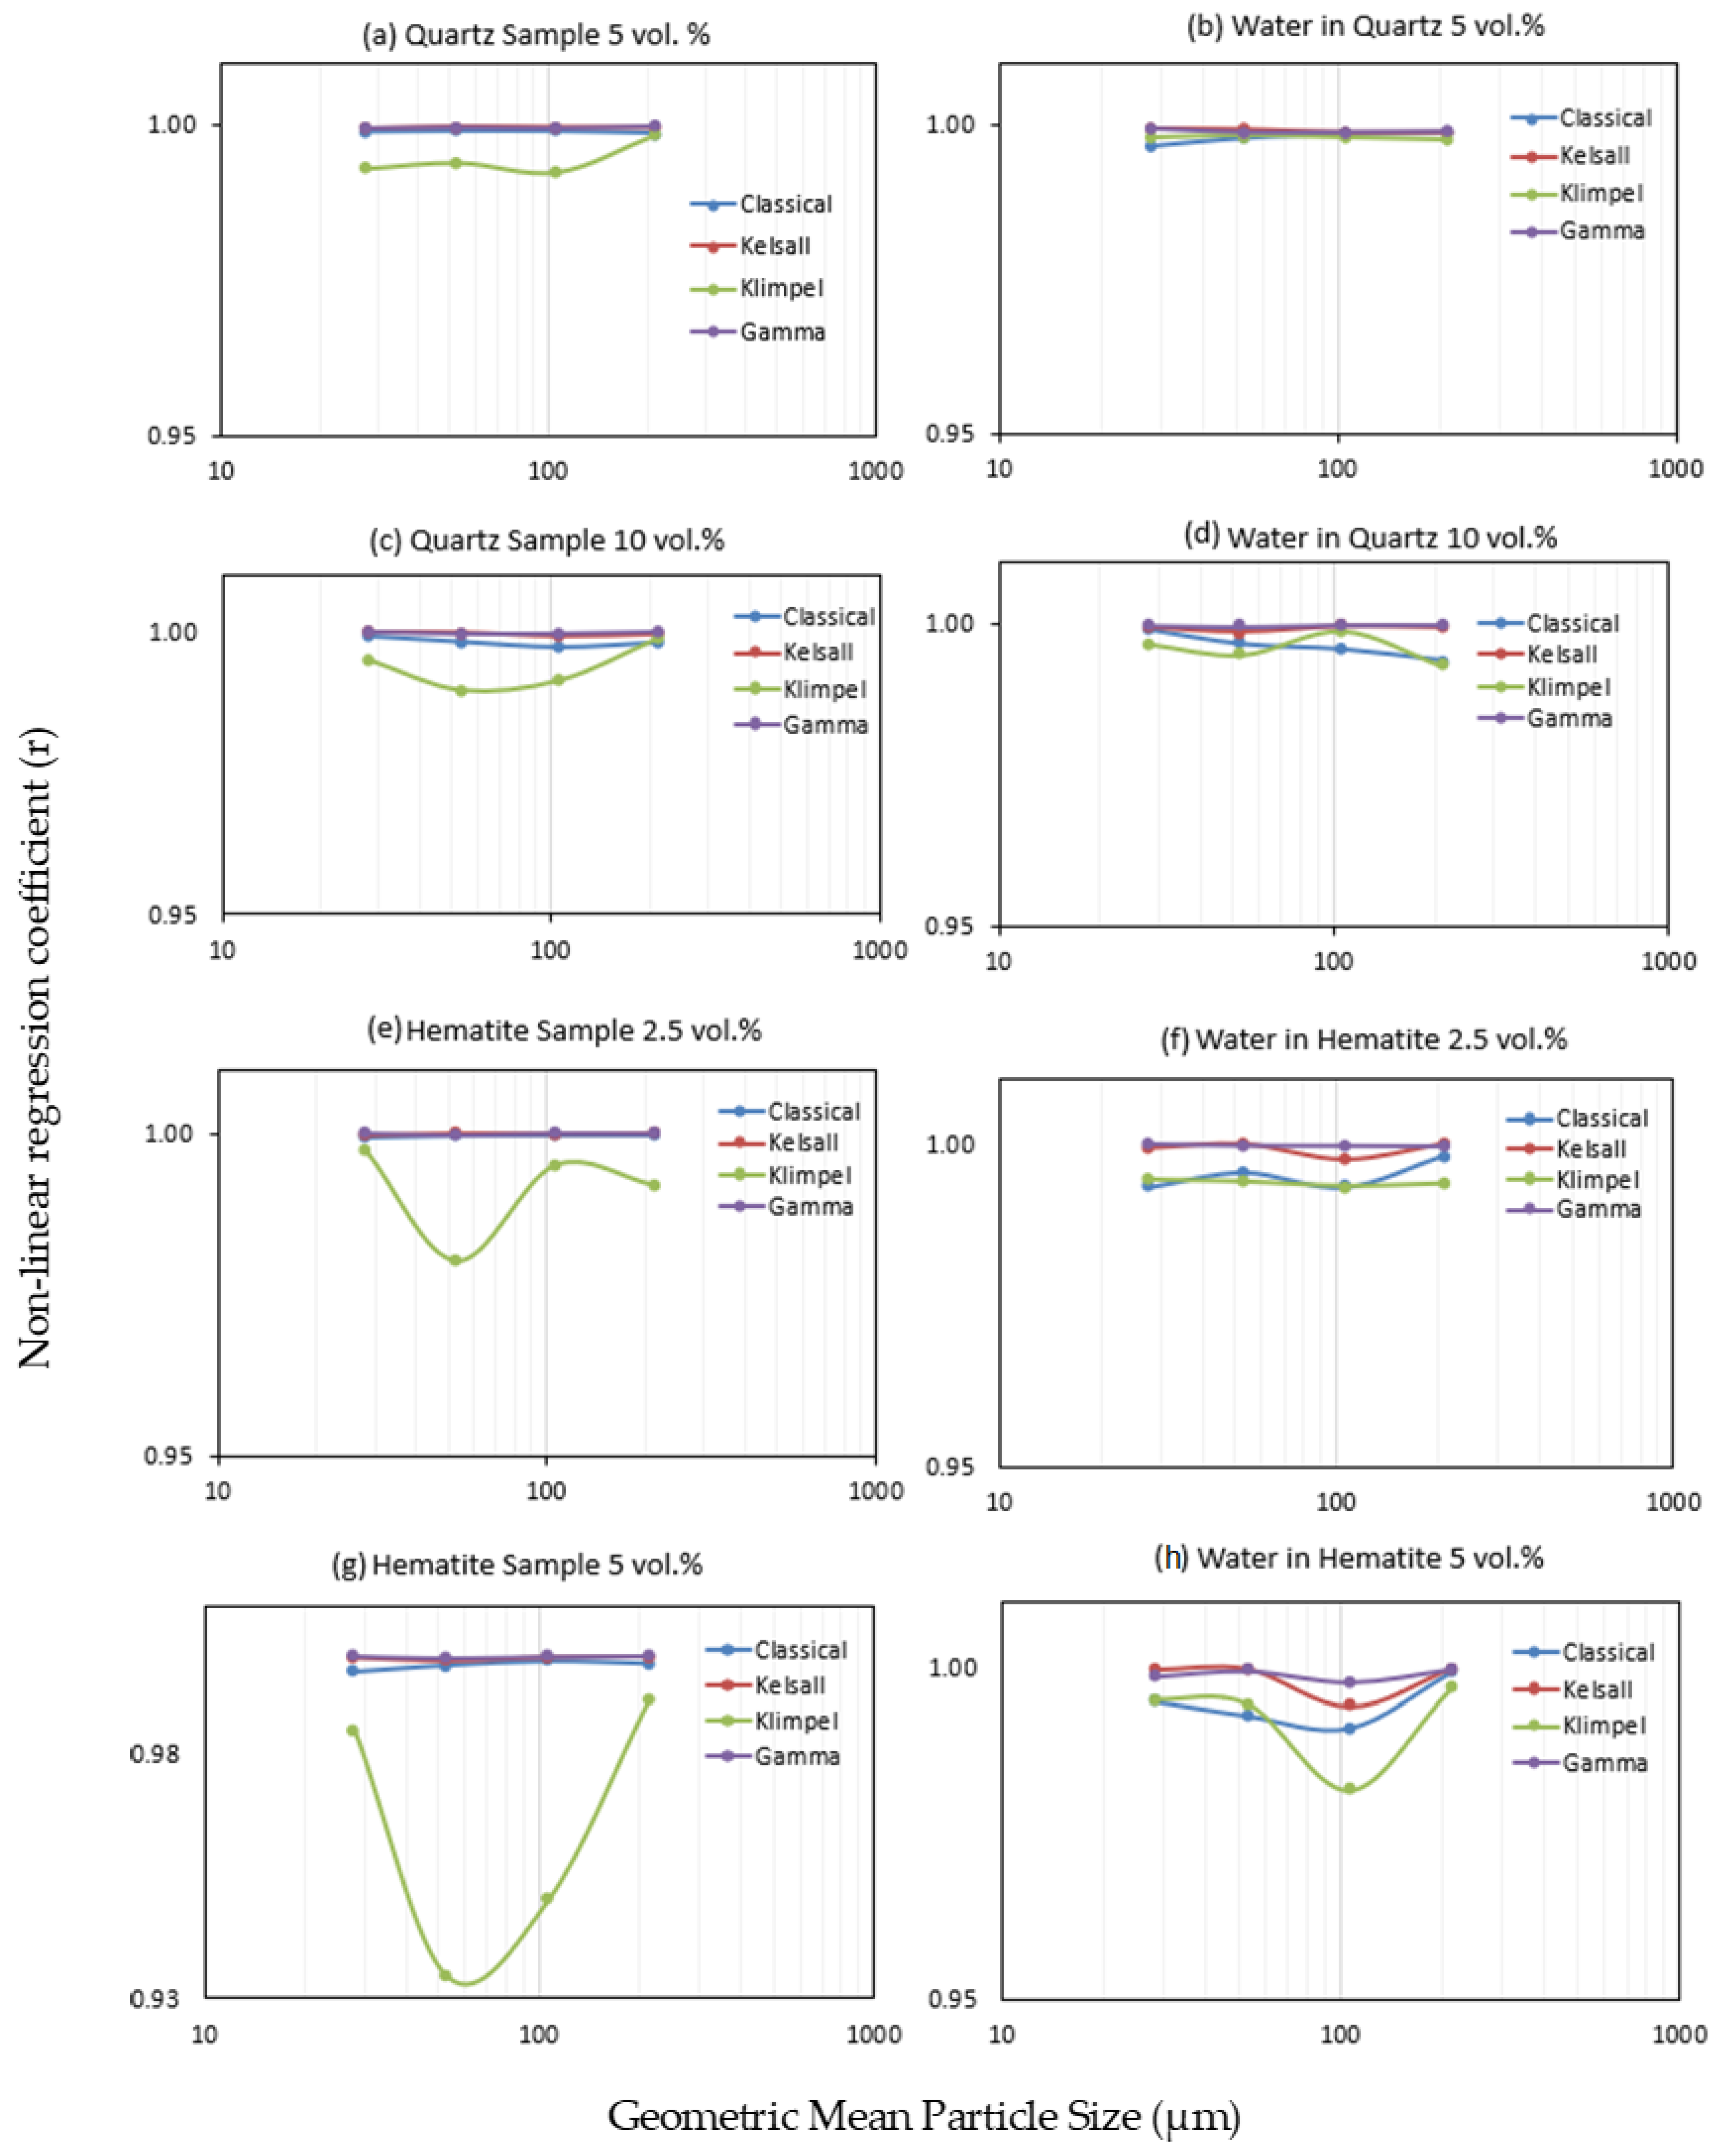
3.2. Kinetic Modeling

3.2.1. Equation Fitting

Figure 4 presents the values of the root-mean-square errors (RMSE) calculated between the experimental data and the four models tested in this study in order to estimate their fitness. For both quartz and hematite, the discretized Gamma distribution is in the best agreement with the experimental data as it shows the minimum RMSE, whereas the Classical model shows the poorest agreement (Figure 4). In a few instances, however, the result obtained with the Kelsal model displays a better fit to the data than the Gamma model. Due to small increases in the RMSE for the Gamma model (e.g., Figure 4c), it was necessary to test more than one fitting method. Therefore, model fitting was also conducted using the non-linear regression coefficient and the results (see supporting data, Figure A1) still indicate that the Gamma model best fit the experimental data, followed by the Kelsal model. However, the Classical model is superior to the Klimpel model, for which the latter shows the poorest fit when tested by the non-linear regression coefficient. It is important to note that the slight increases in the fitting errors of the Gamma model that appear using the RMSE are no longer present with r (Figure A1).
Remarkably, there is no evidence of any single tested model consistently showing good agreement for both fine and coarse particles. This, on the other hand, suggests that both fine and coarse particles can be modelled by the same kinetic model, despite displaying significant differences with respect to recoveries over time. The same is true for the solid concentration, which shows inverse behaviors of the models between quartz and hematite.
Figure 5 gives two examples of the different fitting of the models. As can be seen, almost all these models yield an acceptable fit with the experimental data, although the Gamma model is the most robust. Therefore, the derived kinetic parameters can be used to model the flotation process.

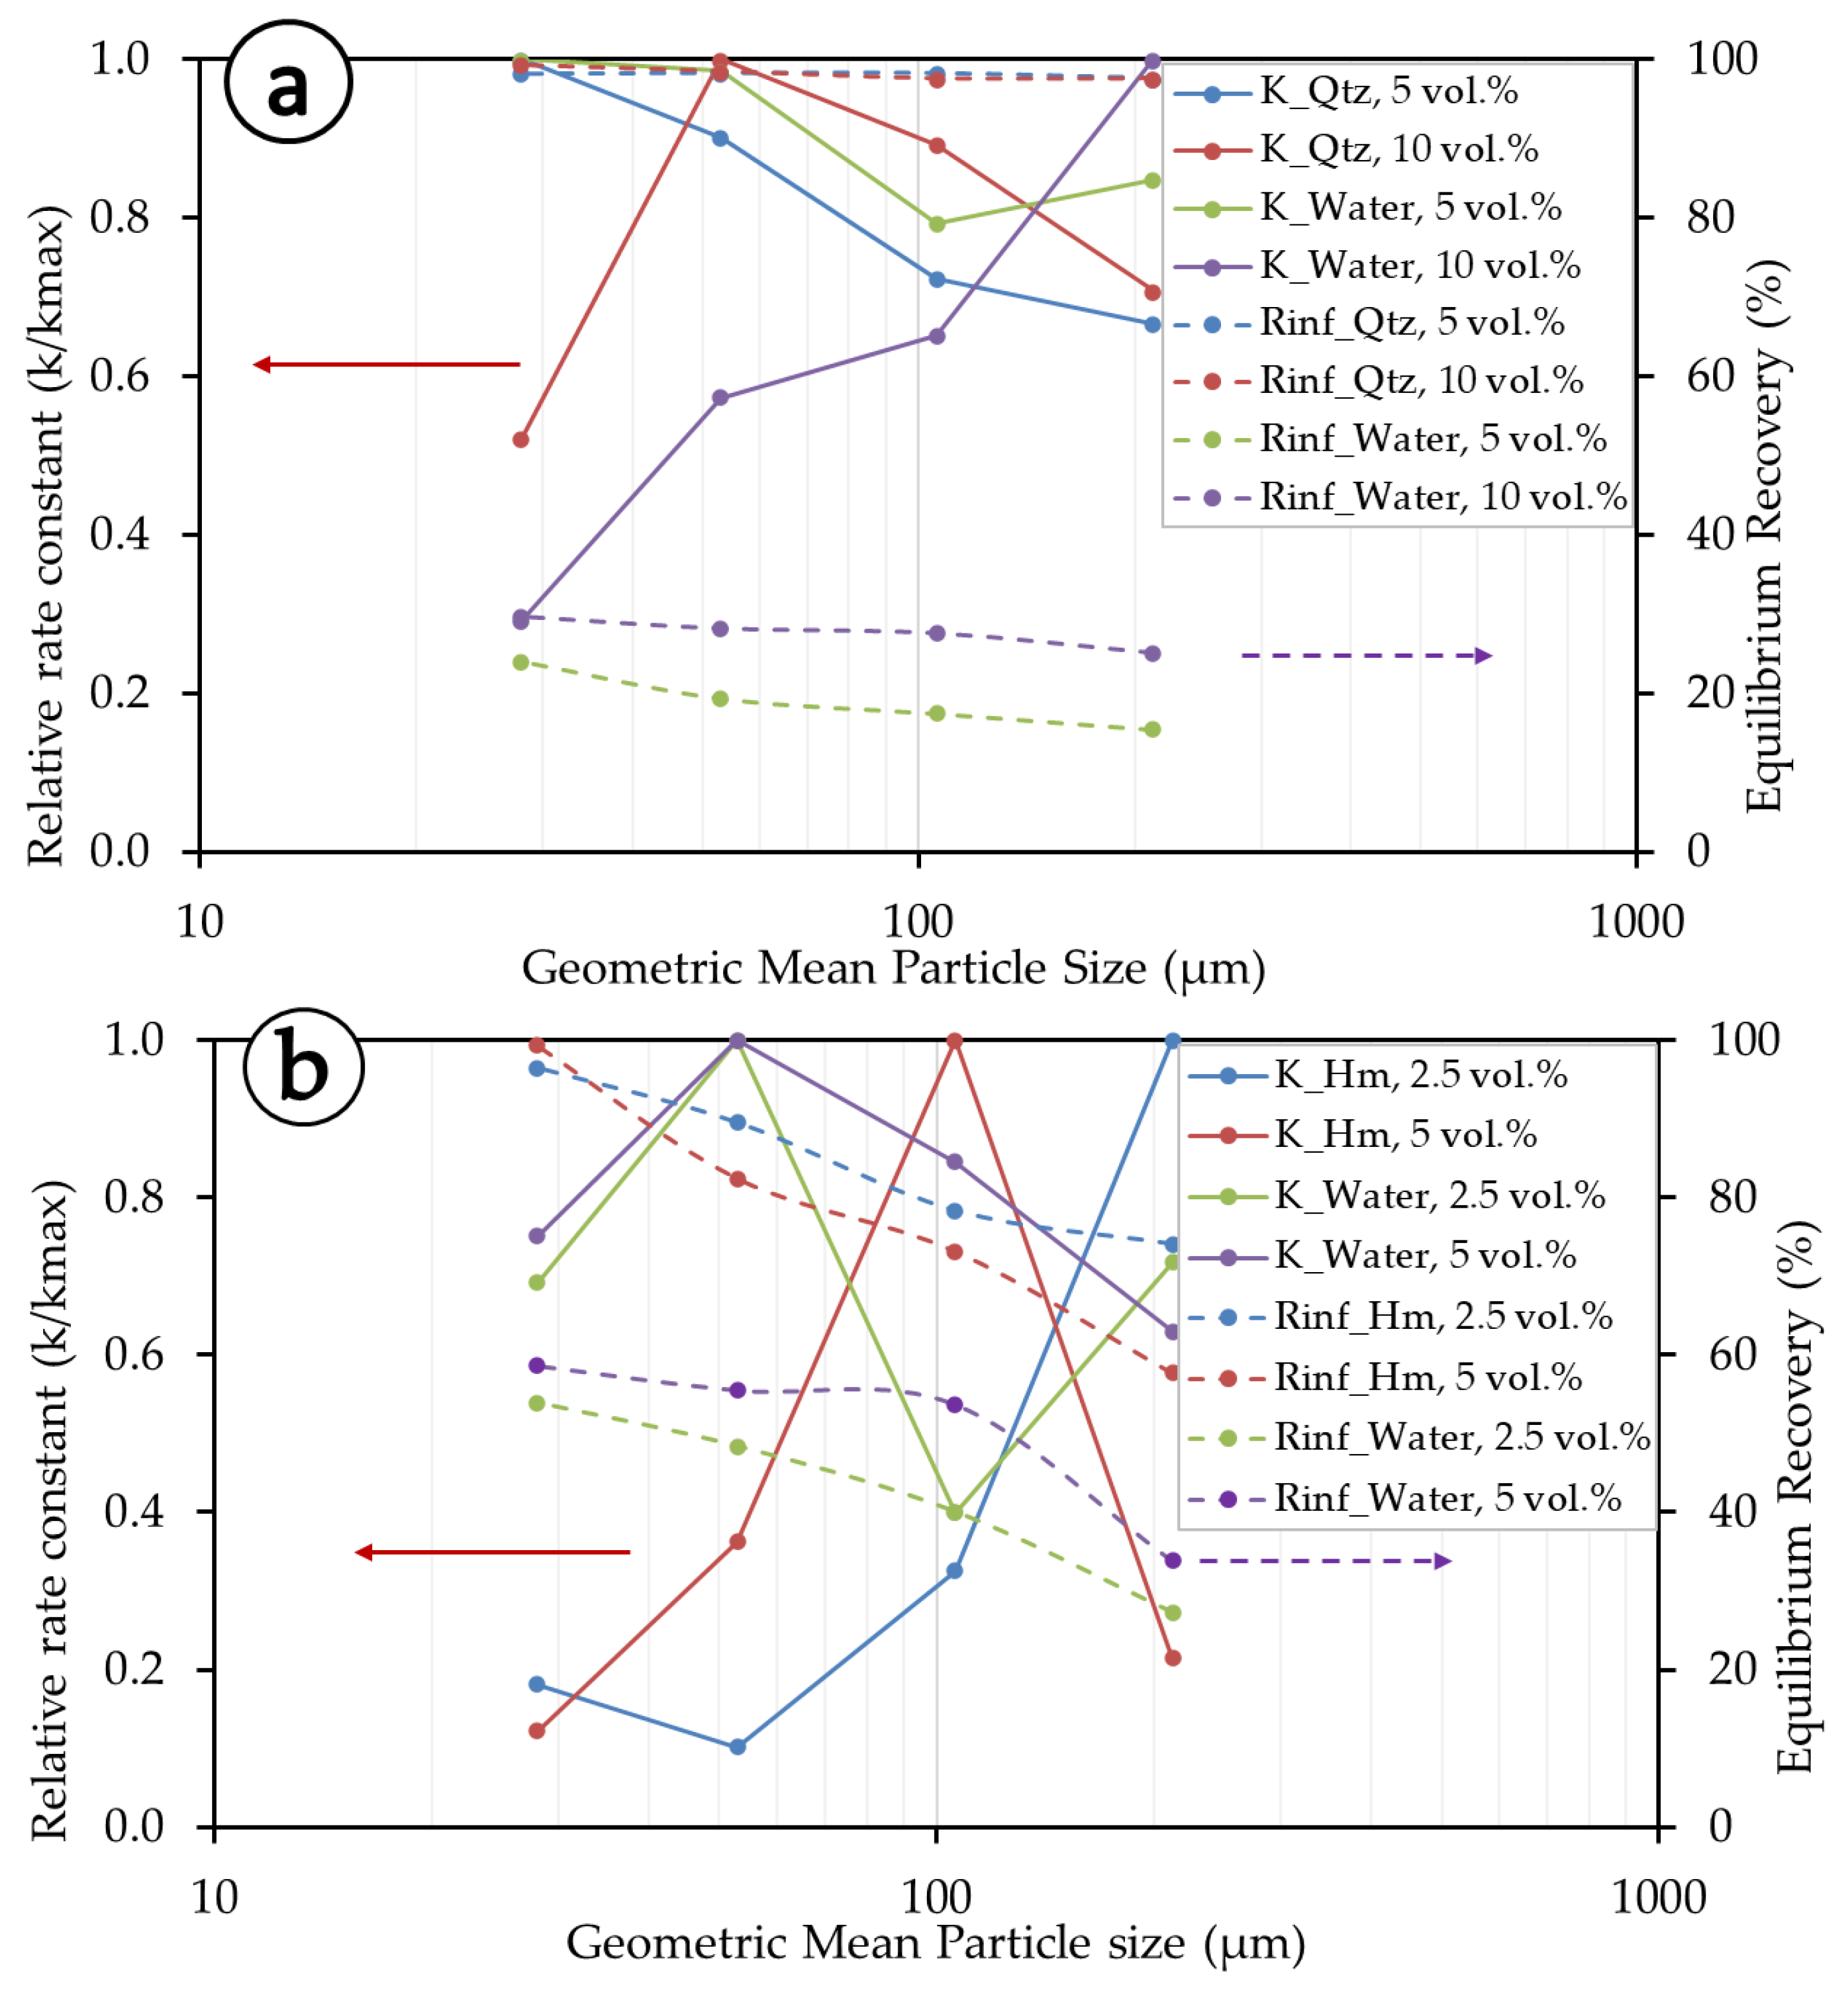
3.2.2. Kinetic Parameters
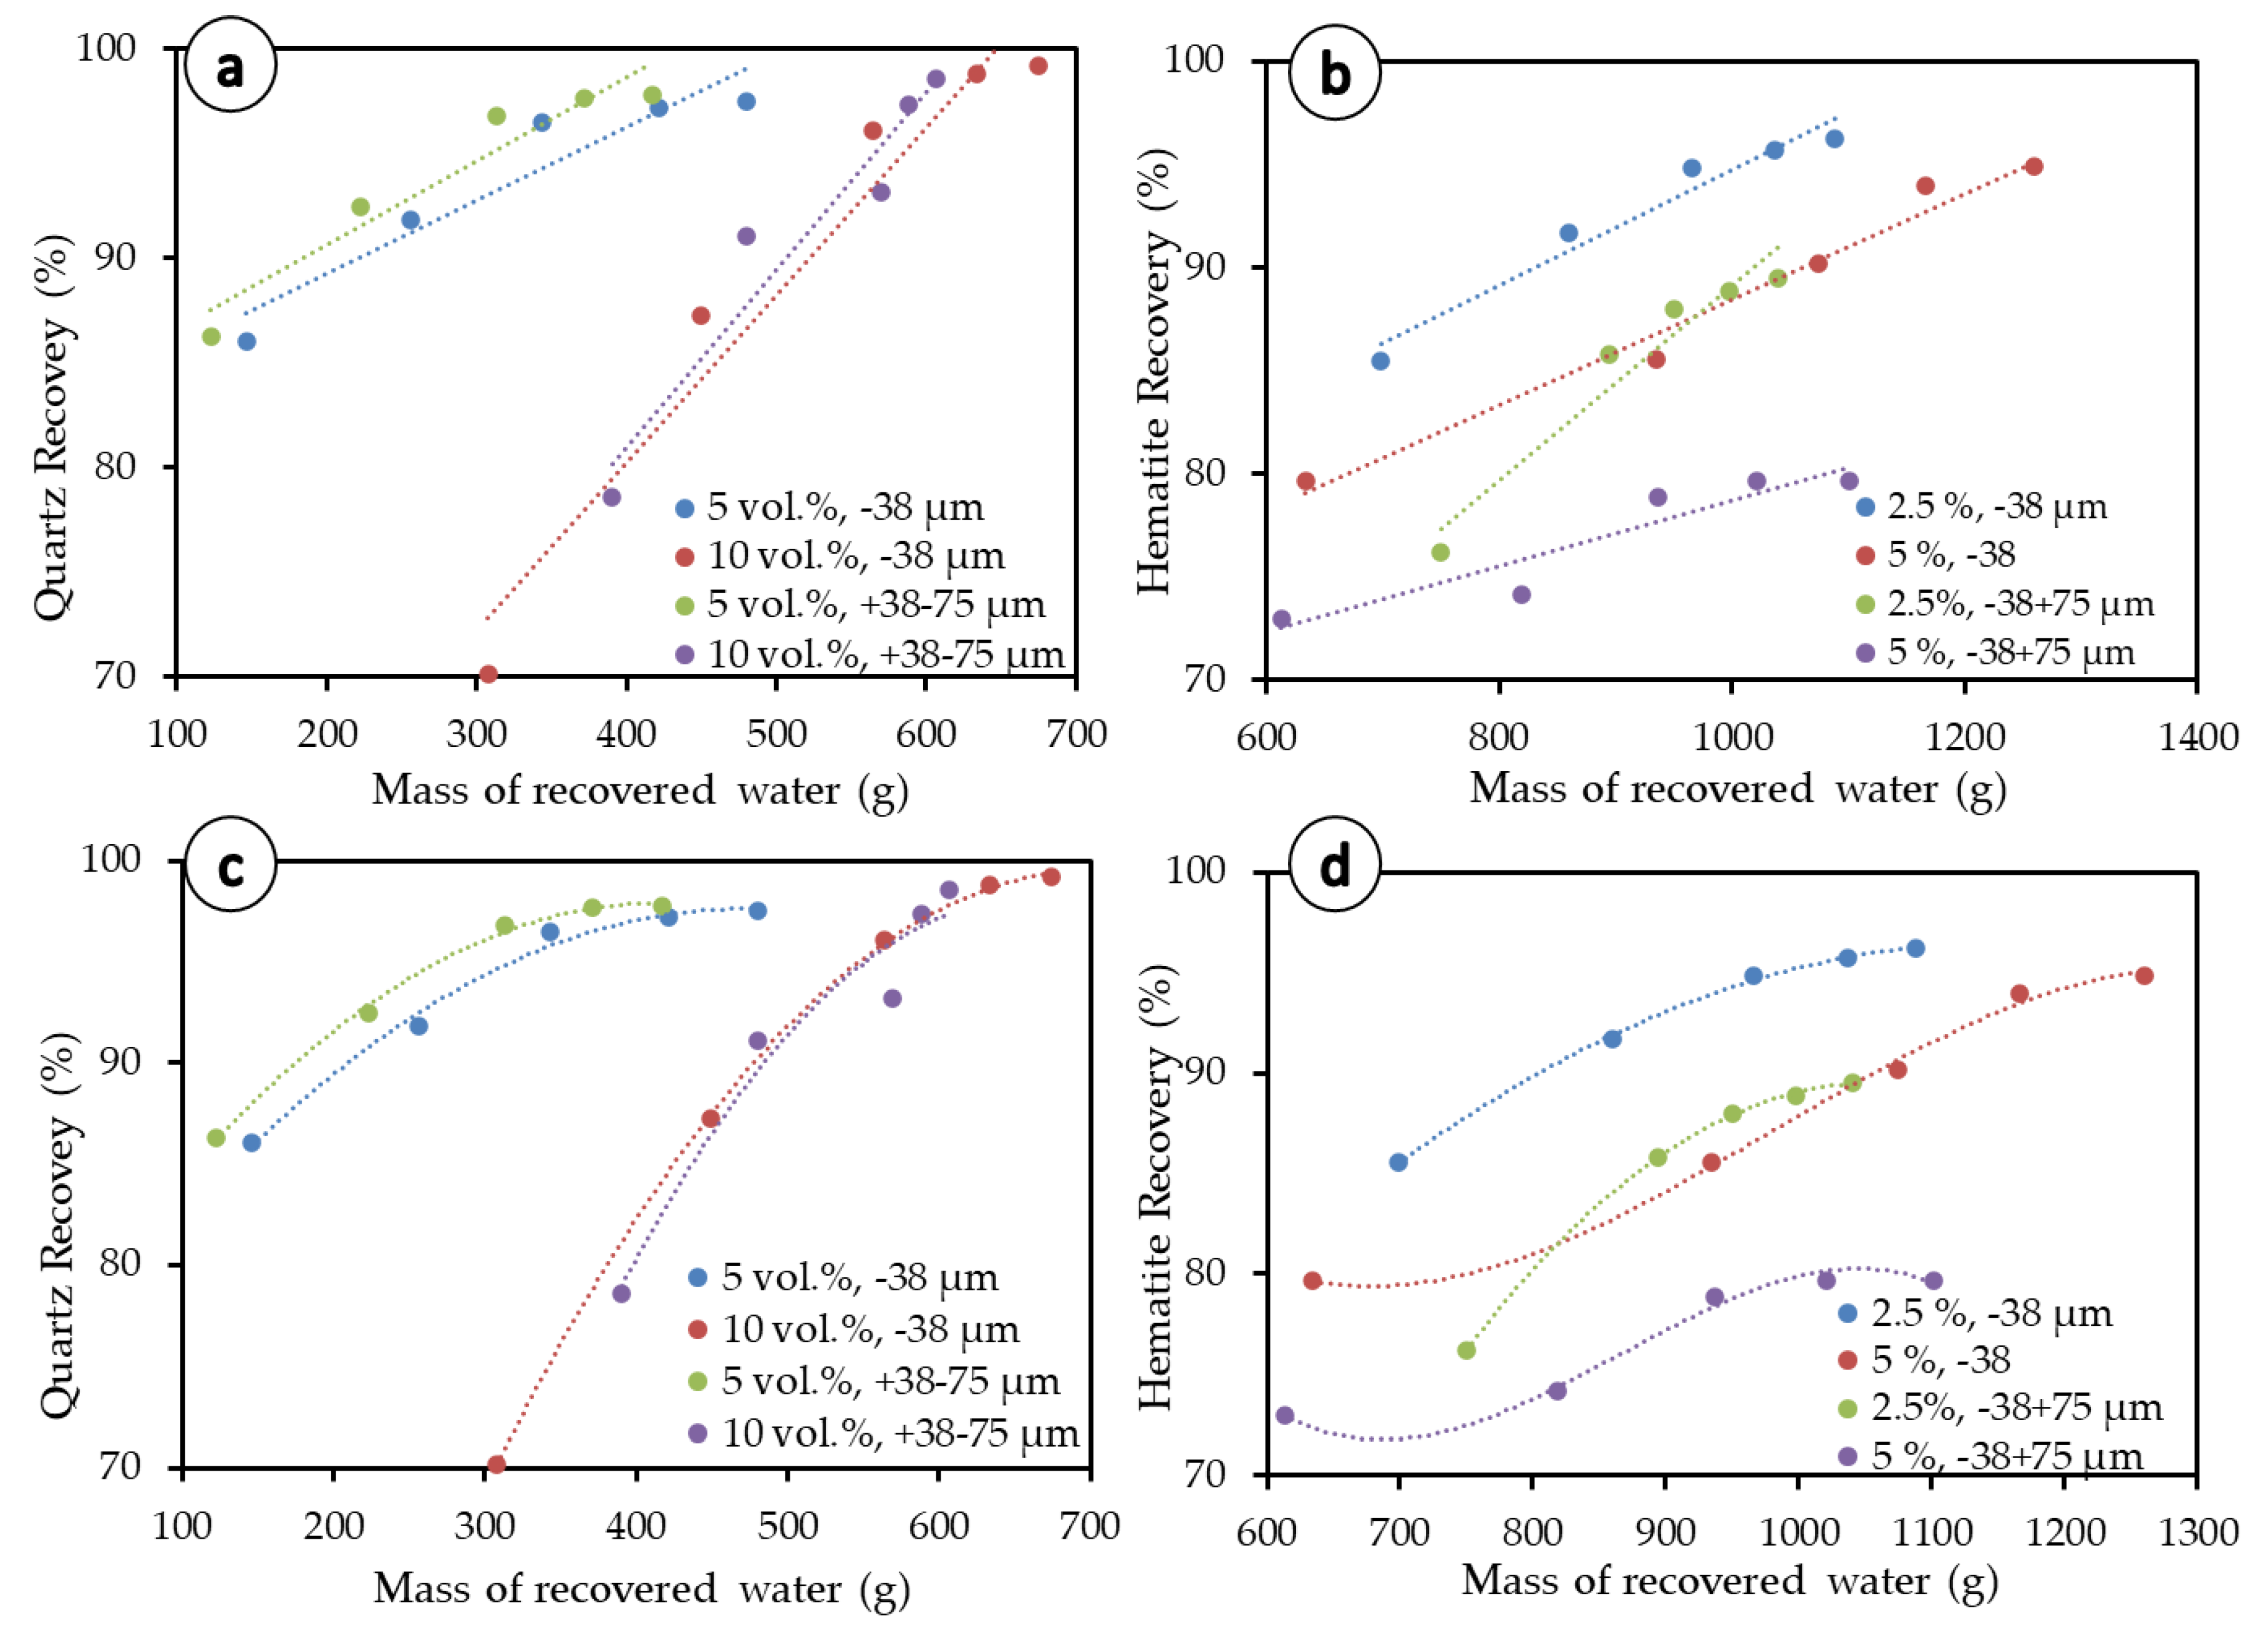
Figure 6 summarizes the relationship between the kinetics parameters (R and k) of the Gamma model. For the convenience of presentation, particle size fractions are represented by a single value of the geometrical mean size, with the lower limit of the finest fraction taken at −20 µm. The rate constants are also presented as relative rate constants (k/kmax) to allow for interpretation between different flotation systems. The experiments show that R and k are size-, solid concentration-, and mineral type- (density and surface chemistry) dependent (Figure 6a,b). At lower solid concentrations (5 vol.% in the quartz system and 2.5 vol.% in the hematite system), quartz exhibits higher rate constants than hematite. Quartz exhibits overall higher R (equilibrium recovery) than hematite, and the latter shows better overall rate constants than quartz. As to the influence of size, at finer size fractions, quartz has better kinetics and recoveries for lower solid concentrations, and in the middle size ranges, better performance appears at higher solid concentrations. Hematite, on the other hand, presents better kinetics at a higher solid concentration in the middle-particle-size fraction. For the lower solid concentration, hematite exhibits better kinetics in the coarser particle size fractions. As for equilibrium recovery, overall, hematite is better recovered at a lower solid concentration, but the recovery steadily decreases towards higher particle size fractions. The differences observed in the behaviors of quartz and hematite are mainly due to their differences in densities, with hematite being almost two times heavier than quartz (5.3 vs. 2.65 g/cm3), but also their interactions with flotation reagents and with other particles in the pulp.
Water kinetics, herein considered proportional to the floatable gangue, are also size, pulp, and density dependent. The water kinetics in the quartz system are better (i.e., less relative rate constant) at a higher solid concentration, which is opposite to the behavior of the mineral itself (i.e., exhibiting a higher relative rate constant at a higher solid concentration in general). This is not the case for hematite, which exhibits overall better water kinetics (i.e., a lower relative rate constant) at lower solid concentrations. Water recovery in the hematite mineral system is better than in the quartz system and exhibits a steady decrease with an increasing particle size. This is understandable because, at lower particle sizes, there is much greater entrainment of fine particles, whose movement involves more water pull. Essentially, equilibrium recovery (R) and rate constants (k) are better in the middle to higher particle size fractions of quartz, whereas in the case of hematite, better kinetics are exhibited at lower to middle particle size fractions.

3.3. Entrainment

Water recovery is plotted for different particle size fractions both in the quartz and hematite systems (Figure 7) in order to visualize the influence of kinetics on entrainment [18,19,20]. The linear equations and associated coefficients of determination (R2) for the respective linear correlations between minerals and water recoveries are presented in Table 3.
Figure 7 shows an inverse relationship between solid concentration and particle size with respect to the amount of water recovered by the concentrate. This anticorrelation is more clearly visible in the case of hematite due to its higher density compared to quartz. In both the quartz and hematite flotation systems, at lower solid concentrations, the experimental data show a break in the linear trend (change in slope) (e.g., Figure 7a). Therefore, most of the water recovery to the froth occurs and accelerates as mineral recovery approaches its equilibrium recovery. The trend of higher water recovery at higher solid concentrations is consistent with previous studies which showed that diluting the solid concentration reduces water recovery [10]. Although this trend may seem counter-intuitive, it is explained by the fact that water transport is done by the air bubbles. The dilution of the flotation feed (i.e., low solid concentration) means that the feed rate of water rises. However, if there is no change in the bubbling rate, then the rate of water carried to the concentrate remains unchanged, at least to a first approximation [10]. Water recovery is the ratio of water content in the concentrate compared to its content in the feed. If the former remains unchanged while the latter increases, then water recovery decreases.
Despite the break in the linear trends, the overall individual linear equations of water recovery vs. particle recovery (y = mx + b) show some remarkable trends (Table 3), which are similar to those found in the literature (e.g., [53]). In almost all situations, the coefficients of determination (R2) are higher in the hematite system than in the quartz system for the same particle size fractions. This translates into the break (change in slope) expressed in Figure 7a, which is more pronounced in the case of quartz than hematite. This suggests that in the reverse flotation of iron ore, refraining from achieving equilibrium recovery could help limit entrainment, but not necessarily in the case of direct flotation. The better linearity observed for hematite was also observed for other heavy minerals in previous studies, such as pyrite [54] and cassiterite [19]. Thus, the findings obtained in this study could extend to other flotation systems including light (e.g., silicate minerals) and heavy minerals (e.g., hematite, cassiterite). In the quartz system, the slopes (m values) of different lines consistently increase as the particle size fractions decrease, with the highest values matching the lowest particle size (−38 µm), whereas this is the contrary trend exhibited concerning the y-intercept values (b values). This is expected since the water recovery relative to entrainment is known to correlate well with the recovery of fine particles (e.g., [19,20,41]). Remarkably, in the quartz system, the higher values of m and lower values of b are exhibited with the lower solid concentration (5 vol.%). According to Warren et al. [19], smaller b values translate into lower water recovery, meaning that higher water recoveries, and, therefore, higher entrainment, are observed at rather higher solid concentrations (here, at 10 vol.% in the quartz system). This observation is consistent with previous studies that showed that increasing the solid concentration has an effect on pulp rheology, leading to an increase in recovery by entrainment [36,47]. In the hematite system, although there is no consistent trend, higher values of m and lower values of b are seen in the higher particle size fractions, and this trend is not in accordance with the quartz system. The values of m are, on average, slightly higher at the higher solid concentrations, and this further confirms the increased entrainment due to an adverse effect of the high solid concentration on the pulp rheology. The reason for this could be the differences in both the particles’ density and their respective surface chemistries, for which the latter govern their ability to interact with the DDA collector [47,55,56].
The slow-floating fractions and rates are reasonable indicators of mineral entrainment in flotation. The more the slow-floating particles (θ, Kelsall model) in a system and the higher their associated flotation kinetics rate constant (ks), the higher the entrainment [57]. Analysis of fast- and slow-floating fractions is also used in this study to characterize entrainment. The Kelsall kinetics model [15], as presented in Table 1, can be analyzed to gain further insight into the correlation between flotation kinetics and entrainment. For this purpose, the finest particle size fraction studied (−38 µm) is used (Figure 8) for illustration. At this size fraction, the slow-floating fraction θ for hematite (5 vol.% solid concentration), ks, and kf (Table 1) have respective values of 0.15, 0.18, and 5.09. Therefore, the fast and slow recoveries of hematite are given in Equations (13) and (14) below:
R f = 0.85   ( 1 e 5.09 t )
R s = 0.15   ( 1 e 0.18 t )
At first glance at Figure 8, a difference appears between both the mineral particles and associated water recoveries both at high and low solid concentrations. On the one hand, the total mineral particles’ recoveries tend to follow the same trend as the fast-floating particles, whereas the total water recovery follows the general trend of slow water fraction recovery. On the other hand, the fast-floating mineral particles show better performance at lower pulp densities, while the slow-floating particles perform better at higher pulp densities. The opposite is obviously true for water kinetics in both systems for the fast-floating water fraction. The slow-floating water fraction features a peculiar behavior though, with linear and diverging curves over an extended duration of the flotation process. The conclusion from these observations is that after fast recovery (true flotation) is over, the slow recoveries and kinetics are mainly driven by the slow-floating water fraction.
Results for the Warren entrainment method are presented in Figure 9a,b (dotted lines), and corresponding linear regression equations fitting presented in Table 4. This method consists of separating the degree of entrainment, the recovery by entrainment, and the recovery by true flotation. As a traditionally used method, it can provide an initial insight into the impact of entrainment. In total, five entrainment models were tested on the −38 µm and +38–75 µm size fractions and results are presented in Table 5.
Although the entrainment values deduced from the Warren model are used for comparison with other methods, this method does not seem to fit well with the experimental data on the graph. The reason for this discrepancy may be because the model was developed for finer particles and may not be directly extended to all the size ranges considered in the present work. Based on our results and this observation, we suggest that polynomial equations (Figure 9c,d), which yield better determination coefficients (Table 4) for most of the flotation experiments in both quartz and hematite flotation systems, are used instead. However, this polynomial-fitting method builds from the Warren model, as the 2D plot still represents particle recovery as a function of the mass of water recovered by the concentrate.
The modeling results presented in Table 5 are very similar for entrainment at the −38 µm and +38–75 µm size fractions and not consistent with the fact that coarser fractions are expected to yield lower entrainment [19,20,21,22]. In addition, none of the models make use of the solid concentration, which does not correspond to the discussion provided above, wherein the solid concentration has been proven to play an important role in flotation kinetics and entrainment. Of all tested methods/models, only the Ross and Van Deventer model [20] does not capture any differences in the degree of entrainment as the solid concentration of particles in the pulp varies. This model is consistent in terms of the size fraction and particle density, with coarser size fractions (+38–75 µm) presenting lower entrainment than fine size fractions (−38 µm) and heavy particles leading to lower entrainment. The Ross and Van Deventer model also yields negative values for hematite at coarser particle sizes, an understandable outcome since they make use of both density and particle size, which are both—according to the model (Table 2)—anticorrelated with entrainment. Regarding the degree of entrainment, only the Ross model mostly satisfied the condition for higher solid concentrations to show higher entrainment (e.g., 0.220 at 5 vol.% quartz < 0.312 at 10 vol.% quartz) and higher particle density to display lower entrainment—especially for the −38 µm size fraction (i.e., 0.220 at 5 vol.% quartz > 0.013 at 5 vol.% hematite). Regarding the recovery by entrainment, at the −38 µm size range, the tested models (Warren, Maachar and Dobby, and Rahal et al.) show that a higher solid concentration leads to higher values for the recovery by entrainment for the -38 µm size range (e.g., 16.90% with 5 vol.% quartz < 53.93% with 10 vol.% quartz by Warren model; 30.37% with 2.5 vol.% hematite < 32.27% with 5 vol.% hematite by Warren model). This agreed with the higher water recovery obtained with the higher solid concentration (i.e., 10 vol.% for quartz, 5 vol.% for hematite), as shown in Figure 2a,b.
In short, entrainment, the non-selective recovery of fine particles, is mainly driven by slow-floating water towards the equilibrium recovery. The methods and models describing this phenomenon should integrate both the solid concentration and particle size, in addition to previously considered parameters such as particle density.

4. Conclusions

This study investigated the impact of the size fraction and solid concentration on the flotation kinetics and entrainment in quartz and hematite single-mineral flotation systems under similar flotation-related operating conditions. Four commonly used flotation kinetics models, as well as five selected entrainment methods/models, were tested.
In the quartz flotation system, the higher solid concentration and lower particle size fractions exhibited better quartz flotation recovery along with higher water pull over time. Superior hematite flotation recovery was found at lower solid concentrations. However, in the hematite system, water recovery reached the maximum of almost 60% in the finest particle size range (−38 µm) at a higher solid concentration (5 vol.%), which can be compared to only 30% in the case of quartz at 10 vol.% at the same size fraction. Thus, during direct hematite flotation, a vast quantity of water can be recovered along with a high quantity of entrained gangue (quartz), but in reverse flotation, less water can be pulled to quartz concentrate, resulting in less entrained hematite. Therefore, the use of reverse iron ore flotation is recommended, and the targeting of silicate minerals constitutes the best flotation route applicable to iron ore beneficiation as opposed to direct flotation, which is aimed at hematite.
Kinetics modeling showed that the discretized Gamma distribution was achieved the best agreement with the experimental data as it produced the minimum RMSE and non-linear correlation coefficient, whereas the Classical and Klimpel models showed the poorest agreement. The equilibrium recovery (R) and rate constants (k) of both quartz and hematite were better in the middle-particle-size fractions. The water kinetics in the quartz system were faster at higher solid concentrations, which contrasts with the behavior of the quartz itself. This is not the case for hematite, which exhibits overall faster water kinetics at lower solid concentrations.
An inverse relationship was observed between the amount of water recovered by the concentrate and both the solid concentration and particle size. As the flotation time is extended, the majority of the water recovery by the froth occurs and accelerates as mineral recovery nears its equilibrium recovery. Therefore, in the reverse flotation of iron ore, refraining from achieving the equilibrium recovery could help limit entrainment, but not necessarily in direct flotation. No entrainment model or method gave satisfactory results in accordance with the flotation rates, but the Warren and Ross models approximated the overall performance at the finest size fraction. However, replacing the Warren method by polynomial distribution led to better fits in all the experiments. In addition to the solid concentration, particle size and density are key to the development of new entrainment models. The separation of fast from slow flotation showed that after fast recovery was finished, the slow recoveries were mainly driven by the slow-floating water fraction. In order to complement this study, flotation tests and modeling of the mixture of hematite and quartz can be carried out and the results can be compared with the ones obtained from the single-mineral flotation tests presented in this study.

Author Contributions

Conceptualization, A.O.; methodology, E.M., M.H. and A.O.; software, E.M. and A.O.; validation, E.M. and A.O.; formal analysis, E.M. and A.O.; investigation, E.M., M.H. and A.O.; resources, A.O.; data curation, E.M., M.H. and A.O.; writing—original draft preparation, E.M. and A.O.; writing—review and editing, E.M. and A.O.; visualization, E.M. and A.O.; supervision, A.O.; project administration, A.O.; funding acquisition, A.O. All authors have read and agreed to the published version of the manuscript.

Funding

This research received no external funding.

Data Availability Statement

Not applicable.

Acknowledgments

We acknowledge that the experimental part of the work presented in this article was conducted as a part of thesis work of M.H. at the Université of Lorraine in France.

Conflicts of Interest

The authors declare no conflict of interest.

Appendix A

Figure A1. Model fitting using the non-linear regression coefficient: (a) quartz 5 vol.% (b) water in quartz 5 vol.%, (c) quartz sample 10 vol.%, (d) water in quartz 10 vol.%, (e) hematite sample 2.5 vol.%, (f) water in hematite 2.5 vol.%, (g) hematite sample 5 vol.%, and (h) water in hematite 5 vol.%.
Metals 13 00053 g0a1

References

  1. Filippov, L.O.; Severov, V.V.; Filippova, I.V. An Overview of the Beneficiation of Iron Ores via Reverse Cationic Flotation. Int. J. Miner. Process. 2014, 127, 62–69. [Google Scholar] [CrossRef]
  2. Braga, F.Y.A.; José, A.M.L.; Milhomem, F.O. Size-Dependent Kinetics of Iron Ore Reverse Flotation. Part. Sci. Technol. 2020, 38, 419–426. [Google Scholar] [CrossRef]
  3. Pereira, A.R.M.; Hacha, R.R.; Torem, M.L.; Merma, A.G.; Silvas, F.P.C.; Abhilash, A. Direct Hematite Flotation from an Iron Ore Tailing Using an Innovative Biosurfactant. Sep. Sci. Technol. 2021, 56, 2978–2988. [Google Scholar] [CrossRef]
  4. Quast, K. An Investigation of the Flotation Minimum in the Oleate Flotation of Hematite under Alkaline Conditions. Miner. Eng. 2017, 113, 71–82. [Google Scholar] [CrossRef]
  5. Ray, N.; Nayak, D.; Dash, N.; Rath, S.S. Utilization of Low-Grade Banded Hematite Jasper Ores: Recovery of Iron Values and Production of Ferrosilicon. Clean Technol. Environ. Policy 2018, 20, 1761–1771. [Google Scholar] [CrossRef]
  6. Araujo, A.C.; Viana, P.R.M.; Peres, A.E.C. Reagents in Iron Ores Flotation. Miner. Eng. 2005, 18, 219–224. [Google Scholar] [CrossRef]
  7. Kapiamba, K.F.; Kimpiab, M. The Effects of Partially Replacing Amine Collectors by a Commercial Frother in a Reverse Cationic Hematite Flotation. Heliyon 2021, 7, e06559. [Google Scholar] [CrossRef]
  8. Ma, M. Froth Flotation of Iron Ores. Int. J. Min. Eng. Miner. Process. 2012, 1, 56–61. [Google Scholar] [CrossRef]
  9. Nguyen, A.V. FLOTATION. In Encyclopedia of Separation Science; Wilson, I.D., Ed.; Academic Press: Oxford, UK, 2007; pp. 1–27. ISBN 978-0-12-226770-3. [Google Scholar]
  10. Wills, B.A.; Finch, J.A. Chapter 12—Froth Flotation. In Wills’ Mineral Processing Technology, 8th ed.; Butterworth-Heinemann: Oxford, UK, 2016; pp. 265–380. ISBN 978-0-08-097053-0. [Google Scholar]
  11. Runge, K. Laboratory Flotation Testing—An Essential Tool for Ore Characterisation. Flotat. Plant Optim. 2010, 19, 55–173. [Google Scholar]
  12. Zúñiga, H.G. La Recuperación Por Flotación Es Una Función Exponencial Del Tiempo. Boletín Soc. Nac. De Min. 1935, 47, 83–86. [Google Scholar]
  13. Bu, X.; Xie, G.; Peng, Y.; Ge, L.; Ni, C. Kinetics of Flotation. Order of Process, Rate Constant Distribution and Ultimate Recovery. Physicochem. Probl. Miner. Process. 2017, 53, 342–365. [Google Scholar] [CrossRef]
  14. Vinnett, L.; Waters, K.E. Representation of Kinetics Models in Batch Flotation as Distributed First-Order Reactions. Minerals 2020, 10, 913. [Google Scholar] [CrossRef]
  15. Trahar, W.J. A Rational Interpretation of the Role of Particle Size in Flotation. Int. J. Miner. Process. 1981, 8, 289–327. [Google Scholar] [CrossRef]
  16. Klimpel, R.R. Selection of Chemical Reagents for Flotation. In Mineral Processing Plant Design; Mullar, A.L., Bhappu, R.B., Eds.; AIME: New York, NY, USA, 1980; pp. 907–934. [Google Scholar]
  17. Gulsoy, O.Y. A Simple Model for the Calculation of Entrainment in Flotation. Korean J. Chem. Eng. 2005, 22, 628–634. [Google Scholar] [CrossRef]
  18. Kirjavainen, V.M. Application of a Probability Model for the Entrainment of Hydrophilic Particles in Froth Flotation. Int. J. Miner. Process. 1989, 27, 63–74. [Google Scholar] [CrossRef]
  19. Warren, L.J. Determination of the Contributions of True Flotation and Entrainment in Batch Flotation Tests. Int. J. Miner. Process. 1985, 14, 33–44. [Google Scholar] [CrossRef]
  20. Wang, L.; Peng, Y.; Runge, K.; Bradshaw, D. A Review of Entrainment: Mechanisms, Contributing Factors and Modelling in Flotation. Miner. Eng. 2015, 70, 77–91. [Google Scholar] [CrossRef]
  21. Wang, C.; Sun, C.; Liu, Q. Entrainment of Gangue Minerals in Froth Flotation: Mechanisms, Models, Controlling Factors, and Abatement Techniques—A Review. Min. Metall. Explor. 2021, 38, 673–692. [Google Scholar] [CrossRef]
  22. Wang, L.; Peng, Y.; Runge, K. Entrainment in Froth Flotation: The Degree of Entrainment and Its Contributing Factors. Powder Technol. 2016, 288, 202–211. [Google Scholar] [CrossRef] [Green Version]
  23. Ramlall, N.V. Measuring and Modelling Entrainment in Rougher and Cleaner Batch Flotation. J. S. Afr. Inst. Min. Metall. 2020, 120. [Google Scholar] [CrossRef]
  24. Mineralogy & Flotation: Floatability VS Selectivity Test Assessment. Mineral Processing & Metallurgy. 2016. Available online: https://www.911metallurgist.com/blog/mineralogy-flotation-floatability-selectivity (accessed on 21 July 2022).
  25. Rahman, R.M.; Ata, S.; Jameson, G.J. The Effect of Flotation Variables on the Recovery of Different Particle Size Fractions in the Froth and the Pulp. Int. J. Miner. Process. 2012, 106–109, 70–77. [Google Scholar] [CrossRef]
  26. Schubert, H. On the Optimization of Hydrodynamics in Fine Particle Flotation. Miner. Eng. 2008, 21, 930–936. [Google Scholar] [CrossRef]
  27. Safari, M.; Hoseinian, F.S.; Deglon, D.; Leal Filho, L.; Souza Pinto, T.C. Impact of Flotation Operational Parameters on the Optimization of Fine and Coarse Itabirite Iron Ore Beneficiation. Powder Technol. 2022, 408, 117772. [Google Scholar] [CrossRef]
  28. Xu, D.; Ametov, I.; Grano, S.R. Detachment of Coarse Particles from Oscillating Bubbles—The Effect of Particle Contact Angle, Shape and Medium Viscosity. Int. J. Miner. Process. 2011, 101, 50–57. [Google Scholar] [CrossRef]
  29. Silva, K.; Filippov, L.O.; Piçarra, A.; Flilippova, I.V.; Lima, N.; Skliar, A.; Faustino, L.; Filho, L.L. New Perspectives in Iron Ore Flotation: Use of Collector Reagents without Depressants in Reverse Cationic Flotation of Quartz. Miner. Eng. 2021, 170, 107004. [Google Scholar] [CrossRef]
  30. Filippov, L.O.; Silva, K.; Piçarra, A.; Lima, N.; Santos, I.; Bicalho, L.; Filippova, I.V.; Peres, A.E.C. Iron Ore Slimes Flotation Tests Using Column and Amidoamine Collector without Depressant. Minerals 2021, 11, 699. [Google Scholar] [CrossRef]
  31. Polat, M.; Chander, S. First-Order Flotation Kinetics Models and Methods for Estimation of the True Distribution of Flotation Rate Constants. Int. J. Miner. Process. 2000, 58, 145–166. [Google Scholar] [CrossRef]
  32. Sutherland, K.L. Physical Chemistry of Flotation. XI. Kinetics of the Flotation Process. J. Phys. Chem. 1948, 52, 394–425. [Google Scholar] [CrossRef]
  33. Brezani, I. Flotation Kinetics—Equation Fitting. Available online: https://www.mathworks.com/matlabcentral/fileexchange/28583-flotation-kinetics-equation-fitting (accessed on 5 May 2022).
  34. Xu, M. Modified Flotation Rate Constant and Selectivity Index. Miner. Eng. 1998, 11, 271–278. [Google Scholar] [CrossRef]
  35. Laplante, A.R.; Kaya, M.; Smith, H.W. The Effect of Froth on Flotation Kinetics-A Mass Transfer Approach. Miner. Process. Extr. Metall. Rev. 1989, 5, 147–168. [Google Scholar] [CrossRef]
  36. Fornasiero, D.; Filippov, L.O. Innovations in the Flotation of Fine and Coarse Particles. J. Phys. Conf. Ser. 2017, 879, 012002. [Google Scholar] [CrossRef] [Green Version]
  37. Lima, N.P.; de Souza Pinto, T.C.; Tavares, A.C.; Sweet, J. The Entrainment Effect on the Performance of Iron Ore Reverse Flotation. Miner. Eng. 2016, 96–97, 53–58. [Google Scholar] [CrossRef]
  38. Eskanlou, A.; Huang, Q.; Chegeni, M.H.; Khalesi, M.R.; Abdollahy, M. Determination of the Mass Transfer Rate Constant in a Laboratory Column Flotation Using the Bubble Active Surface Coefficient. Miner. Eng. 2020, 156, 106521. [Google Scholar] [CrossRef]
  39. Duan, J.; Fornasiero, D.; Ralston, J. Calculation of the Flotation Rate Constant of Chalcopyrite Particles in an Ore. Int. J. Miner. Process. 2003, 72, 227–237. [Google Scholar] [CrossRef]
  40. Rahal, K.; Manlapig, E.; Franzidis, J.-P. Effect of Frother Type and Concentration on the Water Recovery and Entrainment Recovery Relationship. Min. Metall. Explor. 2001, 18, 138–141. [Google Scholar] [CrossRef]
  41. Savassi, O.N.; Alexander, D.J.; Franzidis, J.P.; Manlapig, E.V. An Empirical Model for Entrainment in Industrial Flotation Plants. Miner. Eng. 1998, 11, 243–256. [Google Scholar] [CrossRef]
  42. Kirjavainen, V.M. Review and Analysis of Factors Controlling the Mechanical Flotation of Gangue Minerals. Int. J. Miner. Process. 1996, 46, 21–34. [Google Scholar] [CrossRef]
  43. Maachar, A.; Dobby, G.S. Measurement of Feed Water Recovery and Entrainment Solids Recovery in Flotation Columns. Can. Metall. Q. 1992, 31, 167–172. [Google Scholar] [CrossRef]
  44. Lynch, A.J.; Johnson, N.W.; Manlapig, E.V.; Thorne, C.G. Mineral and Coal Flotation Circuits: Their Simulation and Control; Elsevier: Amsterdam, The Netherlands, 1981. [Google Scholar]
  45. Bu, X.; Wang, X.; Zhou, S.; Li, B.; Zhan, H.; Xie, G. Discrimination of Six Flotation Kinetic Models Used in the Conventional Flotation and Carrier Flotation of −74 Μm Coal Fines. ACS Omega 2020, 5, 13813–13821. [Google Scholar] [CrossRef]
  46. Liu, T.Y.; Schwarz, M.P. CFD-Based Modelling of Bubble-Particle Collision Efficiency with Mobile Bubble Surface in a Turbulent Environment. Int. J. Miner. Process. 2009, 90, 45–55. [Google Scholar] [CrossRef] [Green Version]
  47. Sajjad, M.; Otsuki, A. Coupling Flotation Rate Constant and Viscosity Models. Metals 2022, 12, 409. [Google Scholar] [CrossRef]
  48. Fan, G.; Wang, L.; Cao, Y.; Li, C. Collecting Agent–Mineral Interactions in the Reverse Flotation of Iron Ore: A Brief Review. Minerals 2020, 10, 681. [Google Scholar] [CrossRef]
  49. Abaka-Wood, G.B.; Addai-Mensah, J.; Skinner, W. A Study of Flotation Characteristics of Monazite, Hematite, and Quartz Using Anionic Collectors. Int. J. Miner. Process. 2017, 158, 55–62. [Google Scholar] [CrossRef]
  50. Suman, S.K.; Kumar, S. Reverse Flotation Studies on Iron Ore Slime by the Synergistic Effect of Cationic Collectors. Sep. Sci. Technol. 2020, 55, 1702–1714. [Google Scholar] [CrossRef]
  51. Wang, W.; Cong, J.; Deng, J.; Weng, X.; Lin, Y.; Huang, Y.; Peng, T. Developing Effective Separation of Feldspar and Quartz While Recycling Tailwater by HF Pretreatment. Minerals 2018, 8, 149. [Google Scholar] [CrossRef] [Green Version]
  52. Wang, B.; Xu, X.; Duan, H.; Wang, X. QSAR Study of Amine Collectors for Iron Ore Reverse Flotation. Physicochem. Probl. Miner. Process. 2019, 55, 1059–1069. [Google Scholar] [CrossRef]
  53. Nguyen, A.V. Froth Flotation. In Reference Module in Chemistry, Molecular Sciences and Chemical Engineering; Elsevier: Amsterdam, The Netherlands, 2013; ISBN 978-0-12-409547-2. [Google Scholar]
  54. Engelbrecht, J.A.; Woodburn, E.T. The Effects of Froth Height, Aeration Rate and Gas Precipitation on Flotation. J. S. Afr. Inst. Min. Metall 1975, 76, 125–132. [Google Scholar]
  55. Otsuki, A.; Barry, S.; Fornasiero, D. Rheological Studies of Nickel Oxide and Quartz/Hematite Mixture Systems. Adv. Powder Technol. 2011, 22, 471–475. [Google Scholar] [CrossRef]
  56. Sajjad, M.; Otsuki, A. Correlation between Flotation and Rheology of Fine Particle Suspensions. Metals 2022, 12, 270. [Google Scholar] [CrossRef]
  57. Michaud, D. Flotation Kinetics: Mass & Water Recovery VS Entrainment & Mineralogy. Available online: https://www.911metallurgist.com/blog/flotation-mass-water-recovery-mineralogy (accessed on 21 July 2022).
Figure 1. Influence of size fraction and solid concentration on the recovery of quartz, hematite, and water; (ad) quartz 5 vol.%, quartz 10 vol.%, hematite 2.5 vol.%, and hematite 5 vol.%, respectively.
Metals 13 00053 g001
Figure 2. Recovery by size at different times. (a) Quartz recovery, (b) hematite recovery, (c) water recovery in quartz system, (d) water recovery in hematite system. Dashed lines represent 10 vol.% and 5 vol.% solid concentrations in the quartz and hematite systems, respectively, whereas solid lines depict 5 vol.% and 2.5 vol.% concentrations in both systems.
Metals 13 00053 g002
Figure 3. (a) Zeta potential of quartz and hematite, bare and treated with DDA, redrawn from [50,51] [50,51]; (b) Recovery of quartz and hematite in DDA system as a function of pH, redrawn from [52].
Metals 13 00053 g003
Figure 4. RMSE as a result of model fitting for the different methods in all experiments. (a) Quartz flotation recovery at 5 vol.%, (b) water recovery in quartz flotation at 5 vol.%, (c) quartz flotation recovery at 10 vol.%, (d) water recovery in quartz flotation at 10 vol.%, (e) hematite flotation recovery at 2.5 vol.%, (f) water recovery in hematite flotation at 2.5 vol.%, (g) hematite flotation recovery at 5 vol.%, (h) water recovery in hematite flotation at 5 vol.%.
Metals 13 00053 g004
Figure 5. Selected examples of different models fitted to experimental data. (a) Quartz flotation recovery at 10 vol.% and −38 µm, and (b) hematite flotation recovery at 5 vol.% and −38 µm.
Metals 13 00053 g005
Figure 6. Kinetic parameters for the Gamma model. (a) Quartz systems and (b) hematite systems. Data points are only connected with lines to provide a visual aid.
Metals 13 00053 g006
Figure 7. Relationship between mineral water recovery and particles recovery. (a) Quartz system, and (b) Hematite system. Dotted lines are given for the purpose of visual aid only.
Metals 13 00053 g007
Figure 8. Illustration of fast- and slow-floating components in both the quartz and hematite systems (−38 µm fraction). (a) Quartz recovery, (b) hematite recovery, (c) water recovery from Quartz flotation, and (d) water recovery from hematite flotation.
Metals 13 00053 g008
Figure 9. Equation fitting for mineral recovery. (a) Warren model applied to quartz, (b) Warren model applied to hematite, (c) polynomial fitting applied to quartz, and (d) Polynomial fitting applied to hematite.
Metals 13 00053 g009
Table 1. Description of the flotation kinetics models tested in this study.
DesignationEquationKinetic Parameters
Classical Model [13] R = R ( 1 e k t )         (2)R and k
Kelsall Model [15] R = θ ( 1 e k s t ) + ( 1 θ ) ( 1 e k f t )      (3)θ, ks and kf
Klimpel Model [16] R = R [ 1 1 k t ( 1 e k t ) ]        (4)R and k
Gamma Model [14] R = R [ 1 1 ( 1 + k 0 t ) α ]        (5)R and k = αk0
Table 2. Entrainment methods and models selected and tested in this study.
DesignationEquation
Warren [19] R m = T m + e m . W w a t e r , (7) and
R g = e g . W w a t e r  (8),
Maachar and Dobby [43] R e = R w . ( e 0.0325 Δ ρ ) . ( e 0.063 d i )       (9)
Ross [41] E N T = P C w W C p        (10)
Rahal et al. [40] R e = a R w b         (11)
Ross and Van Deventer [20] E N T = 1     0.429 [ l o g ( d i )     1 ] . [ ρ 1 ]       (12)
Table 3. Summary of linear correlation between water recovery and particle recovery. Rw, Rq, and Rh are the respective recoveries of water, quartz, and hematite.
SystemSolid Conc. (vol.%)Size (µm)R2y = mx + b
Quartz5+150–3000.9183Rw = 0.6314 Rq − 47.534
+75–1500.8662Rw = 0.842 Rq − 67.828
+38–750.9219Rw = 1.0437 Rq − 85.198
−380.9036Rw = 1.1696 Rq − 94.71
10+150–3000.9711Rw = 0.2792 Rq − 3.9576
+75–1500.9833Rw = 0.4059 Rq − 13.157
+38–750.9286Rw = 0.501 Rq − 21.845
−380.9448Rw = 0.547 Rq − 25.049
Hematite2.5+150–3000.9868Rw = 2.4663 Rh − 154.82
+75–1500.9059Rw = 3.5921 Rh − 246.32
+38–750.9361Rw = 0.9065 Rh − 35.401
−380.9557Rw = 1.6056 Rh − 105.36
5+150–3000.9867Rw = 2.7244 Rh − 118.55
+75–1500.9751Rw = 4.3682 Rh − 263.67
+38–750.8808Rw = 2.631 Rh − 160.07
−380.9779Rw = 1.7583 Rh − 109.48
Table 4. Linear and polynomial fitting of entrainment.
SystemSizeDensityWarren MethodFitted Method
Linear EquationR2Polynomial EquationR2
Quartz−385y = 0.035x + 82.20.9036y = −0.0001x2 + 0.1048x + 72.9160.9903
10y = 0.08x + 48.20.9448y = −0.0002x2 + 0.2662x + 6.18670.9998
+38–755y = 0.04x + 82.60.9219y = −0.0001x2 + 0.1139x + 74.2940.9973
10y = 0.0848x + 47.00.9286y = −0.0003x2 + 0.348x − 16.6810.9541
Hematite−382.5y = 0.0279x + 66.80.9557y = −5 × 10−5x2 + 0.1221x + 25.9670.9989
5y = 0.0256x + 62.80.9779y = −1 × 10−7x3 + 0.0004x2 − 0.36x + 1800.9965
+38–752.5y = 0.0471x + 42.00.9361y = −0.0001x2 + 0.2998x − 68.7550.9998
5y = 0.0159x + 62.70.8808y = −4 × 10−7x3 + 0.001x2 − 0.79x + 2840.9889
Table 5. Numerical values of the tested entrainment methods/models.
Method/ModelSystemSolid Conc. (vol.%)Degree of EntrainmentRecovery by Entrainment (%)Recovery by True Flotation (%)
−38 µm+38–75 µm−38 µm+38–75 µm−38 µm+38–75 µm
WarrenQz50.0350.04016.9016.7282.2182.61
100.0800.08553.9351.4648.2547.04
Hm2.50.0280.04730.3748.9866.8342.02
50.0260.01532.2717.5062.8562.77
Maachar and DobbyQz5--6.0900.585--
10--8.6890.859--
Hm2.5--13.091.468--
5--14.881.621--
RossQz50.2200.043----
100.3120.331----
Hm2.50.0090.012----
50.0130.007----
Rahal et al.Qz5--15.508.363--
10--25.5915.810--
Hm2.5--29.5626.91--
5--34.7931.54--
Ross and Van DeventerQz50.7950.487----
100.7950.487----
Hm2.50.479−0.305----
50.479−0.305----
Disclaimer/Publisher’s Note: The statements, opinions and data contained in all publications are solely those of the individual author(s) and contributor(s) and not of MDPI and/or the editor(s). MDPI and/or the editor(s) disclaim responsibility for any injury to people or property resulting from any ideas, methods, instructions or products referred to in the content.

