
Investigations on the Wear Performance of Coated Tools in Machining UNS S32101 Duplex Stainless Steel

 , , and
Abstract
:1. Introduction
2. Materials and Methods
2.1. Materials
2.1.1. Employed Tools
2.1.2. Machined Material
2.2. Methods
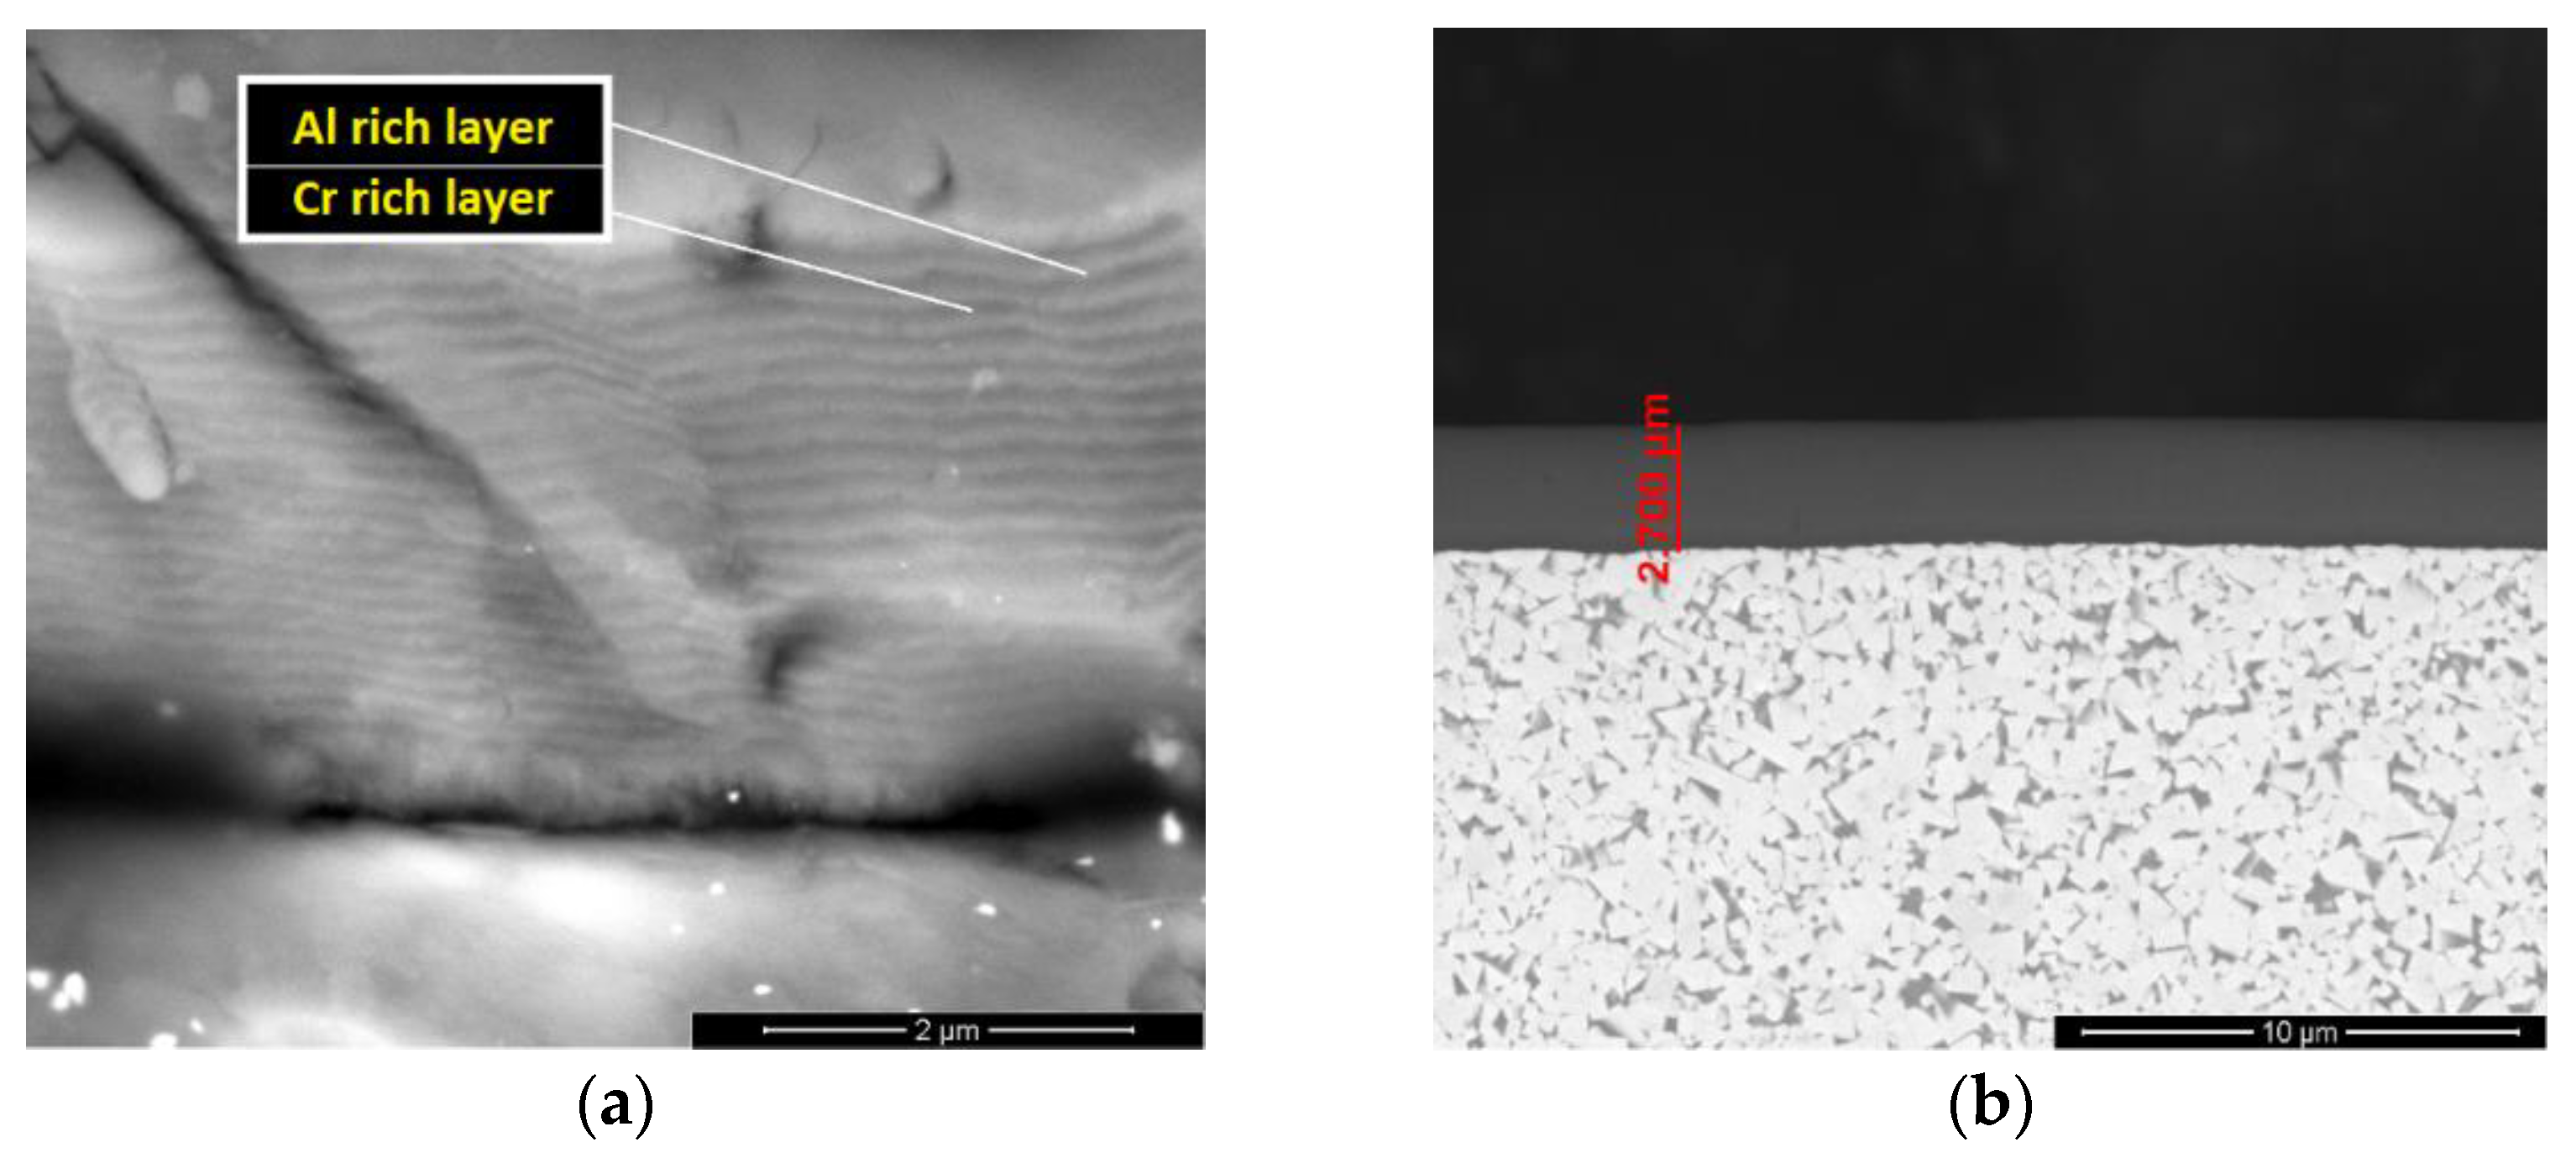
2.2.1. Coatings’ Thickness Analysis
2.2.2. Machining Tests
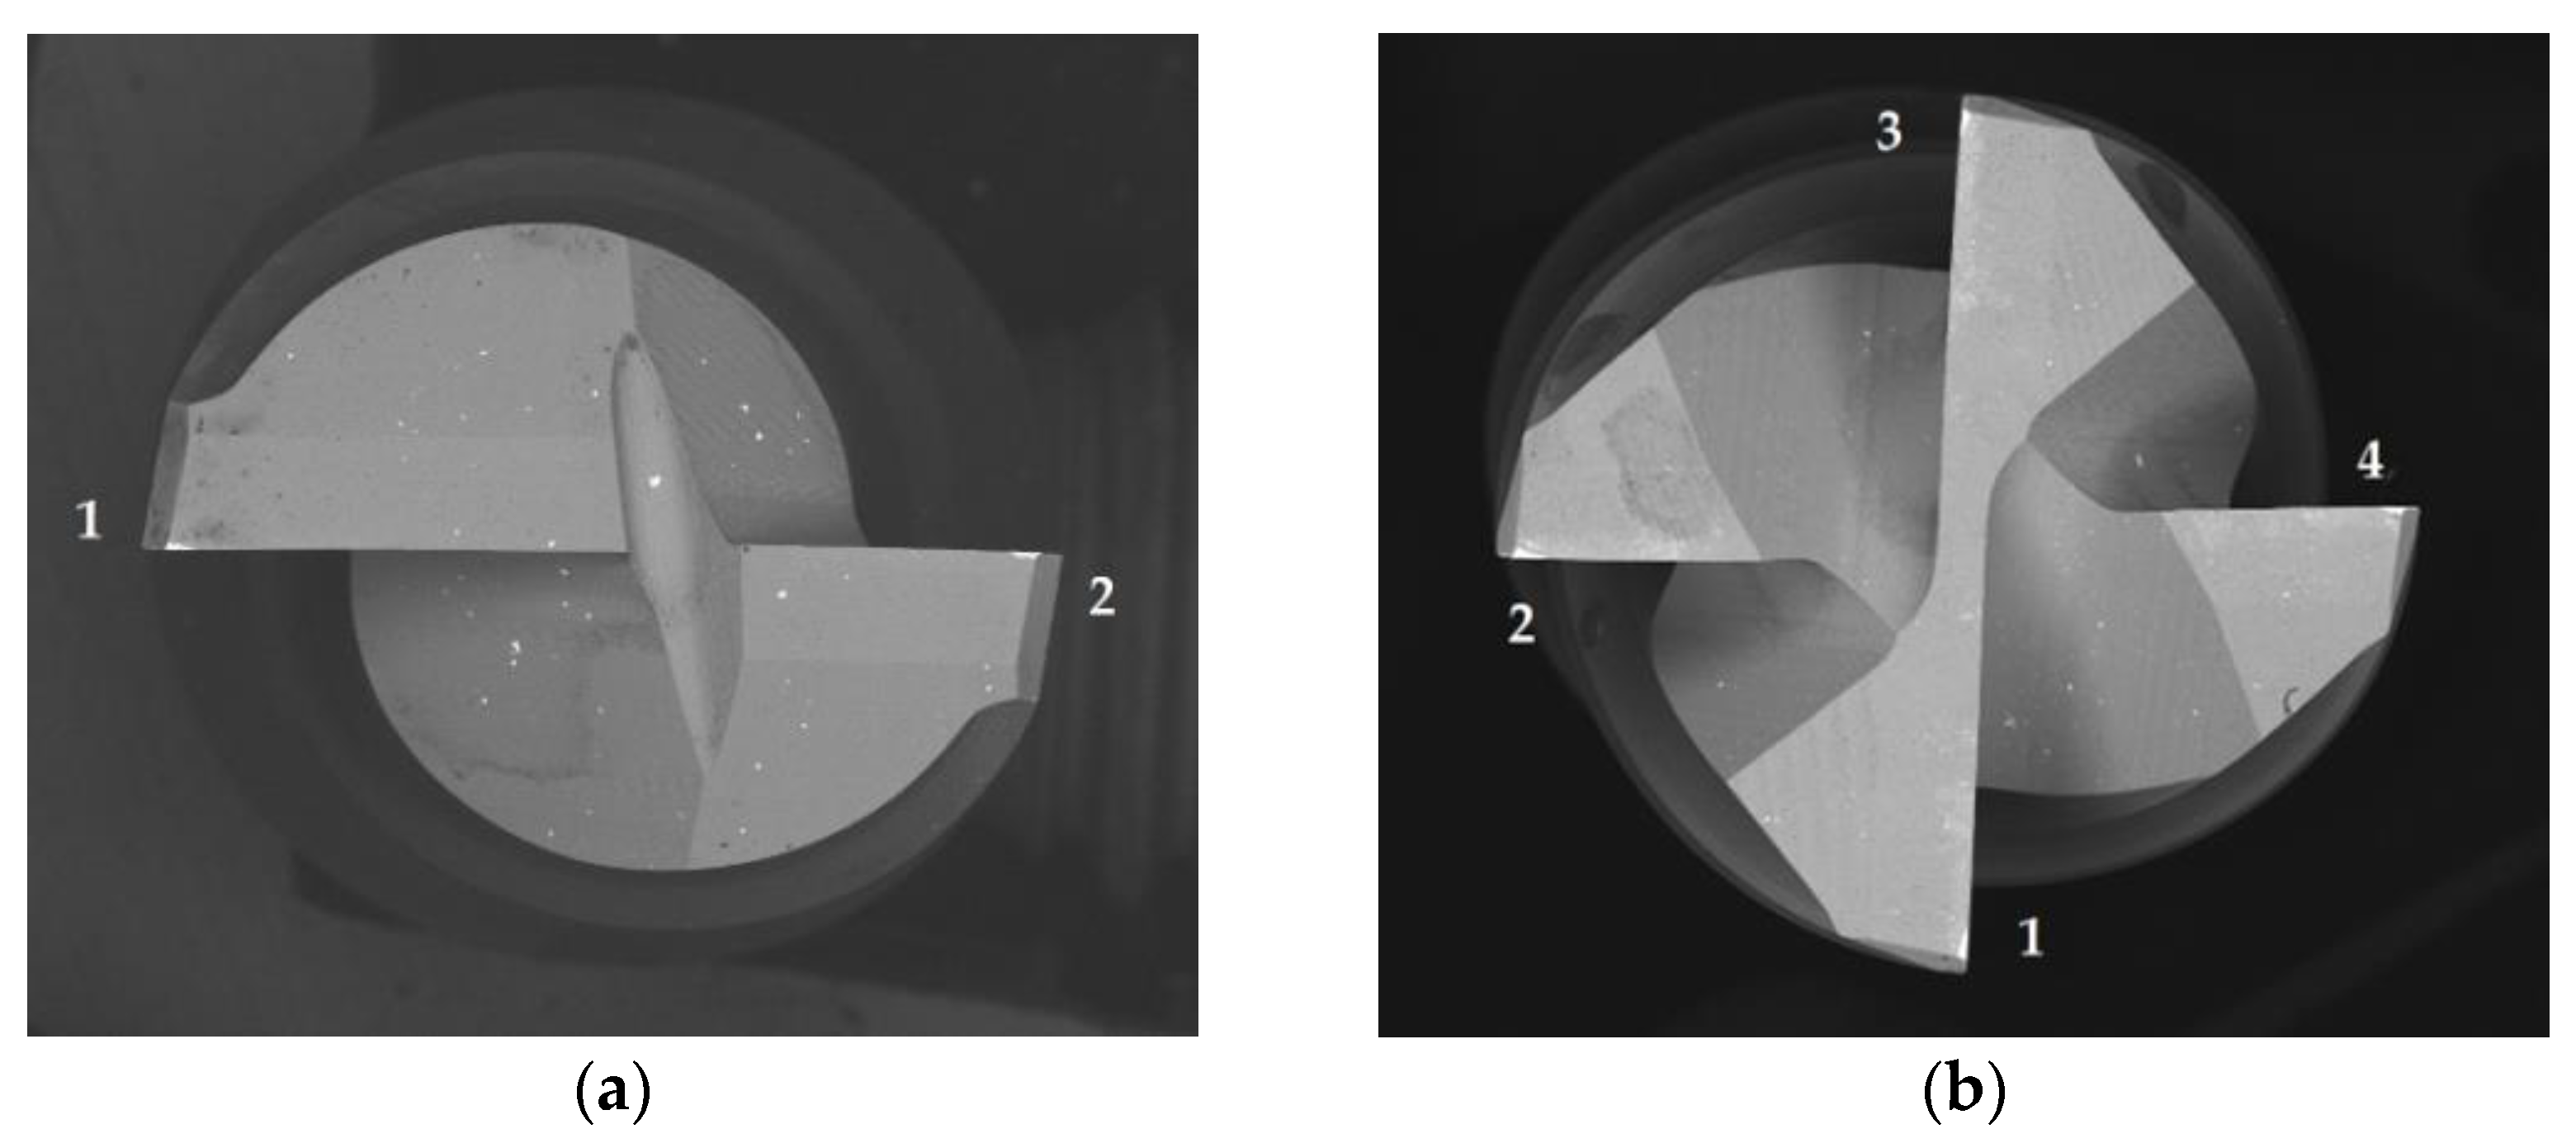
Machining Strategy
Cutting Force Analysis
Machining Test Parameters
2.2.3. Surface Roughness Test
2.2.4. Tool Wear Analysis
3. Results and Discussion
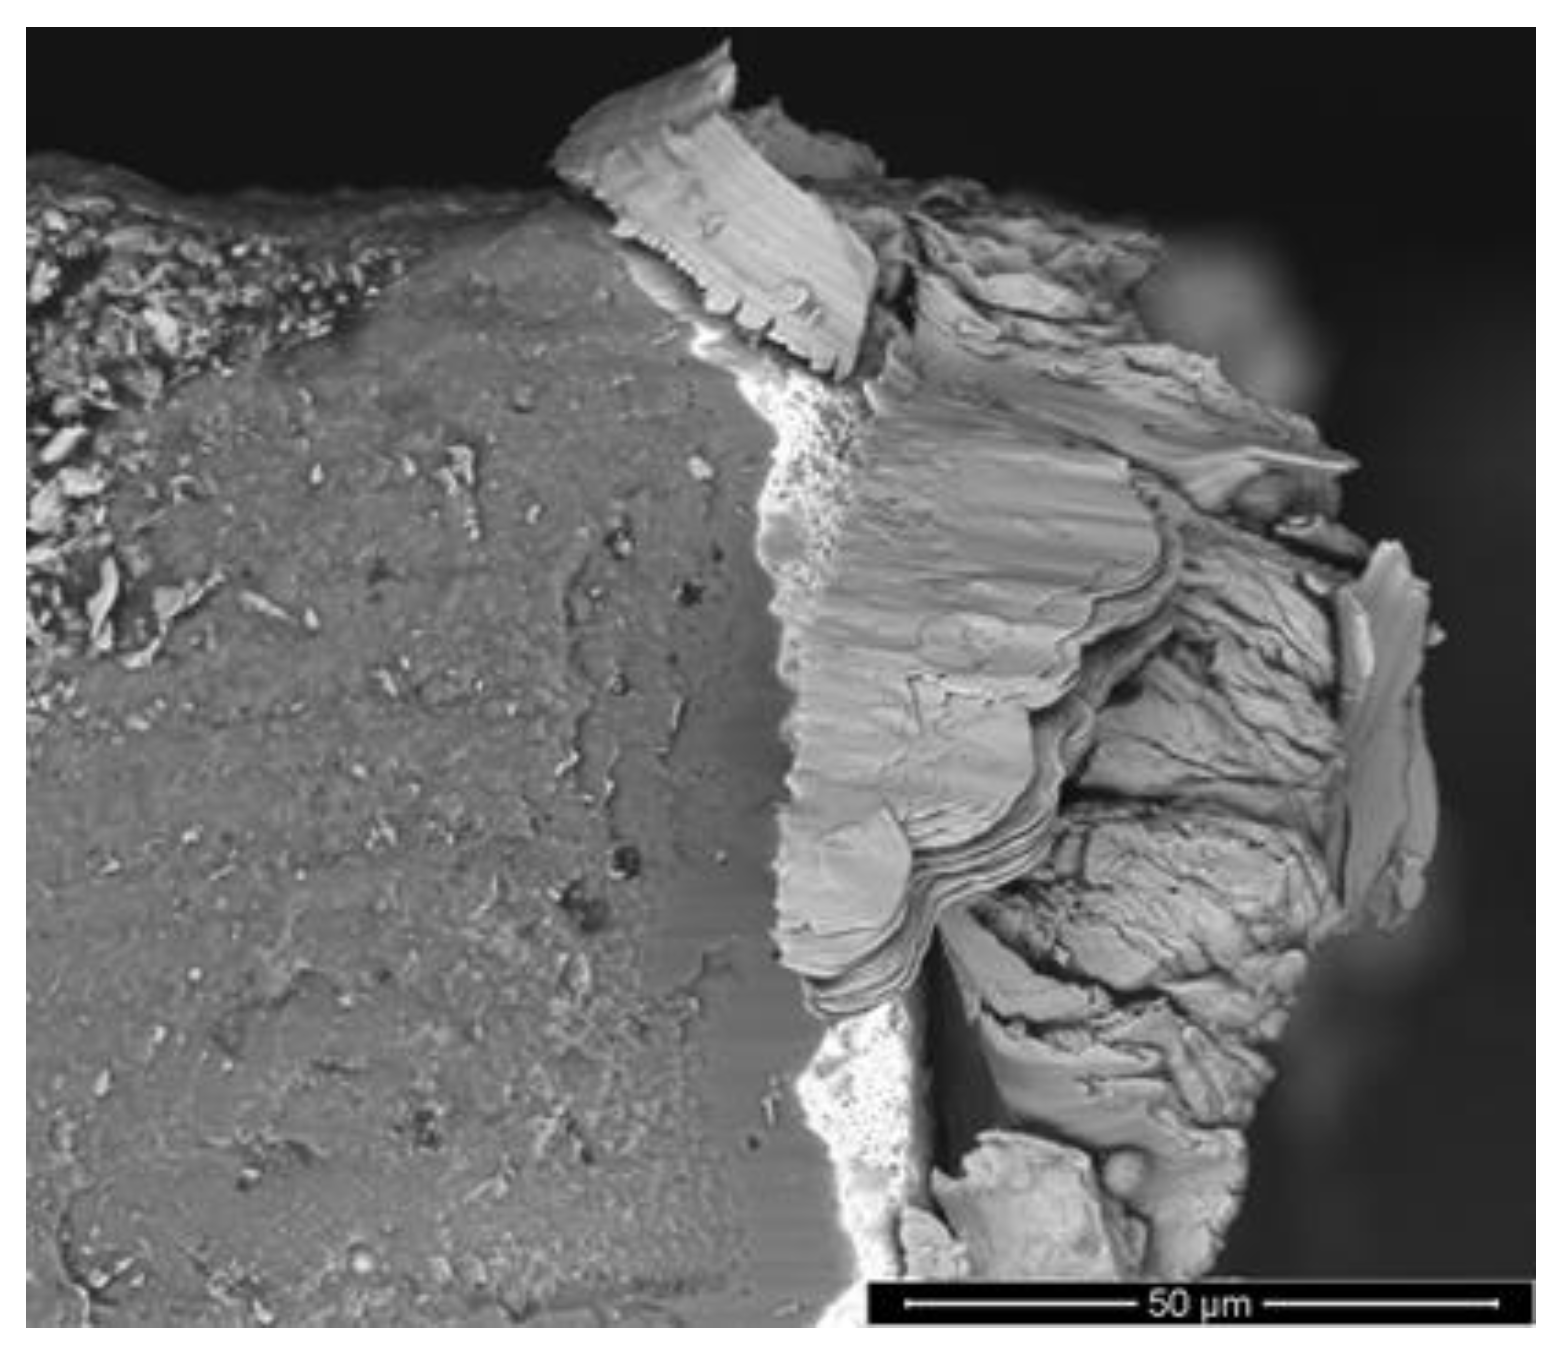
3.1. Coatings’ Characterization
3.2. Cutting Force Analysis
3.3. Surface Roughness Analysis
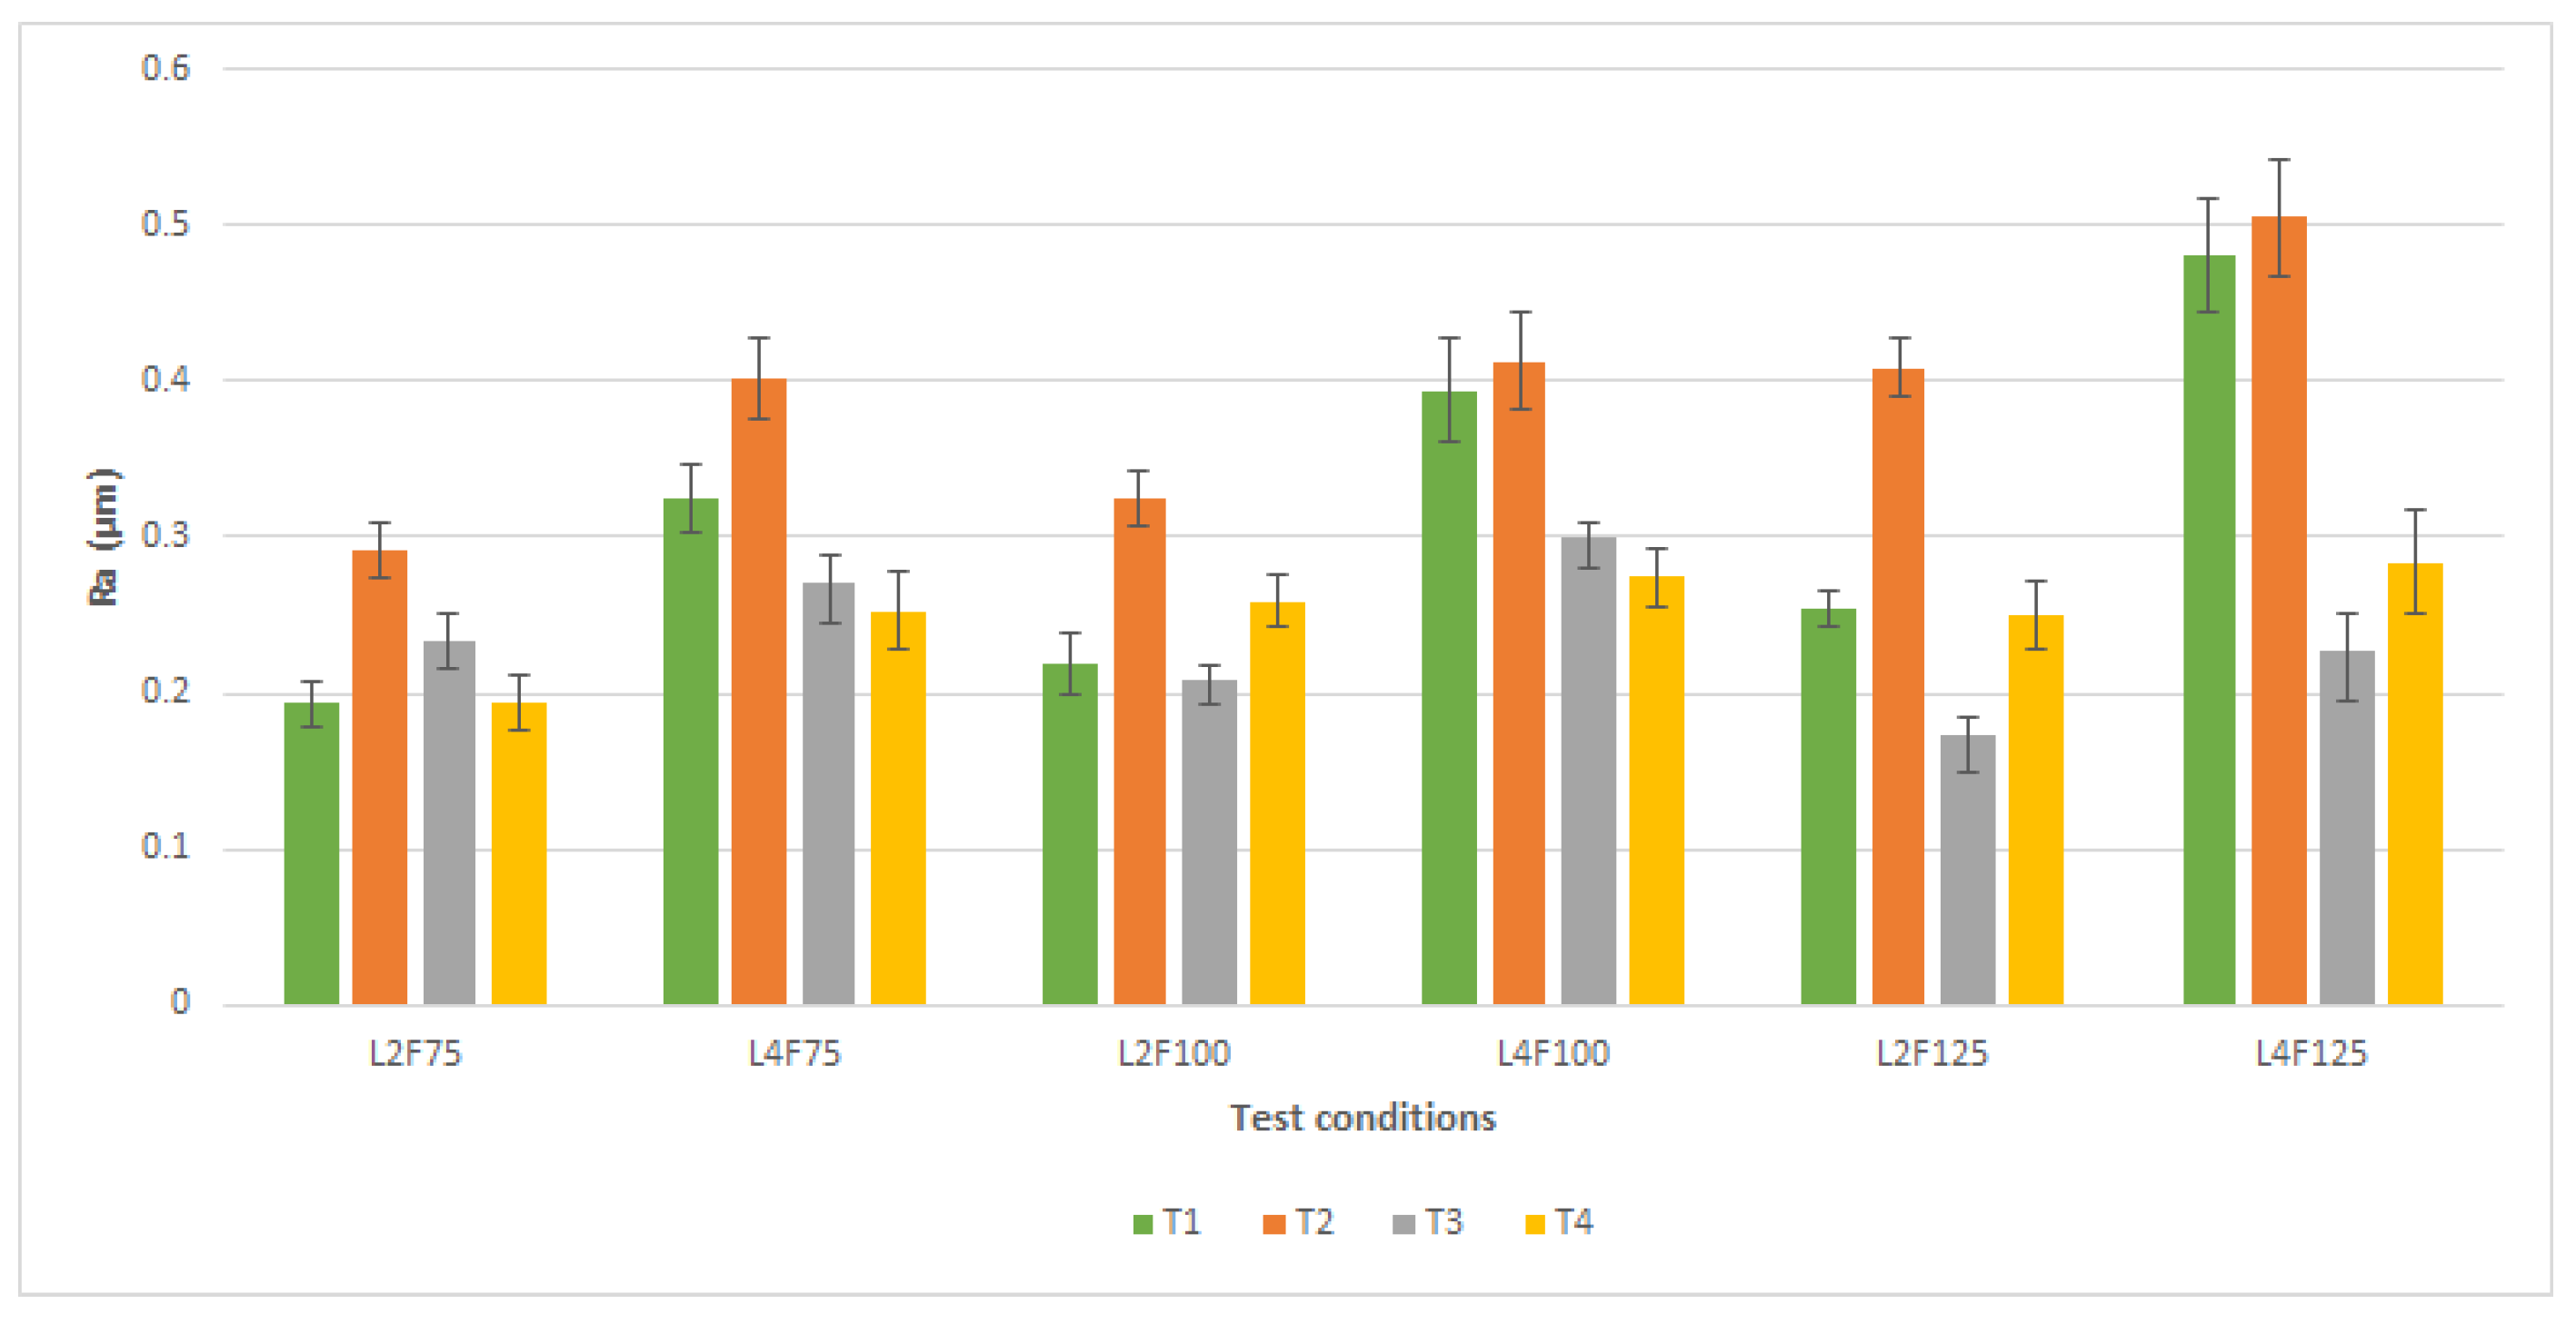
3.3.1. T1—Produced Surface Roughness
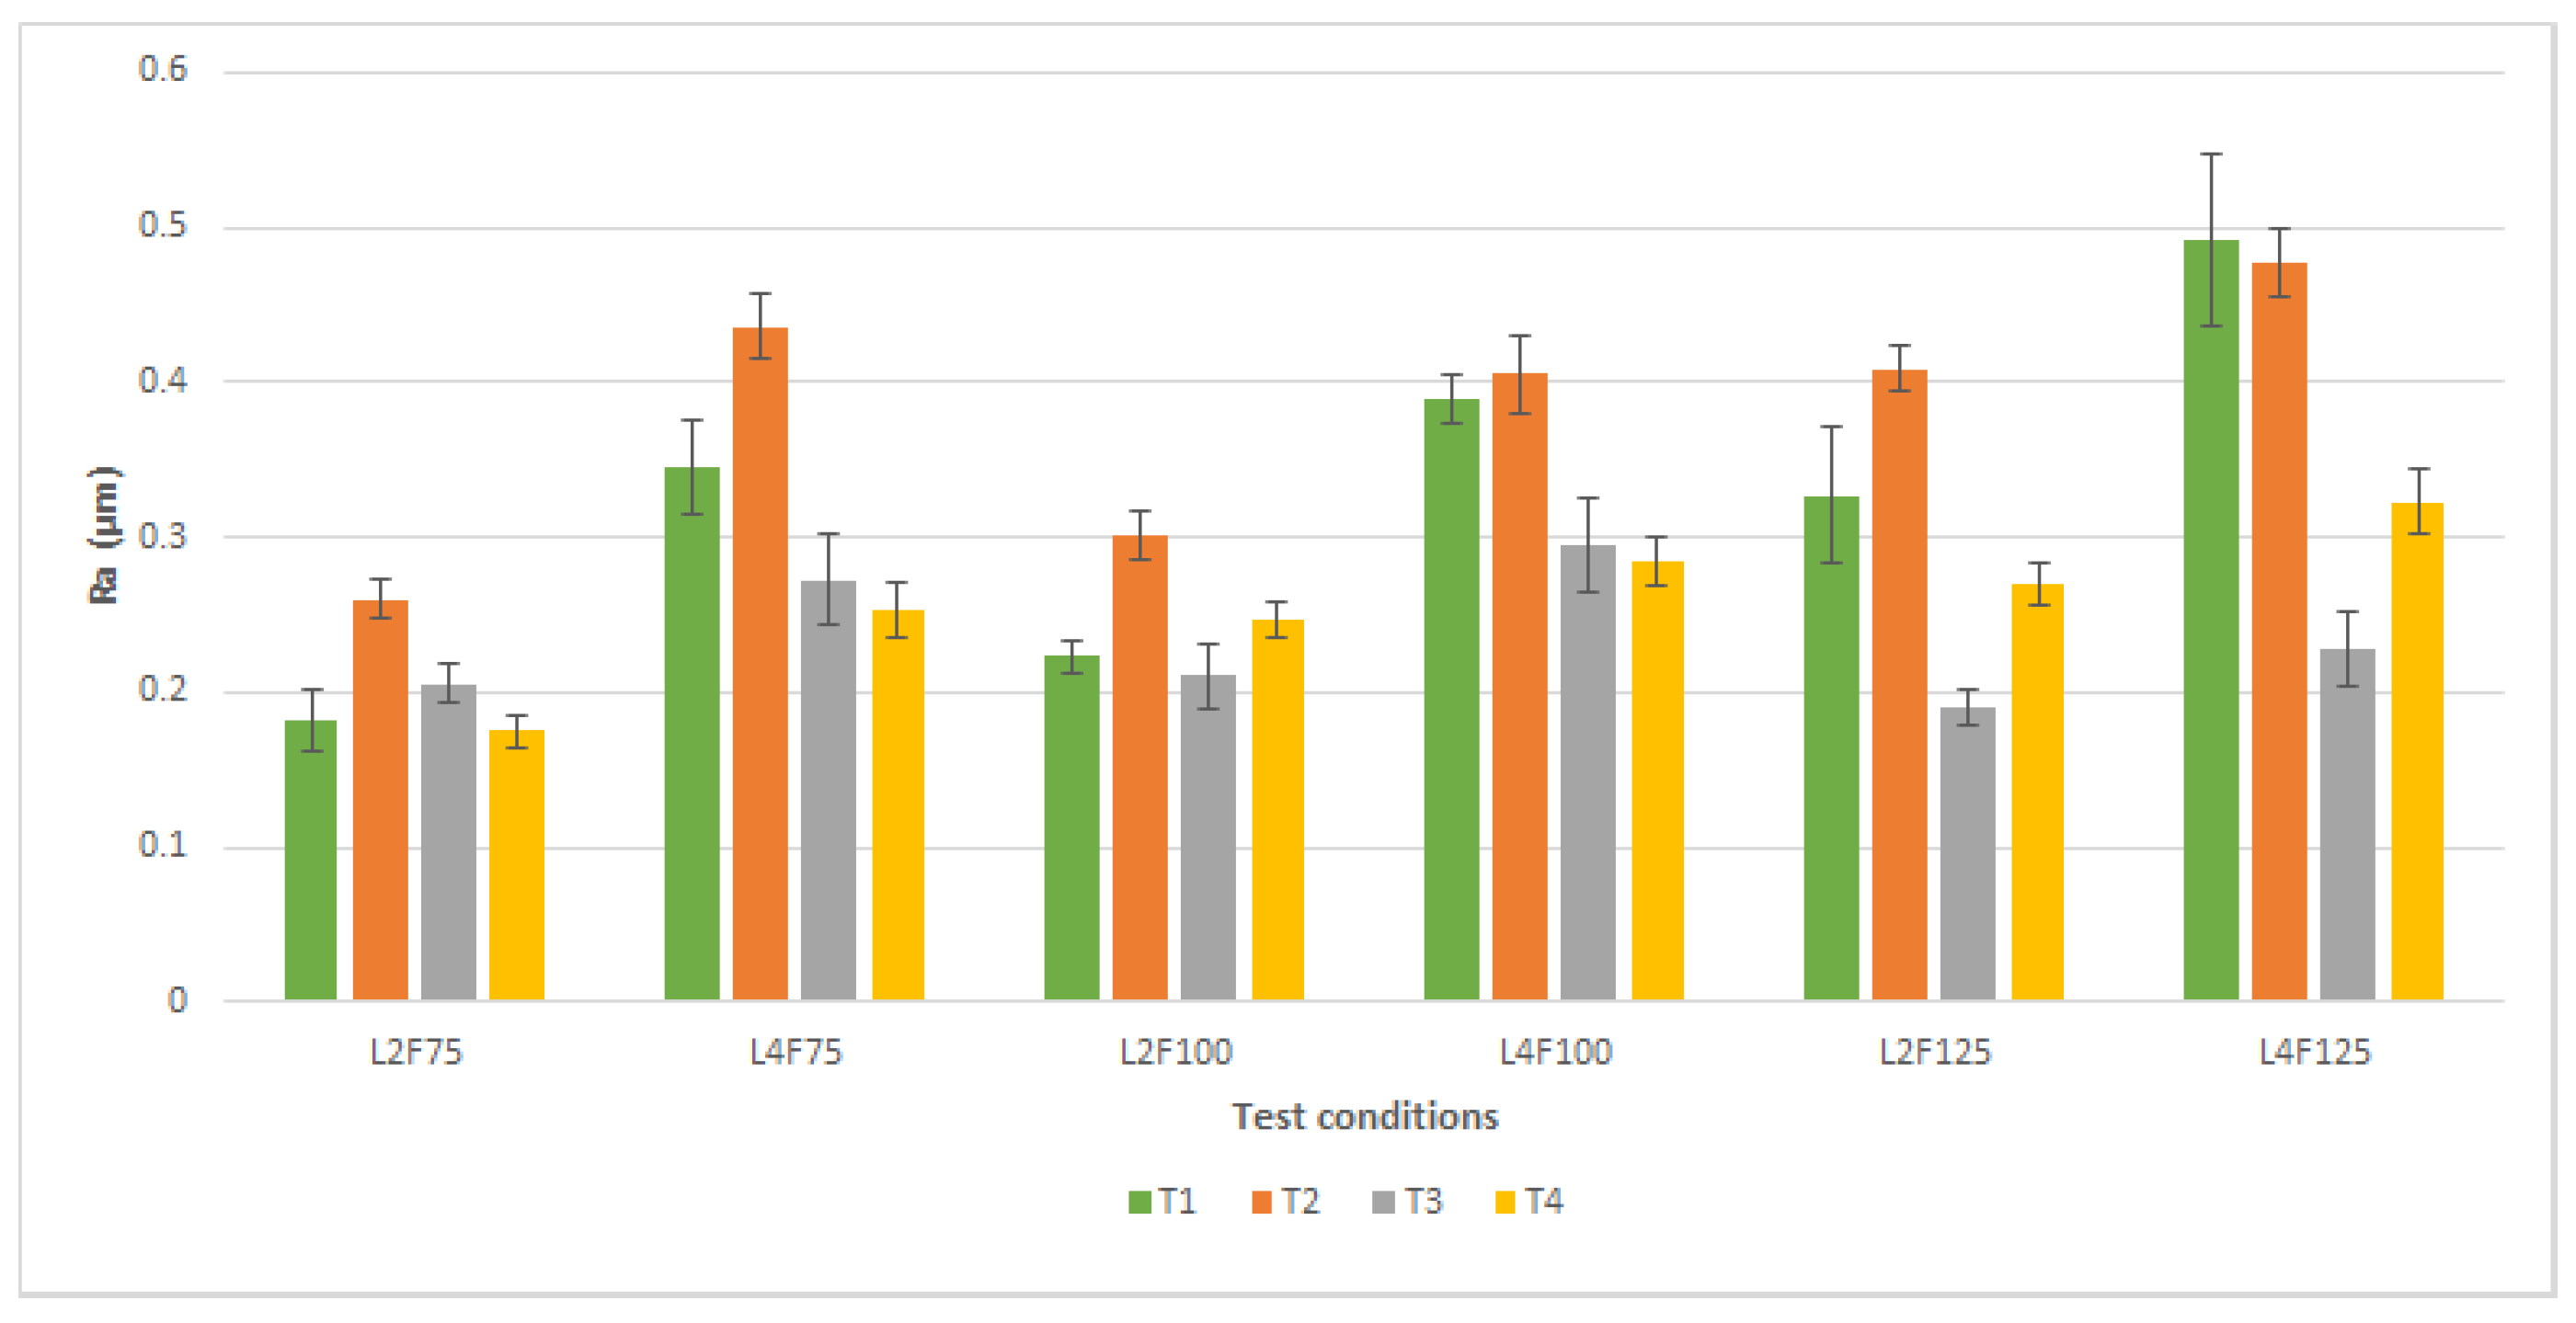
3.3.2. T2—Produced Surface Roughness
3.3.3. T3—Produced Surface Roughness
3.3.4. T4—Produced Surface Roughness
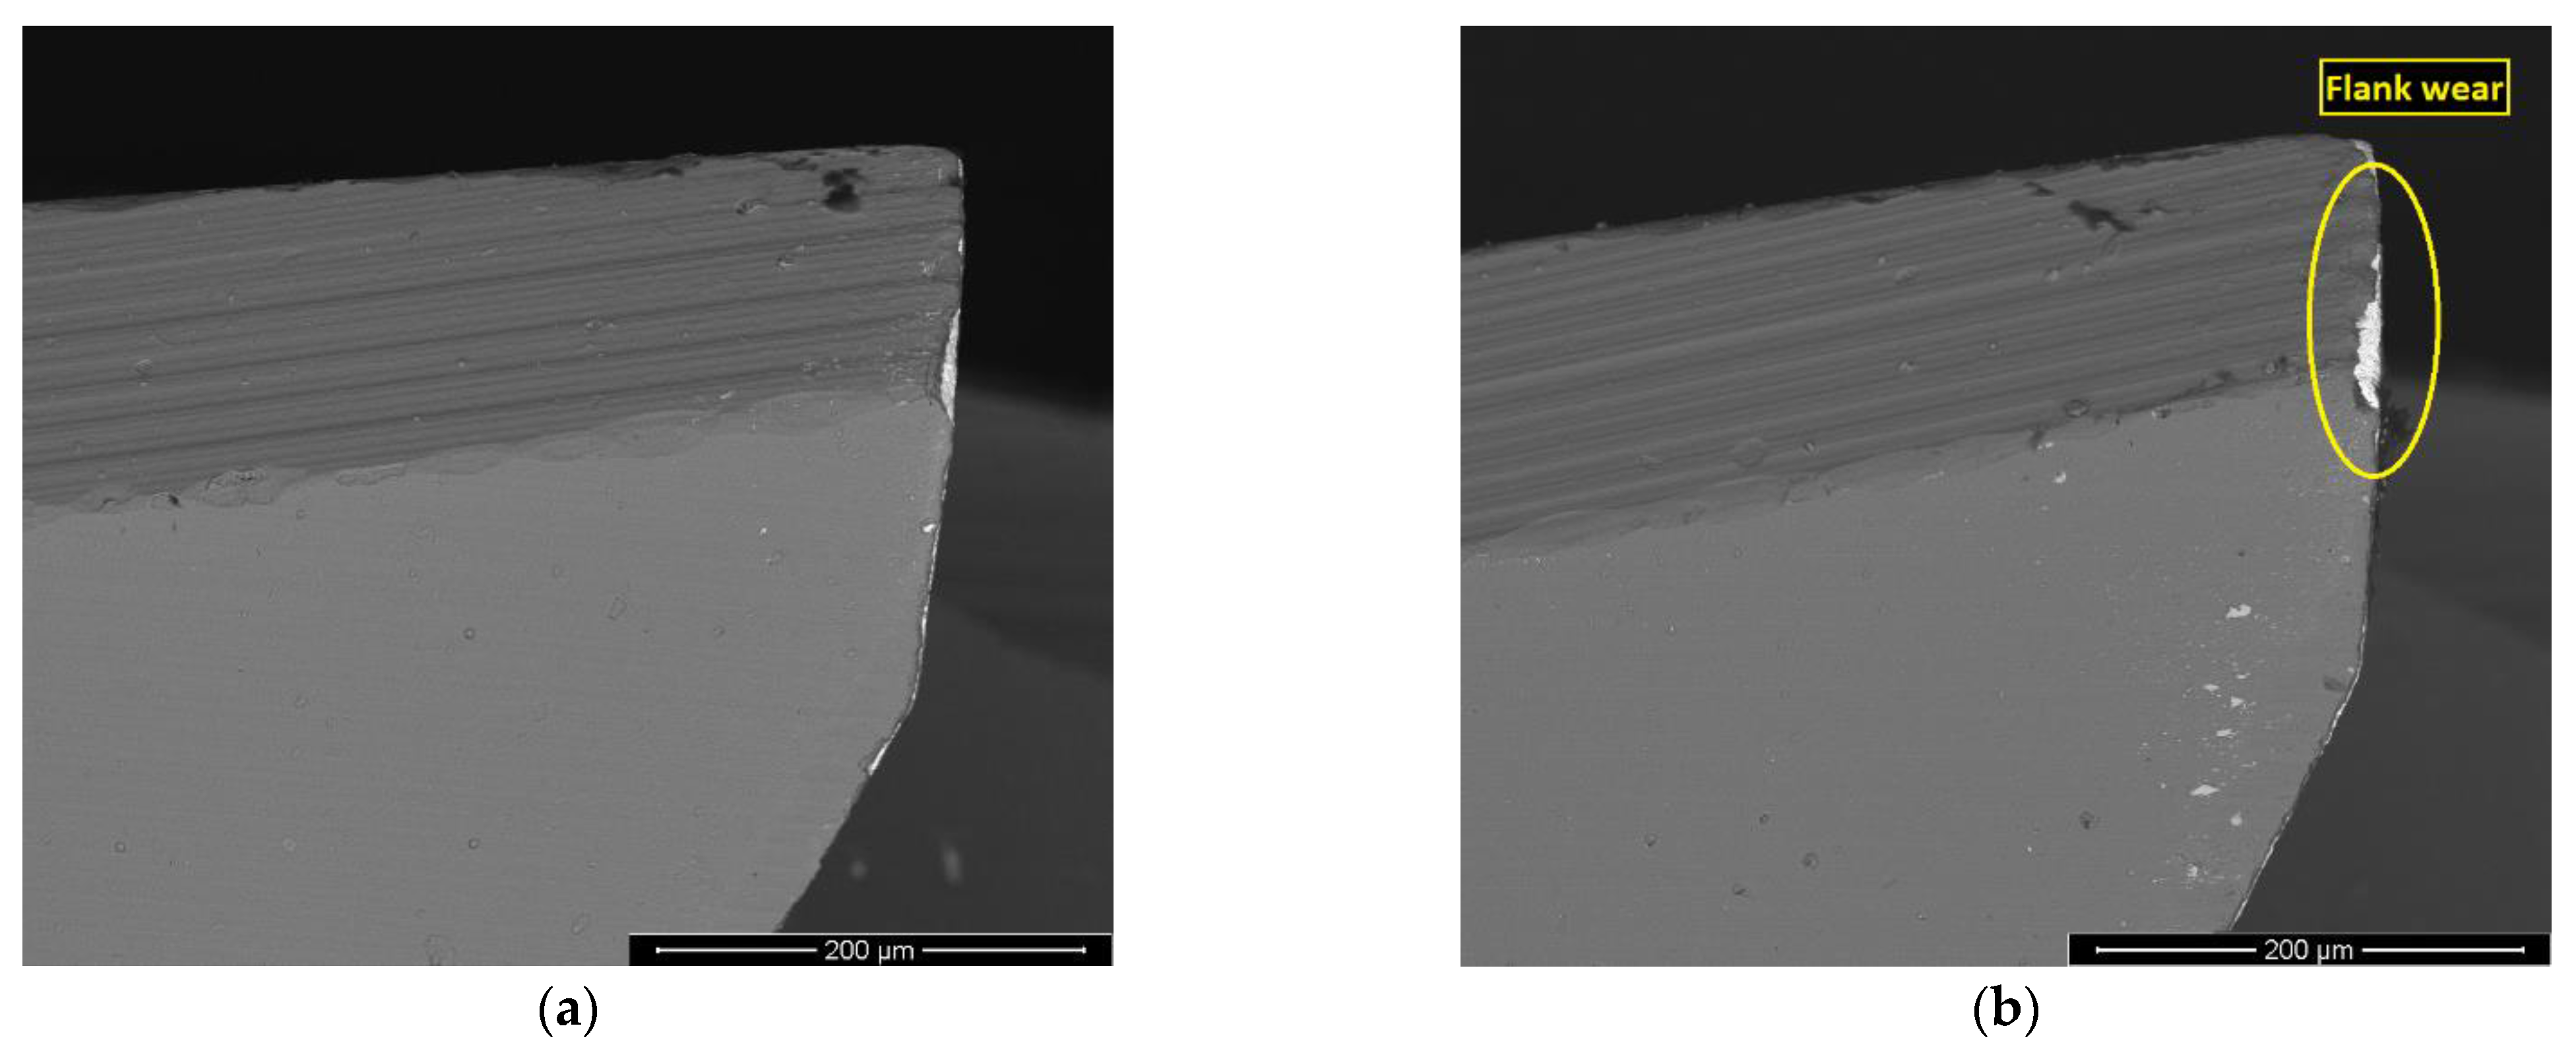
3.4. Flank Wear Measurements
3.4.1. T1—Flank Wear Measurement
3.4.2. T2—Flank Wear Measurement
3.4.3. T3—Flank Wear Measurement
3.4.4. T4—Flank Wear Measurement
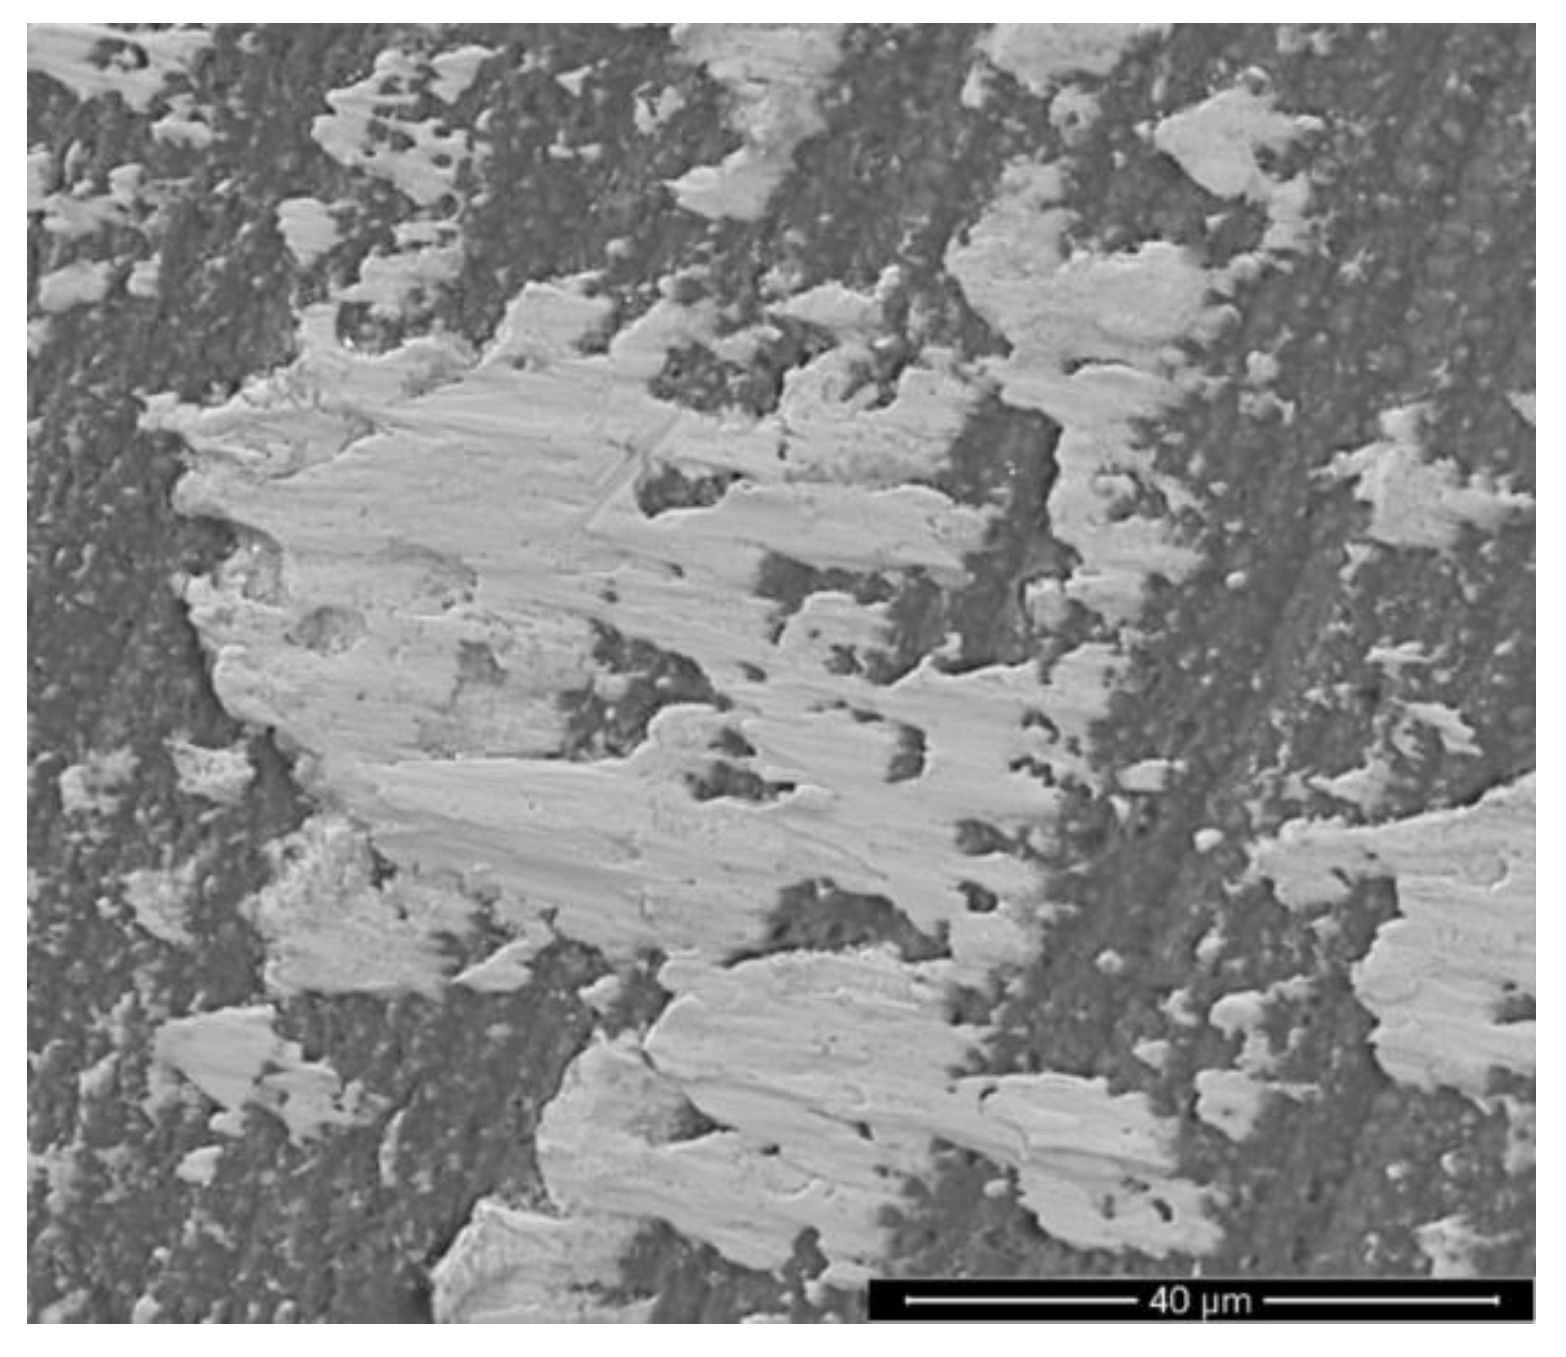
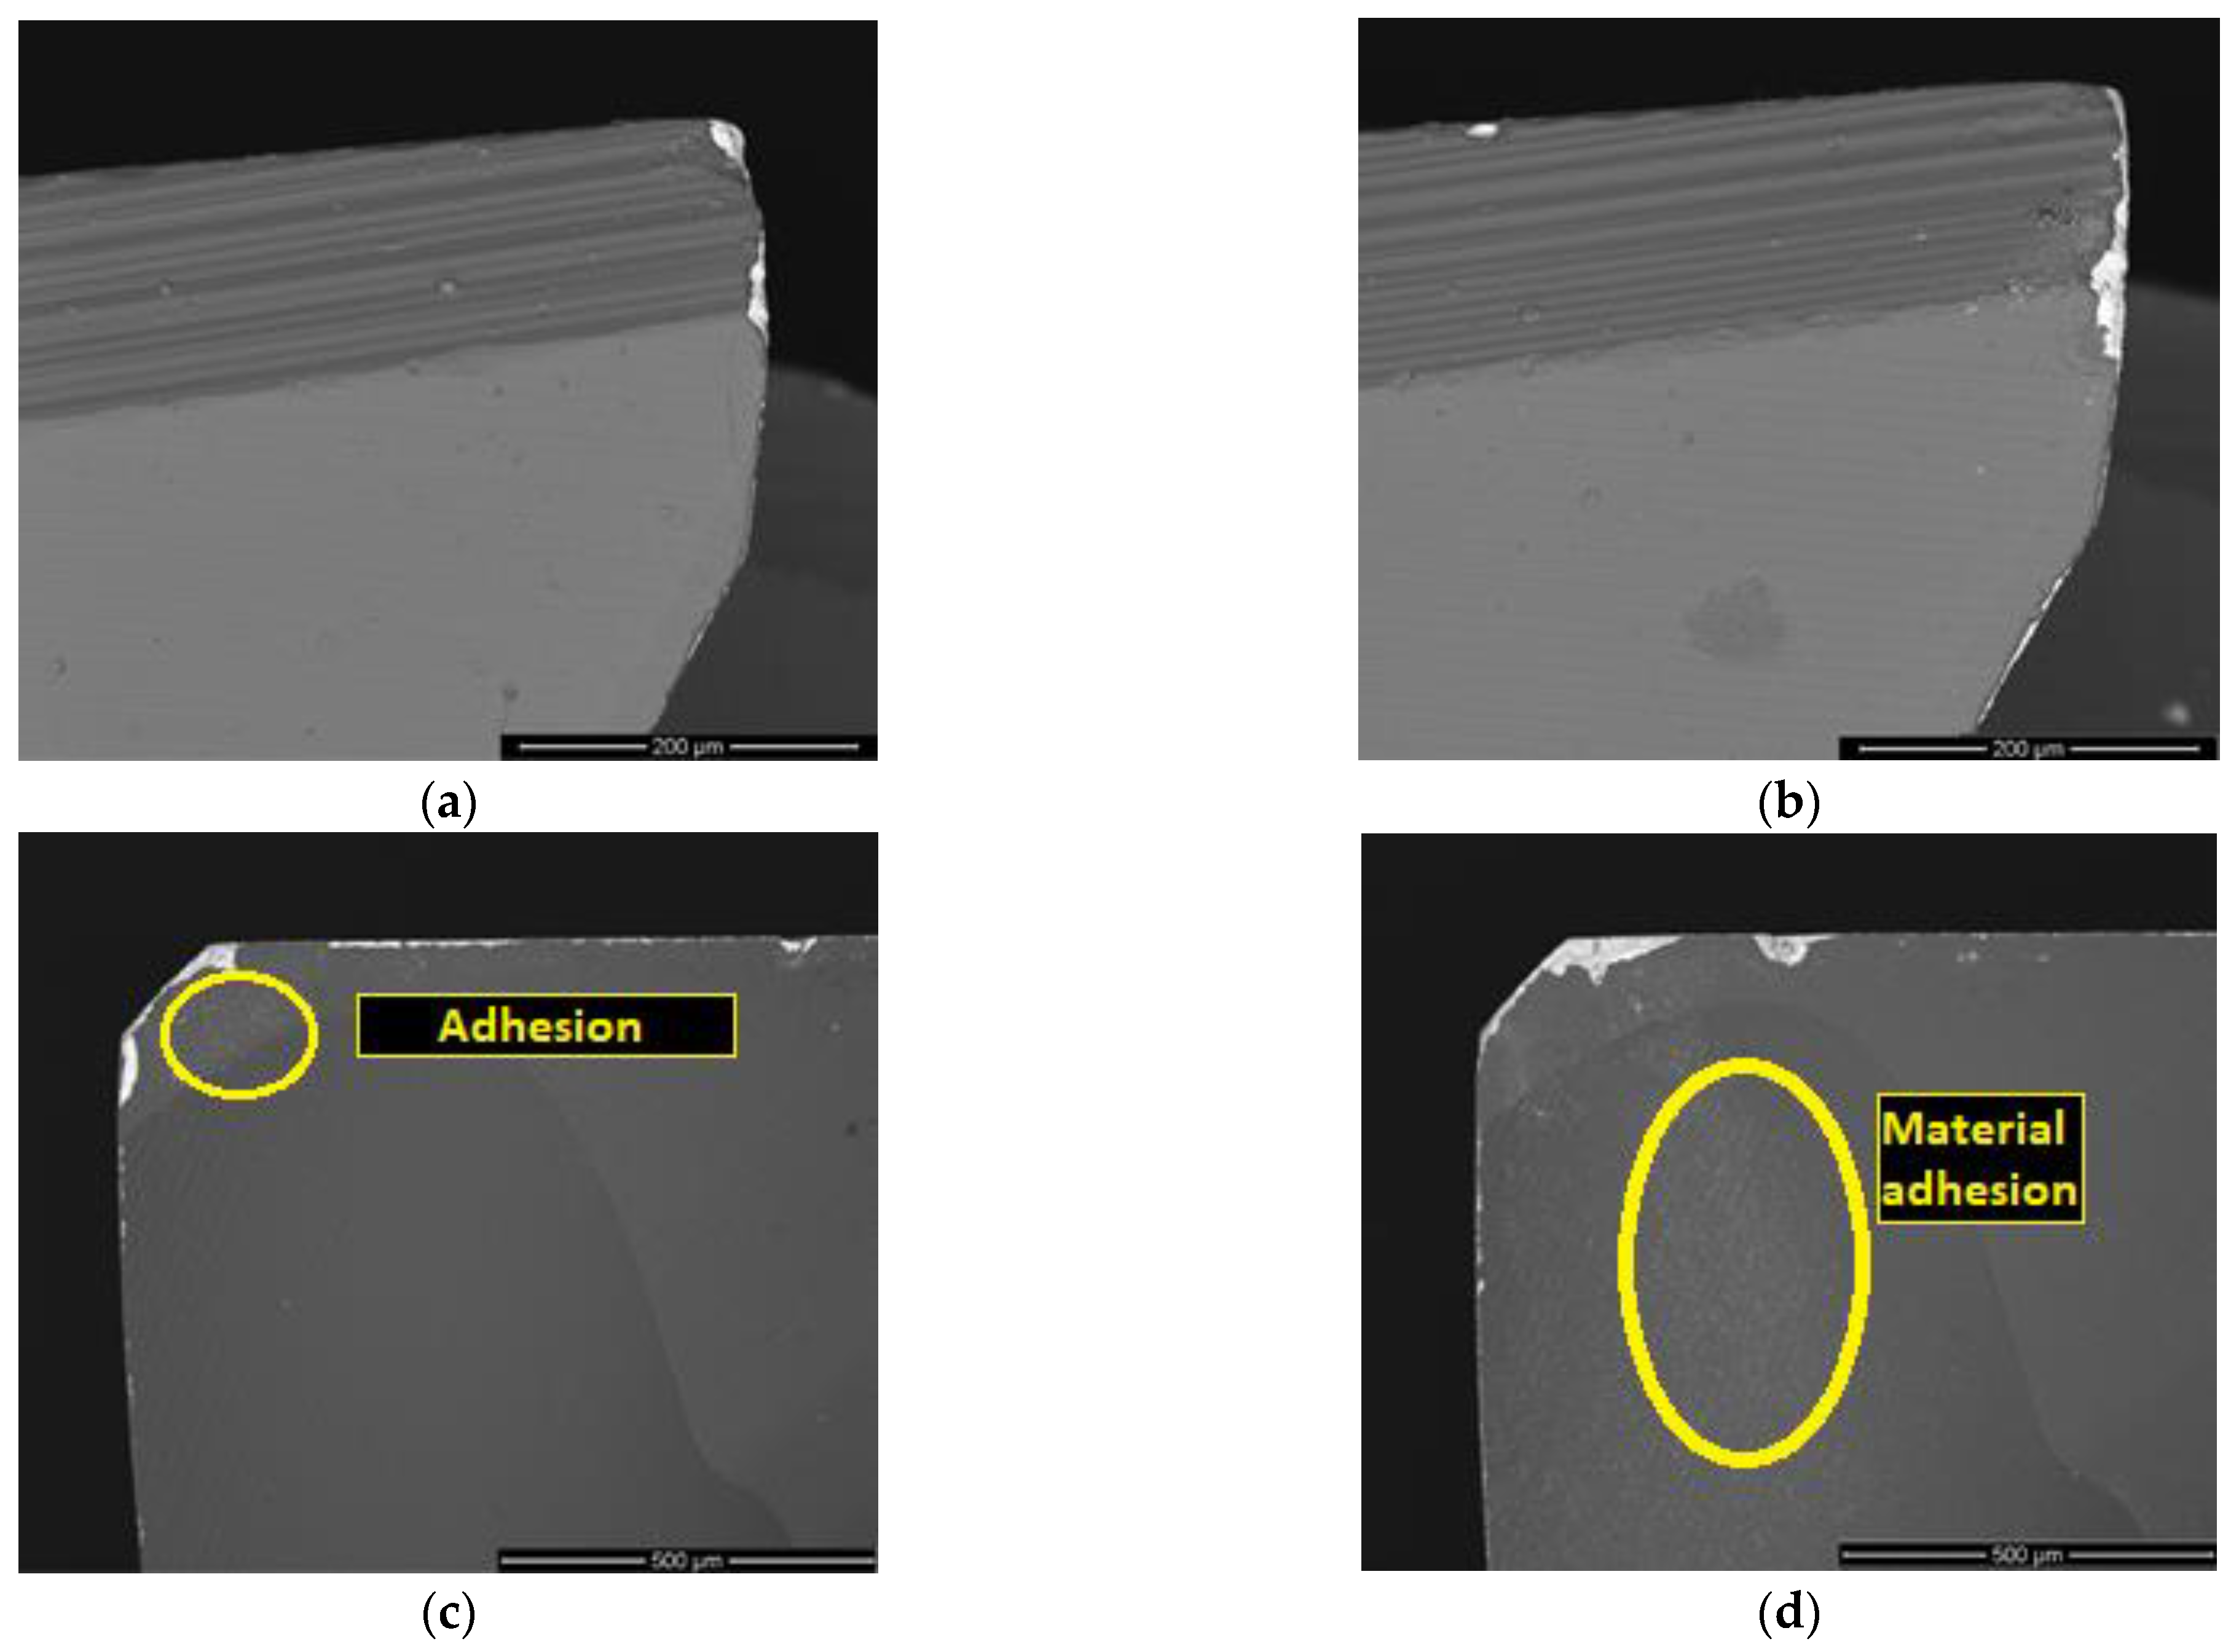
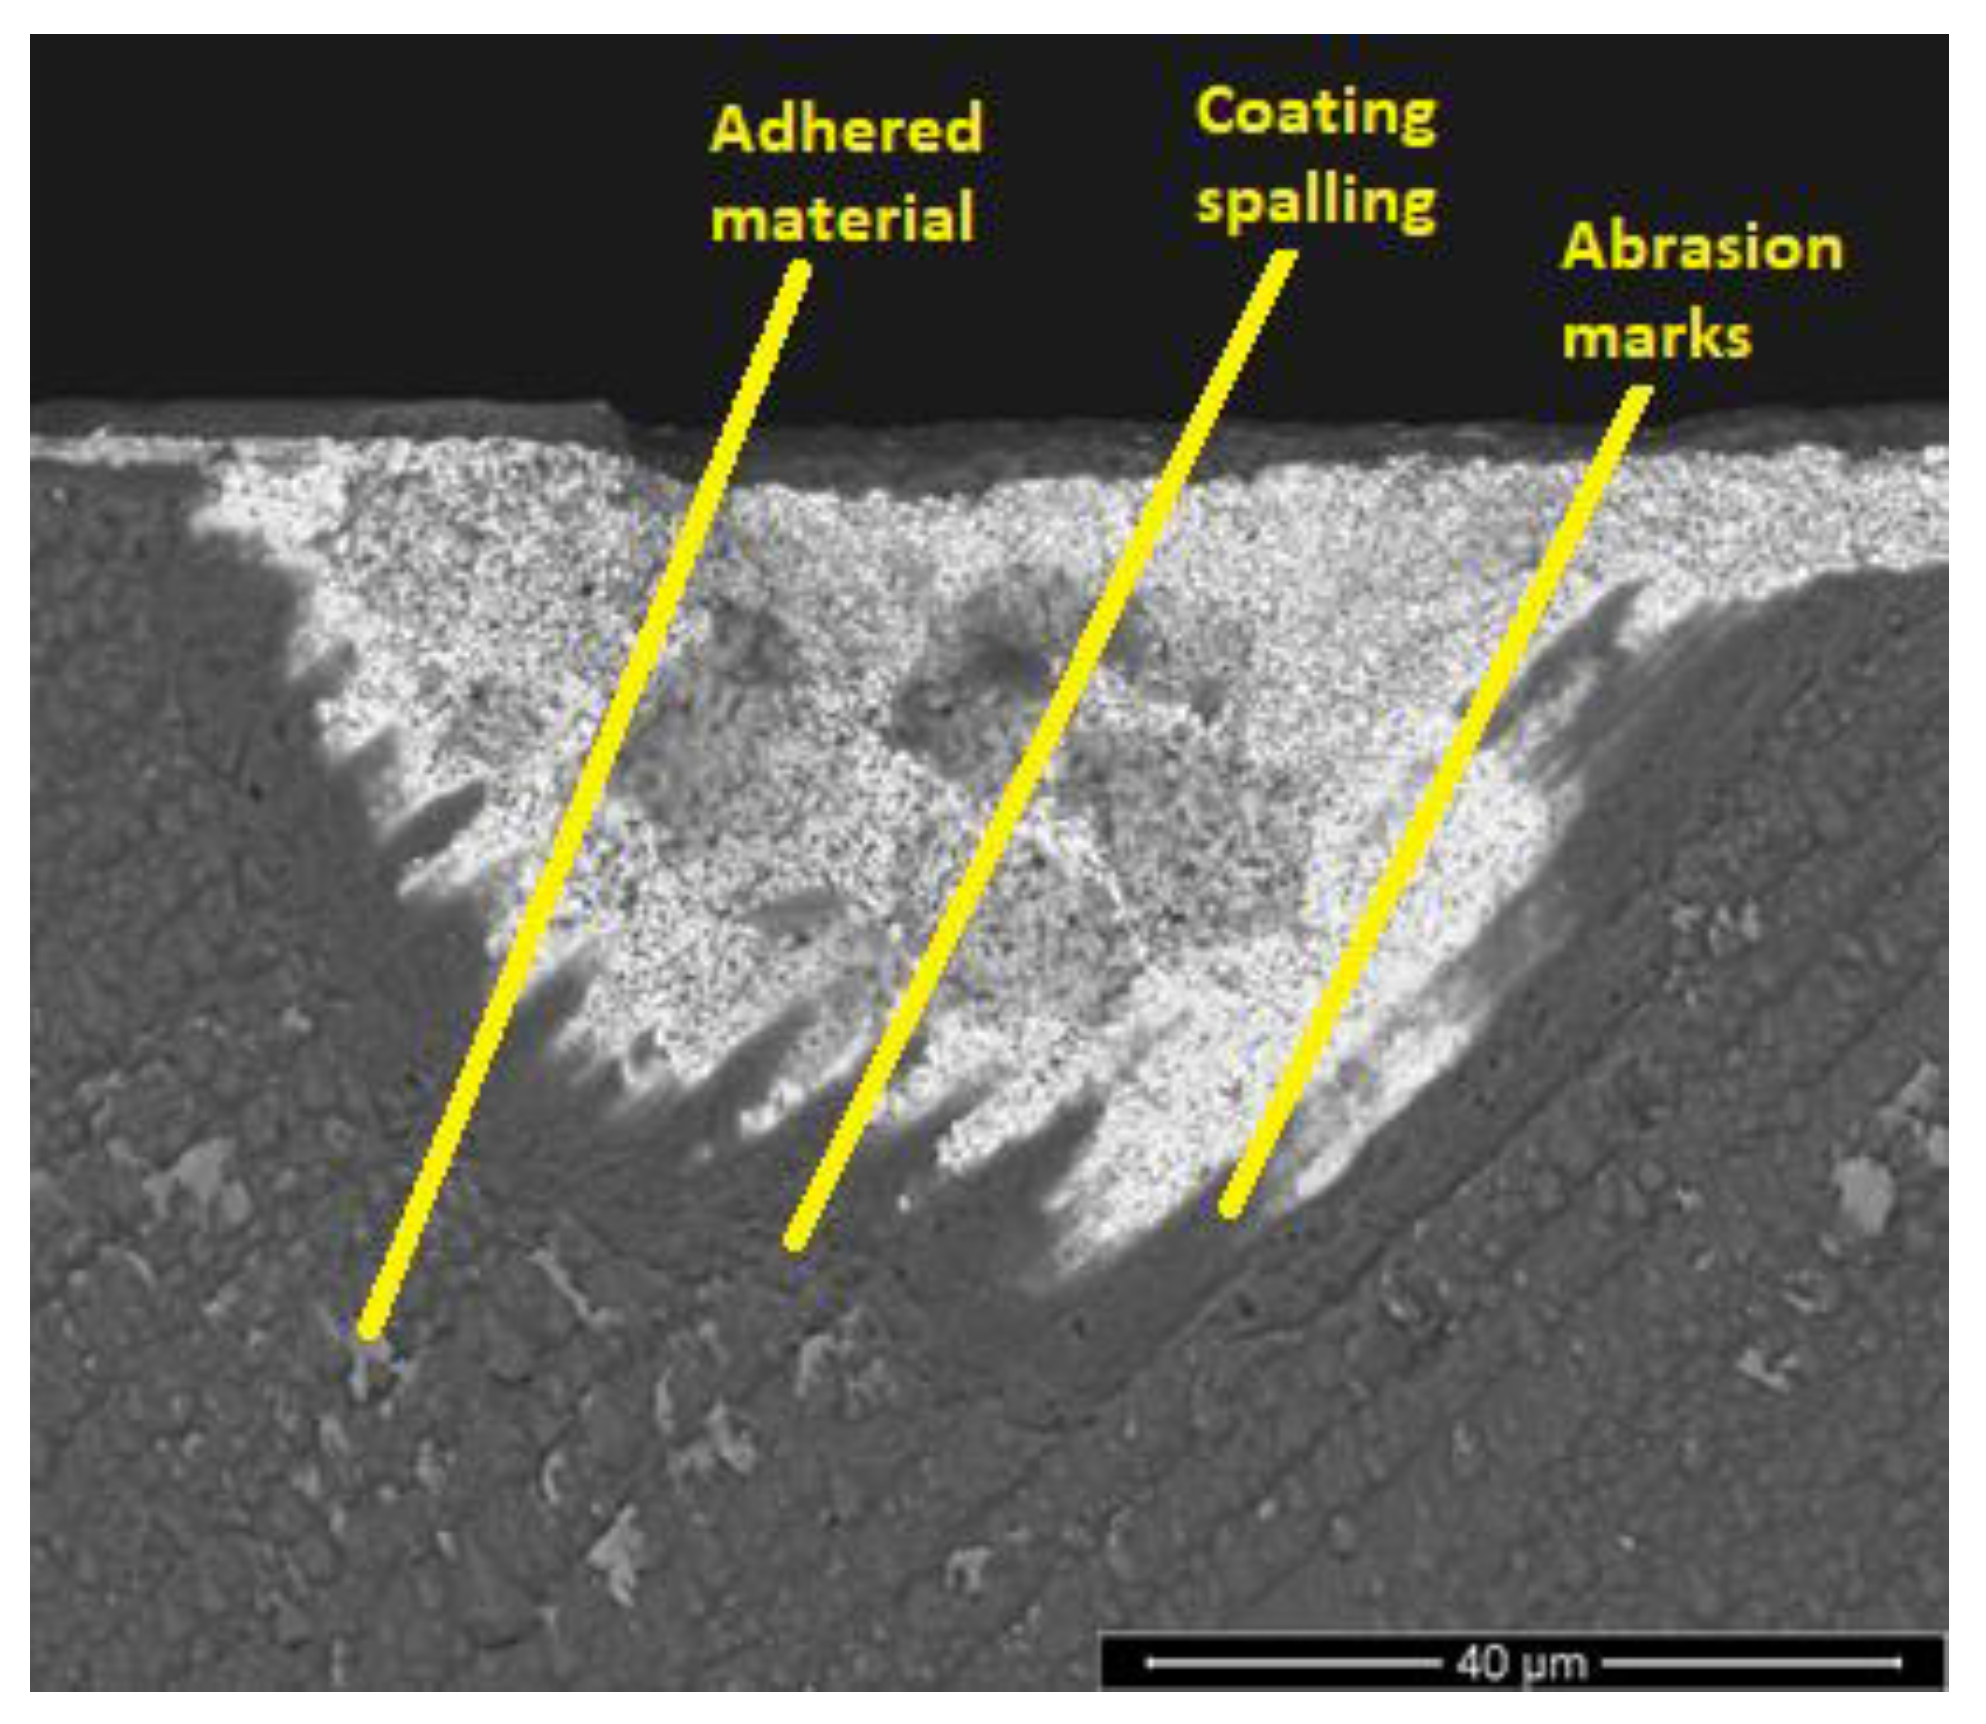
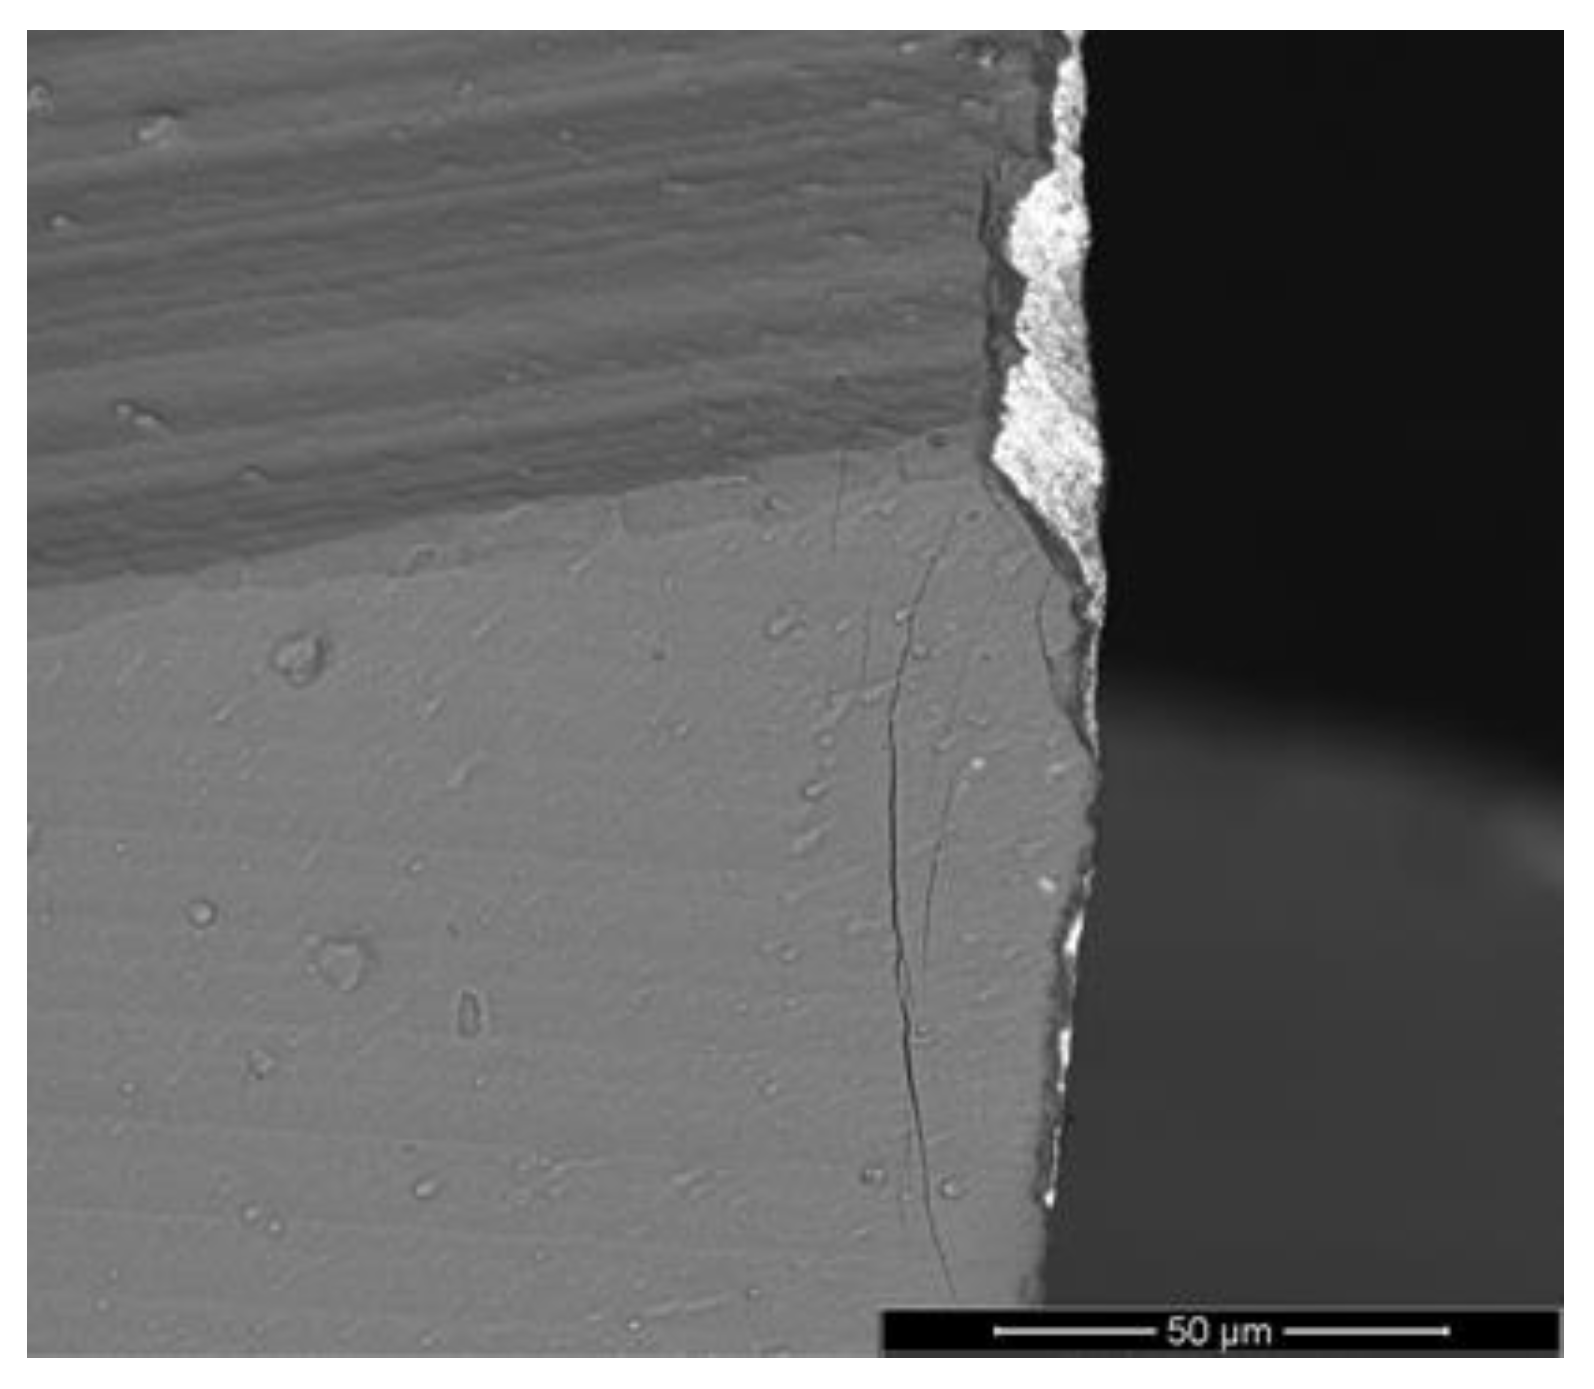
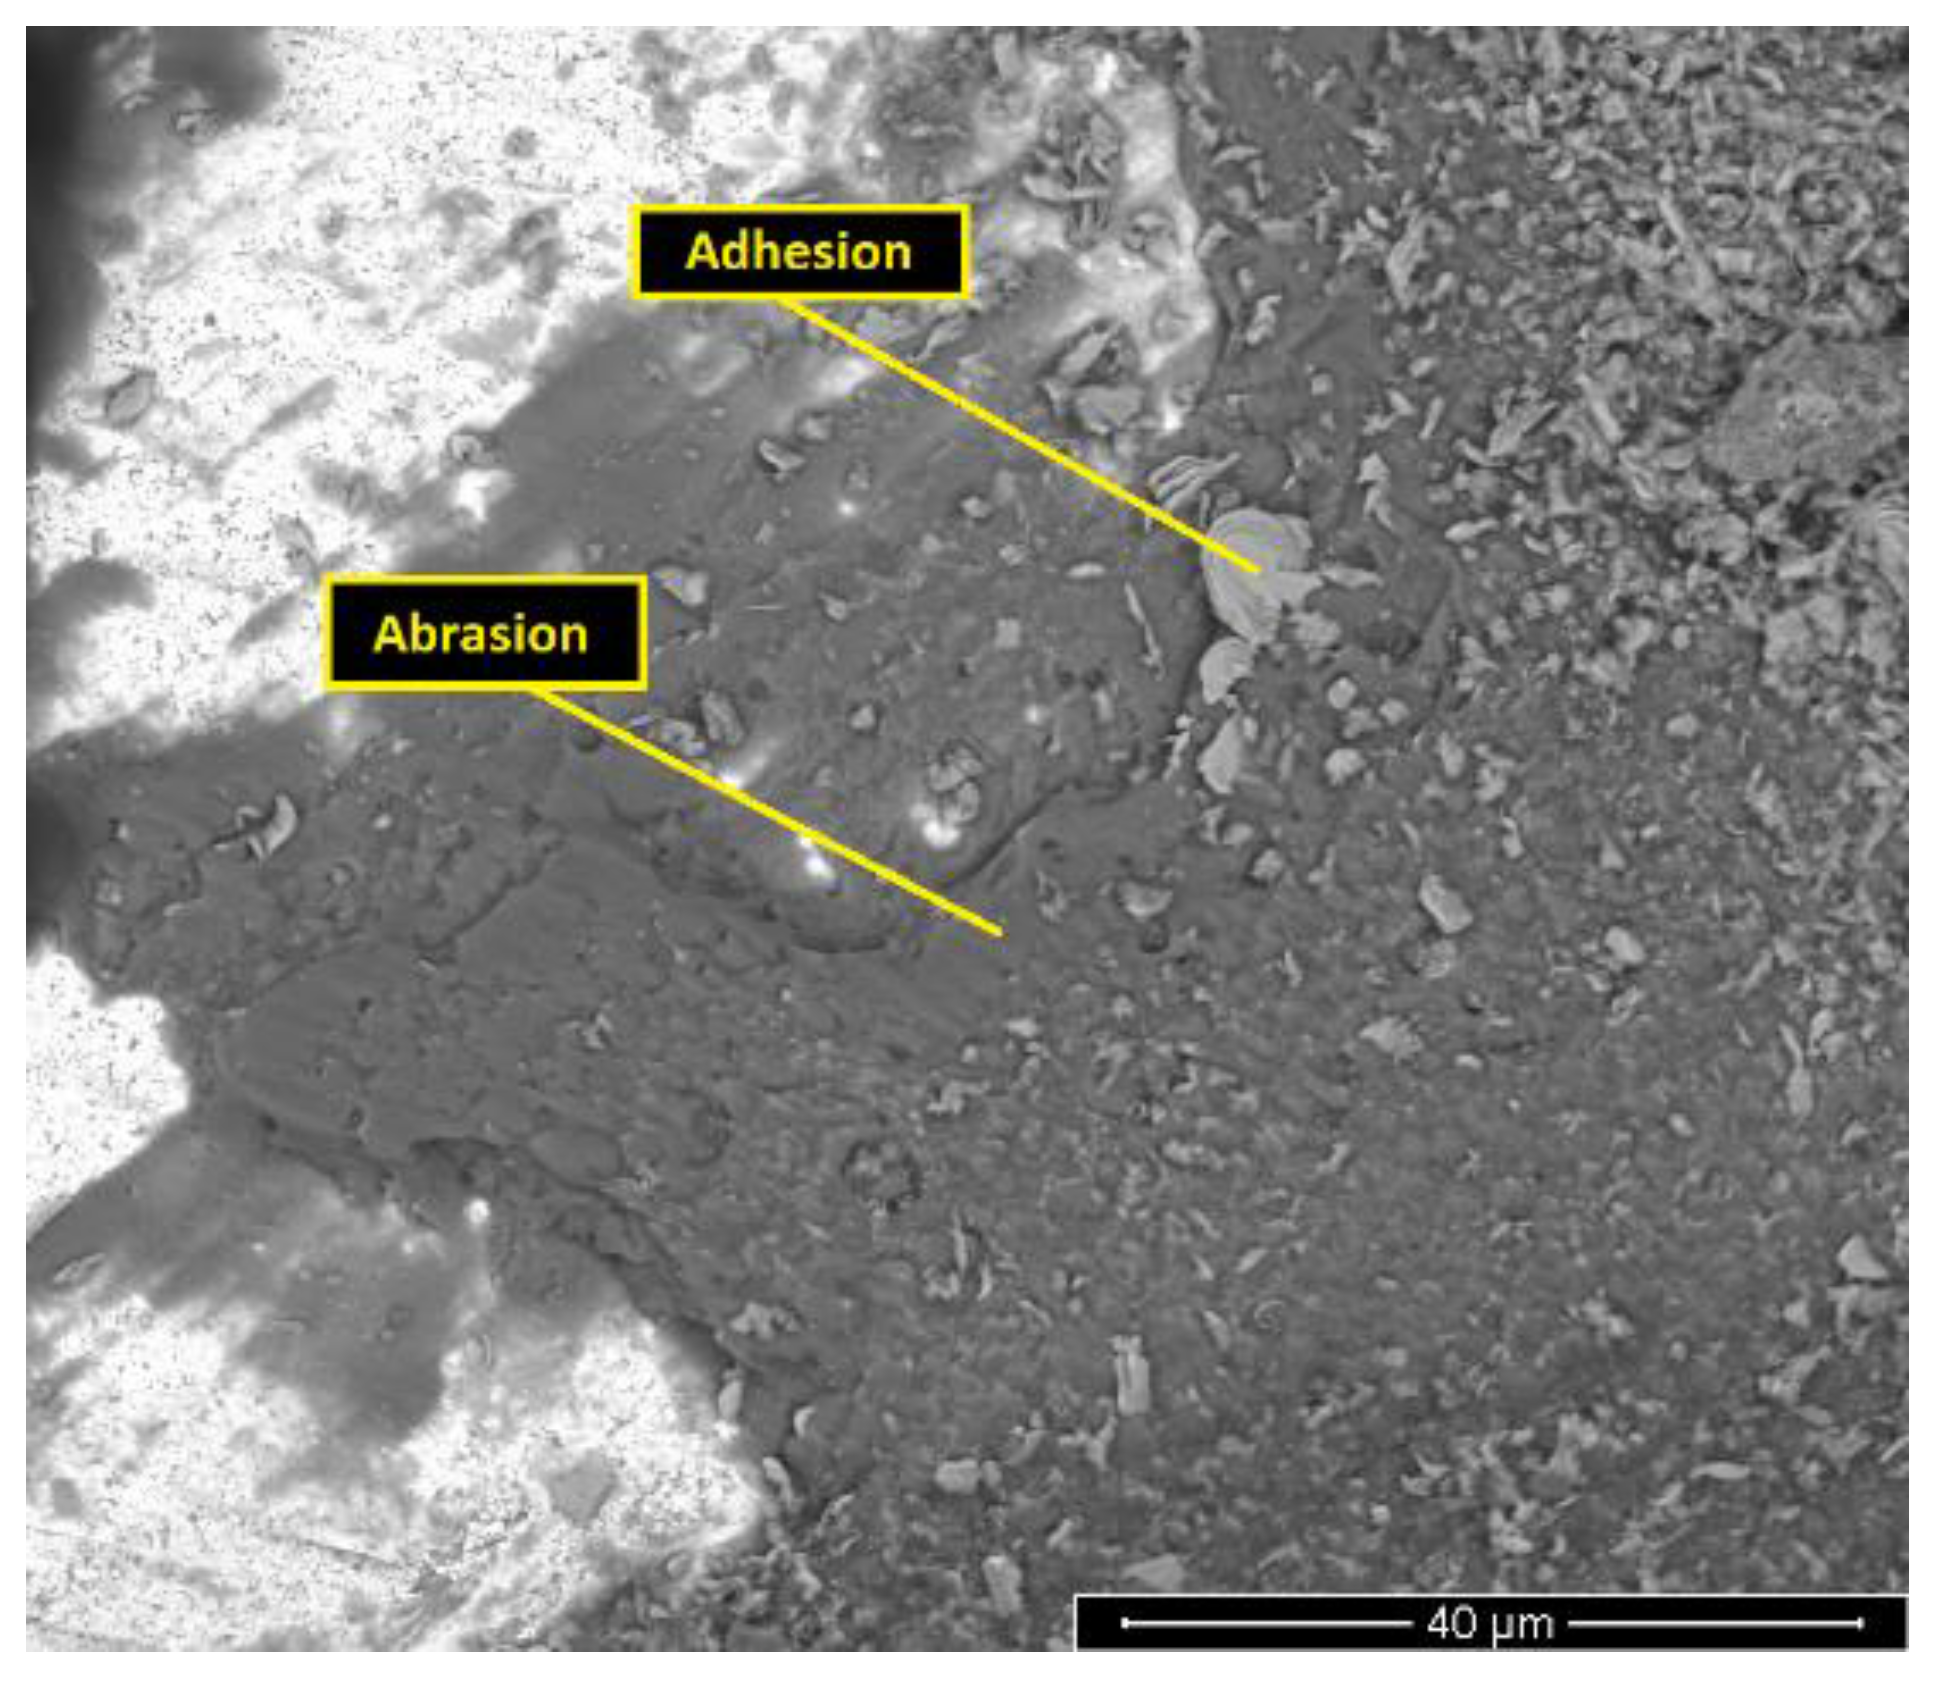
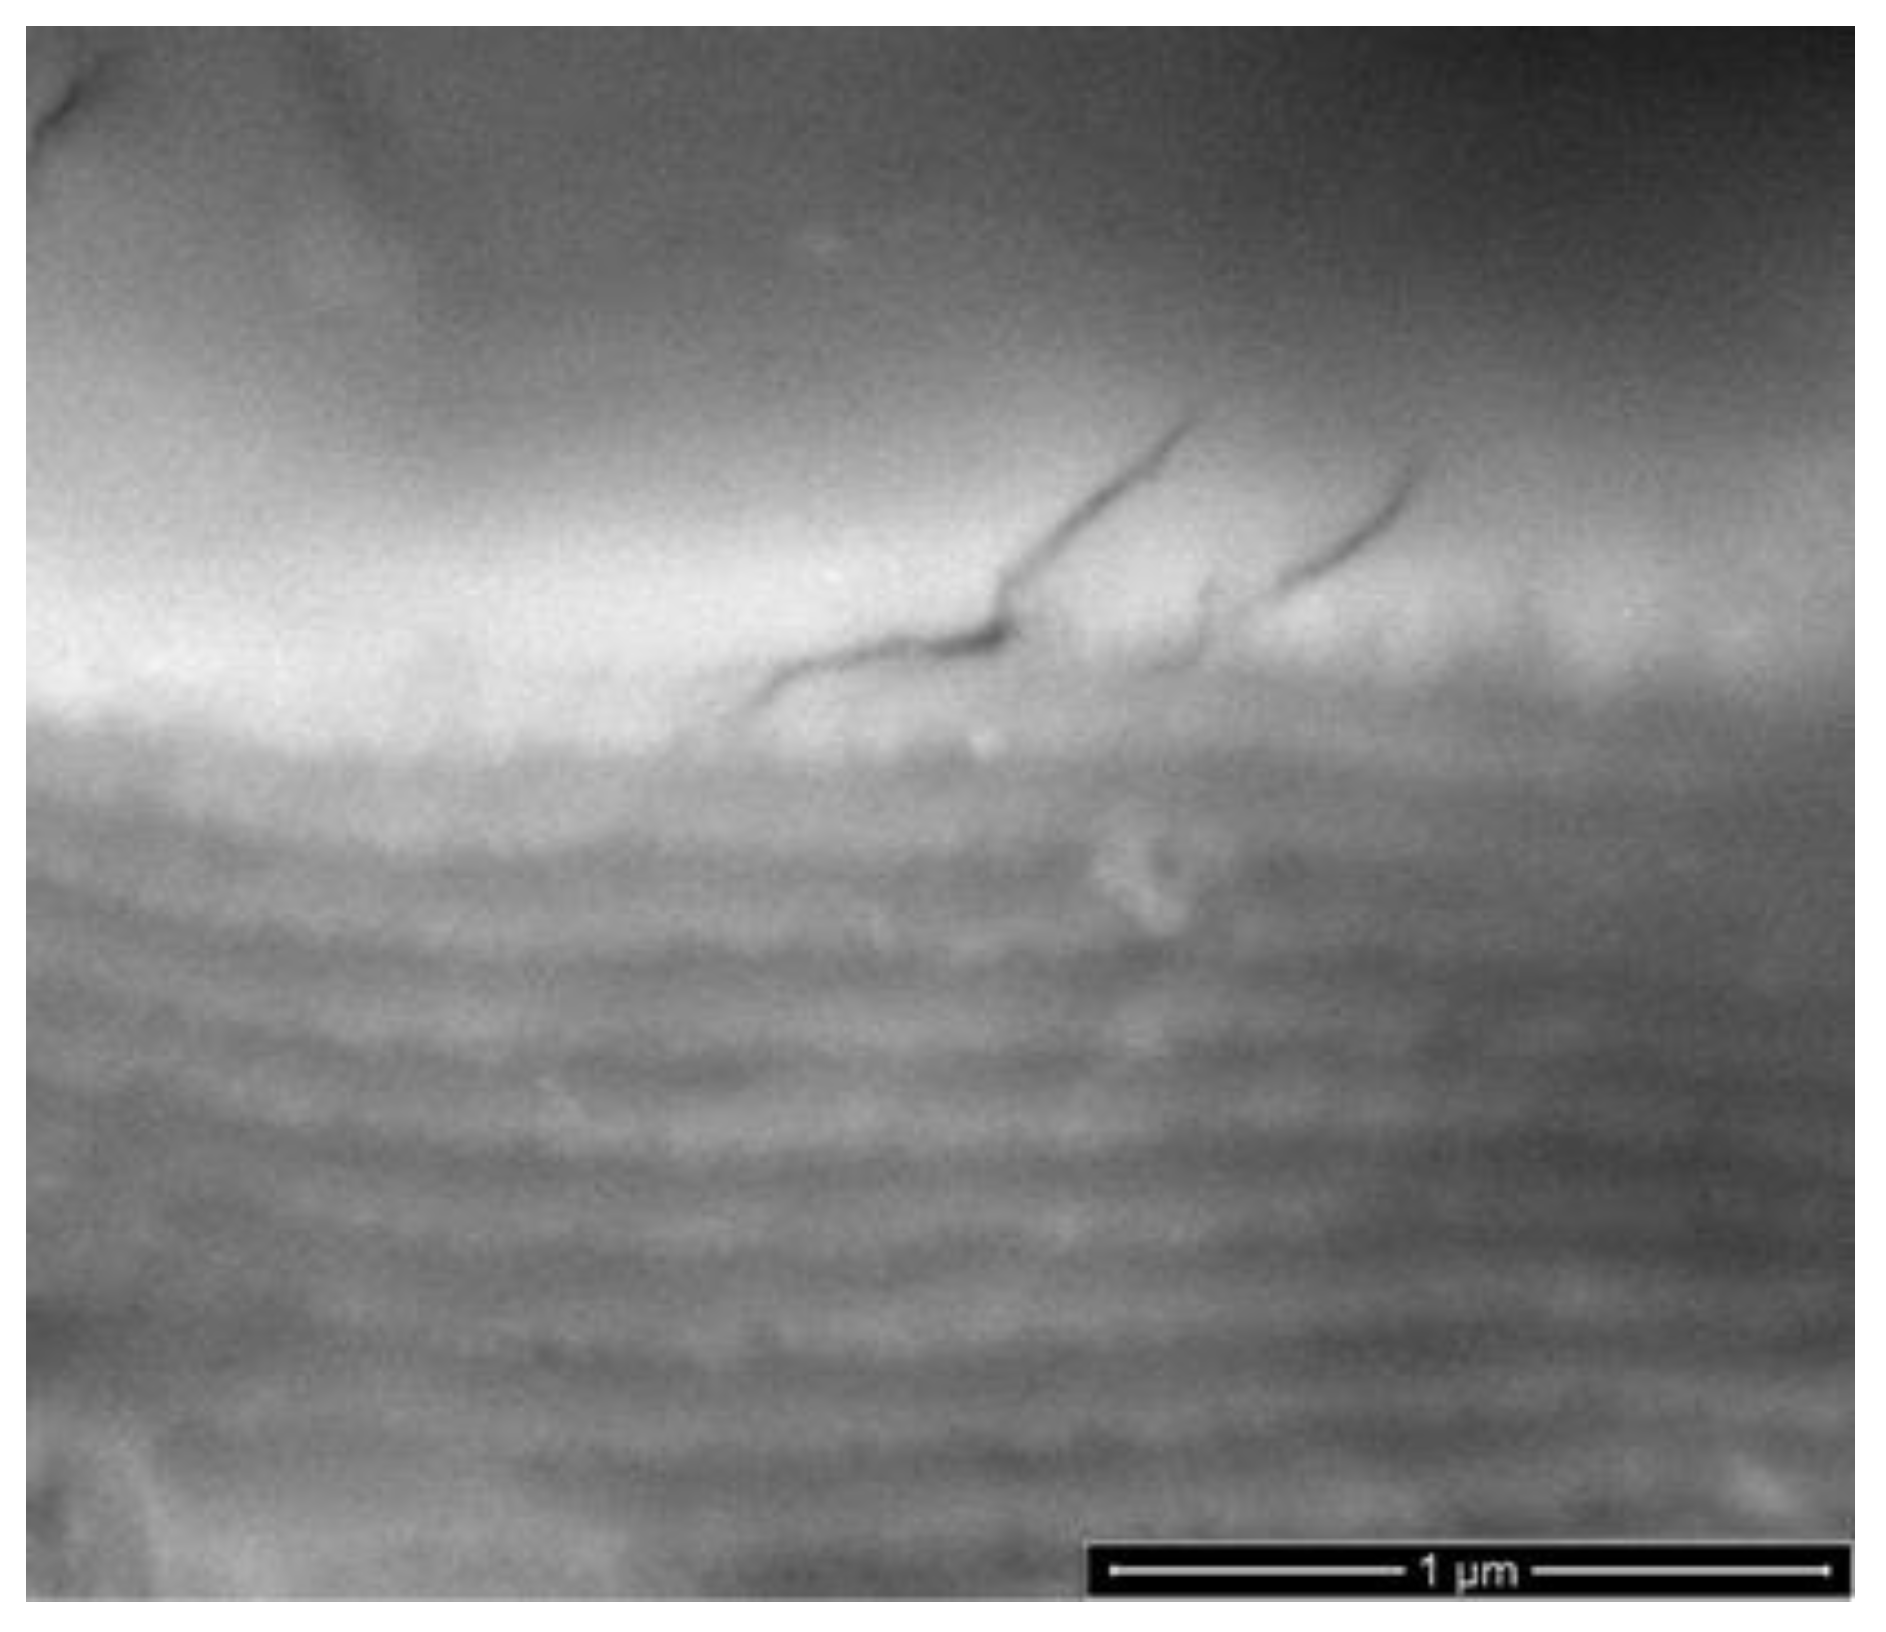
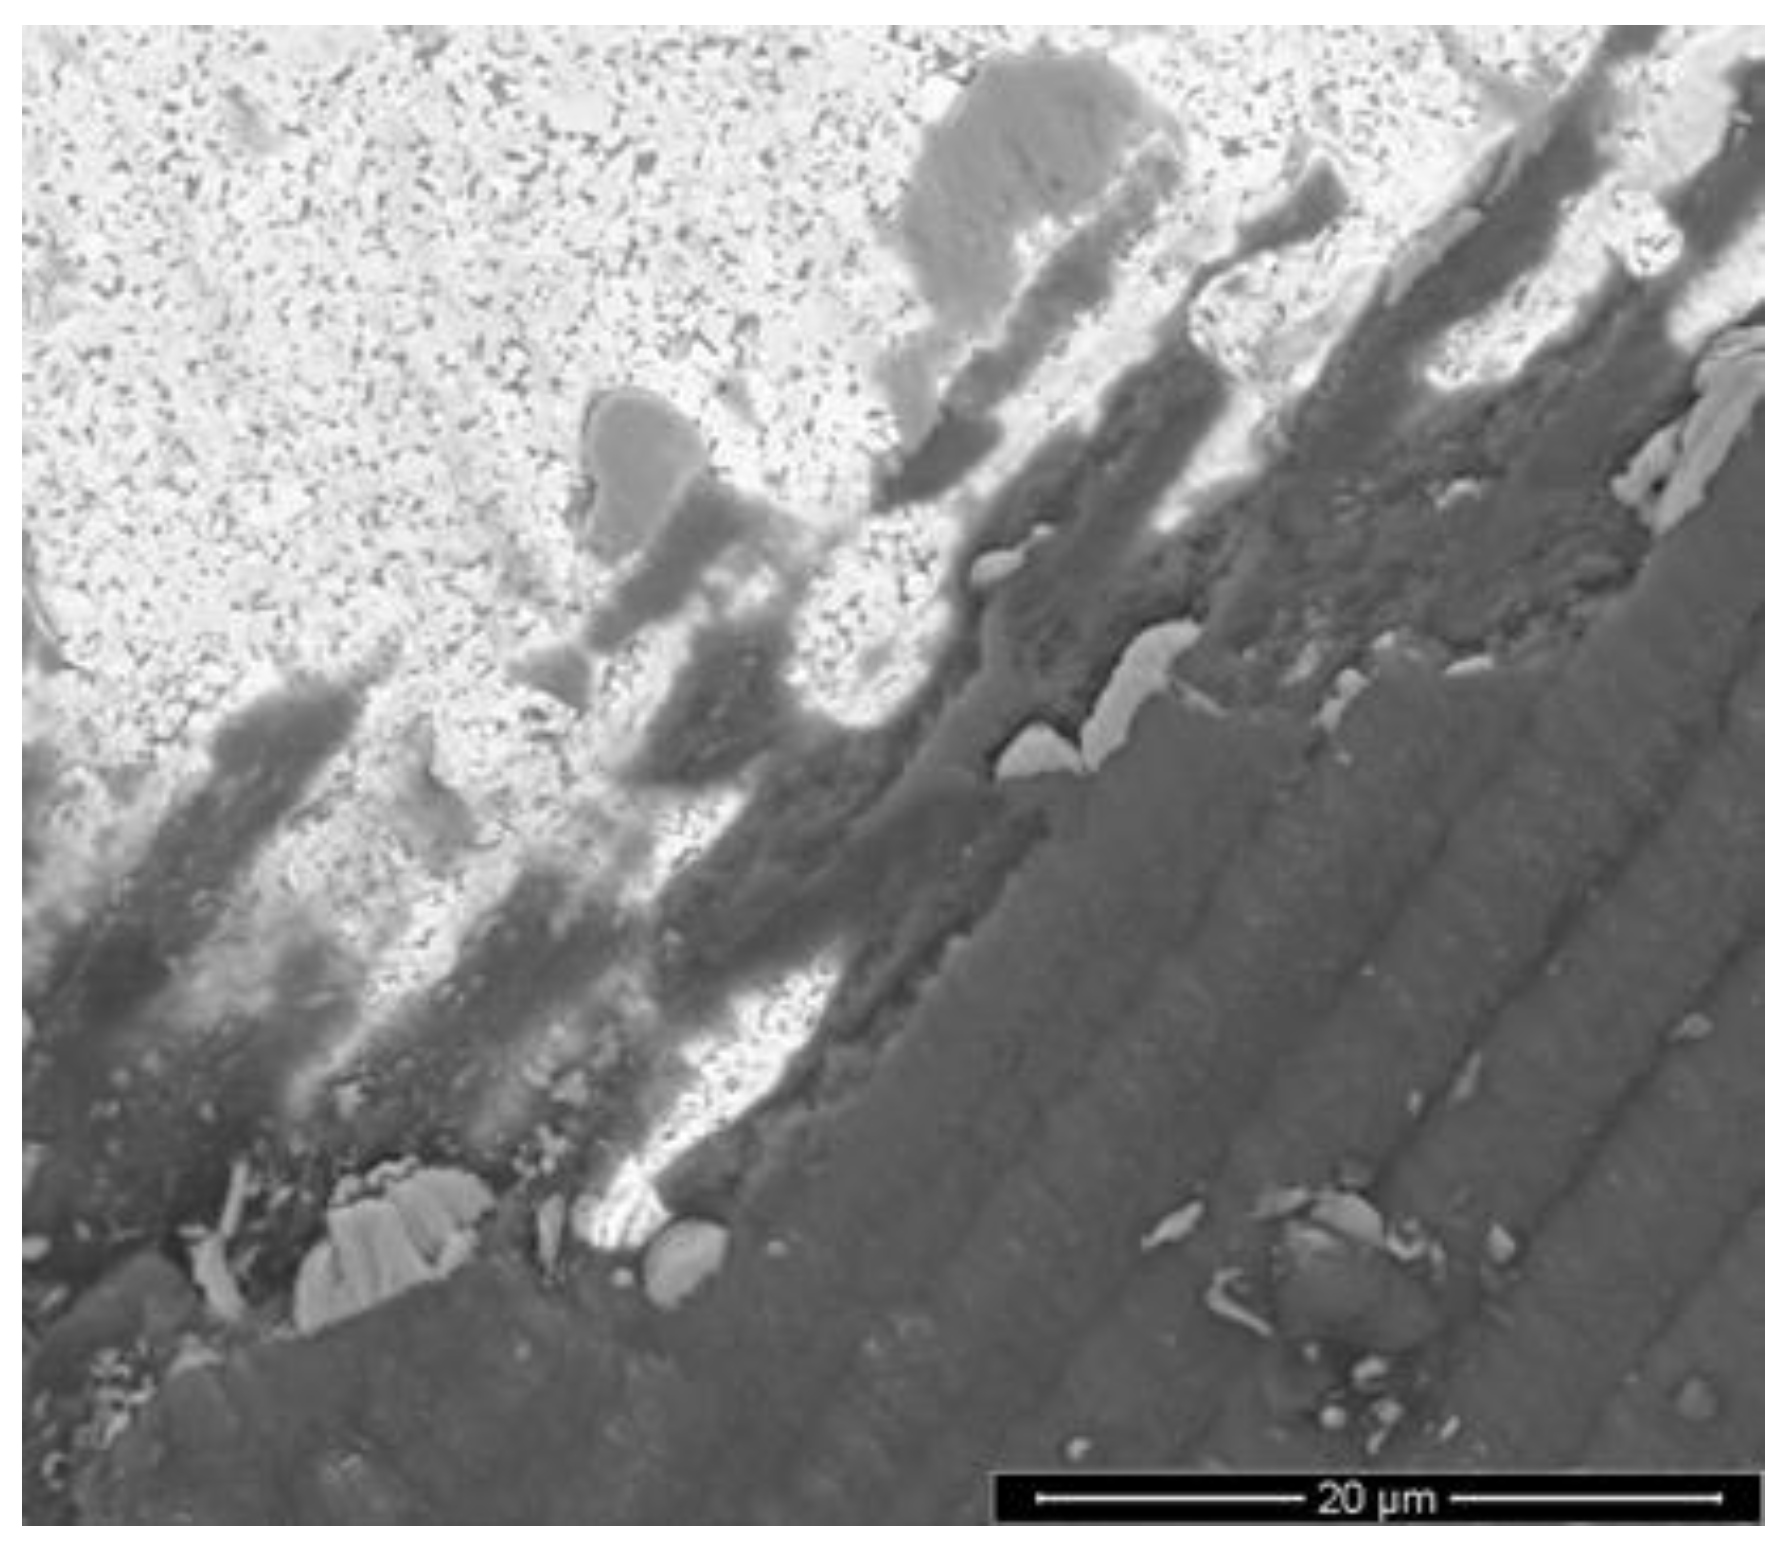
3.5. Analysis of the Wear Mechanisms
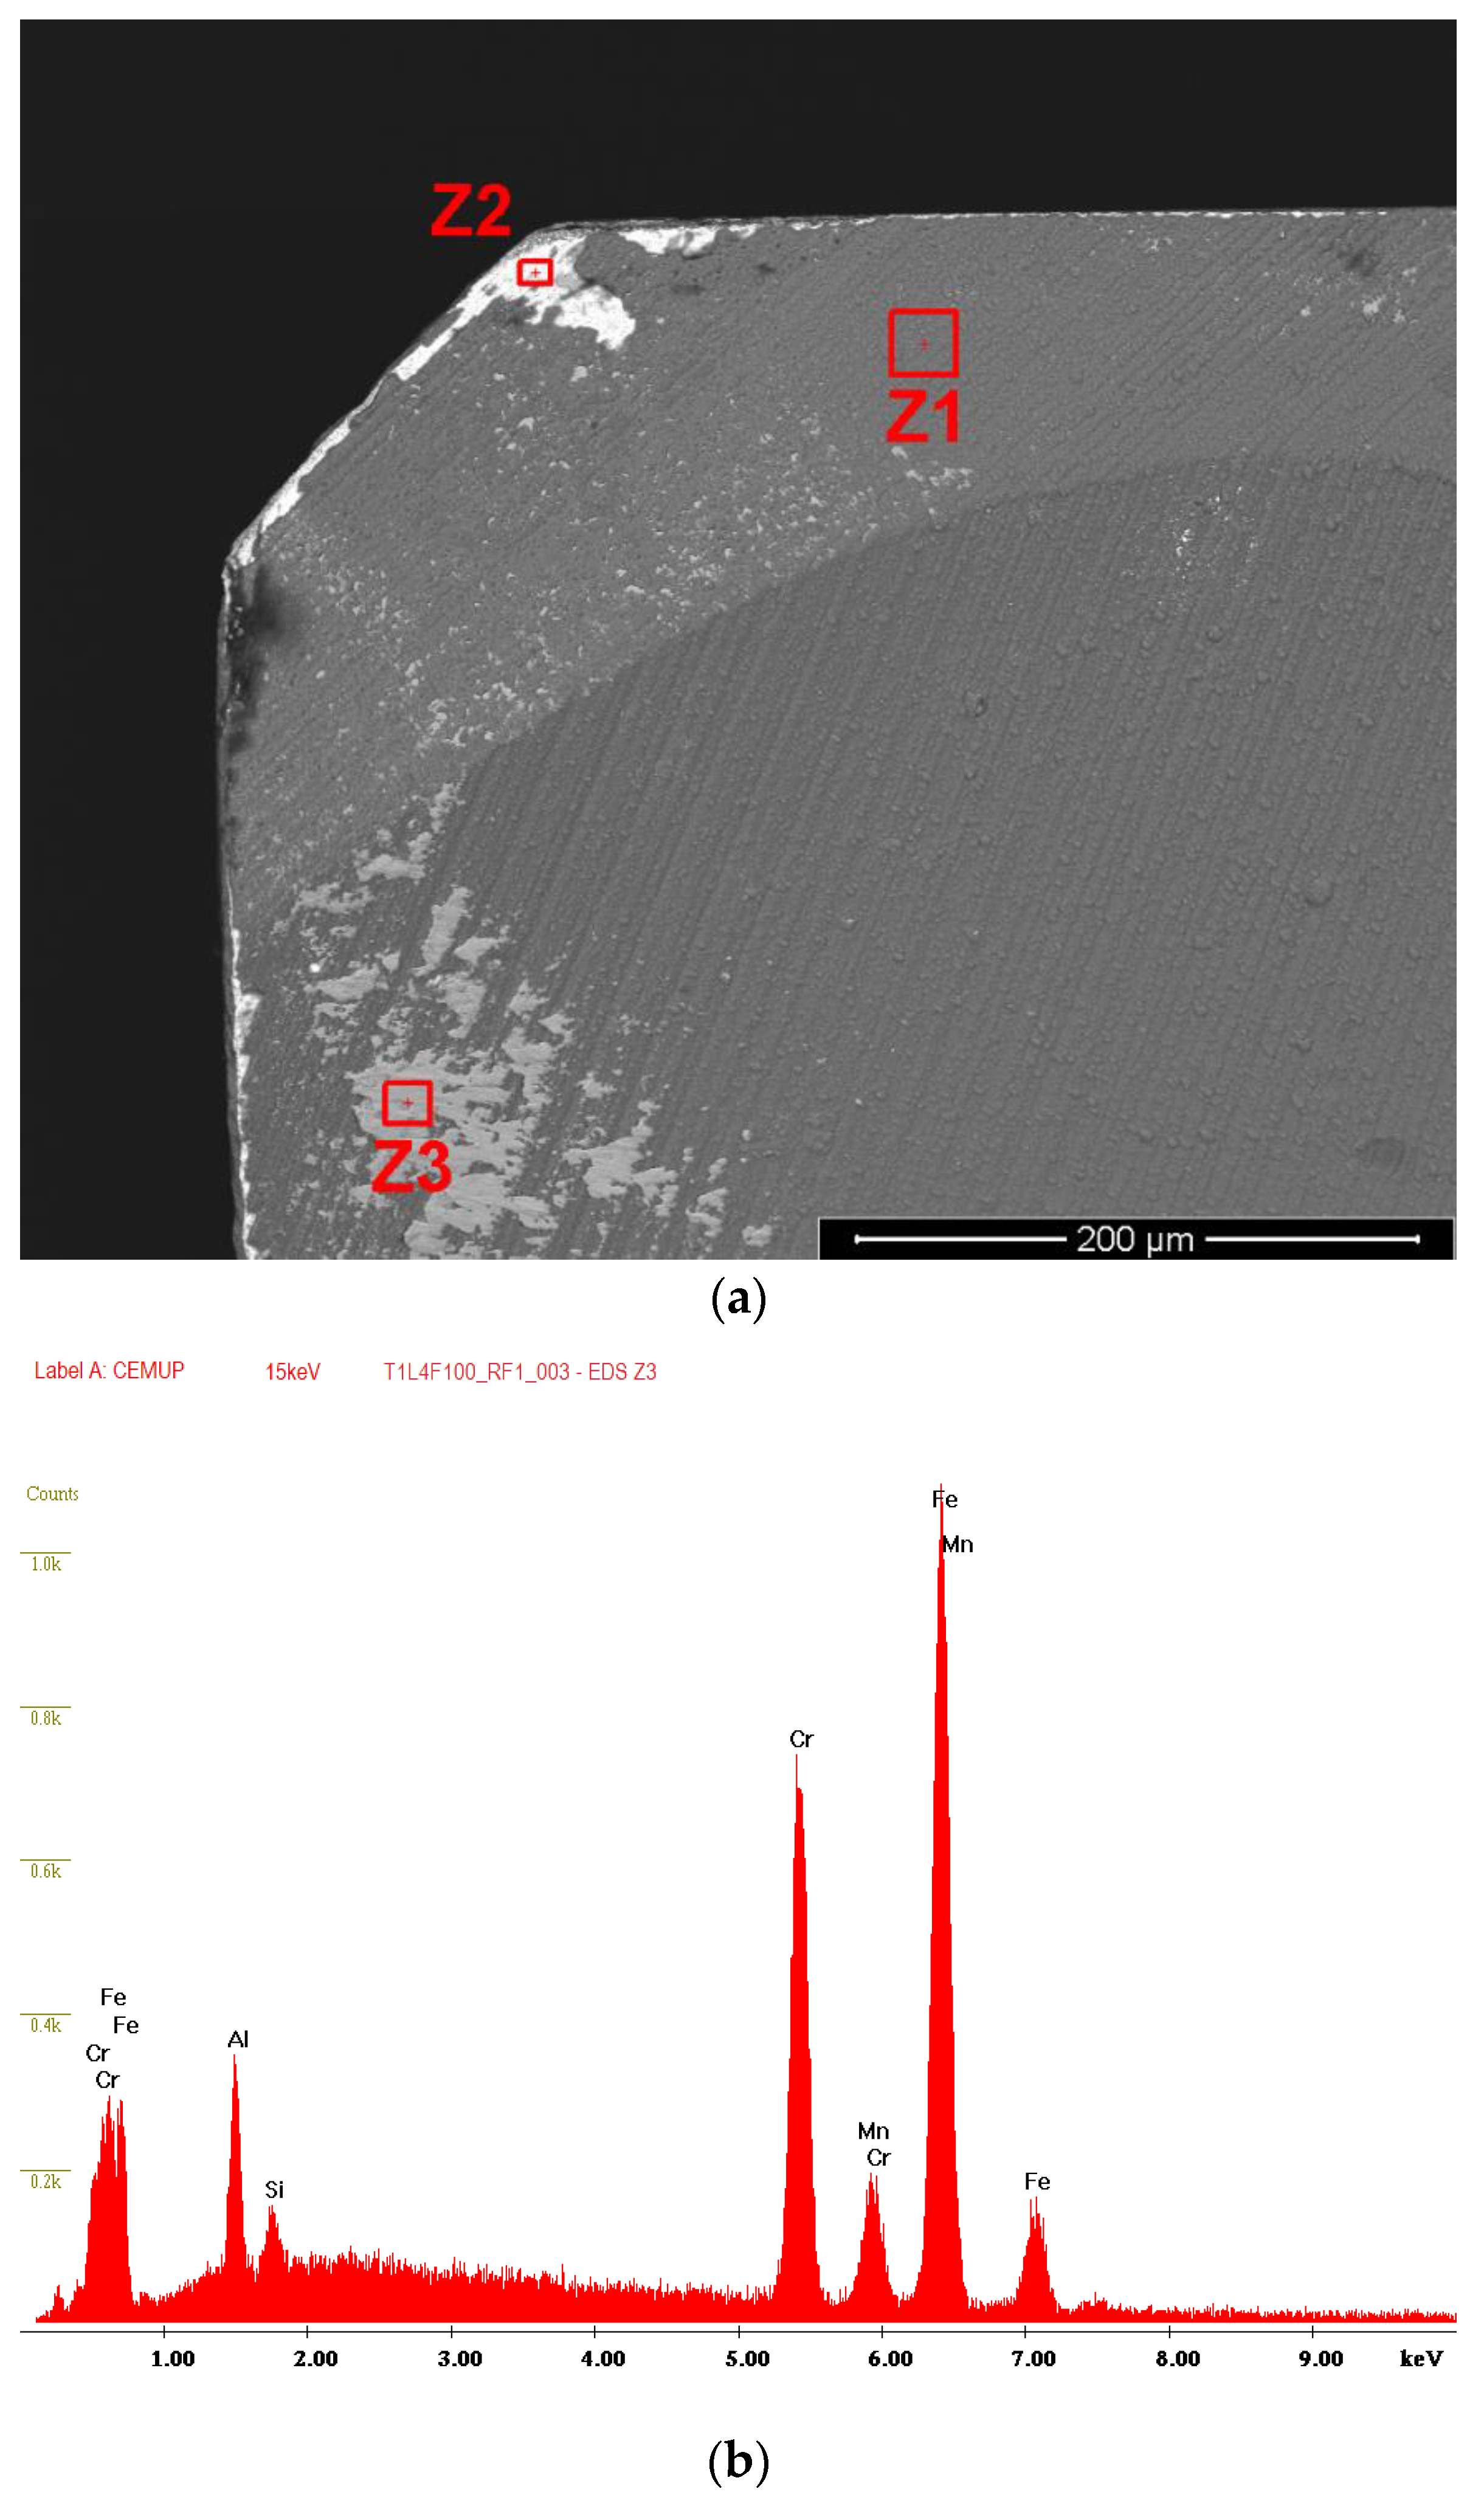
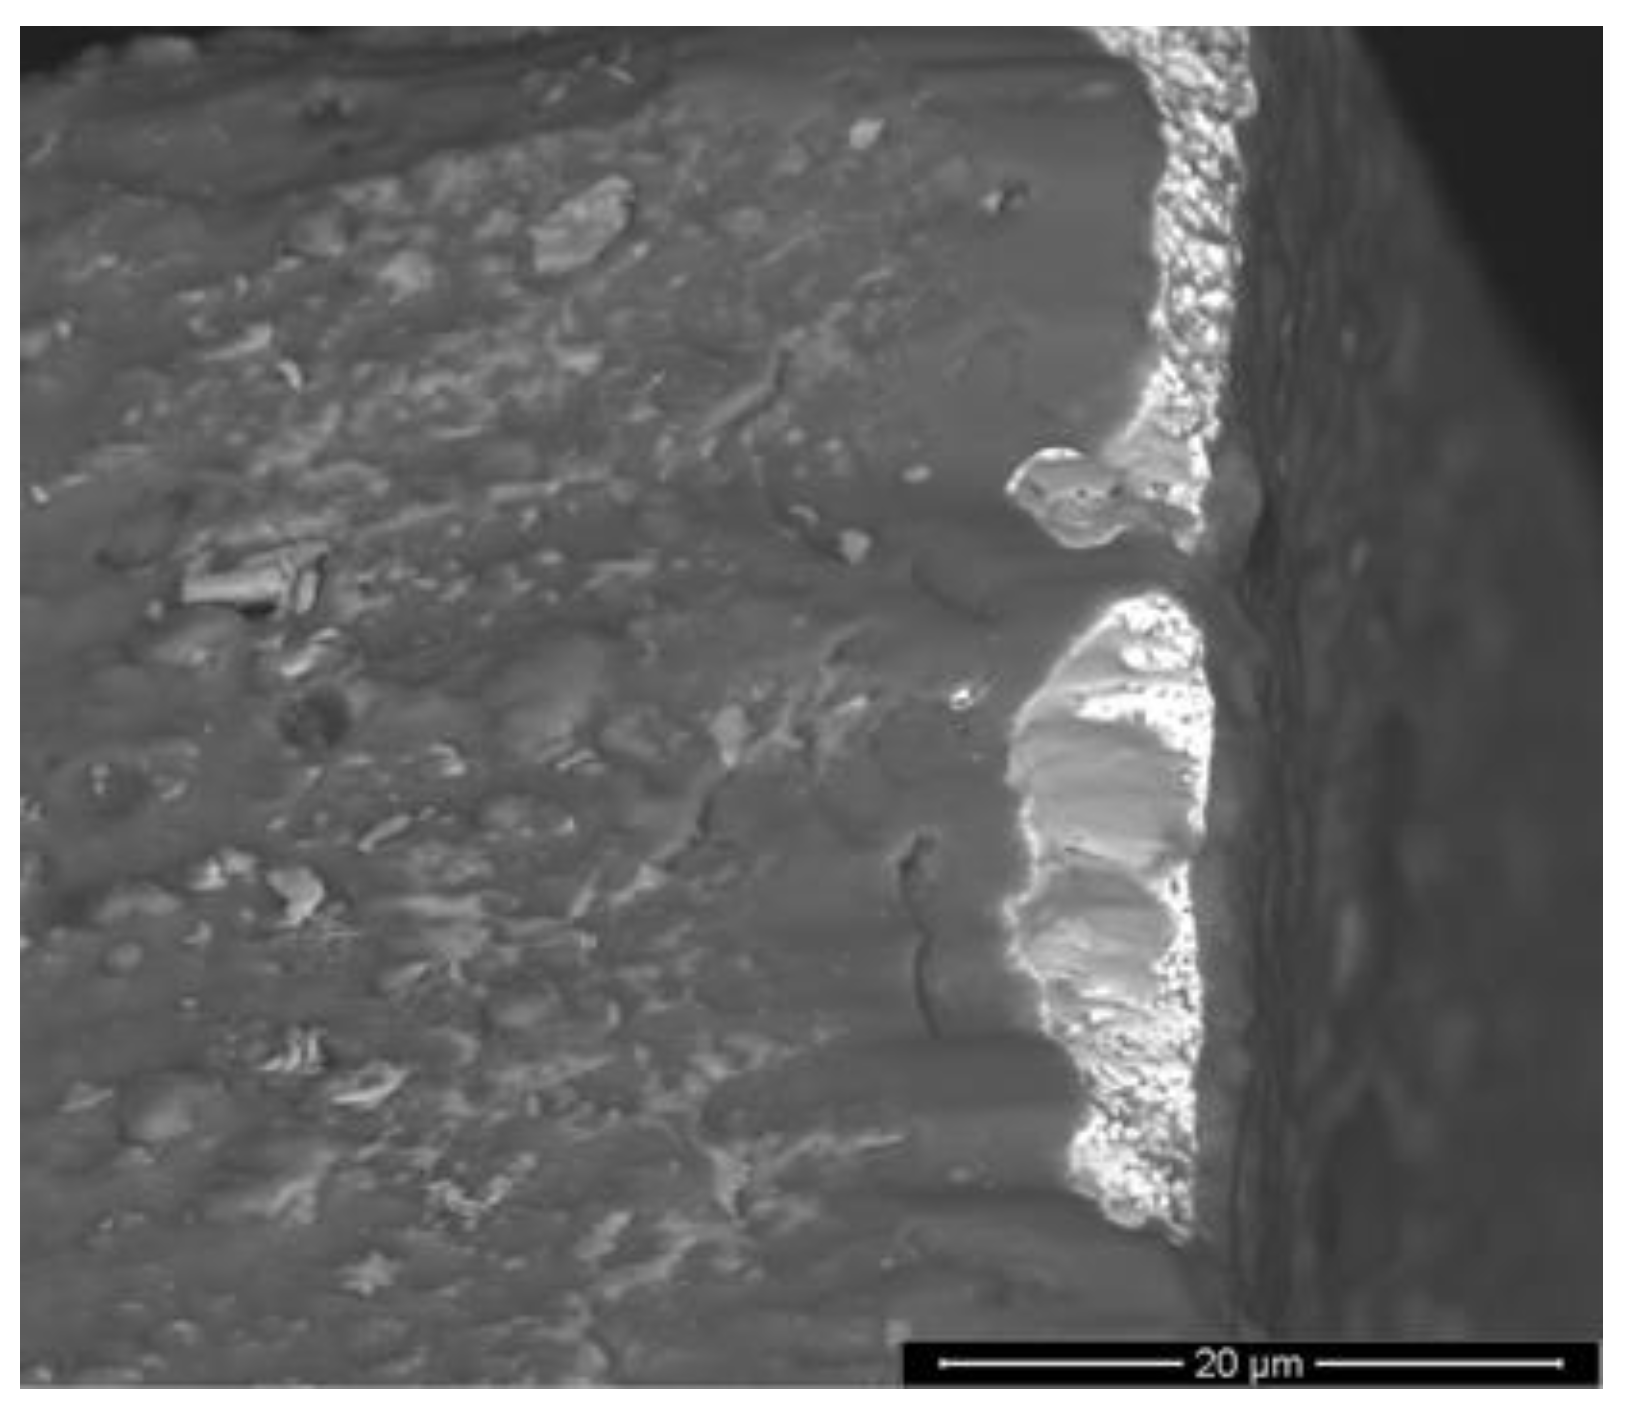
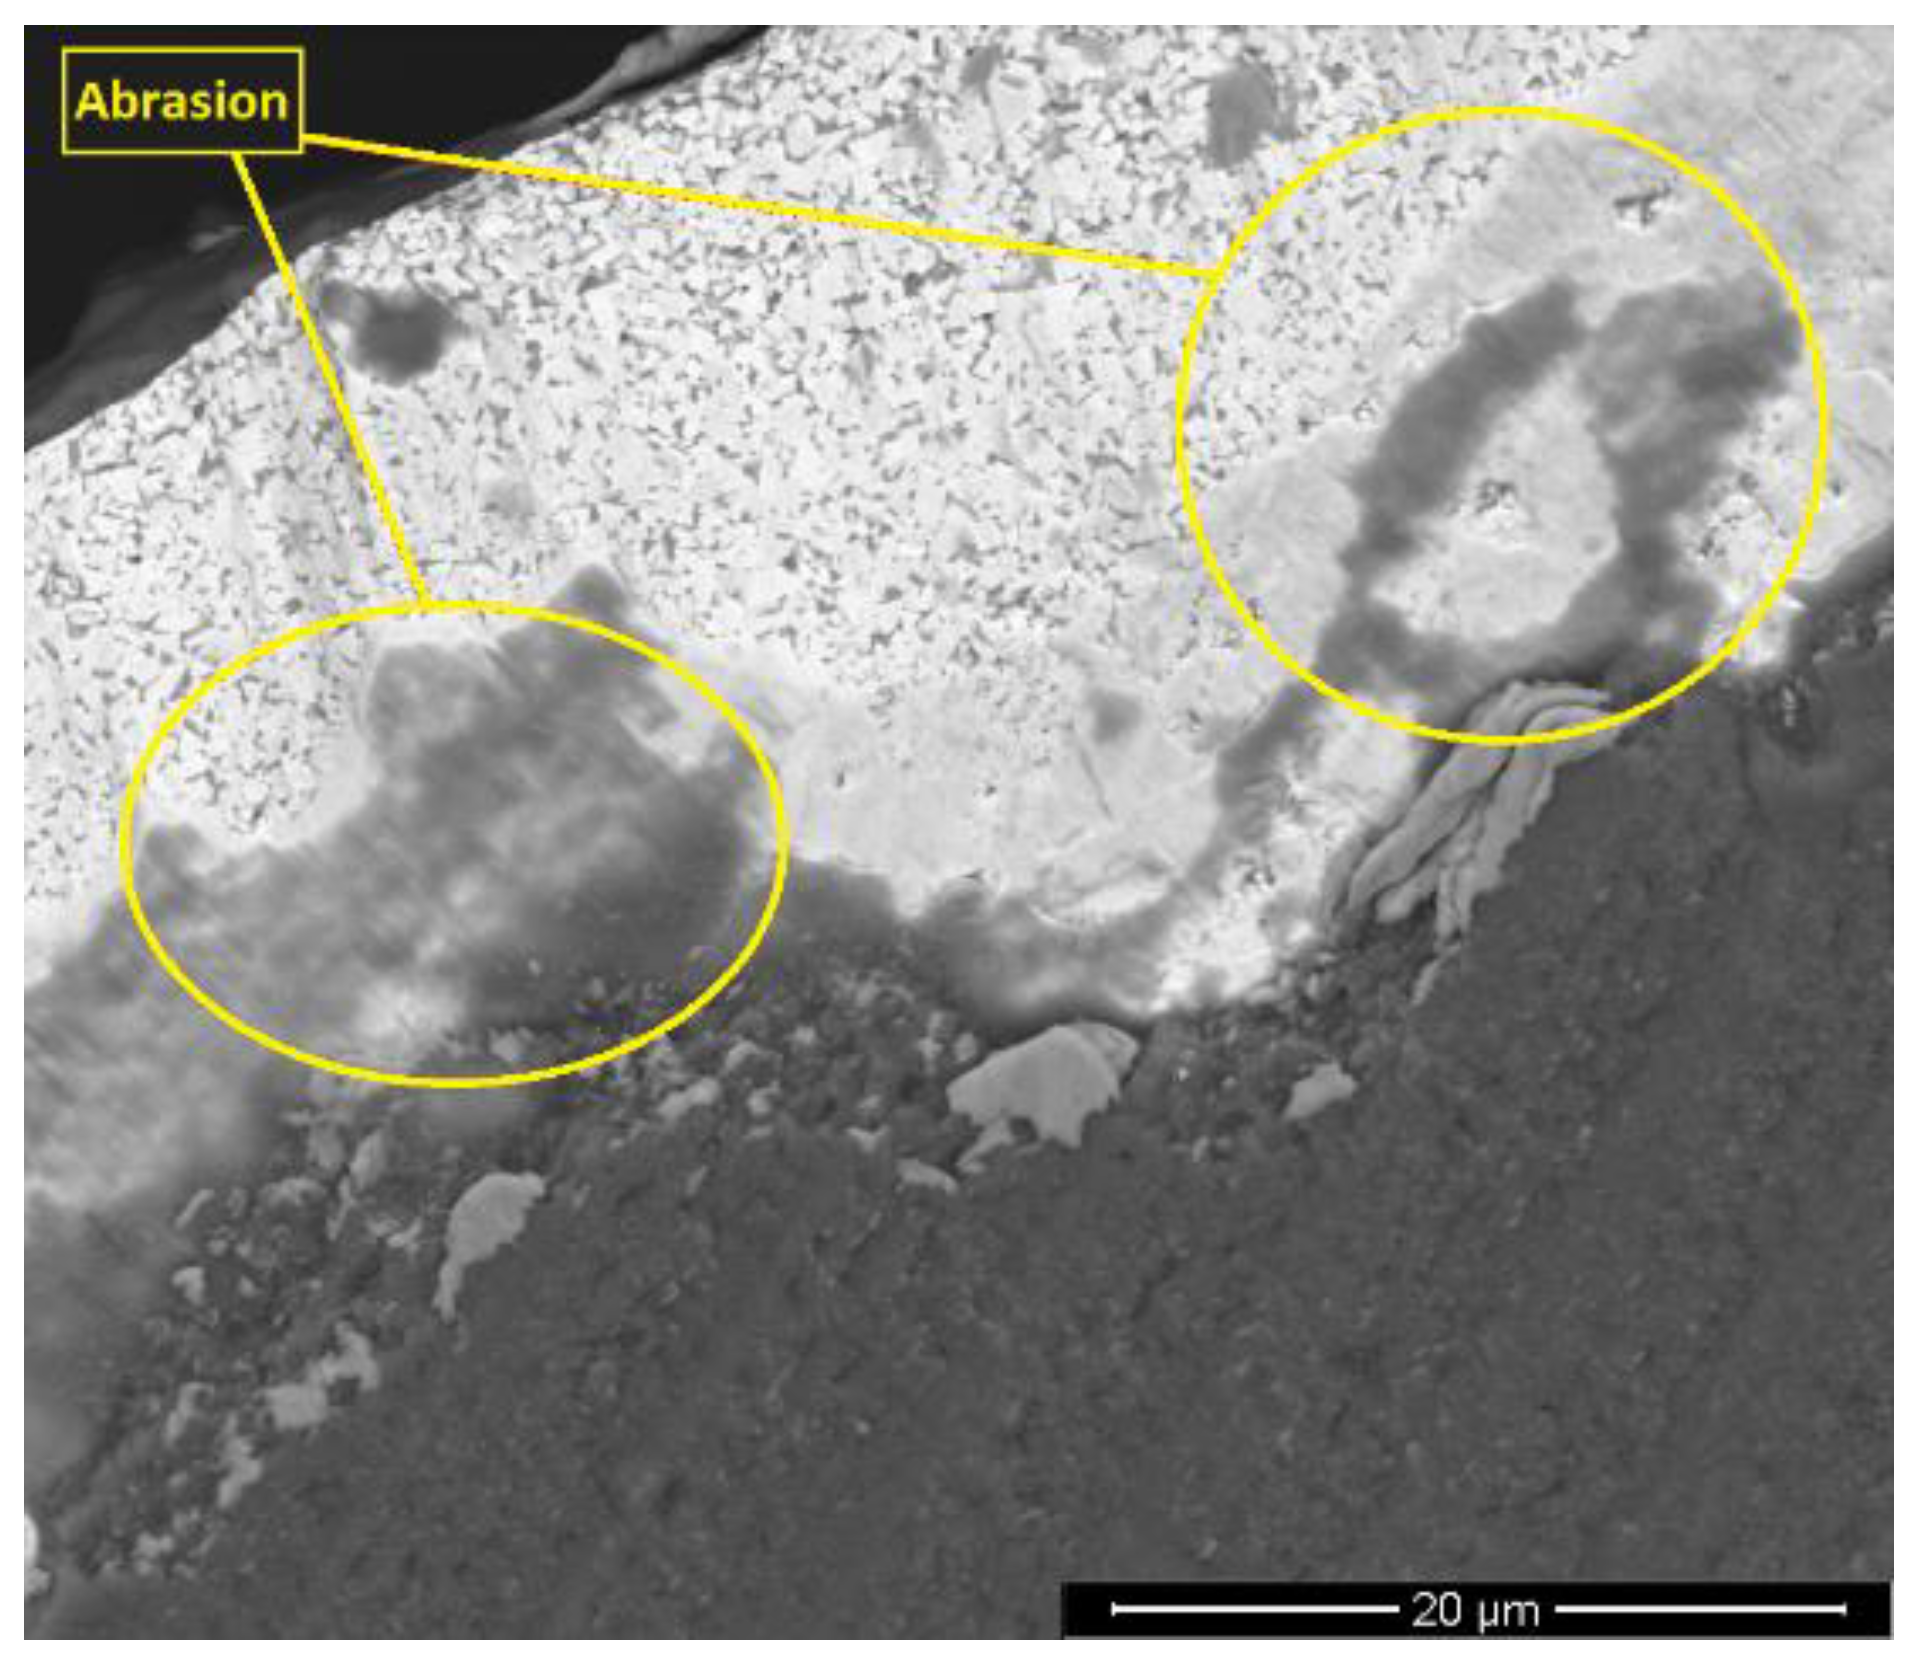
3.5.1. T1—Wear Mechanism Analysis
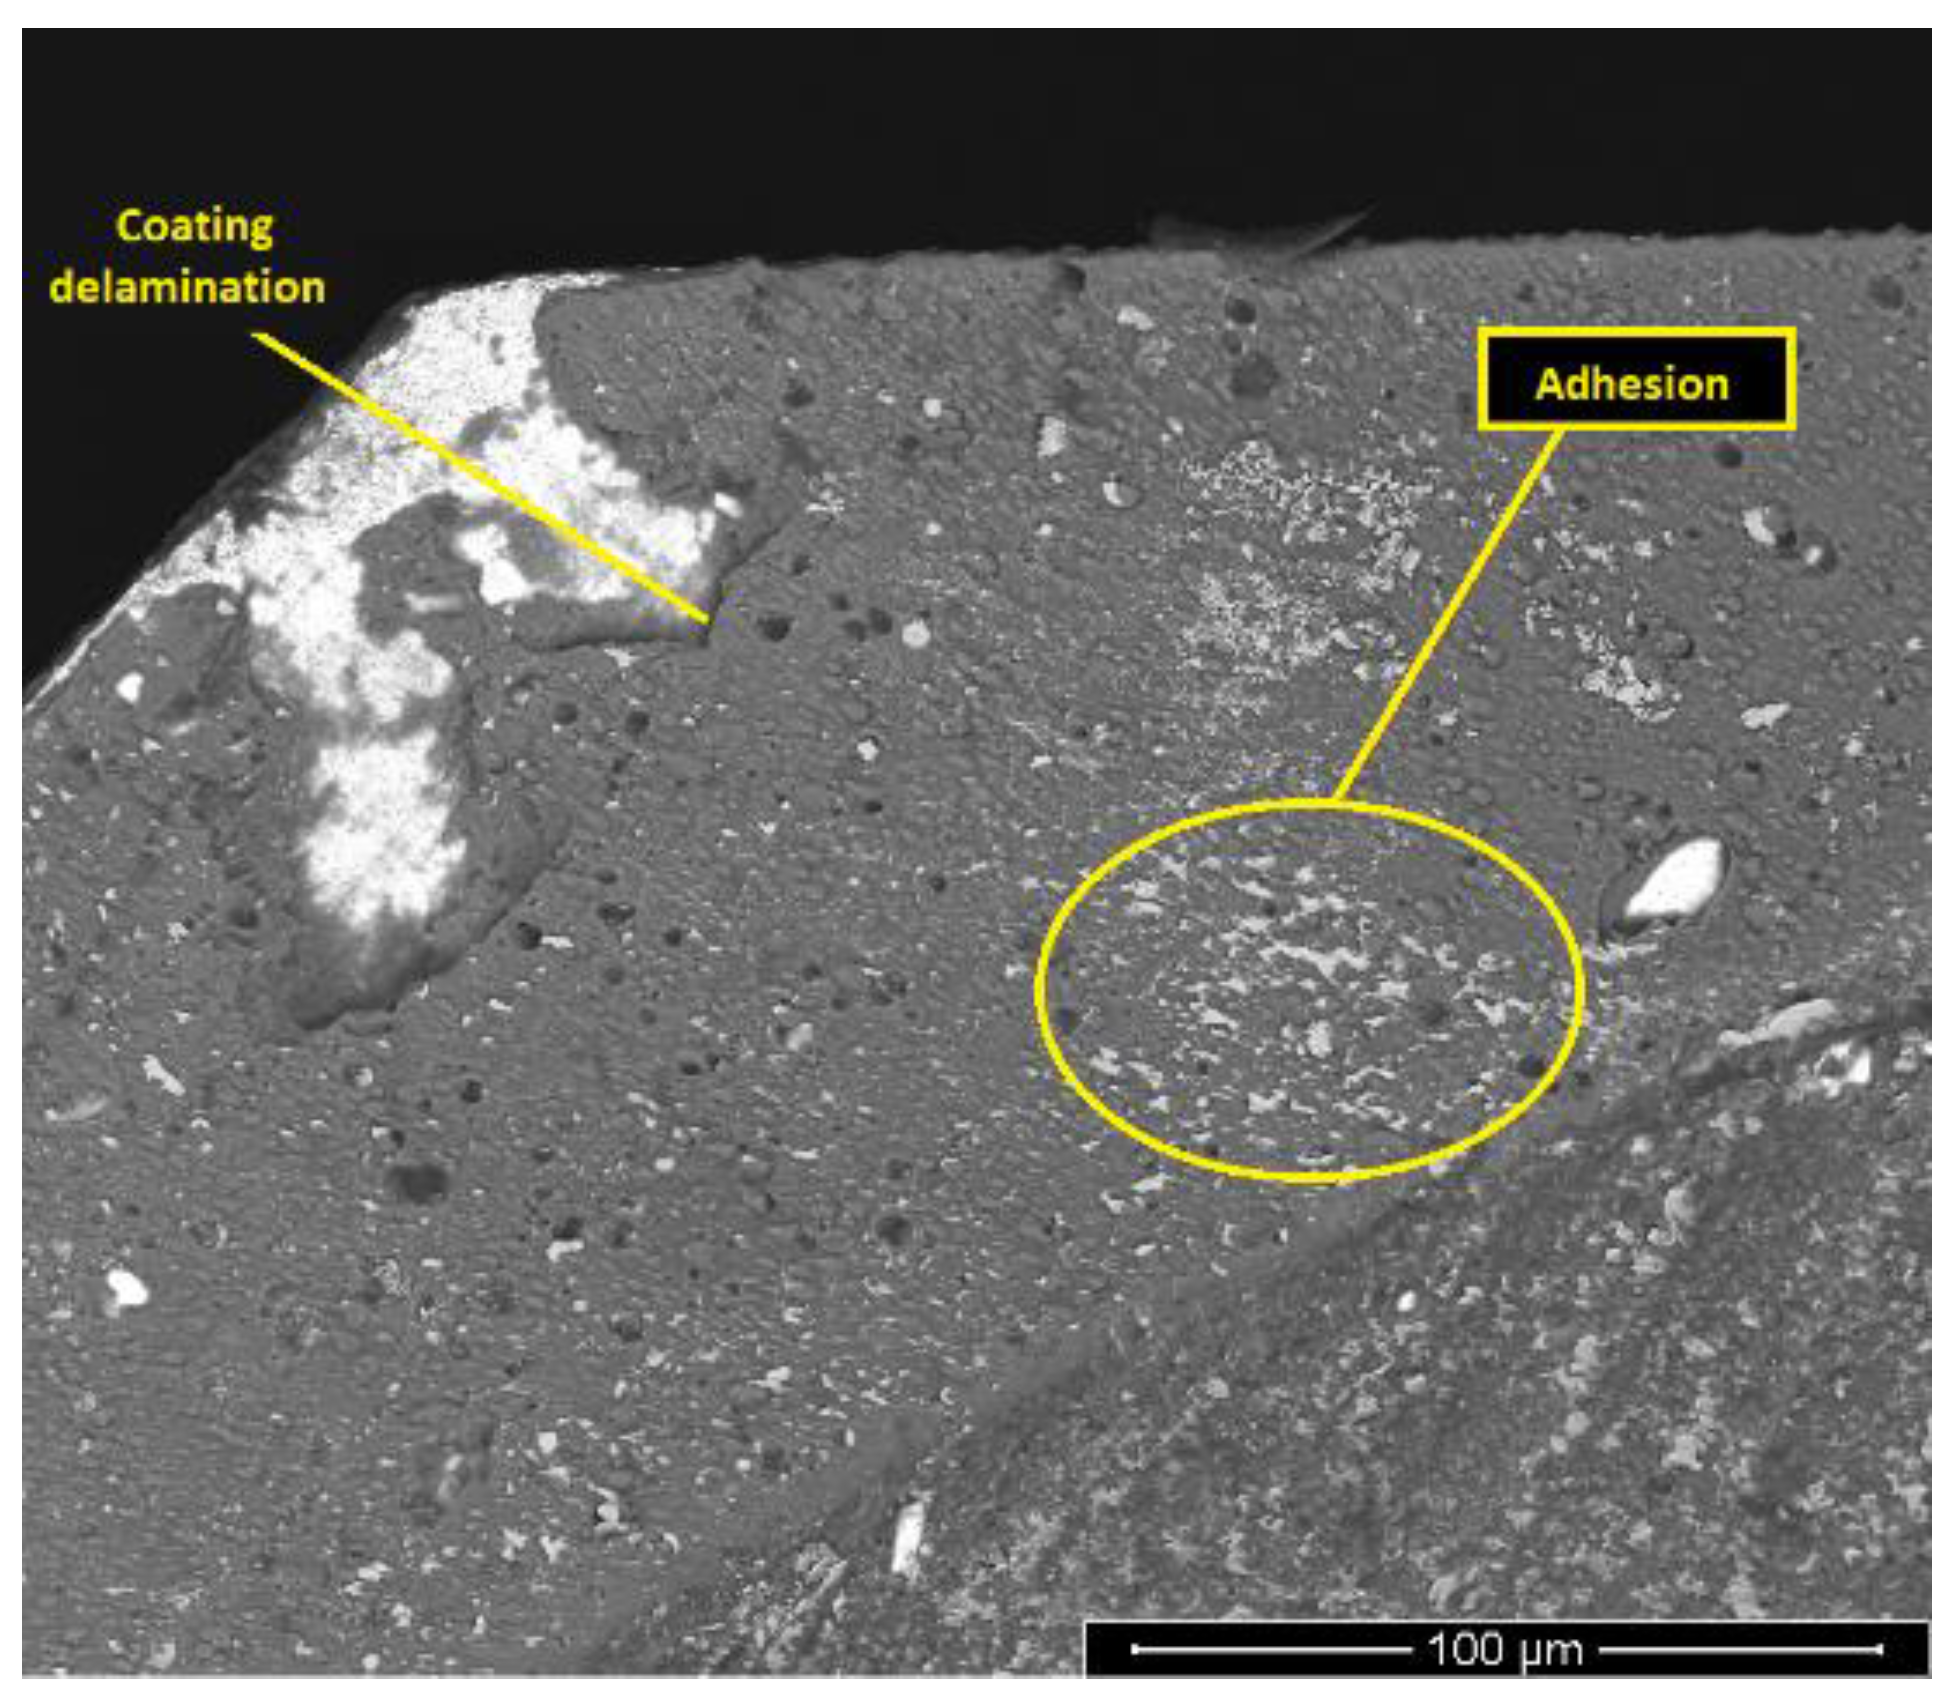
3.5.2. T2—Wear Mechanism Analysis
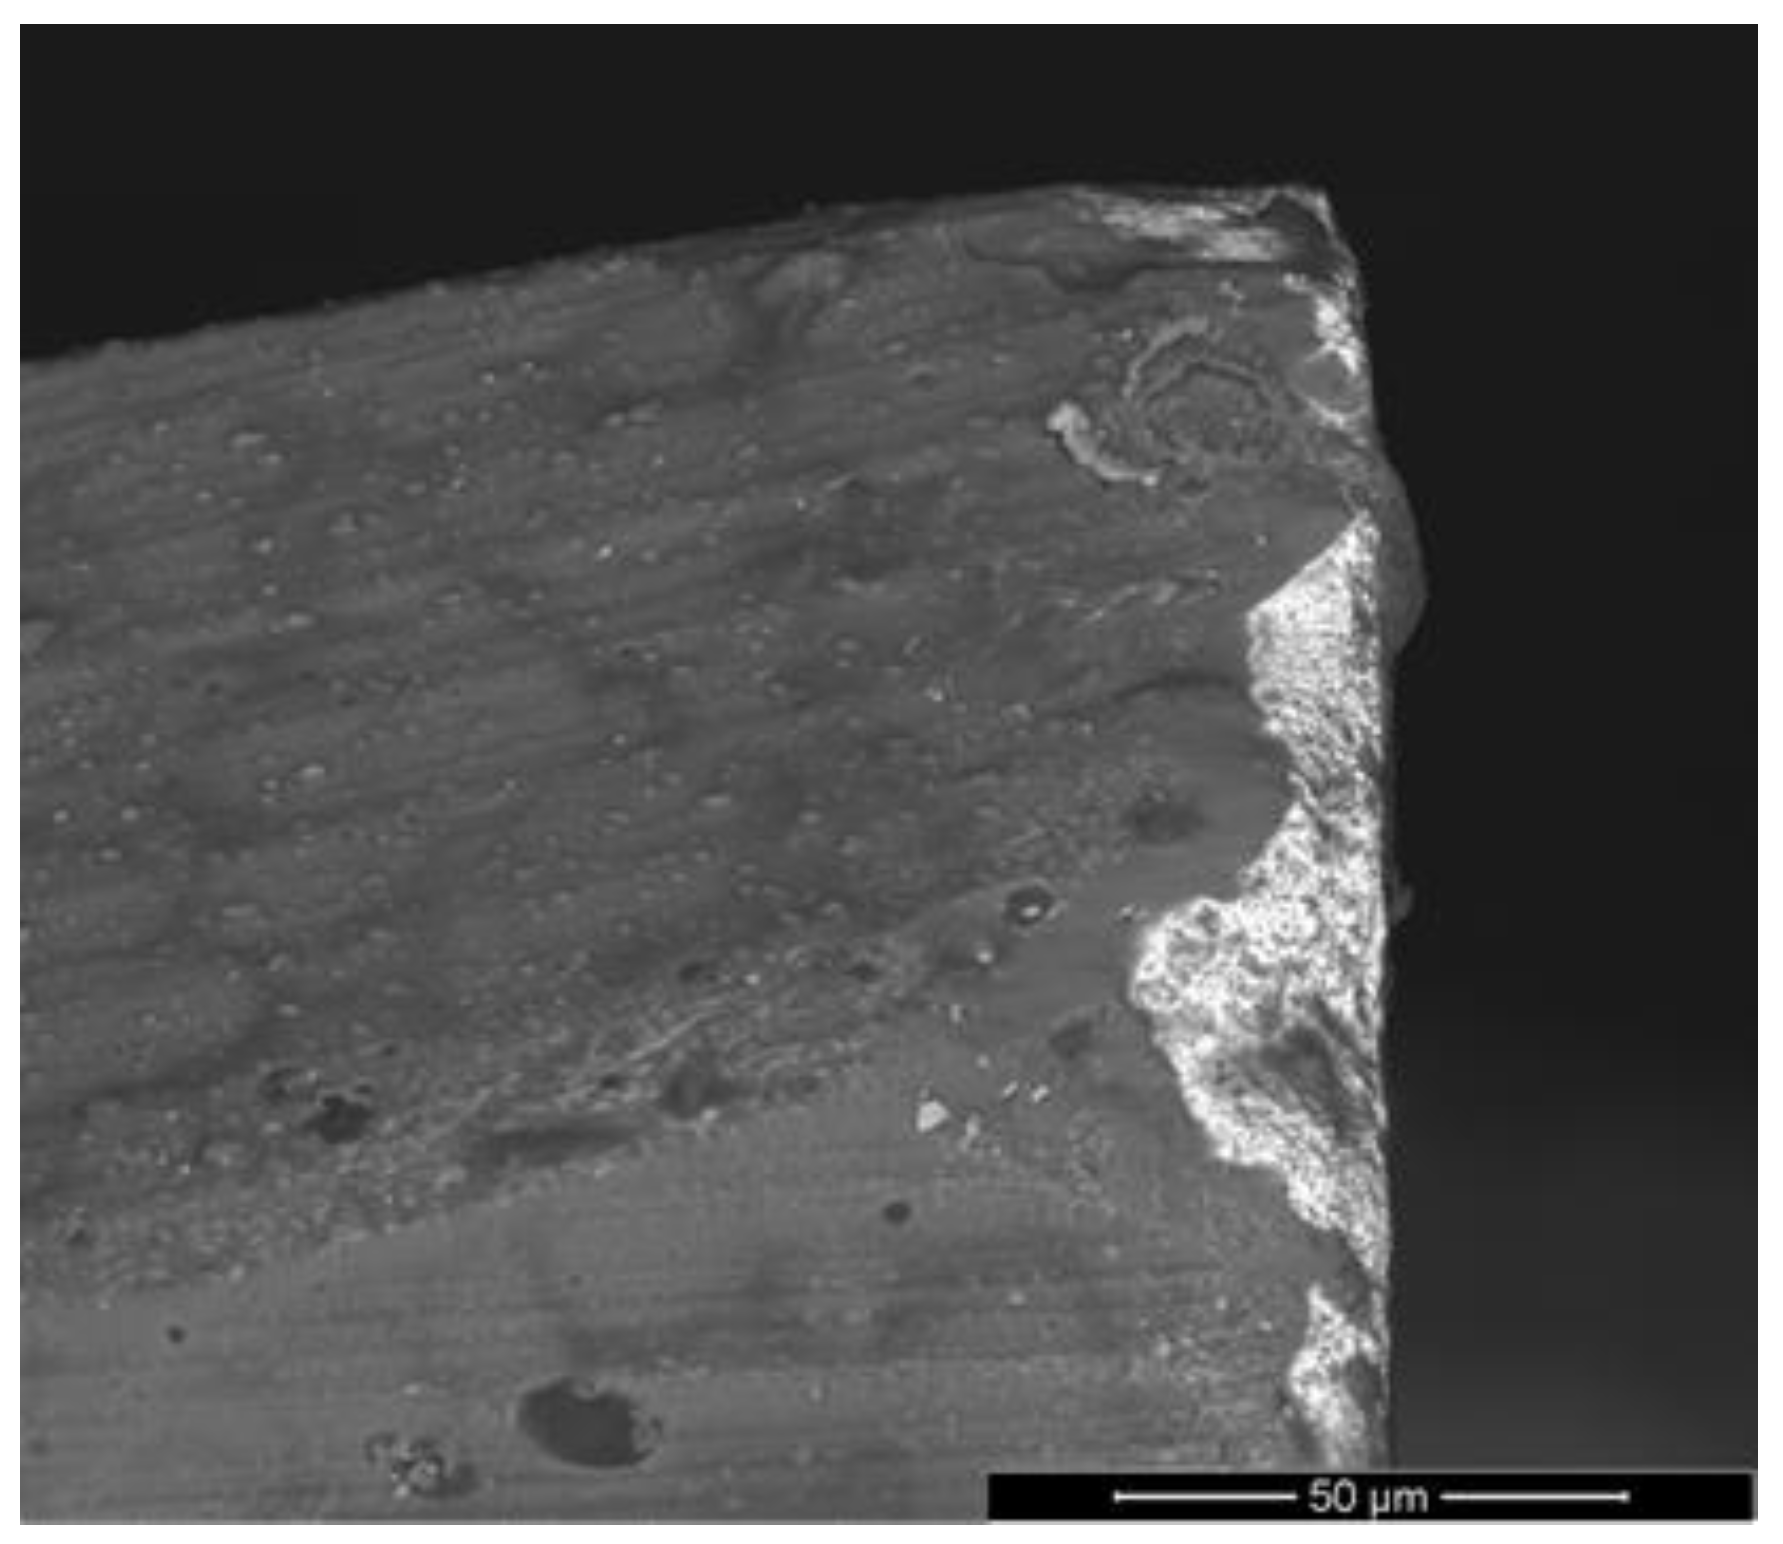
3.5.3. T3—Wear Mechanism Analysis
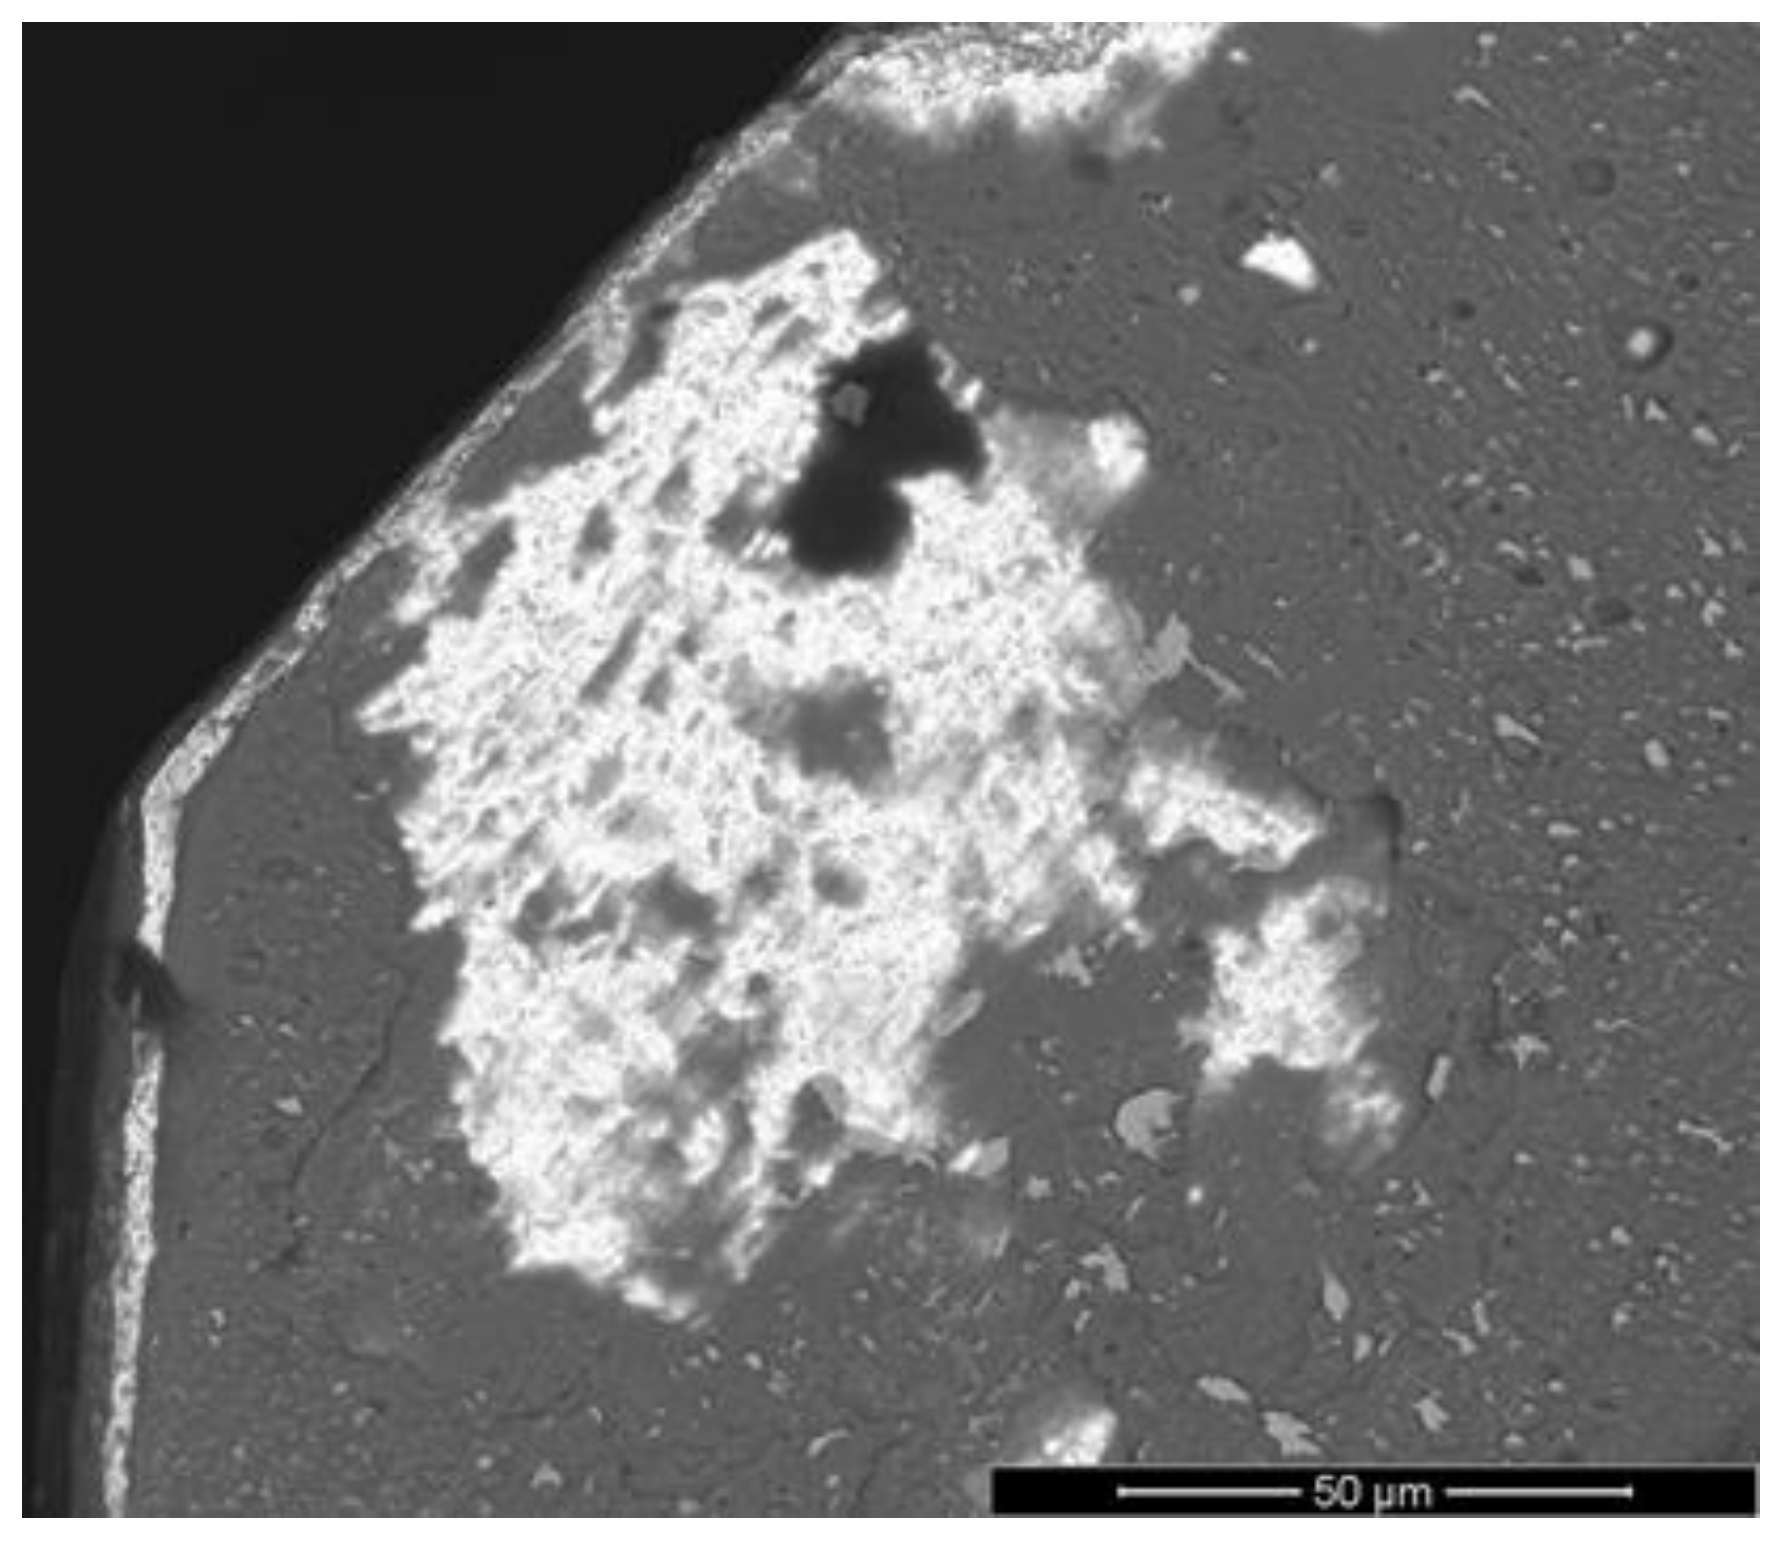
3.5.4. T4—Wear Mechanism Analysis
3.6. Summary of the Analyses’ Results
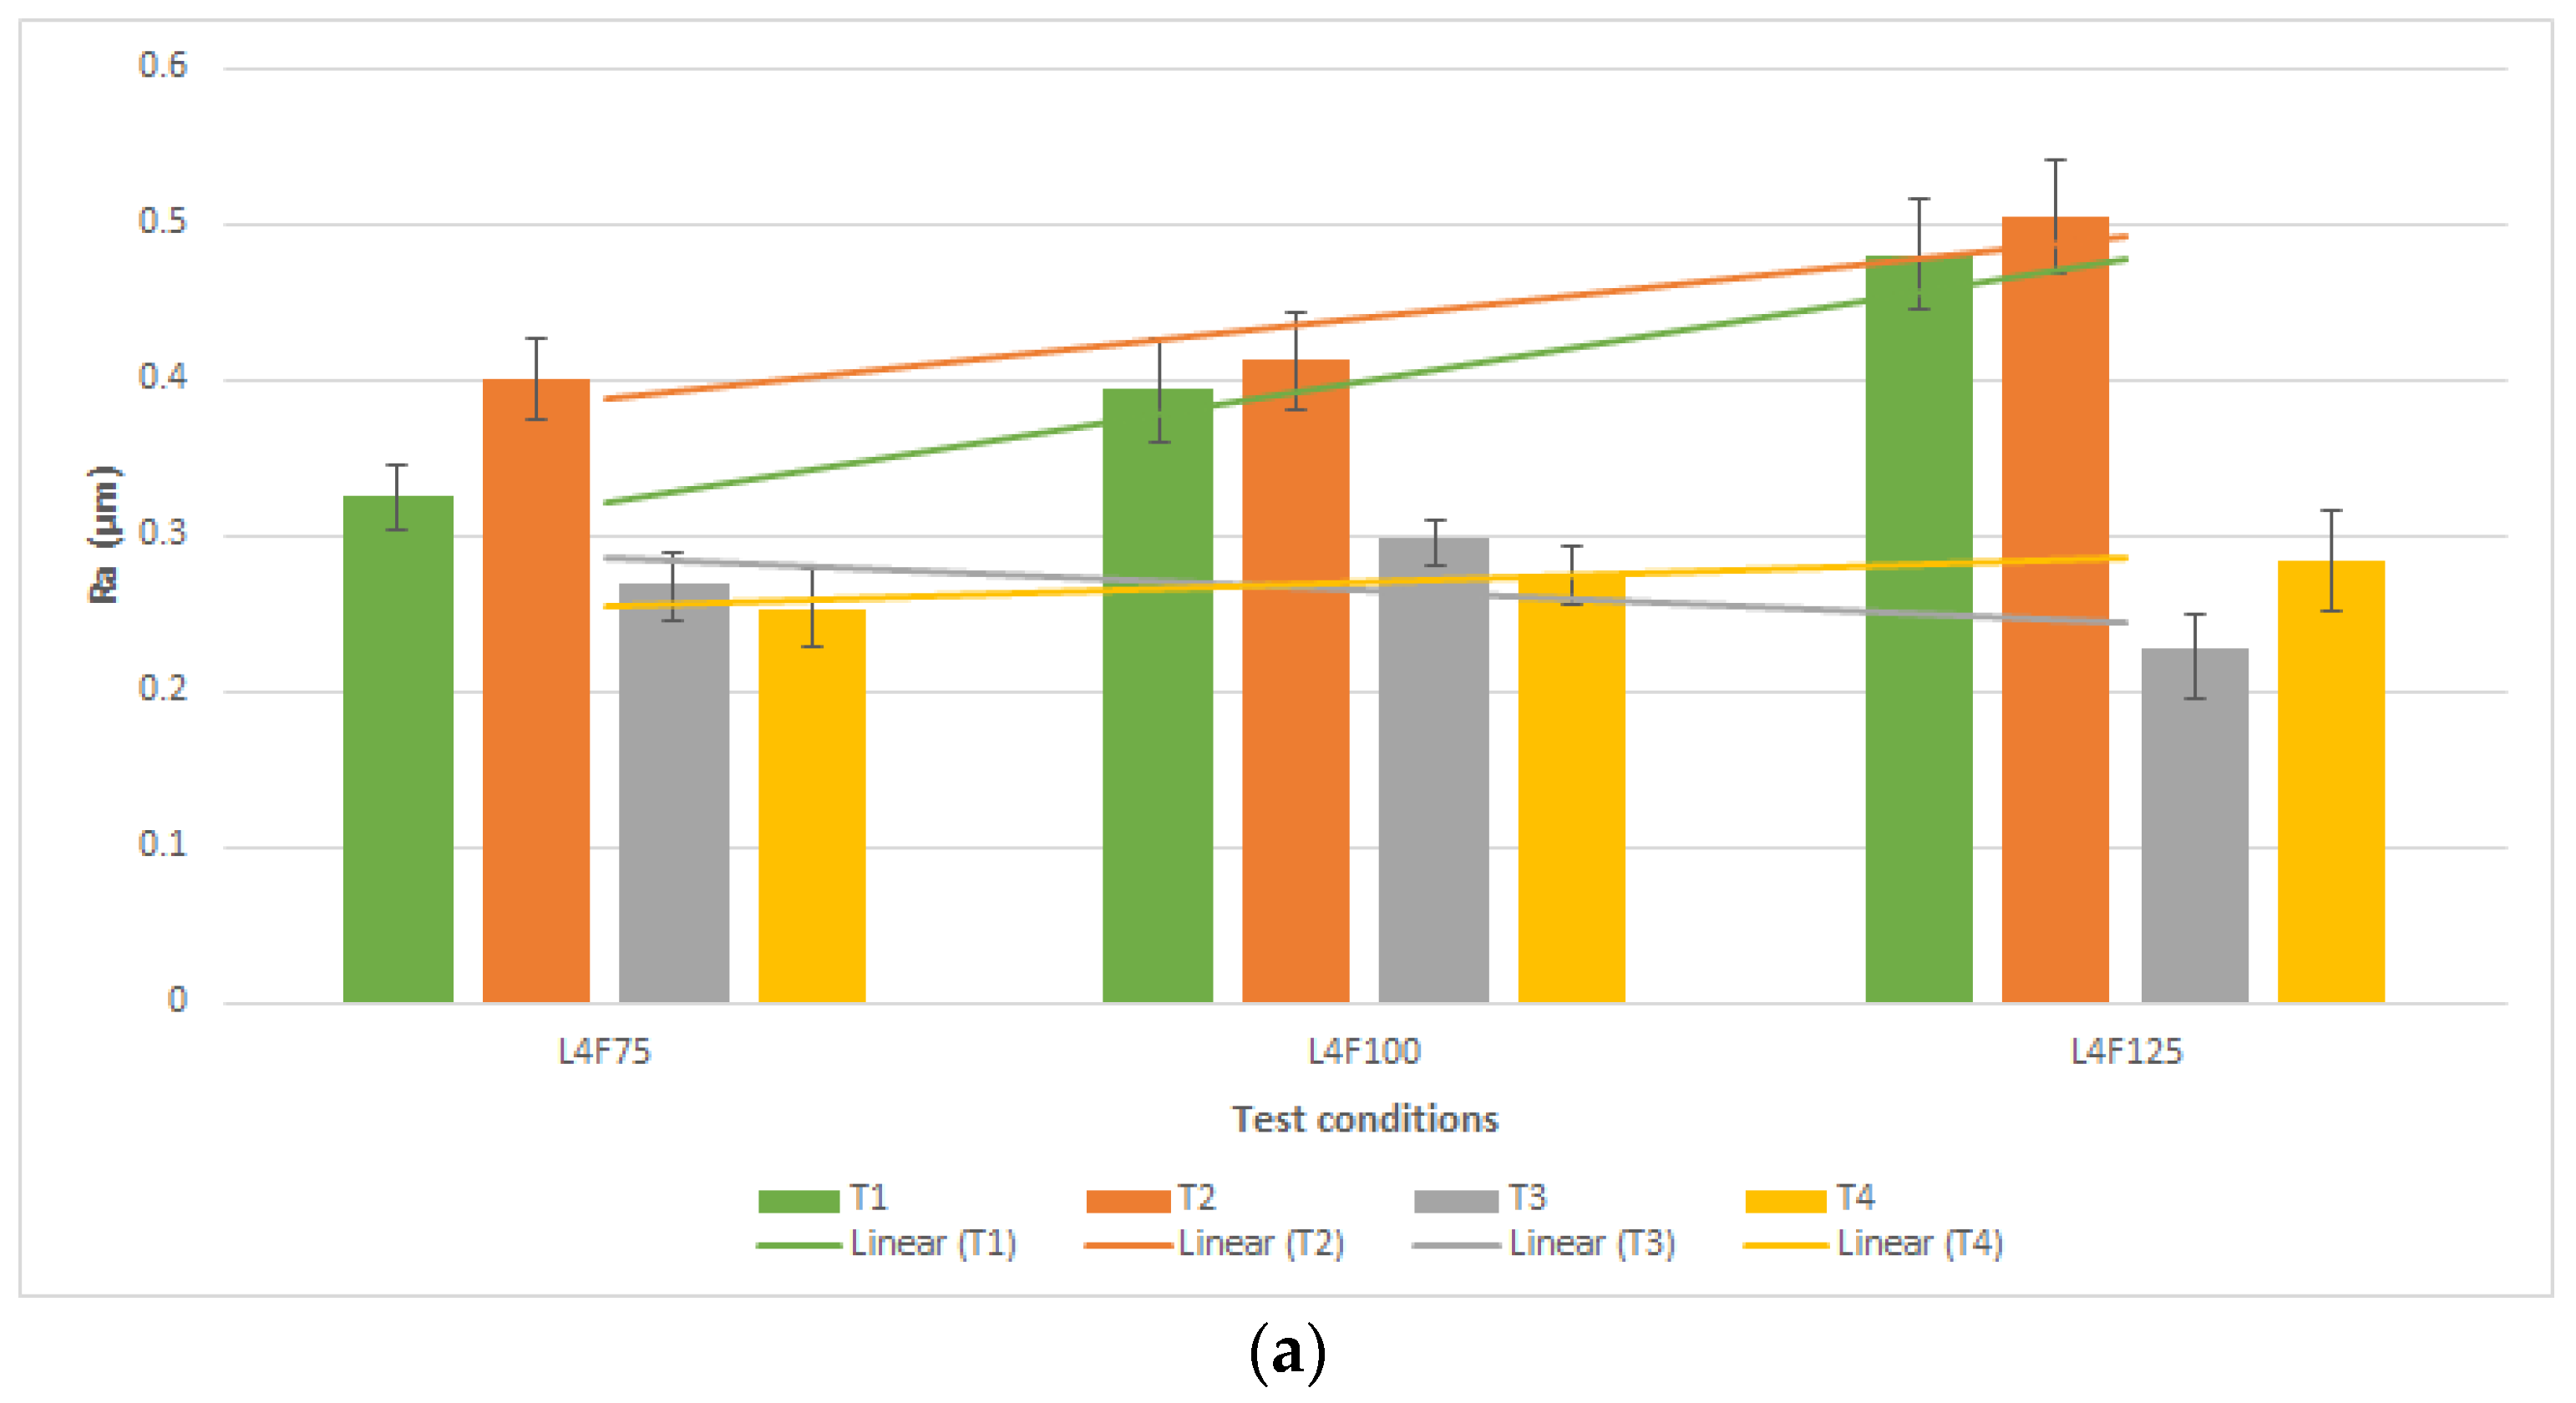
3.6.1. Surface Roughness Analysis Summary
3.6.2. Flank Wear Measurement Summary
3.6.3. Wear Mechanism Analysis Summary
4. Conclusions
Author Contributions
Funding
Data Availability Statement
Acknowledgments
Conflicts of Interest
References
- Cheng, X.; Wang, Y.; Li, X.; Dong, C. Interaction between austein-ferrite phases on passive performance of 2205 duplex stainless steel. J. Mater. Sci. Technol. 2018, 34, 2140–2148. [Google Scholar] [CrossRef]
- Jebaraj, A.V.; Ajaykumar, L.; Deepak, C.R.; Aditya, K.V.V. Weldability, machinability and surfacing of commercial duplex stainless steel AISI2205 for marine applications—A recent review. J. Adv. Res. 2017, 8, 183–199. [Google Scholar] [CrossRef] [PubMed]
- Nomani, J.; Pramanik, A.; Hilditch, T.; Littlefair, G. Chip formation mechanism and machinability of wrought duplex stainless steel alloys. Int. J. Adv. Technol. 2015, 80, 1127–1135. [Google Scholar] [CrossRef]
- Chail, G.; Kangas, P. Super and hyper duplex stainless steels: Structures, properties, and applications. Procedia Struct. Integr. 2016, 2, 1755–1762. [Google Scholar] [CrossRef] [Green Version]
- Nomani, J.; Pramanik, A.; Hilditch, T.; Littlefair, G. Machinability study of first generation duplex (2205), second generation duplex (2507) and austenite stainless steel during drilling process. Wear 2013, 304, 20–28. [Google Scholar] [CrossRef] [Green Version]
- Koyee, R.D.; Heisel, U.; Eisseler, R.; Schmauder, S. Modeling and optimization of turning duplex stainless steels. J. Manuf. Processes 2014, 16, 451–467. [Google Scholar] [CrossRef]
- Gowthaman, P.S.; Jeyakumar, S.; Saravanan, B.A. Machinability and tool wear mechanism of Duplex stainless steel—A review. Mater. Today Proc. 2020, 26, 1423–1429. [Google Scholar] [CrossRef]
- Sahithi, V.V.D.; Malayadrib, T.; Srilatha, N. Optimization of Turning Parameters on Surface Roughness Based on Taguchi Technique. Mater. Today Proc. 2019, 18, 3657–3666. [Google Scholar] [CrossRef]
- Tlhabadira, I.; Daniyan, I.A.; Masu, L.; Van Staden, L.R. Process Design and Optimization of Surface Roughness during M200 TS Milling Process using the Taguchi Method. Procedia CIRP 2019, 84, 868–873. [Google Scholar] [CrossRef]
- Vardhan, M.V.; Sankaraiah, G.; Yohan, M.; Rao, H.J. Optimization of Parameters in CNC milling of P20 steel using Response Surface methodology and Taguchi Method. Mater. Today Proc. 2017, 4, 9163–9169. [Google Scholar] [CrossRef]
- Zhang, J.Z.; Chen, J.C.; Kirby, E.D. Surface roughness optimization in an end-milling operation using the Taguchi design method. J. Mater. Process. Technol. 2007, 184, 233–239. [Google Scholar] [CrossRef]
- Kumar, S.; Saravanan, I.; Patnaik, L. Optimization of surface roughness and material removal rate in milling of AISI 1005 carbon steel using Taguchi approach. Mater. Today Proc. 2019, 22, 654–658. [Google Scholar] [CrossRef]
- Selvaraj, D.P. Optimization of cutting force of duplex stainless steel in dry milling operation. Mater. Today Proc. 2017, 4, 11141–11147. [Google Scholar] [CrossRef]
- Airao, J.; Chaudhary, B.; Bajpai, V.; Khanna, N. An Experimental Study of Surface Roughness Variation in End Milling of Super Duplex 2507 Stainless Steel. Mater. Today Proc. 2018, 5, 3682–3689. [Google Scholar] [CrossRef]
- Policena, M.R.; Devitte, C.; Fronza, G.; Garcia, R.F.; Souza, A.J. Surface roughness analysis in finishing end-milling of duplex stainless steel UNS S32205. Inter. J. Adv. Manuf. Technol. 2018, 98, 1617–1625. [Google Scholar] [CrossRef]
- Sousa, V.F.C.; Silva, F.J.G. Recent Advances in Turning Processes Using Coated Tools—A Comprehensive Review. Metals 2020, 10, 170. [Google Scholar] [CrossRef] [Green Version]
- Sousa, V.F.C.; Silva, F.J.G. Recent Advances on Coated Milling Tool Technology—A Comprehensive Review. Coatings 2020, 10, 235. [Google Scholar] [CrossRef] [Green Version]
- Martinho, R.P.; Silva, F.J.G.; Baptista, A.P.M. Cutting forces and wear analysis of Si3N4 diamond coated tools in high speed machining. Vacuum 2008, 82, 1415–1420. [Google Scholar] [CrossRef] [Green Version]
- Paiva, J.M.F.; Amorim, F.L.; Soares, P.C.; Veldhuis, S.C.; Mendes, L.A.; Torres, R.D. Tribological behavior of superduplex stainless steels against PVD hard coatings on cemented carbide. Inter. J. Adv. Manuf. Technol. 2019, 90, 1649–1658. [Google Scholar] [CrossRef]
- Silva, F.J.G.; Martinho, R.; Andrade, M.; Baptista, A.P.M.; Alexandre, R. Improving the Wear Resistance of Moulds for the Injection of Glass Fibre-Reinforced Plastics Using PVD Coatings: A Comparative Study. Coatings 2017, 7, 28. [Google Scholar] [CrossRef] [Green Version]
- Silva, F.J.G.; Martinho, R.P.; Alexandre, R.J.D.; Baptista, A.P.M. Increasing the wear resistance of molds for injection of glass fiber reinforced plastics. Wear 2011, 271, 2494–2499. [Google Scholar] [CrossRef] [Green Version]
- Silva, F.J.G.; Martinho, R.P.; Baptista, A.P.M. Characterization of laboratory and industrial CrN/CrCn/Diamond-like carbon coatings. Thin Solid Films 2014, 550, 278–284. [Google Scholar] [CrossRef]
- Silva, F.J.G.; Fernandes, A.J.S.; Costa, F.M.; Teixeira, V.; Baptista, A.P.M.; Pereira, E. Tribological behaviour of CVD diamond films on steel substrates. Wear 2003, 255, 846–853. [Google Scholar] [CrossRef]
- Silva, F.J.G.; Fernandes, A.J.S.; Costa, F.M.; Baptista, A.P.M.; Pereira, E. Unstressed PACVD diamond films on steel pre-coated with a composite multilayer. Surf. Coat. Technol. 2005, 191, 102–107. [Google Scholar] [CrossRef]
- Baptista, A.; Silva, F.J.G.; Porteiro, J.; Míguez, J.L.; Pinto, G. Sputtering physical vapour deposition (PVD) coatings: A critical review on process improvement and market trend demands. Coatings 2018, 8, 402. [Google Scholar] [CrossRef] [Green Version]
- Baptista, A.; Silva, F.J.G.; Porteiro, J.; Míguez, J.L.; Pinto, G.; Fernandes, L. On the Physical Vapour Deposition (PVD): Evolution of Magnetron Sputtering Processes for Industrial Applications. Procedia Manuf. 2018, 17, 746–757. [Google Scholar] [CrossRef]
- Martinho, R.P.; Silva, F.J.G.; Martins, C.; Lopes, H. Comparative study of PVD and CVD cutting tools performance in milling of duplex stainless steel. Int. J. Adv. Manuf. Technol. 2019, 102, 2423–2439. [Google Scholar] [CrossRef]
- Ginting, A.; Skein, R.; Cuaca, D.; Herdianto, P.; Masyithah, Z. The characteristics of CVD- and PVD-coated carbide tools in hard turning of AISI 4340. Measurement 2018, 129, 548–557. [Google Scholar] [CrossRef]
- Koseki, S.; Inoue, K.; Morito, S.; Ohba, T.; Usuki, H. Comparison of TiN-coated tools using CVD and PVD processes during continuous cutting of Ni-based superalloys. Surf. Coat. Technol. 2015, 283, 353–363. [Google Scholar] [CrossRef]
- Caliskan, H.; Panjan, P.; Kurbanoglu, C. 3.16 Hard coatings on cutting tools and surface finish. Compr. Mater. Finish. 2017, 230–242. [Google Scholar]
- Paiva, J.M.F.; Torres, R.D.; Amorim, F.L.; Covelli, D.; Tauhiduzzaman, M.; Veldhuis, S.; Dosbaeva, G.; Fox-Rabinovich, G. Frictional and wear performance of hard coatings during machining of superduplex stainless steel. Int. J. Adv. Manuf. Technol. 2017, 92, 423–432. [Google Scholar] [CrossRef]
- Klocke, F.; Krieg, T. Coated tools for metal cutting—Features and applications. CIRP Ann. 1999, 48, 515–525. [Google Scholar] [CrossRef]
- Fernández-Abia, A.I.; Barreiro, J.; Fernández-Larrinoa, J.; de Lacalle, L.N.L.; Fernández-Valdivielso, A.; Pereira, O.M. Behaviour of PVD Coatings in the Turning of Austenitic Stainless Steels. Procedia Eng. 2013, 63, 133–141. [Google Scholar] [CrossRef] [Green Version]
- Vasu, M.; Nayaka, H.S. Investigation of Cutting Force Tool Tip Temperature and Surface Roughness during Dry Machining of Spring Steel. Mater. Today Proc. 2018, 5, 7141–7149. [Google Scholar] [CrossRef]
- Phokobye, S.N.; Daniyan, I.A.; Tlhabadira, I.; Masu, L.; Van Staden, L.R. Model Design and Optimization of Carbide Milling Cutter for Milling Operation of M200 Tool Steel. Procedia CIRP 2019, 84, 954–959. [Google Scholar] [CrossRef]
- Strafford, K.N.; Audy, J. Indirect monitoring of machinability in carbon steels by measurement of cutting forces. J. Mater. Process. Technol. 1997, 67, 150–156. [Google Scholar] [CrossRef]
- Venkatesan, K.; Manivannan, K.; Devendiran, S.; Mathew, A.T.; Ghazaly, N.M.; Aadhavan; Benny, S.M.N. Study of Forces, Surface Finish and Chip Morphology on Machining of Inconel 825. Procedia Manuf. 2019, 30, 611–618. [Google Scholar] [CrossRef]
- Caudill, J.; Schoop, J.; Jawahir, I.S. Numerical Modeling of Cutting Forces and Temperature Distribution in High Speed Cryogenic and Flood-cooled Milling of Ti-6Al-4V. Procedia CIRP 2019, 82, 83–88. [Google Scholar] [CrossRef]
- Fernández-Abia, A.I.; Barreiro, J.; de Lacalle, L.N.L. Behavior of austenitic stainless steels at high speed turning using specific force coefficients. Int. J. Adv. Manuf. Technol. 2012, 62, 505–515. [Google Scholar] [CrossRef]
- Batuev, V.A.; Batuev, V.V.; Ardashev, D.V.; Shipulin, L.V.; Degtyareva-Kashutina, A.S. Analytical Calculation of Cutting Forces and Analysis of their Change at 3-D Milling. Procedia Manuf. 2019, 32, 42–49. [Google Scholar] [CrossRef]
- Davoudinejad, A.; Chiappini, E.; Tirelli, S.; Annoni, M.; Strano, M. Finite Element Simulation and Validation of Chip Formation and Cutting Forces in Dry and Cryogenic Cutting of Ti-6Al-4V. Procedia Manuf. 2015, 1, 728–739. [Google Scholar] [CrossRef] [Green Version]
- Bhopale, S.; Jagatap, K.R.; Lamdhade, G.K.; Darade, P.D. Cutting Forces during Orthogonal Machining Process of AISI 1018 Steel: Numerical and Experimental Modeling. Mater. Today Proc. 2017, 4, 8454–8462. [Google Scholar] [CrossRef]
- Mebrahitom, A.; Choon, W.; Azhari, A. Side Milling Machining Simulation Using Finite Element Analysis: Prediction of Cutting Forces. Mater. Today Proc. 2017, 4, 5215–8521. [Google Scholar] [CrossRef]
- Gouveia, R.; Silva, F.J.G.; Reis, P.; Baptista, A.P.M. Machining duplex stainless steel: Comparative study regarding end mill coated tools. Coatings 2016, 6, 51. [Google Scholar] [CrossRef] [Green Version]
- Ahmed, Y.S.; Paiva, J.; Covelli, D.; Veldhuis, S. Investigation of Coated Cutting Tool Performance during Machining of Super Duplex Stainless Steels through 3D Wear Evaluations. Coatings 2017, 7, 127. [Google Scholar] [CrossRef] [Green Version]
- Dos Santos, A.G.; da Silva, M.B.; Jackson, M.J. Tungsten carbide micro-tool wear when micro milling UNS S32205 duplex stainless steel. Wear 2018, 414–415, 109–117. [Google Scholar] [CrossRef]
- Diniz, A.E.; Machado, A.R.; Corrêa, J.G. Tool wear mechanisms in the machining of steels and stainless steels. Int. J. Adv. Manuf. Technol. 2016, 87, 3157–3168. [Google Scholar] [CrossRef]
- Silva, F.; Martinho, R.; Martins, C.; Lopes, H.; Gouveia, R. Machining GX2CrNiMoN26-7-4 DSS Alloy: Wear Analysis of TiAlN and TiCN/Al2O3/TiN Coated Carbide Tools Behavior in Rough End Milling Operations. Coatings 2019, 9, 392. [Google Scholar] [CrossRef] [Green Version]
- Krolczyk, G.M.; Nieslony, P.; Legutko, S. Determination of tool life and research wear during duplex stainless steel turning. Arch. Civ. Mech. Eng. 2015, 15, 347–354. [Google Scholar] [CrossRef]
- Rajaguru, J.; Arunachalam, N. Coated tool Performance in Dry Turning of Super Duplex Stainless Steel. Procedia Manuf. 2017, 10, 601–611. [Google Scholar] [CrossRef]
- Suárez, A.; de Lacalle, L.N.L.; Polvorosa, R.; Veiga, F.; Wretland, A. Effects of high-pressure cooling on the wear patterns on turning inserts used on alloy IN718. Mater. Manuf. Process. 2017, 32, 678–686. [Google Scholar] [CrossRef]
- ISO 8688-2:1986; Tool Life Testing in Milling—Part 2: End Milling. International Organization for Standardization: Geneva, Switzerland, 1986.
- Leyland, A.; Matthews, A. On the significance of the H/E ratio in wear control: A nanocomposite coating approach to optimised tribological behaviour. Wear 2000, 246, 1–11. [Google Scholar] [CrossRef]
- Beake, B.D. The influence of the H/E ratio on wear resistance of coating systems—Insights from small-scale testing. Surf. Coat. Technol. 2022, 128272. [Google Scholar] [CrossRef]
- Beake, B.D.; Vishnyakov, V.M.; Harris, A.J. Nano-scratch testing of (Ti,Fe)Nx thin films on silicon. Surf. Coat. Technol. 2017, 309, 671–679. [Google Scholar] [CrossRef]
- Sousa, V.F.C.; Silva, F.J.G.; Alexandre, R.; Fecheira, J.S.; Silva, F.P.N. Study of the wear behaviour of TiAlSiN and TiAlN PVD coated tools on milling operations of pre-hardened tool steel. Wear 2021, 476, 203695. [Google Scholar] [CrossRef]


| Tool Ref. | Tool Geometry | Number of Flutes/Edges | Rake Angle | Relief Angle |
|---|---|---|---|---|
| T1 | Flat end-mill | 2 | 30° | 10° |
| T2 | End-mill with a 45° chamfer, 0.08 mm from the cutting edge | 4 | 35° | 10° |
| T3 | Flat end-mill | 4 | 40° | 5° |
| T4 | End-mill with a 0.2 mm corner radius | 4 | 35° | 10° |
| Parameters | TiAlN Coating | TiAlSiN Coating | AlCrN Coating |
|---|---|---|---|
| Deposition time (min.) | 240 | 240 | 240 |
| Reactor gases | Ar+ + Kr + N2 | Ar+ + Kr + N2 | Ar+ + Kr + N2 |
| Target material | 4TiAl 40/60 | 4TiAlSi 38/57/5 | 2Al + 2Cr |
| Pressure (mPa) | 580 | 580 | 580 |
| Temperature (°C) | 450 | 450 | 450 |
| Bias (V) | −110 | −110 | −110 |
| Target current density (A/cm2) | 20 | 20 | 20 |
| Holder rotational speed (rpm) | 1 | 1 | 1 |
| C | Mn | Cu | Cr | Ni | Mo | N |
|---|---|---|---|---|---|---|
| 0.03 | 5.0 | 0.3 | 21.5 | 1.5 | 0.3 | 0.22 |
| Sample | Coating | Cutting Speed | Number of Edges | Feed Rate | Depth of Cut | Radial Depth of Cut | Cutting Length |
|---|---|---|---|---|---|---|---|
| Reference | Type | mm/min | mm/min | mm | mm | m | |
| T1L4F75 | AlCrN | 60 | 2 | 359.25 | 0.08 | 3 | 4 |
| T1L2F75 | AlCrN | 60 | 2 | 359.25 | 0.08 | 3 | 2 |
| T1L4F100 | AlCrN | 60 | 2 | 479 | 0.08 | 3 | 4 |
| T1L2F100 | AlCrN | 60 | 2 | 479 | 0.08 | 3 | 2 |
| T1L4F125 | AlCrN | 60 | 2 | 598.25 | 0.08 | 3 | 4 |
| T1L2F125 | AlCrN | 60 | 2 | 598.25 | 0.08 | 3 | 2 |
| T2L4F75 | TiAlN | 60 | 4 | 359.25 | 0.08 | 3 | 4 |
| T2L2F75 | TiAlN | 60 | 4 | 359.25 | 0.08 | 3 | 2 |
| T2L4F100 | TiAlN | 60 | 4 | 479 | 0.08 | 3 | 4 |
| T2L2F100 | TiAlN | 60 | 4 | 479 | 0.08 | 3 | 2 |
| T2L4F125 | TiAlN | 60 | 4 | 598.25 | 0.08 | 3 | 4 |
| T2L2F125 | TiAlN | 60 | 4 | 598.25 | 0.08 | 3 | 2 |
| T3L4F75 | AlCrN | 60 | 4 | 359.25 | 0.08 | 3 | 4 |
| T3L2F75 | AlCrN | 60 | 4 | 359.25 | 0.08 | 3 | 2 |
| T3L4F100 | AlCrN | 60 | 4 | 479 | 0.08 | 3 | 4 |
| T3L2F100 | AlCrN | 60 | 4 | 479 | 0.08 | 3 | 2 |
| T3L4F125 | AlCrN | 60 | 4 | 598.25 | 0.08 | 3 | 4 |
| T3L2F125 | AlCrN | 60 | 4 | 598.25 | 0.08 | 3 | 2 |
| T4L4F75 | TiAlSiN | 60 | 4 | 359.25 | 0.08 | 3 | 4 |
| T4L2F75 | TiAlSiN | 60 | 4 | 359.25 | 0.08 | 3 | 2 |
| T4L4F100 | TiAlSiN | 60 | 4 | 479 | 0.08 | 3 | 4 |
| T4L2F100 | TiAlSiN | 60 | 4 | 479 | 0.08 | 3 | 2 |
| T4L4F125 | TiAlSiN | 60 | 4 | 598.25 | 0.08 | 3 | 4 |
| T4L2F125 | TiAlSiN | 60 | 4 | 598.25 | 0.08 | 3 | 2 |
| Coating | Thickness (µm) |
|---|---|
| TiAlN | 2.812 ± 0.121 |
| TiAlSiN | 2.799 ± 0.163 |
| AlCrN | 2.965 ± 0.227 |
| Coating | Hardness (H)—GPa | Reduced Young’s Modulus (Er)—GPa | H/E | H3/E2 |
|---|---|---|---|---|
| TiAlN | 22.9 ± 1.2 | 312 ± 9 | 0.073 | 0.123 |
| TiAlSiN | 21.6 ± 0.9 | 266 ± 7 | 0.081 | 0.142 |
| AlCrN | 36.8 ± 2.1 | 335 ± 5 | 0.11 | 0.395 |
| Coating | Ec/Es |
|---|---|
| TiAlN | 0.511 |
| TiAlSiN | 0.435 |
| AlCrN | 0.581 |
| Tool Ref. | Ra (Radial Direction) (µm) | Ra (Tangential Direction) (µm) |
|---|---|---|
| T1L2F75 | 0.193 ± 0.015 | 0.182 ± 0.019 |
| T1L4F75 | 0.325 ± 0.021 | 0.345 ± 0.031 |
| T1L2F100 | 0.219 ± 0.019 | 0.223 ± 0.011 |
| T1L4F100 | 0.394 ± 0.033 | 0.389 ± 0.016 |
| T1L2F125 | 0.254 ± 0.012 | 0.327 ± 0.044 |
| T1L4F125 | 0.481 ± 0.036 | 0.492 ± 0.056 |
| Tool Ref. | Ra (Radial Direction) (µm) | Ra (Tangential Direction) (µm) |
|---|---|---|
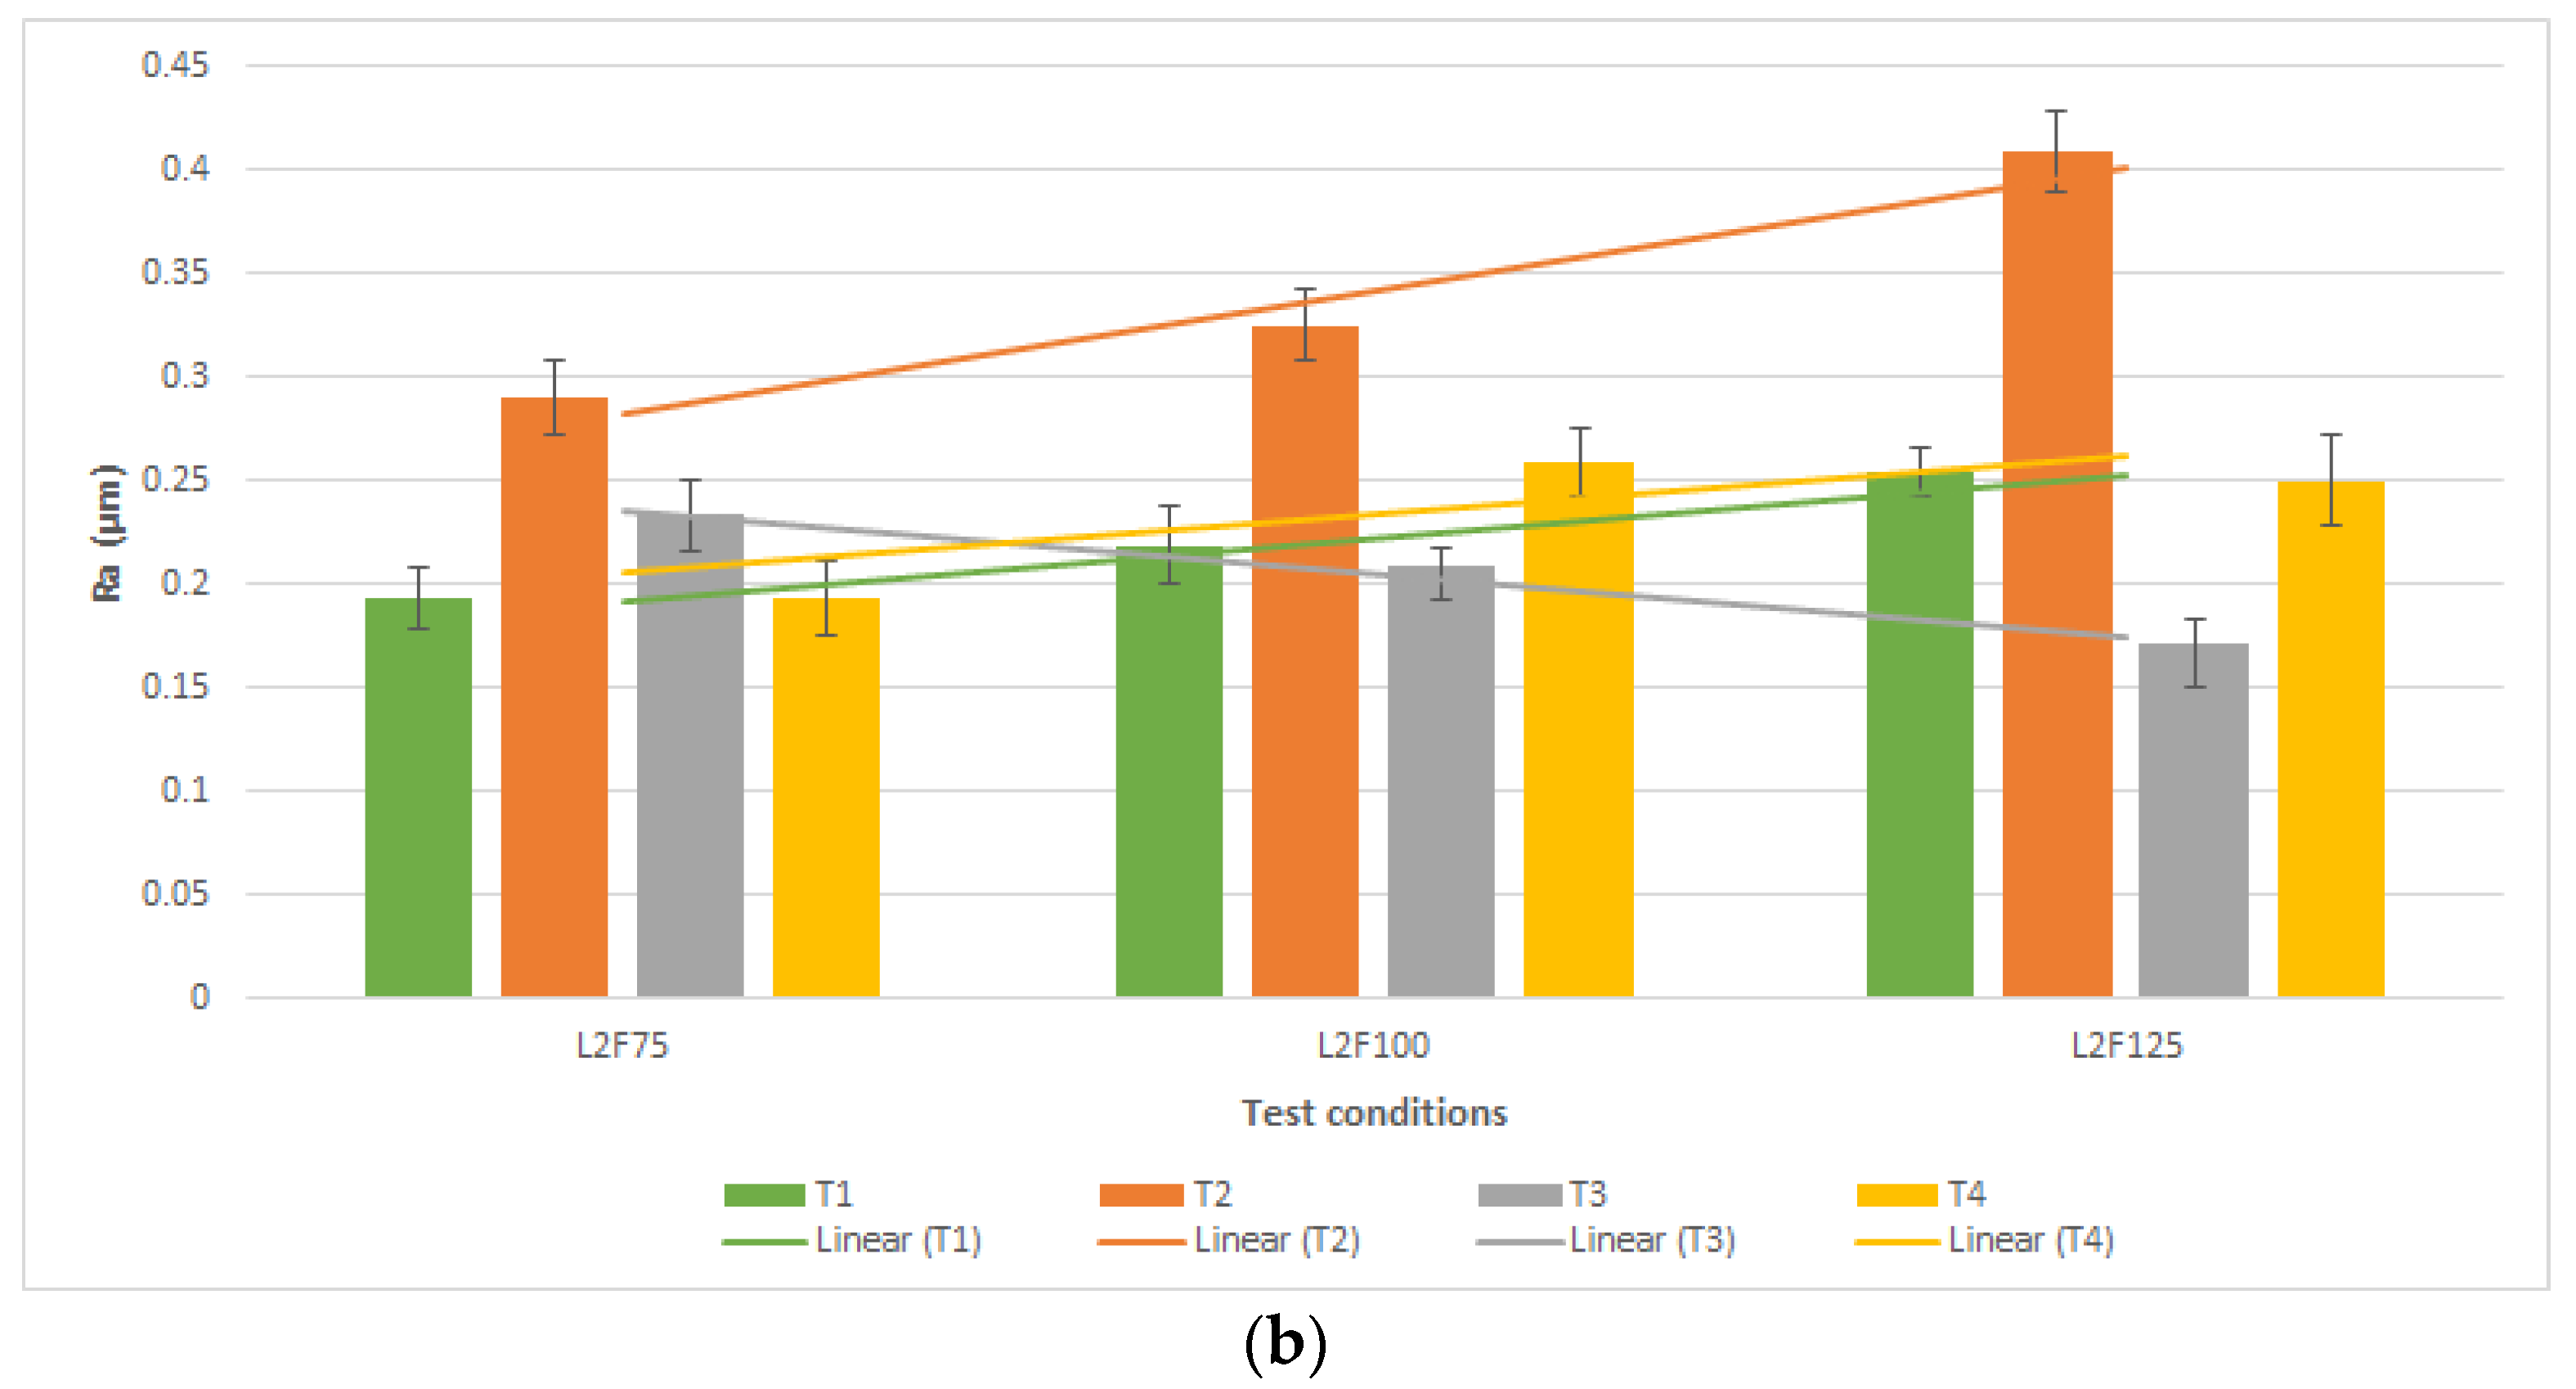
| T2L2F75 | 0.291 ± 0.018 | 0.260 ± 0.012 |
| T2L4F75 | 0.401 ± 0.026 | 0.436 ± 0.021 |
| T2L2F100 | 0.325 ± 0.017 | 0.301 ± 0.015 |
| T2L4F100 | 0.413 ± 0.031 | 0.405 ± 0.026 |
| T2L2F125 | 0.409 ± 0.019 | 0.409 ± 0.014 |
| T2L4F125 | 0.505 ± 0.037 | 0.477 ± 0.022 |
| Tool Ref. | Ra (Radial Direction) (µm) | Ra (Tangential Direction) (µm) |
|---|---|---|
| T3L2F75 | 0.234 ± 0.016 | 0.206 ± 0.013 |
| T3L4F75 | 0.270 ± 0.019 | 0.273 ± 0.029 |
| T3L2F100 | 0.209 ± 0.009 | 0.211 ± 0.021 |
| T3L4F100 | 0.299 ± 0.011 | 0.295 ± 0.031 |
| T3L2F125 | 0.172 ± 0.012 | 0.190 ± 0.012 |
| T3L4F125 | 0.228 ± 0.022 | 0.228 ± 0.025 |
| Tool Ref. | Ra (Radial Direction) (µm) | Ra (Tangential Direction) (µm) |
|---|---|---|
| T4L2F75 | 0.194 ± 0.018 | 0.175 ± 0.011 |
| T4L4F75 | 0.253 ± 0.025 | 0.253 ± 0.018 |
| T4L2F100 | 0.259 ± 0.016 | 0.247 ± 0.011 |
| T4L4F100 | 0.274 ± 0.019 | 0.284 ± 0.016 |
| T4L2F125 | 0.250 ± 0.022 | 0.270 ± 0.014 |
| T4L4F125 | 0.284 ± 0.033 | 0.323 ± 0.021 |
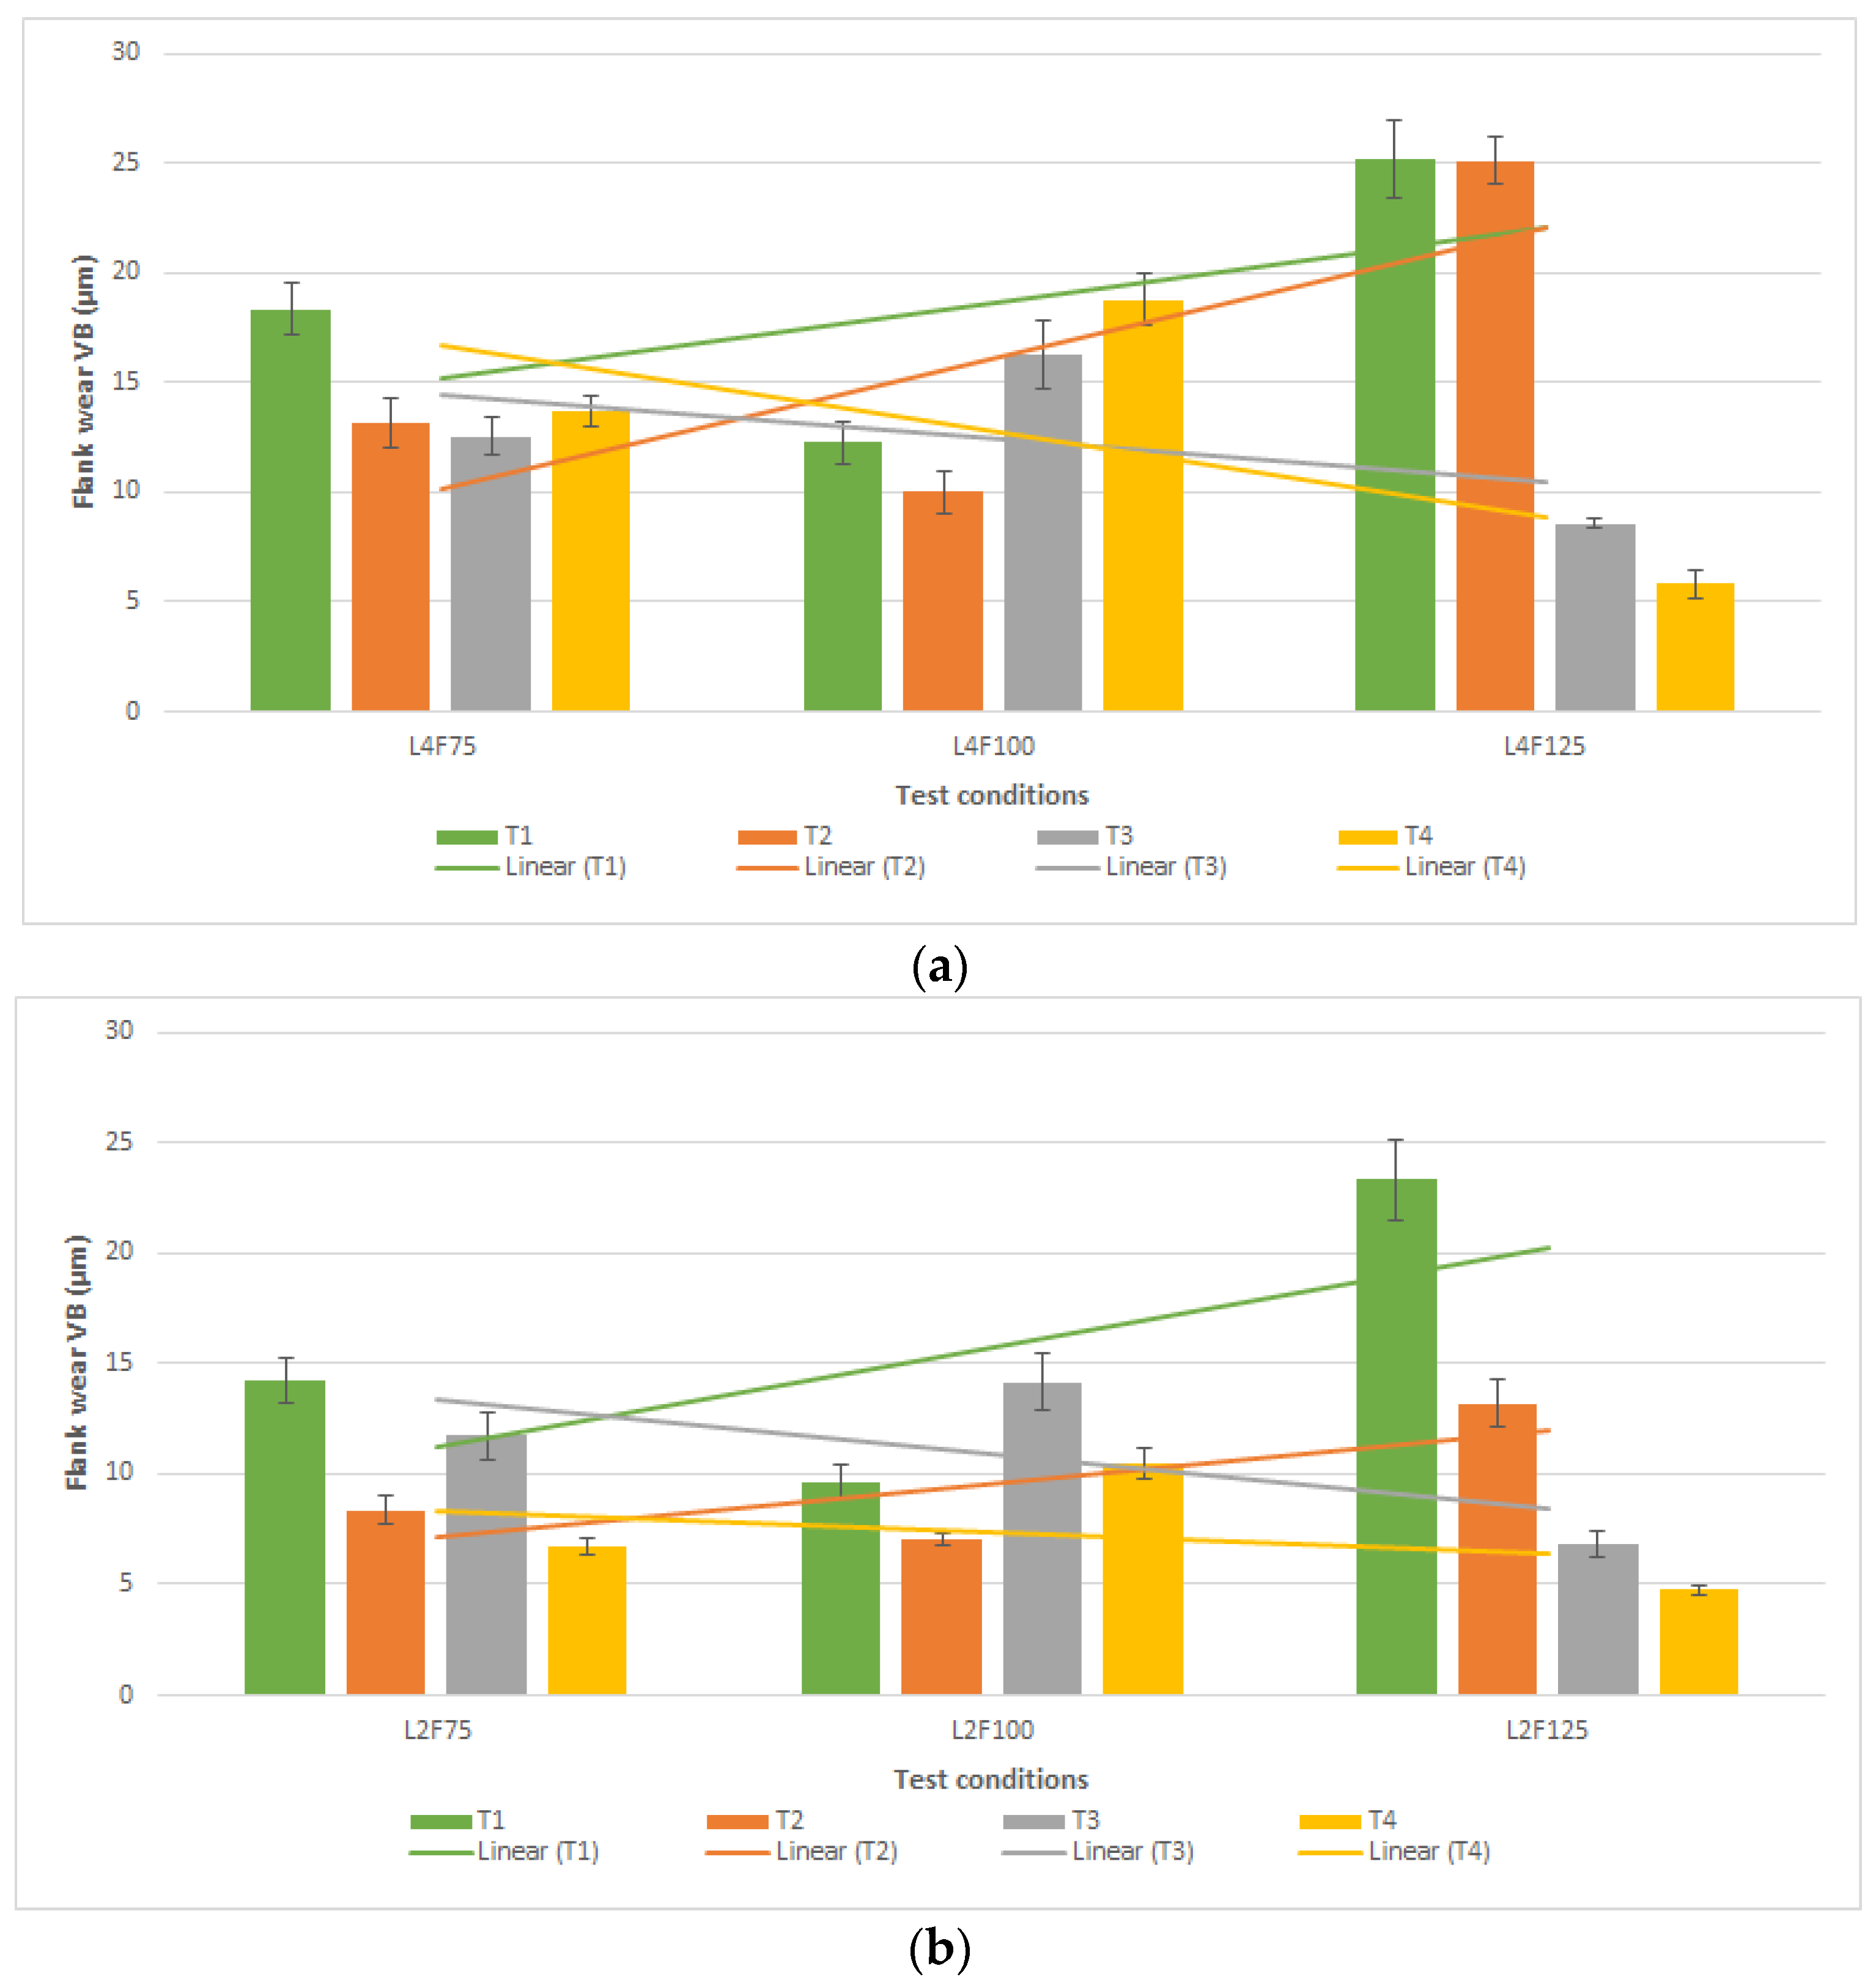
| Tool Ref. | Flank Wear, VB (µm) |
|---|---|
| T1L2F75 | 14.22 ± 1.05 |
| T1L4F75 | 18.34 ± 1.16 |
| T1L2F100 | 9.670 ± 0.78 |
| T1L4F100 | 12.27 ± 0.98 |
| T1L2F125 | 23.32 ± 1.84 |
| T1L4F125 | 25.20 ± 1.76 |
| Tool Ref. | Flank Wear, VB (µm) |
|---|---|
| T2L2F75 | 8.380 ± 0.69 |
| T2L4F75 | 13.18 ± 1.12 |
| T2L2F100 | 7.040 ± 0.24 |
| T2L4F100 | 10.01 ± 0.98 |
| T2L2F125 | 13.21 ± 1.12 |
| T2L4F125 | 25.12 ± 1.05 |
| Tool Ref. | Flank Wear, VB (µm) |
|---|---|
| T3L2F75 | 11.72 ± 1.06 |
| T3L4F75 | 12.54 ± 0.85 |
| T3L2F100 | 14.17 ± 1.26 |
| T3L4F100 | 16.26 ± 1.55 |
| T3L2F125 | 6.820 ± 0.55 |
| T3L4F125 | 8.570 ± 0.19 |
| Tool Ref. | Flank Wear, VB (µm) |
|---|---|
| T4L2F75 | 6.710 ± 0.36 |
| T4L4F75 | 13.71 ± 0.74 |
| T4L2F100 | 10.47 ± 0.66 |
| T4L4F100 | 18.80 ± 1.16 |
| T4L2F125 | 4.770 ± 0.22 |
| T4L4F125 | 5.830 ± 0.65 |
| Tool | SEM Wear Analysis Summary |
|---|---|
| T1 | - Abrasive wear; - Coating delamination; - Coating cracking; - Material adhesion. |
| T2 | - Material adhesion; - Abrasive wear; - Adhesive wear; - Coating delamination; - Coating cracking. |
| T3 | - Material adhesion; - Adhesive wear; - Built-up edge; - Abrasive wear; - Coating delamination. |
| T4 | - Abrasive wear; - Material adhesion; - Adhesive wear; - Coating delamination. |
Publisher’s Note: MDPI stays neutral with regard to jurisdictional claims in published maps and institutional affiliations. |
© 2022 by the authors. Licensee MDPI, Basel, Switzerland. This article is an open access article distributed under the terms and conditions of the Creative Commons Attribution (CC BY) license (https://creativecommons.org/licenses/by/4.0/).
Share and Cite
Sousa, V.F.C.; Silva, F.J.G.; Alexandre, R.; Pinto, G.; Baptista, A.; Fecheira, J.S. Investigations on the Wear Performance of Coated Tools in Machining UNS S32101 Duplex Stainless Steel. Metals 2022, 12, 896. https://doi.org/10.3390/met12060896
Sousa VFC, Silva FJG, Alexandre R, Pinto G, Baptista A, Fecheira JS. Investigations on the Wear Performance of Coated Tools in Machining UNS S32101 Duplex Stainless Steel. Metals. 2022; 12(6):896. https://doi.org/10.3390/met12060896
Chicago/Turabian StyleSousa, Vitor F. C., Francisco J. G. Silva, Ricardo Alexandre, Gustavo Pinto, Andresa Baptista, and José S. Fecheira. 2022. "Investigations on the Wear Performance of Coated Tools in Machining UNS S32101 Duplex Stainless Steel" Metals 12, no. 6: 896. https://doi.org/10.3390/met12060896