
Effect of Process Control Agent on Microstructures and High-Temperature Oxidation Behavior of a Nickel-Based ODS Alloy


1
CAS Key Laboratory of Nuclear Materials and Safety Assessment, Institute of Metal Research, Chinese Academy of Sciences, Shenyang 110016, China
2
School of Materials Science and Engineering, University of Science and Technology of China, Shenyang 110016, China
3
Shi-Changxu Innovation Center for Advanced Materials, Institute of Metal Research, Chinese Academy of Sciences, Shenyang 110016, China
*
Authors to whom correspondence should be addressed.
Metals 2022, 12(6), 1029; https://doi.org/10.3390/met12061029
Submission received: 6 May 2022
/
Revised: 10 June 2022
/
Accepted: 13 June 2022
/
Published: 17 June 2022
(This article belongs to the Special Issue High Temperature Corrosion or Oxidation of Metals and Alloys)
Abstract
:Two nickel-based oxide-dispersion-strengthened (ODS) alloys supplemented with different amounts of process control agent (PCA) were prepared. The microstructures including grains and nanometric oxides and the subsequent oxidation behavior of these ODS alloys were investigated. It was found that the distribution of nanometric oxides in the nickel-based ODS alloy is uniform and the grains are refined by adding a proper amount of PCA in the mechanical milling, while the blocking effect on the diffusion of active elements Y, Al and Ti among powders takes place with an excessive amount of PCA, resulting in the precipitation of large-size oxides in local areas of the alloy. After oxidation in air at 1000 °C for 200 h, the oxide scales on the surface of both nickel-based ODS alloys are composed of Cr2O3. As Y-rich oxide particles are precipitated in the matrix, the thickness of the oxide scale is significantly reduced compared with non-ODS alloys. However, due to the influence of grain boundaries on the diffusion of elements, the oxide scale on the surface of an alloy with finer grain size is thicker. The oxidation resistance of ODS alloys strongly depends on the exact manufacturing process.
1. Introduction
Due to the pinning effect of yttrium-rich oxide nanoparticles with high thermal stability on grain boundaries and dislocations, nickel-based oxide-dispersion-strengthened (ODS) alloys exhibit excellent high-temperature strength, thermal fatigue resistance and radiation swelling resistance. They have become candidate materials for space reactor vessels and secondary loop pipelines of gas-cooled nuclear reactors [1,2]. In rather demanding elevated-temperature environments, such as aircraft turbine engines [3], oxidation resistance of nickel-based ODS alloys has also become an important requirement, in addition to mechanical properties. It has been proven that the oxidation resistance of conventional wrought Ni superalloys can be improved by selectively oxidizing chromium to form a continuous Cr2O3 scale [4] and by reducing the growth rate of oxide products [5]. However, compared with wrought Ni superalloys, the research on the oxidation behavior of nickel-based ODS alloy is limited.
In the process of mechanical alloying (MA) by high-energy ball milling, the grinding powders with high toughness and viscosity easily agglomerate and adhere to the grinding media, resulting in the incomplete crushing of particles and thereby leading to the invalid MA of alloy powders. Therefore, some surface-active substances, called process control agents (PCAs), are introduced into the powder mixture in the MA process to reduce agglomeration and adhesion. During studying the mechano-chemical reduction of Cu2O by graphite with and without the addition of stearic acid as a PCA, Sheibani et al. [6] observed that the particle size of Cu was reduced and the hardness of sintered nanopowder samples was improved by the PCA addition. In the synthesis of MoSi2-Al2O3 composite by ball milling of MoO3, Si and Al powder mixtures, Hossein and Saeed [7] found that PCA reduced the incubation period for composite reaction occurrence and decreased the mean crystallite size of products. In contrast, by studying the effects of PCA on the MA process and mechanical properties of L21-Ni50Ti25Al25 alloys, Shi et al. [8] emphasized that the addition of PCA gave rise to a reduction in strength and an increase in full-alloying temperature. On the other hand, the mechanical alloying of matrix powder with yttria particles is a key procedure for producing uniform precipitation of nanometric oxides in the ODS alloy. The addition of PCA has been applied in the MA process of ODS alloy preparation [9,10]. By adding the same amount of stearic acid and ethyl alcohol during ball milling of Fe-20Cr-5.5Al-0.5Ti-0.5Y2O3 powder, Chen and Dong [9] compared the influence of PCAs on the cold welding of powder particles. The use of stearic acid was found to achieve the lowest crystallite size with fine uniform spherical powders and was more effective than ethyl alcohol. In the process of preparing Fe-14Cr-0.4Ti-0.25Y2O3 steels by changing the amount of residual PCA in ball-milled powders and the spark-plasma-sintering temperature, Mihalache et al. [11] found that adding a high quantity of PCA can shorten the ball-milling time, while near theoretical density, high Vickers hardness and fine grain size of ferritic alloy can be achieved with a proper amount of PCA. Obviously, the addition of PCA can significantly change the properties of powder and alloy. Up to now, however, no research has been done on the oxidation resistance of alloys with different amounts of PCA, especially nickel-based ODS alloys.
In this study, the mechanically alloyed powders with different amounts of PCA were prepared and consolidated into nickel-based ODS alloy by hot isostatic pressing (HIP). The influence of PCA on the morphology and distribution of grains and nanometric oxides within the matrix was studied. An isothermal oxidation of these nickel-based ODS alloys was also carried out at the high temperature of 1000 °C. The influence of microstructures of nickel-based ODS alloy on its oxidation behavior is discussed.
2. Materials and Methods
Argon-atomized nickel pre-alloyed powder (≤150 μm), 0.6 wt.% yttria particles (~30 nm) and different amounts of ethanol as a PCA were mechanically milled. As studied in [12], a homogeneous microstructure was obtained in Ni-15Cr-4.5Al-4W-2.5Ti-2Mo-2Ta-0.15Zr-1.1Y2O3 alloy by adding 1.0 wt.% PCA. Therefore, two quantities of PCA, namely 0.5 wt.% as well as 1.5 wt.%, were chosen to be added in the MA process. The detailed procedure of MA is the same as that described in [13]. After a hot isostatic pressing (HIP) treatment at a temperature of 1175 °C and pressure of 150 MPa for 3 h, the alloys supplemented with a small amount of PCA and a high amount of PCA were designated S1 and S2, respectively; the chemical composition of nickel-based ODS alloy, which was measured by PW4400X fluorescence spectrometry (PANalytical B.V., Almelo, The Netherlands), is listed in Table 1.
The as-HIP-treated alloy was used to evaluate high-temperature oxidation resistance, and oxidation testing was carried out at 1000 °C in a furnace with stagnant air for 200 h. After being cut into dimensions of 10 mm × 5 mm × 2 mm, the specimens were ground with SiC abrasive papers up to 2000 grit, mechanically polished with 1.5 μm diamond powder and ultrasonically cleaned with ethanol. In order to obtain the oxidation kinetics curve, the weight measurement was performed at intervals of 5, 20, 50, 100 and 200 h by using a sartorius BP 211D electric balance (SSIL, Beijing, China) with an accuracy of 0.01 mg. The plotted data points of mass gain were based on the average value of three specimens.
The grain distribution in the as-HIP-treated alloy was determined by standard electron backscatter diffraction (EBSD) using an FEI APREO instrument (Thermo Fisher Scientific, Waltham, MA, USA) with Aztec software (Springfield, NJ, USA). The EBSD sample was placed in a scanning electron microscope (SEM) chamber with a specific sample stage at an angle of 70° to the horizontal plane. The step size and acceleration voltage were 50 nm and 15 kV, respectively. The morphology and crystal structure of nanometric oxides in the as-HIP-treated and oxidized specimens were characterized by transmission electron microscopy (TEM) and high-resolution transmission electron microscopy (HRTEM) using FEI Tencnai G2 20 (Thermo Fisher Scientific, Waltham, MA, USA) and FEI Talos F200C (Thermo Fisher Scientific, Waltham, MA, USA), respectively, at an acceleration voltage of 200 kV. The foil specimens with a diameter of 3 mm were punched from the as-HIP-treated and oxidized alloys and mechanically thinned to ~60 μm. The thinned foils were then electro-polished in a TENUPOL 5 twin-jet polisher (Struers, Ballrup, Denmark) with a 10% (in volume) HClO4 and 90% C2H5OH at −20 °C. The element distribution of nanometric oxides in the TEM foil was also measured by scanning electron microscopy using Zeiss Merlin Compact (Carl Zeiss, Oberkochen, Germany) and a Nordlys Nano detector. Similar to TKD detection, TEM foil was placed in the SEM chamber with a specific sample stage at an angle of 25° to the horizontal plane. The step size and acceleration voltage were 2 nm and 30 kV, respectively. The cross-sectional morphology of the oxide scale was analyzed by SEM and related elemental mapping using an FEI APREO instrument. The composition of the oxide scale on the specimens after oxidation was characterized by X-ray diffraction (XRD) using a Rigaku D/max X-ray diffraction meter (Rigaku, Tokyo, Japan) with Cu Kα radiation of λ = 1.54184 Å, voltage of 40 kV, current of 200 mA and step size of 1°/min.
3. Results and Discussion
3.1. Characterization of Microstructures
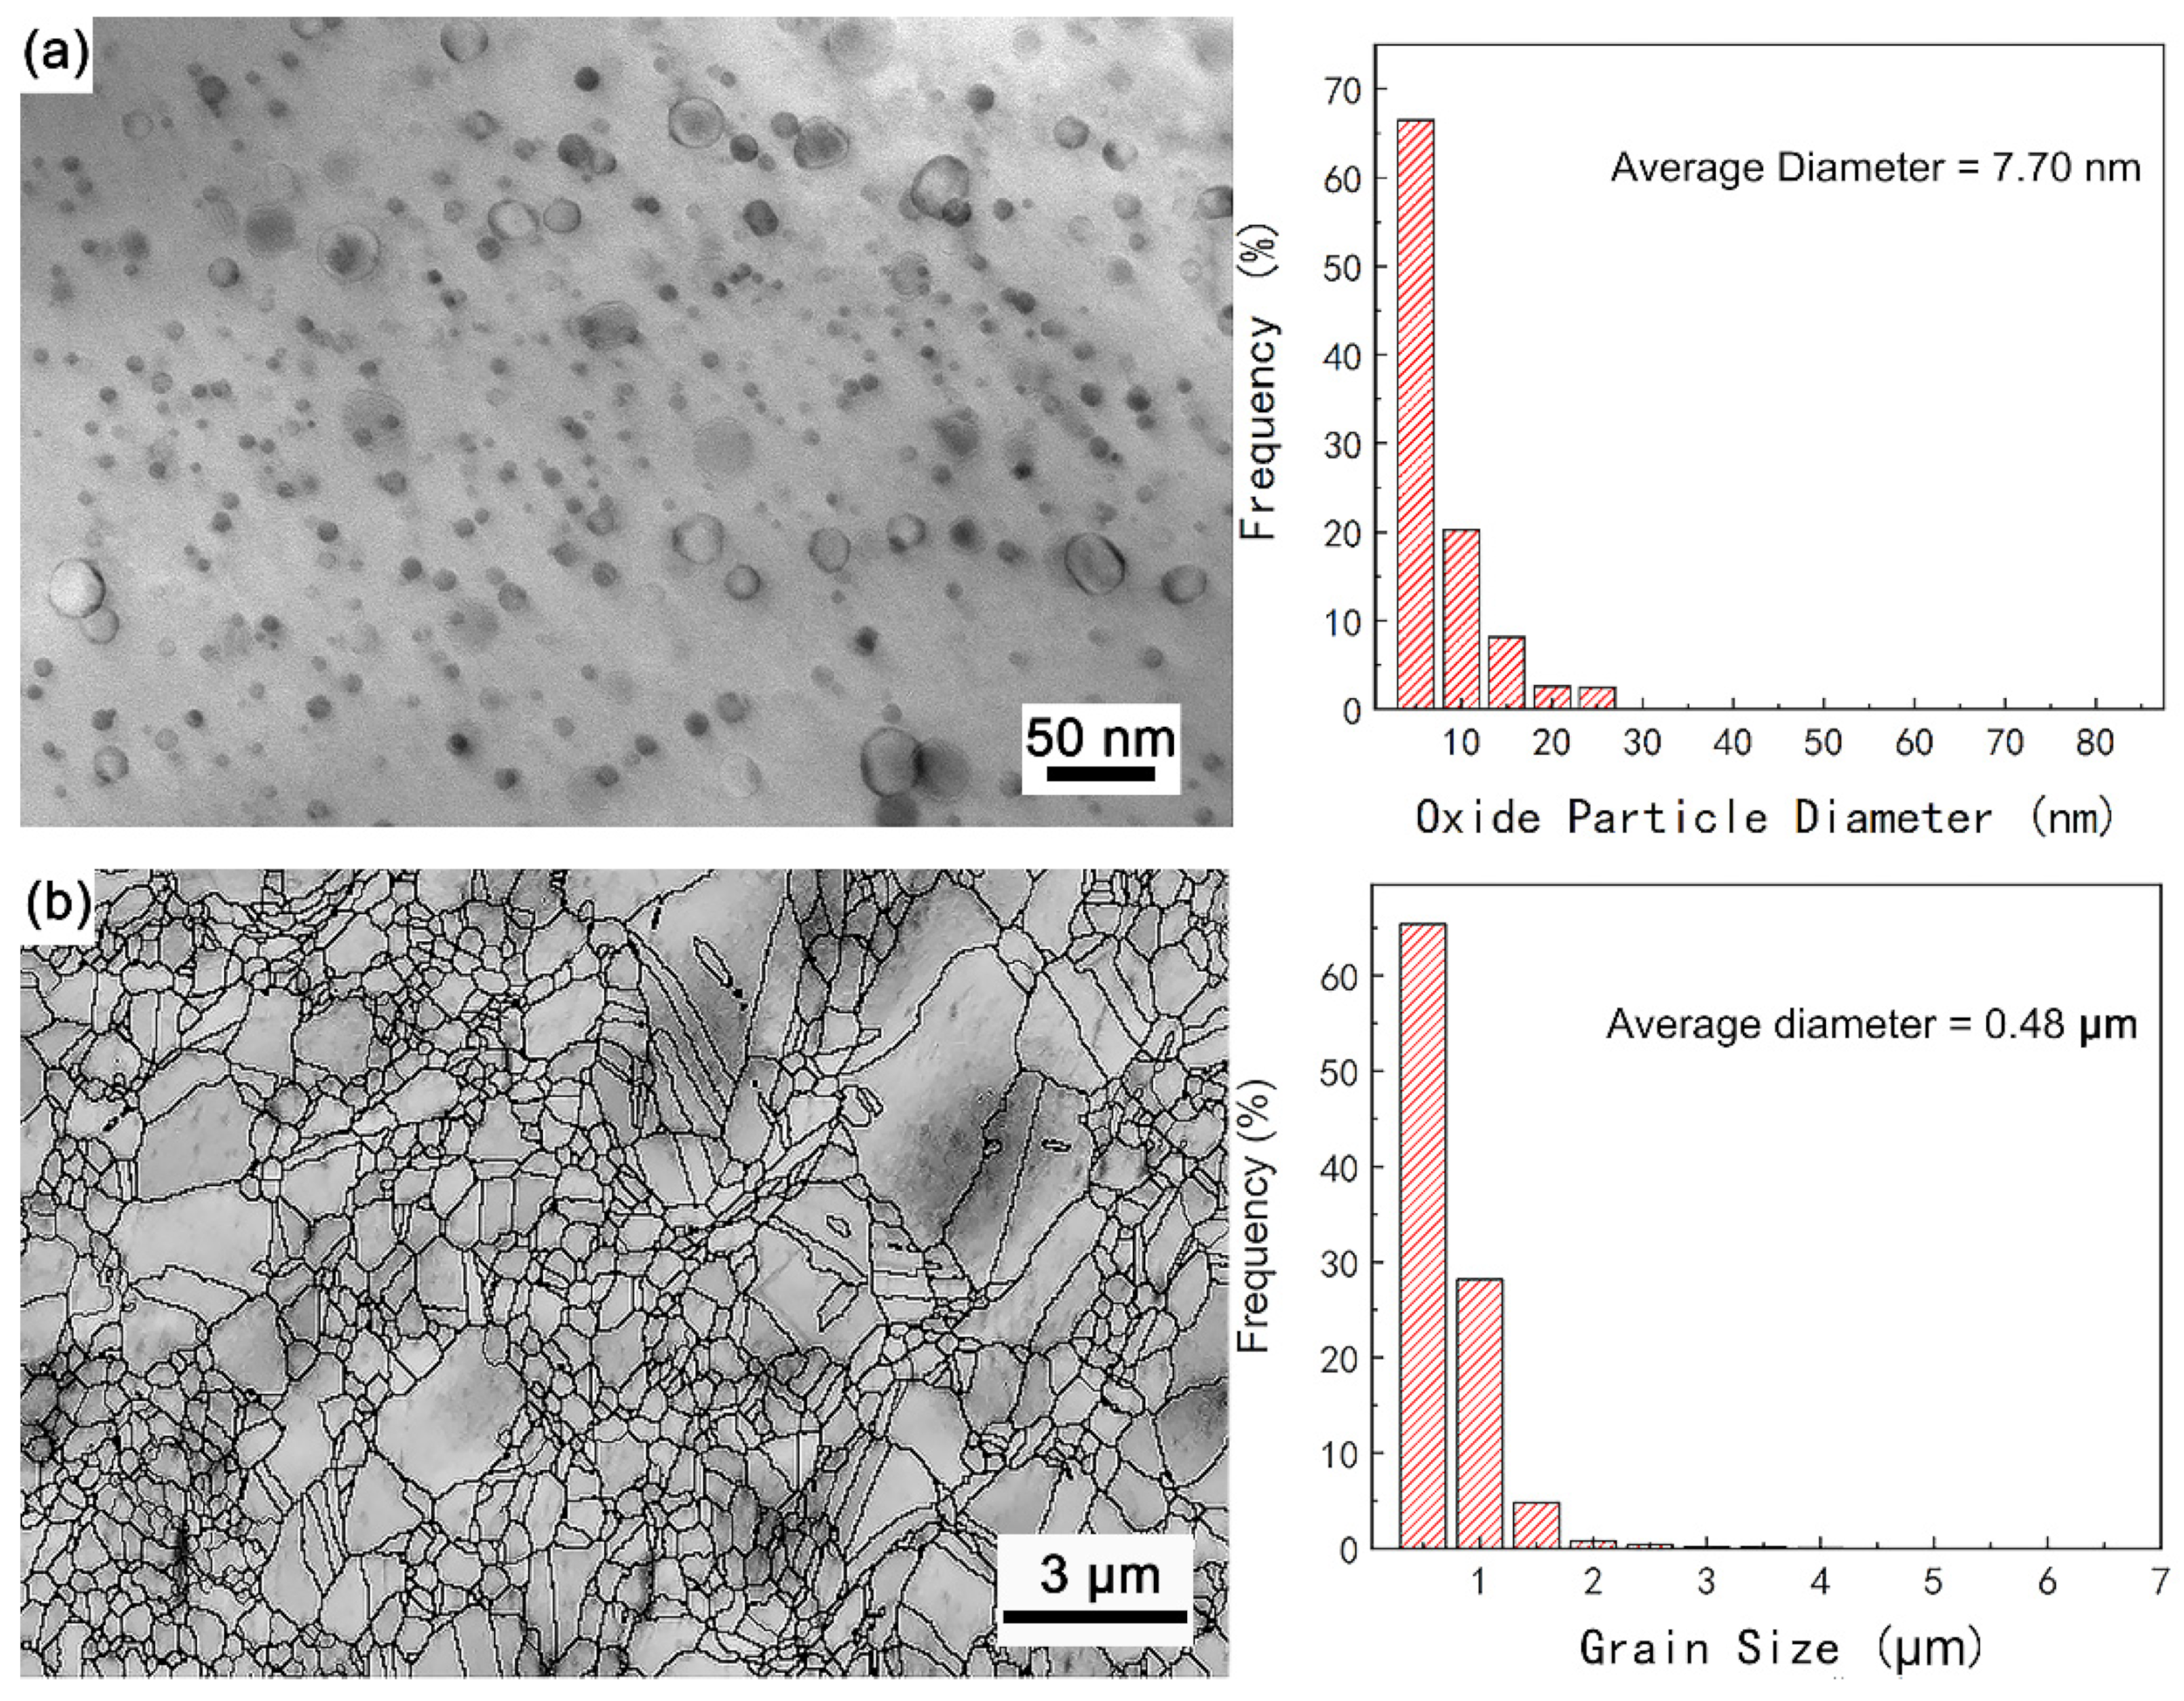
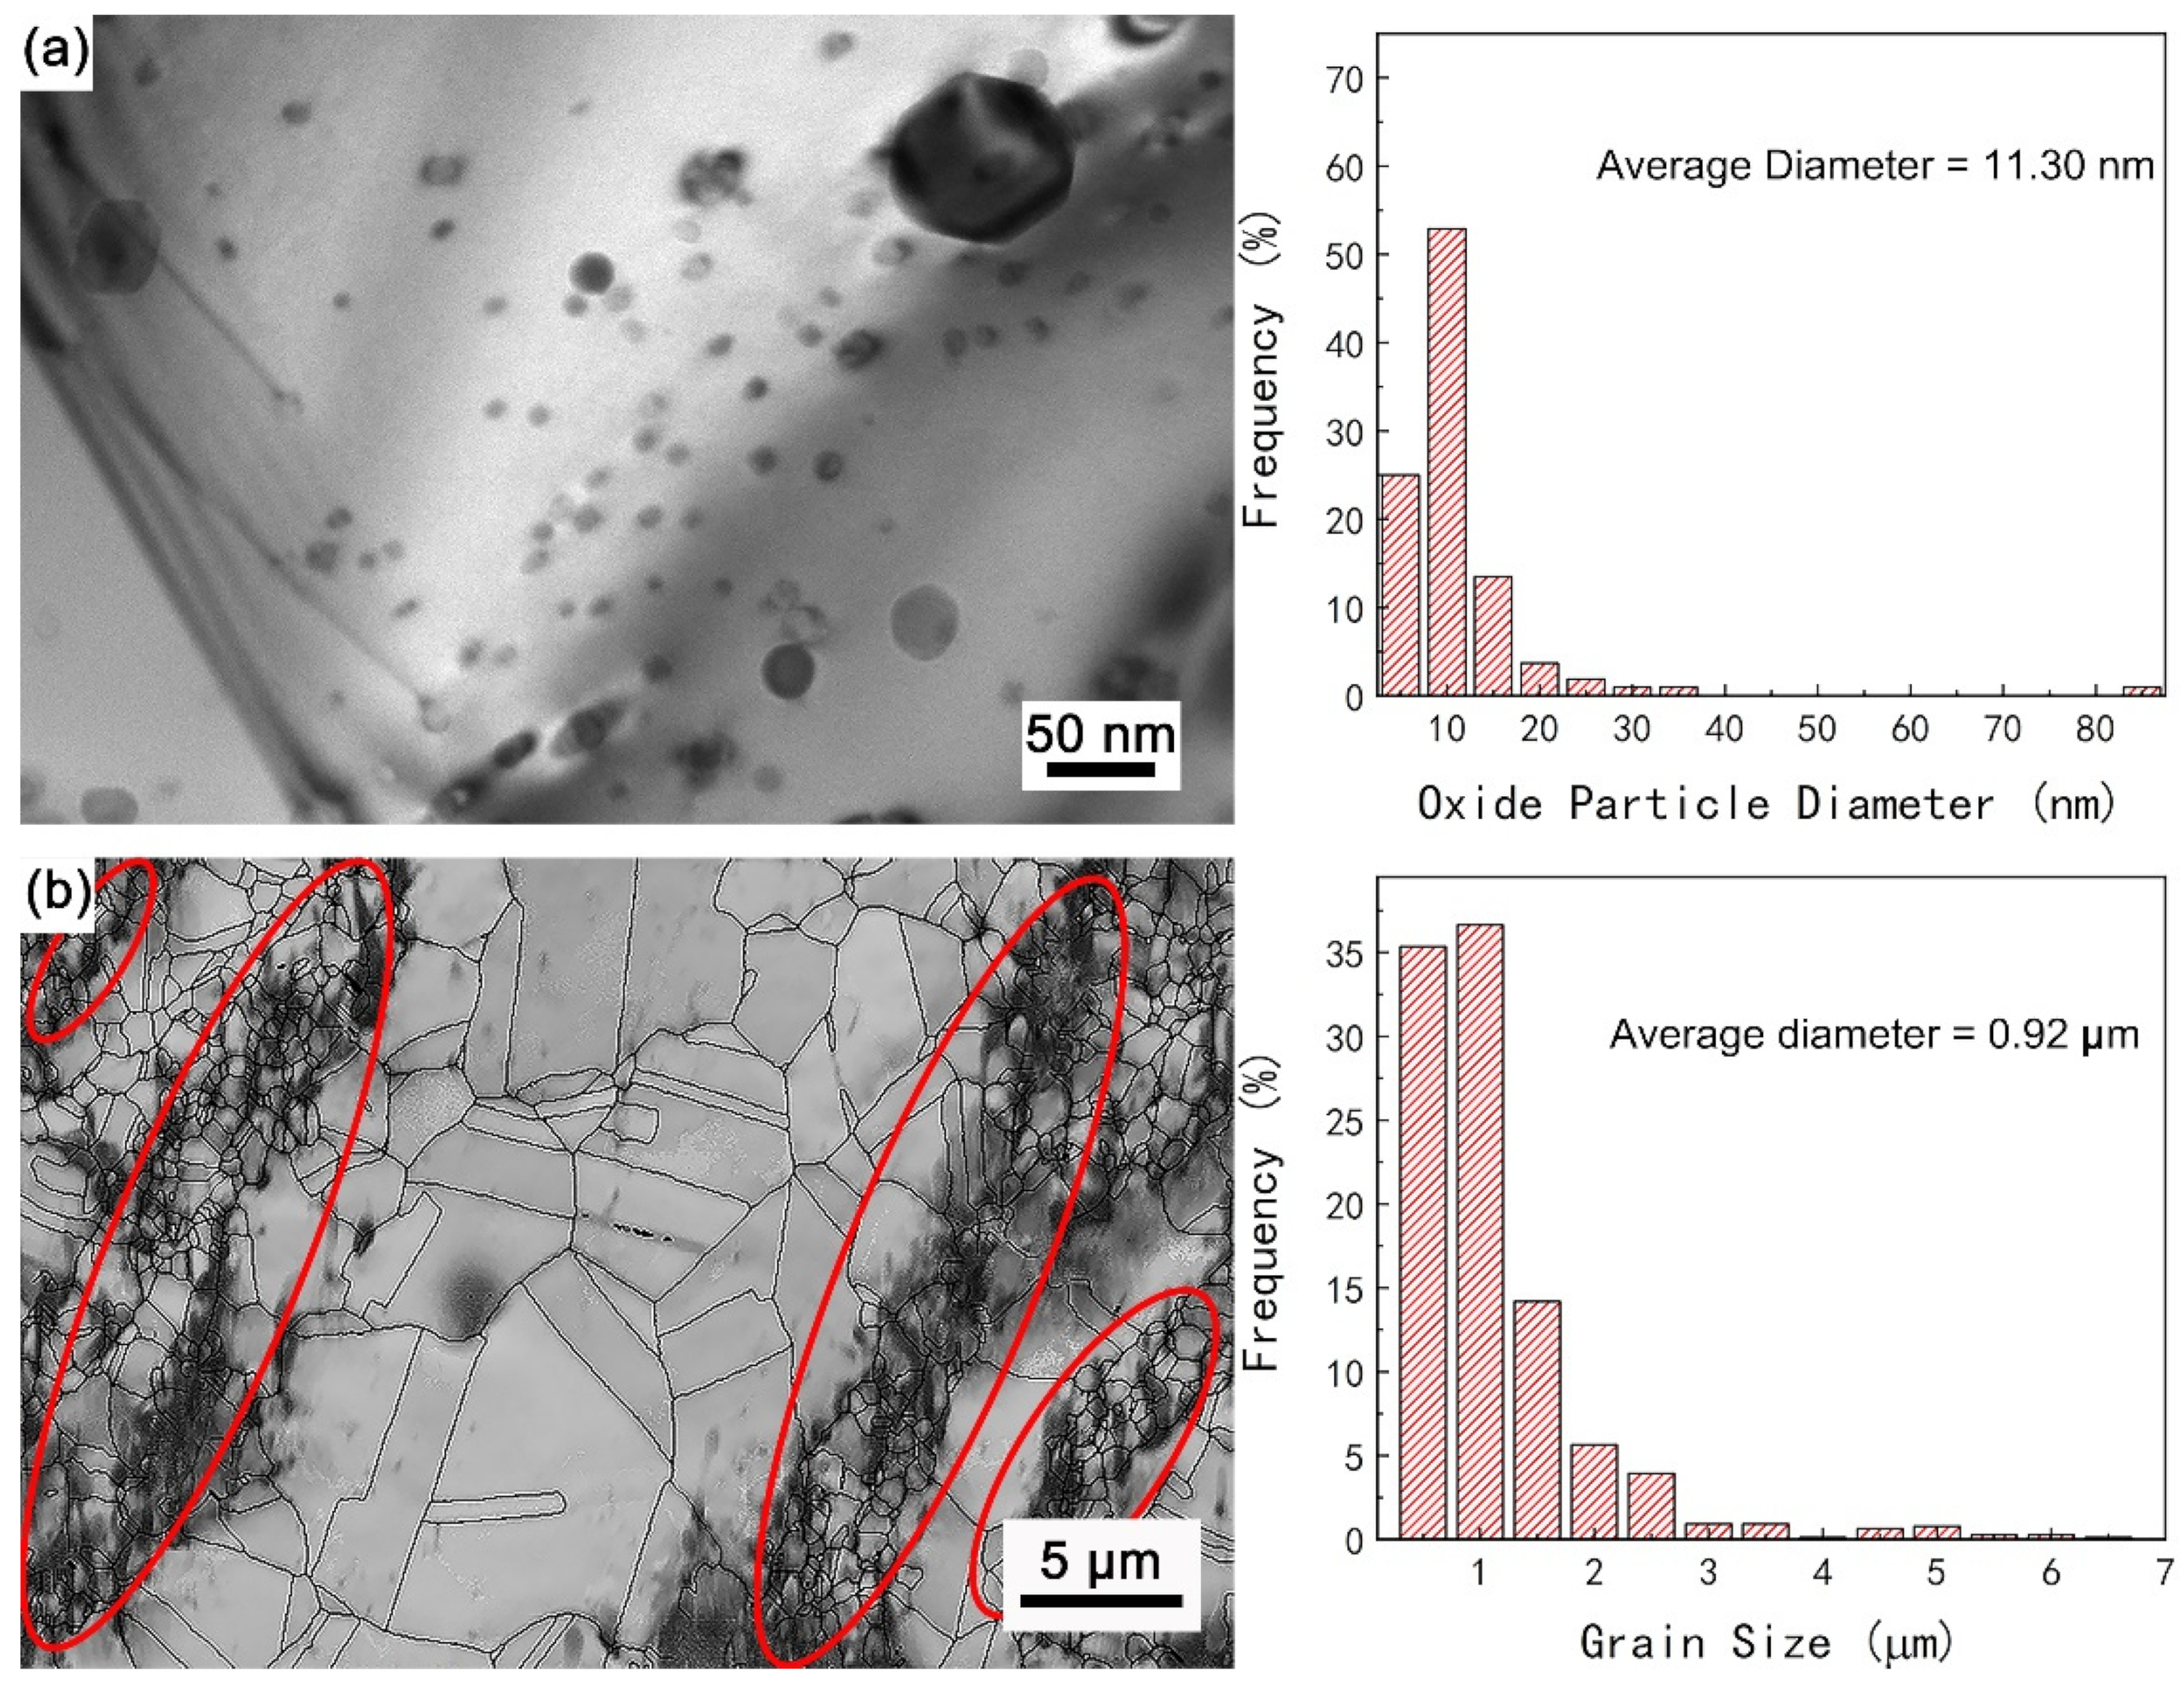
To elucidate the effect of the addition of PCA on the distribution of grains and nanometric oxides, the microstructures of the two as-HIP-treated ODS alloys were characterized. Figure 1 and Figure 2 show the morphology and size distribution of grains and secondary phase oxides in the as-HIP-treated S1 and S2 specimens, respectively. Although the size distribution range of nanoparticles is similar, the uniformity of secondary phase oxides in S1 alloy is significantly higher than that in S2. The number density of oxide nanoparticles listed in Table 2 is 3.42 ± 0.41 × 10²² m−3 for S1 alloy with a low amount of PCA and 7.62 ± 3.8 × 10²¹ m−3 for S2 with a high amount of PCA. It is well known that the greater the number of nanometric oxides is and the more refined the particle size is, the stronger the pinning effect on grain boundaries is. Therefore, the average grain size in the S1 alloy is noticeably smaller, and the grain distribution is more homogeneous, as shown in Figure 1b and Figure 2b. The result indicates that adding approximately 0.5 wt.% PCA into the ball-milled powder is a proper amount to obtain the uniform distribution of oxide nanoparticles in the nickel-based ODS alloy.
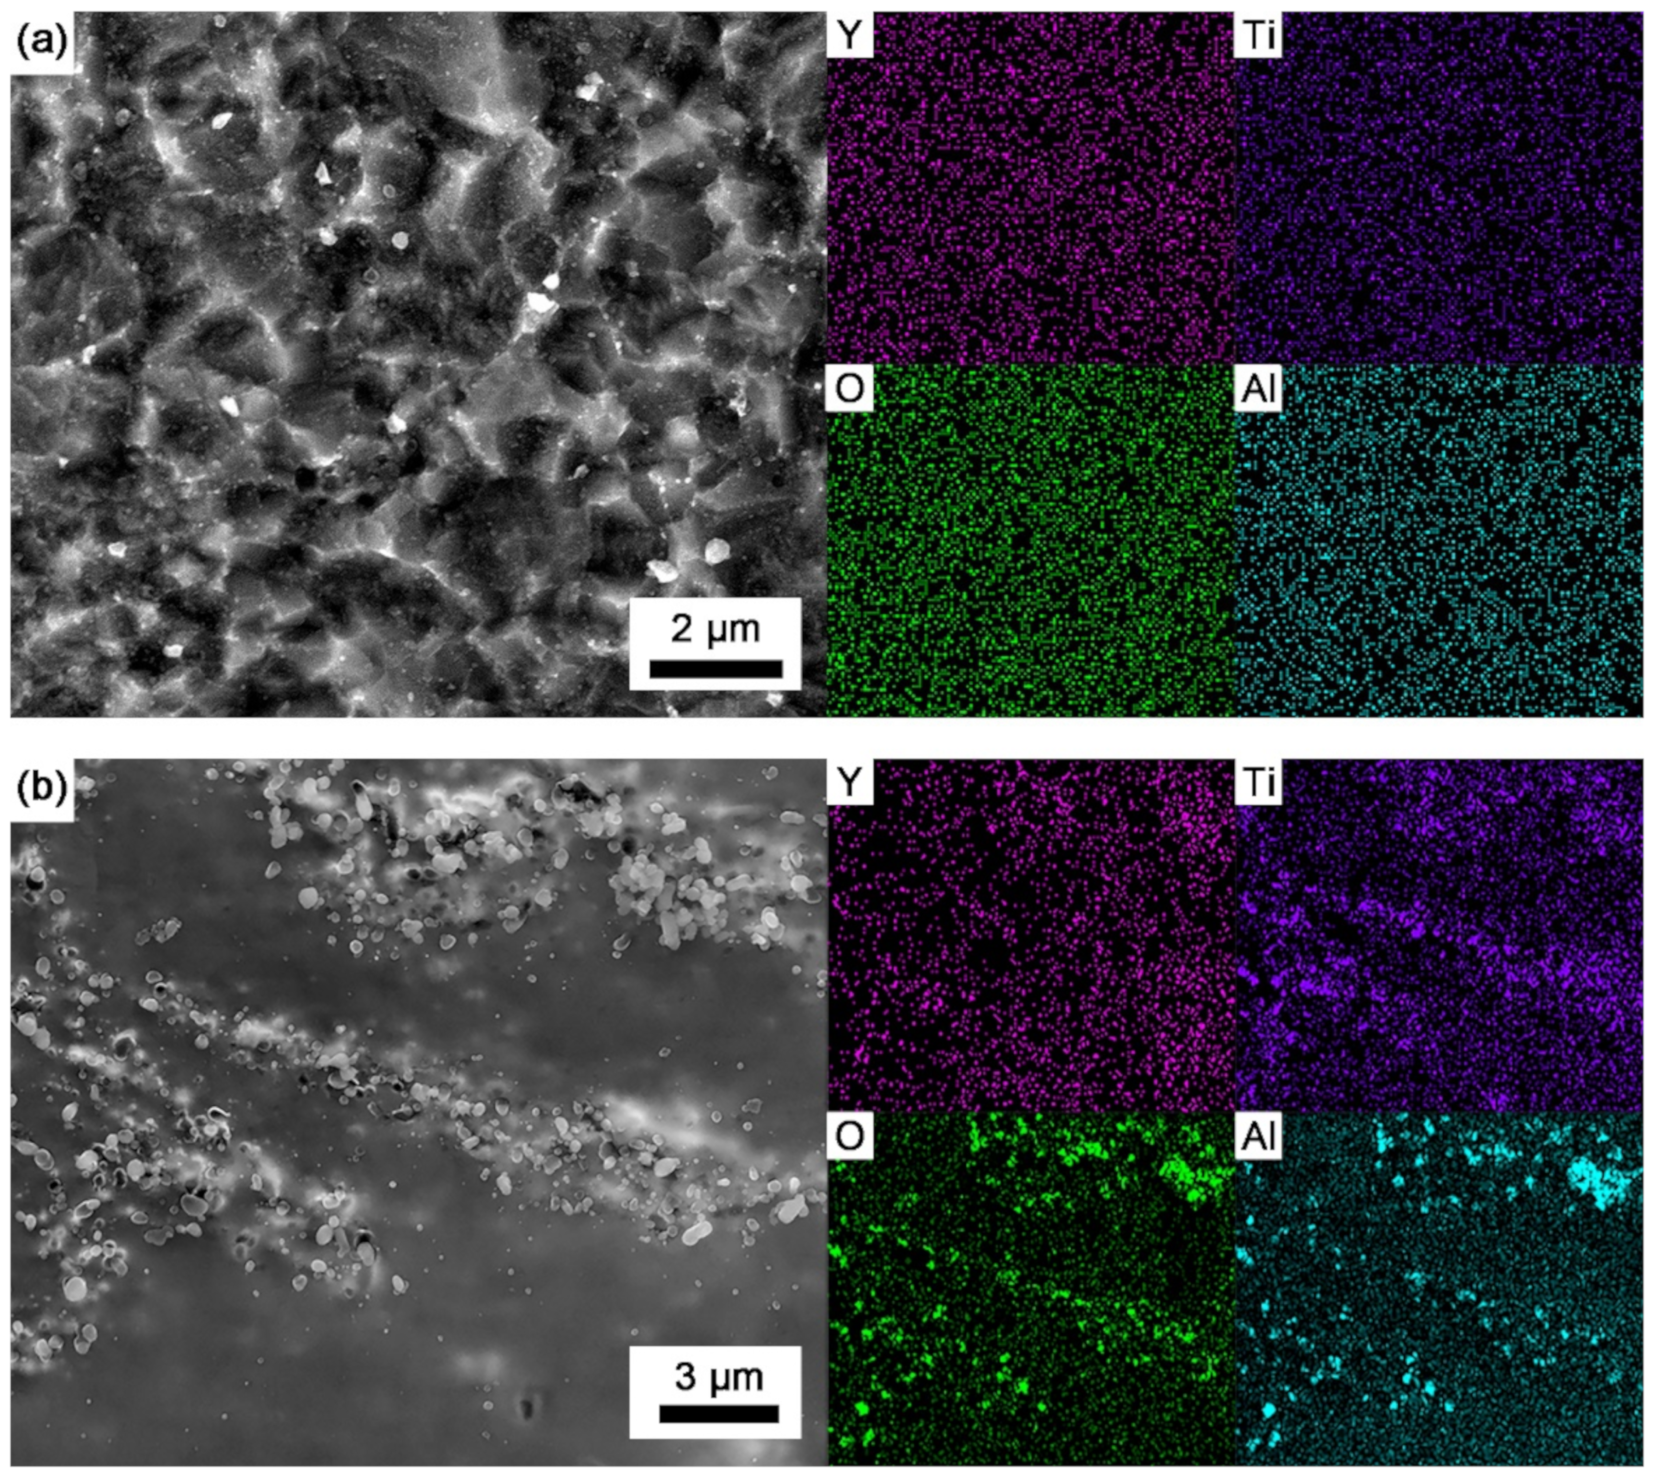
Further, SEM images and corresponding elemental distribution maps displaying multiple nanometric oxides of the as-HIP-treated S1 and S2 alloys are shown in Figure 3. The SEM specimens were prepared in the same way as those for TEM analysis, and the alloy specimen thickness was no more than 150 nm. The chromium, aluminum, titanium and yttrium elements shown in Figure 3a are uniformly distributed in the as-HIP-treated S1. Nevertheless, in Figure 3b, it can be observed that a large number of small oxides enriched in aluminum, titanium or yttrium elements are distributed along a certain direction or a grain boundary, with their sizes ranging from tens of nanometers to hundreds of nanometers. The authors speculate that the nonuniform distribution of secondary phase nanoparticles and grain sizes of S2 in Figure 2 is relevant to these oxides and aggregates.
In a study on L21-Ni50-Ti25-Al25 alloys synthesized by MA, Shi et al. [8] found the nickel, titanium and aluminum elements in the particles were unevenly distributed after mechanical ball-milling. They also found that the MA (PCA) alloy had a full-alloying temperature considerably higher than that without PCA. In the present investigation, the proper amount of PCA promoted the crushing of nickel-based powder and inhibited the cold welding of fractured powder in the MA process during the preparation of the S1 alloy. However, when the amount of PCA increased dramatically, some PCA remained on the surface of the grinding powder. The residual PCA on the powder surface may create a shielding effect, which can hinder the mutual diffusion of active elements aluminum, titanium and yttrium among these particles. Then, the probability that the active elements in the local area react with each other and precipitate in the supersaturated form increased, which resulted in the easy precipitation of a large number of small oxides along the particle interface or grain boundary in the subsequent HIP process, generating the oxide aggregates as shown in Figure 3b.
The crystal structure of secondary phase nanoparticles in each ODS alloy was further determined by HRTEM. Approximately 50 nanoparticles were selected from different fields of view, and their crystal structure was analyzed by fast Fourier transformation (FFT) patterns. The result is also shown in Table 2. In addition to size and distribution, the crystallographic structure of secondary phase oxides in the as-HIP-treated S1 and S2 is also different. This suggests that besides the distribution and size of secondary phase oxides, the chemical composition of oxide nanoparticles is also affected by the addition of PCA. Based on the calculation of the formation enthalpy of the oxides in typical ODS alloys [14], in the absence of aluminum, Y2O3, YTiO3, Y2Ti2O7 and Y2TiO5 can be simultaneously formed by slight changes in the manufacturing process at the expense of yttrium and titanium oxides. Therefore, on the premise that the matrix composition, ball-milling parameter and thermal consolidation parameter of the two nickel-based ODS alloys are the same, the size and chemistry of nanometric oxides in the as-HIP-treated alloys are dependent upon the addition amount of PCA in the process of MA. The aluminum content in these nickel-based alloys is too low (~0.3 wt.%), and Y-Al-O complex oxide nanoparticles are impossible or not easy to generate. Titanium and yttrium elements in S1 powder are rapidly diffused and sufficiently combined with the aid of a proper amount of PCA, and then Y-Ti-O oxide nanoparticles are precipitated during the process of the mechanical milling [12]. On the other hand, the shielding effect caused by excessive addition of PCA promotes the preferential combination of local aluminum and yttrium oxides in the milled powder, and then higher amounts (~46.7%) of Y-Al-O particles are generated in S2.
3.2. Weight Gain
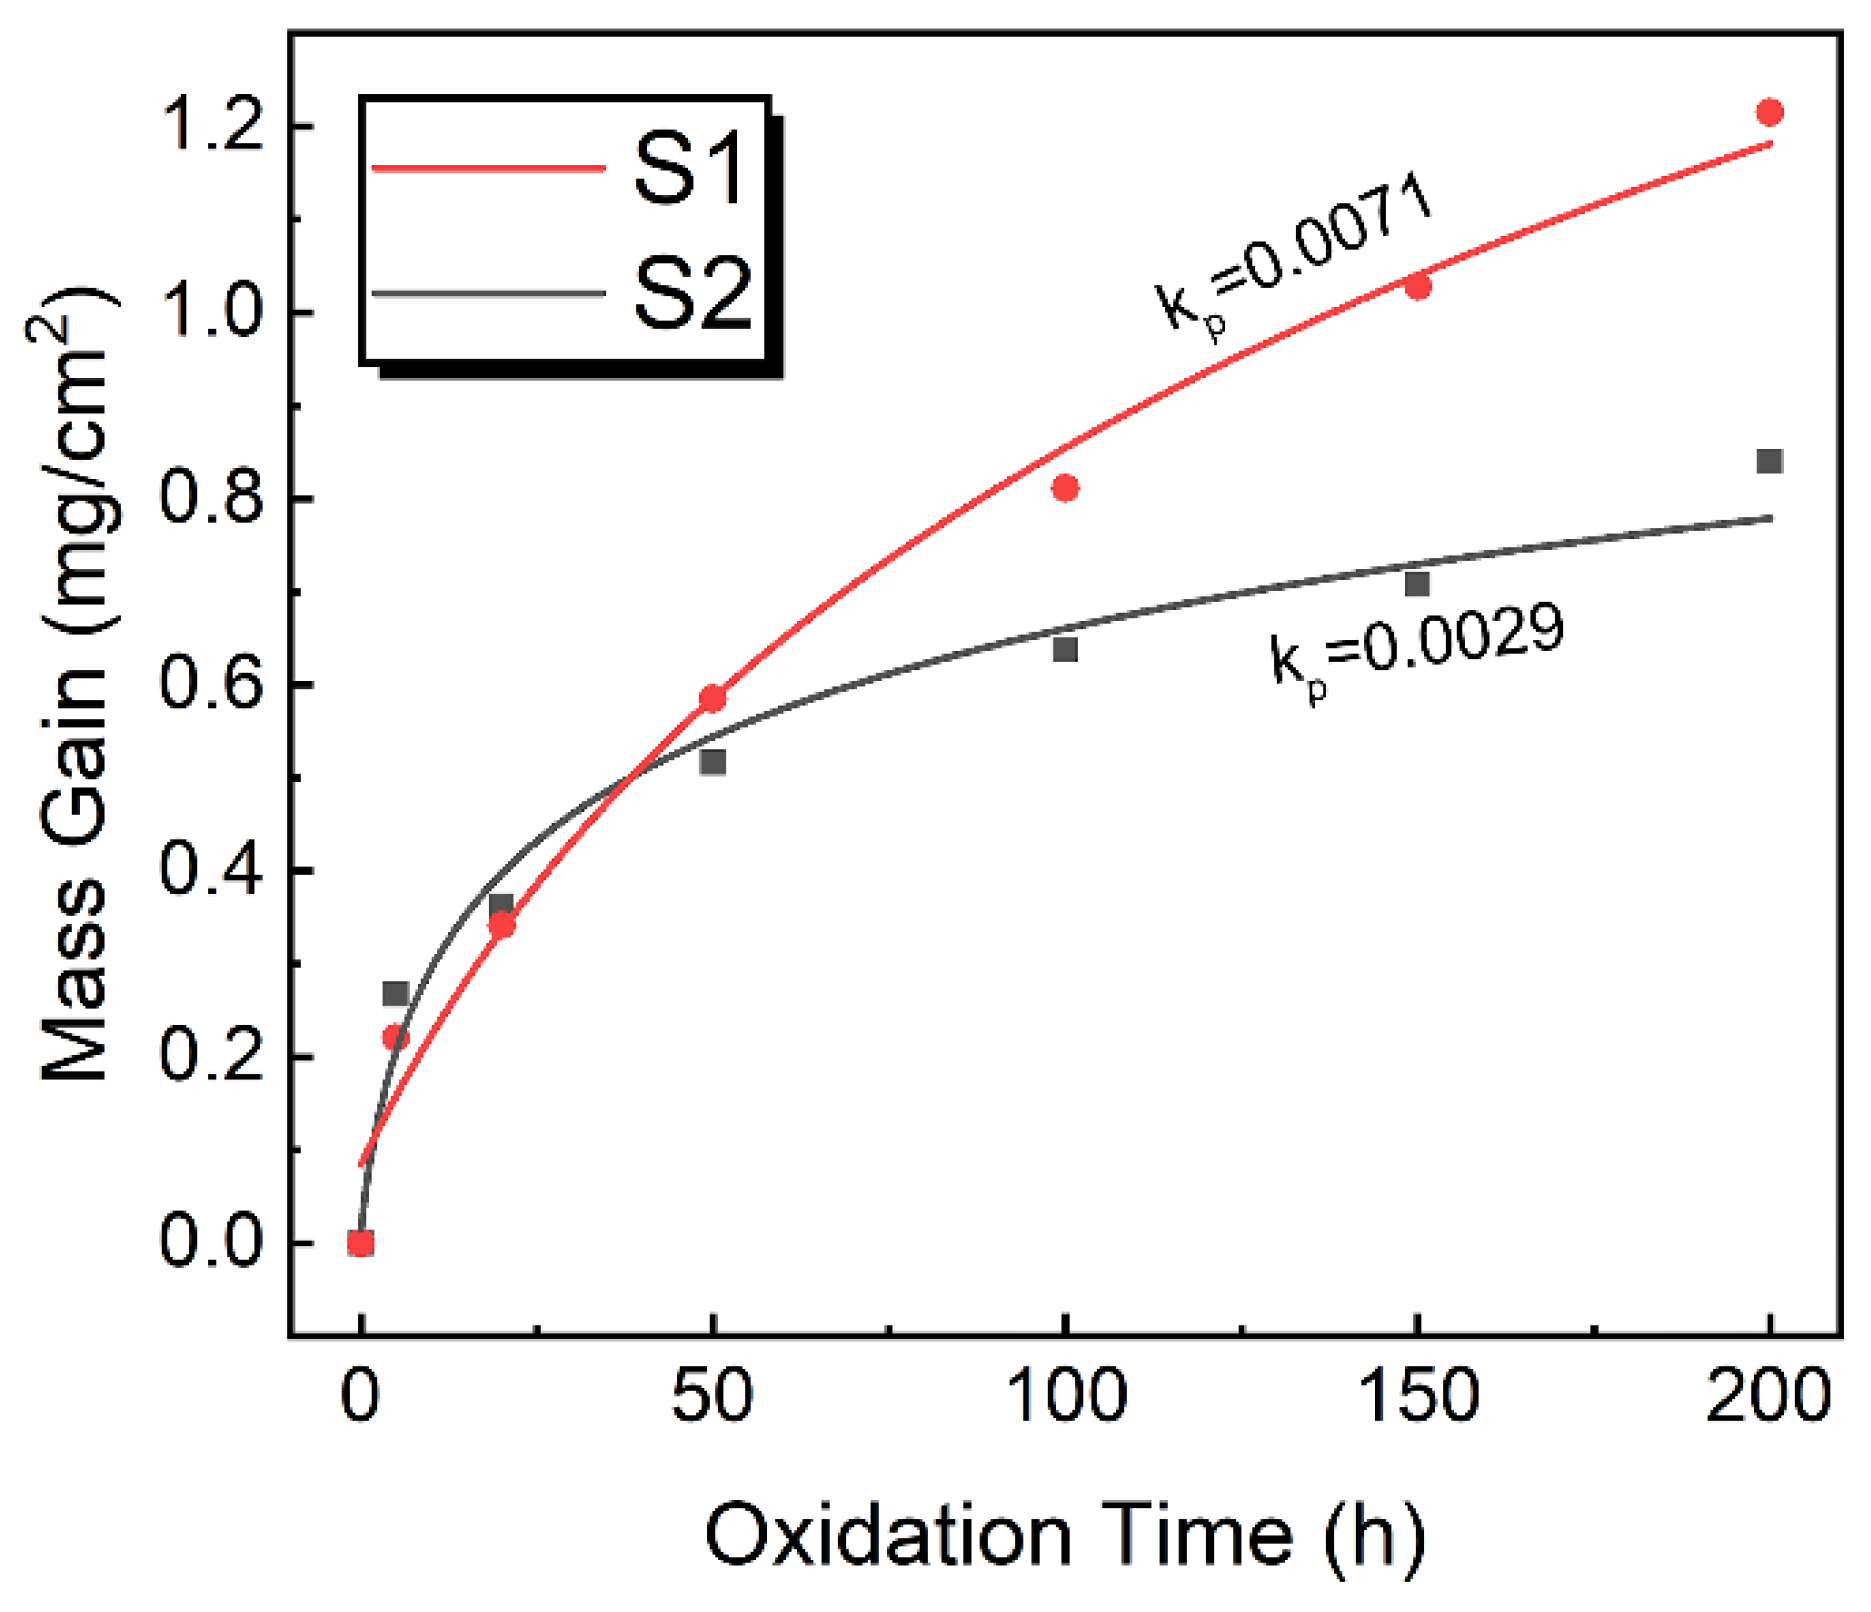
Figure 4 shows the weight gain curves of S1 (with fine grains and dispersed oxide nanoparticles) and S2 (with inhomogeneous grains and sparse oxide nanoparticles) oxidized in air at 1000 °C for up to 200 h. The mass gain per unit area of each specimen increases rapidly in the initial stage of around 50 h and slows down in the subsequent stage of oxidation. These oxidation kinetics curves are fitted with the parabolic law, in which the parabolic rate constant is determined by plotting mass gain versus the square root of time [15], using the following Equation (1):
where ∆m is mass change per unit area, t is oxidation duration, kp is the parabolic rate constant and C is an integration constant. As a result, the parabolic rate constant is 0.0071 mg2·cm−4·h−1 for S1 and 0.0029 mg2·cm−4·h−1 for S2, indicating the enhancement of oxidation resistance in S2. Considering the same alloy composition and fabrication processing, it is believed that the discrepancy in oxidation behavior is associated with the microstructures of the two ODS alloys. Additionally, compared with the results of modified Nimonic 263 superalloy [16] (Ni-24.31Cr-19.63Co-0.75Al-1.58Ti-1.83Nb-0.52Mo-1.02Fe-0.45Si-0.27Mn-0.034C, whose kp is 0.0278 mg2·cm−4·h−1) and a nickel-based ODS alloy PM1000 [17] (Ni-20Cr-0.3Al-0.5Ti-0.6Y2O3, whose kp is 0.0091 mg2·cm−4·h−1), the obtained parabolic rate constants are markedly reduced after isothermal oxidation at 1000 °C in air. The reason for the reduction in corrosion rate will be discussed later.
3.3. Characterization of Oxidation Products
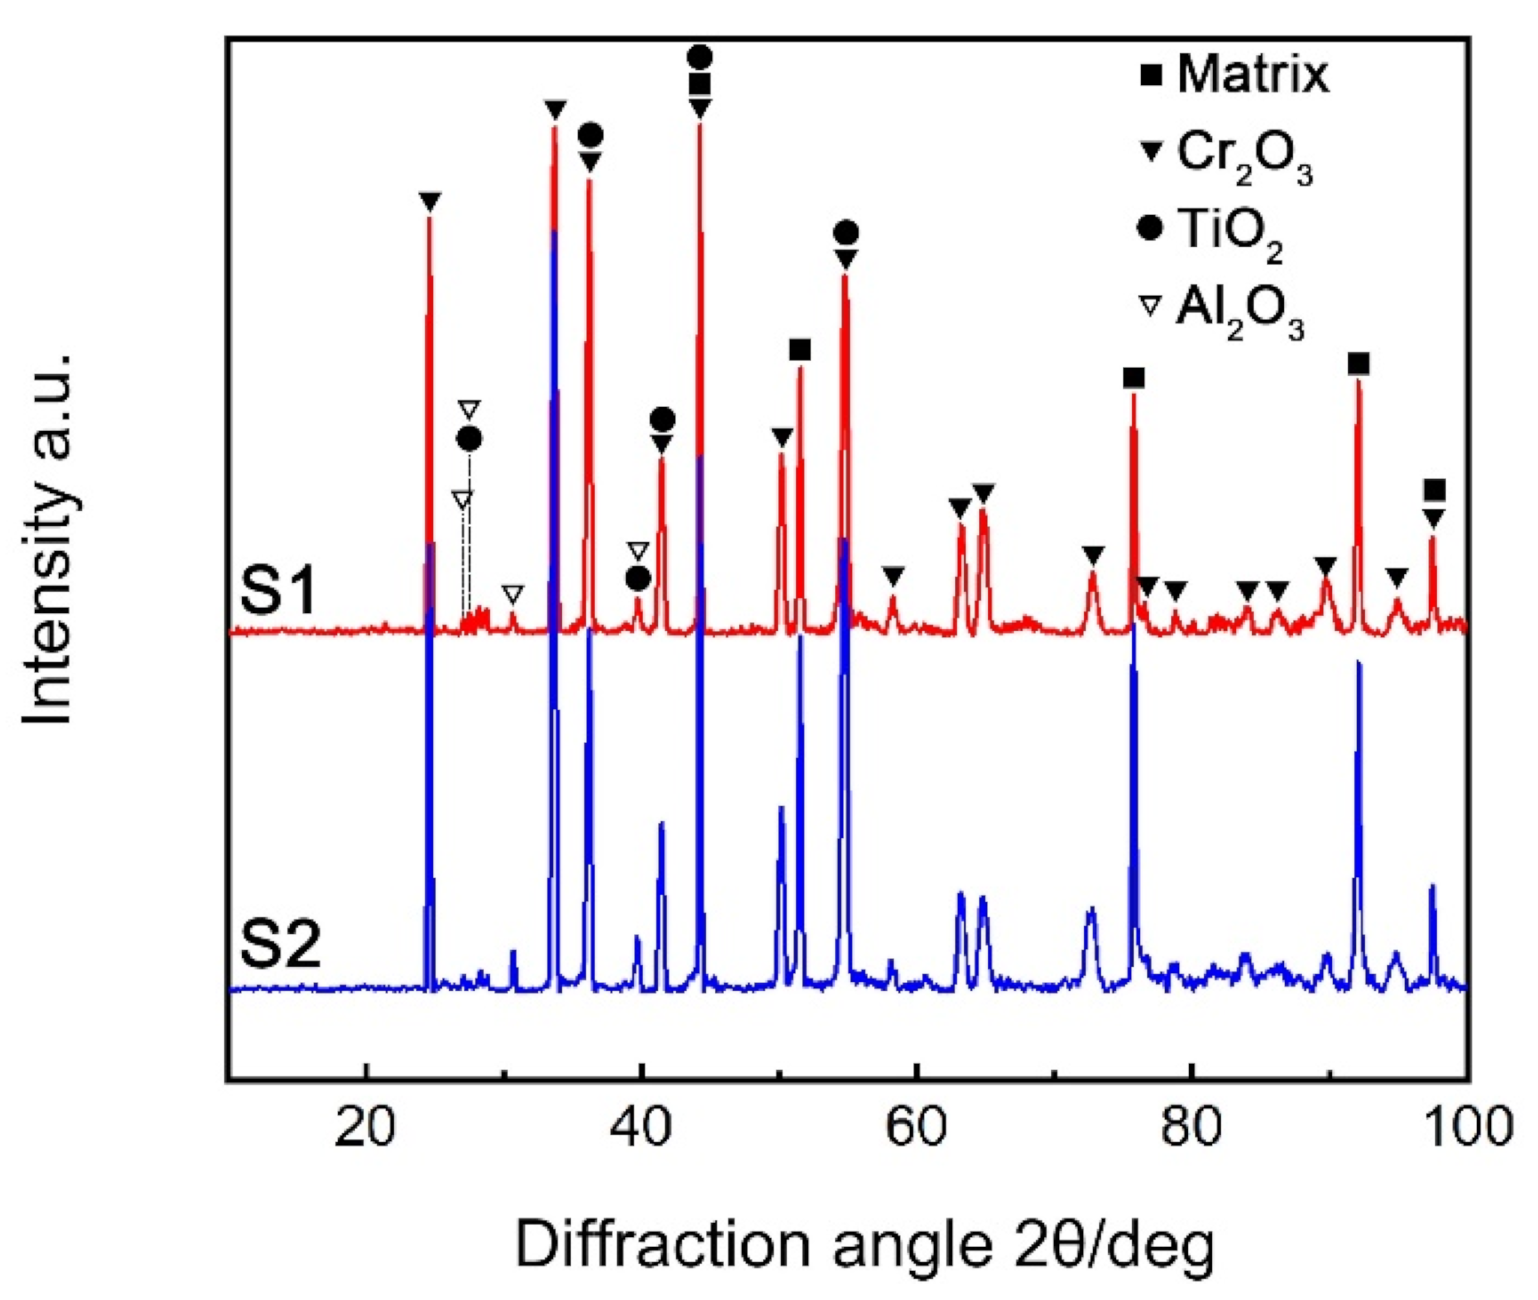
Figure 5 presents XRD patterns of both alloys obtained after oxidation at 1000 °C for 200 h. The oxidation products grown on the S1 and S2 surfaces have similar composition, mainly composed of Cr2O3 (a = b = 4.959 Å, c = 13.594 Å, α = 90°, β = 90°, γ = 120°). This dominating oxidation product is in agreement with the findings of previous studies on the oxidation of nickel-based conventional wrought and ODS alloys [16,17]. In addition, a quantity of TiO2 (a = b = 4.593 Å, c = 2.959 Å, α = β = γ = 90°) and a small amount of Al2O3 (a = 7.934 Å, b = 7.956 Å, c = 11.711 Å, α = β = γ = 90°) within the oxide scale are detected. The amount of PCA has no obvious impact on the constituents of the oxide scale. Meanwhile, no NiCr2O4 was identified in the oxide scales of the alloys, which is different from the result of some conventional Ni superalloys K4750 [18] (Ni-19.9Cr-4.3Fe-1.21Al-3Ti-3.14W-1.56Nb-1.43Mo-0.1C) and K435 [19] (Ni-15.53Cr-1.99Mo-10.73Co-5.33W-2.89Al-4.68Ti-0.21Nb-0.02B-0.03Fe-0.075C). However, a similar phenomenon has been found in the oxidation behavior of an ODS nickel-based alloy MA754 (Ni-20Cr-0.5Y2O3) [20], and it has been demonstrated to be caused by the high oxidation selectivity of chromium in the ODS alloy.
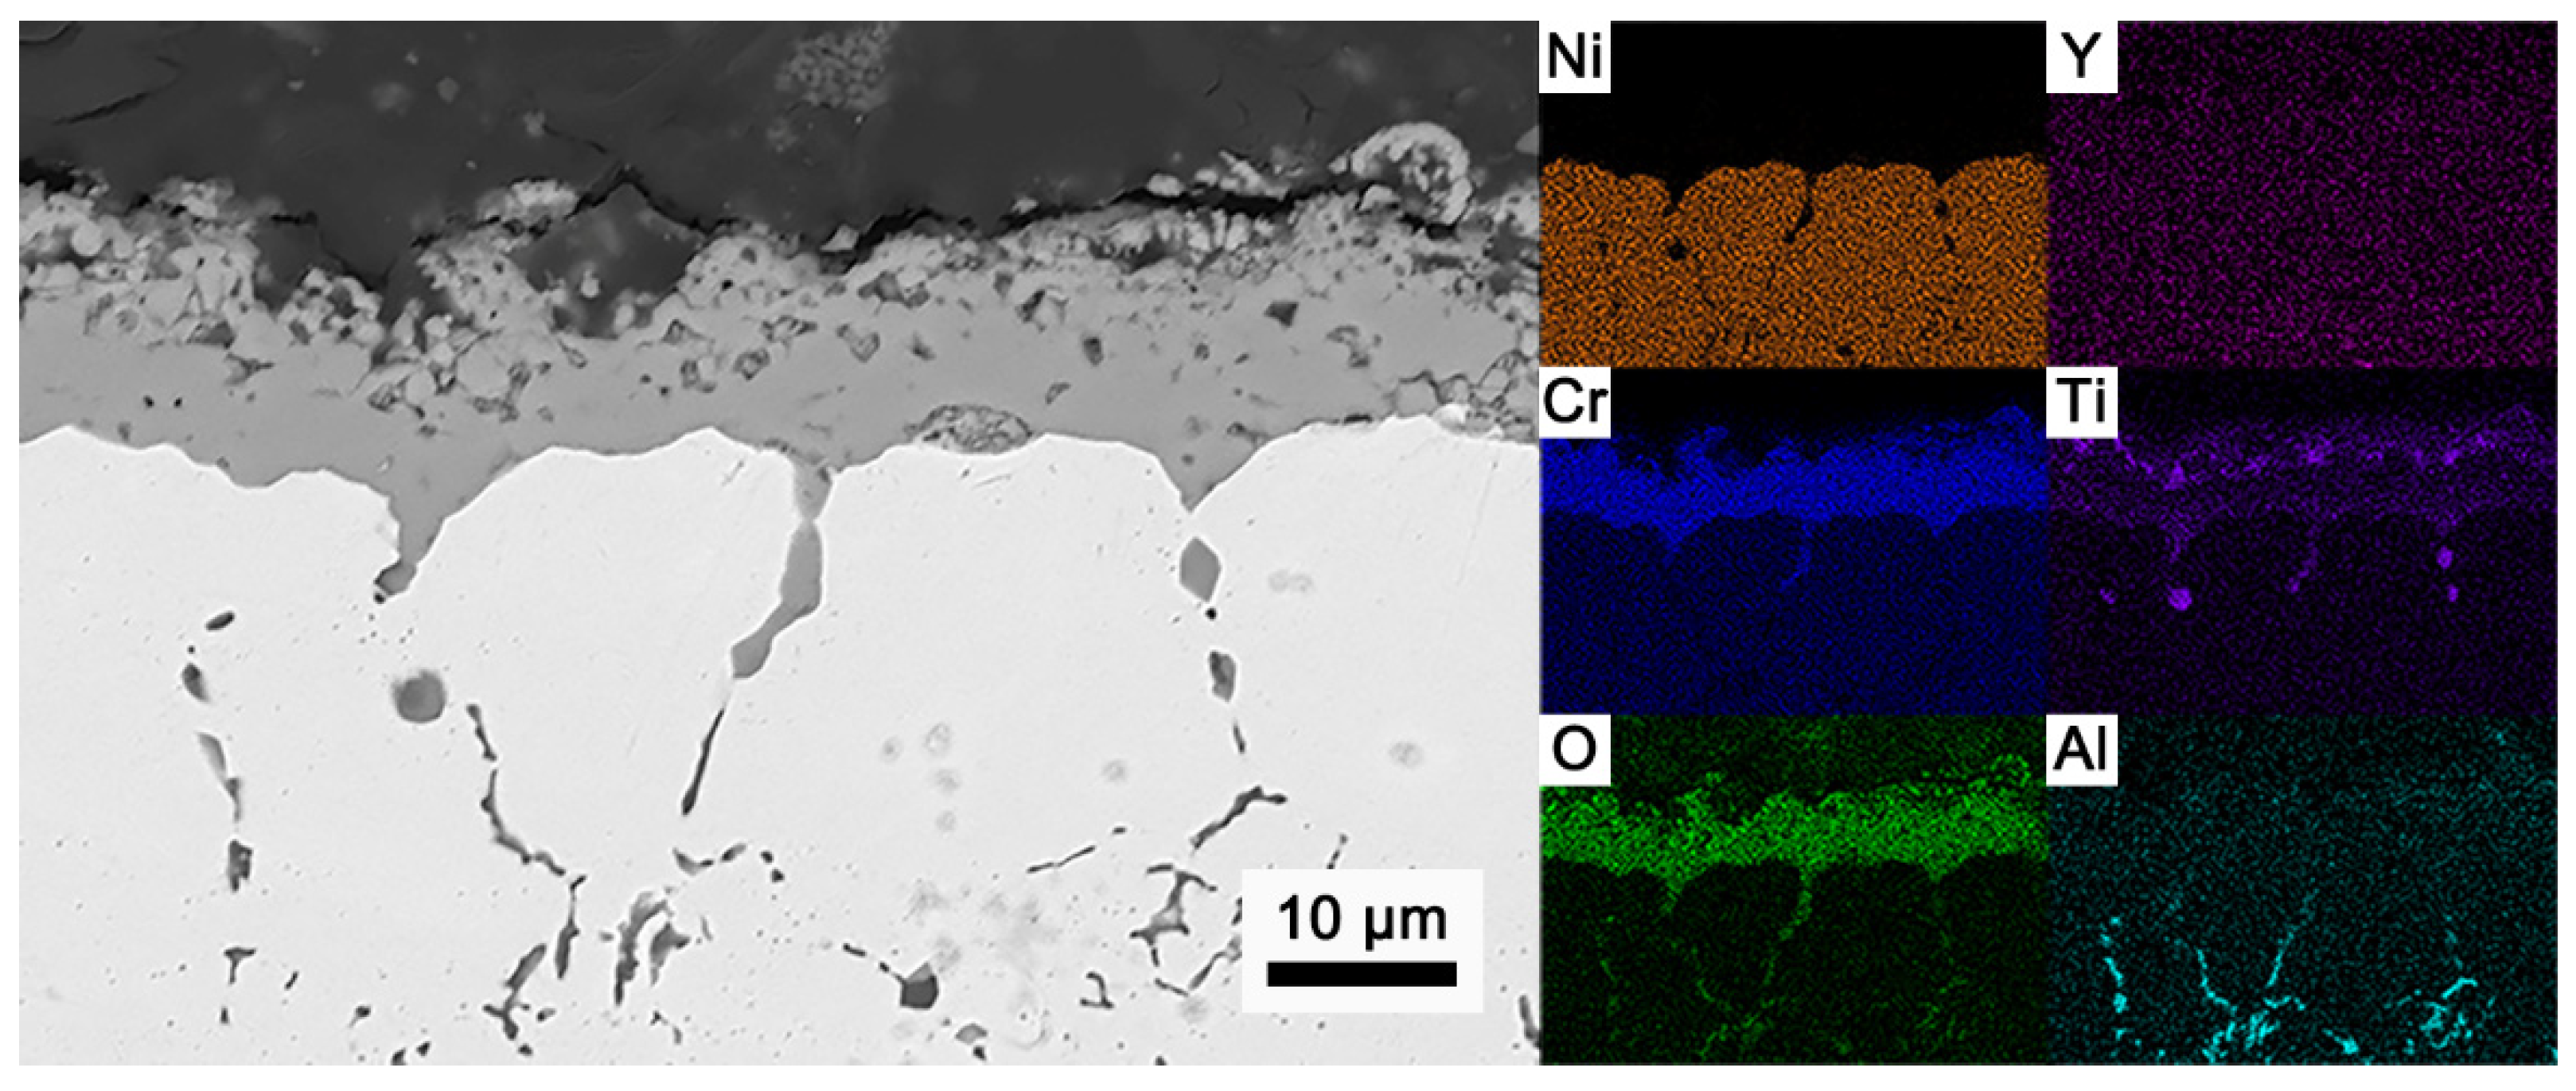
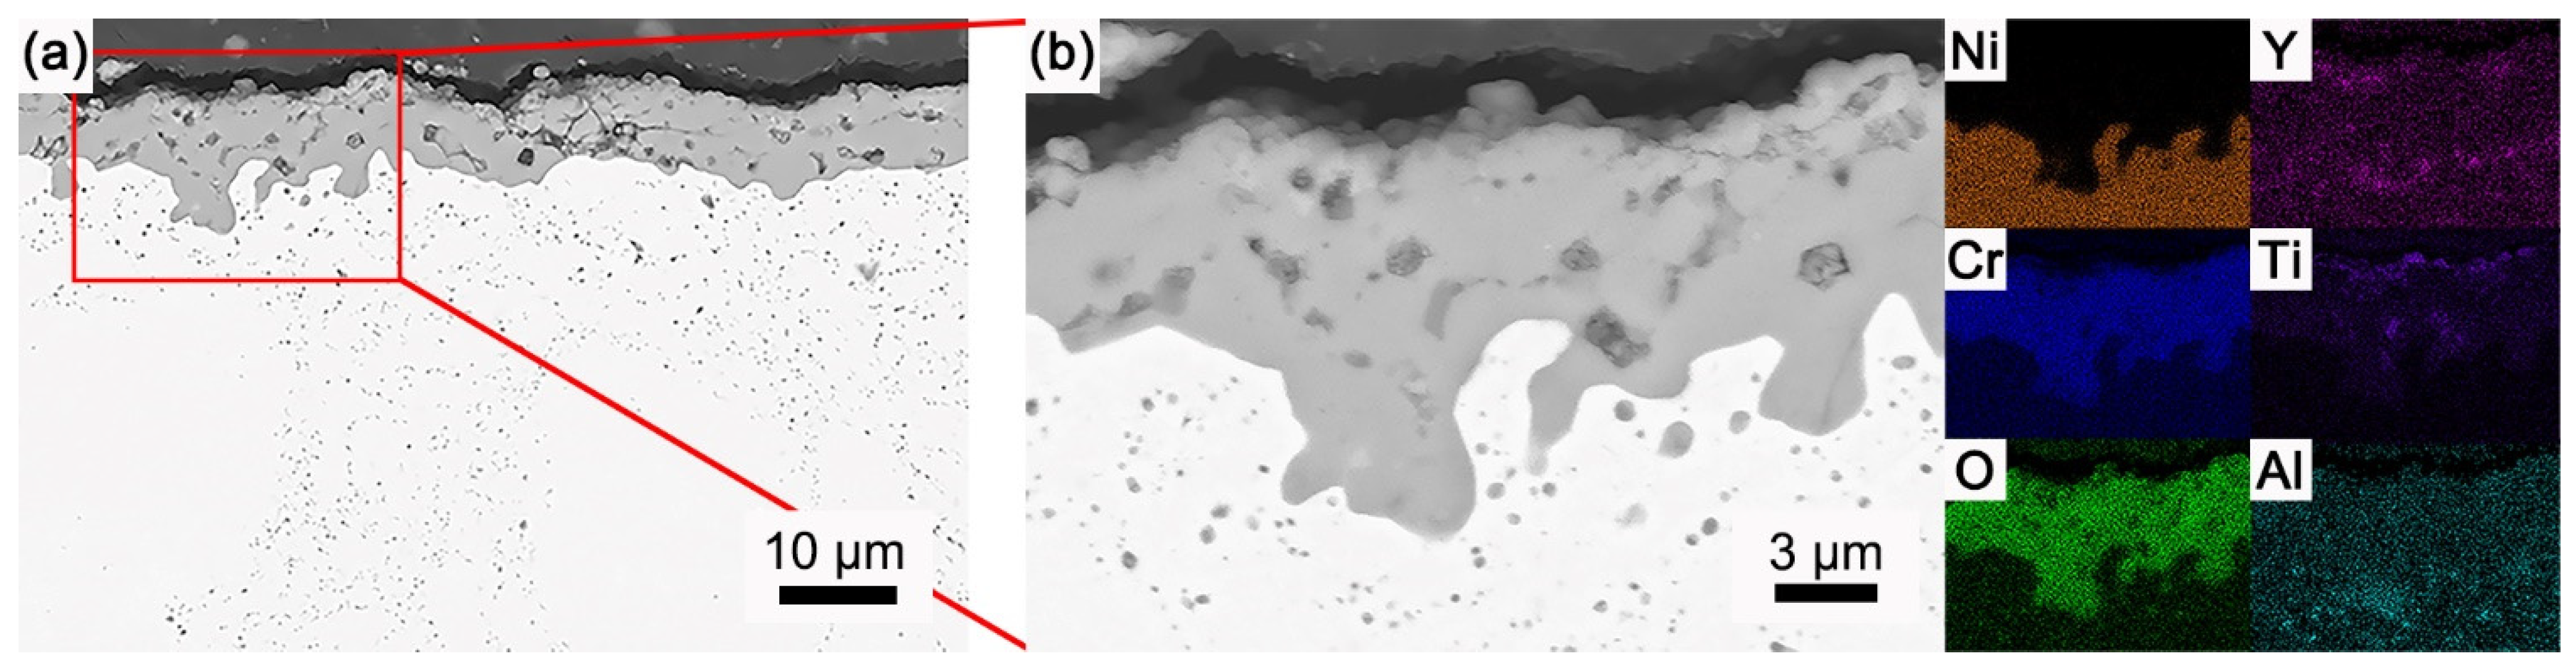
The scale morphology and corresponding element mapping on the cross sections of two ODS specimens after the oxidation test are shown in Figure 6 and Figure 7. It is obvious that the continuous scales are composed of chromium oxide, and nickel oxides are not detected in the scale. As emphasized by various studies showing that titanium and yttrium can easily diffuse out along grain boundaries and segregate into scale [21,22,23], the enrichment of titanium and yttrium is also observed in the oxide scale of these two ODS alloys. Additionally, due to too small an amount of aluminum (~0.3 wt.%) in the matrix, the continuous alumina layer is not formed in or beneath the chromia scale. Relative to the distribution of titanium and yttrium in the oxide scale, aluminum has been oxidized along the grain boundary below the scale, becoming the front of the internal oxidation of the matrix. Compared with S2, the internal oxidation of aluminum in S1 is more obvious, and the interpretation of this phenomenon will also be provided later.
After analysis with Nano Measurer software, it was found that the mean thickness of the oxide scale covering the surface is 12.9 ± 2.0 μm for S1 and 7.4 ± 0.5 μm for S2, which is coincident with the mass gain of two alloys in Figure 4. In comparison with the Cr2O3 scale thickness of around 24.4 μm on the wrought Ni superalloy K317 (Ni-22Cr-8Mo-1.2Al-0.4Ti-12Co) oxidized at 1000 °C for 100 h [24], the thickness is significantly reduced. This is predominantly due to the effect of yttrium-rich oxide dispersion, which has been proven to be able to considerably reduce the flux of metallic cation diffusion out through the oxide scale [20,25]. Furthermore, the growth of oxide scale on the surface of ODS alloy proceeds nearly exclusively by inward transport of oxygen through grain boundaries of oxide scale after a long exposure time, which has been emphasized by some studies on ODS alloys [26,27,28]. Through comparing the high-temperature oxidation behavior in air of ODS nickel-based alloy MA754 (Ni-20Cr-0.5Y2O3) and ODS FeCrAl alloy MA956 (Fe-20Cr-5Al-0.5Y2O3) to that of wrought model alloys with similar compositions, Quadakkers et al. [20] claimed that the additions of yttria decreased the growth rate of chromia as well as alumina scale, improved oxide scale adherence and enhanced preferential oxidation of chromium in nickel-based alloys. Similarly, after comparing the oxidation behavior of 9Cr- and 11Cr-FeCr-based ODS alloys with 11Cr PNC-FMS and 17Cr ferritic stainless steel at 650, 750 and 850 °C for 2000 h, Kaito et al. [29] arrived at the conclusion that the superior oxidation resistance of ODS alloy was attributed to the formation of a protective Cr2O3 at the matrix and scale interface, which may be stabilized by finely dispersed Y2O3 particles. In the present investigation, the suppression of outward diffusion of metal cations by yttrium-rich nanometric oxides at the initial stage of oxidation, together with the oxygen inward diffusion along the grain boundary of scale after long-time oxidation, can explain the retardation of oxide scale growth on ODS alloy surface compared with non-ODS alloy and also explain why the parabolic rate constants of S1 and S2 obtained from Figure 4 are much smaller than that of Nimonic 263 superalloy [16].
3.4. Evolution of Secondary Phase Nanoparticles
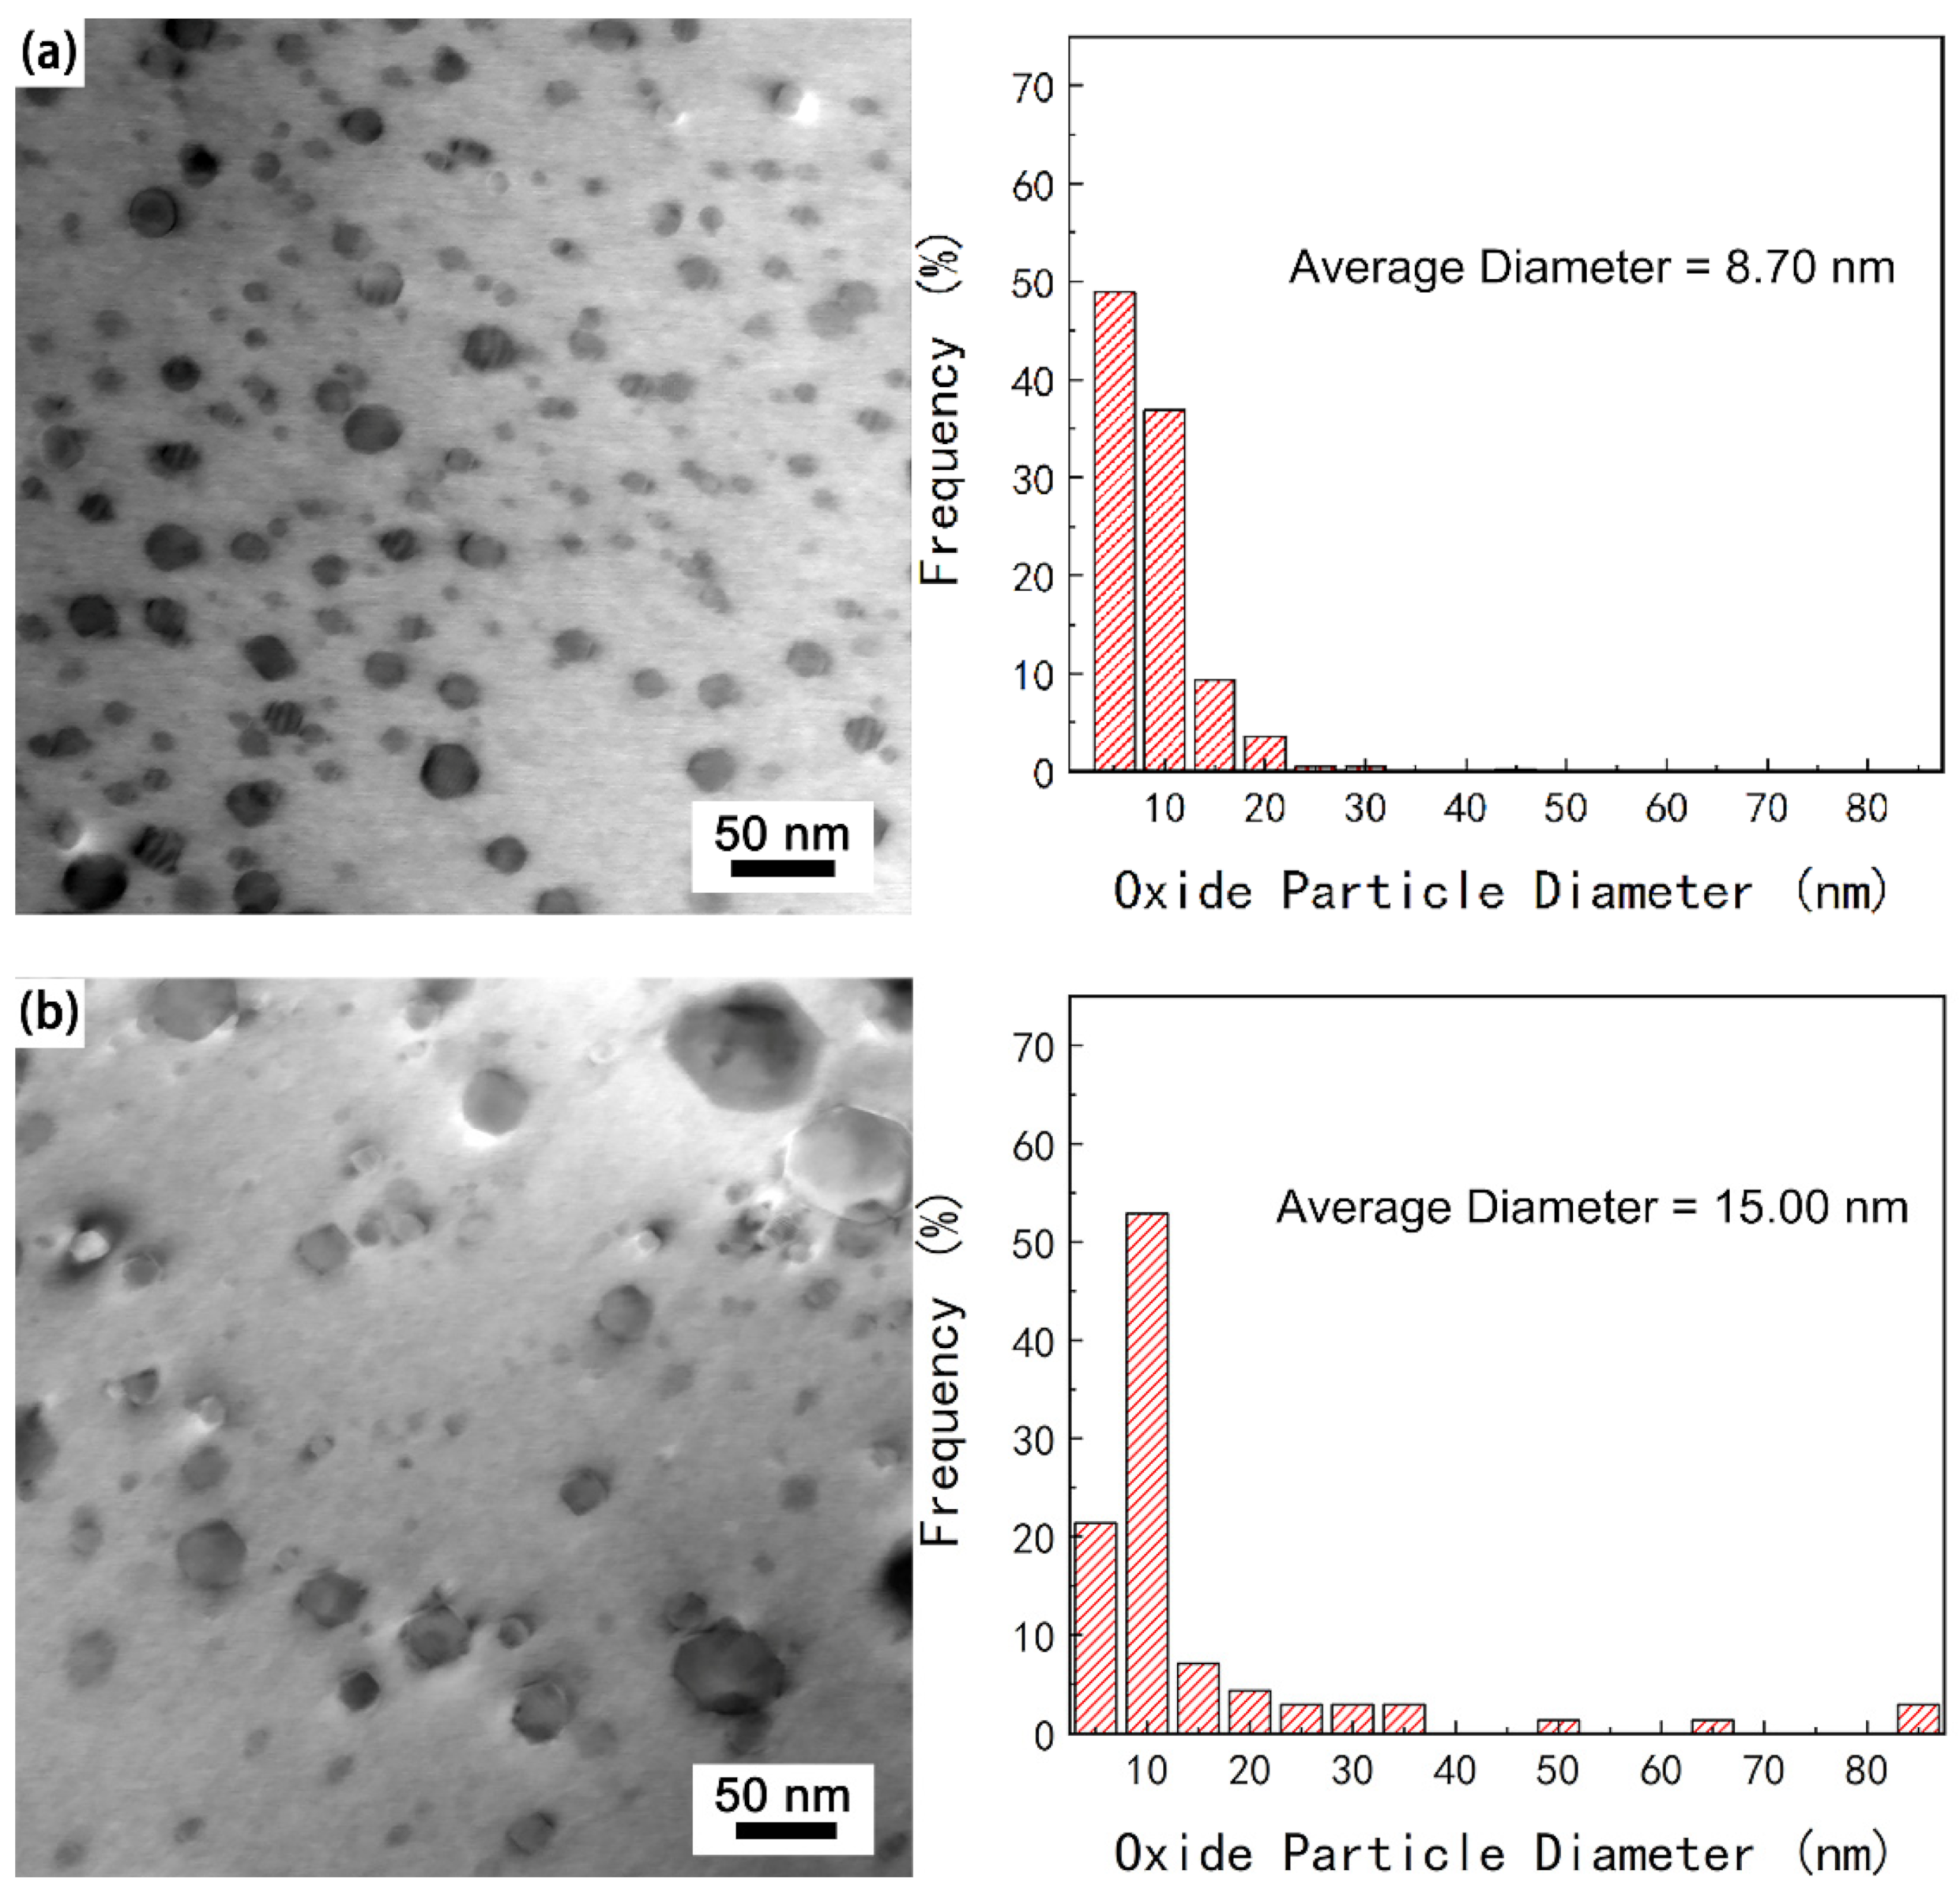
The morphology and size distribution of nanometric oxides in the matrix after 200 h oxidation at 1000 °C is shown in Figure 8. For comparison, the changes in size, number density and component of oxide nanoparticles caused by long-term oxidation are also listed in Table 2. In the same manner, the component of secondary phase particles in each ODS alloy was determined by analyzing the crystal characteristics of about 50 nanoparticles using HRTEM and FFT patterns. It was found that the average size of oxide nanoparticles in S1 increases by approximately 11.5%, while the particle size in S2 increases by 32.7%, accompanying a sharp decrease in the number density of nanometric oxides. The nanoparticle size statistics in Table 2 and the microstructure images in Figure 8 indicate that excessive PCA leads to the reduction in uniformity and stability of secondary phase oxides, which are consequently coarsened through Ostwald ripening during high-temperature annealing.
Additionally, according to the statistical results in Table 2, the variance in the component change of oxide nanoparticles is confirmed. The proportion of Y-Ti-O nanoparticles in the S1 specimen is reduced sharply, concomitant with the increase in Y-Al-O nanoparticles, while the change in nanometric oxides in S2 is mainly manifested by the change in different compositions of Y-Ti-O nanoparticles. Nevertheless, there is a tendency to transform into YTiO3 nanoparticles with an orthogonal structure (a = 5.689Å, b = 7.6094 Å, c = 5.335 Å, α = β = γ = 90°) in two ODS alloys. In the study of FeCr-based ODS alloy (Fe-14Cr-1W-0.25Y2O3), Thual et al. [30] used HRTEM to find that more than 75% of the nanoparticles were composed of YTiO3 + Y2TiO5 with orthorhombic structure after thermal annealing at 1150 °C. They attributed this transition to phase relaxation of nanoparticles caused by the high oxygen content in the ferritic matrix. In the present investigation, with the progress of the oxidation test, oxygen could diffuse into the matrix through the chromia scale. At the same time, a large number of yttrium, titanium and aluminum elements migrate sequentially from the substrate to the surface, as shown in Figure 6 and Figure 7, giving rise to changes in the microenvironment of the alloy matrix. As mentioned in calculation results [14] and experimental results [27] for nanometric oxides, the microenvironment in the ODS alloy has a great impact on the formation and composition of oxide nanoparticles. Therefore, unavoidably, the component of nanometric oxides in these two alloys changes during the long-term high-temperature oxidation. In addition, the difference in grain size plays an auxiliary role in the change in nanometric oxide composition. The finer the grain size is, the more the outward and lateral diffusion paths are. Consequently, the chance of combining yttrium with aluminum increases during the oxidation with elevated temperature and long time, resulting in the precipitation of Y-Al complex oxide in S1. However, simultaneously, the increase in oxygen content in the nickel-based matrix facilitates the transformation of oxide nanoparticles to orthorhombic structure, thus increasing the proportion of YTiO3 nanoparticles.
3.5. Oxidation Development of Oxide Scale
As mentioned above, due to the yttrium-rich oxide precipitates in the matrix, the thickness of the chromium oxide scale on the surface of the two ODS alloys is smaller than that of conventional wrought Ni superalloy K317 [24], and the kp values of the two ODS alloys are lower than that of modified Nimonic 263 superalloy [16]. However, under the same oxidation environment, the scale thickness and oxidation rate of S2 are obviously smaller than those of S1. This is probably derived from the different microstructural parameters, such as the distribution and volume density of oxide nanoparticles, and the distribution of grains in the two ODS alloys.
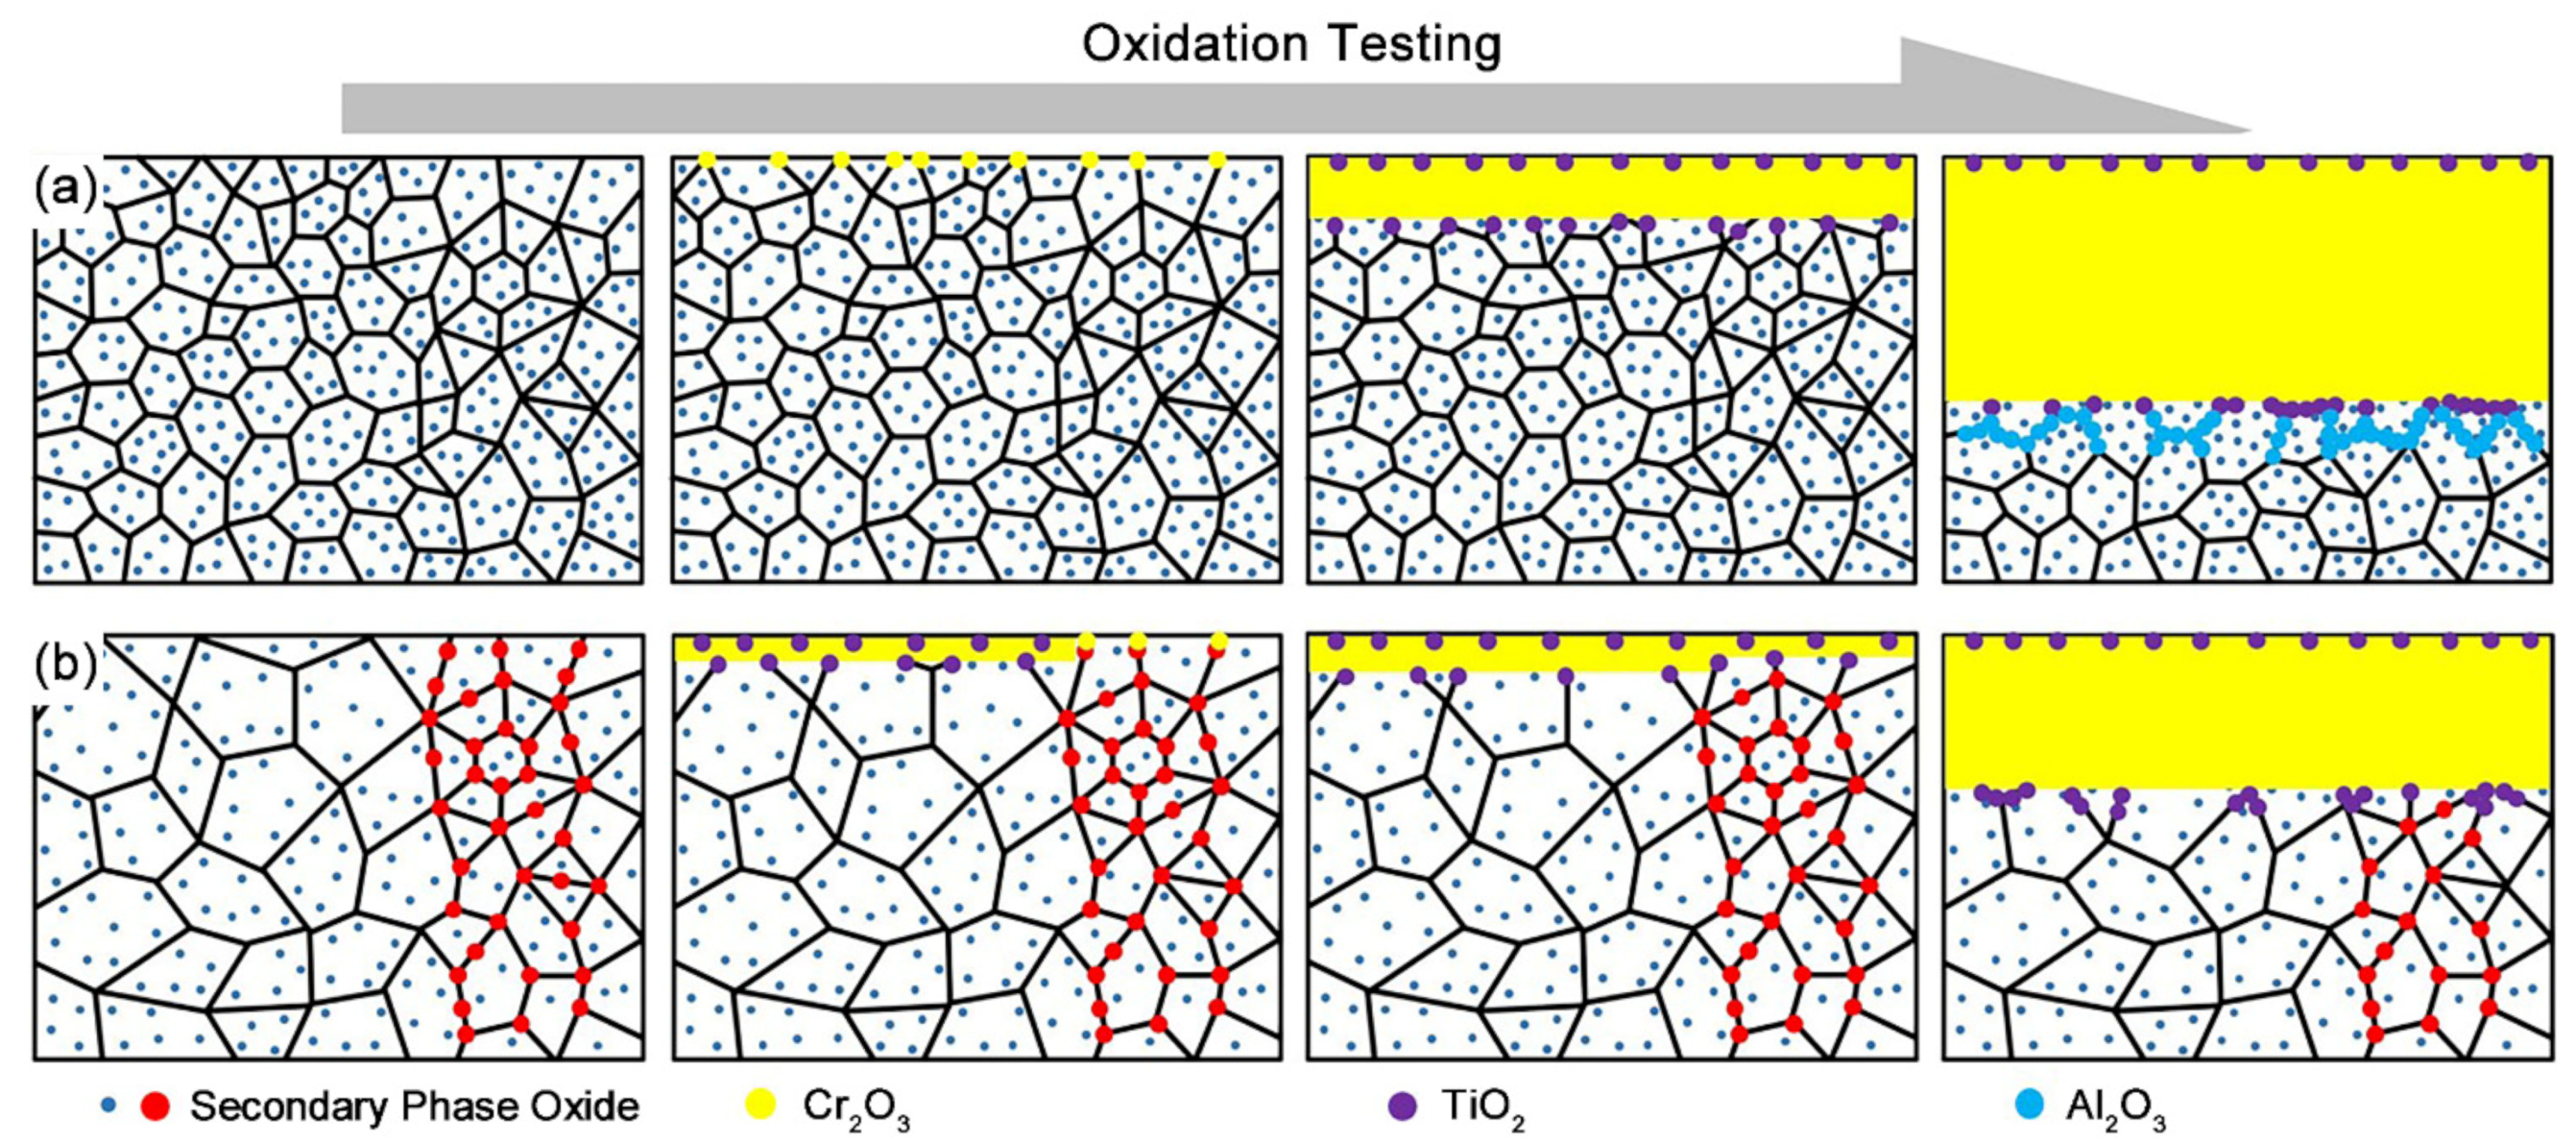
The oxidation process of these two ODS nickel-based alloys is discussed, and Figure 9 presents a schematic diagram for the formation of the oxide scale on the surface. At the initial stage of oxidation, both chromium oxides and nickel oxides may nucleate simultaneously [31]. The high chromium content in the alloy is conducive to the formation of chromium oxide with a lower formation enthalpy [29] and can provide supplies for scale growth. Although the secondary phase nanoparticles and the grain boundaries in these ODS alloys can provide nucleation sites for chromium oxides, the yttrium-rich oxide particles dispersed at the grain boundary with the help of inward diffused oxygen block the outward diffusion of major and minor metal cations along the grain boundary. The secondary phase nanoparticles in S1 are finer and more homogeneous than those in S2, resulting in a slow outward growth of chromium oxide in S1, as shown in Figure 9a. After a long time of exposure, the compact scale mainly composed of chromium oxide is formed. At this time, the scale on the nickel-based ODS alloy grows nearly exclusively by oxygen inward transport along the oxide grain boundary [20], and the internal oxidation becomes one of the main ways of scale growth thereafter. This is coincident with the heavy wave profile at the interface between oxide scale and alloy matrix in Figure 6 and Figure 7.
Furthermore, the finer grains of the S1 alloy improve the short-circuit diffusion of oxygen in the scale, resulting in a faster oxidation rate (in Figure 4) and a thicker scale thickness (in Figure 6) compared with S2. As shown in Figure 9, the finer the grains are, the more obvious the increase in oxide scale thickness is. In summary, the discrepancy in oxide scale development is caused by the addition of different amounts of PCA.
The inward diffusion of oxygen along the finer grains in S1 also leads to the internal oxidation of aluminum embedded in the matrix, and the centration enrichment of aluminum oxide is higher than that of S2. It is also associated with the homogeneous microstructure in the S1 ODS alloy. This morphology may be helpful to produce a pegging effect in the nickel-based ODS alloys [32] and prevent the spalling of the Cr2O3 oxide scale.
4. Conclusions
In this study, the dependence of microstructures (including grains and secondary phase oxides) and subsequent oxidation behavior in air at 1000 °C for 200 h of two nickel-based ODS alloys on the different amounts of PCA addition in the process of fabrication was investigated. The following conclusions can be summarized:
- (1)
- The size and homogeneity of yttrium-rich oxide nanoparticles and grains in nickel-based ODS alloy are strongly influenced by mechanical alloying process parameters, that is, the PCA addition. The excessive addition of PCA plays a negative role in the precipitation of fine and homogeneous nanometric oxides, which weaken the effect of pinning grain boundaries.
- (2)
- The Cr2O3 scale, whose thickness is affected by PCA addition, is formed on the surfaces of both alloys during oxidation testing, and the oxidation kinetics curves conform to a parabolic law.
- (3)
- The distribution of yttrium-rich oxide nanoparticles in the matrix has more significance for the actual oxidation behavior than the yttria concentration. Although the mean thickness of the oxide scale is much lower than that of non-ODS alloy, the thickness of the chromia scale on the alloy with uniform distribution of secondary phase oxides and fine grains is greater than that of the alloy with uneven distribution of nanoparticles and grains.
- (4)
- The size and constituents of nanometric oxides in both alloys also change during the oxidation. Although the constituents of nanometric oxides change uncontrollably in the nickel-based alloys, a transition to YTiO3 with an orthorhombic structure is confirmed.
- (5)
- A nickel-based ODS alloy with a homogeneous distribution of oxide nanoparticles and fine grains could be prepared by mechanical milling with the addition of a proper amount of PCA. Oxide nanoparticles distributed homogeneously could delay the formation of the continuous scale during the transition stage of oxidation, and the fine grains could increase scale thickness and mass gain by promoting the short-circuit diffusion of oxygen in the oxide scale.
Author Contributions
Conceptualization, L.X. and S.L.; formal analysis, J.L.; funding acquisition, L.X. and S.L.; investigation, Z.M.; methodology, Z.M.; resources, L.X. and S.L.; supervision, L.X.; validation, Z.M.; visualization, Z.M.; writing—original draft, Z.M.; writing—review and editing, J.L., L.X. and S.L. All authors have read and agreed to the published version of the manuscript.
Funding
This research received no external funding.
Data Availability Statement
The data presented in this study are available on request from the corresponding author. The data are not publicly available due to an ongoing study.
Acknowledgments
The authors would like to express sincere thanks to Sajian Wu, Changji Li and Shuai Li for their suggestions and their help in experiments.
Conflicts of Interest
The authors declare no conflict of interest.
References
- Benjamin, J.S. Dispersion strengthened superalloys by mechanical alloying. Metall. Trans. 1970, 1, 2943–2951. [Google Scholar] [CrossRef]
- Suryanarayana, C. Mechanical alloying and milling. Prog. Mater. Sci. 2006, 46, 4219812. [Google Scholar] [CrossRef] [Green Version]
- Whitteriberger, J.D. Creep and Tensile Properties of Several Oxide-Dispersion-Strengthened Nickel-Base alloys at 1365 K; NASA TN D-8422; NASA: Washington, DC, USA, 1977. [Google Scholar]
- Giggins, C.S.; Pettit, F.S. The oxidation of TD NiC (Ni-20Cr-2 vol pct ThO2) between 900 °C and 1200 °C. Metall. Mater. Trans. B 1971, 2, 1071–1078. [Google Scholar] [CrossRef]
- Stringer, J.; Wilcox, B.A.; Jaffee, R.I. The high-temperature oxidation of nickel-20 wt. % chromium alloys containing dispersed oxide phases. Oxid. Met. 1972, 5, 11–47. [Google Scholar] [CrossRef]
- Sheibani, S.; Ataie, A.; Heshmati-Manesh, S. Role of process control agent on synthesis and consolidation behavior of nano-crystalline copper produced by mechano-chemical route. J. Alloys Compd. 2008, 465, 78–82. [Google Scholar] [CrossRef]
- Ramezanalizadeh, H.; Heshmati-Manesh, S. Preparation of MoSi2-Al2O3 nano-composite via MASHS route. Int. J. Refract. Met. Hard Mater. 2012, 31, 210–217. [Google Scholar] [CrossRef]
- Shi, J.; Zheng, A.; Lin, Z.; Chen, R.; Zheng, J.; Cao, Z. Effect of process control agent on alloying and mechanical behavior of L21 phase Ni–Ti–Al alloys. Mater. Sci. Eng. A-Struct. 2019, 740–741, 130–136. [Google Scholar] [CrossRef]
- Chen, C.L.; Dong, Y.M. Effect of mechanical alloying and consolidation process on microstructure and hardness of nanostructured Fe-Cr-Al ODS alloys. Mater. Sci. Eng. A-Struct. 2011, 528, 8374–8380. [Google Scholar] [CrossRef]
- Chen, W.; Xiong, W.; Zhang, X. Effect of Y2O3 Content and Sintering Temperature on Mechanical Properties of ODS Nickel-Based Superalloy. Rare. Metal. Mater. Eng. 2010, 39, 112–116. [Google Scholar] [CrossRef]
- Mihalache, V.; Mercioniu, I.; Velea, A.; Palade, P. Effect of the process control agent in the ball-milled powders and SPS-consolidation temperature on the grain refinement, density and Vickers hardness of Fe14Cr ODS ferritic alloys. Powder Technol. 2019, 347, 103–113. [Google Scholar] [CrossRef]
- Han, J.Y.; Kang, H.; Oh, S.T. Effect of process control agent on the microstructure of Ni-based ODS superalloy produced by mechanical alloying and sintering”. Arch. Metall. Mater. 2019, 64, 949–952. [Google Scholar]
- Mao, Z.; Xiong, L.; Liu, S. Compounds, The formation of the complex oxide in Ni-based alloy powder during mechanical milling and heat treatment. J. Alloys Compd. 2021, 879, 160333. [Google Scholar] [CrossRef]
- Chinnappan, R. Thermodynamic Stability of Oxide Phases of Fe-Cr Based ODS Steels via Quantum Mechanical Calculations. Calphad 2014, 45, 188–193. [Google Scholar] [CrossRef]
- Pieraggi, B. Calculations of parabolic reaction rate constants. Oxid. Met. 1987, 27, 177–185. [Google Scholar] [CrossRef]
- Zhao, S.Q.; Dong, J.X.; Zhang, M.C.; Xie, X.S. Oxidation Behaviors of New Ni-based Superalloy at 950 °C and 1000 °C. Rare. Metal. Mater. Eng. 2005, 34, 208–211. [Google Scholar] [CrossRef]
- Weinbruch, S.; Anastassiadis, A.; Ortner, H.M.; Martinz, H.P.; Wilhartitz, P. On the mechanism of high-temperature oxidation of ODS superalloys: Significance of yttrium depletion within the oxide scales. Oxid. Met. 1999, 51, 111–128. [Google Scholar] [CrossRef]
- Liu, Y.-L.; Hou, K.-L.; Ou, M.-Q.; Ma, Y.-C.; Liu, K. Oxidation Behavior of K4750 Alloy at Temperatures Between 750 °C and 1000 °C. Acta. Metall. Sin.-Engl. 2021, 34, 1657–1668. [Google Scholar] [CrossRef]
- Guo, J.T. Materials Science and Engineering for Superalloys; Science Press: Beijing, China, 2008. [Google Scholar]
- Quadakkers, W.J.; Holzbrecher, H.; Briefs, K.G.; Beske, H. Differences in growth mechanisms of oxide scales formed on ODS and conventional wrought alloys. Oxid. Met. 1989, 32, 67–88. [Google Scholar] [CrossRef]
- Blacklocks, A.N.; Atkinson, A.; Packer, R.J.; Savin, S.; Chadwick, A.V. An XAS study of the defect structure of Ti-doped α-Cr2O3. Solid State Ion. 2006, 177, 2939–2944. [Google Scholar] [CrossRef]
- Li, J.; Wu, S.; Ma, P.; Yang, Y.; Wu, E.; Xiong, L.; Liu, S. Microstructure evolution and mechanical properties of ODS FeCrAl alloys fabricated by an internal oxidation process. Mater. Sci. Eng. A-Struct. 2019, 757, 42–51. [Google Scholar] [CrossRef]
- Yan, F.; Li, J.; Xiong, L.; Liu, S.J.M.R.E. Effect of explosive compaction on microstructure of ODS FeCrAl alloy fabricated by oxidation method. Mater. Res. Express 2021, 8, 046504. [Google Scholar] [CrossRef]
- Gao, S.; Hou, J.; Yang, F.; Wang, C.; Zhou, L. High Temperature Oxidation Behaviors of Two Cast Ni-based Superalloys. Rare Metal Mater. Eng. 2019, 48, 960–966. [Google Scholar]
- Ramanarayanan, T.A.; Ayer, R.; Petkovic-Luton, R.; Leta, D.P. The Influence of Yttrium on Oxide Scale Growth and Adherence. Oxid. Met. 1988, 29, 445–472. [Google Scholar] [CrossRef]
- Quadakkers, W.J. Growth mechanisms of oxide scales on ODS alloys in the temperature range 1000–1100 °C. Mater. Corros. 1990, 41, 659–668. [Google Scholar] [CrossRef]
- Angermann, H.H.; Nishi, K.; Aono, Y.; Inagaki, M.; Kodama, H. Evolution of oxides on Ni-base ODS superalloys. Oxid. Met. 1997, 48, 1–39. [Google Scholar] [CrossRef]
- Zhao, H.; Liu, T.; Bai, Z.; Wang, L.; Gao, W.; Zhang, L. Corrosion behavior of 14Cr ODS steel in supercritical water: The influence of substituting Y2O3 with Y2Ti2O7 nanoparticles. Corros. Sci. 2020, 163, 108272. [Google Scholar] [CrossRef]
- Kaito, T.; Narita, T.; Ukai, S.; Matsuda, Y. High temperature oxidation behavior of ODS steels. J. Nucl. Mater. 2004, 329, 1388–1392. [Google Scholar] [CrossRef]
- Thual, M.; Ribis, J.; Baudin, T.; Klosek, V.; de Carlan, Y.; Mathon, M.H. Relaxation path of nanoparticles in an oxygen-enriched ferritic oxide-dispersion-strengthened alloy. Scripta Mater. 2017, 136, 37–40. [Google Scholar] [CrossRef]
- Whittle, D.P.; Stringer, J. Improvements in High Temperature Oxidation Resistance by Additions of Reactive Elements or Oxide Dispersions. Philos. Trans. R. Soc. London. Ser. A Math. Phys. Sci. 1980, 295, 309–329. [Google Scholar] [CrossRef]
- Ye, C.J.; Li, T.F.; Zhou, L.J. Effect of Grain Size on Oxidation Behaviour of Ni3 Al-Zr Base Alloy at Elevated Temperature. Acta. Metall. Sin. 1995, 31, 109–115. [Google Scholar]
Figure 1.
(a) TEM image and size distribution of secondary phase oxides and (b) EBSD image and size distribution of grains in the as-HIP-treated S1.
Figure 1.
(a) TEM image and size distribution of secondary phase oxides and (b) EBSD image and size distribution of grains in the as-HIP-treated S1.

Figure 2.
(a) TEM image and size distribution of secondary phase oxides and (b) EBSD image and size distribution of grains in as-HIP-treated S2. The fine grain regions with secondary phase oxides are marked with red circles.
Figure 2.
(a) TEM image and size distribution of secondary phase oxides and (b) EBSD image and size distribution of grains in as-HIP-treated S2. The fine grain regions with secondary phase oxides are marked with red circles.

Figure 3.
SEM secondary electron image and corresponding element distribution mapping of a TEM foil of as-HIP-treated (a) S1 and (b) S2.
Figure 3.
SEM secondary electron image and corresponding element distribution mapping of a TEM foil of as-HIP-treated (a) S1 and (b) S2.

Figure 4.
Oxidation kinetics curves of two ODS alloys.

Figure 5.
XRD patterns of S1 and S2 oxidized in air at 1000 °C for 200 h.

Figure 6.
Cross-sectional SEM micrograph and element distribution of oxide scales on S1 after oxidation in air at 1000 °C for 200 h.
Figure 6.
Cross-sectional SEM micrograph and element distribution of oxide scales on S1 after oxidation in air at 1000 °C for 200 h.

Figure 7.
Cross-sectional SEM micrograph at (a) low magnification and (b) high magnification and element distribution of oxide scale on S2 after oxidation in air at 1000 °C for 200 h.
Figure 7.
Cross-sectional SEM micrograph at (a) low magnification and (b) high magnification and element distribution of oxide scale on S2 after oxidation in air at 1000 °C for 200 h.

Figure 8.
TEM image and size distribution of secondary phase oxides in (a) S1 and (b) S2 after oxidation in air at 1000 °C for 200 h.
Figure 8.
TEM image and size distribution of secondary phase oxides in (a) S1 and (b) S2 after oxidation in air at 1000 °C for 200 h.

Figure 9.
Schematic diagram of chromia scale formation on the surface of (a) S1 and (b) S2.


Table 1.
Chemical composition of the nickel-based ODS alloy (wt.%).
| Alloys | Ni | Cr | Ti | Al | Fe | C | Y2O3 |
|---|---|---|---|---|---|---|---|
| S1 | Bal. | 20.2 | 0.58 | 0.27 | 1.00 | 0.07 | 0.57 |
| S2 | Bal. | 19.9 | 0.55 | 0.31 | 0.95 | 0.18 | 0.58 |
Table 2.
Summary of characteristics and constituents of nanometric oxides for the nickel-based ODS alloys.
Table 2.
Summary of characteristics and constituents of nanometric oxides for the nickel-based ODS alloys.
| Alloy | Test Specimen | Average Size (nm) | Number Density (1 × 10²¹ m−3) | Component Proportion (%) | ||||
|---|---|---|---|---|---|---|---|---|
| Y2Ti2O7 | Y2TiO5 | YTiO3 | Y3Al5O12 | Y2O3 | ||||
| S1 | As-HIP-treated | 7.70 | 34.2 ± 4.1 | 38.5 | 38.5 | 15.4 | 0.0 | 7.6 |
| After oxidation | 8.70 | 26.7 ± 5.3 | 8.7 | 8.7 | 26.1 | 39.1 | 17.4 | |
| S2 | As-HIP-treated | 11.30 | 7.62 ± 3.8 | 46.7 | 0.0 | 0.0 | 46.7 | 6.6 |
| After oxidation | 15.00 | 3.74 ± 3.2 | 21.4 | 21.4 | 14.3 | 42.9 | 0 | |
Publisher’s Note: MDPI stays neutral with regard to jurisdictional claims in published maps and institutional affiliations. |
© 2022 by the authors. Licensee MDPI, Basel, Switzerland. This article is an open access article distributed under the terms and conditions of the Creative Commons Attribution (CC BY) license (https://creativecommons.org/licenses/by/4.0/).
Share and Cite
MDPI and ACS Style
Mao, Z.; Li, J.; Liu, S.; Xiong, L. Effect of Process Control Agent on Microstructures and High-Temperature Oxidation Behavior of a Nickel-Based ODS Alloy. Metals 2022, 12, 1029. https://doi.org/10.3390/met12061029
AMA Style
Mao Z, Li J, Liu S, Xiong L. Effect of Process Control Agent on Microstructures and High-Temperature Oxidation Behavior of a Nickel-Based ODS Alloy. Metals. 2022; 12(6):1029. https://doi.org/10.3390/met12061029
Chicago/Turabian StyleMao, Zhe, Jing Li, Shi Liu, and Liangyin Xiong. 2022. "Effect of Process Control Agent on Microstructures and High-Temperature Oxidation Behavior of a Nickel-Based ODS Alloy" Metals 12, no. 6: 1029. https://doi.org/10.3390/met12061029
Note that from the first issue of 2016, this journal uses article numbers instead of page numbers. See further details here.