Article

Effect of Uniform and Non-Uniform Increasing Casting Flow Rate on Dispersion and Outflow Percentage of Tracers in Four Strand Tundishes under Strand Blockage Conditions

1
College of Materials Science and Engineering, Taiyuan University of Technology, Taiyuan 030024, China
2
College of New Energy and Materials Engineering, Shanxi Electronic Science and Technology Institute, Linfen 041075, China
*
Author to whom correspondence should be addressed.
Metals 2022, 12(6), 1016; https://doi.org/10.3390/met12061016
Submission received: 30 April 2022 / Revised: 10 June 2022 / Accepted: 13 June 2022 / Published: 15 June 2022

Abstract

:
The flow field, tracer dispersion and uniformity of strands in two designs of four-strand tun-dishes under normal conditions and single-strand blockage conditions are studied by numerical simulation. The casting speed (flow rate) of strands are increasing uniformly or non-uniformly to improve the strand blockage condition. The uniformity of strands of the cases are evaluated by a novel outflow percentage analysis method. The results show that the flow field in the tundish does not change significantly when the single-strand is blocked or the casting flow rate is increased. After blockage of one strand, the consistency of each strand of u-shaped weir tundish is better than that of double-weir tundish. With the uniform increasing of the casting flow rate, the response time of each strand decreases and the outflow percentage increases. However, the uniformity of strands improved slightly in double-weir tundish but decreased in u-shaped tundish. For the double-weir tundish, significantly increasing the casting flow rate of the strand located in the blocked part by a factor of 1.5 and slightly increasing the casting flow rate of the other strands by a factor of 1.25, the consistency of each strand is the best. For the u-shaped weir tundish, the consistency of each strand is improved by non-uniform increasing of the casting flow rate of the strands. The flow rate of the strand located in the blocked part and the other strands is increased by a factor of 1.25, and 1.375 or 1.2 and 1.4 are the optimized cases.

1. Introduction

With the development of metallurgical technology, the tundish not only plays a role in stabilizing the static pressure of molten steel, distributing and storing molten steel to realize sequence casting, but also plays an important role in carrying out various metallurgical operations, such as promoting the homogenization of temperature and chemical composition, the removal of nonmetallic inclusions and controlling residual steel. Therefore, fluid flow, heat transfer, and inclusion removal in the tundish have been widely studied by researchers [1,2,3,4,5]. Compared with single-strand and two-strand tundish, the flow field of multi-strand tundish is more complicated, which may cause problems such as short-circuit flow and large temperature differences of molten steel among multiple strands [6,7]. For multi-strand tundish, we not only need to consider the flow characteristics of each strand, but also the consistency between the strands.
In the industrial production process, because of the equipment or technological process problems, the phenomenon of strand blocking sometimes occurs. Equipment causes include the failure of mold, rollers and electrical. The process problems include the breakout of steel or a blockage of the submerged entry nozzles (SENs), etc. Strand blocking has an impact on the flow field, temperature field and the removal of inclusions in the tundish. For the flow field, it was observed in a numerical study that there were only small local changes in the volume above the blocked strand [8]. A decrease of the PV/DV (plug volume/dead volume) ratio was found in a physical model study [9]. Meanwhile, some studies [9,10,11] indicated that the closing of the outlet near the inlet has a beneficial effect on mixing inside the multistrand tundish when one of the strands is blocked. In terms of temperature effects, strand-blocking induces the smaller superheats and a larger maximum temperature difference in the tundish [12]. Besides, strands blockage improves inclusion removal to the top surface due to the longer residence time of the molten steel [12,13].
In industrial production, strand blockage is a sudden situation. It needs to be controlled by effective measures. Some researchers [14,15] have verified that optimized flow control devices in tundish can adapt the situation of fewer strands casting. Recently, the effects of turbulence inhibitor, weir, dam, impact pad and their combinations on the flow field have been widely investigated [16,17,18]. In addition, casting speed is one of the key factors affecting flow characteristics in tundish, and is often adjusted to match the production rate and schedule after the blockage. The research on casting speed in tundishes is summarized in Table 1. From the literature, it is clear that casting speed has a significant influence on the flow characteristics, temperature changes and separation efficiency of inclusions. For the flow characteristics, with the increasing of casting flow rate, it was found that the percentage of volume of dead flow decreases and the volume of well mixed flow increases [19], the minimum residence time (response time) decreases [20,21] and the uniformity of flow and temperature among multiple strands improves [22]. For the separation efficiency of inclusions, it was found that the separation efficiency decreased with increasing flow rate, thus more inclusions tend to move out through the outlets of the tundish [23]. In another study [24], it was found that the molten steel free surface would trap more inclusions when the casting speed was increased from 1.0 to 1.2 m/min. For the temperature field, it was found that the lower the casting speeds, the larger the difference between the temperatures of the steel flowing to the tundish and the steel flowing to the mold [25]. Meanwhile, F. He et al. [26] indicated that flow characteristics in the tundish that only increase the far-strand’s casting speed are better than those for increasing the casting speed of each strand simultaneously. In this study, to improve the uniformity of each strand under strand blockage conditions, the casting speed is changed with regards to different flow control device designs.
For the fluid flow in tundish, the “pulse stimulus-response” method is often used to obtain the RTD (Residence Time Distribution) curve [27,28] and further to analyze the flow in the tundish. The uniformity of each strand is an important index for evaluating the flow characteristics of multi-strand tundishes. Some researchers [29,30,31] assessed the uniformity of strands in the tundish through the characteristic parameters of the RTD curve of each strand, such as the integral area of the RTD curve, the average residence time of each strand, the response time of each strand, the time for each strand to reach the concentration peak, the full width at half maxima of the RTD curve of each strand, etc. The uniformity of each strand by calculating the standard deviation of the F-curve of each strand was proposed [32,33].
In this study, the flow field, tracer dispersion and uniformity of strands in two designs of four-strand tundish under normal conditions and single-strand blockage conditions will be studied by numerical simulation. The casting speed (flow rate) of strands are increasing uniformly or non-uniformly to improve the strand blockage condition. The uniformity of strands of the cases will be evaluated by a novel outflow percentage analysis method.

2. Experimental Methods

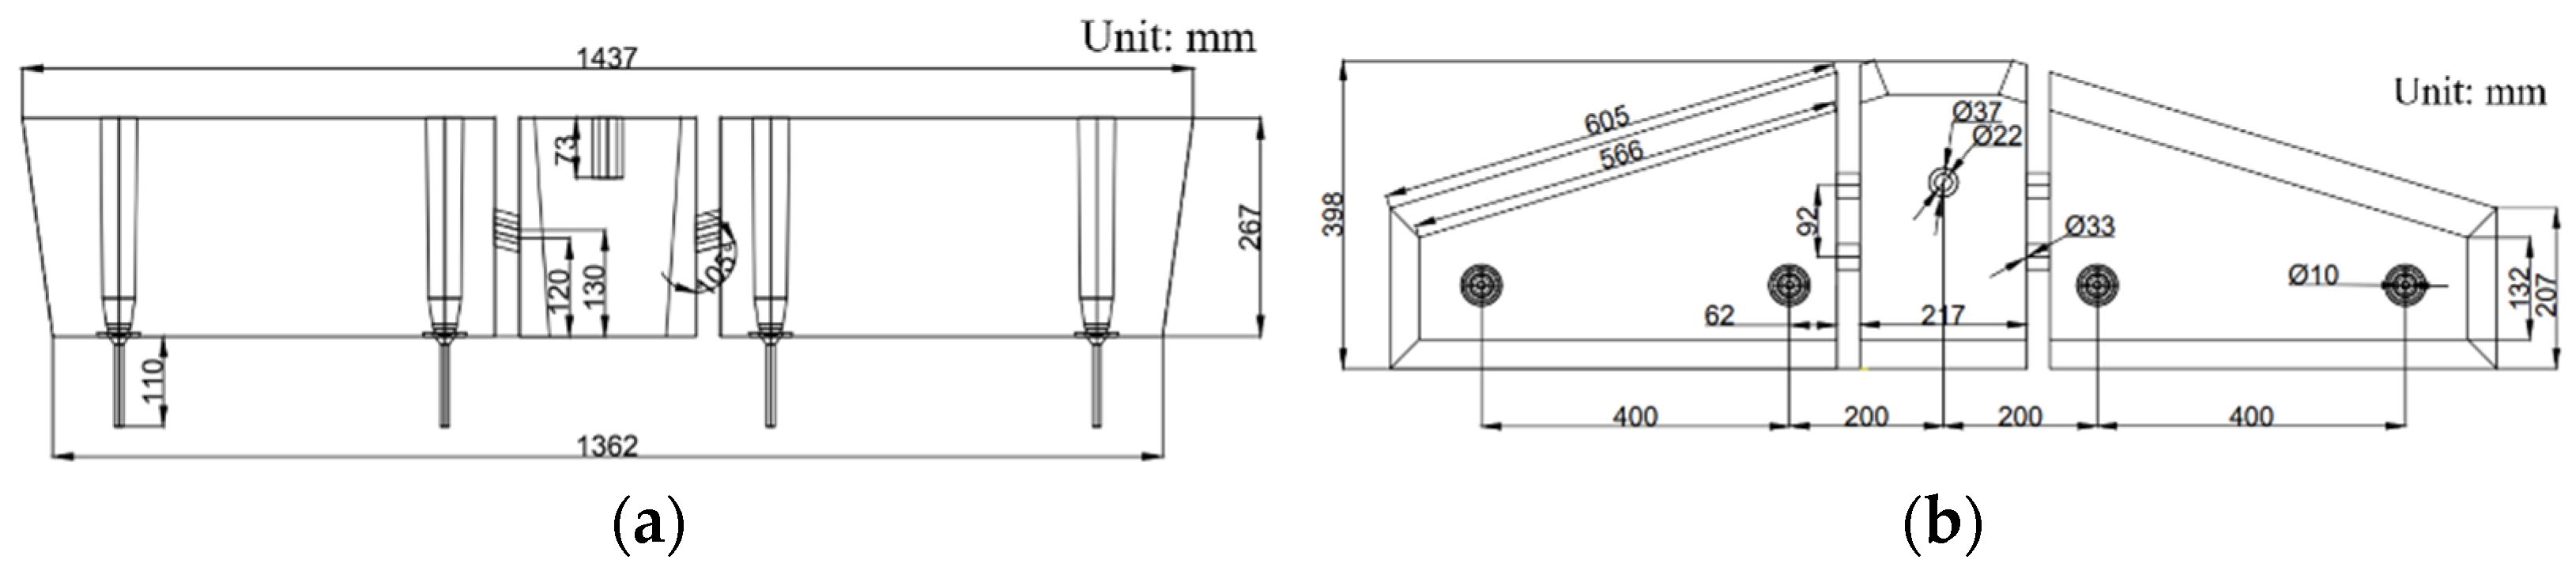
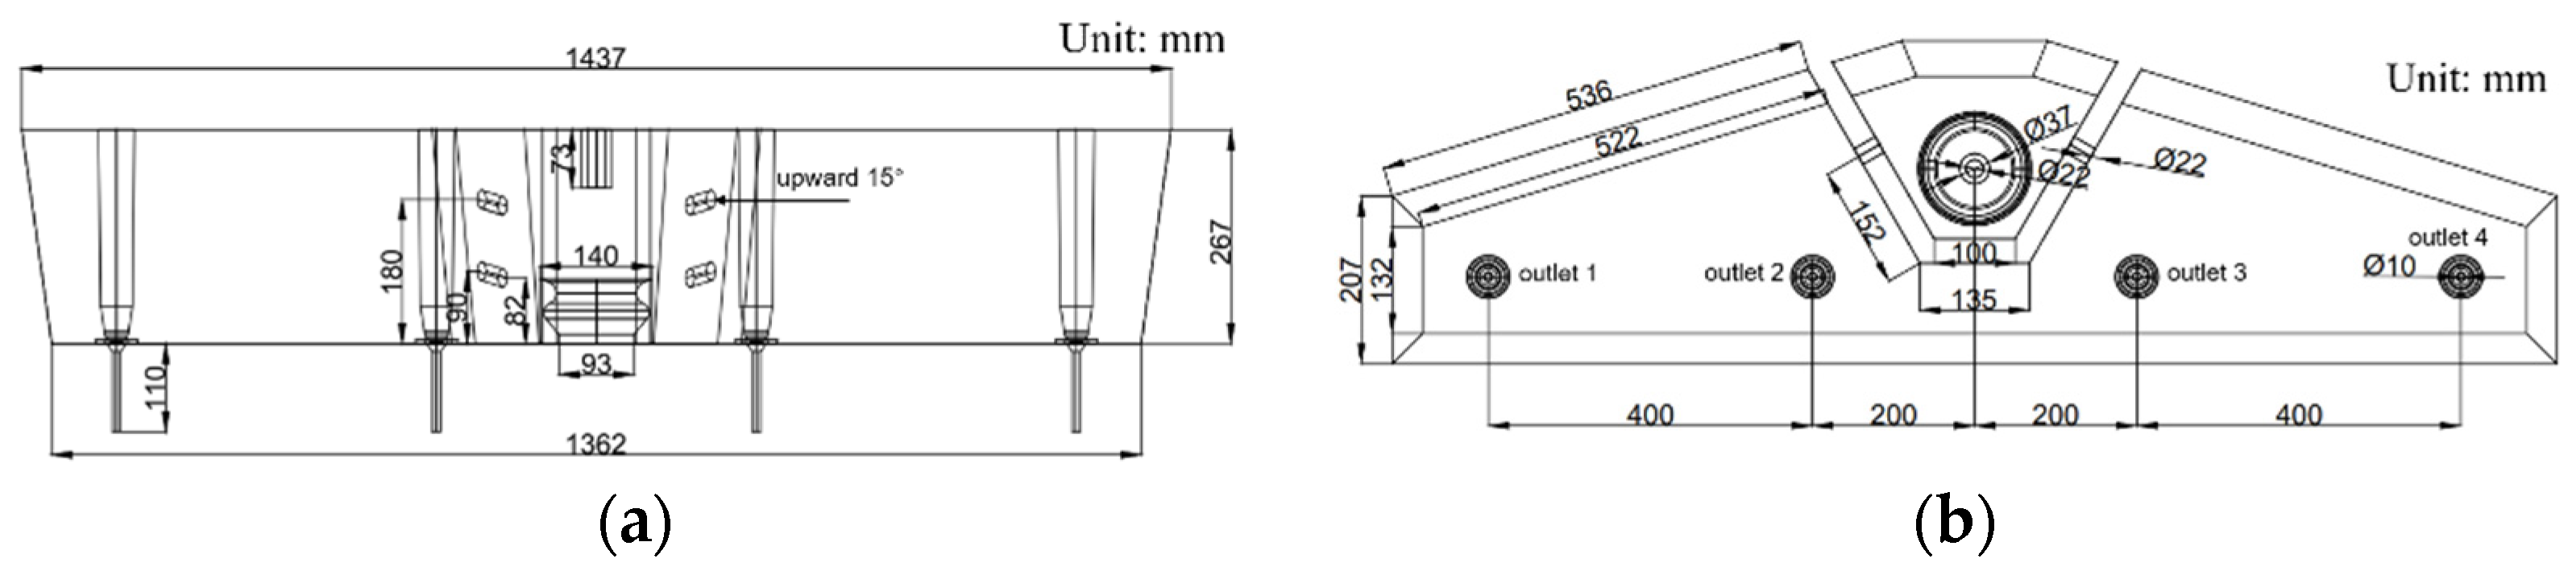
2.1. Physical Modelling

The geometrical parameters of an industrial tundish and corresponding water model are listed in Table 2. The detailed size of the tundishes are shown in Figure 1 and Figure 2.
The water model was scaled down by a factor of 1/3 according to the similarity of Froude number as follows:
( F r ) m = ( F r ) p
u m 2 / g L m = u p 2 / g L p
u m u p = L m 1 / 2 L p 1 / 2
Q m Q p = u m L m 2 u p L p 2 .
The   scale   factor   is : λ = L m L p .
Then : λ Q m Q p = λ 5 2 ,
where (Fr)m and (Fr)p are the Froude number of the physical experiment tundish model and the industrial prototype tundish, respectively. The subscripts m and p represent the model and prototype respectively. u is the outlet flow velocity, L is the characteristic length of the tundish, and Q is the outlet flow rate of tundish. g is the acceleration of gravity.

2.2. CFD (Computational Fluid Dynamics) Modelling and Solution

2.2.1. Model Assumptions

  • The model is based on the 3D size of the tundish. The realizable k-ε two-layer model [35,36] was used to model the turbulence;
  • Both water and passive scalar were assumed to be in the liquid phase;
  • In order to study the flow characteristics and outflow percentages, for simplicity, the thermal buoyancy is neglected, i.e., the liquid flow was assumed to be isothermal;
  • For the same reason, chemical reaction in the tundish is not considered;
  • The free surface is kept at a fixed level and the slag layer is not included in the tundish.

2.2.2. Governing Equations

The equations for continuity and momentum can be written as follows:
ρ ϕ t + ρ u ϕ x i = x i [ Γ ϕ , e f f ϕ x i ] + S ϕ ,
where φ represents the solved variables, such as velocity, concentration, turbulent kinetic energy, turbulent dissipation rate, etc. ρ is the density, kg/m3. u is the velocity vector, m/s. t is the time, s. xi denote the three dimensional Cartesian coordinates. Γφ,eff is the effective diffusion coefficient, m2/s and Sφ is the source term.

2.2.3. Turbulence Model

The realizable k-ε two-layer model (RKE-2L for short) [35] is applied to calculate the flow phenomenon in the tundish. This model combines the realizable k-ε model with the two-layer approach (by Rodi [36]). The transport equations for the kinetic energy k and the turbulent dissipation rate ε are:
t ( ρ k ) + ( ρ k u ) = [ ( μ + μ t σ k ) k ] + P k ρ ε
t ( ρ ε ) + ( ρ ε u ) = [ ( μ + μ t σ ε ) ε ] + ε k ρ C ε 1 P ε C ε 2 ρ ε 2 k + ν ε ,
where:
P K = G K
P ε = S K
G k = μ t S 2 2 3 ρ k u 2 3 μ t ( u ) 2
S = | S | = 2 S : S T = 2 S : S
S = 1 2 ( v + v T ) ,
where μ and μt are viscosity of fluid and turbulent viscosity, respectively Pa⋅s. Pk and Pε are production terms. Gk is a turbulent production term. S is the modulus of the mean strain rate tensor. σk, σε, σε1, σε2 are model coefficients and their values are 1, 1.3, 1.44 and 1.92, respectively.
For the two-layer model, the dissipation rate ε near the wall is prescribed as:
ε = k 3 / 2 l ε ,
where lε is a length scale function that is calculated according to Wolfstein [37]:
l ε = C l d [ 1 exp ( R e d 2 C l ) ]
C μ = 0.09
C l = 0.42 C μ 3 / 4 ,
where Red is the wall-distance Reynolds number. d is the distance to the wall, m. Cl is the model coefficient.

2.2.4. Tracer Transport Model
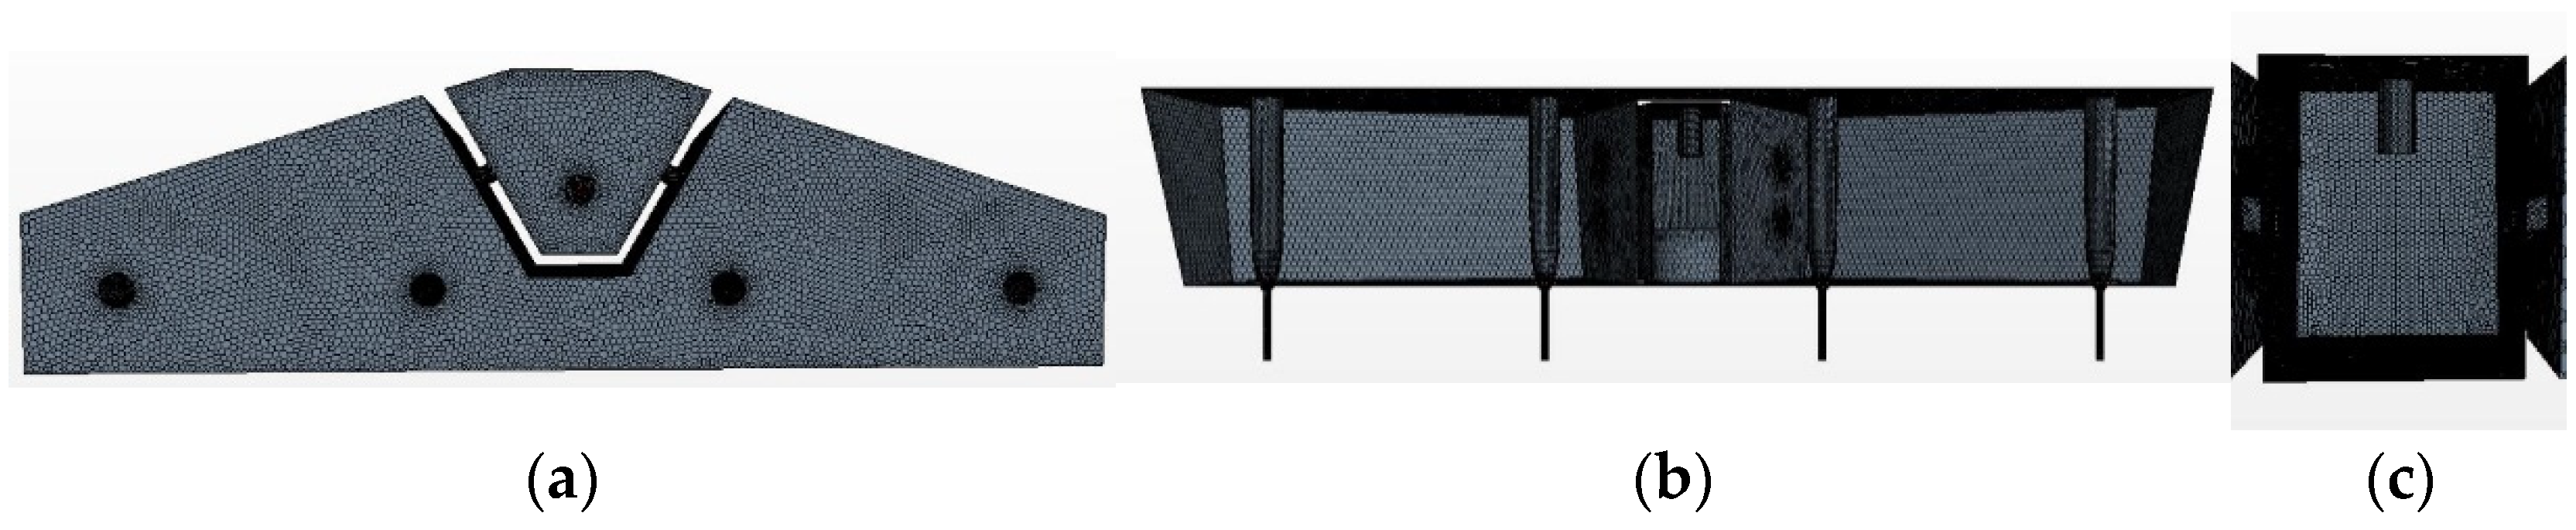
The passive scalar transport model is used to predict the transport process of a tracer in the water and the model can be described as follows:
t ( ρ ω ) + ( ρ u ω ) = ( ρ D e f f ω ) ,
where ω is the volume fraction of the tracer in the computational domain—that is, the proportion of the tracer in the cell to the cell volume—ω = 1 means the cell is filled with tracer, ω = 0 means the cell is filled with water. Deff is the effective diffusion coefficient of passive scalar, m2/s; ω (outlet cross-section area averaged) of the outlet is used as the outlet measurement value for future analysis of the RTD curve.

2.2.5. Mesh

The 3D geometric models of tundishes were established. A polyhedral mesh was used in the simulation, as shown in Figure 3.

2.2.6. Boundary Conditions

  • No-slip conditions were applied at all solid surfaces for the liquid phase;
  • A constant inlet velocity was used, and the inlet velocity was 0.58 m/s;
  • At the tundish outlet, the outflow boundary with constant mass flow rate condition was applied;
  • The outlet pressure was set to a constant value of one standard atmosphere;
  • The roughness of turbulence inhibitor, inlet ladle shroud, stopper rod and raised part of the tundish bottom near the stopper rod were set as 1 × 10⁻⁵ m, Furthermore, the roughness in other solid walls was set as 2 × 10⁻⁶ m.

2.2.7. Initial Conditions

The tracer injection is a pulsating process within a time interval; when the flow field calculation converges, a passive scalar for a certain period of time is injected to calculate its transport process. The injection time is calculated from the volume of tracer added in the water model experiment and the inlet cross-sectional area and inlet velocity of the tracer in the numerical simulation. In the simulation, ω = 0 in the whole region cells except the tracer injection cells, while in the tracer injection cells ω = 1. In this study, the tracer injection time was 0.226 s, which corresponds to a volume of 50 mL in the water model experiment.

2.2.8. Solution Procedure

The governing equations were solved by using the software Simcenter Star-CCM+ [38], which is based on the finite volume method. The steady-state simulation was iteratively calculated by the RKE-2L turbulence model, and the initialization of the transient simulation case was based on the steady-state simulation result. The solution algorithms for velocity and pressure were calculated using the SIMPLE Method. The convergence criterion is that the residual values of all variables are less than 1 × 10⁻³. For the transient simulation, the time step is gradually increased, the initial time step is 0.002 s, the increase factor is less than 1.25 times, the maximum time step is 0.5 s, and each time step includes 30 iterations.

2.3. Analytical Method

In this study, the flow characteristics in the four strand tundish were analyzed by the following two analysis methods.
First method: RTD curve analysis method.
The time dependent volume fraction of the tracer in each strand outlet is obtained and termed Ci(θ). The summation of all the data of each strand and the total C curve is obtained. The E curve is post-processed by dimensionless analysis of the total C curve; according to Equations (20)–(23), the E curve (RTD curve) of each strand can be obtained:
E i ( θ ) = C i ( θ ) / 0 [ i = 1 n C i ( θ ) ] d θ
θ = t / t t h e o r y
t t h e o r y = V / Q i n
In   actual   calculation :           E i ( θ ) = C i ( θ ) / θ = 0 θ m a x i = 1 n [ C i ( θ ) Δ θ ]
where Ei(θ) is the dimensionless concentration of the strand i of the four-strand tundish at time θ. Ci(θ) is the volume fraction ω of the strand i of the four-strand tundish at the outlet at dimensionless time θ. θmax is the maximum monitoring dimensionless time. t is the monitoring time, s. ttheory is the theoretical residence time, s. V is the volume of water in the tundish, L. Qin is the volume flow rate at the tundish inlet, L/s.
Second method: outflow percentage analysis method.
The percentage of outflow refers to the ratio wi(t) of the mass of tracer flowing out of the outlet at time interval from t to t + Δt to the total mass of tracer added in the inlet. Besides, the cumulative tracer outflow percentage Wi(t) could be obtained by an integral of wi(t) with time from 0 to t. The physical meaning of cumulative tracer outflow percentage is the ratio of the mass of tracer flowing out of the outlet from time 0 to t to the total mass of tracer added in the inlet. The following formulas could be used:
w i ( t ) = m i ( t ) / M
M = ρ t r a c e r Q i n ω 0 Δ t
m i ( t ) = ρ t r a c e r Q o u t , i ω i ( t ) Δ t
W i ( t ) = t = 0 t w i ( t ) ,
where mi(t) is the mass of the tracer flowing out of the strand i of the four-strand tundish at time interval from t to t + Δt, kg. M is the total mass of the tracer added in the inlet, kg. ρtracer is the density of the added tracer, kg /m3, in the numerical simulation, ρtracer is numerically equal to fluid density ρ; ω0 is the volume fraction of the added tracer (the volume fraction of the added tracer is 100%); Δt′ is the time interval of adding tracer, s; Qout,i is the volume flow rate at the outlet of the strand i of the four-strand tundish, L/s. ωi(t) is the volume fraction of the tracer flowing out of the strand i of the four-strand tundish at time interval from t to t + Δt. In the numerical simulation, ωi(t) is calculated by the monitoring ω value of each strand of the tundish multiplying the time step interval Δt.
In order to evaluate the uniformity of each strand of the multi-strand tundish intuitively, this paper uses Equation (28) to calculate the variance of the outflow percentage curve of each strand at the same time, and obtains the outflow percentage variance SW(t) of each strand at t:
S W ( t ) = i = 1 n [ W i ( t ) 1 n i = 1 n W i ( t ) ] 2 n 1 .
The time average variance S ¯ W can be calculated:
S ¯ W = 0 t max S W ( t ) d t / t max = t = 0 t max S W ( t ) Δ t / t m a x .
n is the number of strands; in this study, n = 4. tmax is the maximum monitoring time.

3. Results and Discussion

3.1. Verification and Validation

The software Simcenter Star-CCM+ has been verified by many software users for simulating complex fluid flow. In this section, following the study of Chen et al. [28], the verification of a mesh independence study and validation against tracer dispersion and tracer concentration RTD curves in physical models are carried out as a first step.

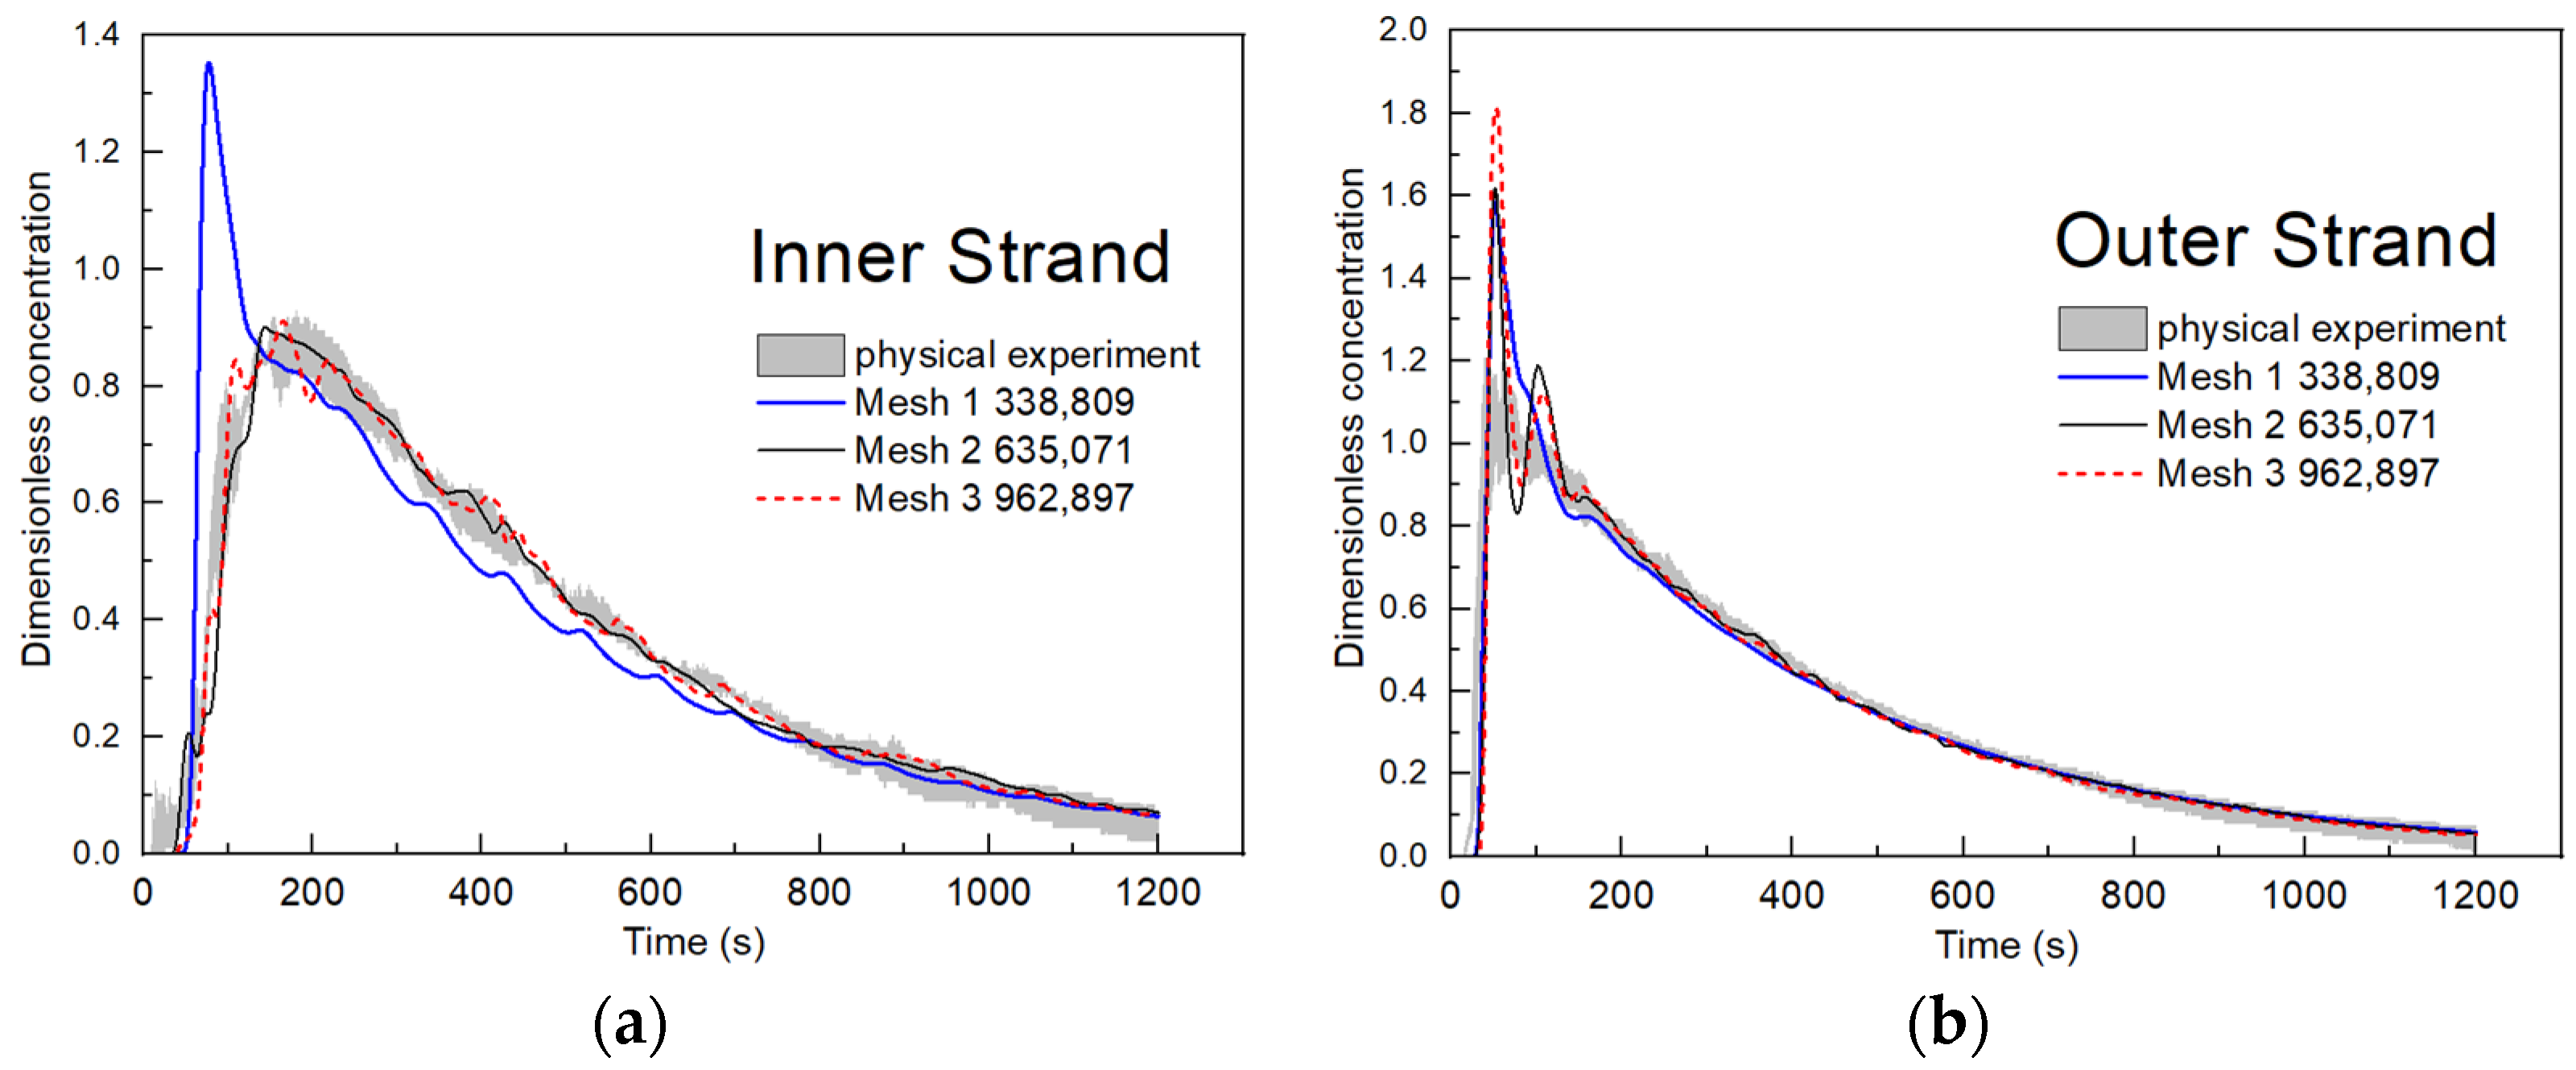
3.1.1. Independent of Computational Mesh

The utilization of an adequately refined and high-quality mesh was an important step in achieving accuracy in numerical simulations. As shown in Figure 4, a mesh independency study was carried out to estimate an appropriate mesh density for the RTD analysis. The numbers of cells of mesh 1, mesh 2, and mesh 3 are 338,809, 635,071, and 962,897, respectively. For the RTD curve of the outer strand, the three meshes are approximately consistent. However, for the inner strand, the numerical simulation results of a rougher mesh (mesh 1) do not fit well with the physical modeling results, while the numerical simulation results of the other two finer meshes fit well with the physical modeling results. With the considerations of the accuracy and the computing load, the computations were carried out by mesh 2.

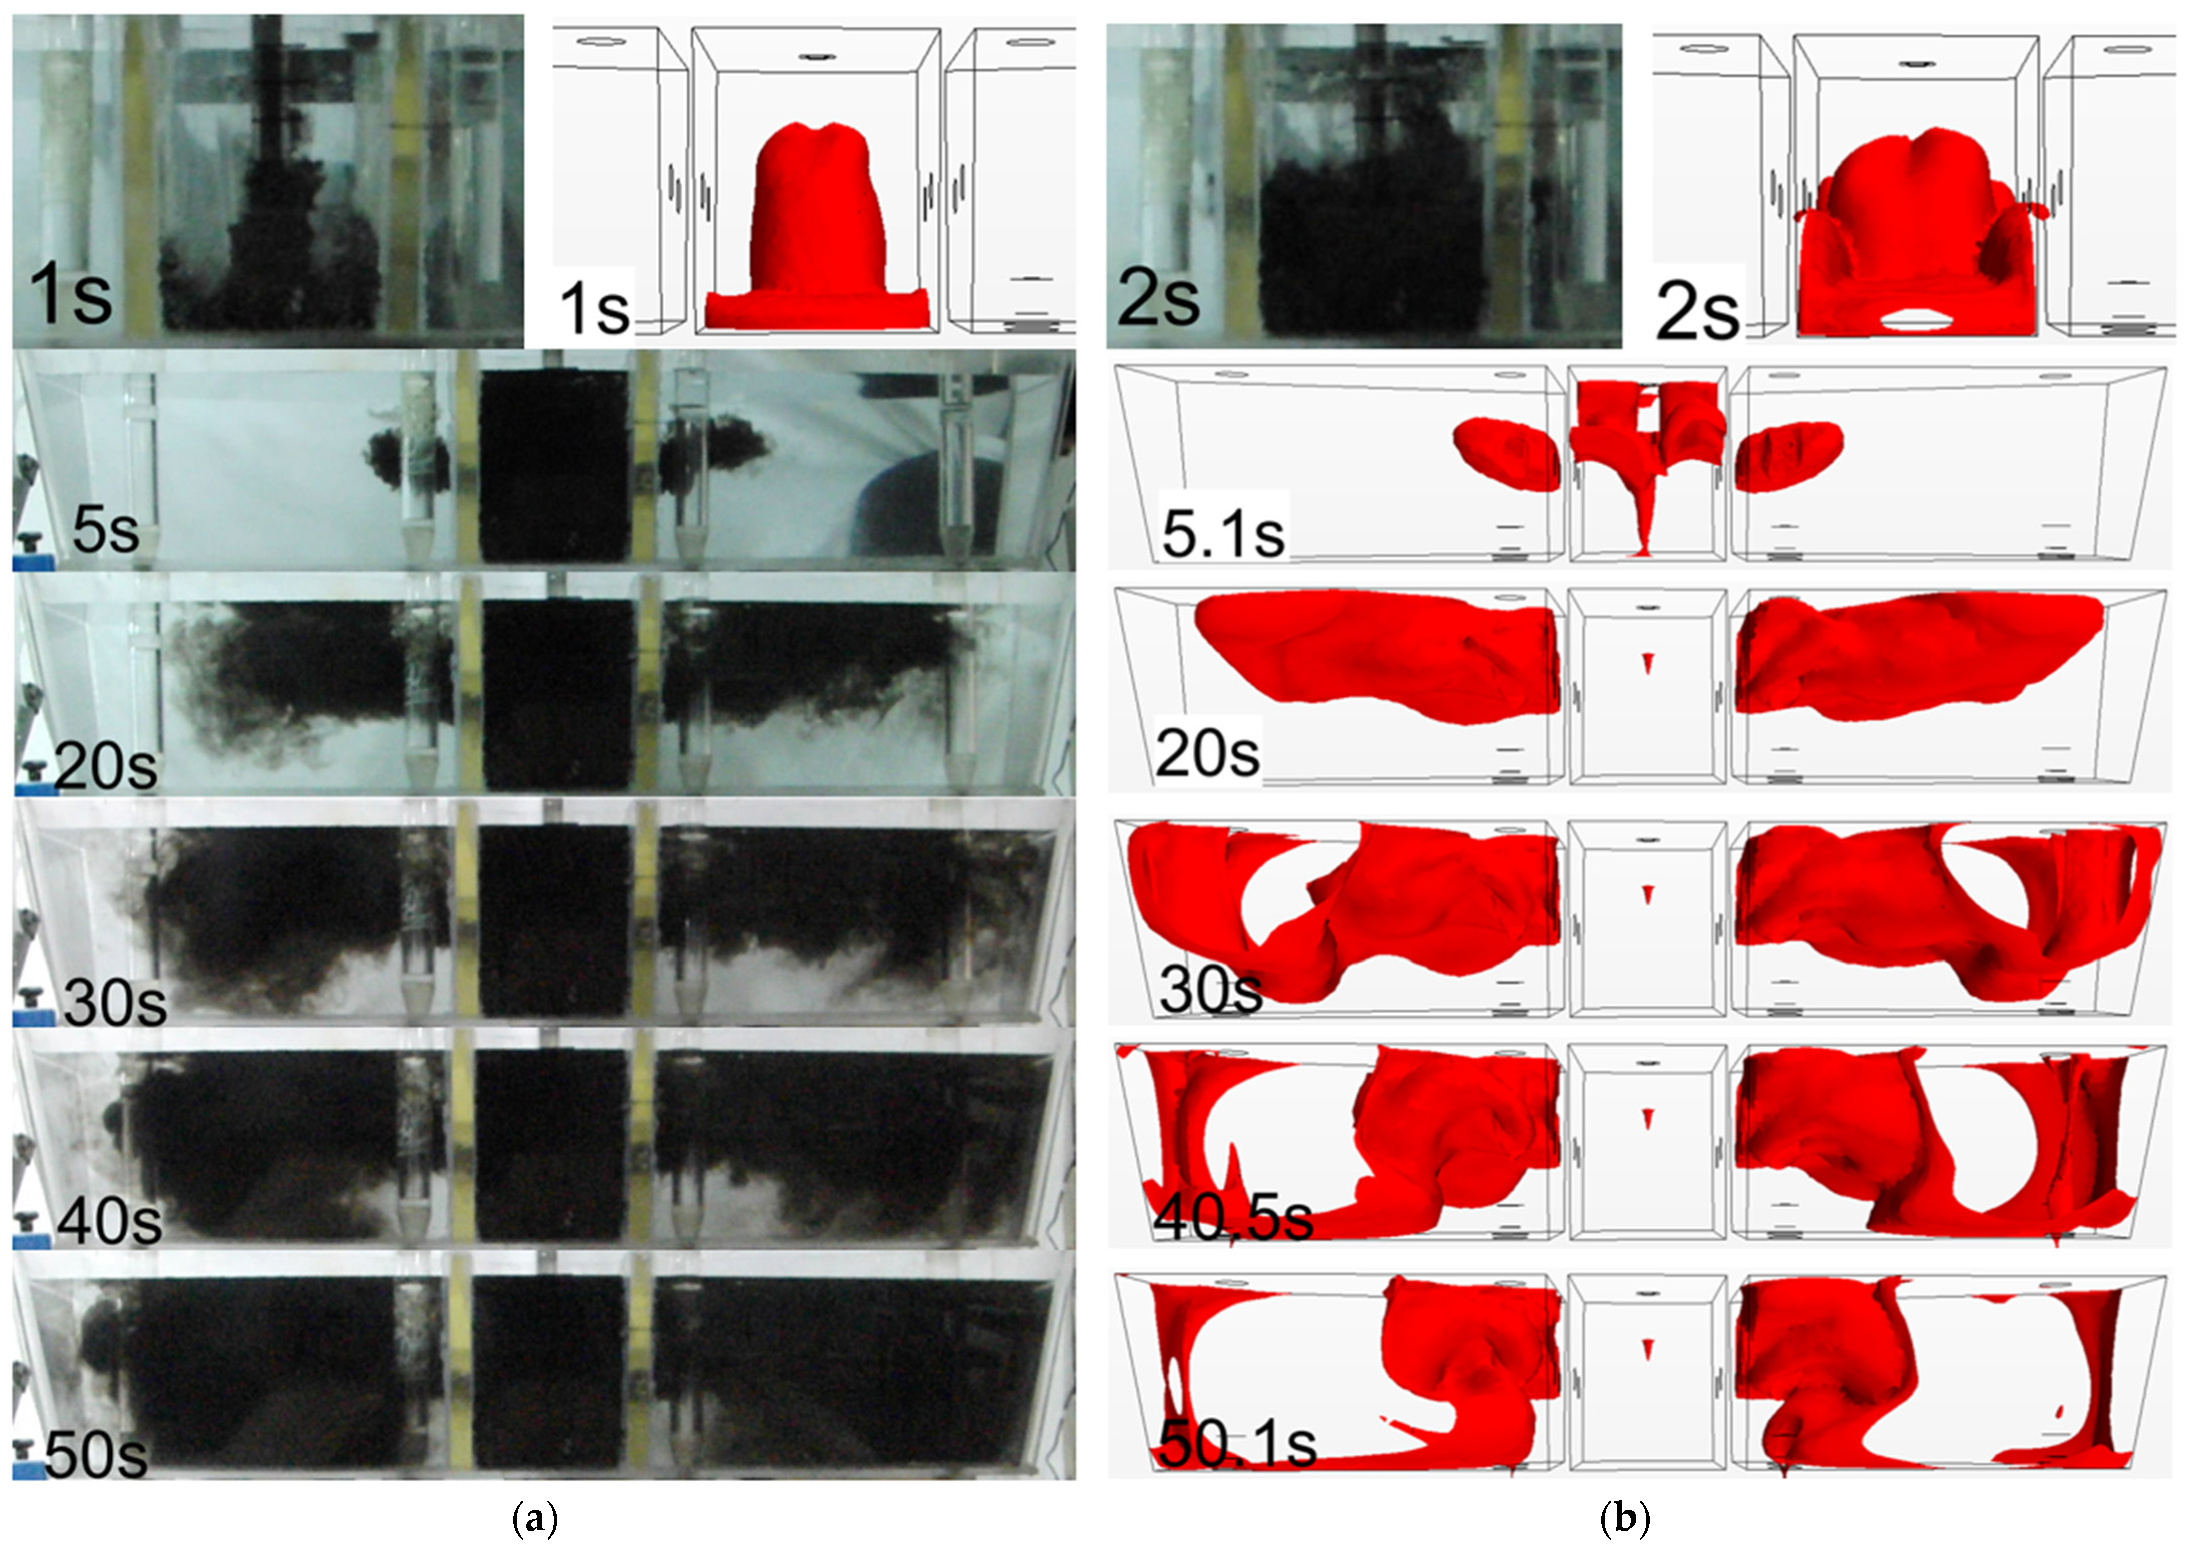
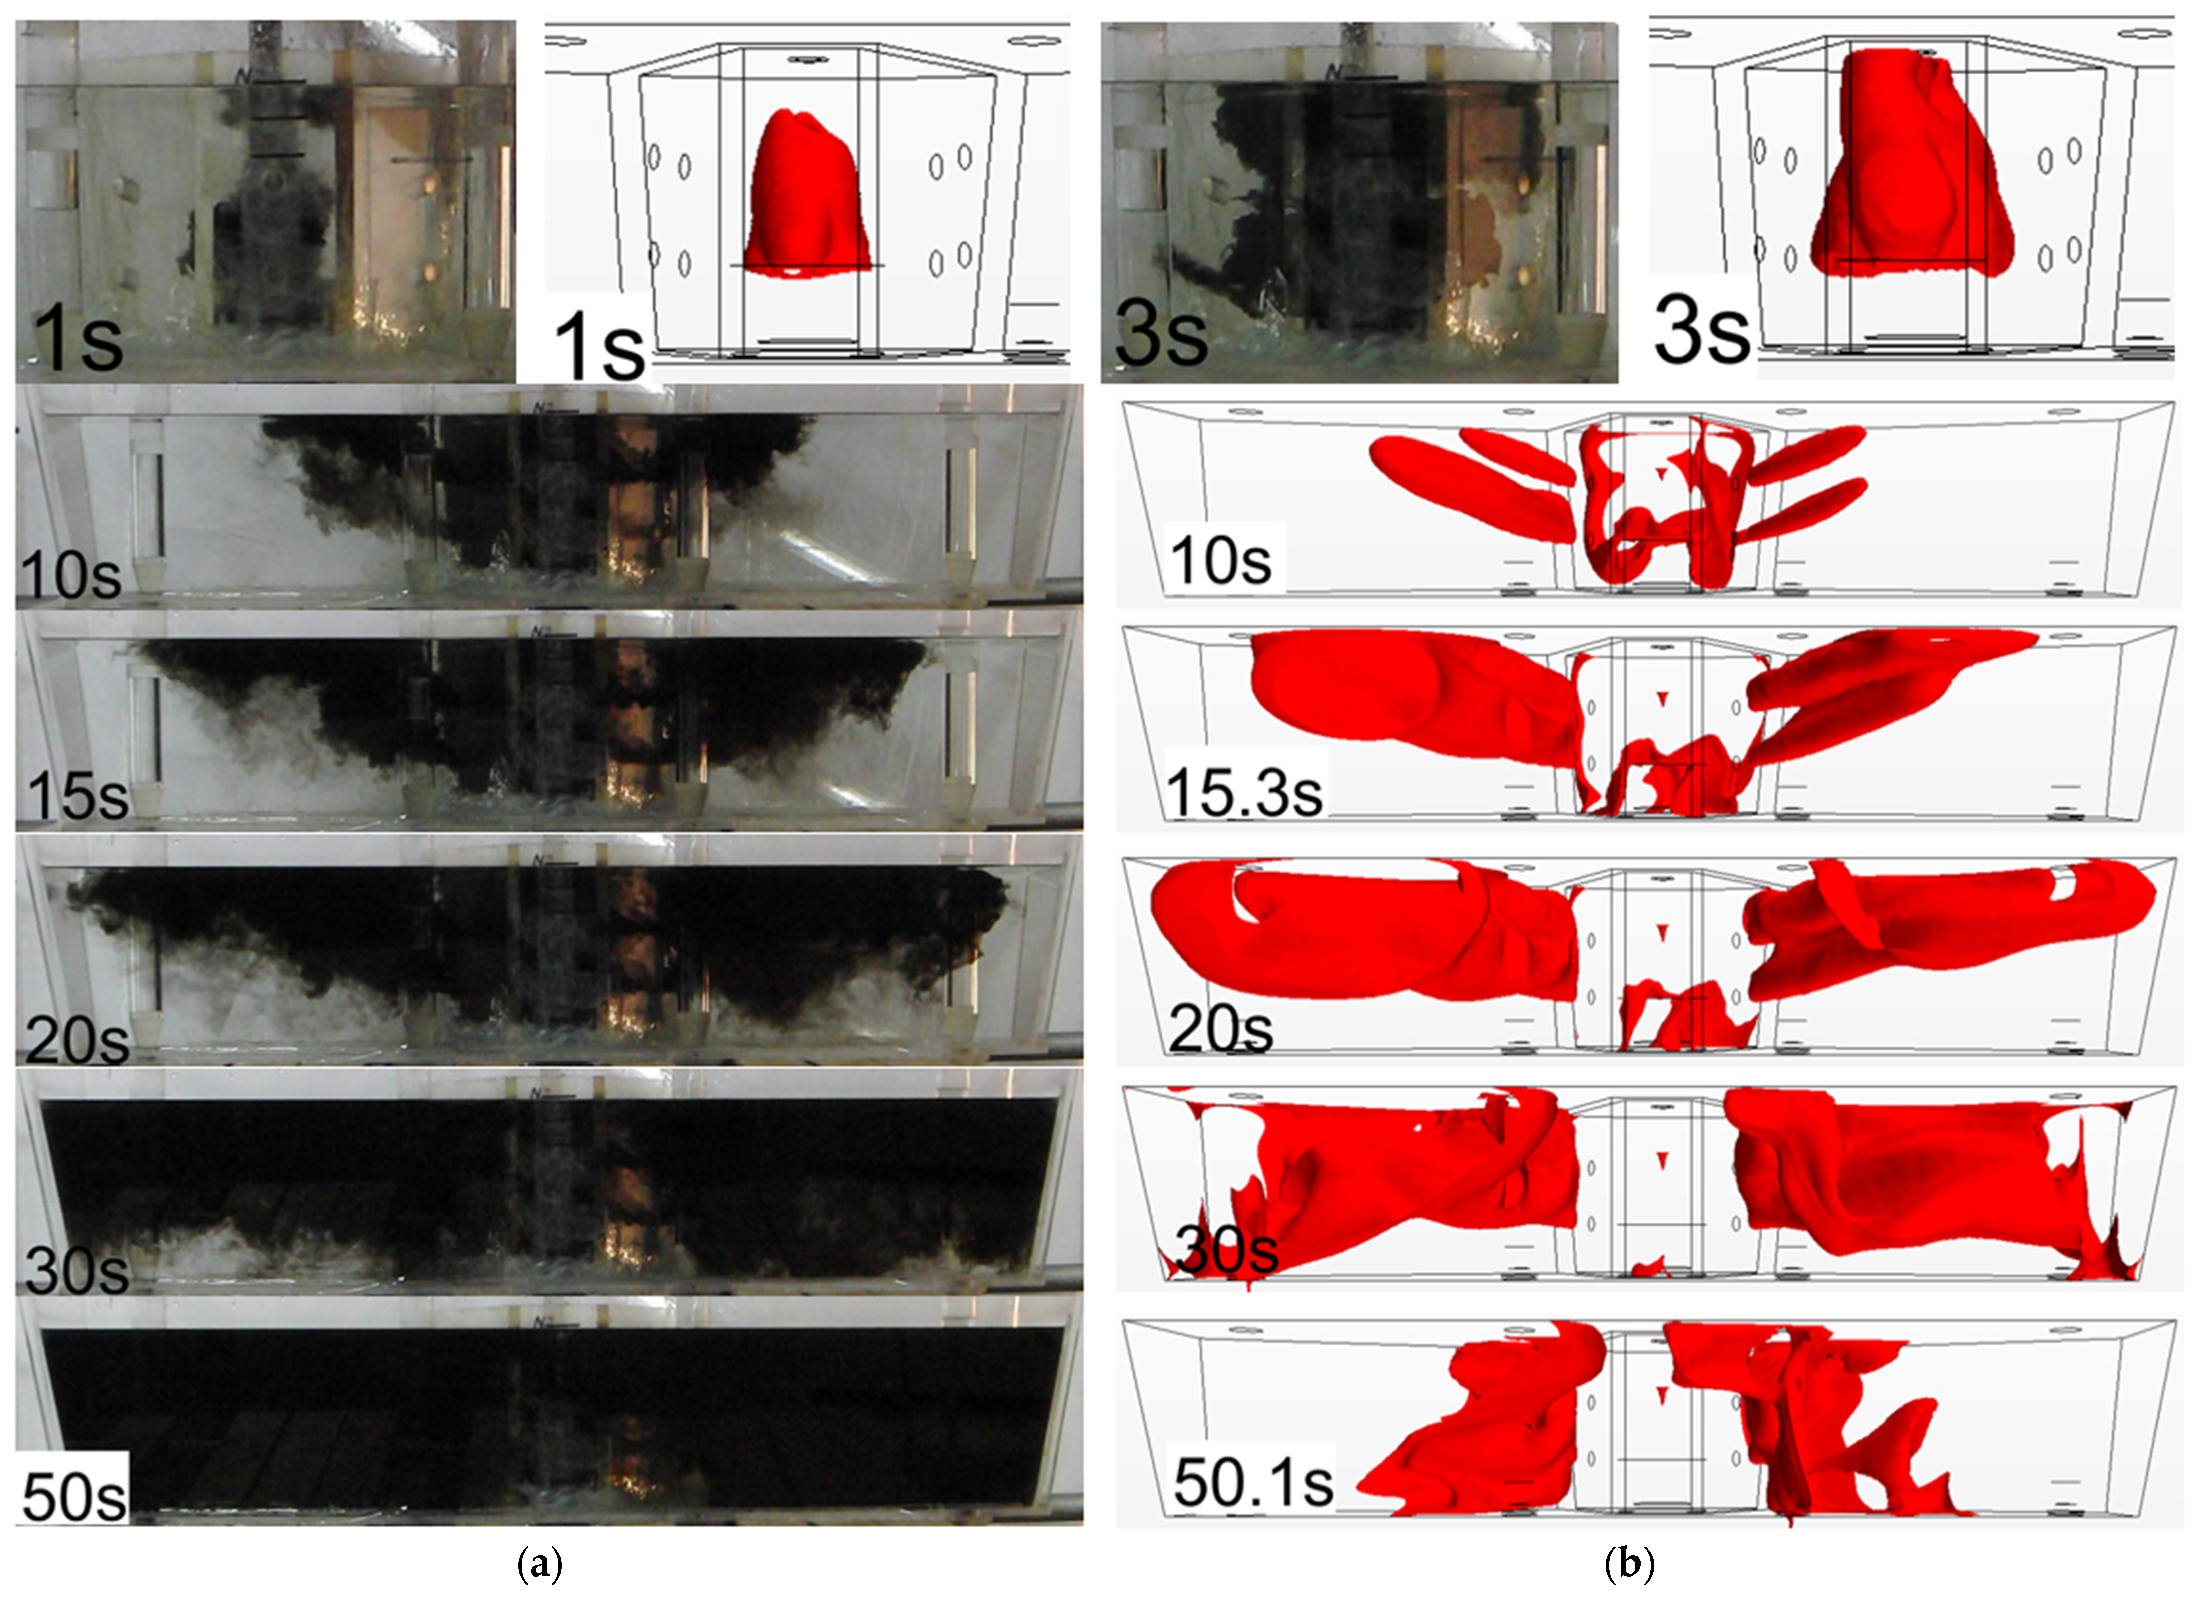
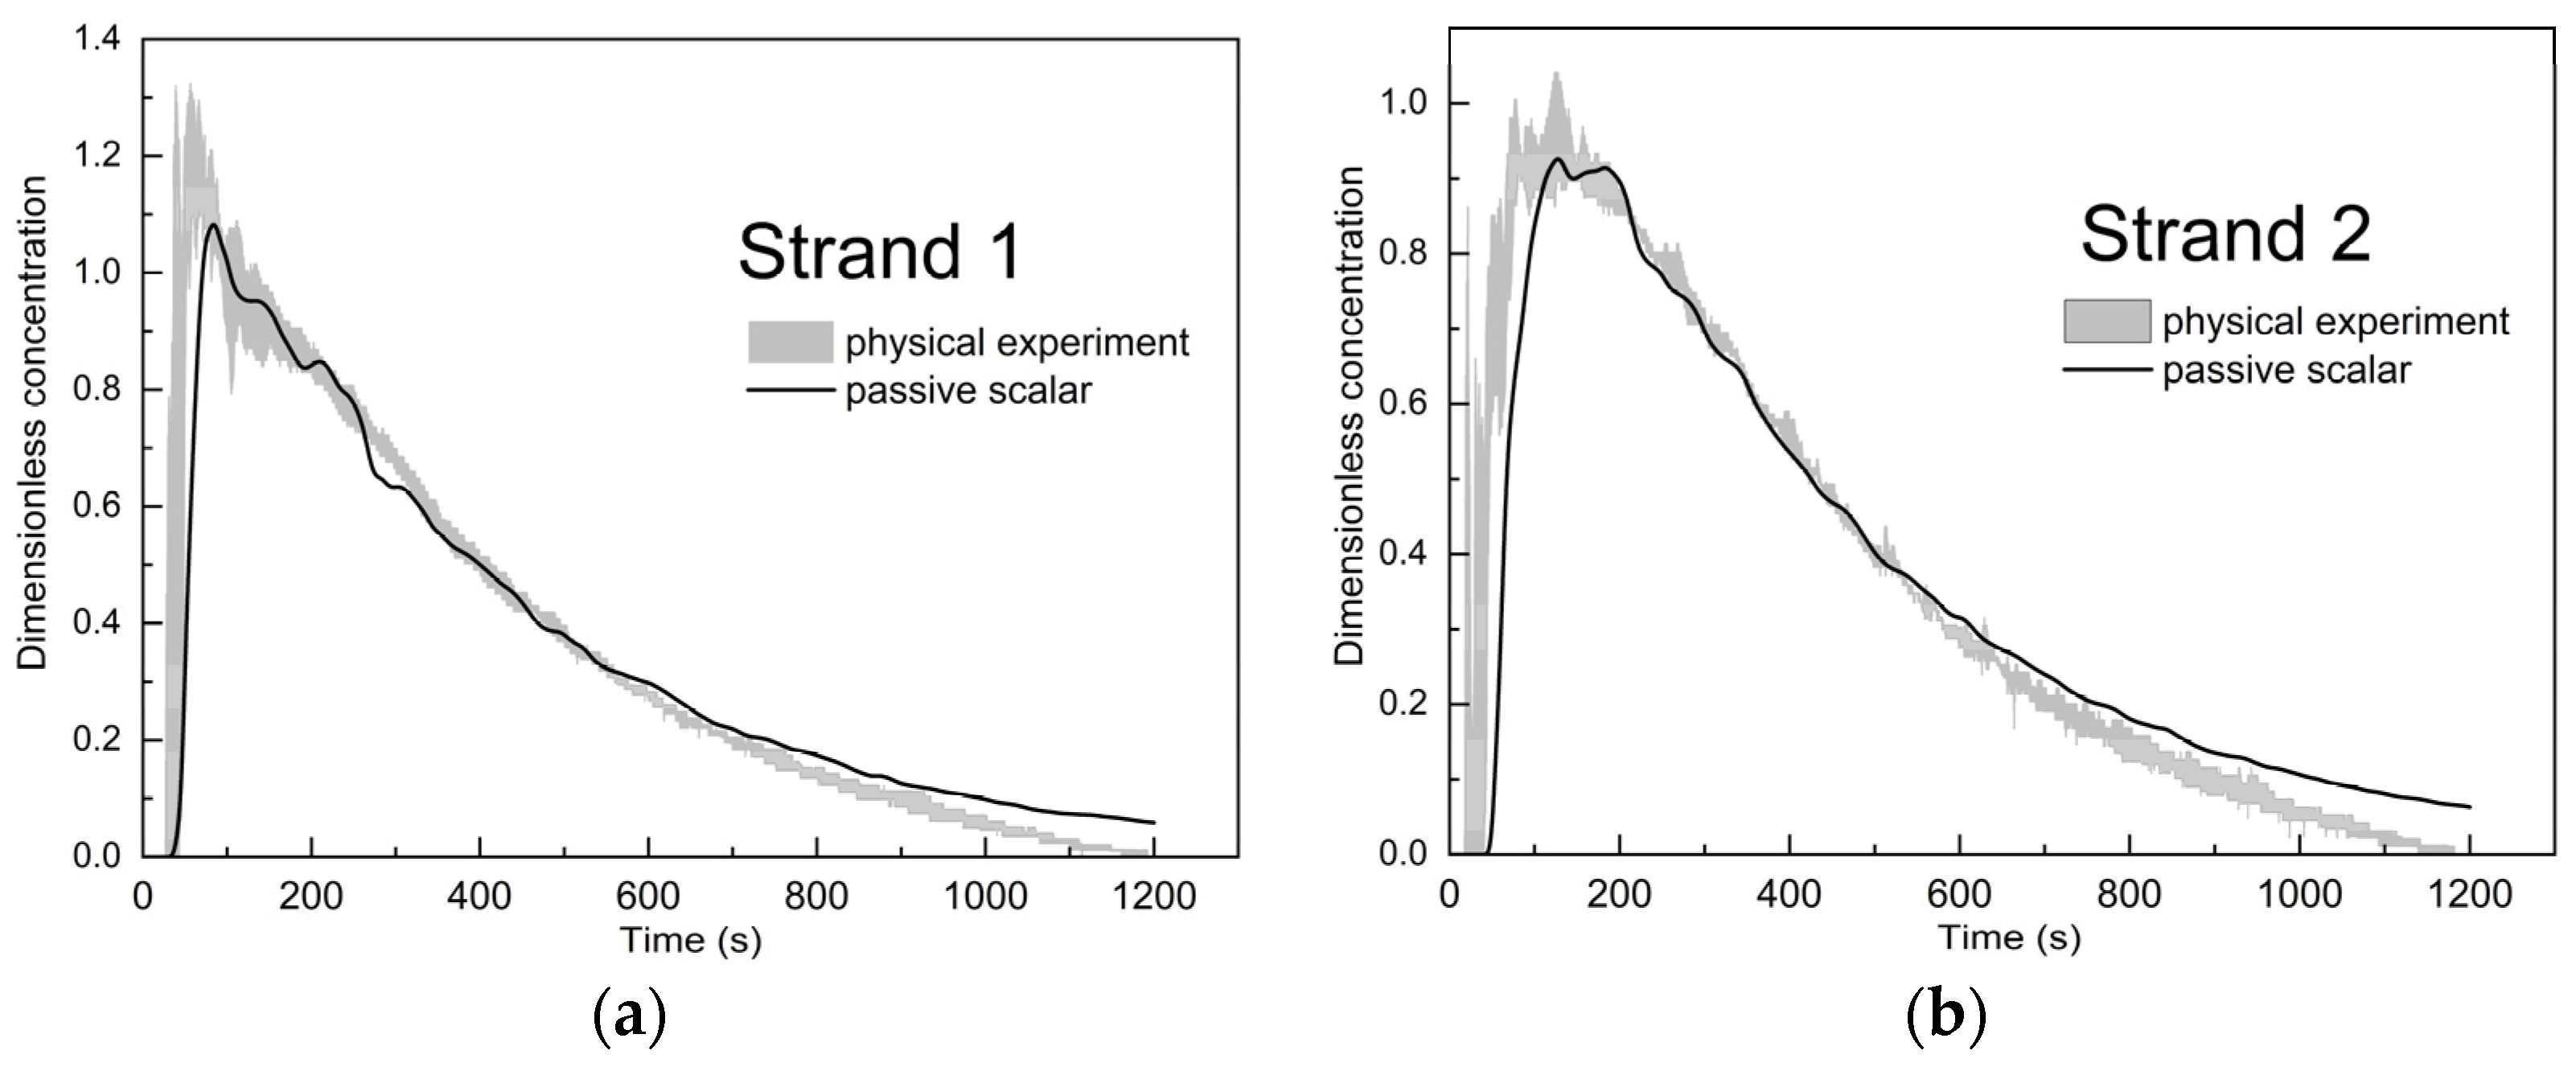
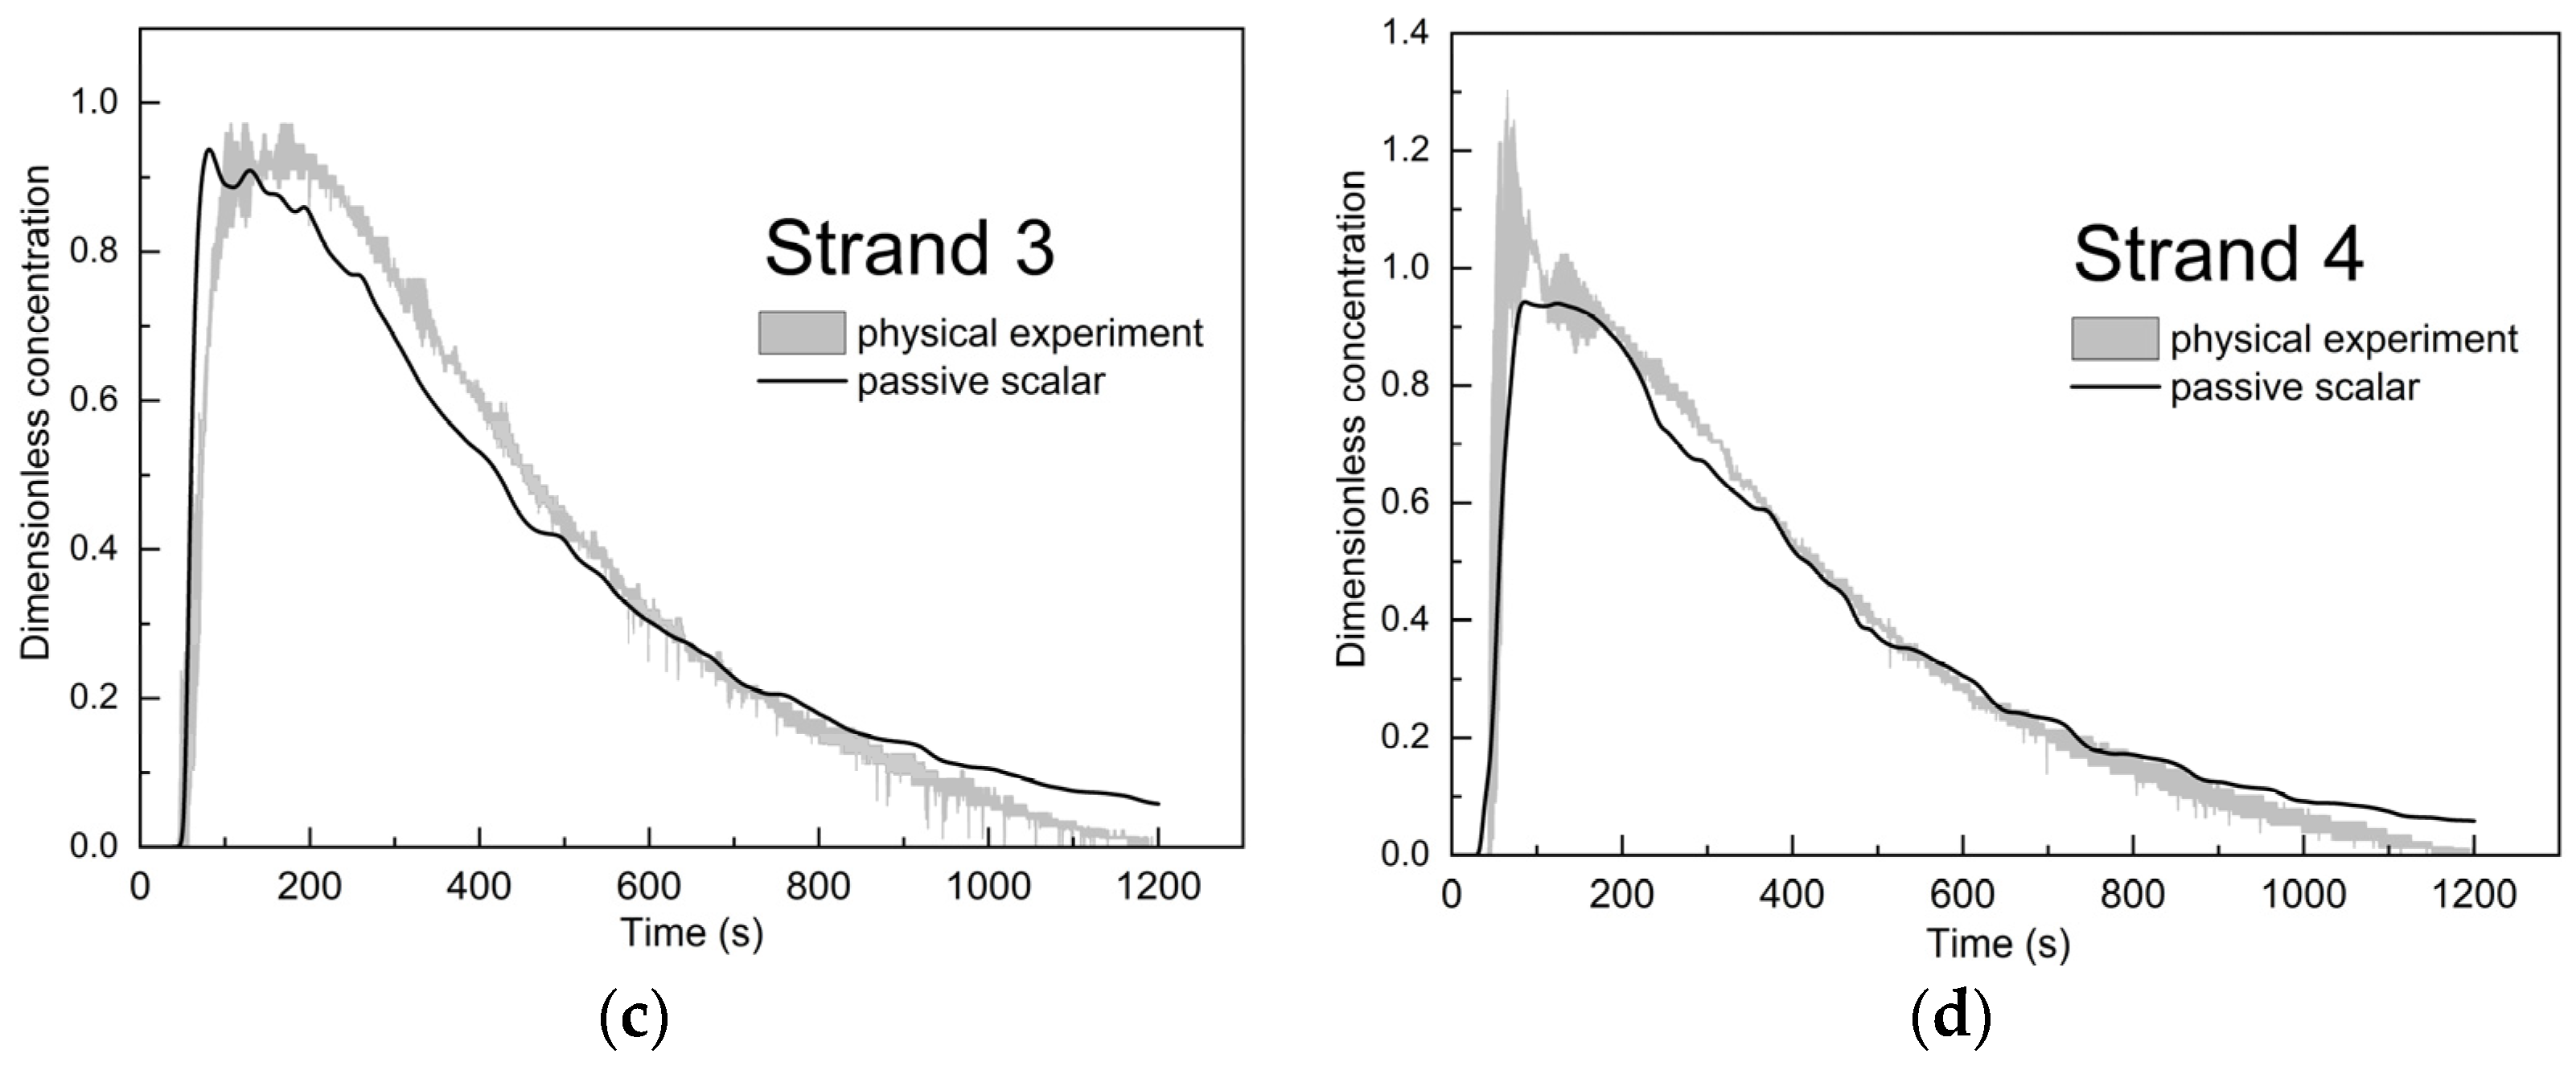
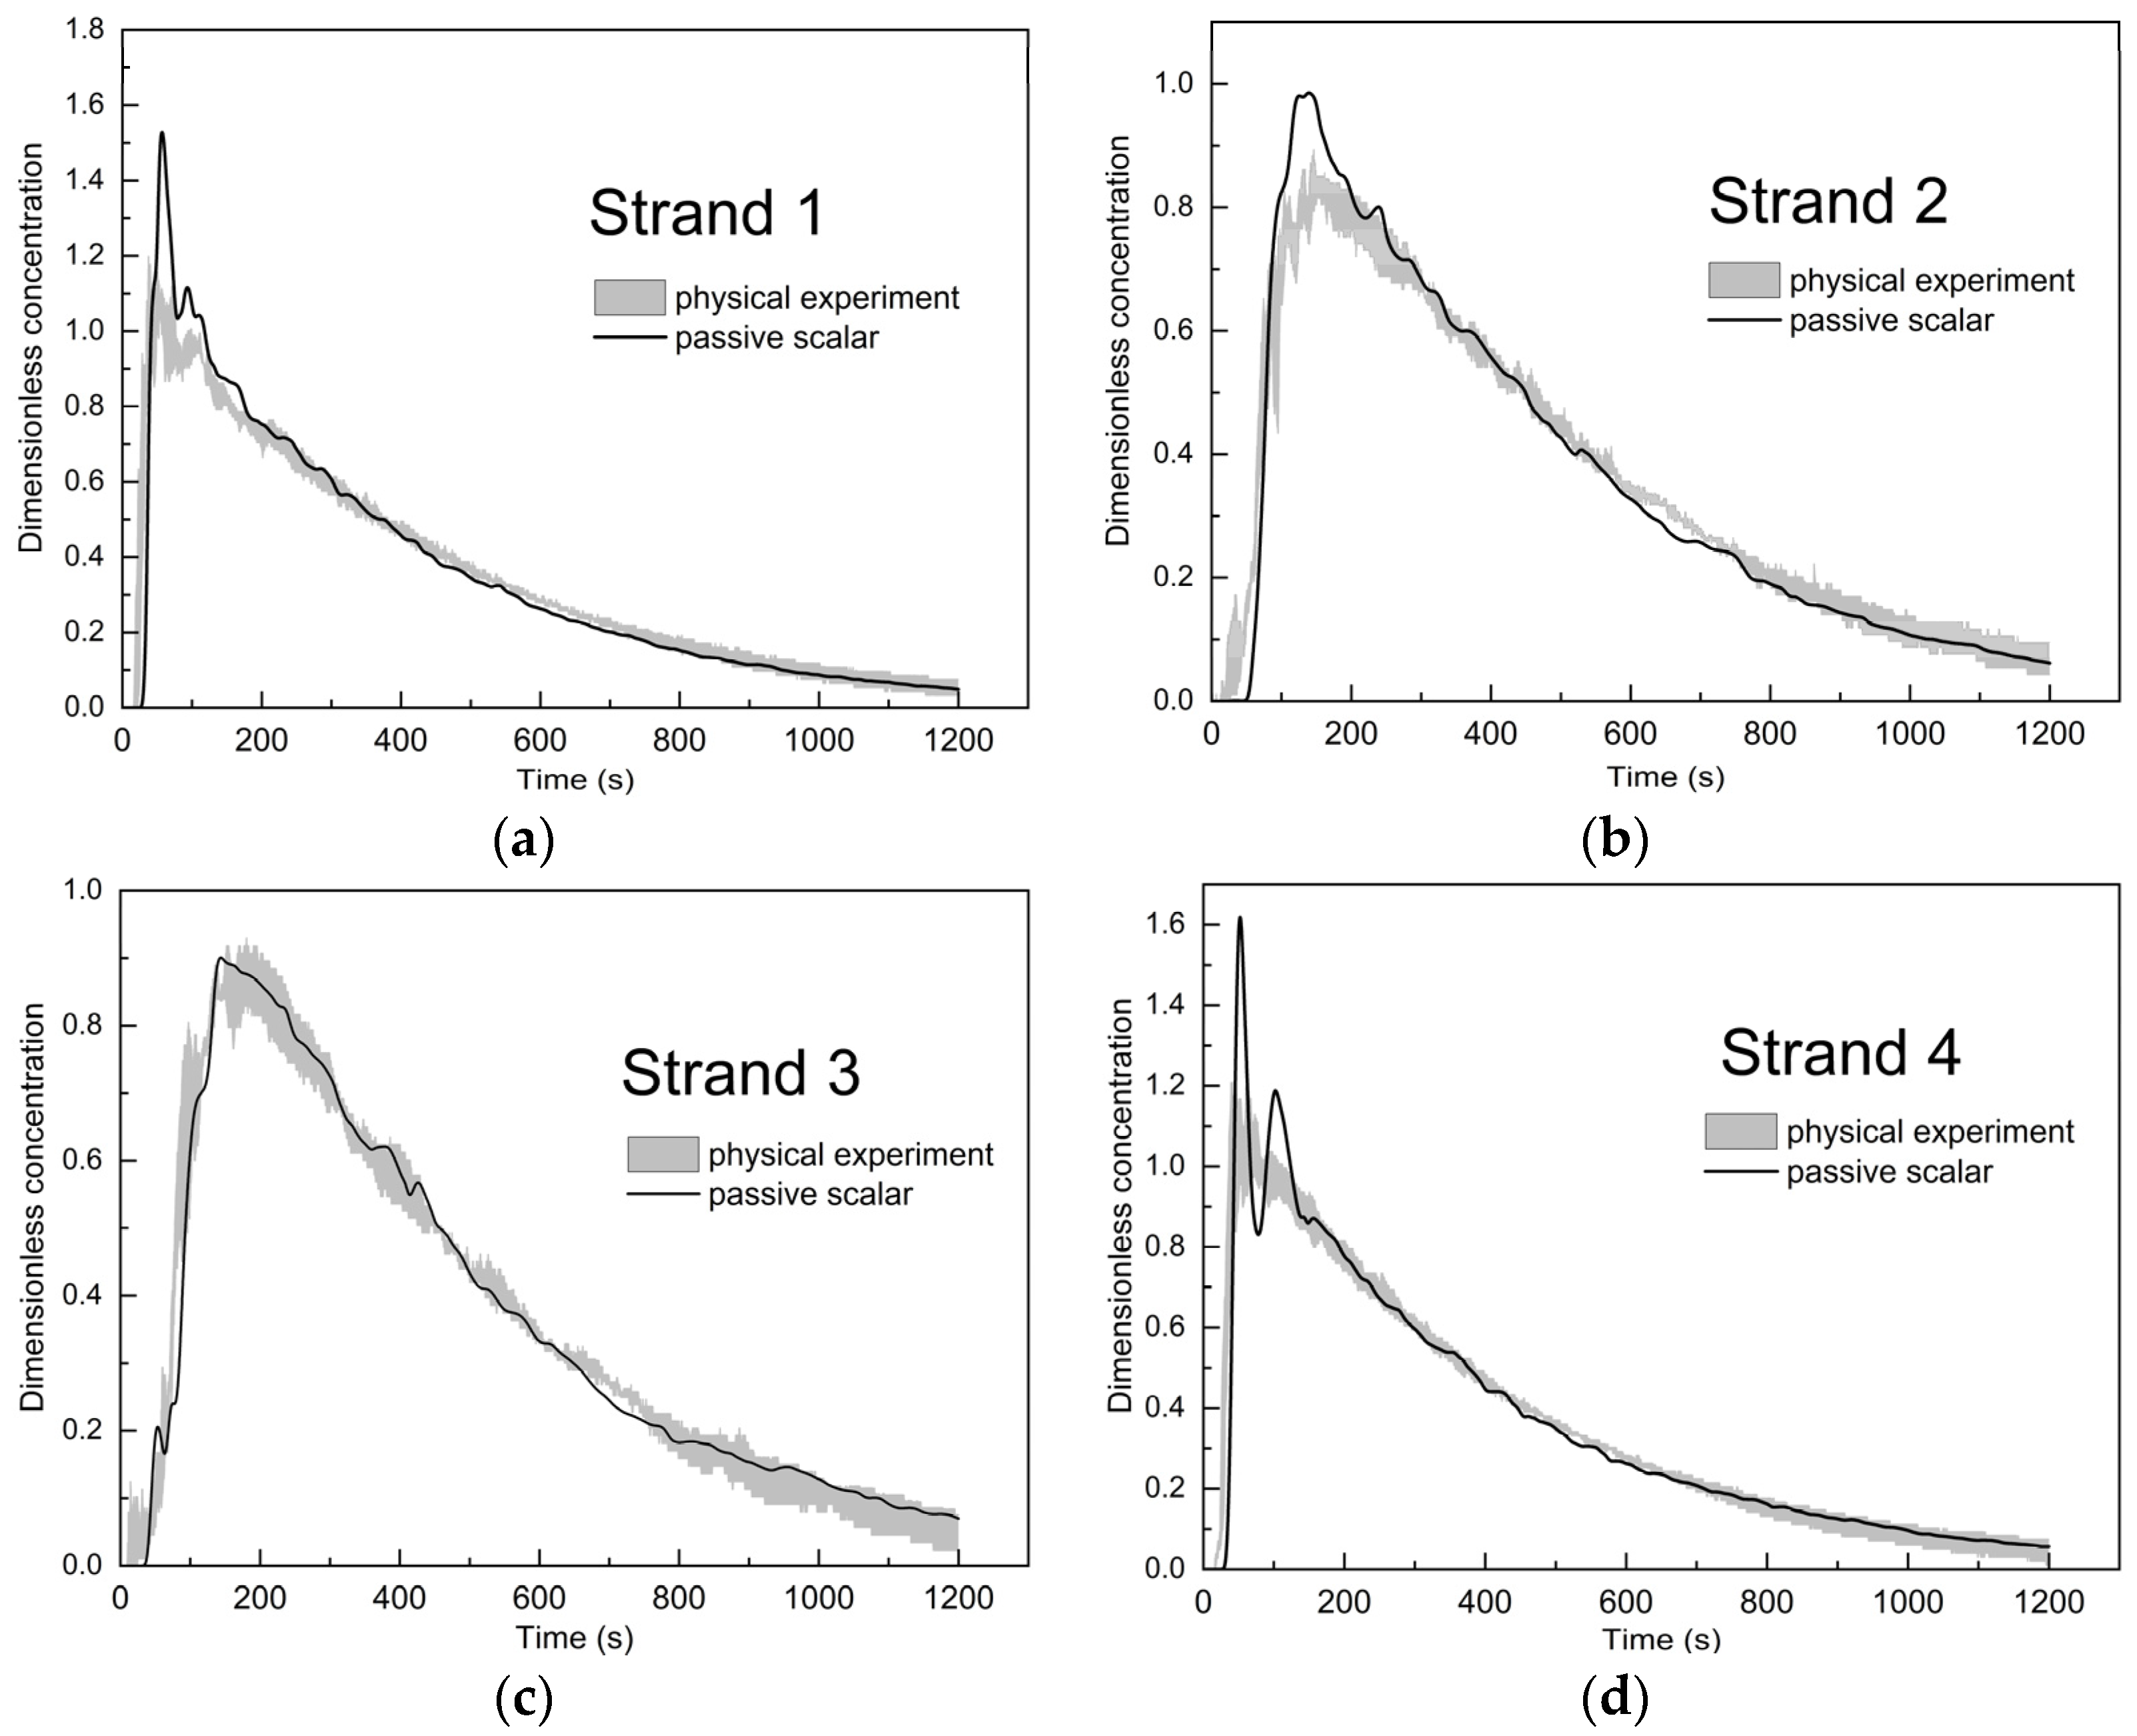
3.1.2. Model Validation

(1)
Black ink dispersion validation
Figure 5 shows the comparison of ink diffusion photographs in a water model and the iso-surface (ω = 10−5) figures of numerical simulation results of a double-weir tundish. The iso-surface volume fraction value is 10−5 in the whole computational domain. During the injection periods of tracer, the iso-surface contours may represent the propagation edge of a tracer in a numerical simulation [28]. A successive evolution of the contours is good for visualizing the tracer dispersion before the well mixed period. Noted that after 30 s in Figure 5, the area located between stopper rod 1 and 2 was not colored. That means the value of the tracer in the grids is larger than the setting value 10−5 and the tracers in those areas are well mixed. This is different from the flow visualization in black ink since it is easy to observe black in all the parts.
The tracer flows from the ladle shroud and hit the bottom of the tundish. Afterwards they moves upwards along the sidewall of the pouring chamber. When it flows upwards to the location of the holes in the weir, a small portion of tracer flows out from the holes. Afterwards the tracer in the pouring chamber continues to flow upwardly and is gradually mixed in the pouring chamber between the two weirs. After mixing in the pouring chamber, the tracer flows through the holes to the main flow areas which are located between stopper rods 1 and 2 in the left side as well as between stopper rods 3 and 4 in the right side of the tundish. Afterwards, a large portion of tracer flows to outlet 2 and outlet 3 by the circulating flow stream along the bottom of the tundish, while a small portion of tracer diffuses to outlet 1 and outlet 4.
Figure 6 shows similar comparison results of a u-shaped weir tundish. The tracer flows from the ladle shroud and hit the turbulence inhibitor. Afterwards, the tracer disperses upwards along the sidewall of the weir. During the upward flow period, a small portion of black ink tracer diffuses through the lower hole in the left part of weir, and the residual portion of tracer is mixed in the pouring chamber. Afterwards, a large portion of tracer flows into the main flow areas through the upper and lower holes in the weir. After the tracer flows out through the holes, it disperses to the locations near the stopper rods 1 and 4 at the free surface, and flows to outlet 1 and outlet 4 followed by the circulating flow stream at about 30 s. The tracer flows to outlet 2 and outlet 3 later on at about 50 s.
(2)
RTD validation
Figure 7 and Figure 8 show the comparison of RTD curves of a physical model and numerical simulation of a double-weir tundish and a u-shaped weir tundish. The gray shaded part in the figure is the fluctuation range of the physical model experimental data, and the black lines are the numerical simulation results. It can be seen from the figure that the peak time and trend of the RTD curve of the numerical simulation result and the physical model result are approximately consistent.
By comparison, the tracer dispersion of the numerical simulation and the physical model are approximately identical, and the results of RTD curve fitting are excellent, indicating that the present numerical simulation and mesh are reasonable at simulating tracer dispersion in the four strand tundishes.

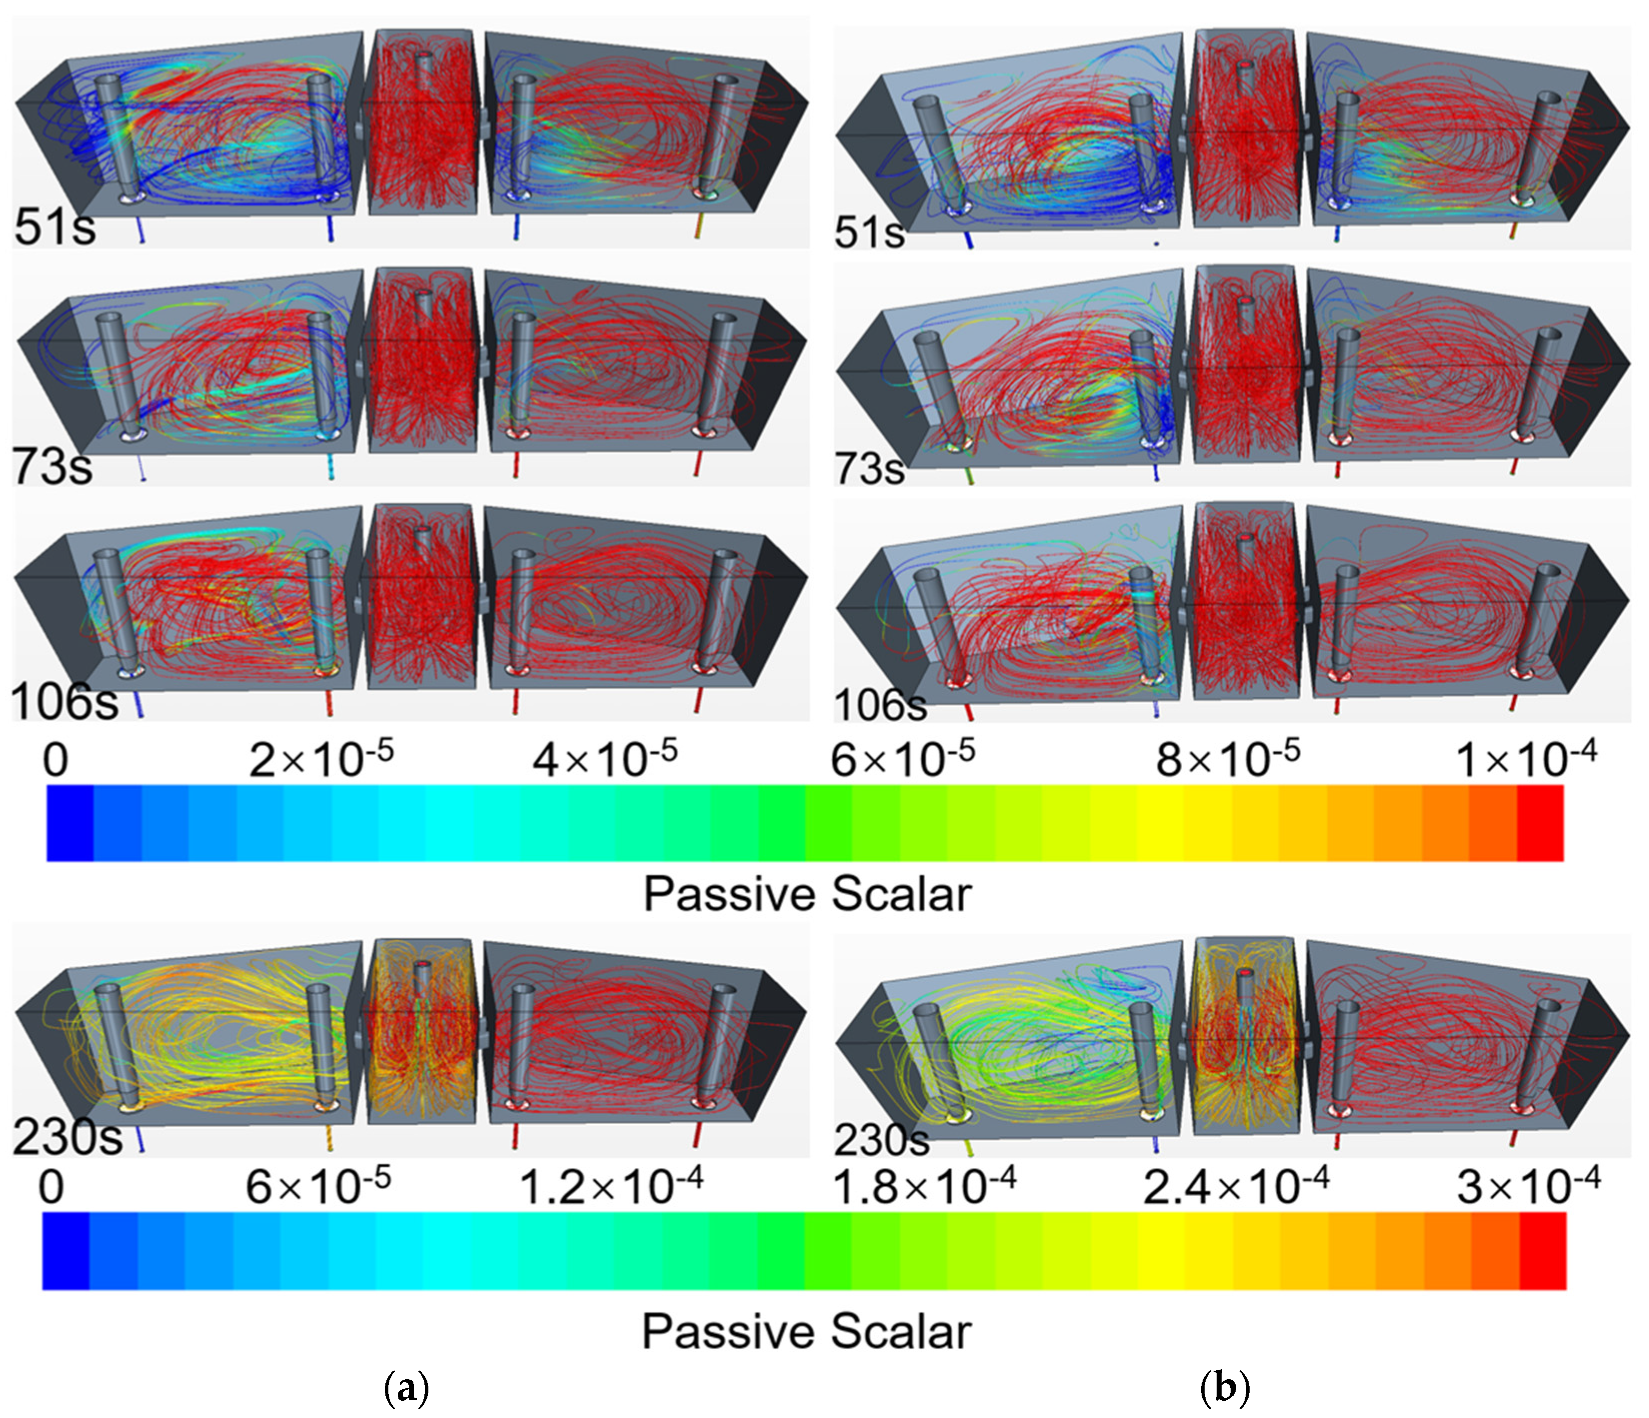
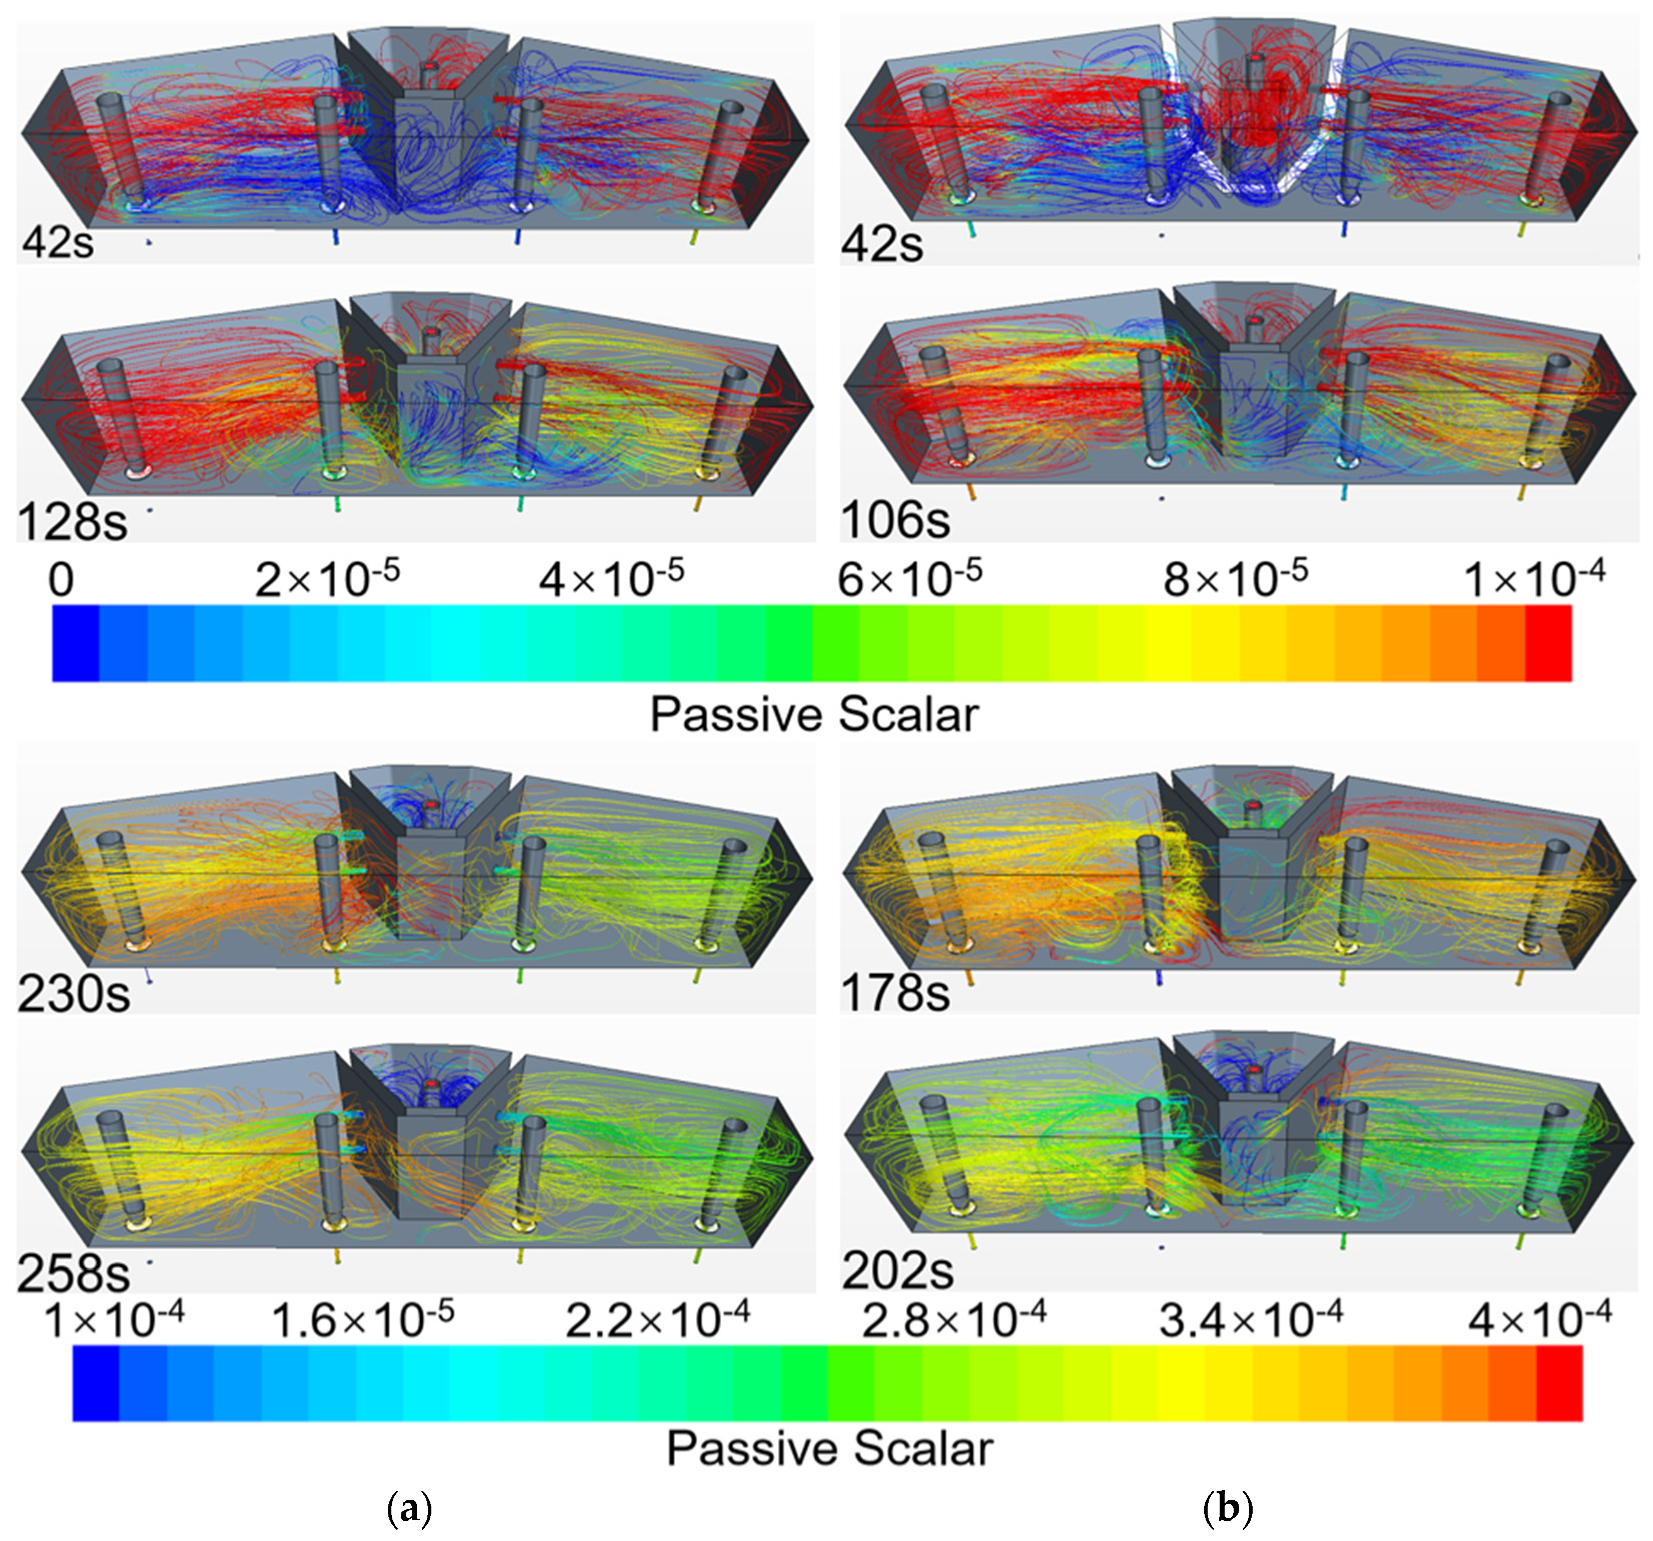
3.2. Fluid Flow and Tracer Dispersion in Tundishes under Single-Strand Blockage Conditions

Figure 9 shows the streamline evolution of the double-weir tundish under the single-strand blockage condition. When strand 1 is blocked, the transport of the tracer from the inlet shroud into the pouring chamber is consistent with the transport process under normal conditions. The streamline in the blocked side (left part) of the tundish is in dynamic change. Compared with the normal condition as described before, only a small portion of tracer disperses to the left side of stopper rod 1 and a major portion of the tracer flows to outlet 2 by the counterclockwise circulating flow stream along the bottom of the tundish. The tracer is gradually mixed in the left part of the tundish. At about 200 s, the counterclockwise circulating flow is gradually formed. While the streamline evolution in the unblocked side (right part) is basically the same as that under normal conditions. The concentration of tracer in the unblocked side is higher than that on the blocked side.
When strand 2 is blocked, the streamline evolution in the pouring chamber and the unblocked side is the same as that under normal conditions. The streamline in the blocked side (left part) of the tundish is similar to the case in which strand 1 is blocked. The difference is that a portion of tracer disperses to outlet 1 in the form of “short-circuit flow”, for example the result at 73 in Figure 9b. Afterwards, the tracer is mixed in the counterclockwise circulating flow and flows to outlet 1.
Specially, no matter which strand is blocked, the streamline evolution in the unblocked side (right part) is basically the same as that under normal conditions. This is because the two sides of the double-weir tundish remain relatively independent, so the blocked side has less influence on the flow in the unblocked side.
Figure 10 is the streamline evolution of the u-shaped weir tundish under the single-strand blockage condition. After the tracer flows through the holes of the u-shaped weir, it flows directly to the areas near the free surface of stopper rods 1, and part of the tracer flows downwards to outlet 1 in the form of “short-circuit flow”. The streamline shows a clockwise (top view) tendency along the left and back wall of the tundish to the main flow area. The flow pattern will accelerate the mixing in the tundish. When strand 1 is blocked, the flow field in the pouring chamber does not change significantly. There is a slight change of the streamline in the blocked side. The streams flow to outlet 2 at about 100 s along the abovementioned circulating flow stream. Finally, it forms a stable flow field after 200 s. In addition, since the two sides of the tundish are not isolated, it can be seen that the tracer flows from the left side through the space between the front part of the weir and the front wall of the tundish to outlet 3. For tracer outflow, the total volume of tracer flowing out from the left side (outlet 2) is less than that from outlet 3 and outlet 4 due to the blockage of strand 1. Thus, the concentration of tracer in the left part of the tundish is significantly higher than that in the right part.
When strand 2 is blocked, the overall flow field is basically the same as that of the case when strand 1 is blocked. The difference is that the tracer flows out from outlet 1 at about 42 s. The circulating flow stream transfers a large portion of tracer to outlet 1. A major portion of the tracer is flowing out from outlet 1. Thus, the tracer flowing from the left side through the weir to the right side is weakened. For tracer outflow, the tracer concentrations on both sides of the tundish were similar before 42 s, then the tracer concentration in the left part was slightly higher than that in the right part. After 170 s, the concentrations in both parts tended to be the same. This is due to the fact that when strand 2 is blocked, the flow stream flows out from outlet 1 earlier, resulting in a lower accumulation of tracer concentration in the left part of the tundish, and a small difference in the concentration of tracer in both parts of the tundish.
Figure 11 and Figure 12 show the outflow percentage curves and variance of outflow percentage curves of the double-weir tundish and the u-shaped weir tundish under single-strand blocked conditions. From the outflow percentage curve, under normal conditions, the outflow percentages of each strand in the double-weir tundish are almost consistent. The consistency of each strand in the u-shaped weir tundish under normal conditions is lower than that of the double-weir tundish. When the single-strand is blocked (take the blockage of strand 1 as an example), the outflow percentage of outlet 3 and outlet 4 of the double-weir tundish is significantly higher than that under normal conditions, and the outflow percentage of outlet 2 is lower than that under normal conditions before 1000 s, so the uniformity of each strand is significantly lower than that under normal condition. For the u-shaped weir tundish, the outflow percentage of each strand under a single-strand blockage is lower than that under the normal conditions at the initial stage, and the outflow percentage of outlet 2, outlet 3, and outlet 4 is higher than that under the normal condition after 250 s, 450 s, and 450 s, respectively. Similar to the trend of the outflow percentage under normal conditions, the outflow percentage of outlet 2 is between that of outlet 3 and outlet 4 before 600 s, and the outflow percentage of outlet 2 is higher than that of outlet 3 and outlet 4 after 600 s. Besides, the uniformity of each strand is much better than that in the double-weir tundish. According to the variance curve, it can be seen that the variances after blocking of the double-weir tundish are significantly higher than that under normal conditions. However, the variance of the u-shaped weir tundish is comparable between the blocking and normal conditions.
A further analysis of time average variance of outflow percentage is given in Table 3. For the double-weir tundish, the value increases from 8.74 × 10⁻⁶ to about 2 × 10⁻³ when a strand is blocked. For the u-shaped weir tundish, the values are 2.36 × 10⁻⁴, 2.76 × 10⁻⁴, and 4.88 × 10⁻⁴ for normal conditions, strand 1 blockage, and strand 2 blockage conditions, respectively. For both tundish designs, the consistency of each strand decreased when a strand is blocked. Furthermore, the consistency of each strand of the u-shaped weir tundish is better than that of the double-weir tundish.

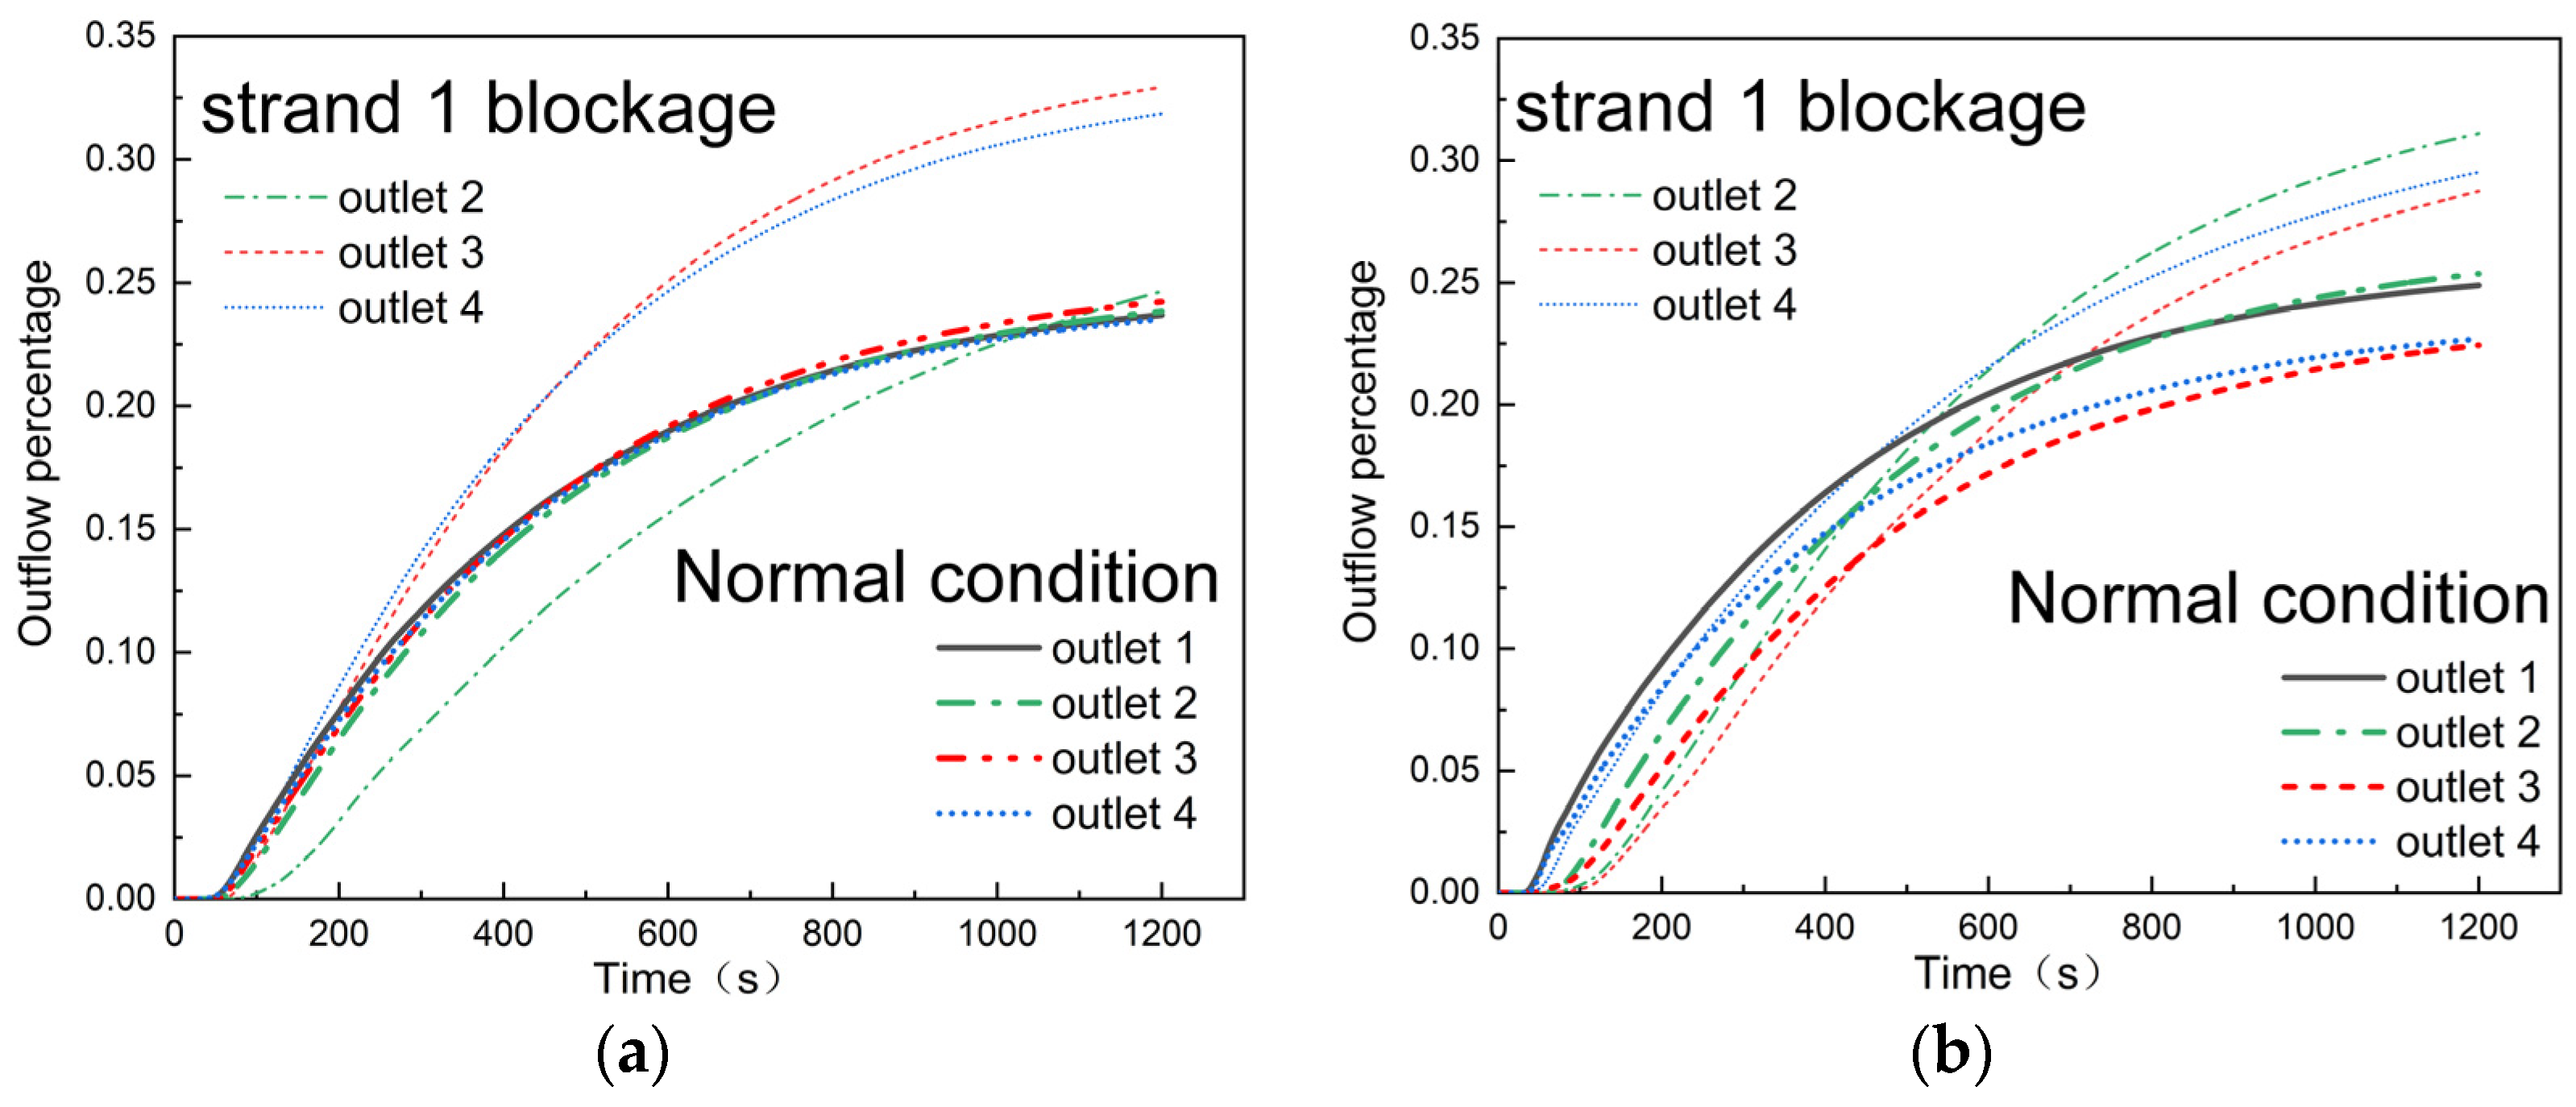
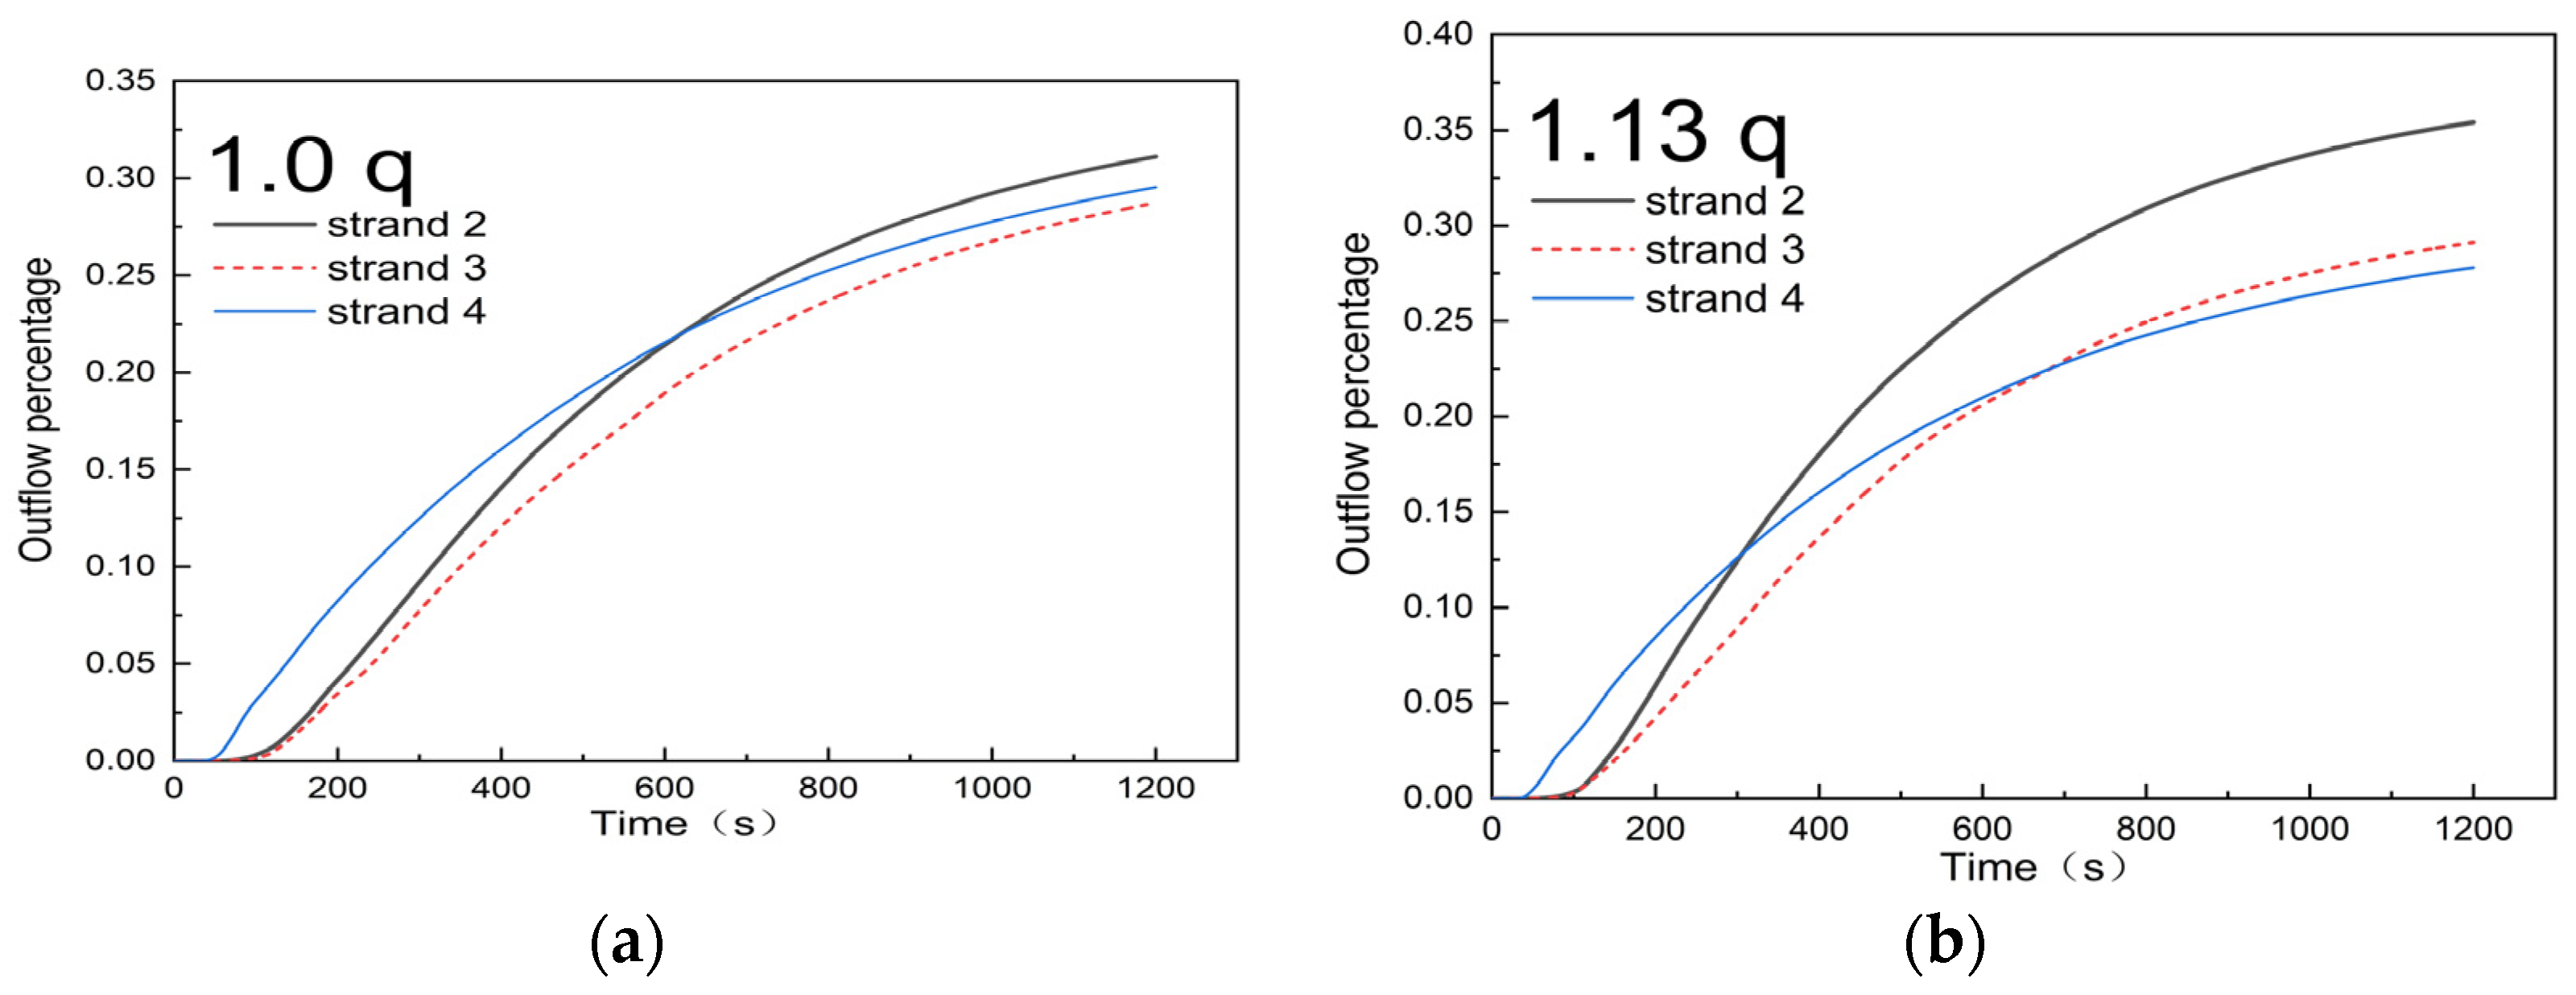
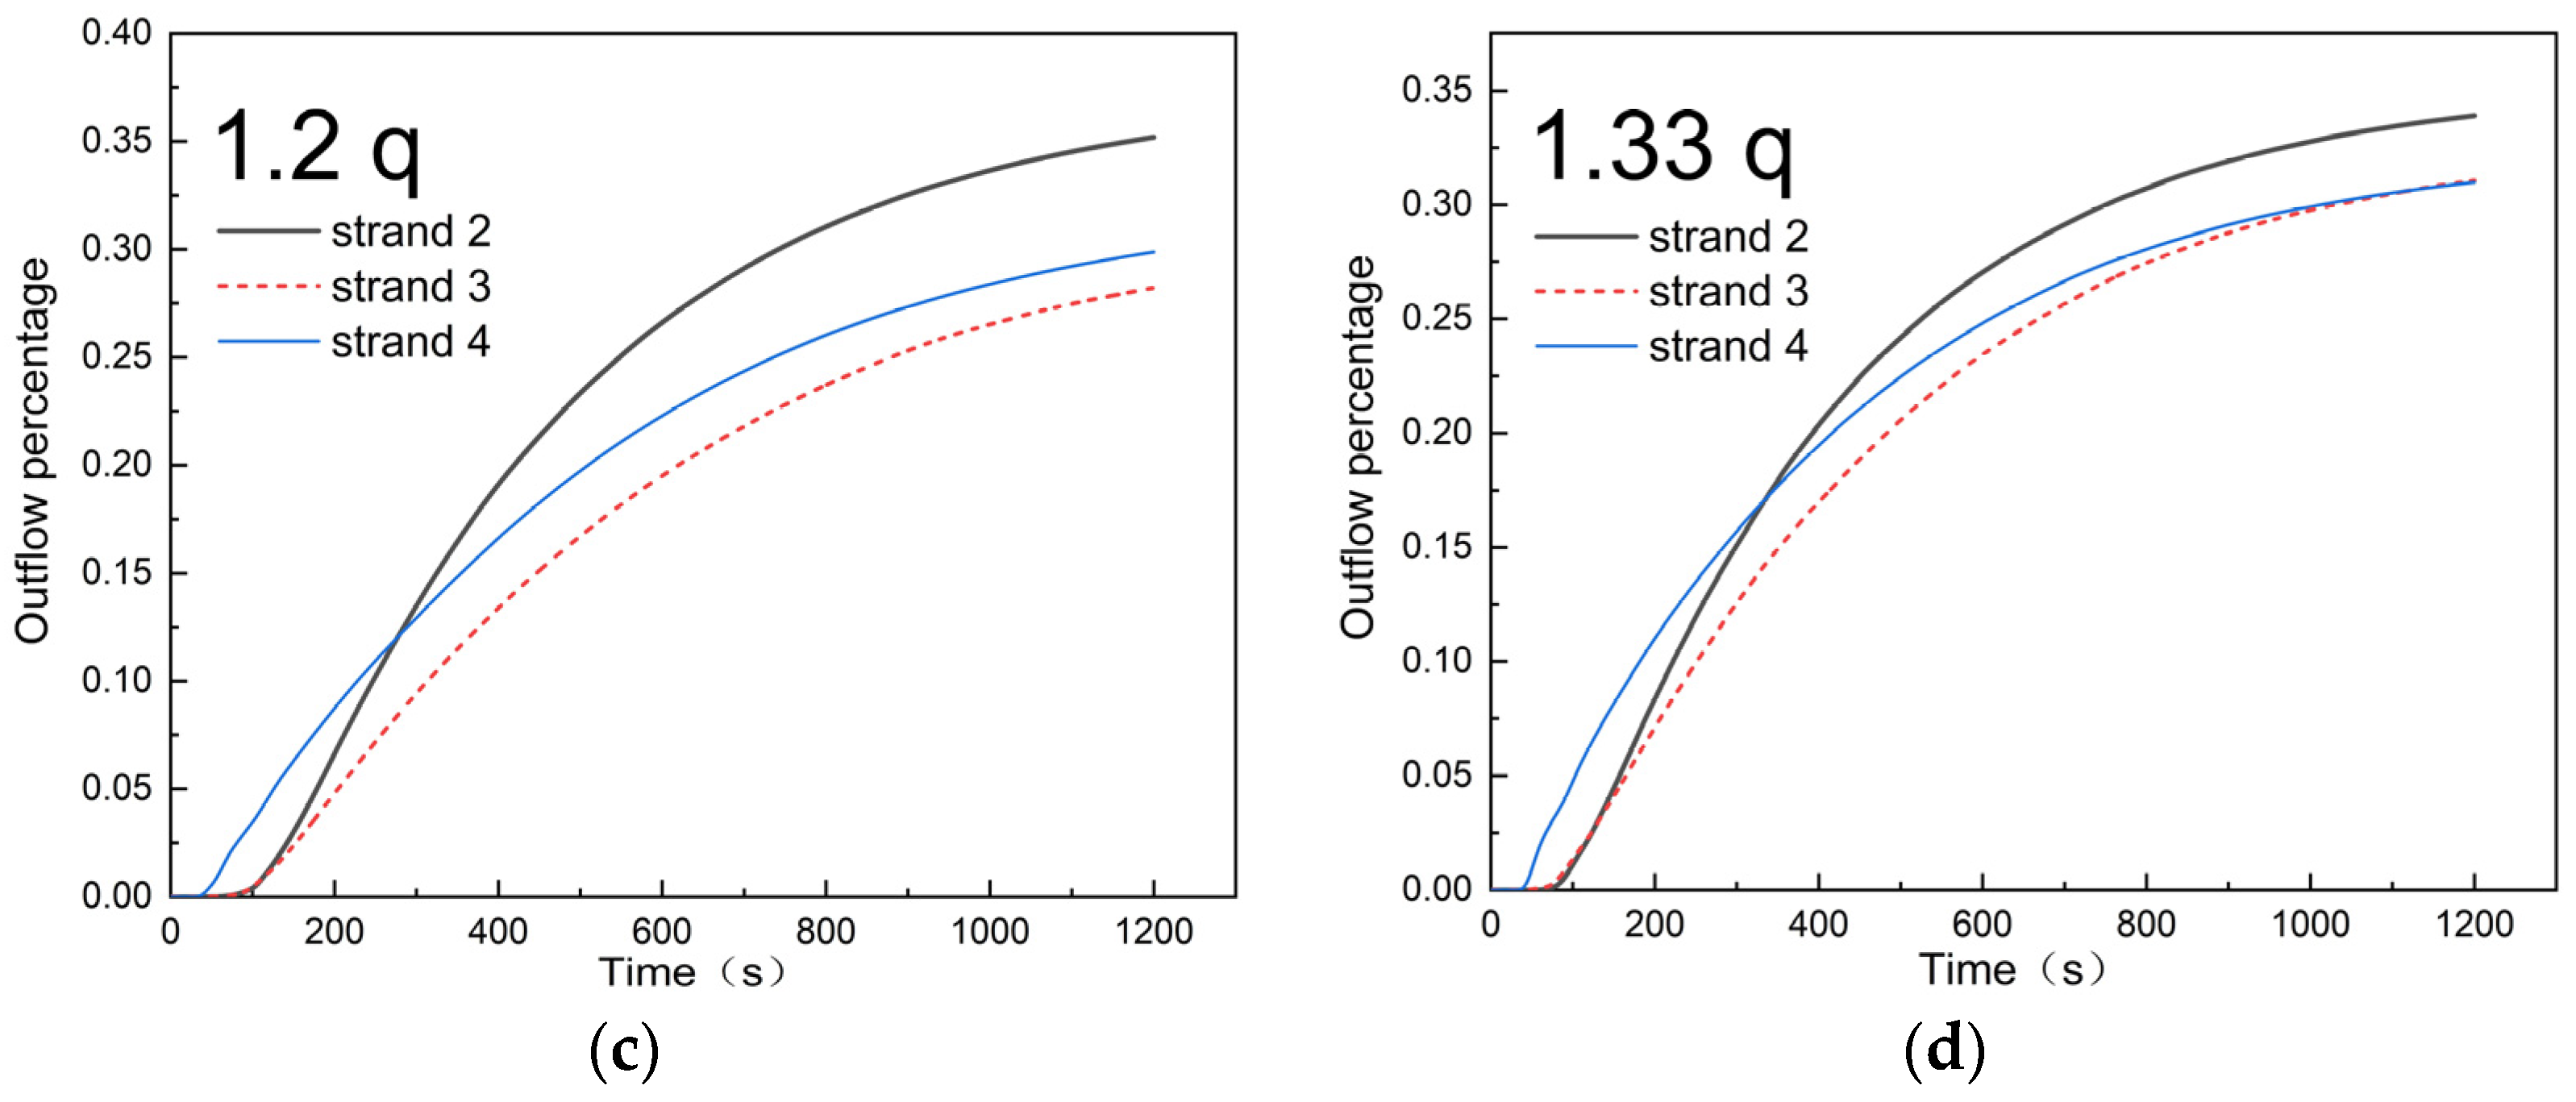
3.3. Dispersion and Outflow Percentage of Tracers under Single-Strand Blockage Conditions with Uniform Increasing Casting Flow Rate

In the industrial production process, in order to increase the production capacity or match the production rate after one strand is blocked, the casting speed is often adjusted according to the casting speed range of the steel grade. In this paper, by changing the flow rate of the outlet and matching the corresponding inlet velocity, the effect of the uniform increasing of the casting flow rate on tracer dispersion and the consistency of outflow percentage of each strand of the double-weir tundish, and the u-shaped weir tundish under single-strand blockage conditions are studied. The flow rate of the outlet is increased based on the flow rate q of the four-strand tundish under normal conditions. The studied casting flow rates are 1.13, 1.2 and 1.33 times the flow rate q and are termed cases 1.13 q, 1.2 q and 1.33 q, respectively.
Figure 13 shows the isosurfaces (ω = 10−5) of uniform increasing casting flow rate cases of the double-weir tundish under the strand 1 blockage condition. For different flow rate cases, the dispersion of the tracer in the pouring chamber is basically the same as that of the normal conditions. With the increase of the flow rate of the outlet, the tracer flowing from the pouring chamber to the main flow area on both sides gradually increases within 10 s. As described before, the tracer dispersings to the right part is more than that to the left part. It can be seen from Figure 13 that the response time of each outlet is gradually shortened. When strand 1 is blocked and the flow rate of outlets is q, the times to reach outlet 2, outlet 3 and outlet 4 are 67 s, 53 s, and 37.5 s respectively. When the flow rate of the outlets is 1.13 q, the times for the tracer to reach each outlet are: 60 s, 44.7 s, 32.4 s. When the flow rate of the outlets is 1.2 q, the times for the tracer to reach each are: 58 s, 42 s, 30 s. When the flow rate of the outlets is 1.33 q, the times for the tracer to reach each outlet are: 53 s, 37.5 s, 27 s. Similarly, when strand 2 is blocked, the time for the tracer to reach the outlet gradually shortens with the increase of the flow rate of the outlet. The isosurface results are not given here. The times for the tracer to reach outlet 1, outlet 3 and outlet 4 are (57 s, 53 s, 37.5 s), (46.5 s, 44.7 s, 32.4 s), (43.8 s, 42 s, 30 s), and (40.5 s, 37.5 s, 27 s) for case 1.0 q, 1.13 q, 1.20 q and 1.33 q, respectively. It is noted that the time for the tracer to reach outlet 1 in the strand 2 blockage case is shorter than the time to reach outlet 2 in the strand 1 blockage case. This is due to the circulating flow stream transferring a large portion of tracer to outlet 1 at a higher pace. In addition, the times for the tracer to reach outlet 3 and outlet 4 are the same for the two cases.
Figure 14, Figure 15 and Figure 16 show the outflow percentage curve and variance of the outflow percentage curve of uniform increasing casting flow rate cases of the double-weir tundish. When strand 1 is blocked, the outflow percentage of sstrand 2 is significantly lower than that of strand 3 and strand 4. The outflow percentage curve of strand 3 and strand 4 is basically the same. Specifically, the outflow percentages (at 1200 s) of strand 2, strand 3 and strand 4 are (24.65%, 32.94%, 31.85%), (26.51%, 32.94%, 32.81%), (27.23%, 33.00%, 33.09%), and (28.59%, 33.04%, 33.30%) for cases 1.0 q, 1.13 q, 1.20 q and 1.33 q, respectively. When strand 2 is blocked, the outflow percentages (at 1200 s) of strand 1, strand 3 and strand 4 are (23.86%, 32.87%, 31.90%), (25.75%, 32.91%, 32.89%), (26.59%, 33.02%, 33.09%), and (27.98%, 33.06%, 33.32%) for cases 1.0 q, 1.13 q, 1.20 q and 1.33 q, respectively. For both cases, with the increase of the flow rate, the outflow percentage of each strand increases, and the difference in outflow percentage between each strand decreases.
From the time average variance result (Table 4), it can be seen that the consistency of each strand increases with the increase of the flow rate of the outlet. When the flow rate of the outlet is 1.33 q, the consistency of each strand is the best among the studied cases. Compared with the 1.0 q result, the average variance of the 1.33 q case is reduced by 25.25% and 27.27% for strand 1 blockage and strand 2 blockage conditions, respectively.
Figure 17 shows the isosurfaces (values of 10−5) of uniform increasing casting flow rate cases of the u-shaped weir tundish under the strand 1 blockage condition. Under different flow rates of outlets, the transport process of tracers are similar. The time for the tracer to reach the outlets (response time) is slightly changed. Specifically, when strand 1 is blocked, the times for the tracer to reach outlet 2, outlet 3 and outlet 4 are (59 s, 52 s, 33 s), (57 s, 52 s, 29.5 s), (56 s, 46.5 s, 29 s), and (57 s, 39 s, 30.6 s) for cases 1.0 q, 1.13 q, 1.20 q and 1.33 q, respectively. When strand 2 is blocked, the times for the tracer to reach outlet 1, outlet 3 and outlet 4 are (40.5 s, 51 s, 33 s), (34.2 s, 52 s, 29.5 s), (31.2 s, 46.5 s, 29 s), and (28.5 s, 38.25 s, 30.6 s) for cases 1.0 q, 1.13 q, 1.20 q and 1.33 q, respectively. By increasing the casting flow rate, the response time of outlet 2 decreases when strand 1 is blocked. However, the response time of outlet 1 is not affected when increasing the casting flow rate under strand 2 blockage conditions. In both cases, the response time of outlet 3 decreases when the casting flow rate increases to 1.2 q and 1.33 q. In all cases, the response time of outlet 4 is not affected by the flow rate. The response time of the inner strand is prone to being affected by the increase of casting flow rate rather than that of the outer strand.
Figure 18, Figure 19 and Figure 20 show the outflow percentage curve and variance of outflow percentage curve of uniform increasing casting flow rate cases of the u-shaped weir tundish. When strand 1 is blocked, the outflow percentage of strand 2 is initially lower than that of strand 4, and then increases rapidly and exceeds the value of strand 4. The consistency of the outflow percentage curve is good for case 1.0 q. When the casting flow rate increases, the outflow percentage of strand 2 is higher than the values of strand 3 and strand 4. The outflow percentages (at 1200 s) of strand 2, strand 3 and strand 4 are (31.10%, 28.74%, 29.53%), (35.40%, 29.11%, 27.80%), (35.18%, 28.21%, 29.87%), and (33.89%, 31.05%, 30.98%) for cases 1.0 q, 1.13 q, 1.20 q and 1.33 q, respectively.
When strand 2 is blocked, as mentioned before, tracer flows out from the outlet 1 are enhanced. So, the outflow percentage of strand 1 is always higher than that of strand 3 and strand 4. The outflow percentages (at 1200 s) of strand 1, strand 3 and strand 4 are (31.11%, 27.99%, 29.20%), (34.75%, 28.65%, 27.83%), (35.64%, 28.48%, 28.25%), and (33.72%, 30.62%, 30.34%) for cases 1.0 q, 1.13 q, 1.20 q and 1.33 q, respectively.
For the time average variance result (Table 4), it can be seen that the consistency of each strand decreases with the increase of the flow rate of the outlet to 1.13 q and 1.20 q. The result of 1.33 q is comparable with the result of 1.0 q. Compared with two tundish designs, with uniform increasing of the casting flow rate for the single strand blockage condition, the consistency of each strand in the u-shaped weir tundish is better than that in the double-weir tundish.

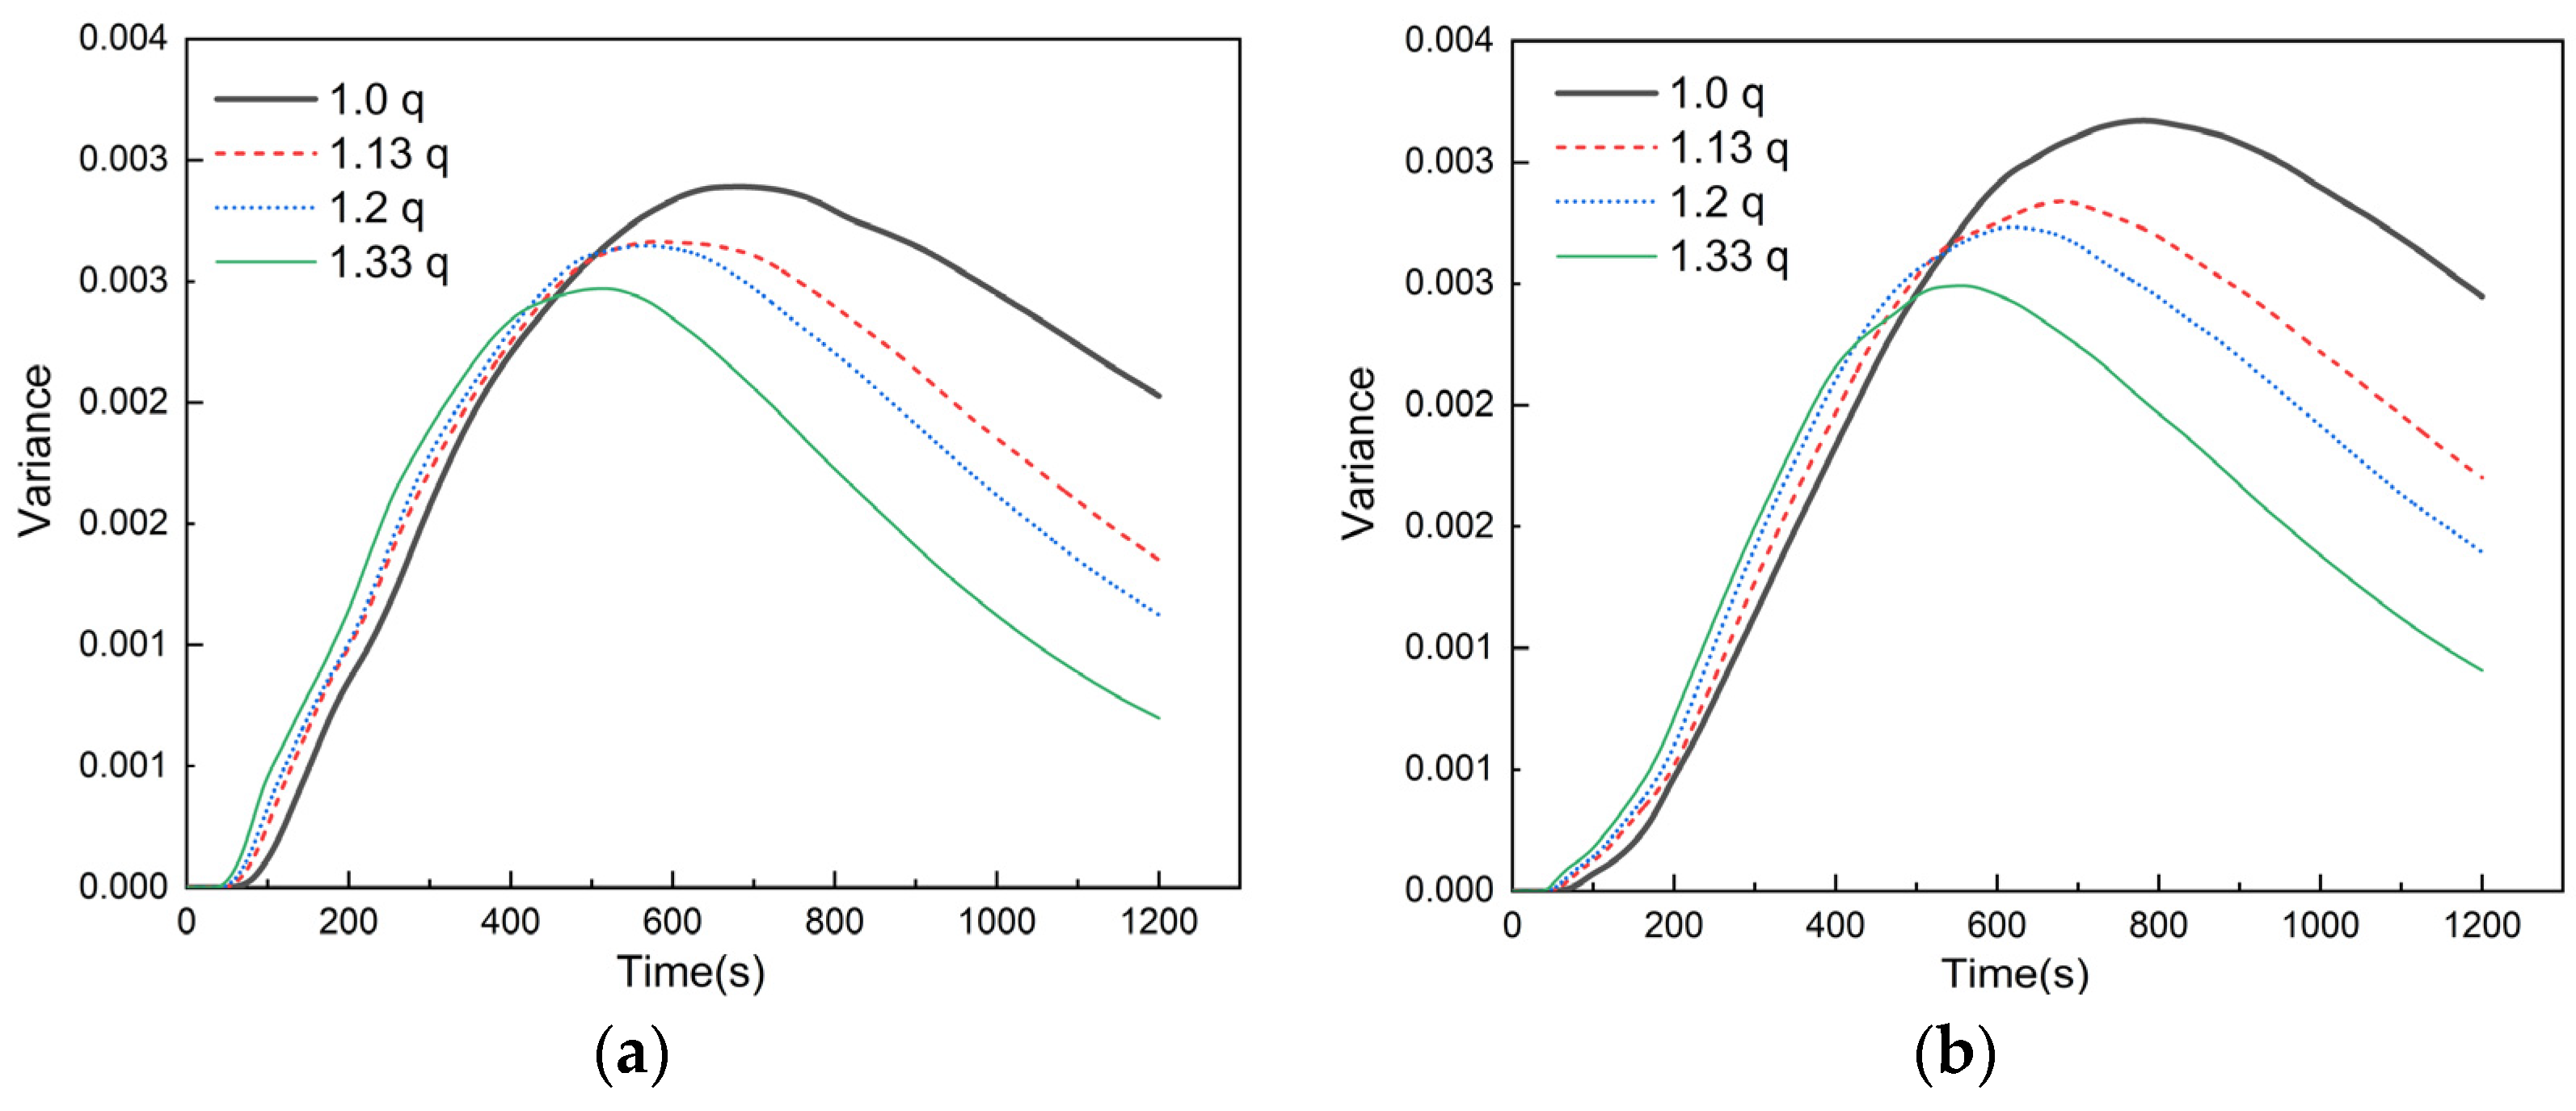
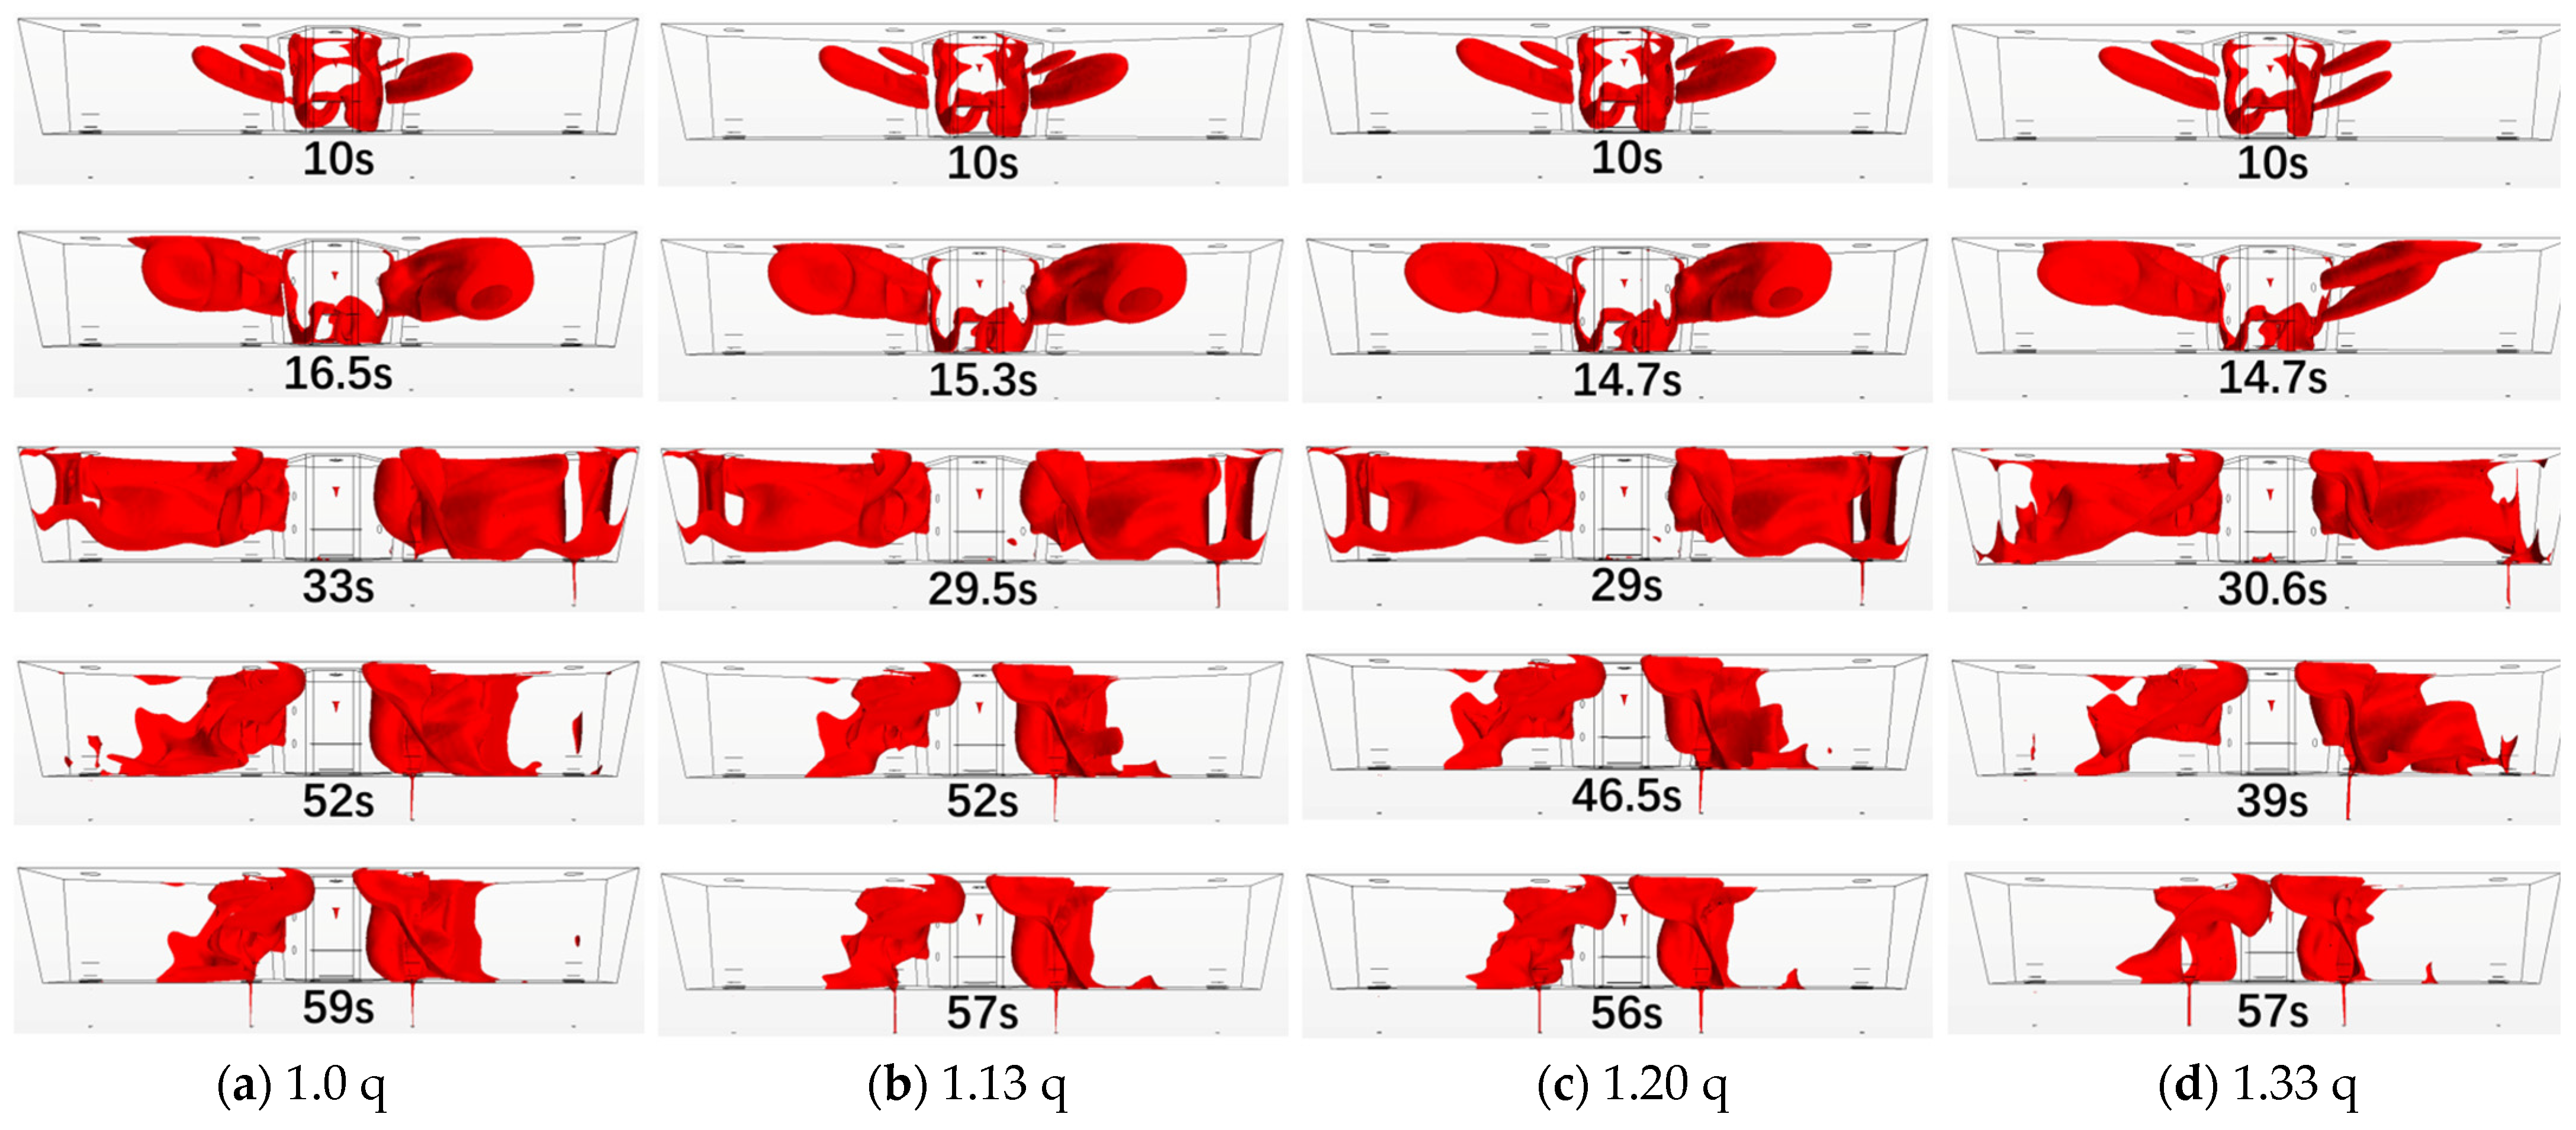
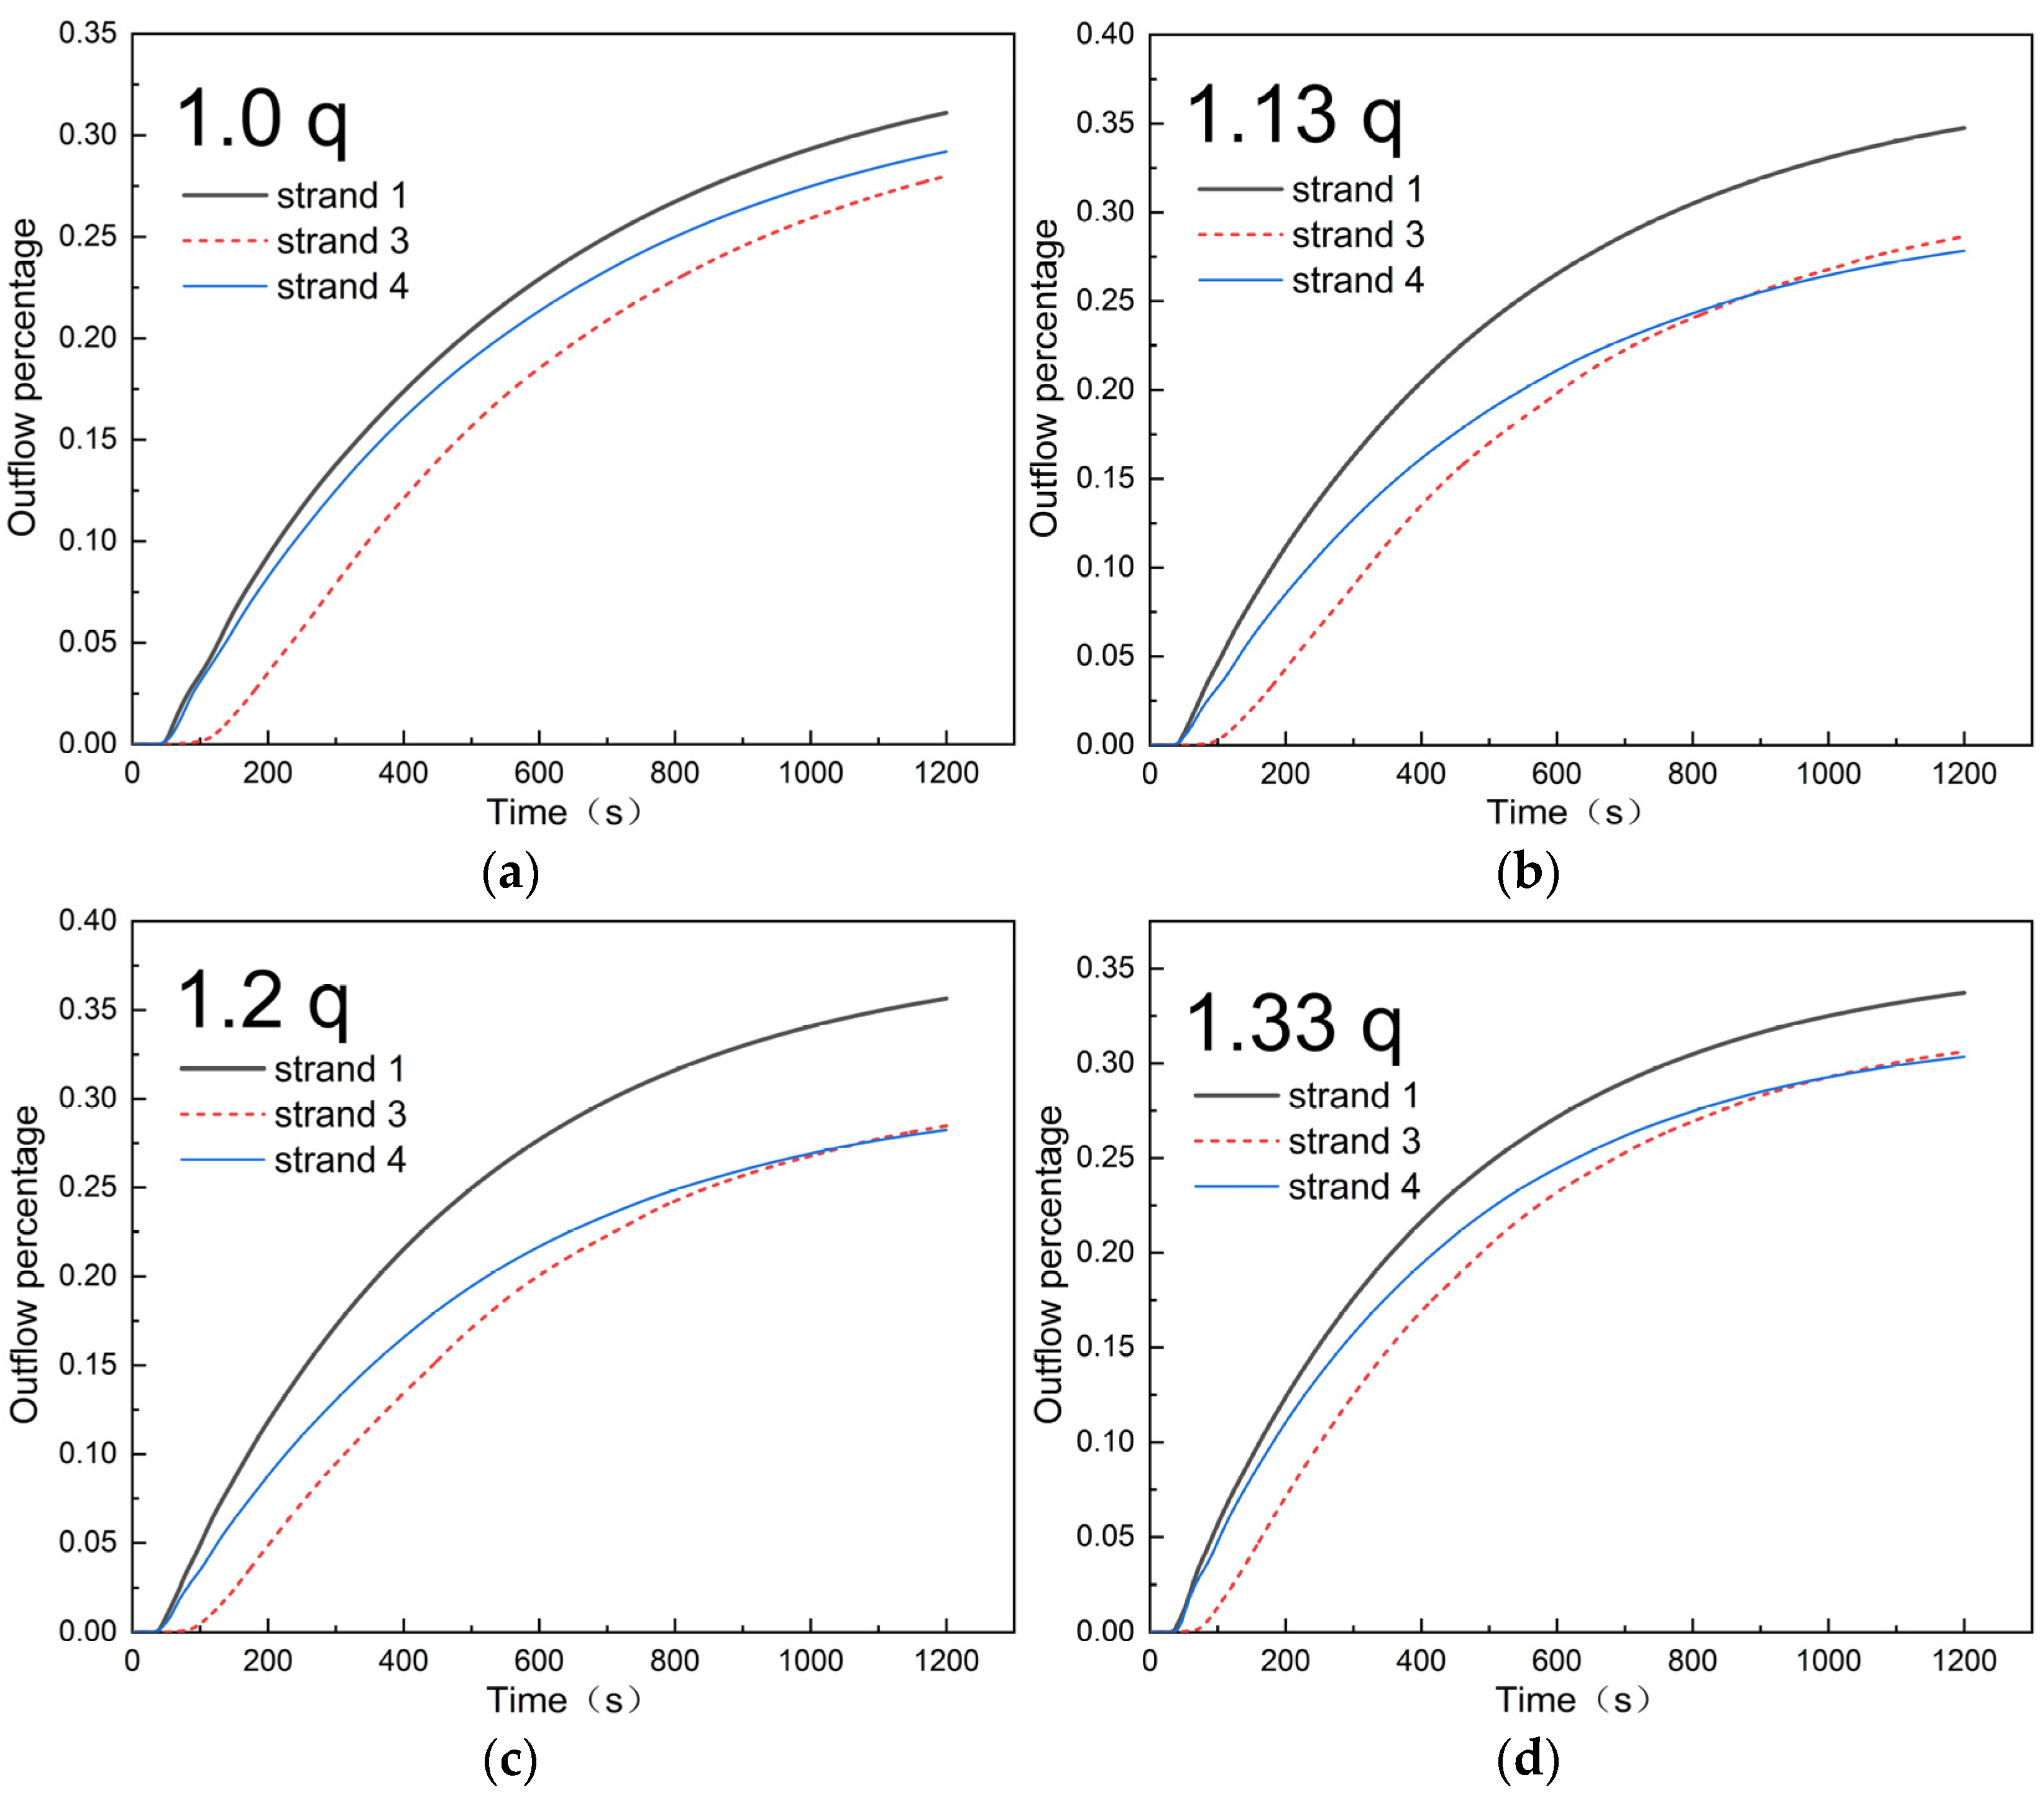
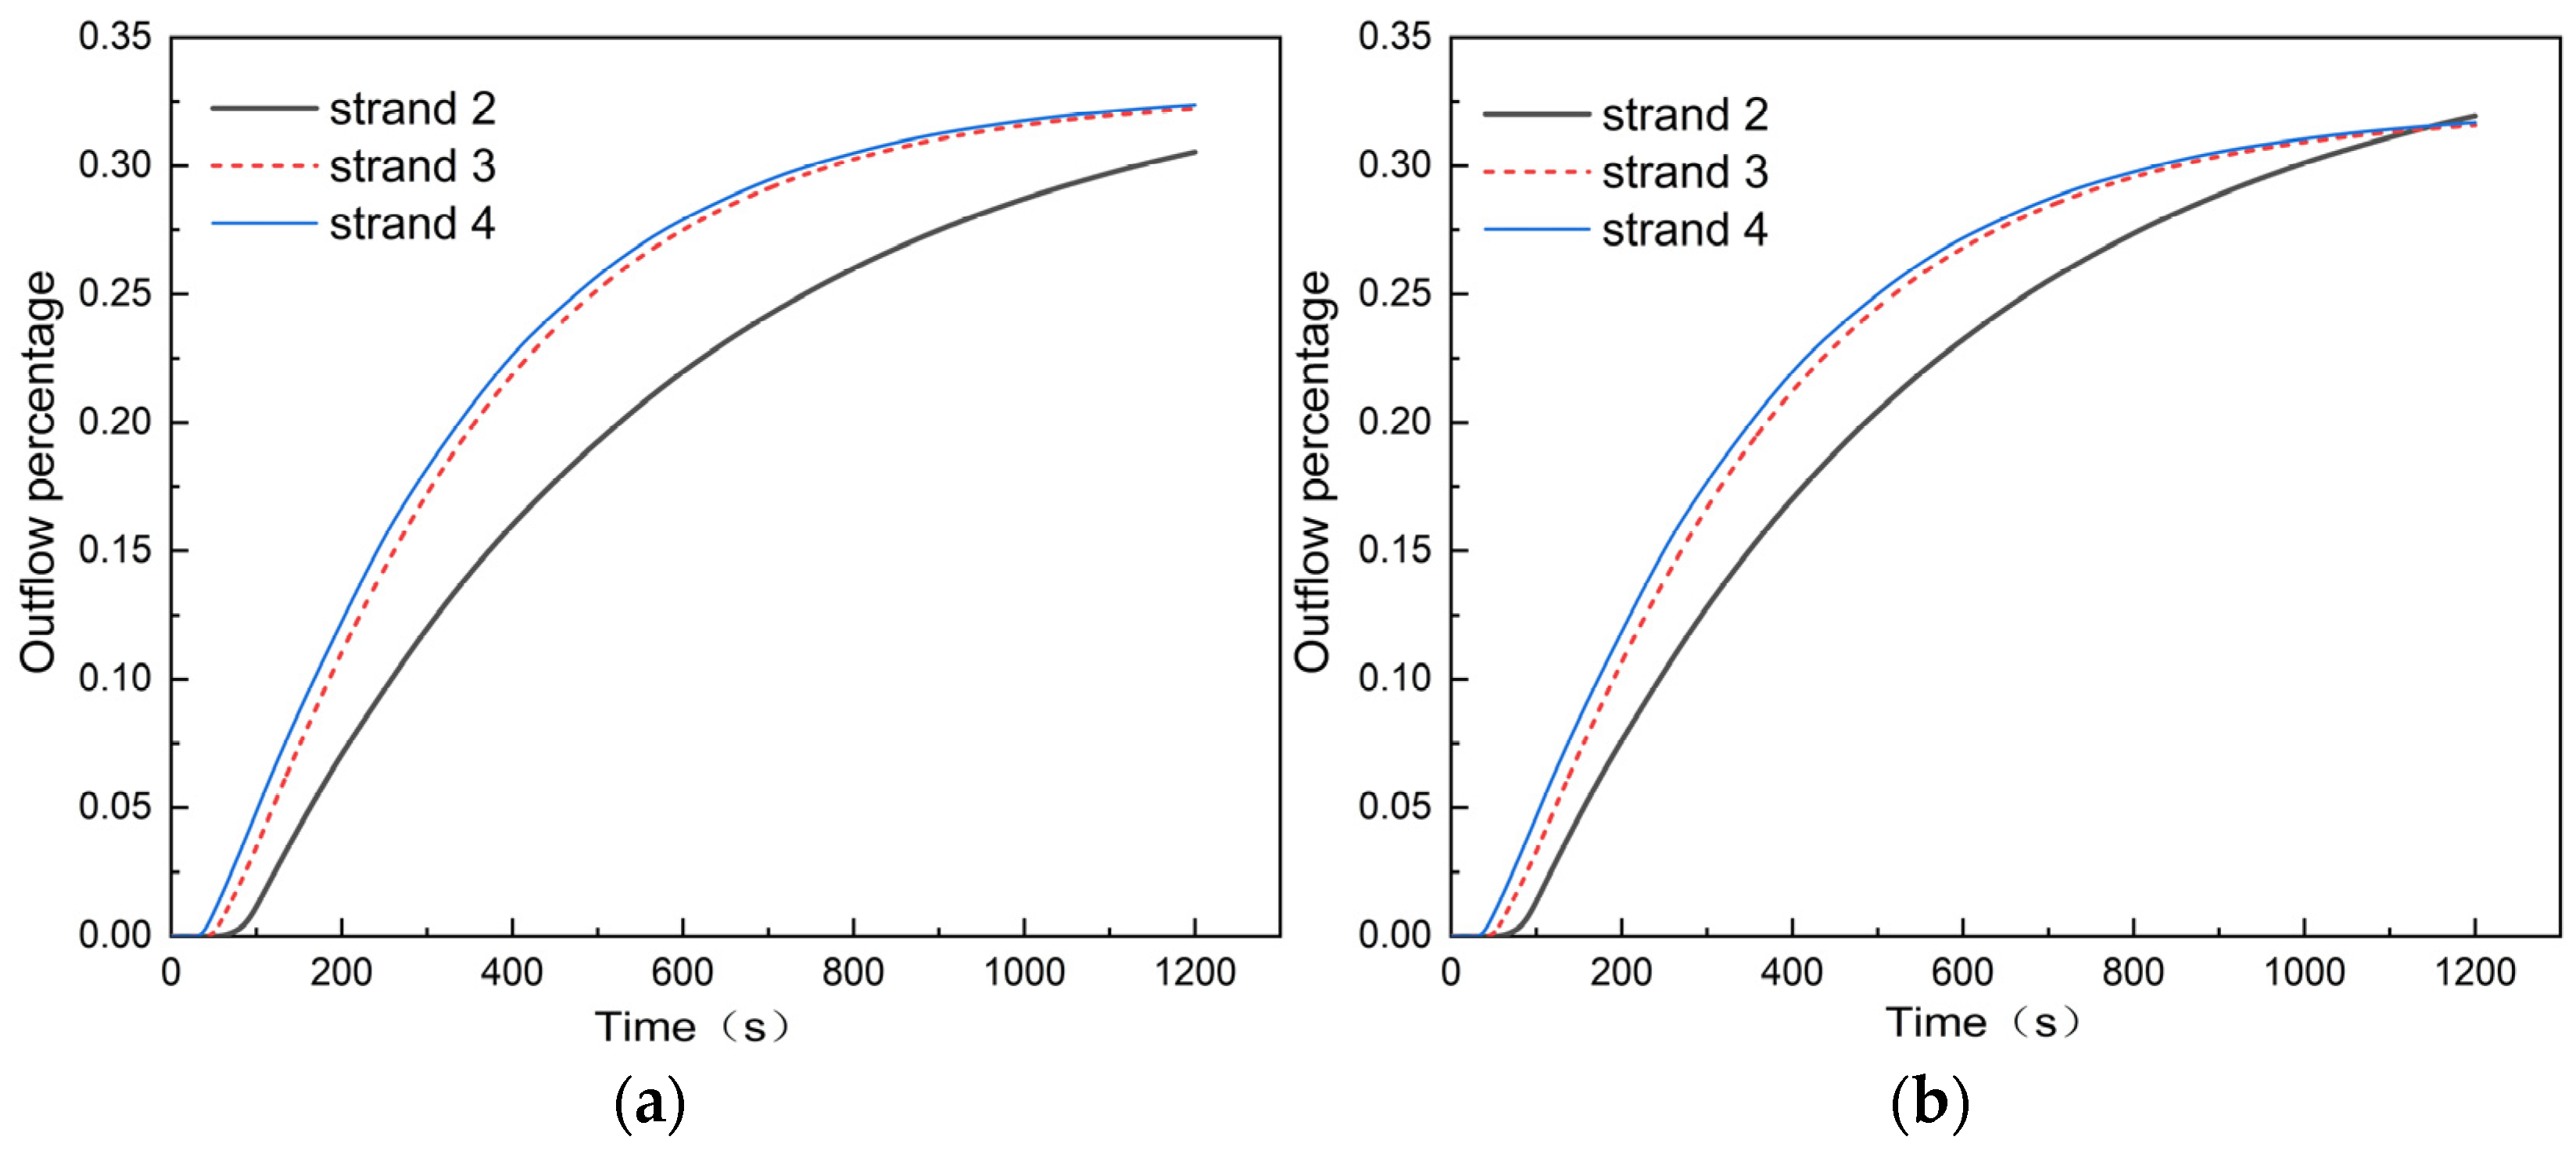
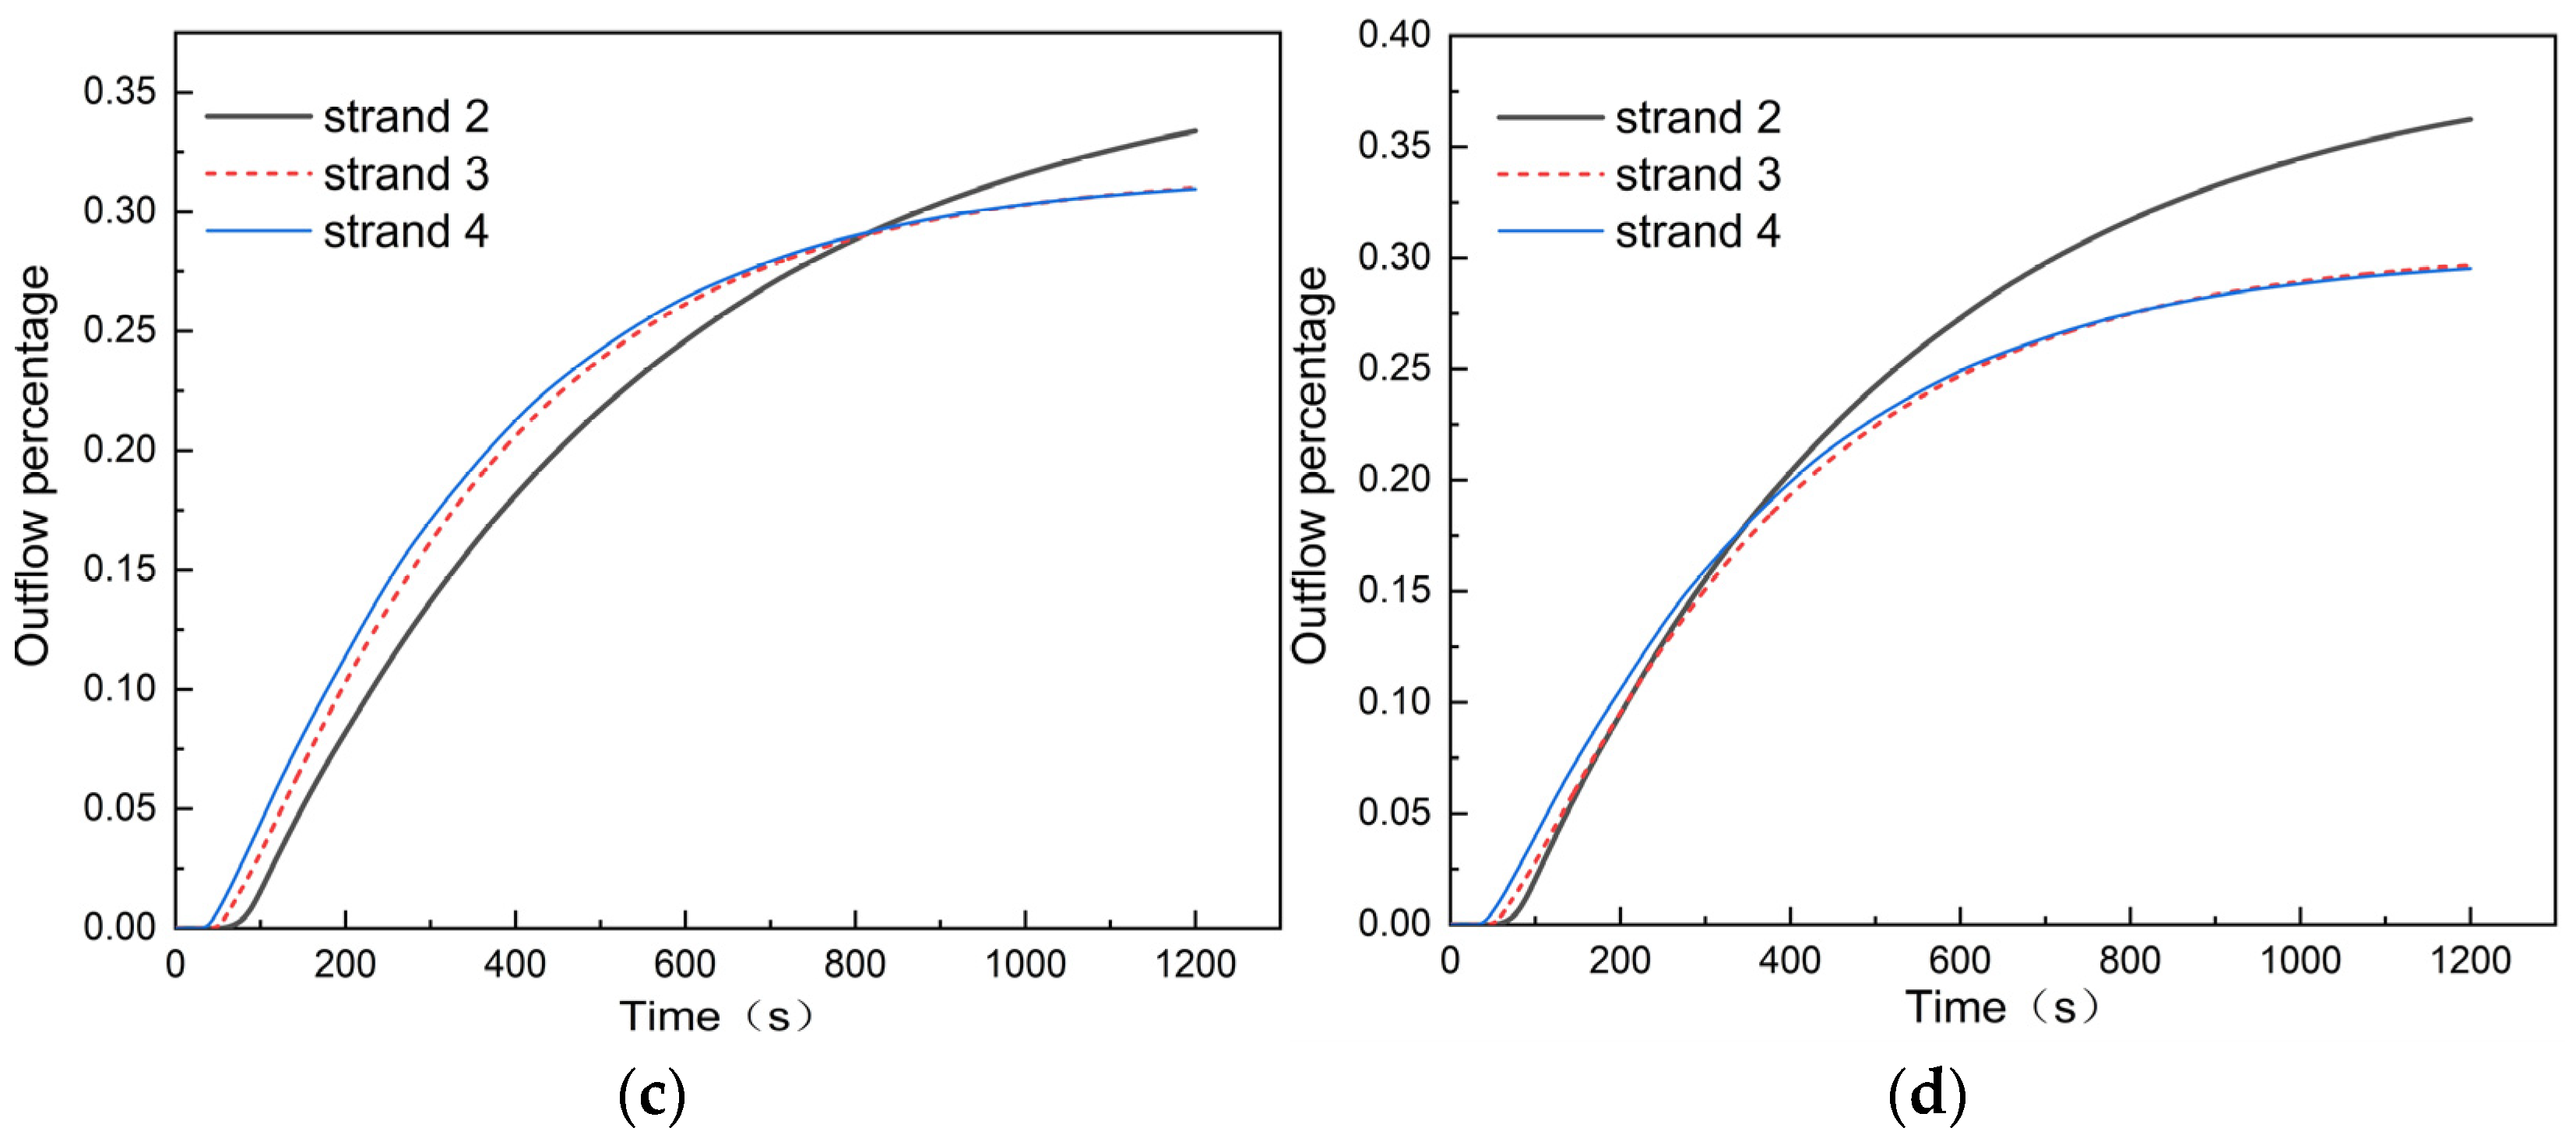
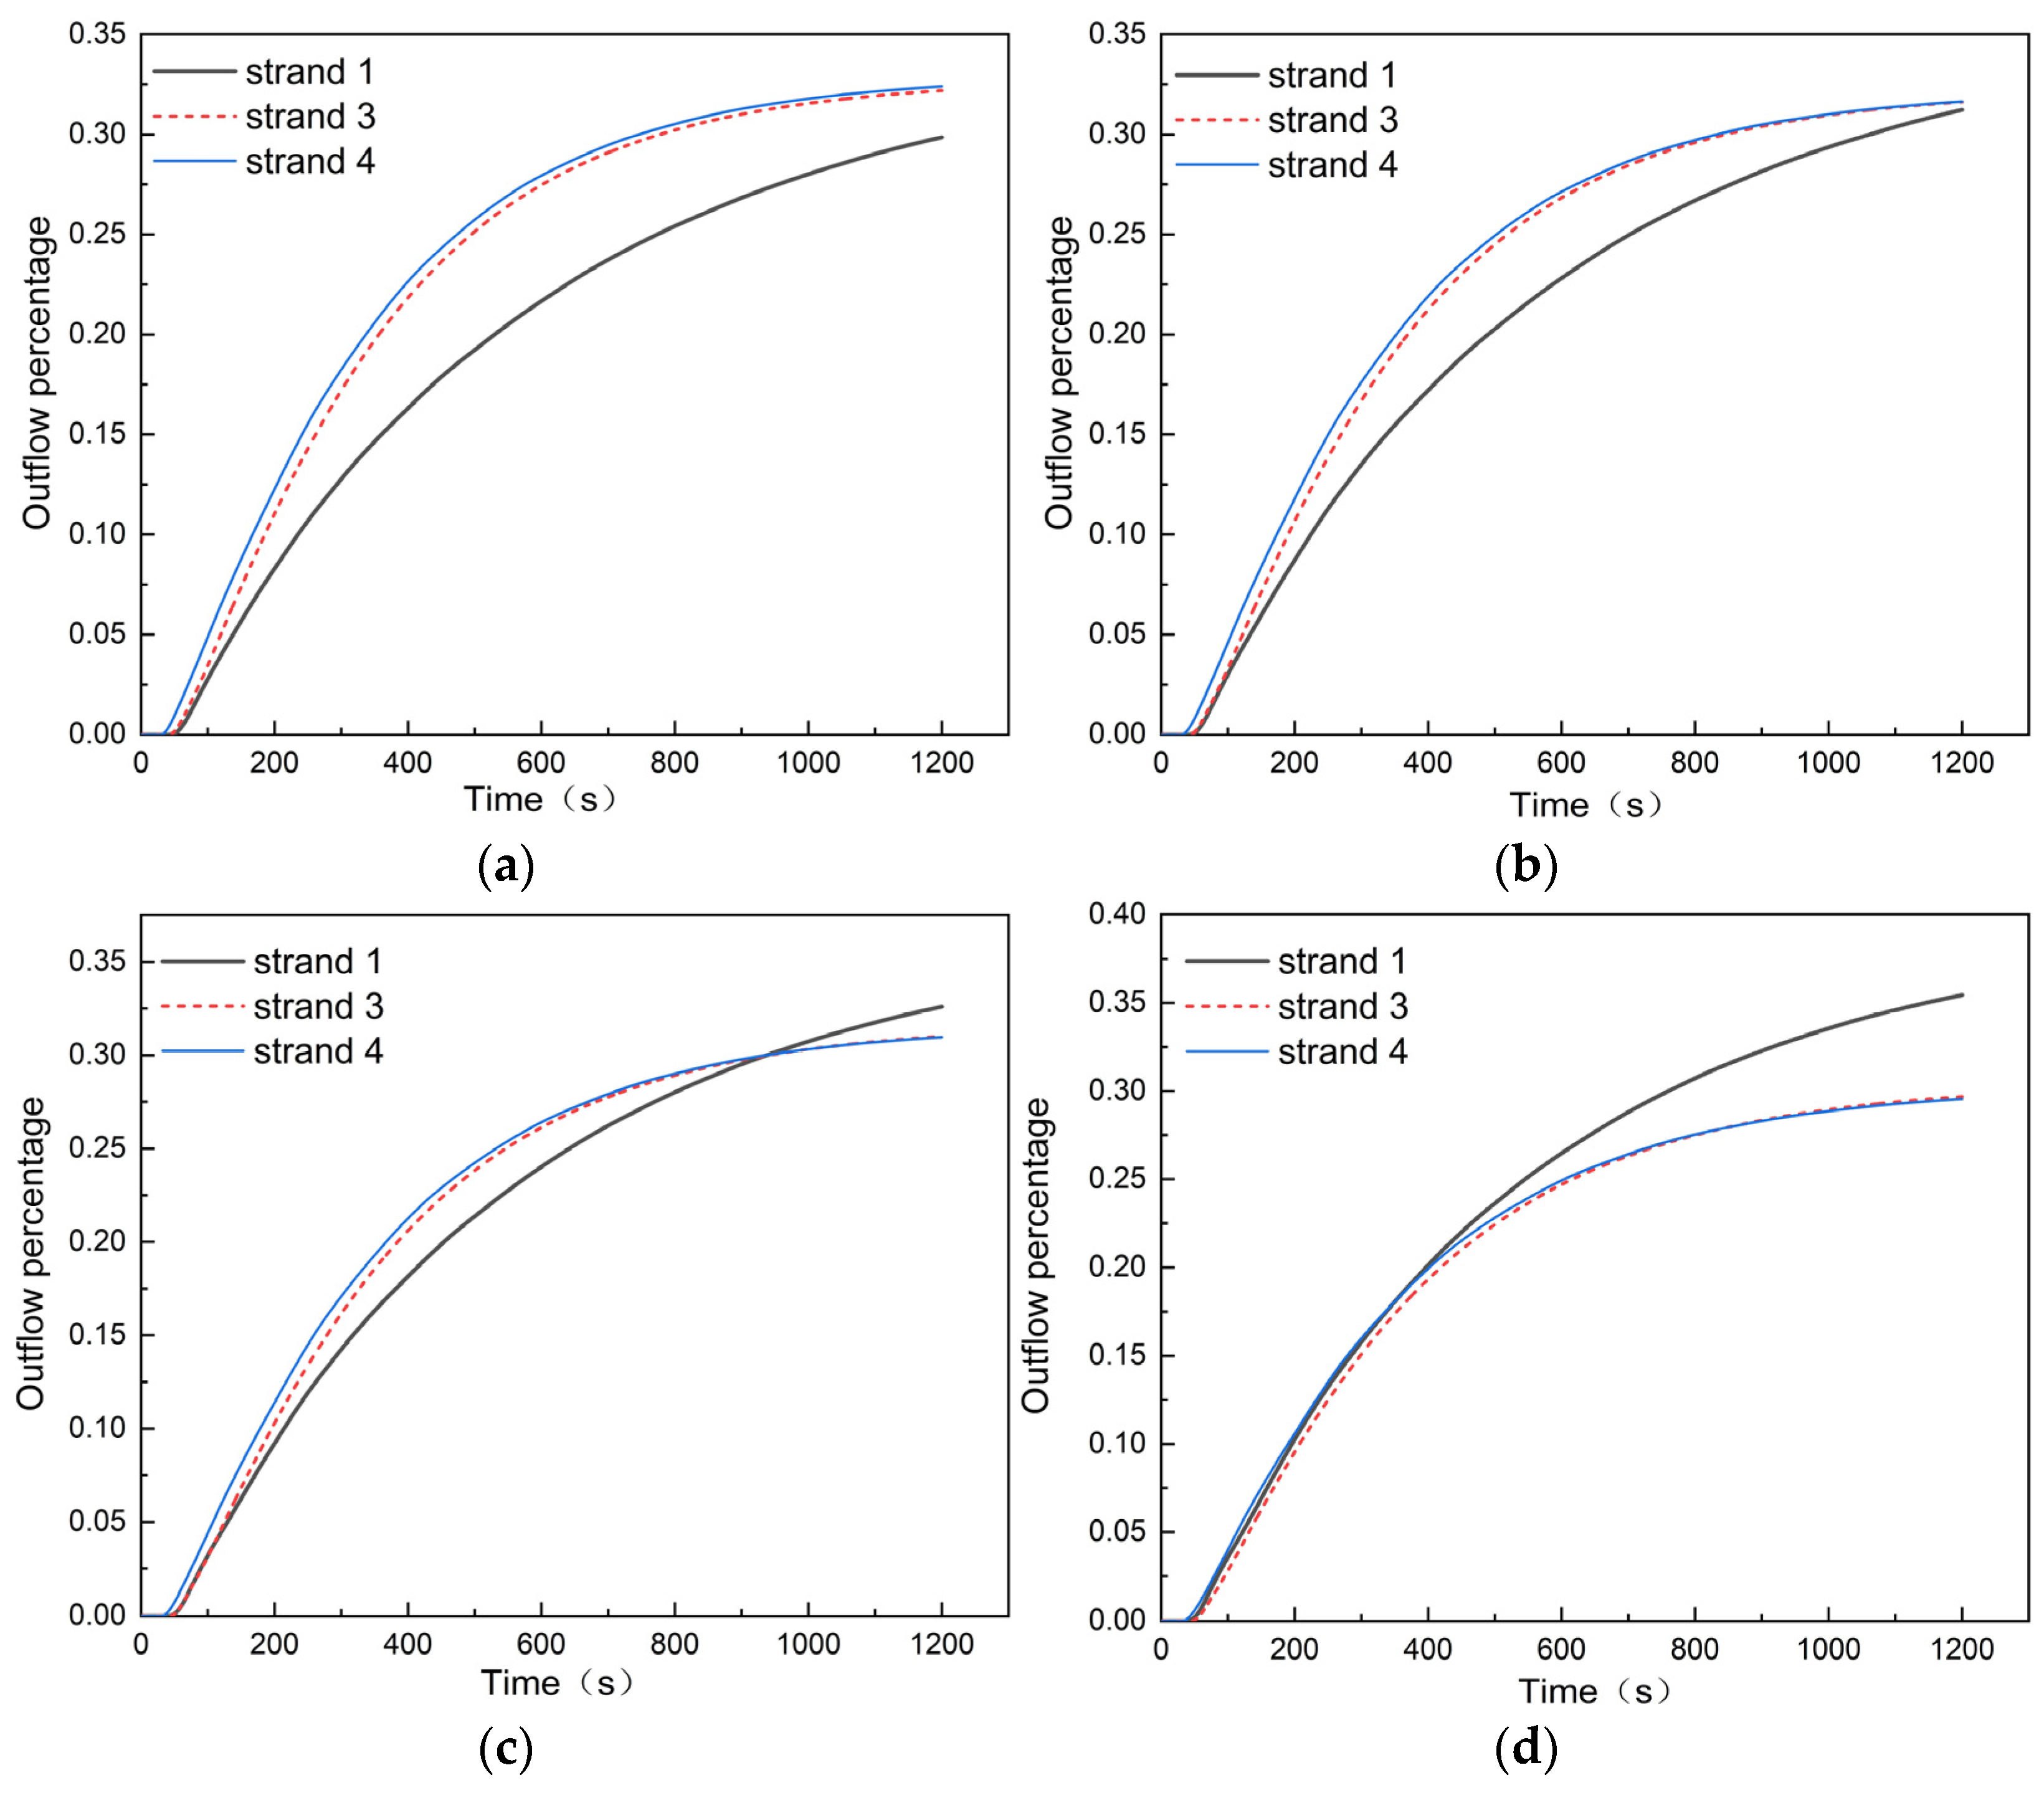
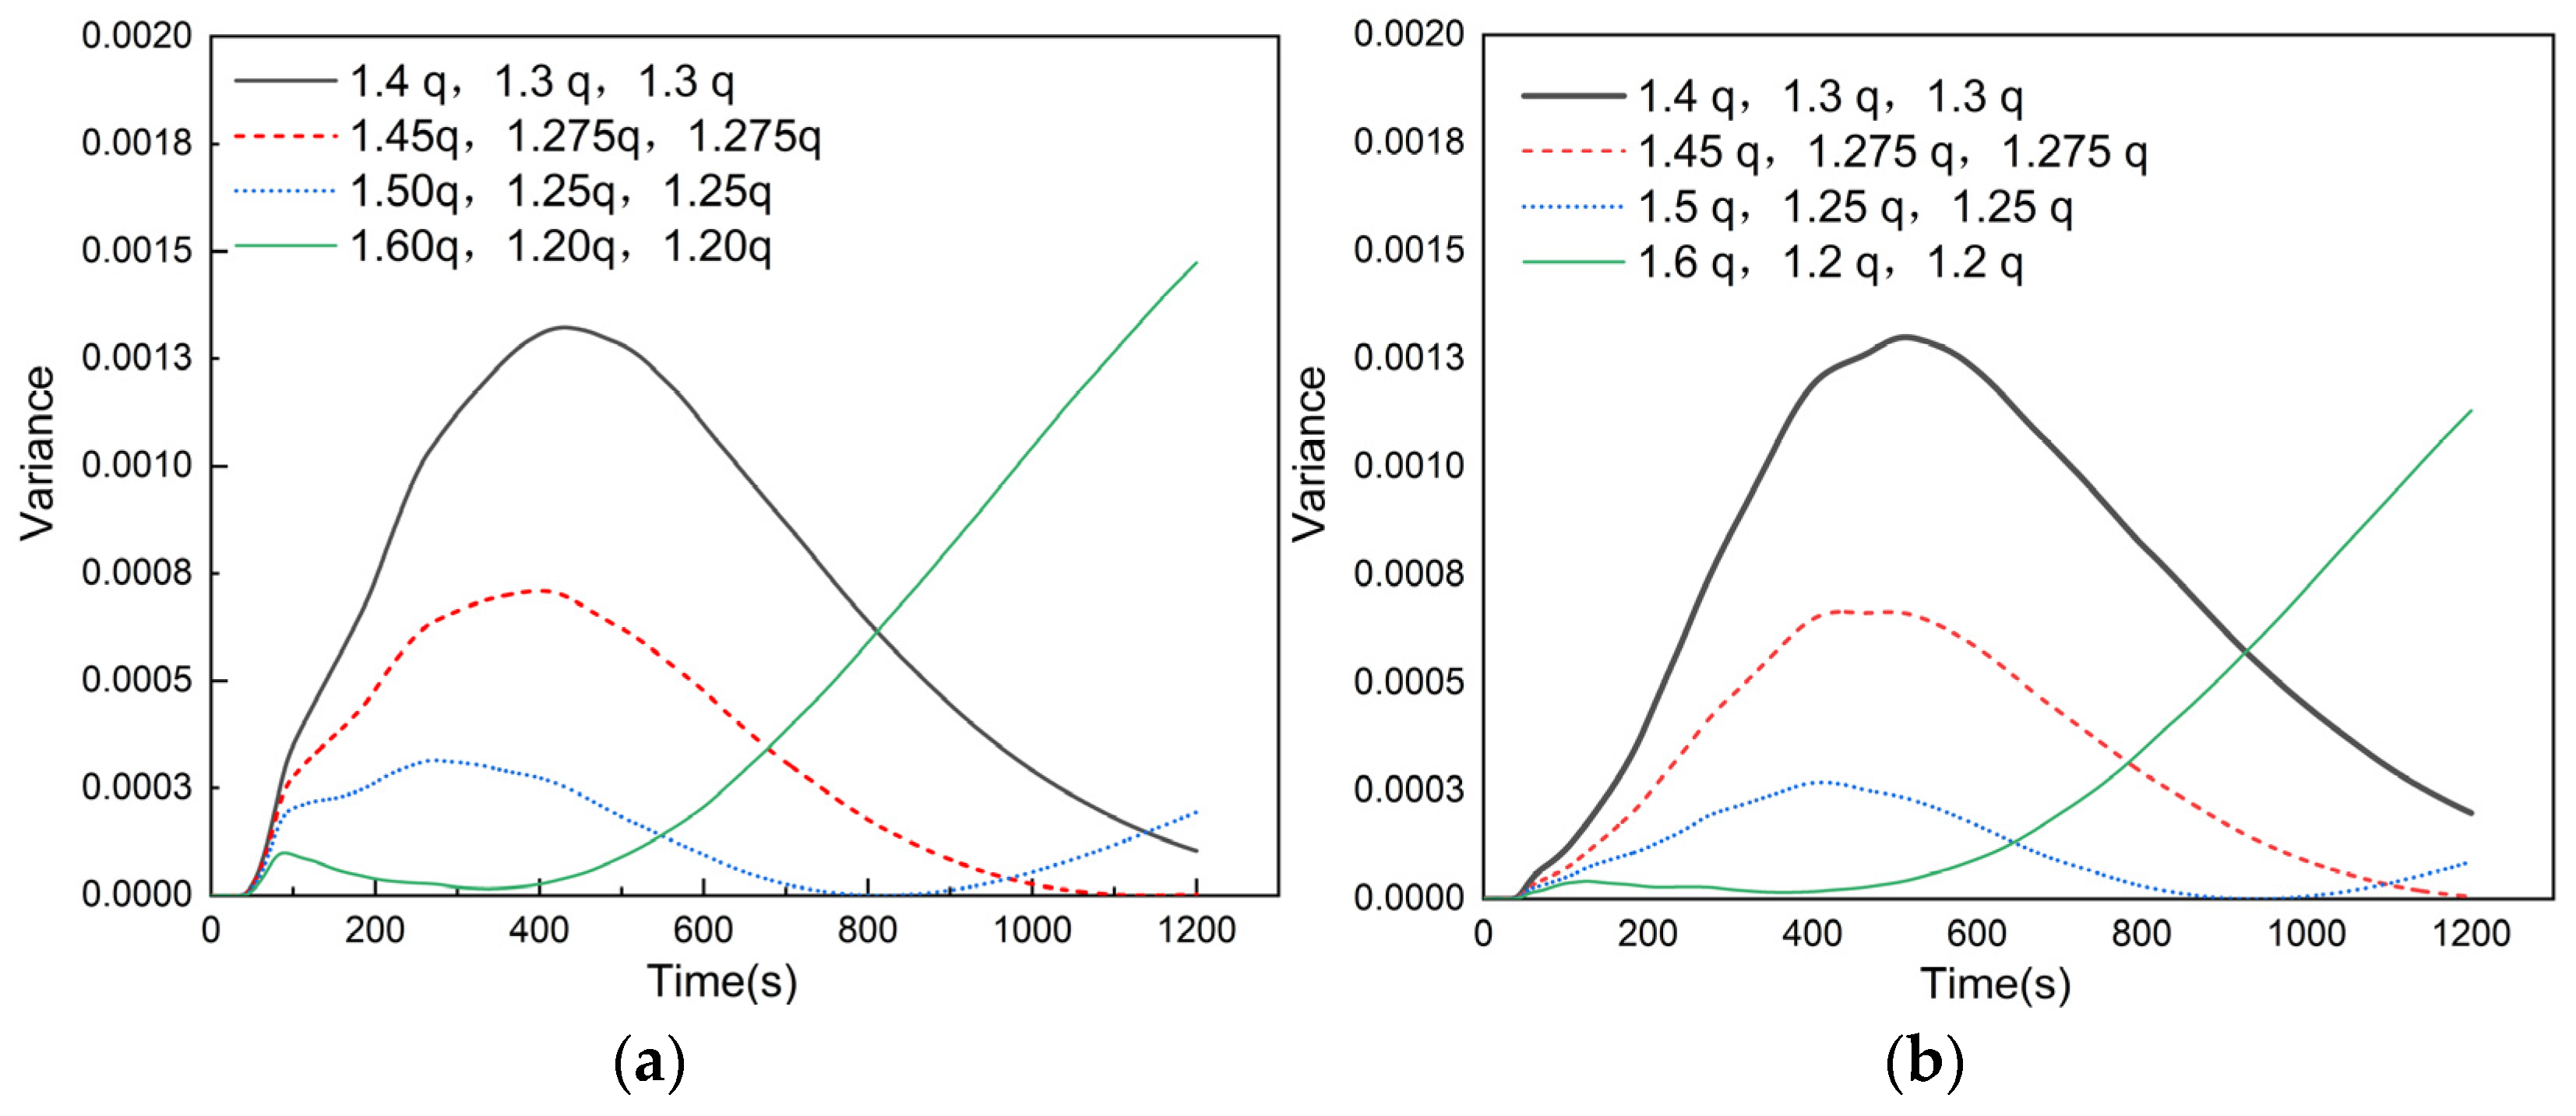
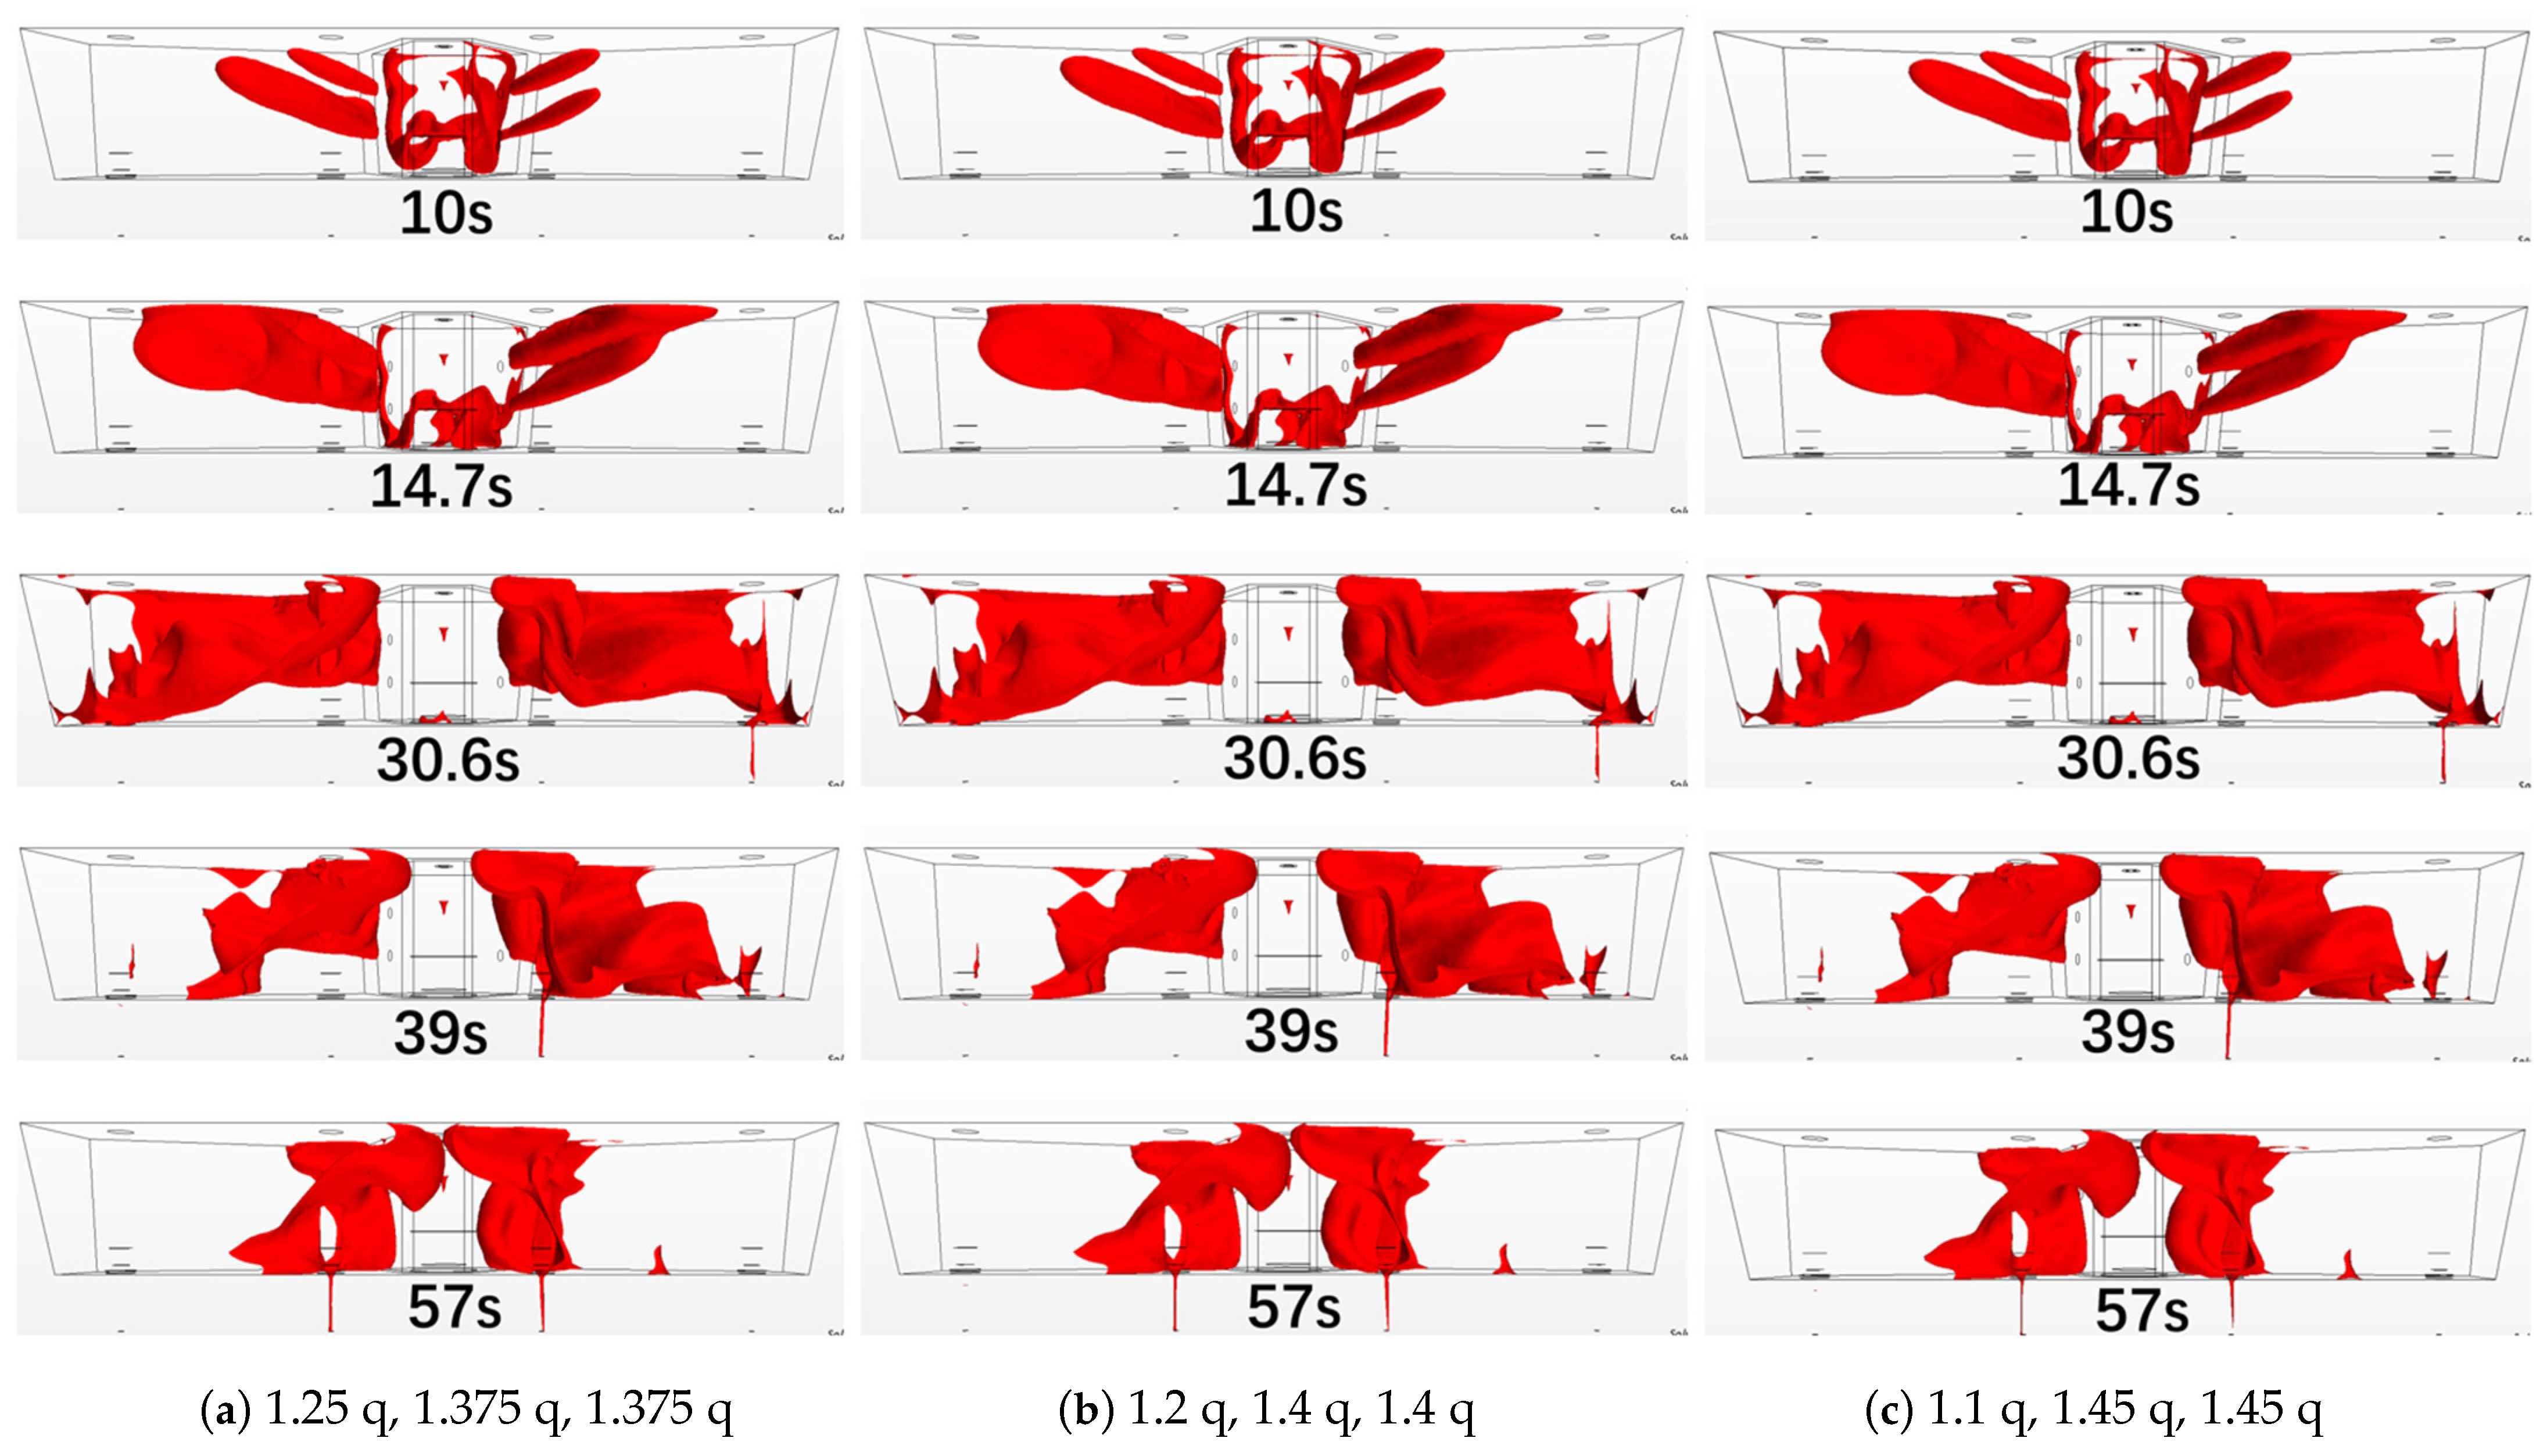
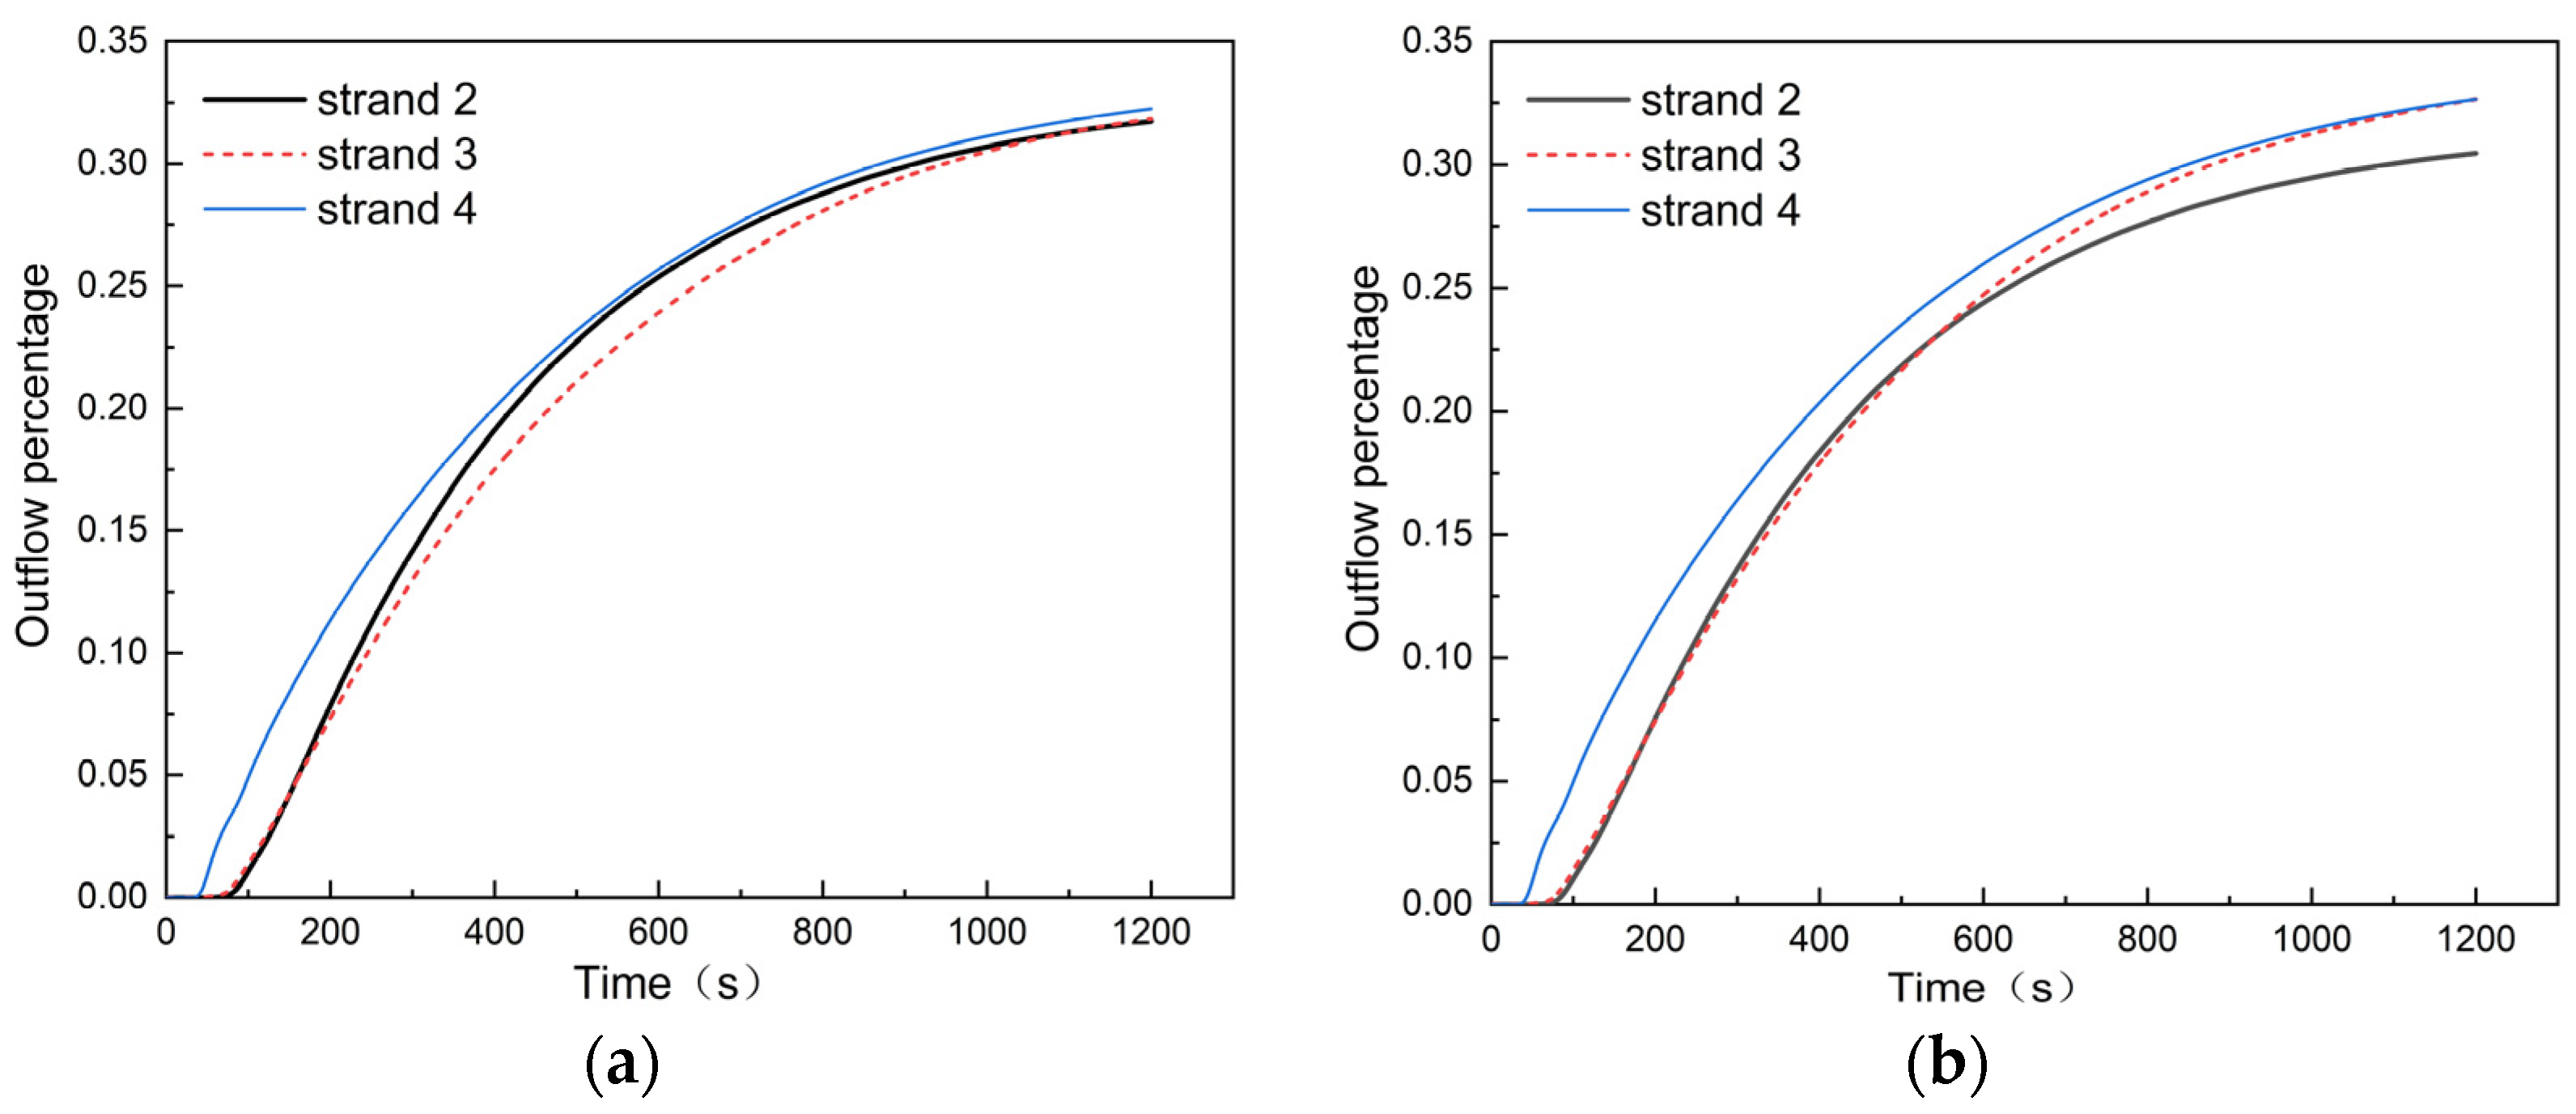
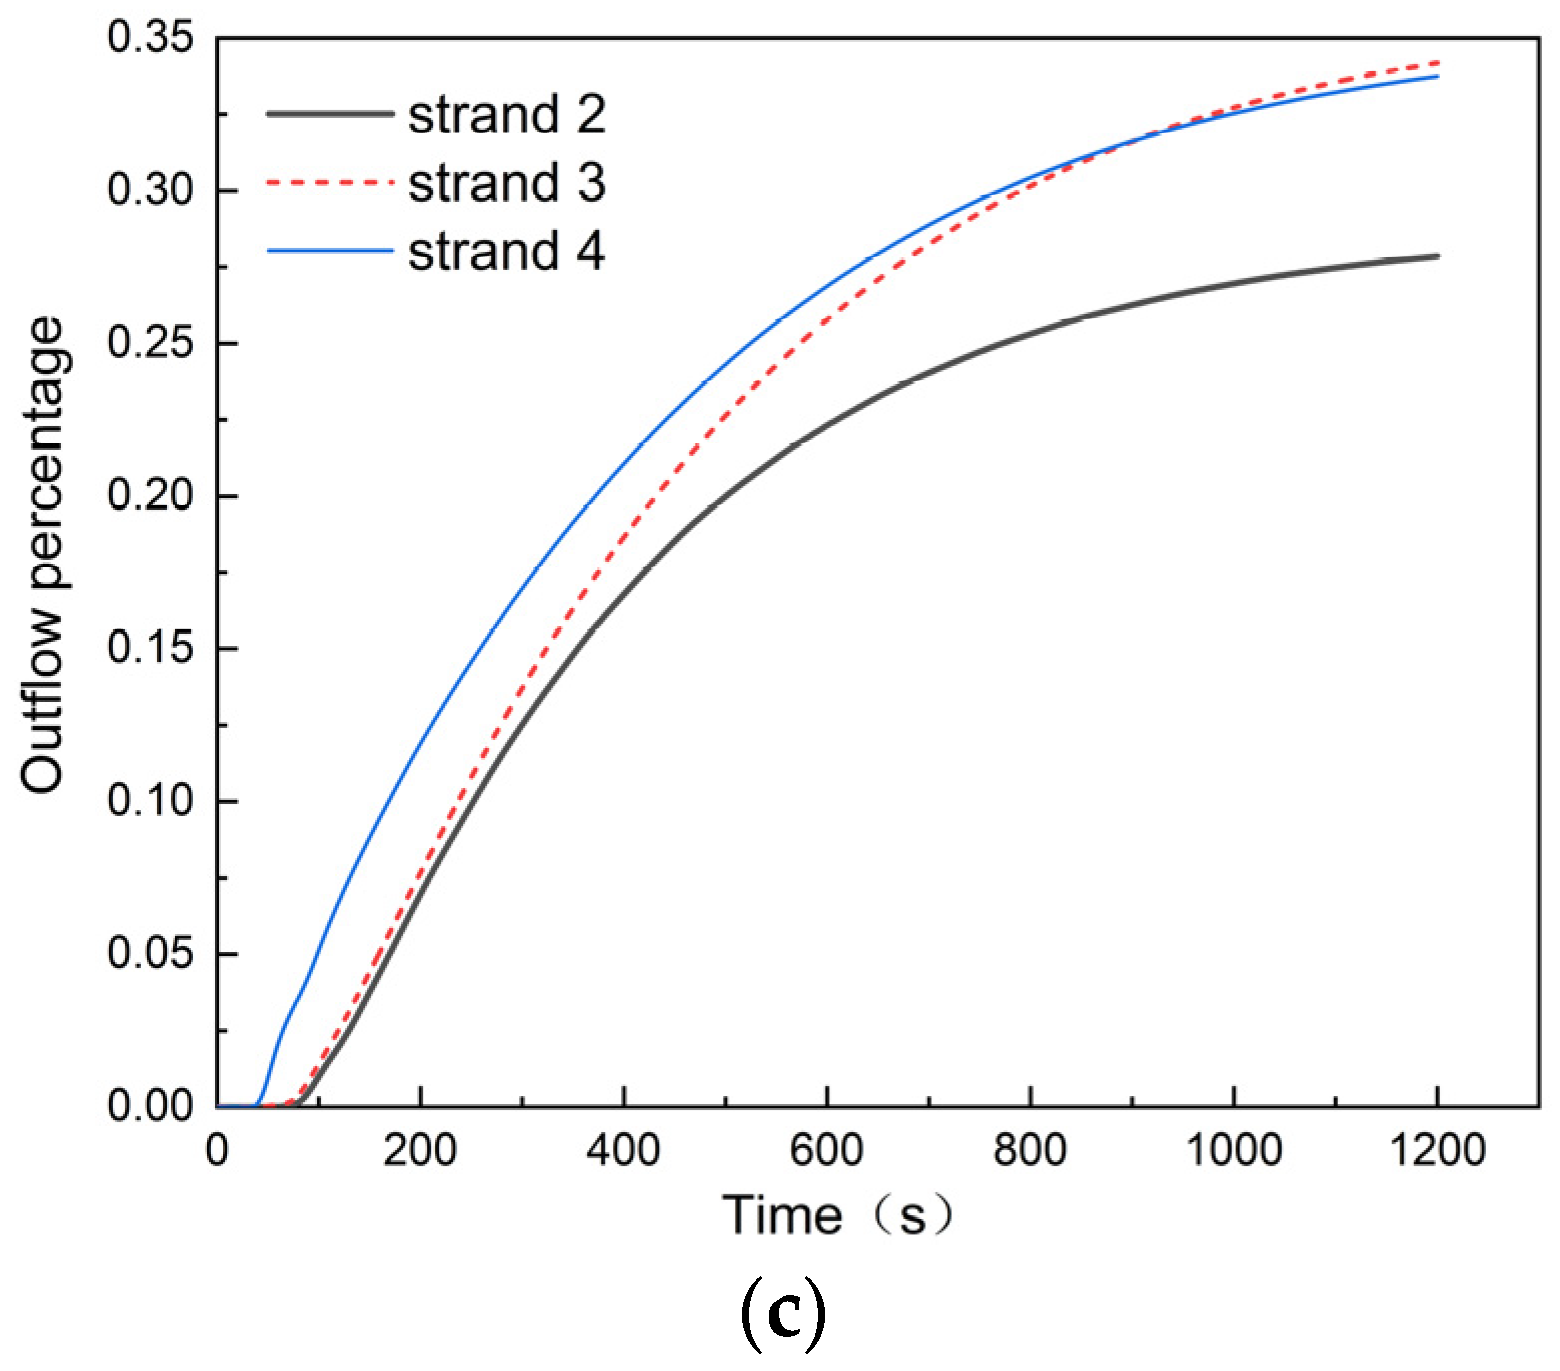
3.4. Dispersion and Outflow Percentage of Tracers under Single-Strand Blockage Conditions with Non-Uniform Increasing Casting Flow Rate

In the double-weir tundish, when the single-strand is blocked, the outflow percentage of strand 1 or strand 2 is significantly lower than that of strand 3 and strand 4. While in the u-shaped weir tundish, the situation is different. The outflow percentage of strand 1 or strand 2 is slightly higher than that of strand 3 and strand 4. Besides, in both tundishes, the outflow percentages of strands 3 and 4 are basically the same. After uniformly increasing the casting flow rate of the three strands, the consistency of each strand in the tundish has not been improved significantly. According to the results, a method of non-uniform increasing of the casting flow rate is proposed. Specifically, for the double-weir tundish, the casting flow rate of strand 1 or strand 2 is less than that of strand 3 and strand 4. For the u-shaped weir tundish, the casting flow rate of strand 1 or strand 2 is greater than that of strand 3 and strand 4. The studied cases are presented in Table 5. The total flow rate equals the 4 q of normal conditions.
Figure 21 shows the isosurfaces (values of 10−5) of non-uniform increasing of the casting flow rate cases of the double-weir tundish under the strand 1 blockage condition. It can be seen from the figure that, after non-uniform increasing of the casting flow rate, the flow field and tracer dispersion are basically the same as the previous result. The times for the tracer to reach outlet 2, outlet 3 and outlet 4 are (53 s, 38.25 s, 28 s), (52 s, 39 s, 28.5 s), (51 s, 39.75 s, 29 s), and (49.2 s, 41.25 s, 30 s) for the cases where the flow rates of strand 2 are 1.4 q, 1.45 q, 1.5 q and 1.6 q, respectively. It can be found that the difference in the response time of each strand is small.
Figure 22, Figure 23 and Figure 24 show the outflow percentage curve and variance of the outflow percentage curve of non-uniform increasing of the casting flow rate cases of the double-weir tundish. It can be seen from the outflow percentage curve that the outflow percentage curves of strand 3 and strand 4 are always consistent. For the strand 1 blockage condition, when the casting flow rate ratio of strand 2 to strand 3 and 4 increases, the outflow percentage of strand 2 increases gradually. The outflow percentages (at 1200 s) of strand 2, strand 3 and strand 4 are (30.53%, 32.22%, 32.36%), (31.93%, 31.58%, 31.68%), (33.37%, 30.98%, 30.95%), and (36.24%, 29.66%, 29.52%) for the cases where the flow rates of strand 2 are 1.4 q, 1.45 q, 1.5 q and 1.6 q, respectively. From the variance curve in Figure 24, when the flow rate of strand 2 is 1.5 q and the flow rate of strand 3 and strand 4 is 1.25 q, the consistency of each flow is the best.
For the strand 2 blockage condition, the outflow percentages (at 1200 s) of strand 1, strand 3 and strand 4 are (29.86%, 32.19%, 32.39%), (31.23%, 31.63%, 31.64%), (32.59%, 31.01%, 30.96%), and (35.43%, 29.67%, 29.55%) for the cases where the flow rates of strand 1 are 1.4 q, 1.45 q, 1.5 q and 1.6 q, respectively. The result is similar to the previous one. The time average variance result is given in Table 6; the consistency of each strand for all the cases is improved compared to the single strand blockage result in Table 3. The optimized case is that the flow rates of strand 1 (or strand 2), strand 3 and strand 4 are 1.5 q, 1.25 q and 1.25 q, respectively.
Figure 25 shows the isosurfaces (values of 10−5) of non-uniform increasing of casting flow rate cases of the u-shaped weir tundish under strand 1 blockage conditions. The flow field and tracer dispersion are basically the same for the three cases. The times for the tracer to reach outlet 2, outlet 3 and outlet 4 are 57 s, 39 s and 30.6 s, respectively. The response times are identical for all three cases.
Figure 26, Figure 27 and Figure 28 show the outflow percentage curve and variance of the outflow percentage curve of the non-uniformly increasing casting flow rate cases of the u-shaped weir tundish. For both strand 1 and strand 2 blockage conditions, the outflow percentage curves of the three strands are consistent in the cases where the flow rates of strand 2 or strand 1 are 1.25 q and 1.2 q. For the cases where the flow rate of strand 2 or strand 1 is 1.1 q and the flow rate of strand 3 and strand 4 is 1.45 q, the outflow percentage of strand 2 or strand 1 is lower than that of strand 3 and strand 4. When strand 1 is blocked, the outflow percentages (at 1200 s) of strand 2, strand 3 and strand 4 are (31.73%, 31.83%, 32.24%), (30.45%, 32.65%, 32.65%), and (27.857%, 34.19%, 33.74%) for the case where the flow rate of strand 2 is 1.25 q, 1.2 q, 1.1 q, respectively. When strand 2 is blocked, the outflow percentages (at 1200 s) of strand 1, strand 3 and strand 4 are (31.76%, 31.50%, 31.47%), (30.17%, 32.26%, 32.27%), and (27.64%, 33.91%, 33.40%) for the cases where the flow rate of strand 1 are 1.25 q, 1.2 q, 1.1 q, respectively.
From the time average variance result (Table 6), the consistency of each strand for cases where the flow rates of strand 2 or strand 1 are 1.25 q and 1.2 q are better than the single strand blockage result in Table 3. In the cases where the flow rates of strand 1 (or strand 2), strand 3 and strand 4 are 1.1 q, 1.45 q and 1.45 q, the consistency of each strand is even worse than that of the single strand blockage result. This may be due to the large difference between the flow rate of strands.

3.5. Discussion

This study compared the flow characteristics in two tundishes with typical flow control devices after single-strand blockage. Under normal working conditions, the double-weir flow control device separates the left and right main flow area into two relatively independent areas. The consistency of each strand is better than that of the u-shaped weir tundish. The result is consistent with the conclusions of L. Zhong et al. [14]. However, this research proves that, compared with the double-weir tundish, the consistency of each strand decreases slightly after the single-strand is blocked in the u-shaped weir tundish. This is because the two sides of the u-shaped weir tundish are connected, and the fluid could flow from the blocked side to another side. The u-shaped weir tundish has better adaptability to single-strand blockage conditions. Therefore, the flow control device that can make the main flow areas interact with each other can effectively alleviate the influence of single strand blockage on the consistency of each strand.
It is found that after the single-strand is blocked, the originally symmetrical four-strand tundish becomes an asymmetrical three-strand tundish, so the outflow percentages of the blocked left side and unblocked right sides are quite different. This paper attempts to improve the consistency of each strand by increasing the casting speed of each strand when the single-strand is blocked. After uniformly increasing the casting flow rate, the overall flow field did not change significantly. However, the transport of tracer in the tundish was accelerated, resulting in a reduced response time of each strand and an increase of the outflow percentage of each strand. This is similar to the results of T. Merder [19]. However, according to the outflow percentage curve and average variance, it can be seen that the consistency of each strand does not change significantly after uniformly increasing the casting flow rate. Thus, in this study, according to the outflow percentage curve of the main flow area on both sides, the methodology of F. He et al. [23], which increases the casting speed of the far-strand to increase the tundish yield, was applied to the casting speed adjustment of the main flow area on both sides after single strand blockage, that is, the non-uniform increasing casting flow rate method proposed in this study. To the authors’ knowledge, this was rarely studied in the literature. The results show that the case of a non-uniformly increasing casting flow rate can effectively improve the consistency of each strand compared with the case of a uniformly increasing casting flow rate. Therefore, by comparing the outflow percentage curves, in order to solve the problems of a multi-strand tundish blockage, production increase, long response time of far-strand and poor uniformity of asymmetric multi-strand tundish, the method of non-uniformly increasing the casting flow rate can be adopted to improve its flow characteristics and the consistency of each strand.
To summarize, the flow control device that can make the main flow areas interact with each other can effectively alleviate the influence of a single strand blockage on the consistency of each strand. For a specific flow control device, the outflow percentage method can be used to effectively compare the distribution differences of each strand. In addition, the consistency of each strand can be improved by means of the useful method of non-uniformly increasing the casting flow rate.

4. Conclusions

  • An analysis method of outflow percentage is proposed, and the consistency of the multi-strand tundish can be evaluated intuitively and quantitatively through the outflow percentage curve and time averaged variance;
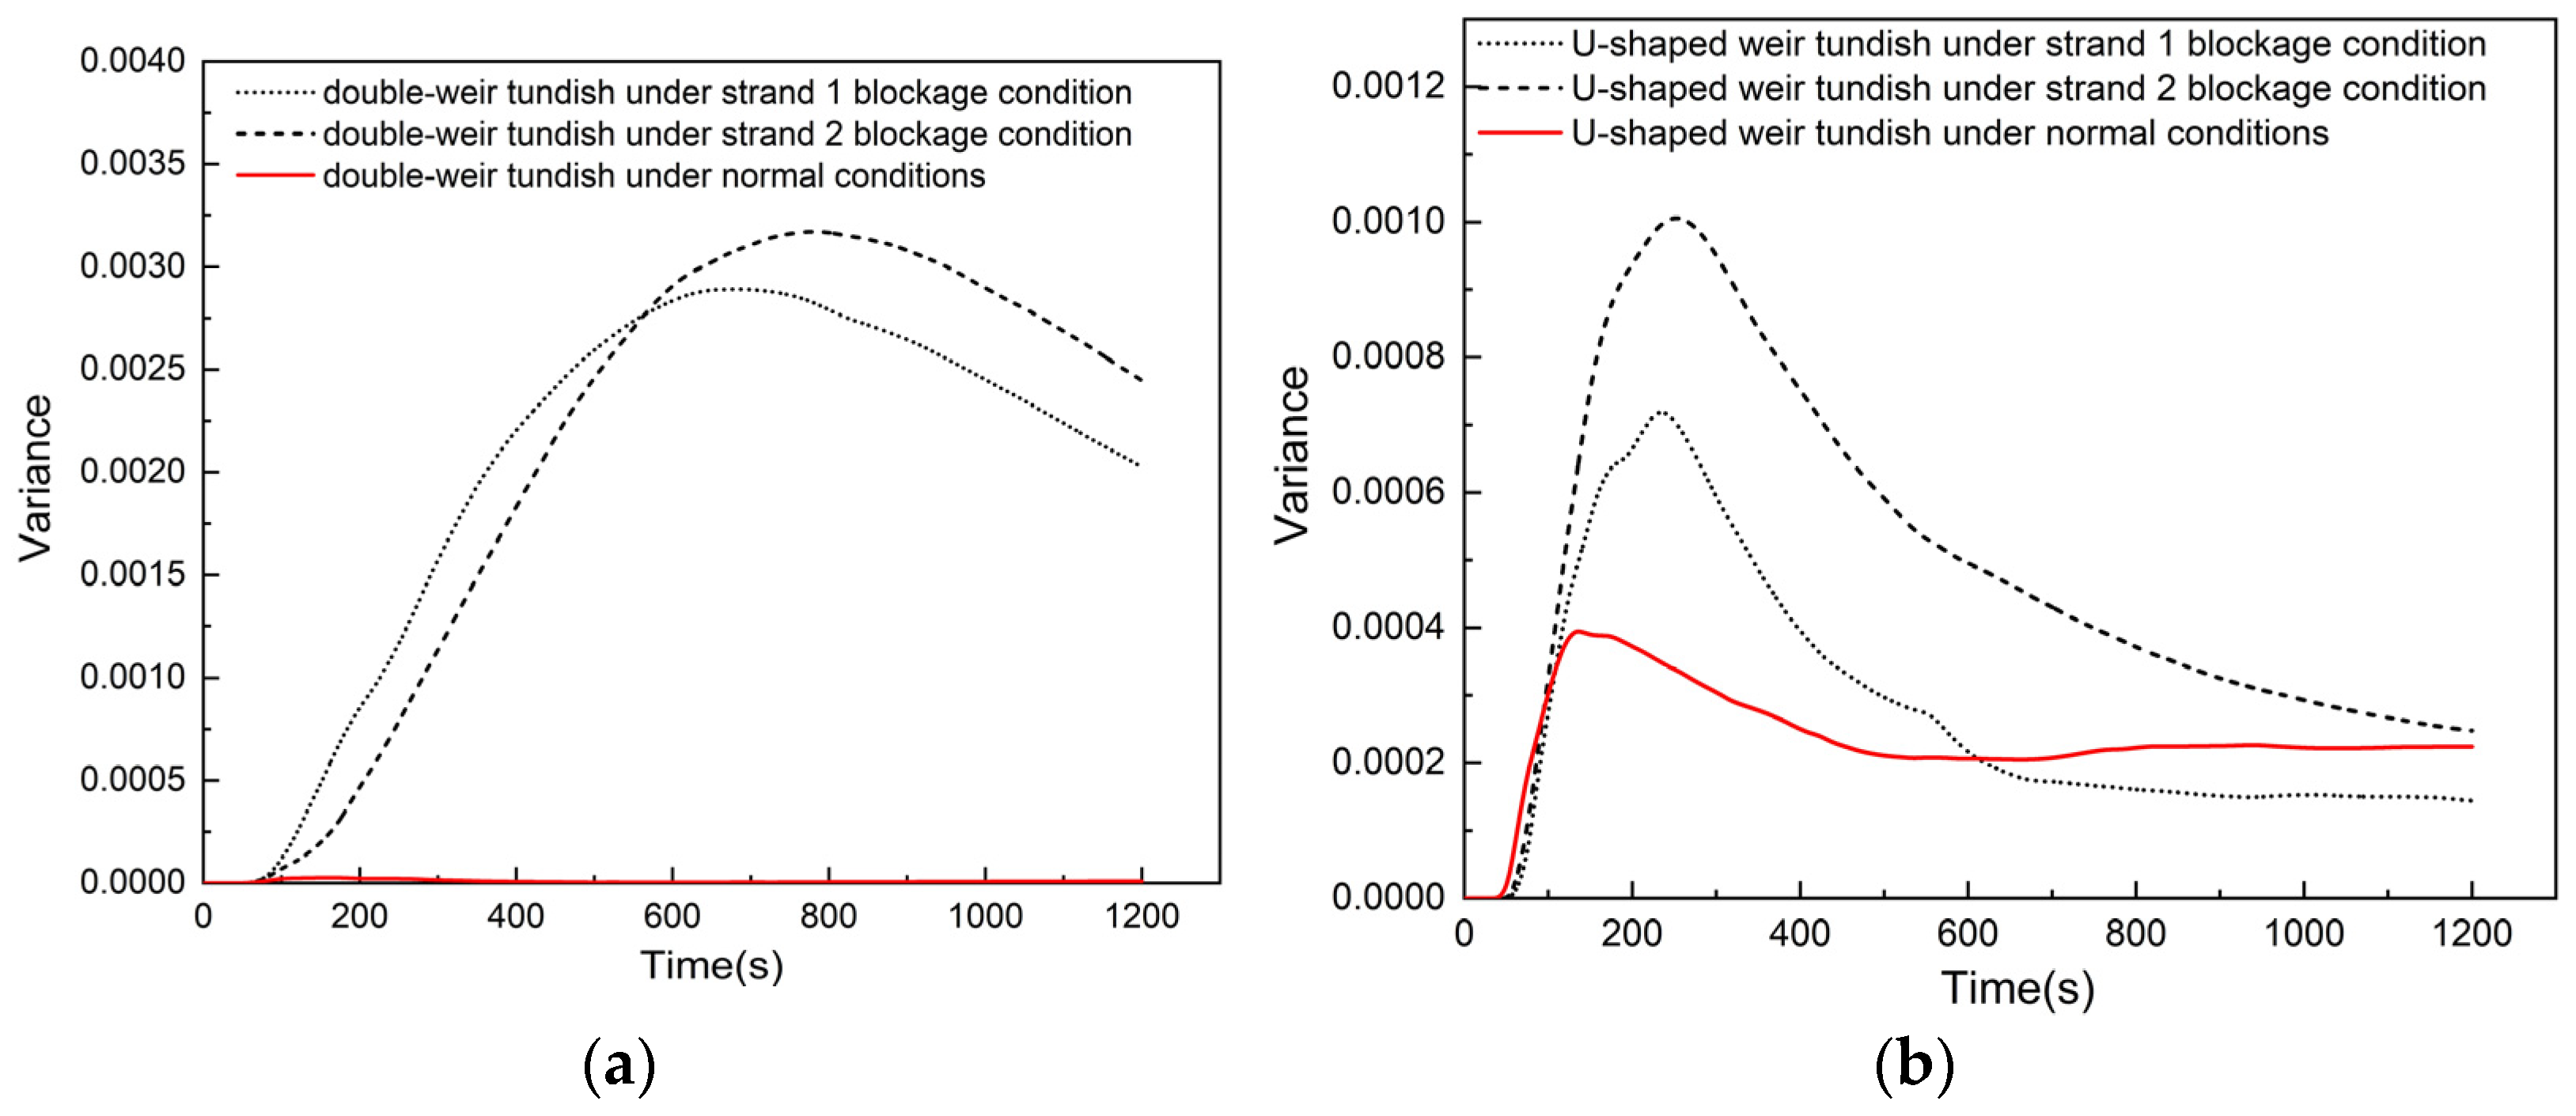
  • When a single-strand is blocked, the flow field in the tundish does not change significantly, but the consistency of each strand is significantly reduced. The consistency of each strand of the u-shaped weir tundish is better than that of the double-weir tundish;
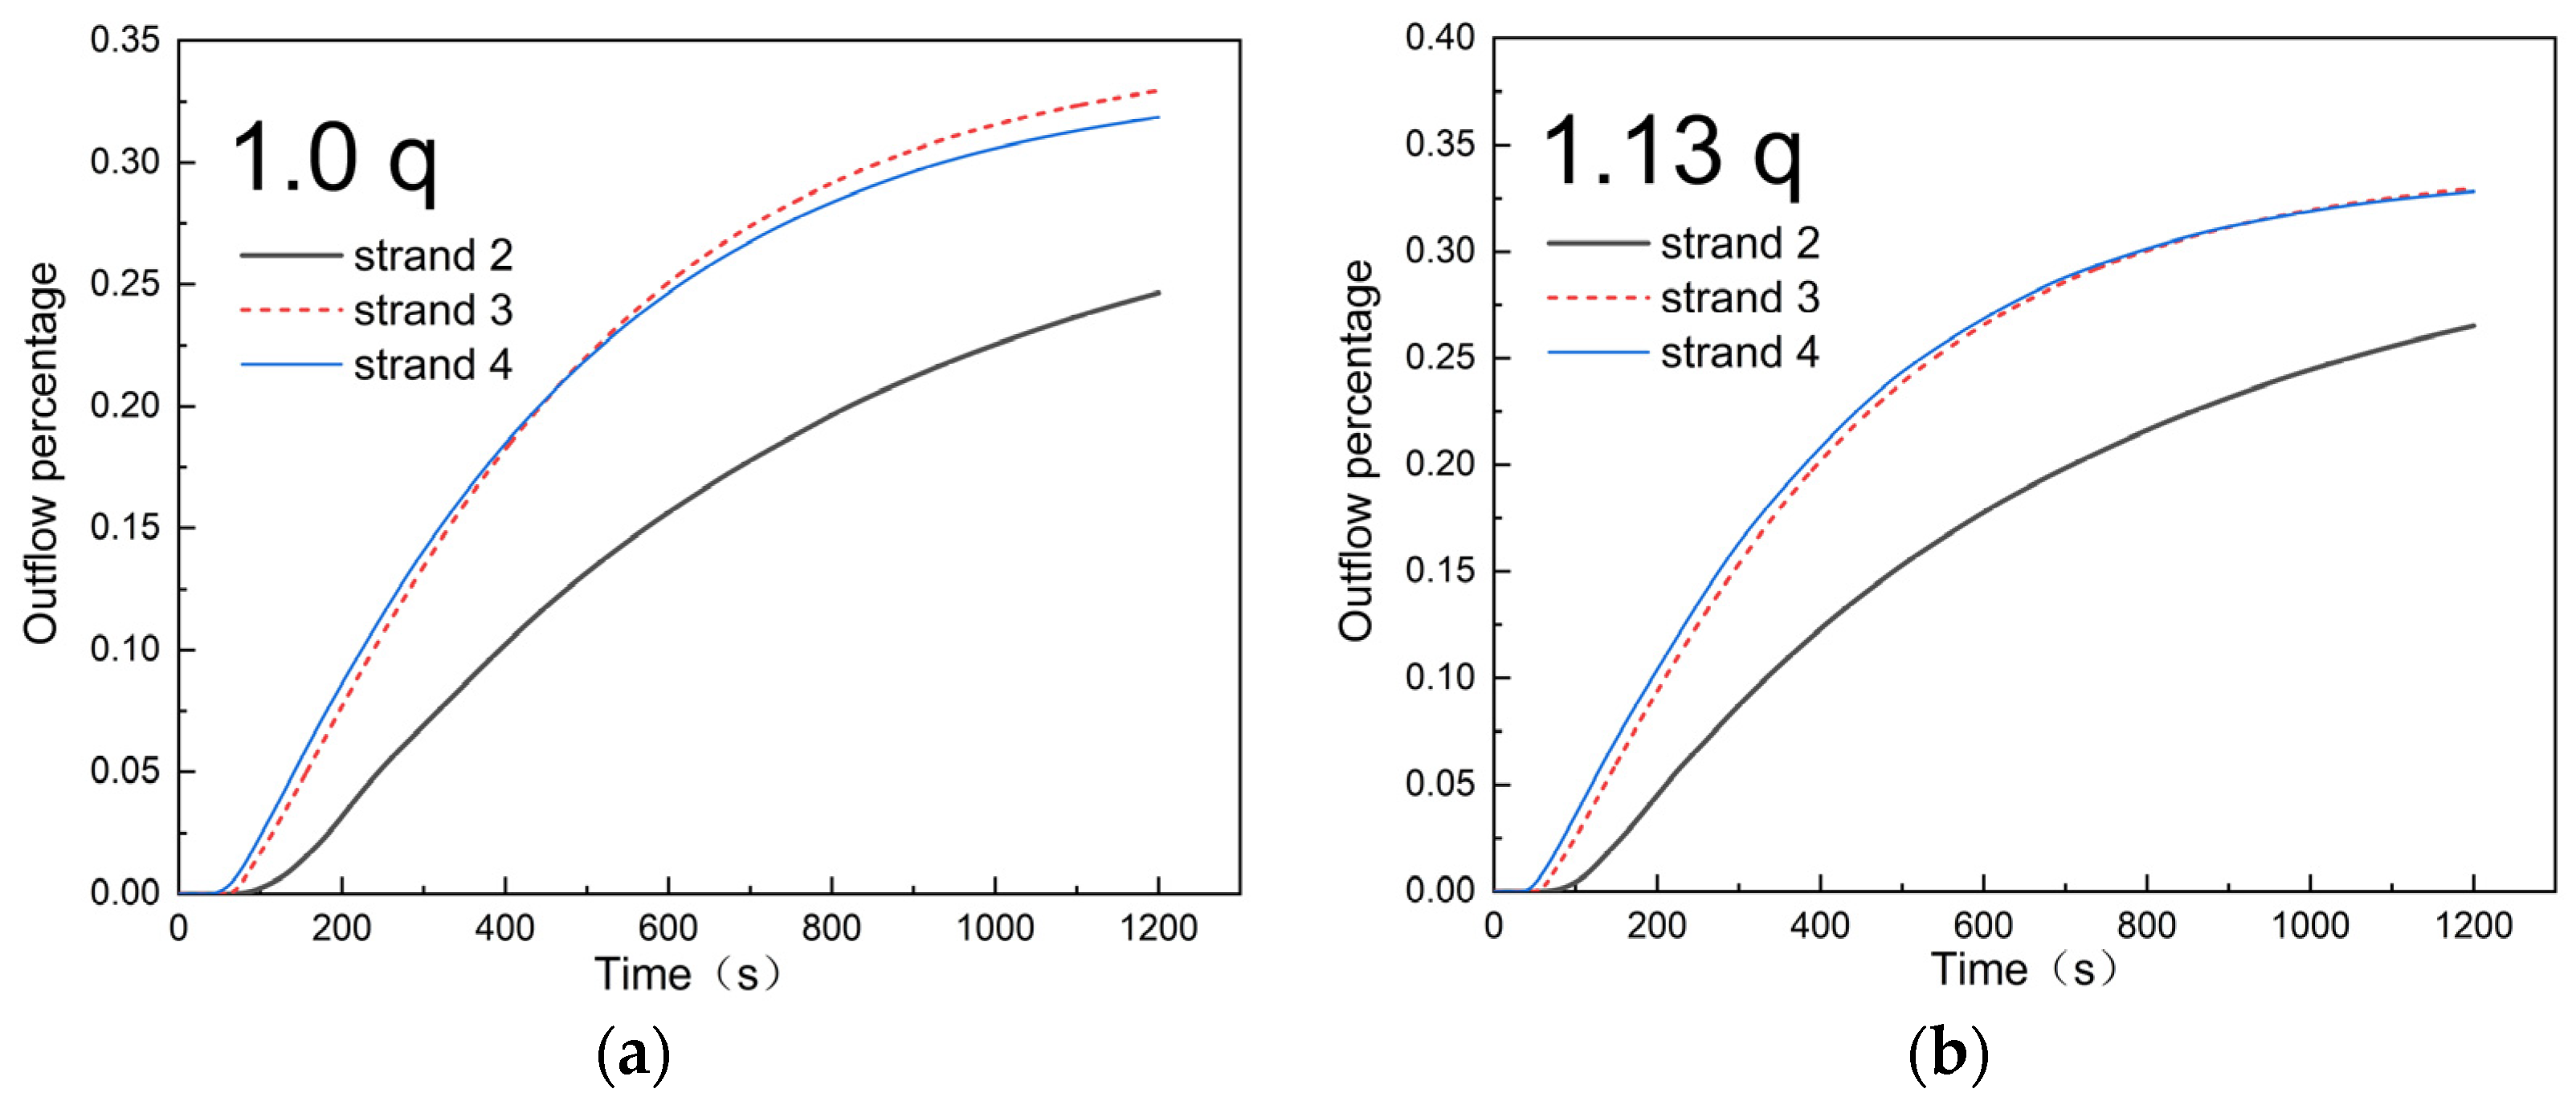
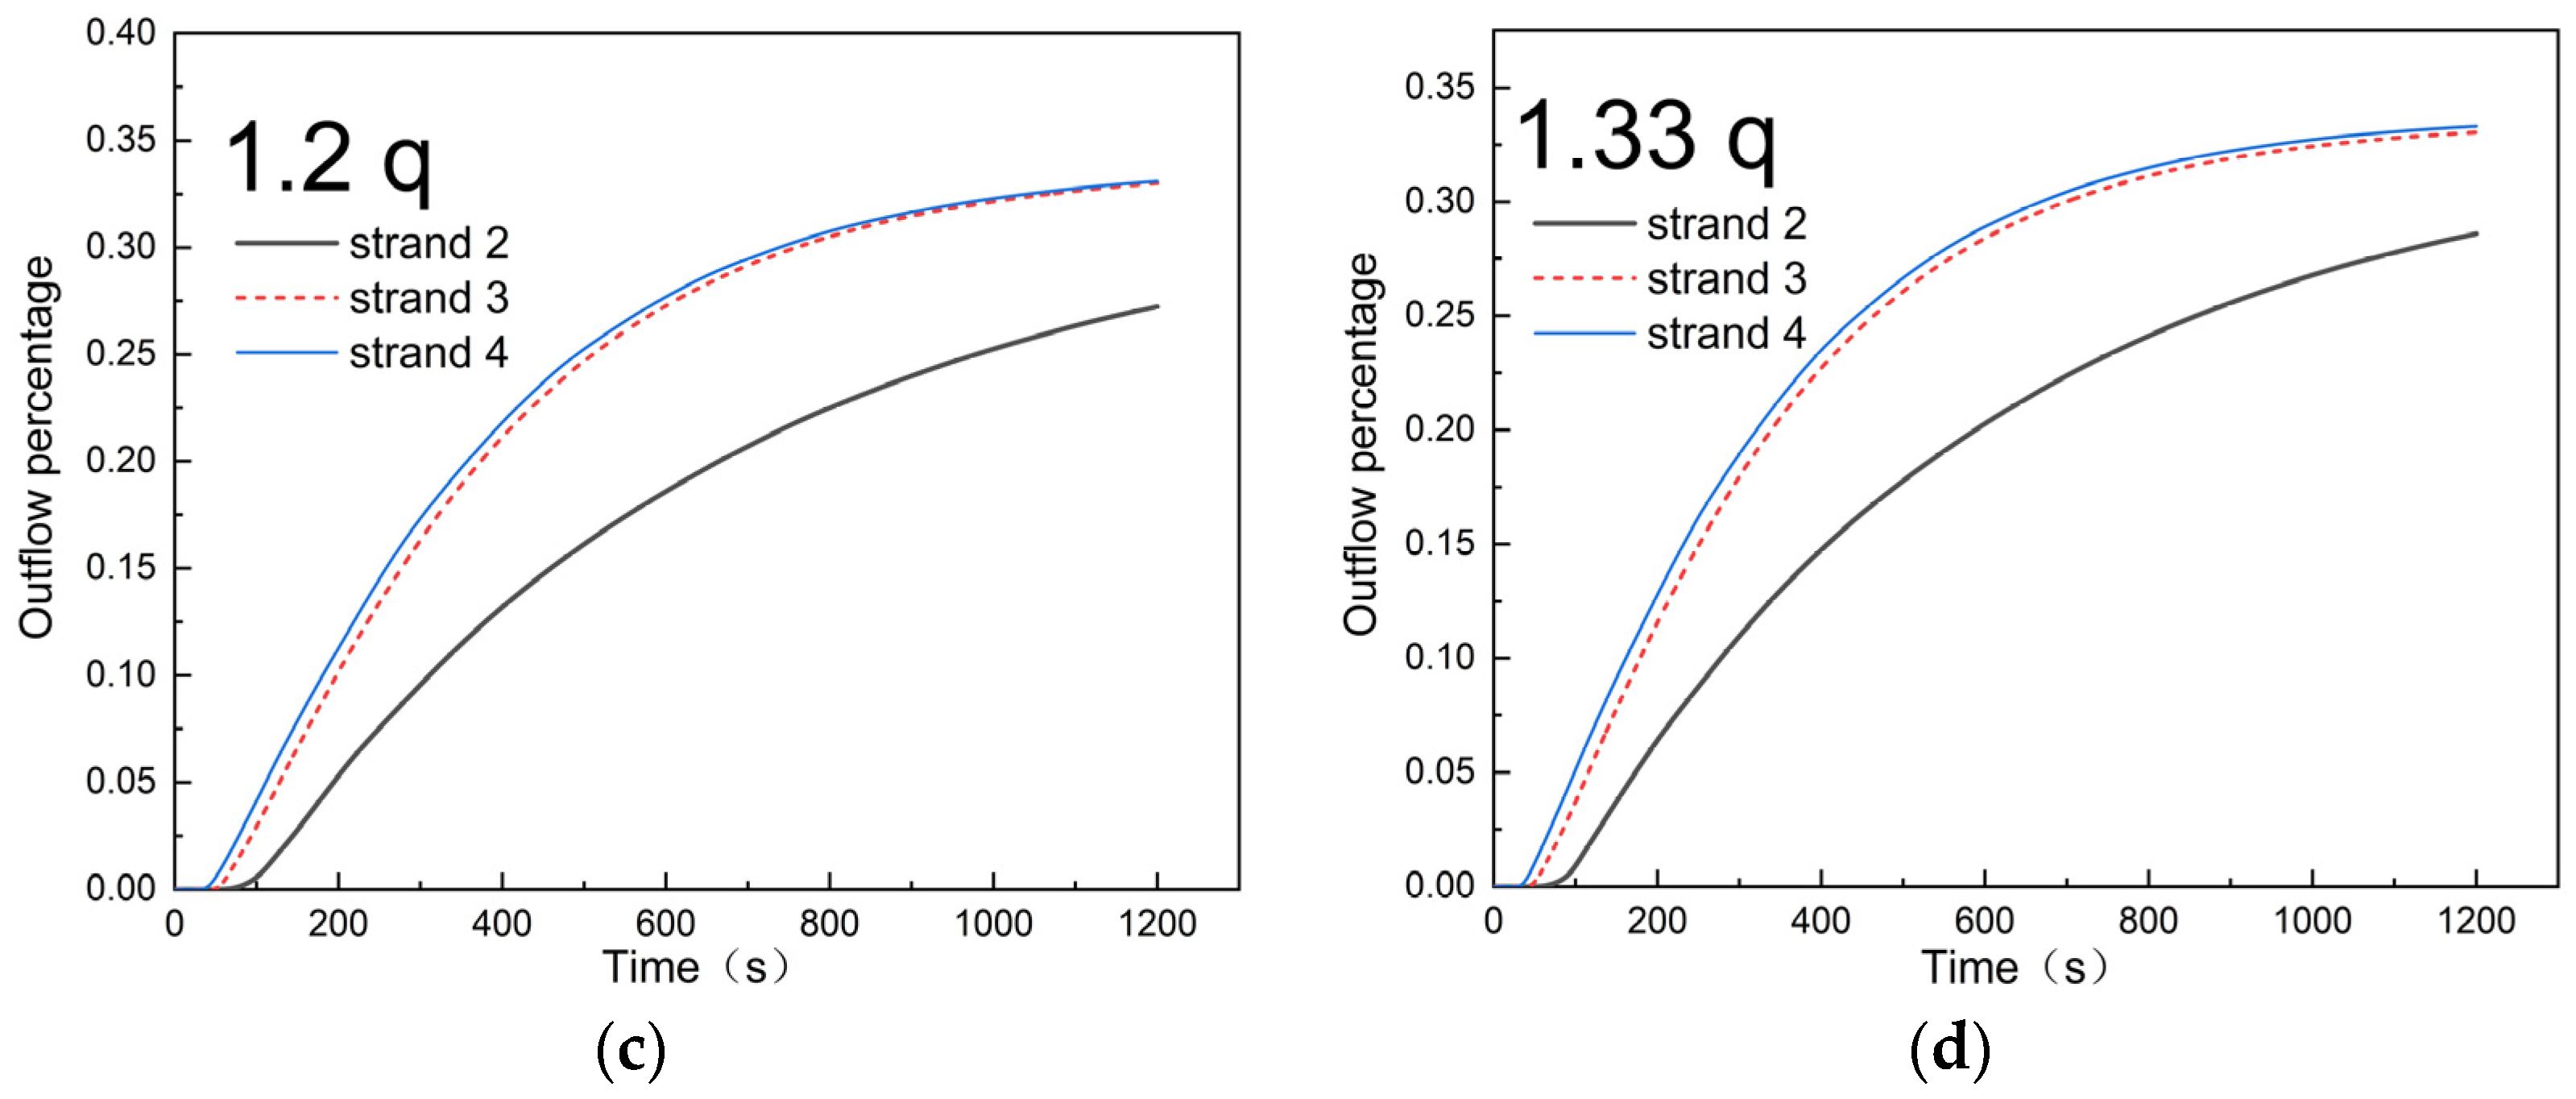
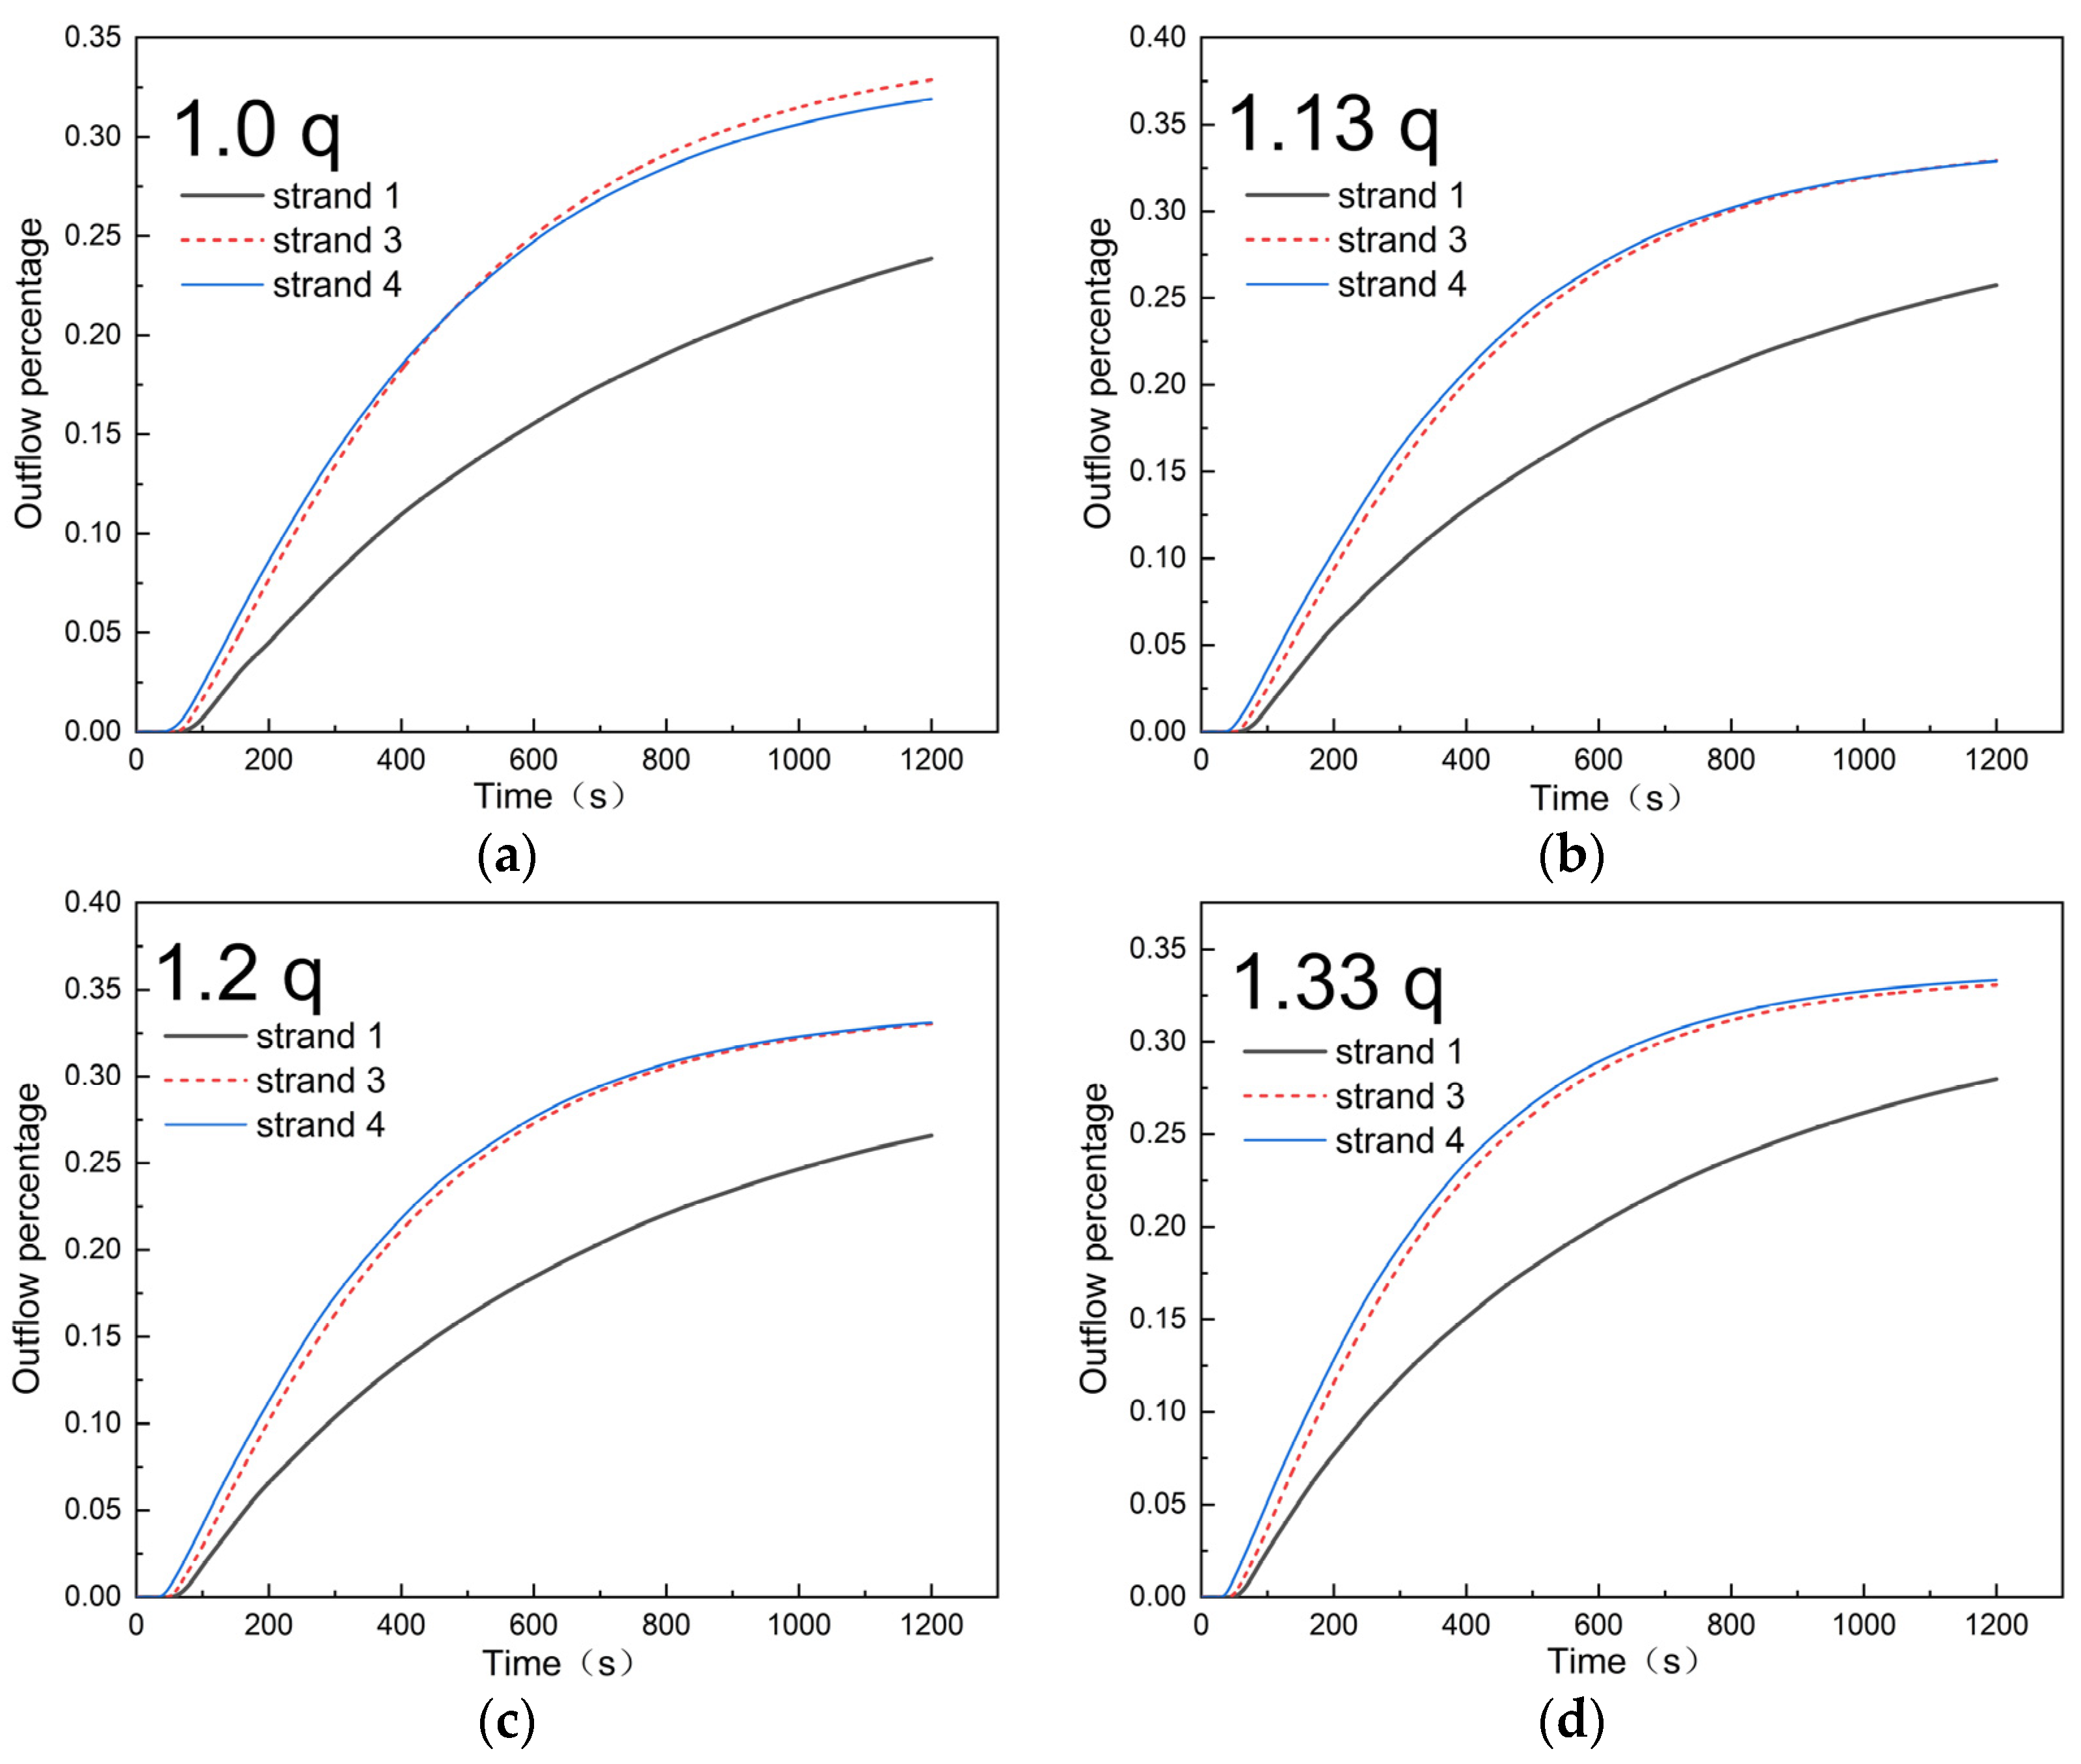
  • When a single-strand is blocked, uniformly increasing the casting flow rate of each strand has a limited effect on the flow field in the tundish. With the increase of the casting flow rate, the response time of each strand decreases and the outflow percentage increases. However, the uniformity of strands improved slightly in the double-weir tundish but decreased in the u-shaped tundish;
  • For the double-weir tundish, by significantly increasing the casting flow rate of the strand located in the blocked part by a factor of 1.5 and slightly increasing the casting flow rate of the other strands by a factor of 1.25, the consistency of each strand is the best;
  • For the u-shaped weir tundish, the consistency of each strand is improved by non-uniformly increasing the casting flow rate of the strands. The flow rates of the strand located in the blocked part and the other strands are increased by a factor of 1.25, and 1.375 or 1.2 and 1.4 are the optimized cases.

Author Contributions

Conceptualization, J.F.; methodology, Y.L. and C.C.; software, Y.L., T.W. and X.O.; resources, J.F. and W.L.; data curation, Y.L.; writing—original draft preparation, J.F. and Y.L.; writing—review and editing, C.C.; funding acquisition, C.C. All authors have read and agreed to the published version of the manuscript.

Funding

This research was funded by National Natural Science Foundation of China, grant number 51904204, and Applied Fundamental Research Programs of Shanxi Province, grant number 201901D211013.

Data Availability Statement

Not applicable.

Conflicts of Interest

The authors declare no conflict of interest.

References

  1. Chattopadhyay, K.; Isac, M.; Guthrie, R.I.L. Physical and mathematical modelling of steelmaking tundish operations: A review of the last decade (1999–2009). ISIJ Int. 2010, 50, 331–348. [Google Scholar] [CrossRef] [Green Version]
  2. Mazumdar, D. Review, analysis, and modeling of continuous casting tundish systems. Steel Res. Int. 2019, 90, 1800279. [Google Scholar] [CrossRef]
  3. Cwudziński, A. New Insight on Liquid Steel Microalloying by Pulse-Step Method in Two-Strand Slab Tundish by Numerical Simulations. Crystals 2021, 11, 448. [Google Scholar] [CrossRef]
  4. Zhao, M.; Wang, Y.; Yang, S.; Ye, M.; Li, J.; Liu, Y. Flow Field and Temperature Field in a Four-Strand Tundish Heated by Plasma. Metals 2021, 11, 722. [Google Scholar] [CrossRef]
  5. Ni, P.; Ersson, M.; Jonsson, L.T.I.; Zhang, T.-A.; Jönsson, P.G. Effect of Immersion Depth of a Swirling Flow Tundish SEN on Multiphase Flow and Heat Transfer in Mold. Metals 2018, 8, 910. [Google Scholar] [CrossRef] [Green Version]
  6. Zhang, B.; Liu, F.; Zhu, R.; Zhu, J. Effects of Multiple-Hole Baffle Arrangements on Flow Fields in a Five-Strand Asymmetric Tundish. Materials 2020, 13, 5129. [Google Scholar] [CrossRef] [PubMed]
  7. Sheng, D.-Y.; Yue, Q. Modeling of Fluid Flow and Residence-Time Distribution in a Five-Strand Tundish. Metals 2020, 10, 1084. [Google Scholar] [CrossRef]
  8. Bruch, C.; Valentin, P. Mathematical Modelling of Fluid Flow in a Continuous Casting Tundish with regard to Extraordinary Casting Conditions. Steel Res. Int. 2004, 75, 659–665. [Google Scholar] [CrossRef]
  9. Sengupta, A.; Mishra, P.; Singh, V.; Mishra, S.; Jha, P.K.; Ajmani, S.K.; Sharma, S.C. Physical Modelling Investigation of Influence of Strand Blockage on RTD Characteristics in a Multistrand Tundish. Ironmak. Steelmak. 2013, 40, 159–166. [Google Scholar] [CrossRef]
  10. Mishra, S.K.; Jha, P.K.; Sharma, S.C.; Ajmani, S.K. Effect of blockage of outlet nozzle on fluid flow and heat transfer in continuously cast multistrand billet caster tundish. Can. Metall. Q. 2012, 51, 170–183. [Google Scholar] [CrossRef]
  11. Merder, T. Numerical Investigation of The Hydrodynamic Conditions in a Multi-strand CC Tundish with Closed Outlets. Arch. Metall. Mater. 2014, 59, 891–896. [Google Scholar] [CrossRef]
  12. Zhang, L. Fluid Flow, Heat Transfer and Inclusion Motion in a Four-Strand Billet Continuous Casting Tundish. Steel Res. Int. 2005, 76, 784–796. [Google Scholar] [CrossRef]
  13. Hülstrung, J.; Zeimes, M.; Au, A.; Oppermann, W.; Radusch, G. Optimization of the Tundish Design to Increase the Product Quality by means of Numerical Fluid Dynamics. Steel Res. Int. 2005, 76, 59–63. [Google Scholar] [CrossRef]
  14. Zhong, L.; Wang, M.; Chen, B.; Wang, C.; Zhu, Y. Flow Control in Six-Strand Billet Continuous Casting Tundish with Different Configurations. J. Iron Steel Res. Int. 2010, 17, 7–12. [Google Scholar] [CrossRef]
  15. Yao, C.; Wang, M.; Pan, M.; Bao, Y. Optimization of large capacity six-strand tundish with flow channel for adapting situation of fewer strands casting. J. Iron Steel Res. Int. 2021, 28, 1114–1124. [Google Scholar] [CrossRef]
  16. Liu, Z.; Jin, Y.; Gan, F.; Lin, P.; Huang, J.; Li, J. Analysis of Optimization Weights for Flow Field of Internal Rotation Stabilizer Coupled with Porous Retaining Wall. Metals 2021, 11, 1208. [Google Scholar] [CrossRef]
  17. Sheng, D.-Y.; Chen, D. Comparison of Fluid Flow and Temperature Distribution in a Single-Strand Tundish with Different Flow Control Devices. Metals 2021, 11, 796. [Google Scholar] [CrossRef]
  18. Yang, B.; Lei, H.; Zhao, Y.; Xing, G.; Zhang, H. Quasi-Symmetric Transfer Behavior in an Asymmetric Two-Strand Tundish with Different Turbulence Inhibitor. Metals 2019, 9, 855. [Google Scholar] [CrossRef] [Green Version]
  19. Merder, T. Effect of casting flow rate on steel flow phenomena in tundish. Metalurgija 2013, 52, 161–164. [Google Scholar]
  20. Bul’ko, B.; Priesol, I.; Demeter, P.; Gašparovič, P.; Baricová, D.; Hrubovčáková, M. Geometric Modification of the Tundish Impact Point. Metals 2018, 8, 944. [Google Scholar] [CrossRef] [Green Version]
  21. Boonpen, K.; Kowitwarangkul, P.; Ninpetch, P.; Phophichit, N.; Chuchuay, P.; Threrujirapapong, T.; Otarawanna, S. Numerical study of influence of casting speed on fluid flow characteristics in the four strand tundish. Mater. Today 2021, 47, 3480–3486. [Google Scholar] [CrossRef]
  22. Liu, Z.; Li, Y.; Cheng, C.; Lan, P.; Wu, W. Study on Parameter Optimization of Diversion Wall in an Eight-Strand Tundish during Continuous Casting of Billet with High Casting Speed. Processes 2022, 10, 555. [Google Scholar] [CrossRef]
  23. Raghavendra, K.; Sarkar, S.; Ajmani, S.K.; Denys, M.B.; Singh, M.K. Mathematical modelling of single and multi-strand tundish for inclusion analysis. Appl. Math. Model. 2013, 37, 6284–6300. [Google Scholar] [CrossRef]
  24. Wang, Q.; Tan, C.; Huang, A.; Yan, W.; Gu, H.; He, Z.; Li, G. Numerical simulation on refractory wear and inclusion formation in continuous casting tundish. Metall. Mater. Trans. B 2021, 52, 1344–1356. [Google Scholar] [CrossRef]
  25. Cwudzinski, A. Numerical Prediction of Hydrodynamic Conditions in One Strand Tundish. Influence of Thermal Conditions and Casting Speed. Arch. Metall. Mater. 2014, 59, 1249–1256. [Google Scholar] [CrossRef] [Green Version]
  26. He, F.; Wang, H.; Zhu, Z. Numerical Investigation of Effect of Casting Speed on Flow Characteristics of Molten Steel in Multistrand Tundish. ISIJ Int. 2019, 59, 1250–1258. [Google Scholar] [CrossRef] [Green Version]
  27. Chen, C.; Jonsson, L.T.I.; Tilliander, A.; Cheng, G.; Jönsson, P.G. A mathematical modeling study of the influence of small amounts of KCl solution tracers on mixing in water and residence time distribution of tracers in a continuous flow reactor-metallurgical tundish. Chem. Eng. Sci. 2015, 137, 914–937. [Google Scholar] [CrossRef]
  28. Chen, C.; Jonsson, L.T.I.; Tilliander, A.; Cheng, G.; Jönsson, P.G. A mathematical modeling study of tracer mixing in a continuous casting tundish. Metall. Mater. Trans. B 2015, 46, 169–190. [Google Scholar] [CrossRef]
  29. Zheng, S.; Zhu, M. Criteria on the Similarity of Melt Flow among Strands in Multi-strand Continuous Casting Tundish. Chin. J. Eng. Des. 2006, 6, 522–526. [Google Scholar] [CrossRef]
  30. Tkadlečková, M.; Walek, J.; Michalek, K.; Huczala, T. Numerical Analysis of RTD Curves and Inclusions Removal in a Multi-Strand Asymmetric Tundish with Different Configuration of Impact Pad. Metals 2020, 10, 849. [Google Scholar] [CrossRef]
  31. Ai, X.; Han, D.; Li, S.; Zeng, H.; Li, H. Optimization of flow uniformity control device for six-stream continuous casting tundish. J. Iron Steel Res. Int. 2020, 27, 1035–1044. [Google Scholar] [CrossRef]
  32. Cui, H.; Liu, Y.; Li, D. Fluid Flow Characterization in Asymmetric Tundish. ISIJ Int. 2015, 55, 2604–2608. [Google Scholar] [CrossRef] [Green Version]
  33. Braga, B.M.; Tavages, R.P. Additional Information on “Fluid Flow Characterization in Asymmetric Tundish” by Cui, Liu and Li. ISIJ Int. 2018, 58, 1953–1955. [Google Scholar] [CrossRef] [Green Version]
  34. Chen, C.; Cheng, G.G.; Yang, H.K.; Hou, Z.B. Physical modeling of fluid flow characteristics in a delta shaped, four-strand continuous casting tundish with different flow control devices. Adv. Mater. Res. 2011, 284, 1071–1079. [Google Scholar] [CrossRef]
  35. Shih, T.H.; Liou, W.W.; Shabbir, A.; Yang, Z.; Zhu, J. A new k-ϵ eddy viscosity model for high reynolds number turbulent flows. Comput. Fluids 1995, 24, 227–238. [Google Scholar] [CrossRef]
  36. Rodi, W. Experience with two-layer models combining the k-epsilon model with a one-equation model near the wall. In Proceedings of the 29th Aerospace Sciences Meeting, Reno, NV, USA, 1–10 January 1991; ARC: Columbus, OH, USA, 1991; p. 216. [Google Scholar] [CrossRef]
  37. Wolfshtein, M. The velocity and temperature distribution in one-dimensional flow with turbulence augmentation and pressure gradient. Int. J. Heat Mass Transf. 1969, 12, 301–318. [Google Scholar] [CrossRef]
  38. Siemens. STAR-CCM+ Version 13.04 User Guide; Siemens PLM Software: Munich, Germany, 2019. [Google Scholar]
Figure 1. Two-dimensional drawing of double weir and four-strand tundish, (a) front view, (b) top view.
Metals 12 01016 g001
Figure 2. Two-dimensional drawing of u-shaped weir and four-strand tundish, (a) front view, (b) top view.
Metals 12 01016 g002
Figure 3. Mesh of four-strand tundishes, (a) Front view of u-shaped weir and four-strand tundish; (b) top view of u-shaped weir and four-strand tundish; (c) pouring chamber of double weir in four-strand tundish.
Metals 12 01016 g003
Figure 4. Verification of RTD curves and experiments of inner and outer strands under different mesh: (a) inner strand, (b) outer strand.
Metals 12 01016 g004
Figure 5. Comparison of ink diffusion photographs in water model and isosurface (ω = 10−5) figures of numerical simulation results of double-weir tundish: (a) ink diffusion photographs, (b) isosurface figures.
Metals 12 01016 g005
Figure 6. Comparison of ink diffusion photographs in water model and isosurface (ω = 10−5) figures of numerical simulation results of u-shaped weir tundish: (a) ink diffusion photographs, (b) isosurface figures.
Metals 12 01016 g006
Figure 7. The comparison of RTD curves of physical model and numerical simulation of double-weir tundish: (a) strand 1, (b) strand 2, (c) strand 3, (d) strand 4.
Metals 12 01016 g007aMetals 12 01016 g007b
Figure 8. The comparison of RTD curves of physical model and numerical simulation of u-shaped weir tundish: (a) strand 1, (b) strand 2, (c) strand 3, (d) strand 4.
Metals 12 01016 g008
Figure 9. Streamline evolution of the double-weir tundish under single-strand blockage conditions, (a) strand 1 blockage, (b) strand 2 blockage.
Metals 12 01016 g009
Figure 10. Streamline evolution of the u-shaped weir tundish under single-strand blockage conditions: (a) strand 1 blockage, (b) strand 2 blockage.
Metals 12 01016 g010
Figure 11. Outflow percentage curve of four-strand tundish under single-strand blockage and normal conditions: (a) double-weir tundish, (b) u-shaped weir tundish.
Metals 12 01016 g011
Figure 12. Variance of outflow percentage of four-strand tundish under single-strand blockage and normal conditions: (a) double-weir tundish, (b) u-shaped weir tundish.
Metals 12 01016 g012
Figure 13. Isosurface evolution results of the double-weir tundish with uniform increasing casting flow rate under strand 1 blockage condition (ω = 10−5).
Metals 12 01016 g013
Figure 14. Outflow percentage curve of the double-weir tundish with uniform increasing casting flow rate under strand 1 blockage condition: (a) 1.0 q, (b) 1.13 q, (c) 1.20 q, (d) 1.33 q.
Metals 12 01016 g014aMetals 12 01016 g014b
Figure 15. Outflow percentage curve of the double-weir tundish with uniform increasing casting flow rate under strand 2 blockage condition: (a) 1.0 q, (b) 1.13 q, (c) 1.20 q, (d) 1.33 q.
Metals 12 01016 g015
Figure 16. Variance of outflow percentage of the double-weir tundish with uniform increasing casting flow rate under single-strand blockage conditions: (a) strand 1 blockage, (b) strand 2 blockage.
Metals 12 01016 g016
Figure 17. Isosurface evolution results of the u-shaped weir tundish with uniform increasing casting flow rate under strand 1 blockage condition (ω = 10−5).
Metals 12 01016 g017
Figure 18. Outflow percentage curve of the u-shaped weir tundish with uniform increasing casting flow rate under strand 1 blockage condition: (a) 1.0 q, (b) 1.13 q, (c) 1.20 q, (d) 1.33 q.
Metals 12 01016 g018aMetals 12 01016 g018b
Figure 19. Outflow percentage curve of the u-shaped weir tundish with uniform increasing casting flow rate under strand 2 blockage condition: (a) 1.0 q, (b) 1.13 q, (c) 1.20 q, (d) 1.33 q.
Metals 12 01016 g019
Figure 20. Variance of outflow percentage of the u-shaped weir tundish with uniform increasing casting flow rate under single-strand blockage conditions: (a) strand 1 blockage, (b) strand 2 blockage.
Metals 12 01016 g020
Figure 21. Isosurface evolution results of the double-weir tundish with non-uniform increasing casting flow rate under strand 1 blockage condition (ω = 10−5).
Metals 12 01016 g021
Figure 22. Outflow percentage curve of the double-weir tundish with non-uniform increasing casting flow rate under strand 1 blockage conditions: (a) 1.4 q,1.3 q, 1.3 q, (b) 1.45 q, 1.275 q, 1.275 q, (c) 1.5 q, 1.25 q, 1.25 q, (d) 1.6 q, 1.2 q, 1.2 q.
Metals 12 01016 g022aMetals 12 01016 g022b
Figure 23. Outflow percentage curve of the double-weir tundish with non-uniform increasing casting flow rate under strand 2 blockage conditions: (a) 1.4 q, 1.3 q, 1.3 q, (b) 1.45 q, 1.275 q, 1.275 q, (c) 1.5 q, 1.25 q, 1.25 q, (d) 1.6 q, 1.2 q, 1.2 q.
Metals 12 01016 g023
Figure 24. Variance of outflow percentage of the double-weir tundish with non-uniform increasing casting flow rate under single-strand blockage conditions: (a) strand 1 blockage, (b) strand 2 blockage.
Metals 12 01016 g024
Figure 25. Isosurface evolution results of the u-shaped weir tundish with non-uniform increasing casting flow rate under strand 1 blockage condition (ω = 10−5).
Metals 12 01016 g025
Figure 26. Outflow percentage curve of the u-shaped weir tundish with non-uniform increasing casting flow rate under strand 1 blockage condition: (a) 1.25 q, 1.375 q, 1.375 q, (b) 1.2 q, 1.4 q, 1.4 q, (c) 1.1 q, 1.45, 1.45 q.
Metals 12 01016 g026aMetals 12 01016 g026b
Figure 27. Outflow percentage curve of the u-shaped weir tundish with non-uniform increasing casting flow rate under strand 2 blockage condition: (a) 1.25 q, 1.375 q, 1.375 q, (b) 1.2 q, 1.4 q, 1.4 q, (c) 1.1 q, 1.45, 1.45 q.
Metals 12 01016 g027
Figure 28. Variance of outflow percentage of the u-shaped weir tundish with non-uniform increasing casting flow rate under single-strand blockage conditions: (a) strand 1 blockage, (b) strand 2 blockage.
Metals 12 01016 g028
Table 1. Research on effect of tundish casting speed change.
InvestigatorsYearTundish TypeResearch Focus
T. Merder [19]2013two-stranddead volume and well mixed volume
K. Raghavendra. et al. [23]2013four-strandinclusion separation efficiency
A. Cwudzinski [25]2014single-strandtemperatures difference
B. Bul’ko. et al. [20]2018two-strandresidence time
F. He. et al. [26]2019five-strandflow characteristics
Q. Wang. et al. [24]2021single-strandinclusion separation efficiency
Boonpen K. et al. [21]2021four-strandresponse time
Liu Z. et al. [22]2022eight-strandresidence time and consistency
Table 2. Parameters of the industrial tundish and water model [34].
ParametersVolumetric Flowrate per Nozzle (L/h)Diameter of the Nozzle (mm)Depth of Liquid (mm)Distance between Two Nozzles (mm)Depth of Shroud Penetration (mm)
Industrial tundish3105308001200220
Water model1991026740073
Table 3. Time average variance of outflow percentage of each strand under normal condition and single-strand blockage condition of two designs of tundish.
CaseDouble-Weir Tundish under Normal Conditionsu-Shaped Weir Tundish under Normal ConditionsDouble-Weir Tundish under Single-Strand Blockage Conditionsu-Shaped Weir Tundish under Single-Strand Blockage Conditions
Strand 1 BlockageStrand 2 BlockageStrand 1 BlockageStrand 2 Blockage
variance8.74 × 10−62.36 × 10−42.02 × 10−32.09 × 10−32.76 × 10−44.88 × 10⁻⁴
Table 4. Time average variance of outflow percentage of each strand with uniform increasing casting flow rate under single-strand blockage conditions of two tundish designs.
CaseDouble-Weir Tundishu-Shaped Weir Tundish
Outlet flow rates1.0 q1.13 q1.2 q1.33 q1.0 q1.13 q1.2 q1.33 q
Strand 1 blockage2.02 × 10−31.81 × 10−31.73 × 10−31.51 × 10−32.76 × 10−49.29 × 10−49.92 × 10−43.04 × 10⁻⁴
Strand 2 blockage2.09 × 10−31.85 × 10−31.76 × 10−31.52 × 10−34.88 × 10−41.18 × 10−31.46 × 10−34.42 × 10⁻⁴
Table 5. Studied cases of non-uniform increasing casting flow rate.
Strand BlockageDouble-Weir Tundishu-Shaped Weir Tundish
Strand 1Strand 2Strand 3Strand 4Strand 1Strand 2Strand 3Strand 4
Strand 1 1.4 q1.3 q1.3 q 1.1 q1.45 q1.45 q
1.45 q1.275 q1.275 q 1.2 q1.4 q1.4 q
1.5 q1.25 q1.25 q 1.25 q1.3751.375
1.6 q1.2 q1.2 q
Strand 21.4 q 1.3 q1.3 q1.1 q 1.45 q1.45 q
1.45 q 1.275 q1.275 q1.2 q 1.4 q1.4 q
1.5 q 1.25 q1.25 q1.25 q 1.3751.375
1.6 q 1.2 q1.2 q
Table 6. Time average variance of outflow percentage of each strand with non-uniform increasing casting flow rate under single-strand blockage conditions of two tundish designs.
CaseDouble-Weir Tundishu-Shaped Weir Tundish
outlet flow rates1.4 q, 1.3 q,
1.3 q
1.45 q, 1.275 q,
1.275 q
1.5 q, 1.25 q,
1.25 q
1.6 q, 1.2 q,
1.2 q
1.2 q, 1.4 q,
1.4 q
1.1 q, 1.45 q,
1.45 q
1.25 q, 1.375 q,
1.375 q
Strand 1 blockage6.94 × 10−43.15 × 10−41.33 × 10−44.39 × 10−41.84 × 10−47.14 × 10−41.37 × 10−4
Strand 2 blockage7.00 × 10−43.08 × 10−41.05 × 10−42.91 × 10−41.69 × 10−45.93 × 10−41.87 × 10−4
Publisher’s Note: MDPI stays neutral with regard to jurisdictional claims in published maps and institutional affiliations.

