Article

Real-Time Quality Monitoring of Laser Cladding Process on Rail Steel by an Infrared Camera

by
Pornsak Srisungsitthisunti
1,*,
Boonrit Kaewprachum
1,
Zhigang Yang
2 and
Guhui Gao
3
1
Production and Robotics Engineering Department, Faculty of Engineering, King Mongkut’s University of Technology North Bangkok, Bangkok 10800, Thailand
2
Key Laboratory of Advanced Materials of Ministry of Education, School of Materials Science and Engineering, Tsinghua University, Beijing 100084, China
3
Material Science & Engineering Research Center, School of Mechanical, Electronic and Control Engineering, Beijing Jiaotong University, Beijing 100044, China
*
Author to whom correspondence should be addressed.
Metals 2022, 12(5), 825; https://doi.org/10.3390/met12050825
Submission received: 28 March 2022 / Revised: 8 May 2022 / Accepted: 9 May 2022 / Published: 11 May 2022
(This article belongs to the Special Issue High Performance Bainitic Steels)

Abstract

:
Laser cladding is considered to be a highly complex process to set up and control because it involves several parameters, such as laser power, laser scanning speed, powder flow rate, powder size, etc. It has been widely studied for metal-part coating and repair due to its advantage in controllable deposited materials on a small target substrate with low heat-affected distortion. In this experiment, laser cladding of U75V and U20Mn rail steels with Inconel 625 powder was captured by an infrared camera with image analysis software to monitor the laser cladding process in order to determine the quality of the cladded substrates. The cladding temperature, thermal gradient, spot profile, and cooling rate were determined from infrared imaging of the molten pool. The results showed that cladding temperature and molten pool’s spot closely related to the laser cladding process condition. Infrared imaging provided the cooling rate from a temperature gradient which was used to correctly predict the microhardness and microstructure of the HAZ region. This approach was able to effectively detect disturbance and identify geometry and microstructure of the cladded substrate.

1. Introduction

Improving material properties such as the wear and rolling contact fatigue of rail steel can result in longer rail usage, less damage, and less repair and the ability to support high-speed train and carry heavier loads. Heat treatment and coating technologies such as thermal spray and laser cladding can be utilized to increase the wear and rolling contact fatigue of rail steel [1,2,3,4]. As opposed to heat treatment, a coating process such as laser cladding can lower the overall rail manufacturing costs because it consumes less heat and can be completed quickly. Laser cladding provides a precise heat input, a narrow heat-affected zone, and little distortion, making it ideal for repairing damaged parts and improving the mechanical properties of rail components.
Laser cladding is an additive manufacturing process that can be used to apply a small material coating on a target substrate [5,6,7,8,9,10]. There are two types of laser cladding, wire cladding and powder cladding. Laser cladding with powder material is more versatile, as it deposits a thin layer of fine powder on top of the substrate by using focused heat from a laser. This process is extremely complex because it involves multiphysics of material, laser, optic, powder, gas flow, etc. Therefore, controlling such a process can be sensitive and challenging to achieve consistent quality. Laser cladding for rail steels has been studied for many powder and substrate material systems, including bainite; hyper-eutectoid rail; CL60, U71Mn, R400HT, HE400, R260, and R200 rail steels; and Fe-based, Ni-based, Co-based powder materials [6]. The laser-cladding process can improve rail wear and rolling contact fatigue (RCF) significantly by using Stellite 12 on R260 grade rail material [7] and reduce surface damage on wheel/rail rollers [8]. Laser cladding improved wear by depositing a layer of martensitic stainless steel on the substrate, but the difference in their thermal expansion coefficients creates a residual stress field on the clad and substrate [9].
During laser material processing, the laser beam interacts with the material being processed. When the laser beam hits the material surface, it is absorbed, reflected, refracted, scattered, or transmitted. These interactions result in heating, melting, vaporization, or plasma formation. In laser-cladding processes, one or more of the mentioned phenomena may occur during the process, resulting in characteristics of the molten pool, keyhole, plume, spatters, and radiation signal that can be used for monitoring [10,11]. The temperature and the size of the molten pool are two key parameters in the fabrication process that affect the performance of the welding process. It can be found that the higher temperature increases with the size of the molten pool, which has an effect on the heat-affected zone (HAZ). Rapid heating and cooling of laser welding and laser cladding strongly affect the mechanical properties of the welded region, such as unexpected microstructure, hardness, and residual stress [10,11].
Several monitoring systems for laser welding have been developed, including optical radiation detection, visual detection, paraxial sound and temperature detection, and plasma charge detection. An infrared camera can access radiation in infrared wavelengths (1150–1800 nm) due to the temperature of the radiated object, which can be used to determine the temperature of a molten pool [11]. An infrared image of the molten pool can be analyzed for real-time analysis of the welding temperature and the laser-welding pool’s size [11]. Analyzing the laser welding’s molten pool morphology by using a high-speed camera was shown to correctly predict the weld’s macrostructure [12]. Coaxial monitoring of laser welding has been studied by using the Canny edge detection operator [13]. For high-power lasers, a high-speed infrared video camera with a homomorphic filtering algorithm is used to accurately extract the weld pool’s width [14]. Machine learning algorithms were also employed for high-speed images of the weld zone during laser welding [15]. On the other hand, real-time monitoring of laser cladding has not been widely studied [16]. Monitoring of thermo-cycles during the laser cladding process, using a pyrometer, was implemented [17].
The microstructure and microhardness of the cladded layer are critical considerations when choosing a coating material and coating process for surface improvement of rail steel. When hardened by flame and induction, the hardness increased abruptly to 800–900 HV, causing boundary cracking [18]. Inconel 625 is a nickel-based superalloy with high tensile strength and heat resistance that is frequently used in coating applications. In addition, the Inconel alloying layer provides excellent corrosion and oxidation resistance. Laser cladding using Incornel 625 powder resulted in a microhardness of around 250 HV, which was similar to that of rail steel (400 HV). As a result, laser cladding was more preferable for repair and wear improvement of rail steels [19,20].
In this paper, we developed a non-contact monitoring system with an infrared camera and an image processing technique for laser cladding. By using a combination of temperature, size, and profile of the infrared hot spot, the molten pool was comprehensively analyzed for cladding temperature, thermal gradient, clad geometries, and cooling rate. The influence of processing parameters on the morphology of the molten pool was discussed. The relationship between the molten pool’s temperature profile and geometrical features, microstructure, and microhardness was established. This process monitoring approach can be applied to other rail materials, as well.

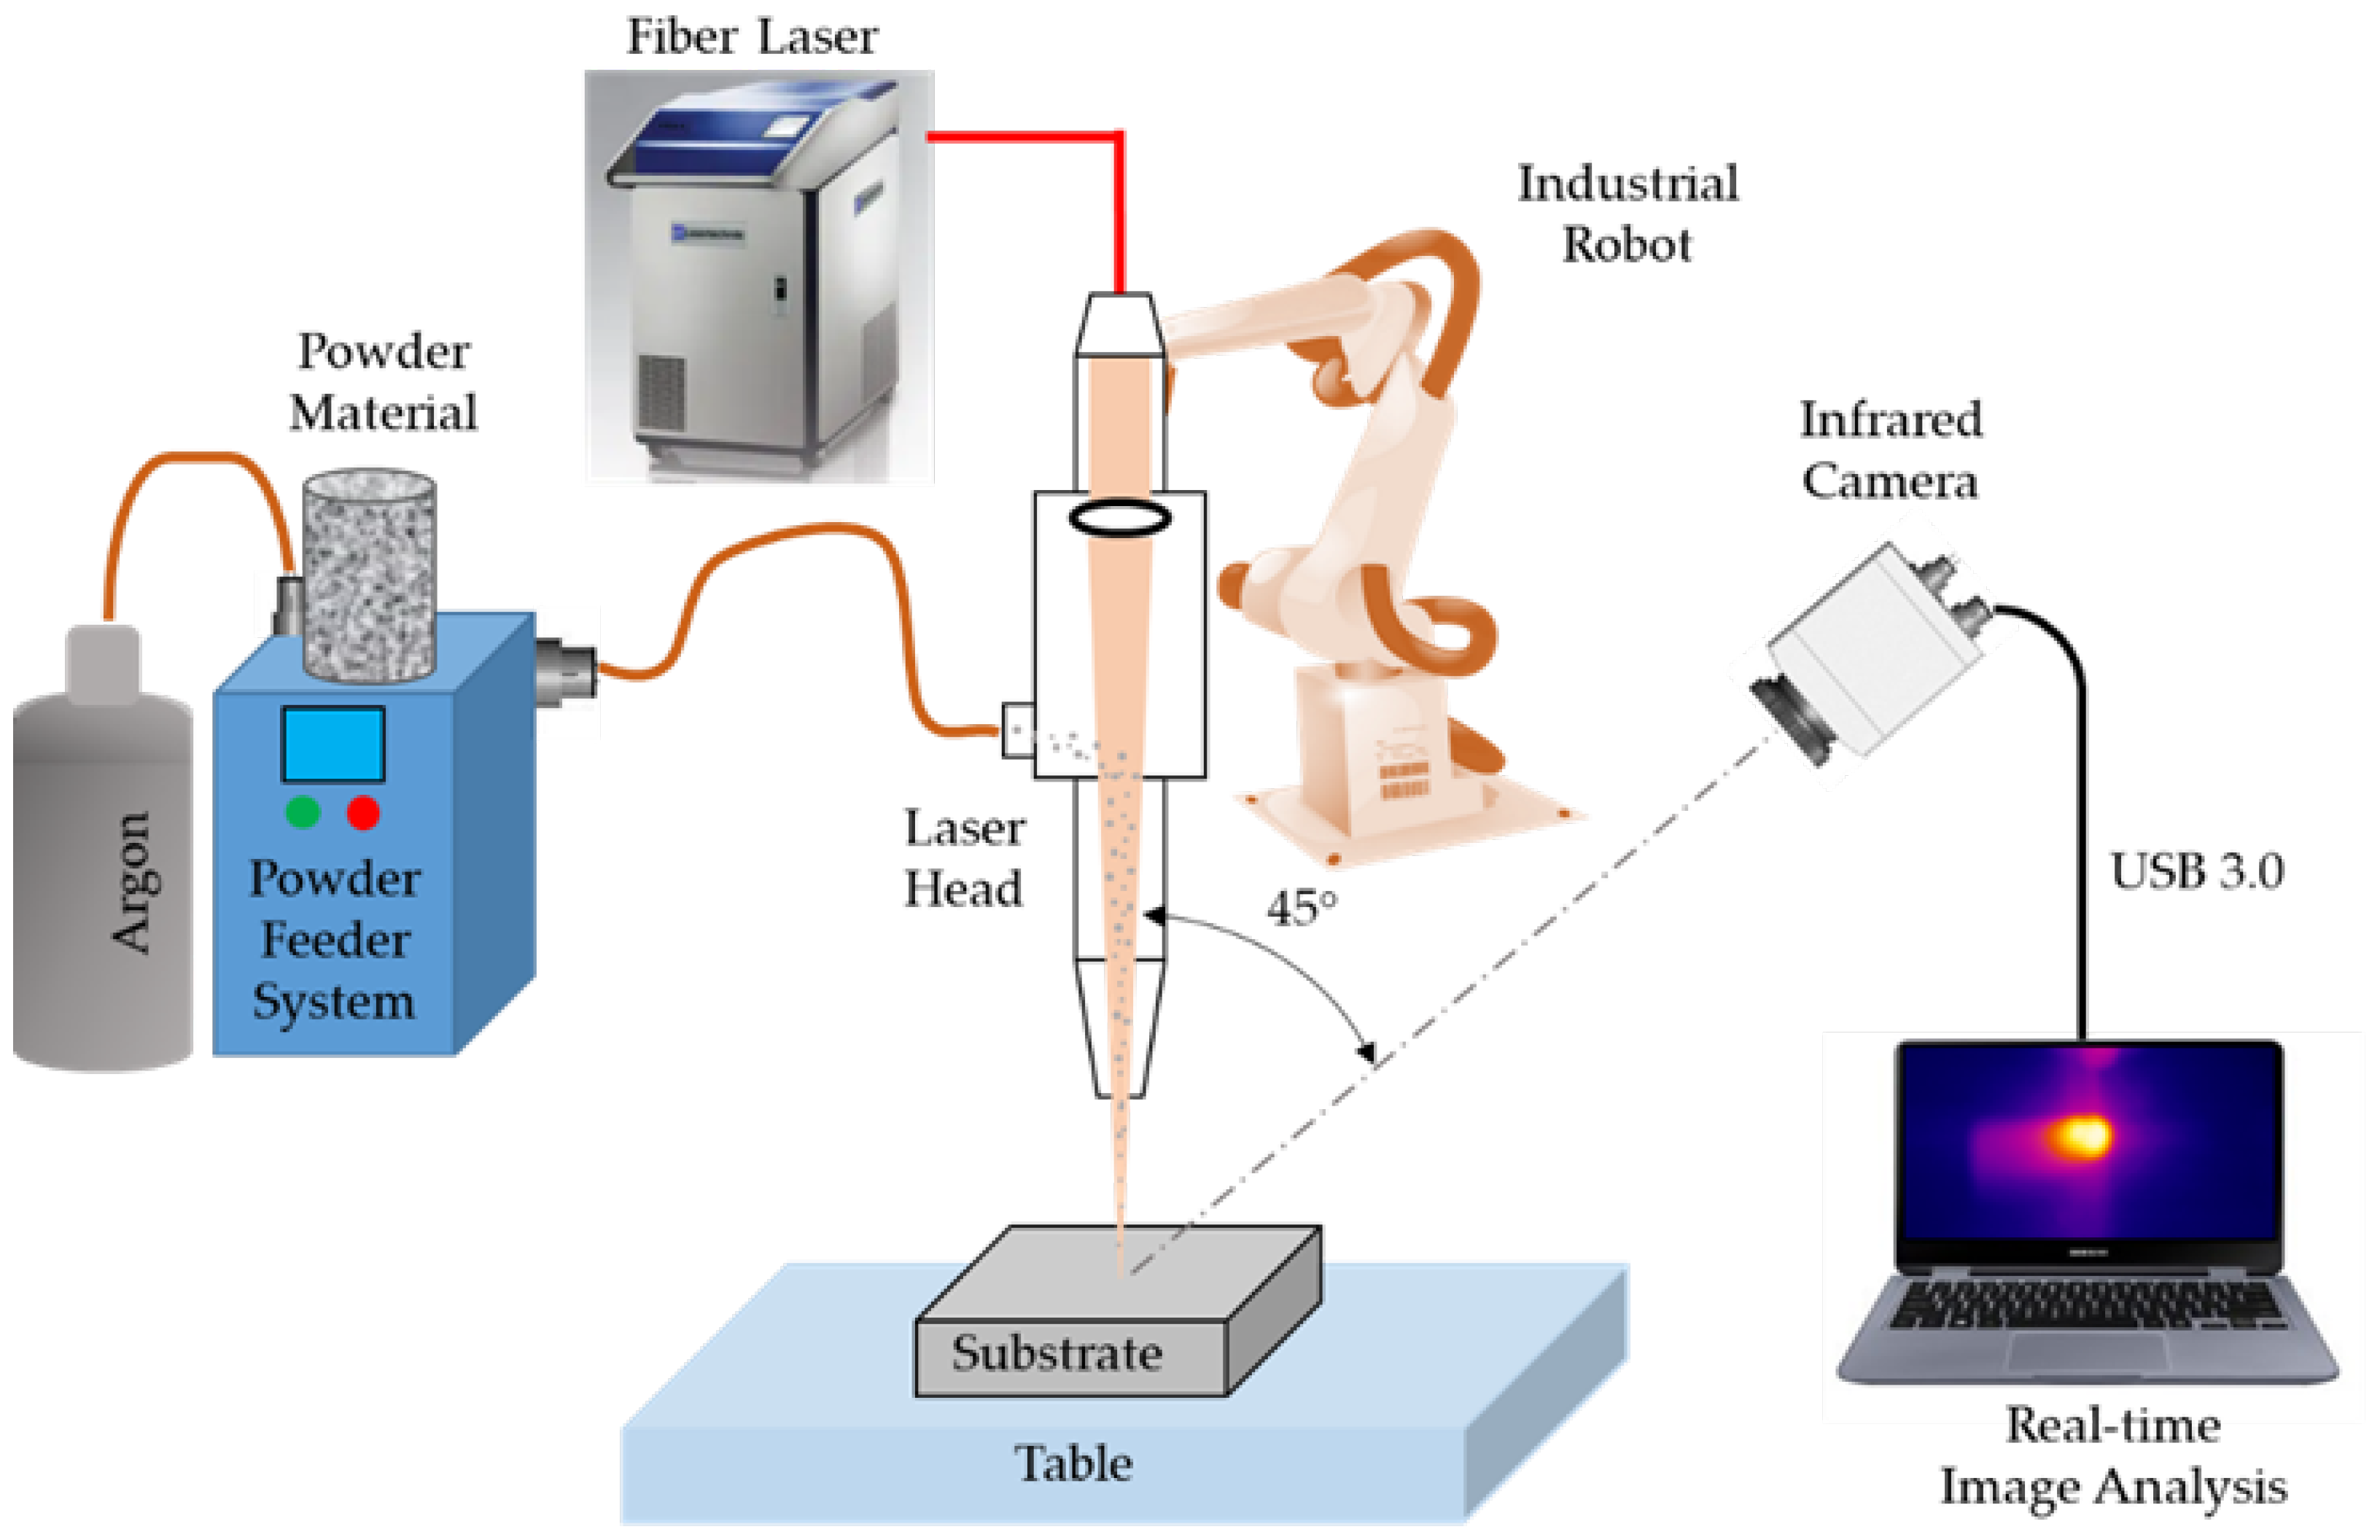
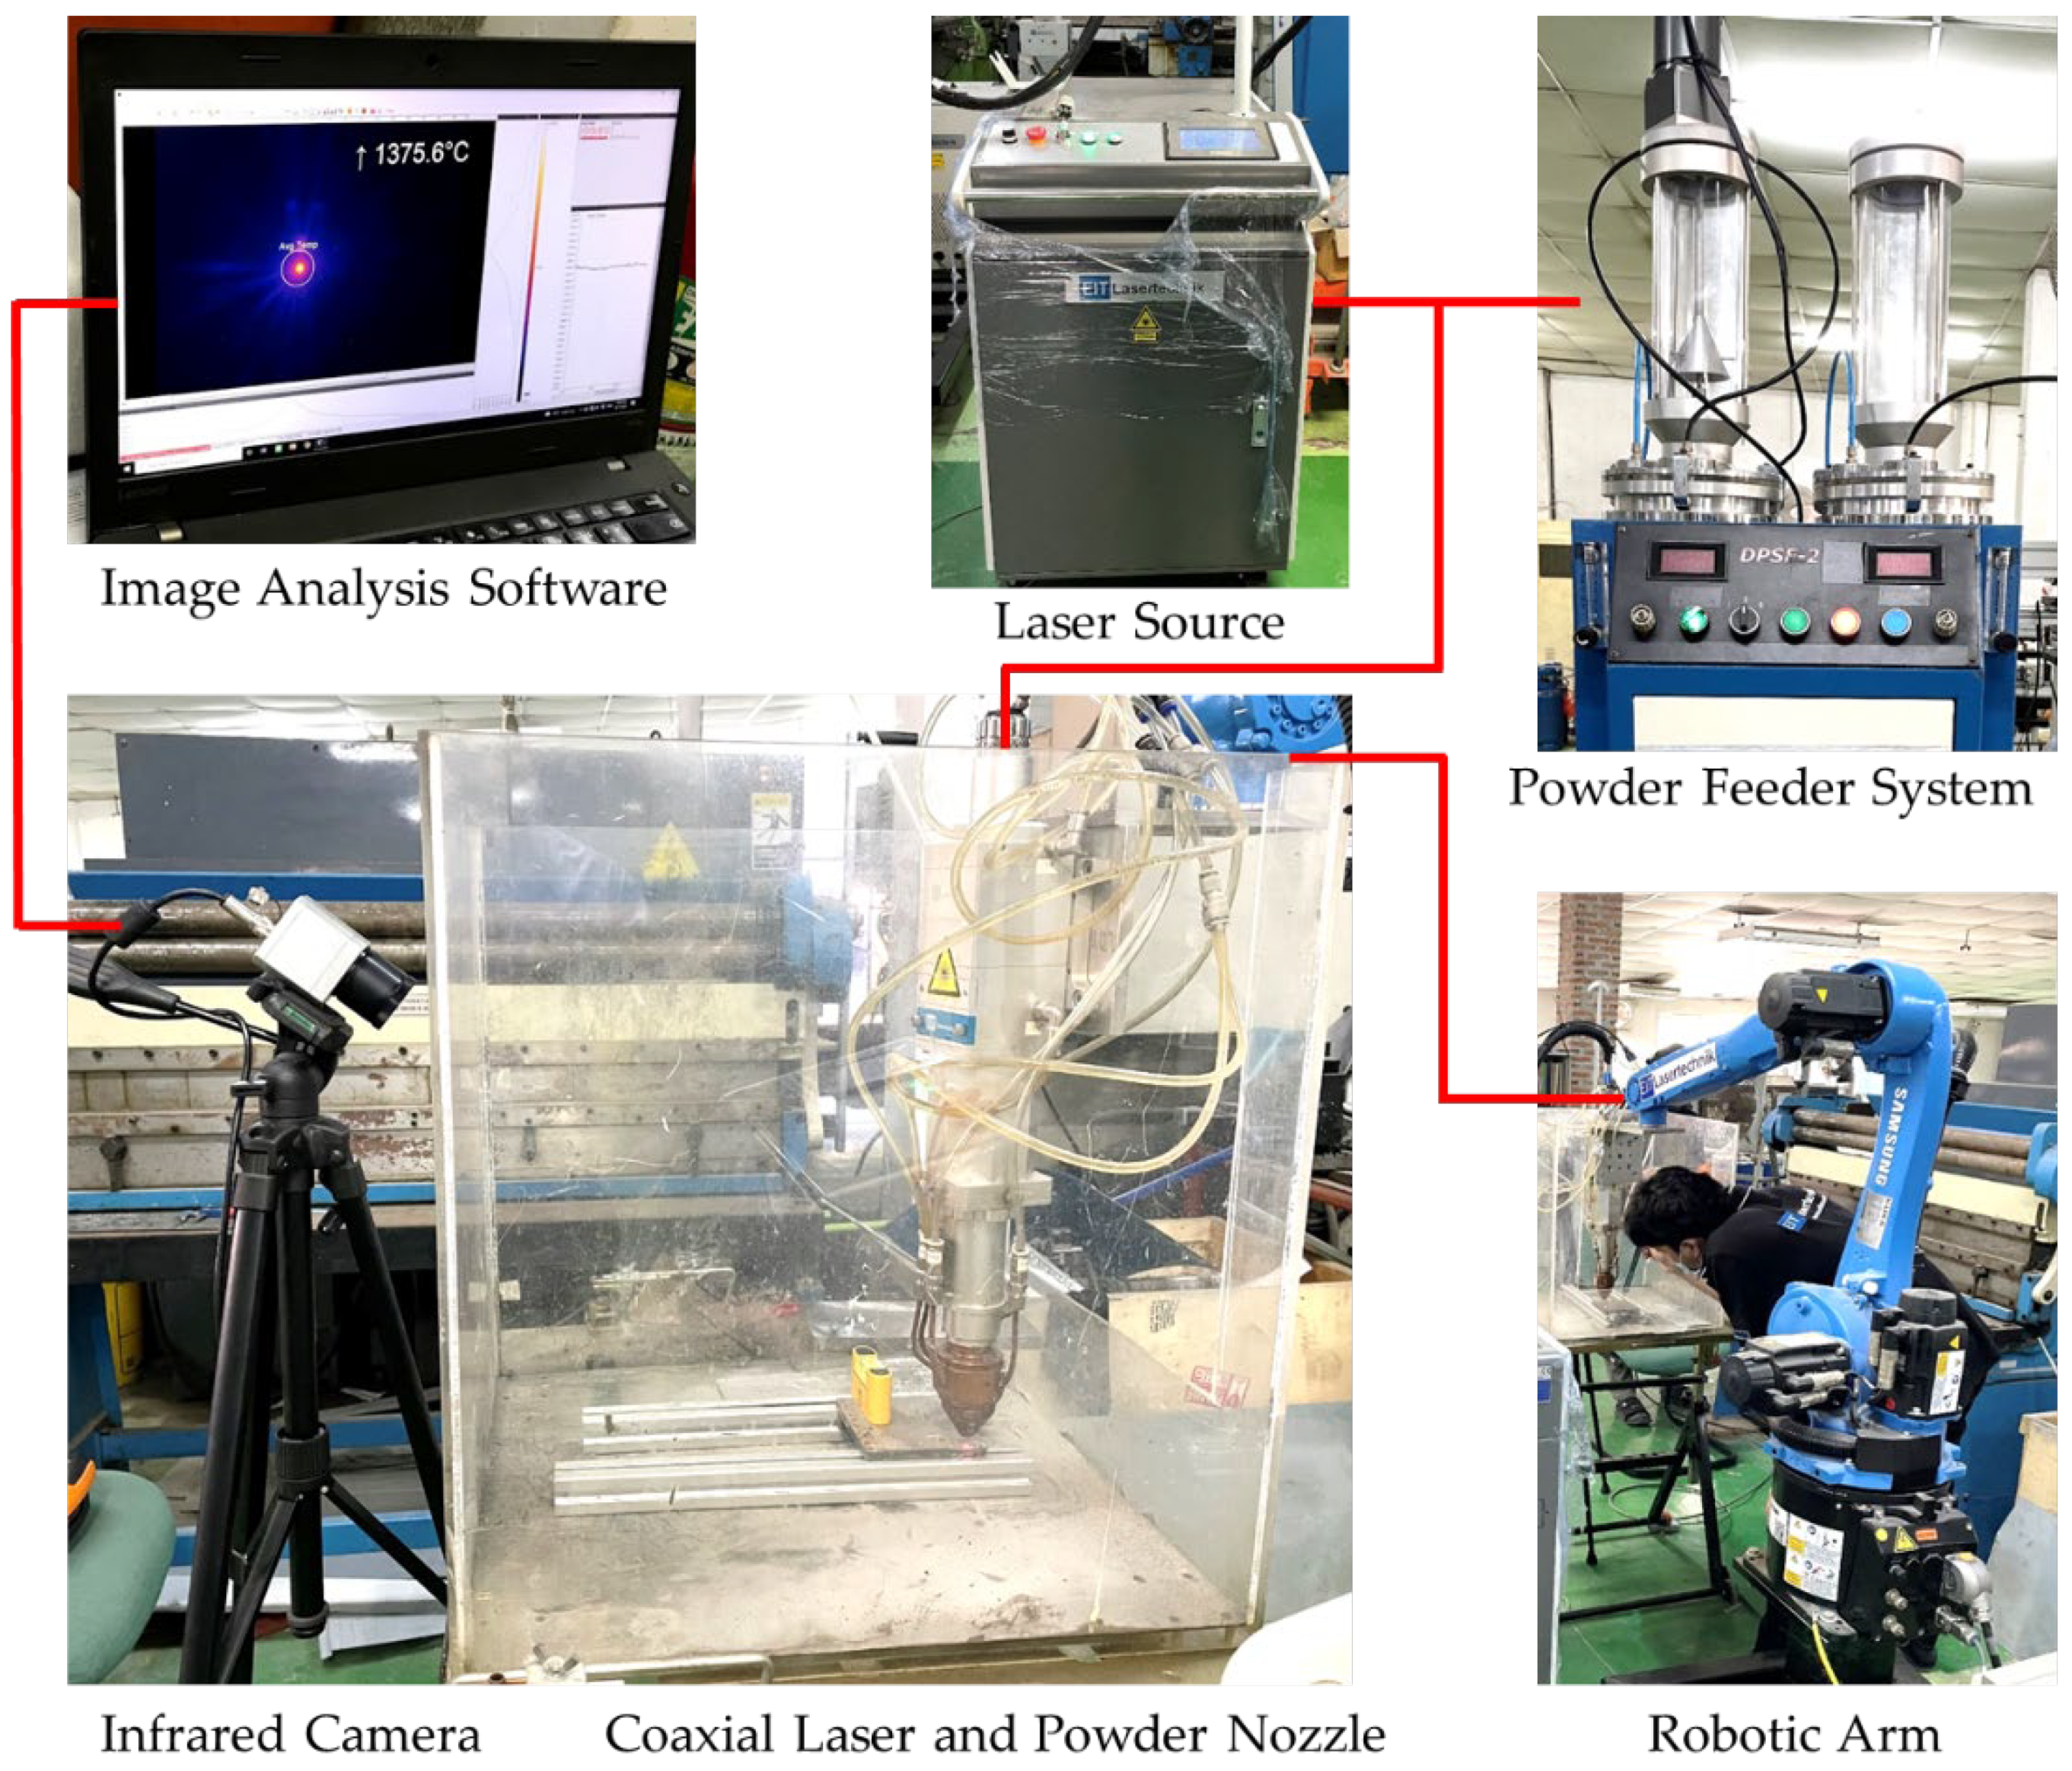
2. Materials and Methods

U75V is one of the most widely used rail steels in China. This rail steel has a chemical composition of Fe-0.71C-0.7Mn-0.6Si-0.04V. The heat treatments of U75V steel include hot-rolling at a final rolling temperature of 950 °C, followed by air-cooling to 800 °C, fast cooling (at the rate of 4 °C/s) to 600 °C, and then air-cooling to room temperature. U75V steel has a pearlitic structure after heat treatment. Its liquidus and solidus temperatures are 1478 and 1353 °C, respectively [21]. In addition, U20Mn (Fe-0.2C-2.25Mn-0.9Si-0.6Cr-0.6Ni-0.4Mo) rail steel with a granular bainitic structure and a martensitic/austenitic isolated structure was also used in the experiment.
The laser-cladding experiment used Inconel 625 (Ni-20.3Cr-10.6Mo-3.8Nb-1.3Fe-0.3Si-0.1Mn) alloy powder material to repair and improve the surface characteristics of the substrates. Its liquidus and solidus temperatures are 1350 and 1290 °C, respectively [22]. For this experiment, Inconel 625 powder with a particle distribution of 15–53 μm was chosen for laser cladding on a rail steel substrate.
Figure 1 depicts a schematic diagram of the online monitoring of laser cladding experiment. The rail substrates with dimensions of 30 mm × 30 mm × 8 mm thick were placed inside an enclosure box underneath a laser head. The laser system was an ytterbium laser system (YLS) with a 1500 W maximum power operating at a wavelength of 1035 nm. The laser beam was delivered to the laser head equipped with powder feeder nozzles. The powder feeder system with two mixing chambers carried powder material by shielding gas (argon) to the nozzle and splitting into four powder feeder tubes for better powder distribution on the target.
The powder particles were fed into the coaxial nozzles and directed to the melt-pool by a flow of argon, while the focused laser beam passed through the central focusing lens to the substrate. The laser focusing distance was 15 mm, with a laser spot of 2 mm in diameter. The laser head, which combined the laser beam and the powder feeder nozzle, was connected to an industrial robotic arm. Using a 6-axis robotic arm allowed laser cladding to be deposited on a complex-shaped substrate with high precision and repeatability.
The laser-cladding process parameters are given in Table 1. The laser powers were 500, 800, and 1000 W, and the laser scanning speeds were 3 and 6 mm/s. All process conditions were tested with four layers of cladding. In our experiment, the laser-cladding head was positioned at a defocus distance of +15 mm above the substrate. Inconel 625 powder was carried by argon gas at a constant feed rate of 15 g/min. The laser beam incident angle was set at 10 degrees to avoid radiation reflection to the fiber laser. The infrared camera (Optris PI 1M) was positioned sideways to the scanning direction at 550 mm from the substrate (outside the protective box), at a viewing angle of 45 degrees. The camera was viewed from the side view of the laser scanning direction to keep the same distance from the molten pool. The camera’s sensor was capable of capturing temperatures ranging from 450 to 1800 °C at a frame rate of 30 images/s. Figure 2 shows the actual laser-cladding equipment.
The real-time monitoring system started simultaneously with the laser-cladding operation. The infrared camera captured images and sent data to a computer via USB cable. Infrared thermography during laser cladding included molten pools, plasma, splatters, and laser reflection, as shown in Figure 3. By filtering out noises from splatters and other disturbances, the process conditions of the laser cladding can be directly assessed from the appearance of the cladding laser spot (hot spot). The temperature estimations were based on the material’s emissivity properties in order to convert the incoming radiation intensity to an absolute temperature value. Our image-analysis software determined the molten-pool temperature by averaging the temperature over a selection area around the hot spot found in each image, as shown in Figure 3. The selection area was always centered on the maximum temperature point in the picture. Noises and disturbances outside this area were excluded. Therefore, the molten pool’s temperature was calculated by averaging the temperature of the infrared image over the selected area. We have applied this method to reduce temperature fluctuation and provide an accurate estimation of molten pool temperature in our previous work on process monitoring of laser welding of steel sheets [11].
Additional image analysis steps were carried out by using LabVIEW programming, as shown in Figure 4. The original IR images were segmented to separate the hot region above a specific temperature from the lower temperature. The region of interest in the hot spot represented the size of the molten pool from laser cladding. Then the program processed the image as binary and used a measurement tool to determine the width, length, and area of the region of interest. The LabVIEW possessing time for all steps was only 37 milliseconds for each image. As a result, by employing an infrared camera and image analysis, the real-time monitoring of the molten pool during the laser cladding process was accomplished.

3. Results

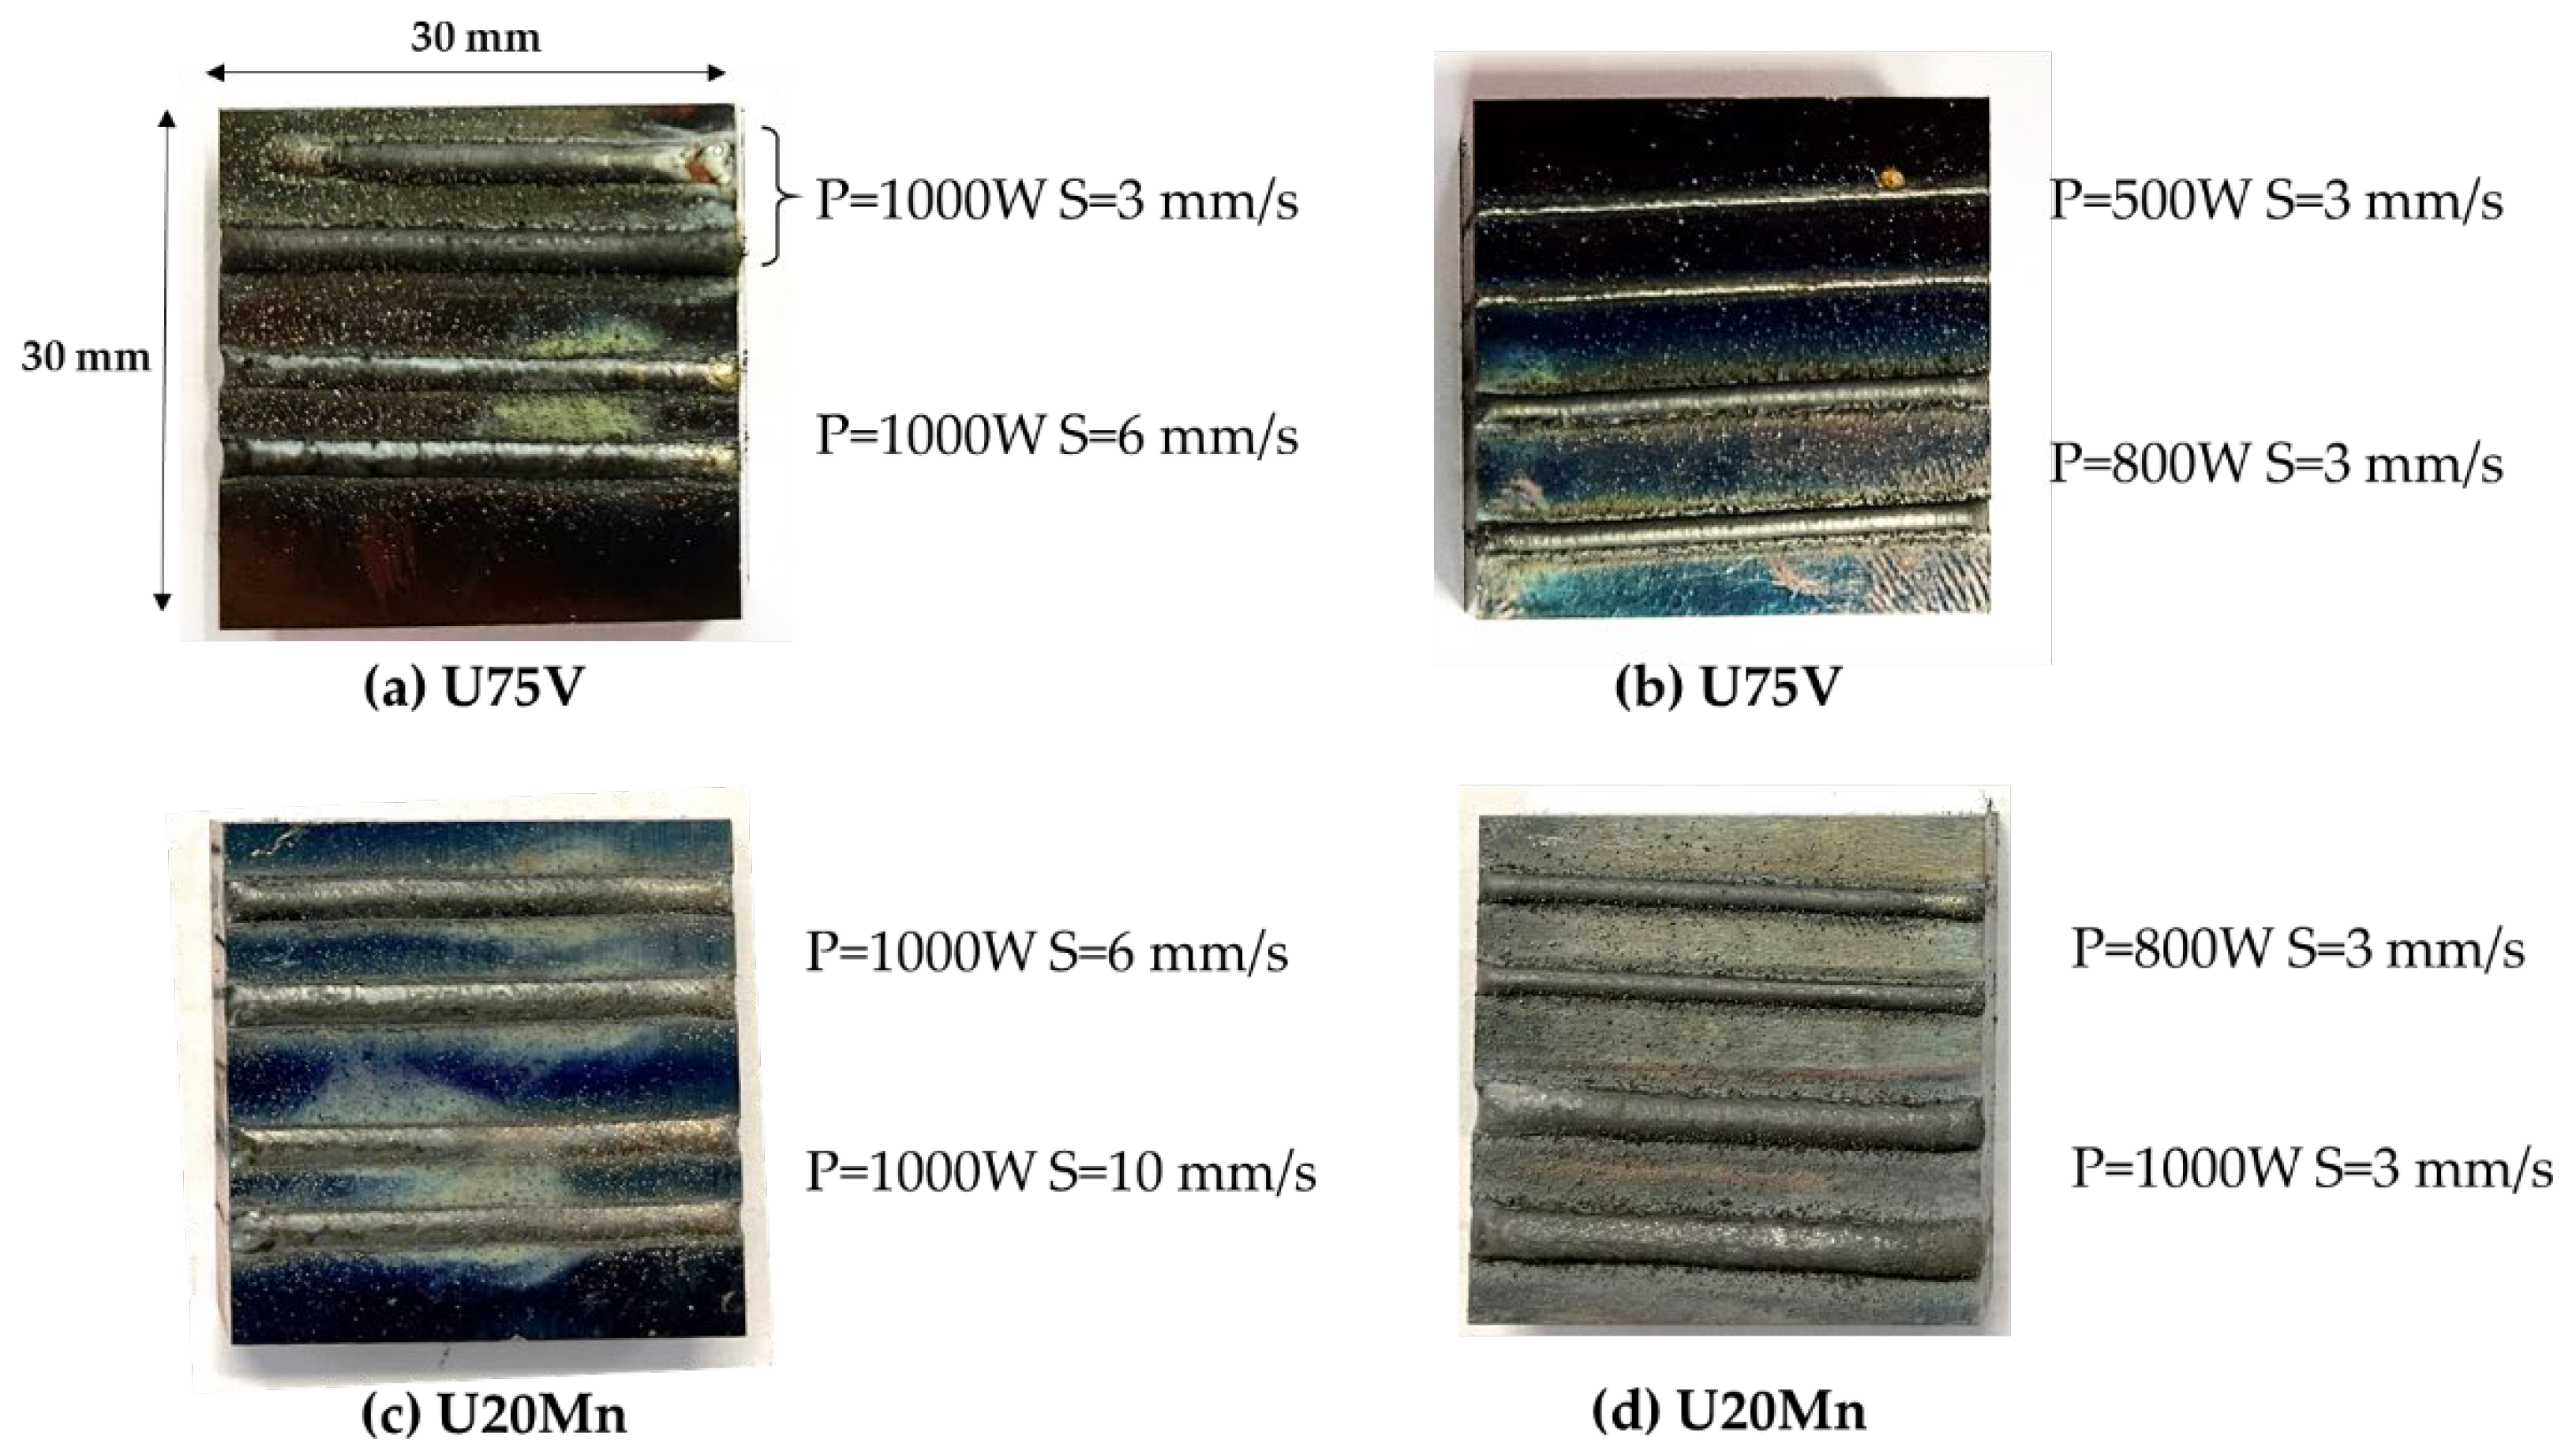
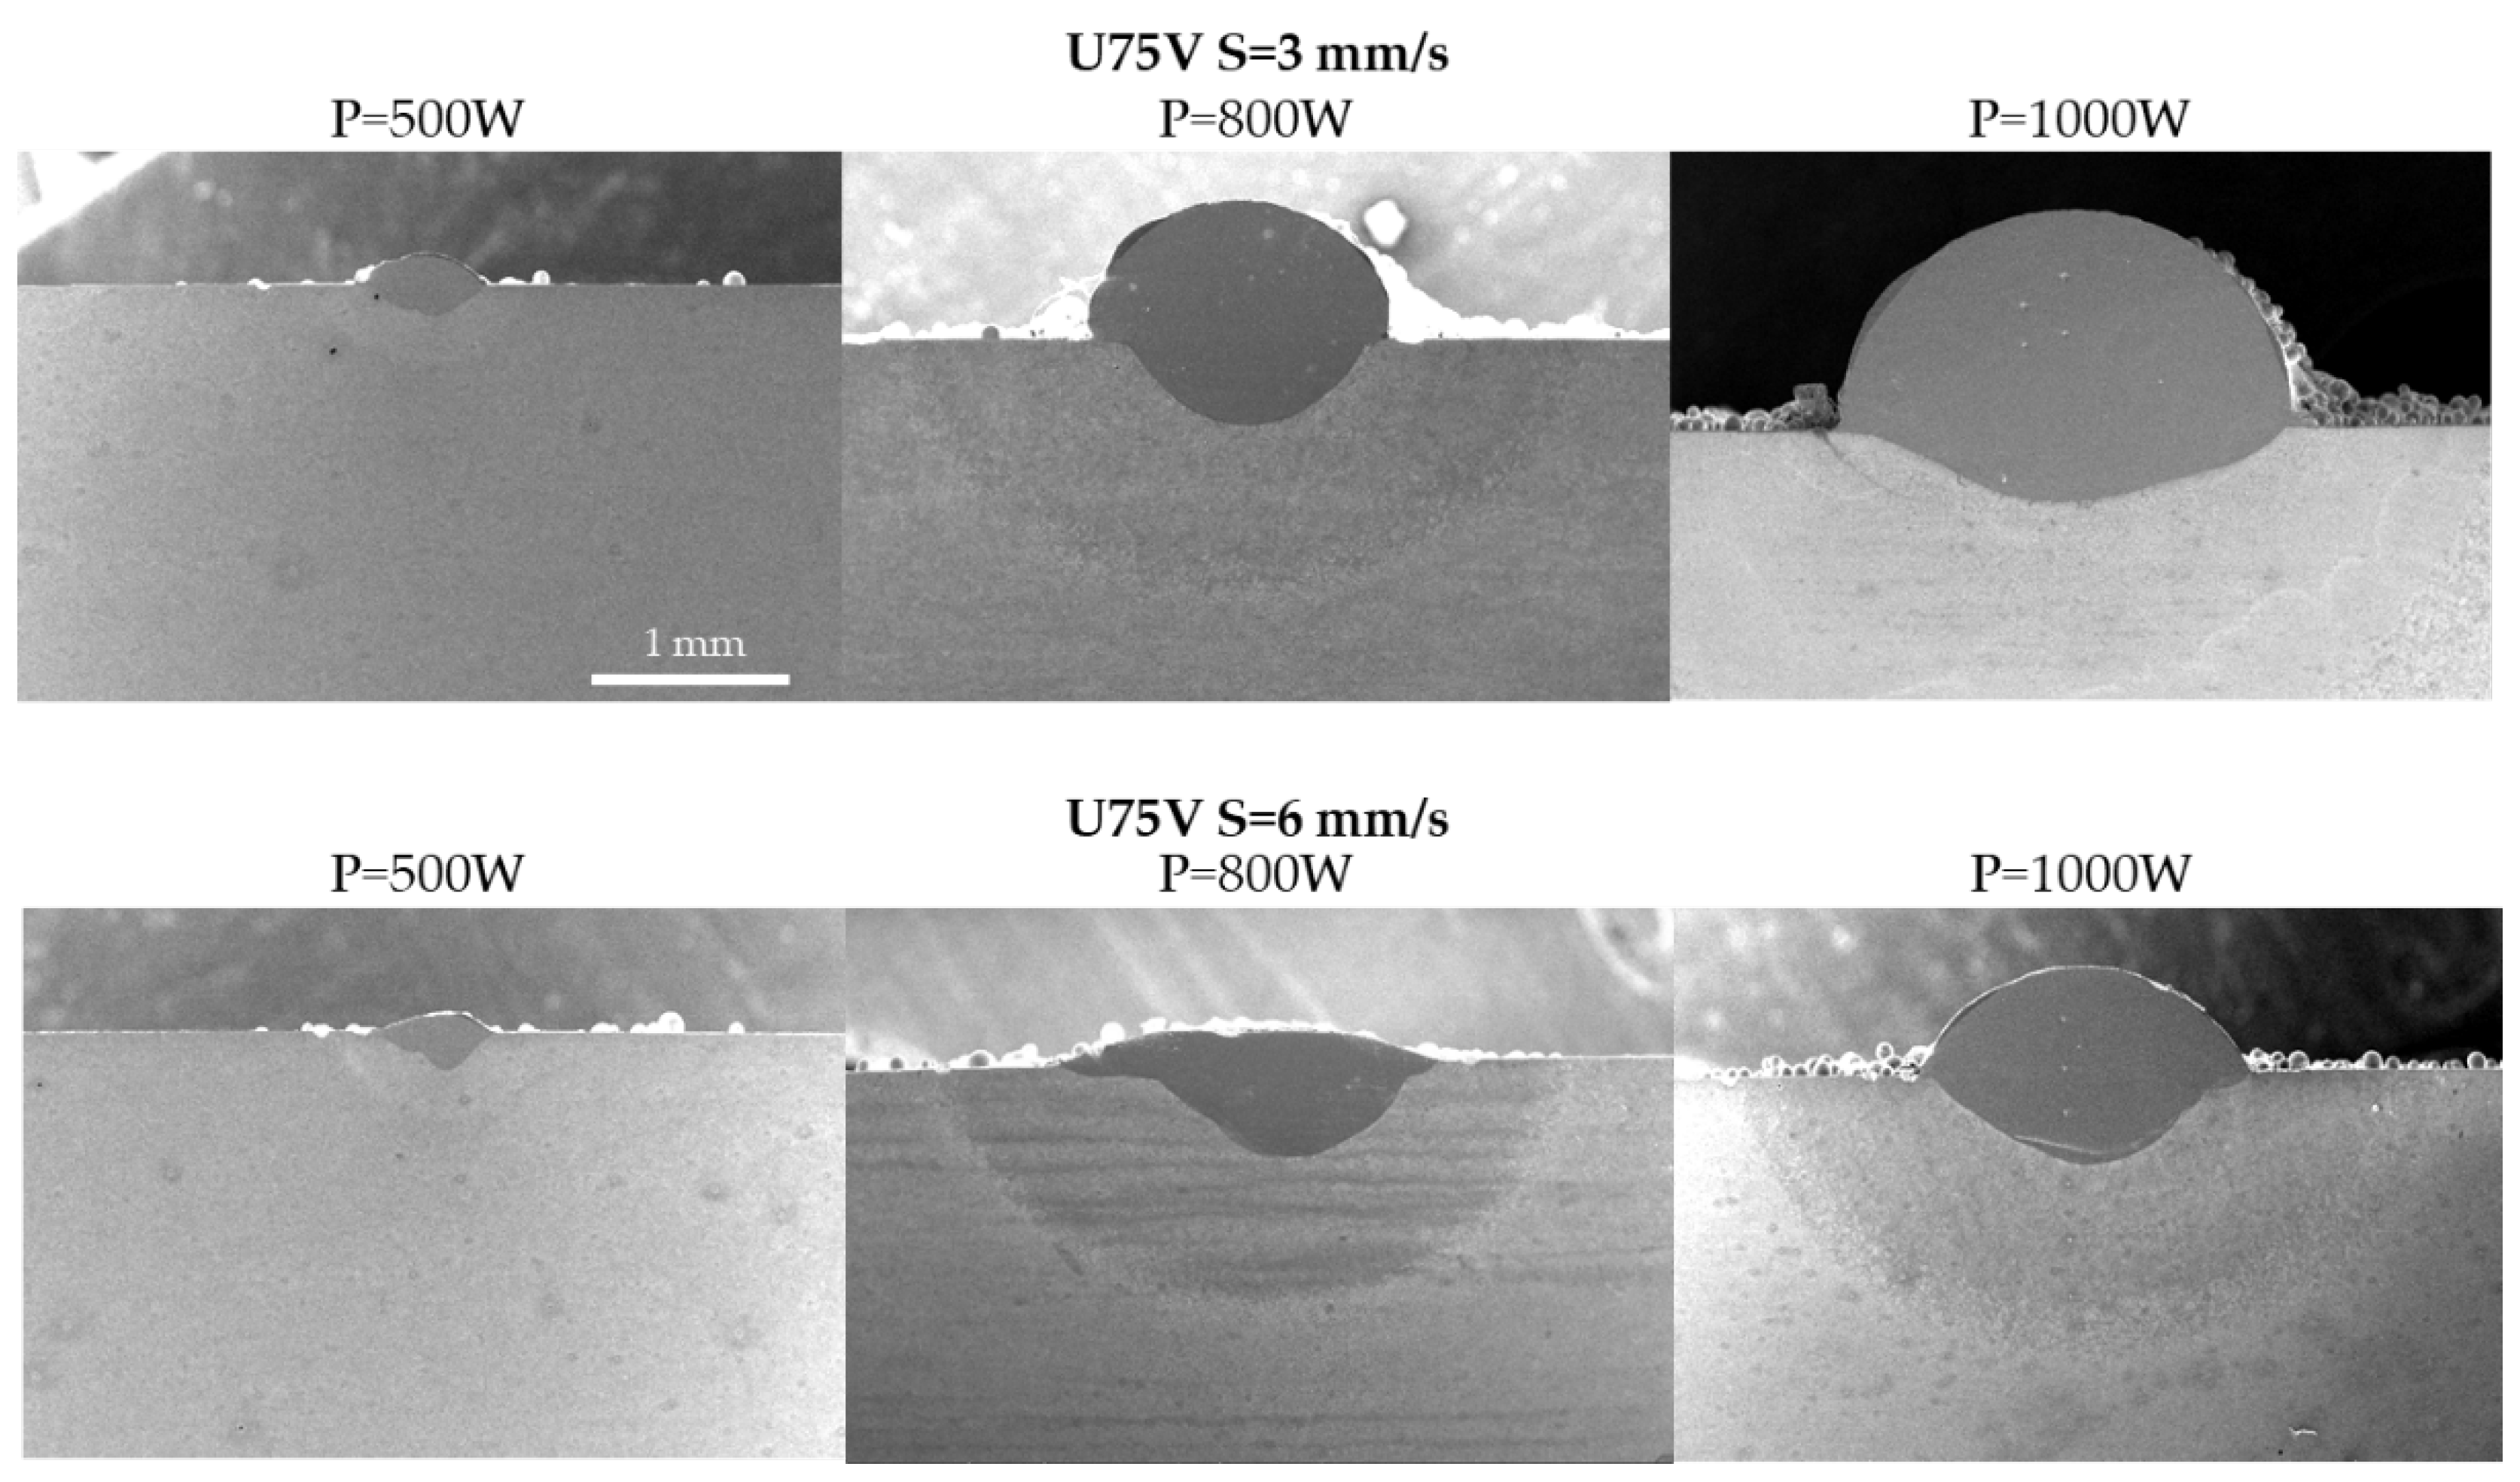
3.1. Geometry of Cladded Layer

For a parametric study of laser cladding on rail steel, Inconel 625 powders were cladded along the length of the substrate by starting the laser head from left to right and returning to the left side repeatedly. The powder was fed coaxially and then melted, using a laser beam, and the melt pool was quickly cooled to form a cladding layer. A total of four layers of Inconel 625 powder were deposited by laser cladding on U75V substrates across the width of the substrate (30 mm).
The results showed that the laser power from 500 to 1000 W and laser cladding speed from 3 to 6 mm/s provided continuous cladded lines, as shown in Figure 5. For all cases, the laser cladded four times (four layers) on the substrates. Figure 5a,c shows the effect of the scanning speed, and Figure 5b,d shows the effect of the laser power. Every condition was tested twice, and the clad lines seemed to be consistent. The powder feed rate was set to 15 g/min to ensure that sufficient powder reached the substrate. The geometrical features of a four-layer clad line for various cladding conditions are summarized in Table 2.
Figure 6 shows SEM images from the cross-section of cladded rail steel under various conditions. In all cases, the cladded material adhered well to the substrate. There was no cracking or void in the interfacing layer. The higher the laser power, the larger the cladded size, while the scanning speed had more of an effect on the clad height and penetration depth.

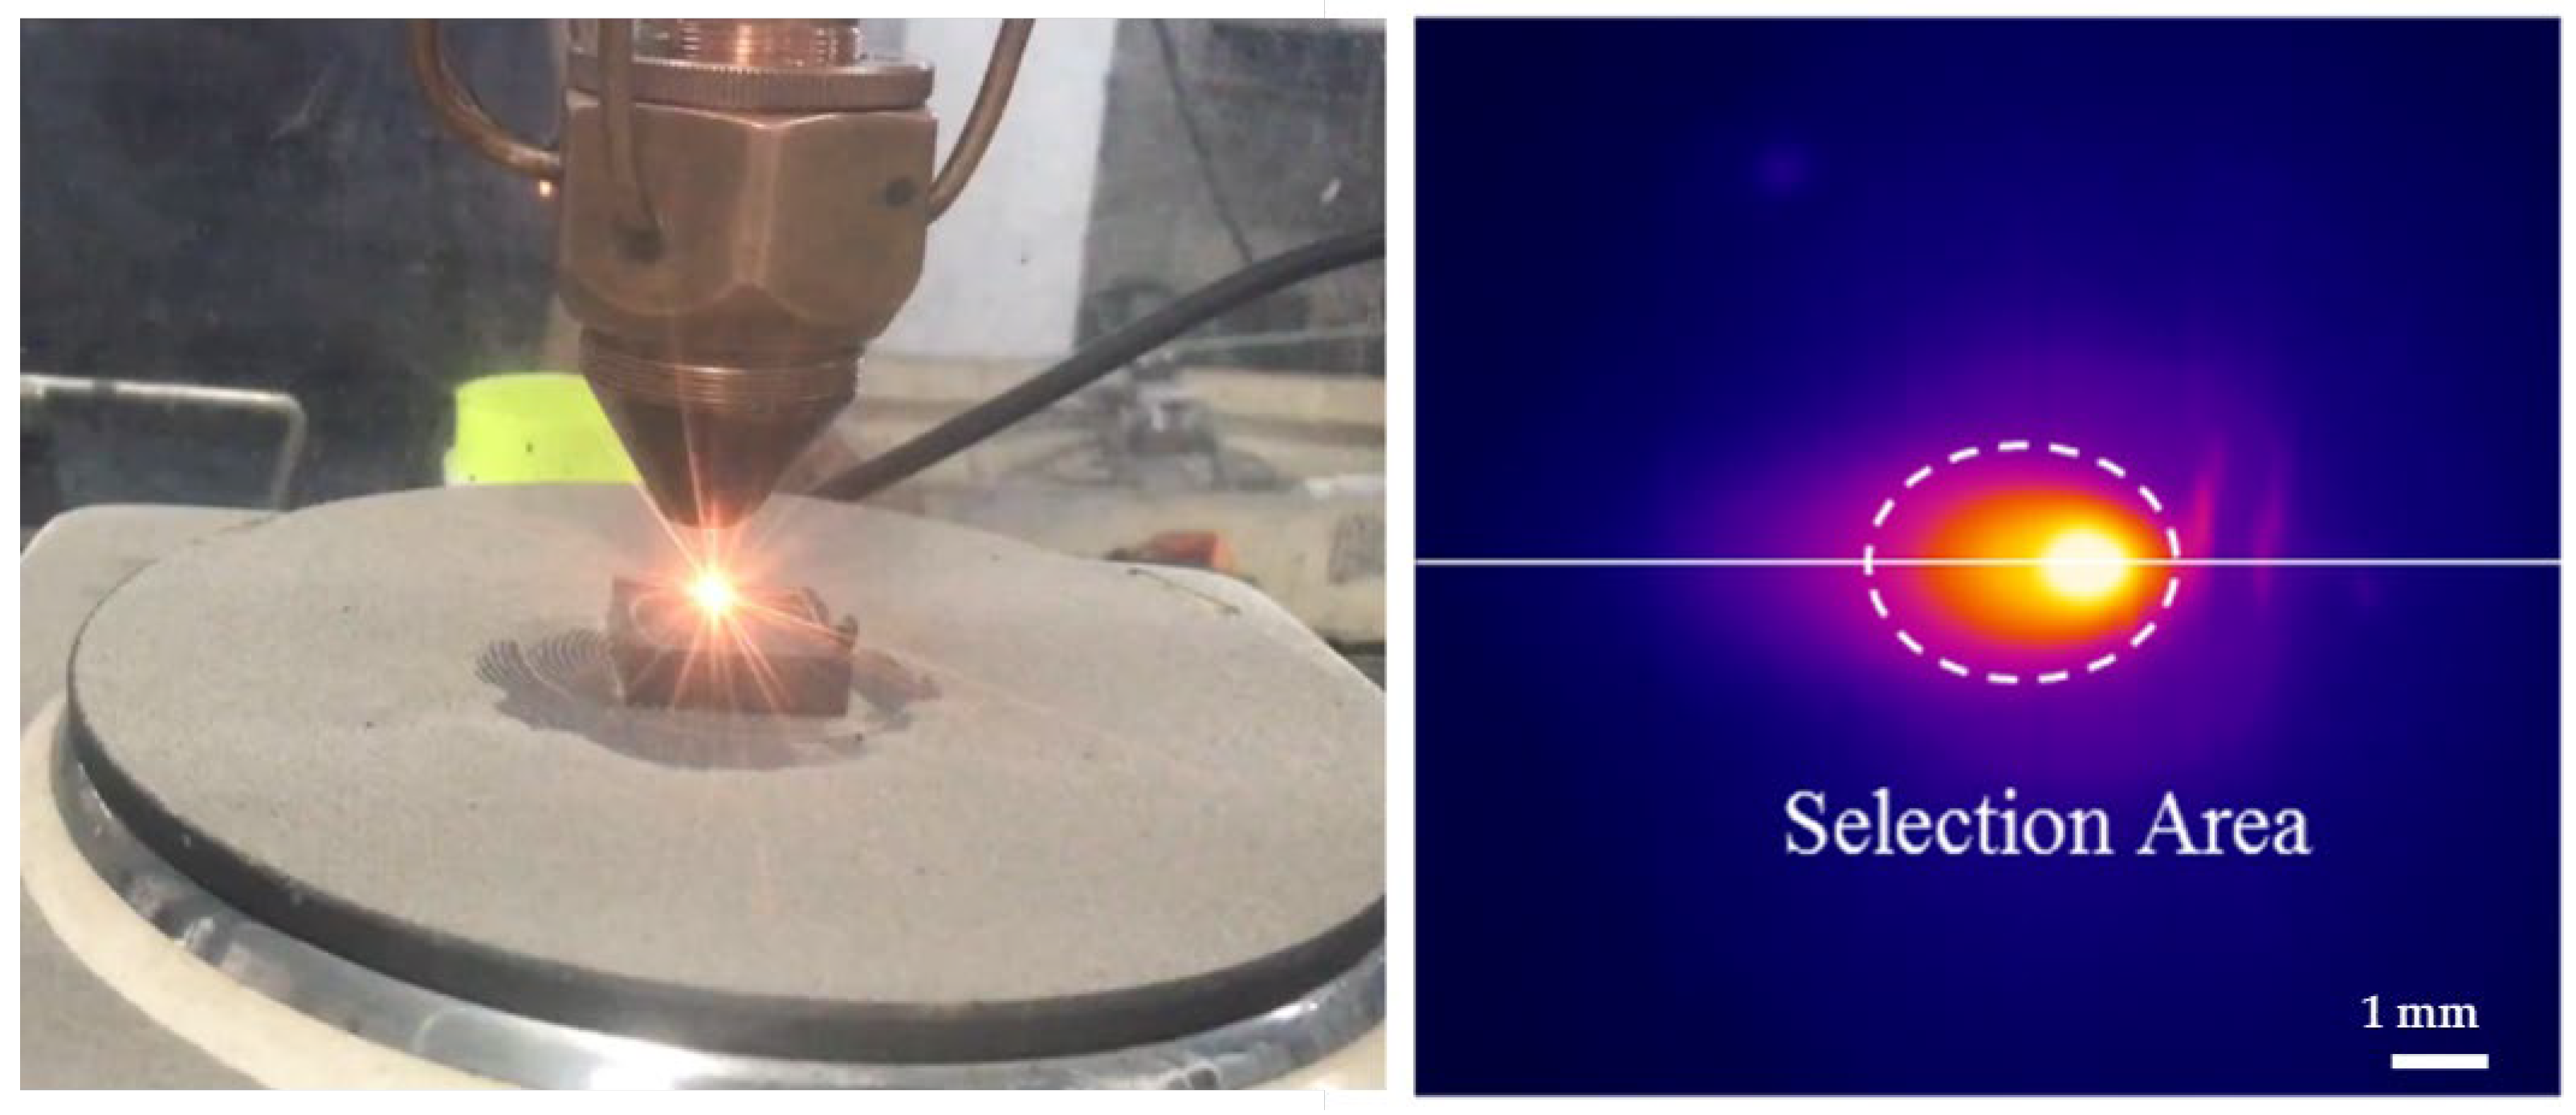
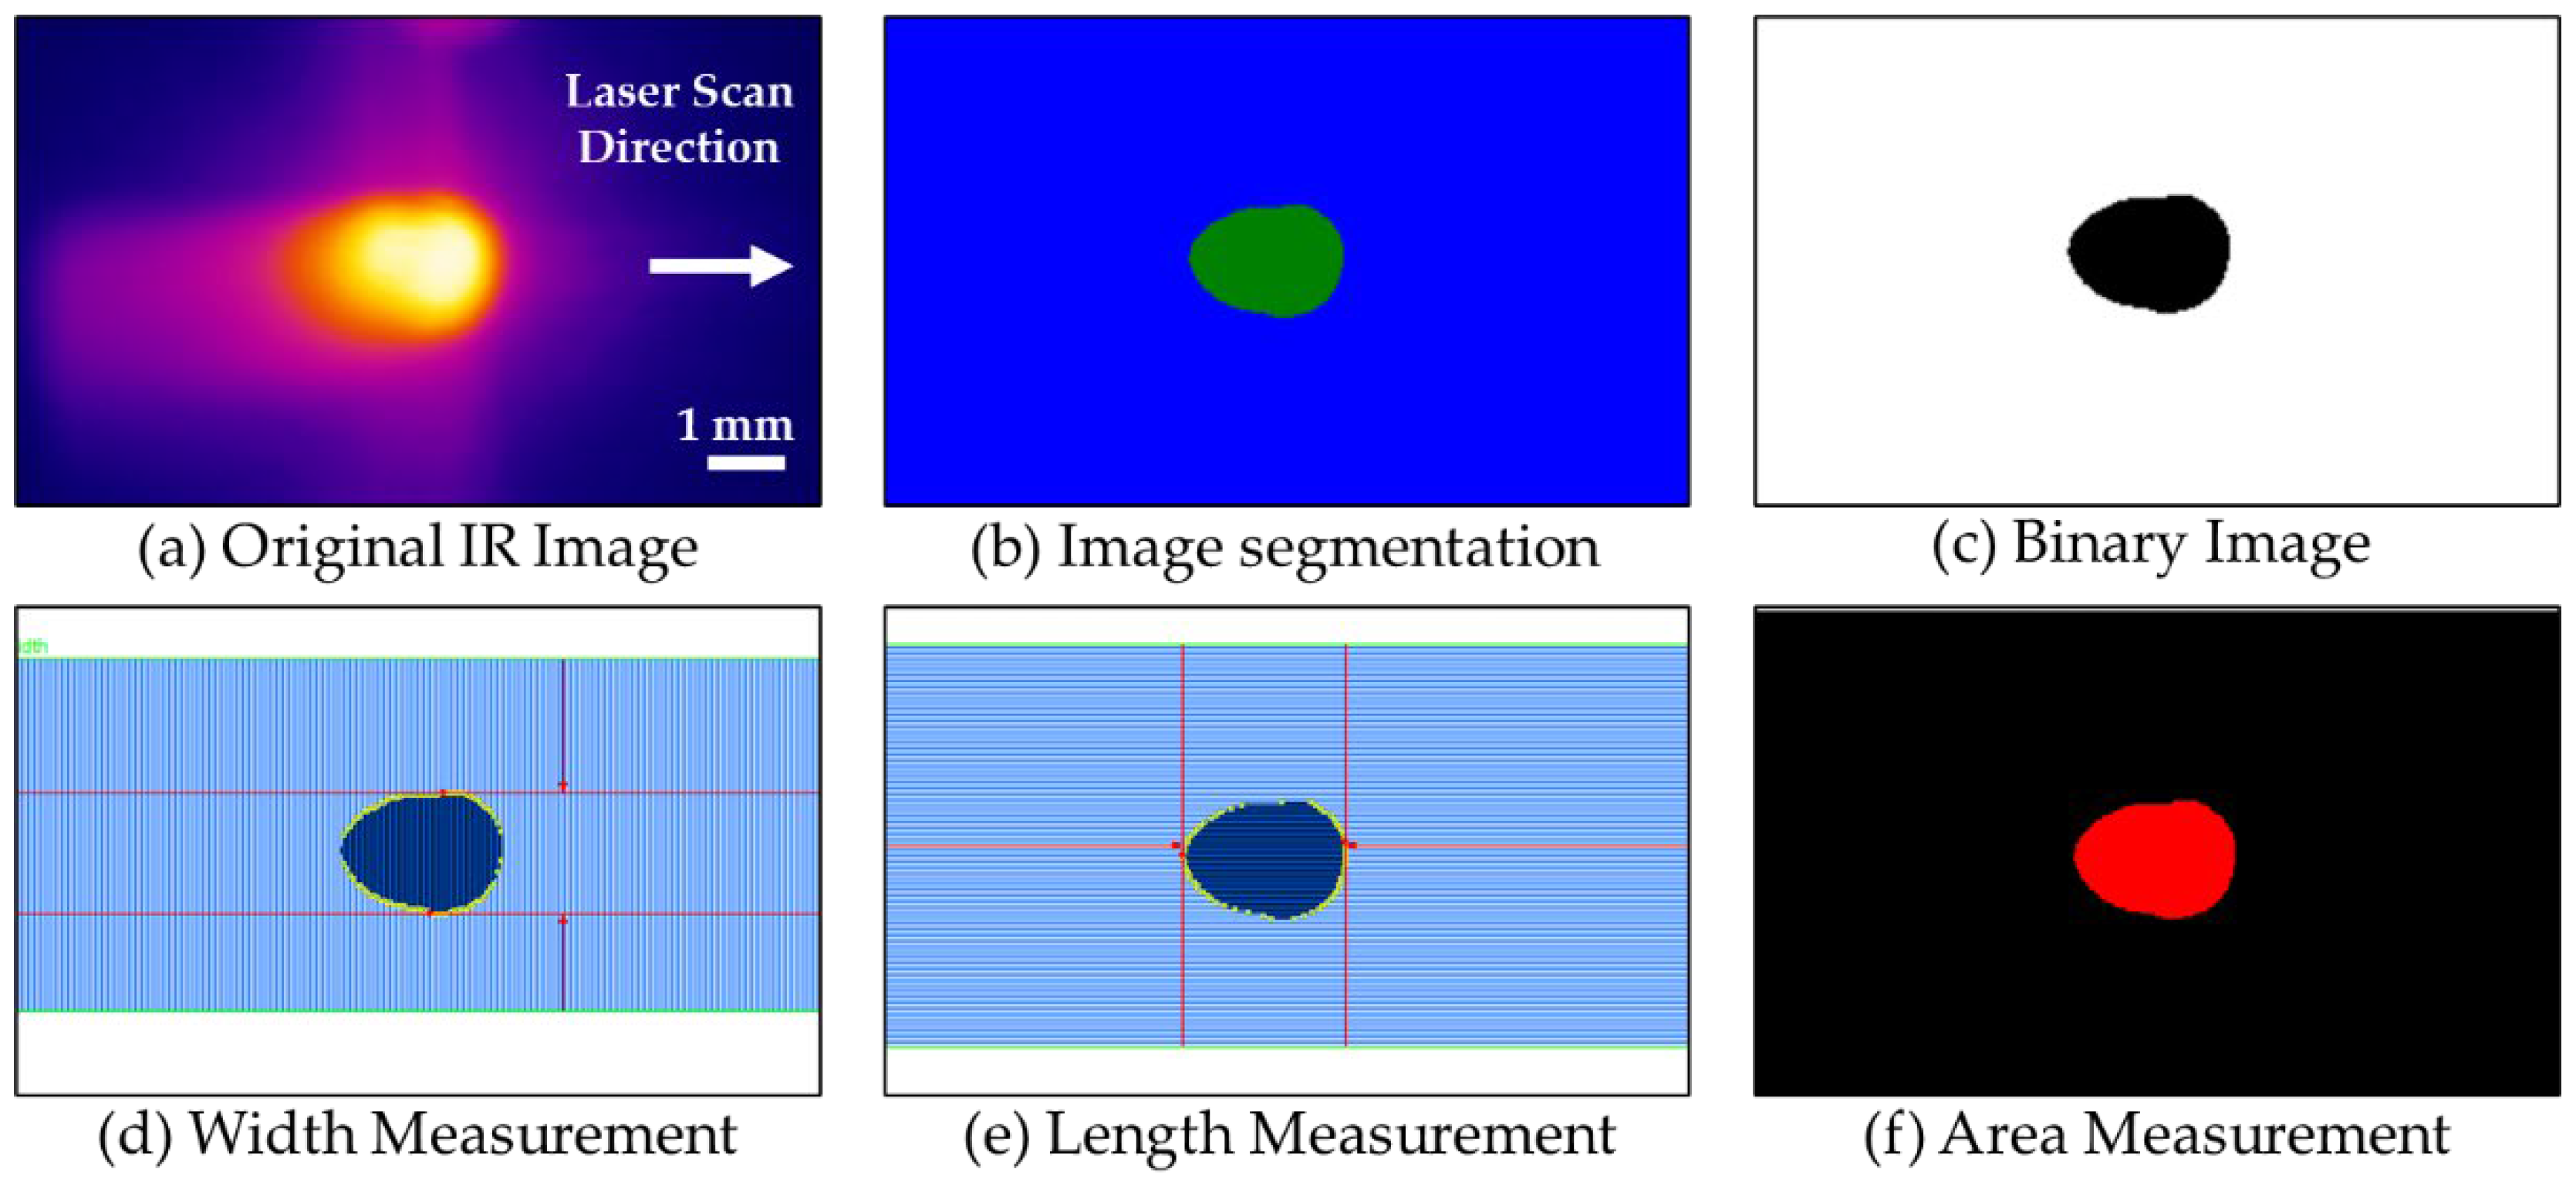
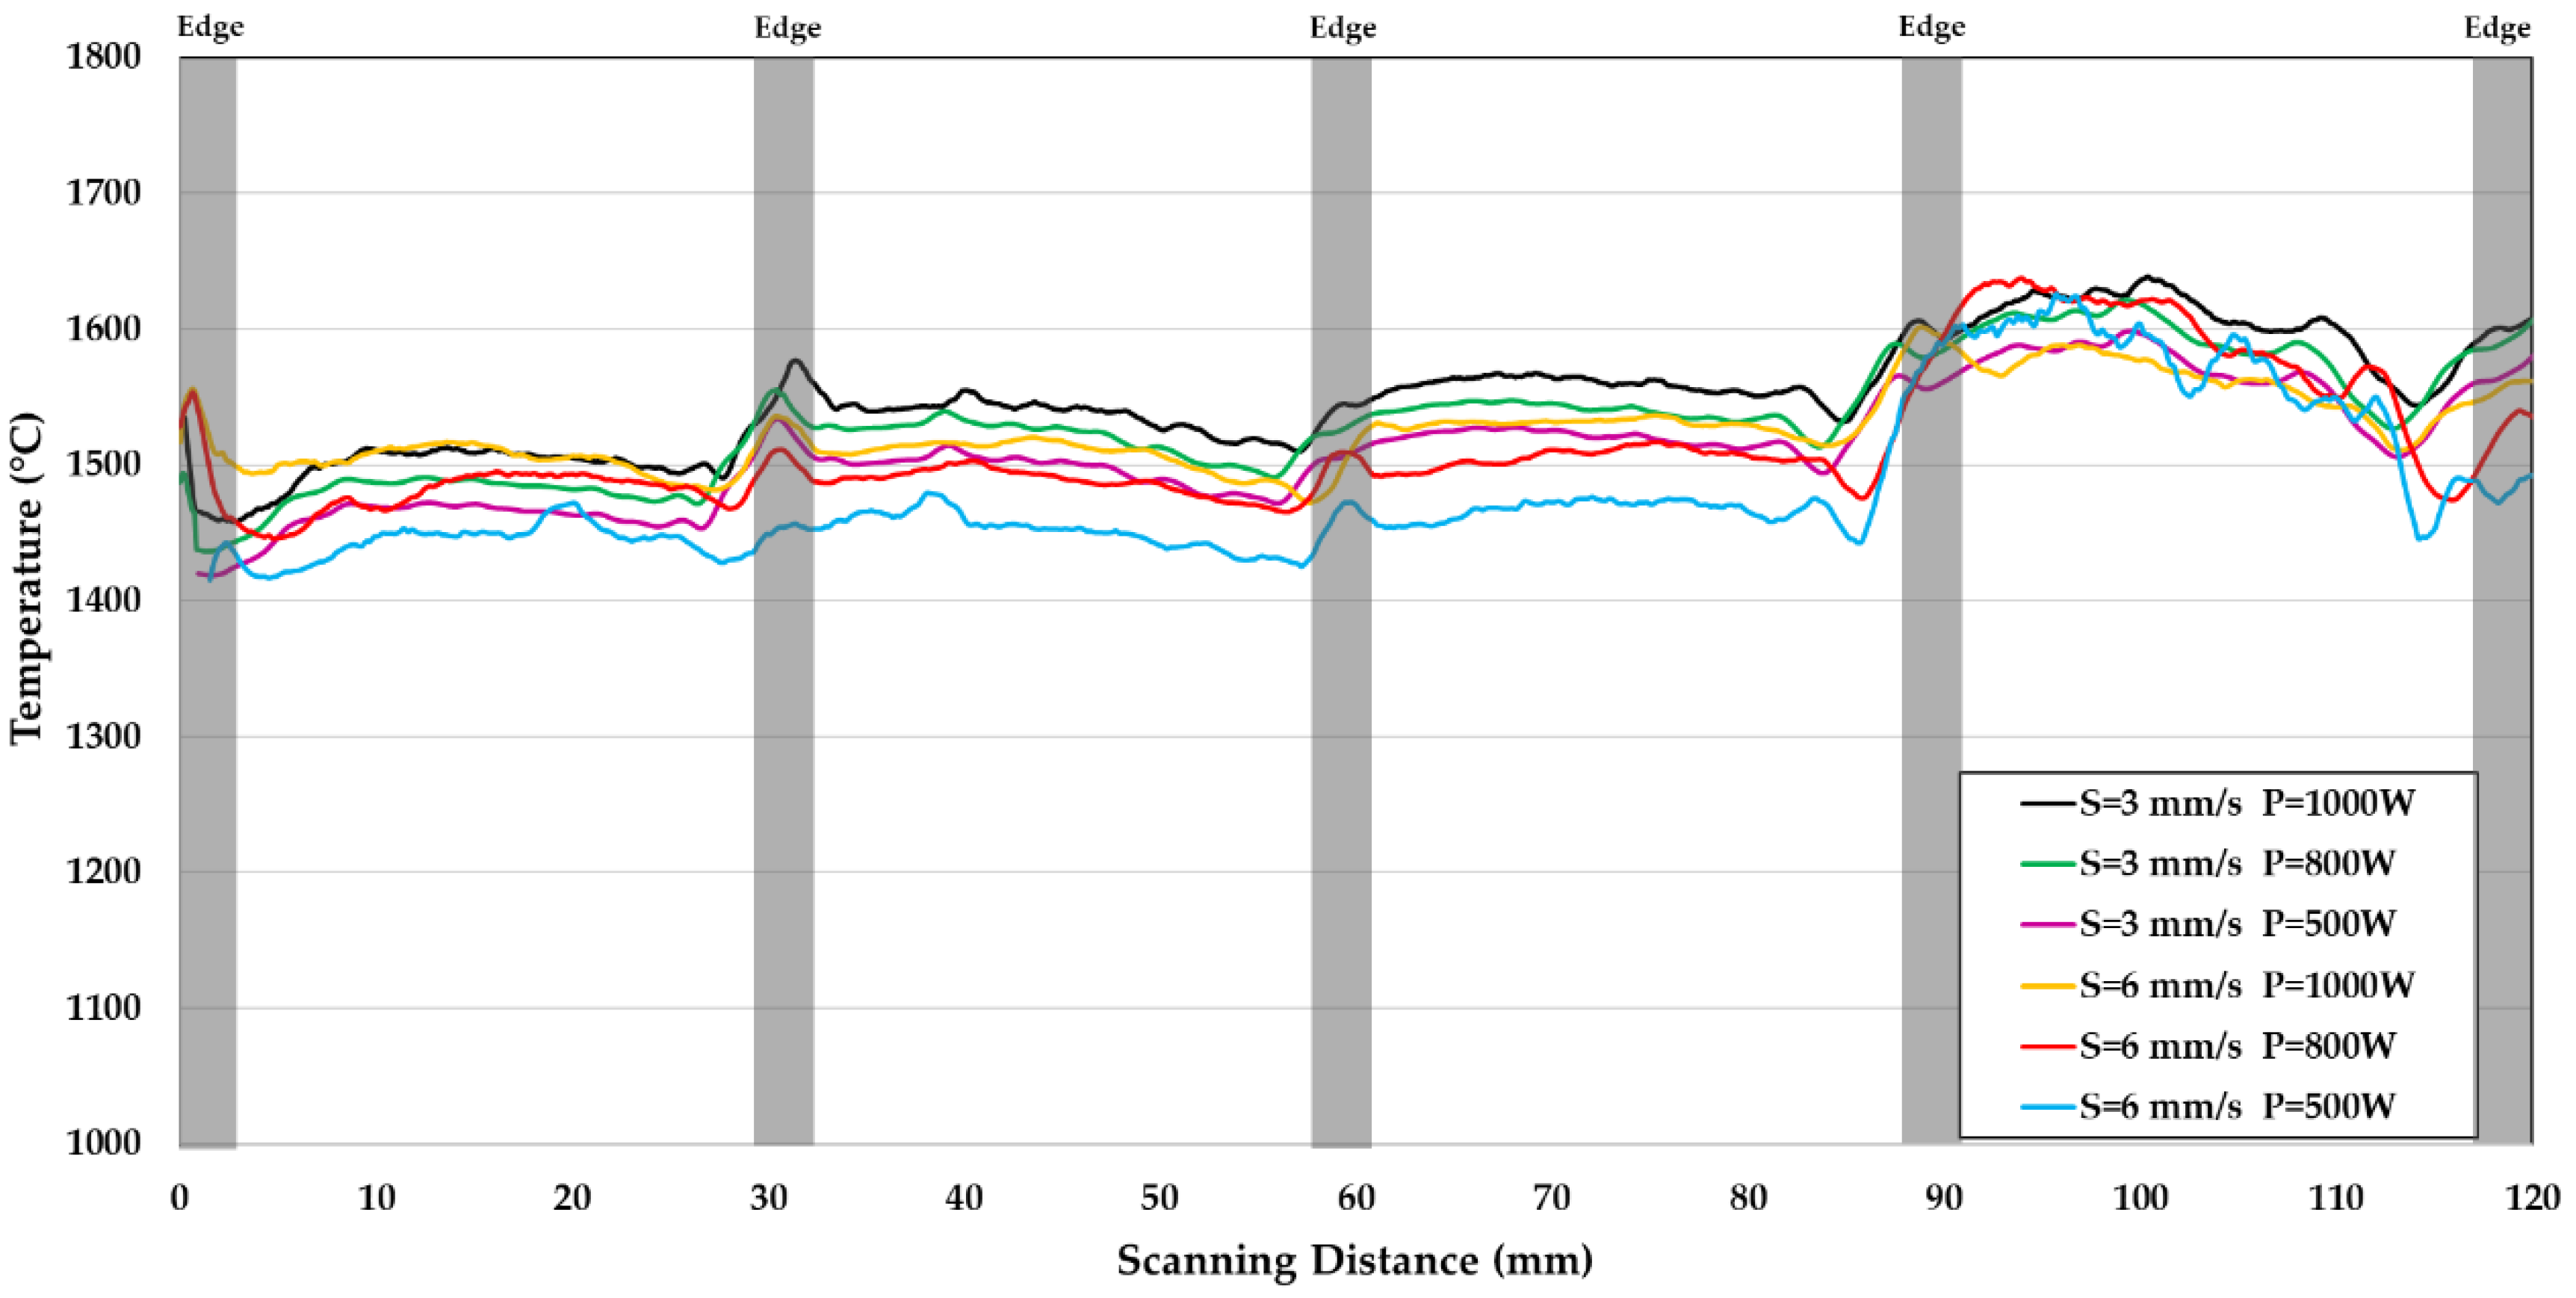
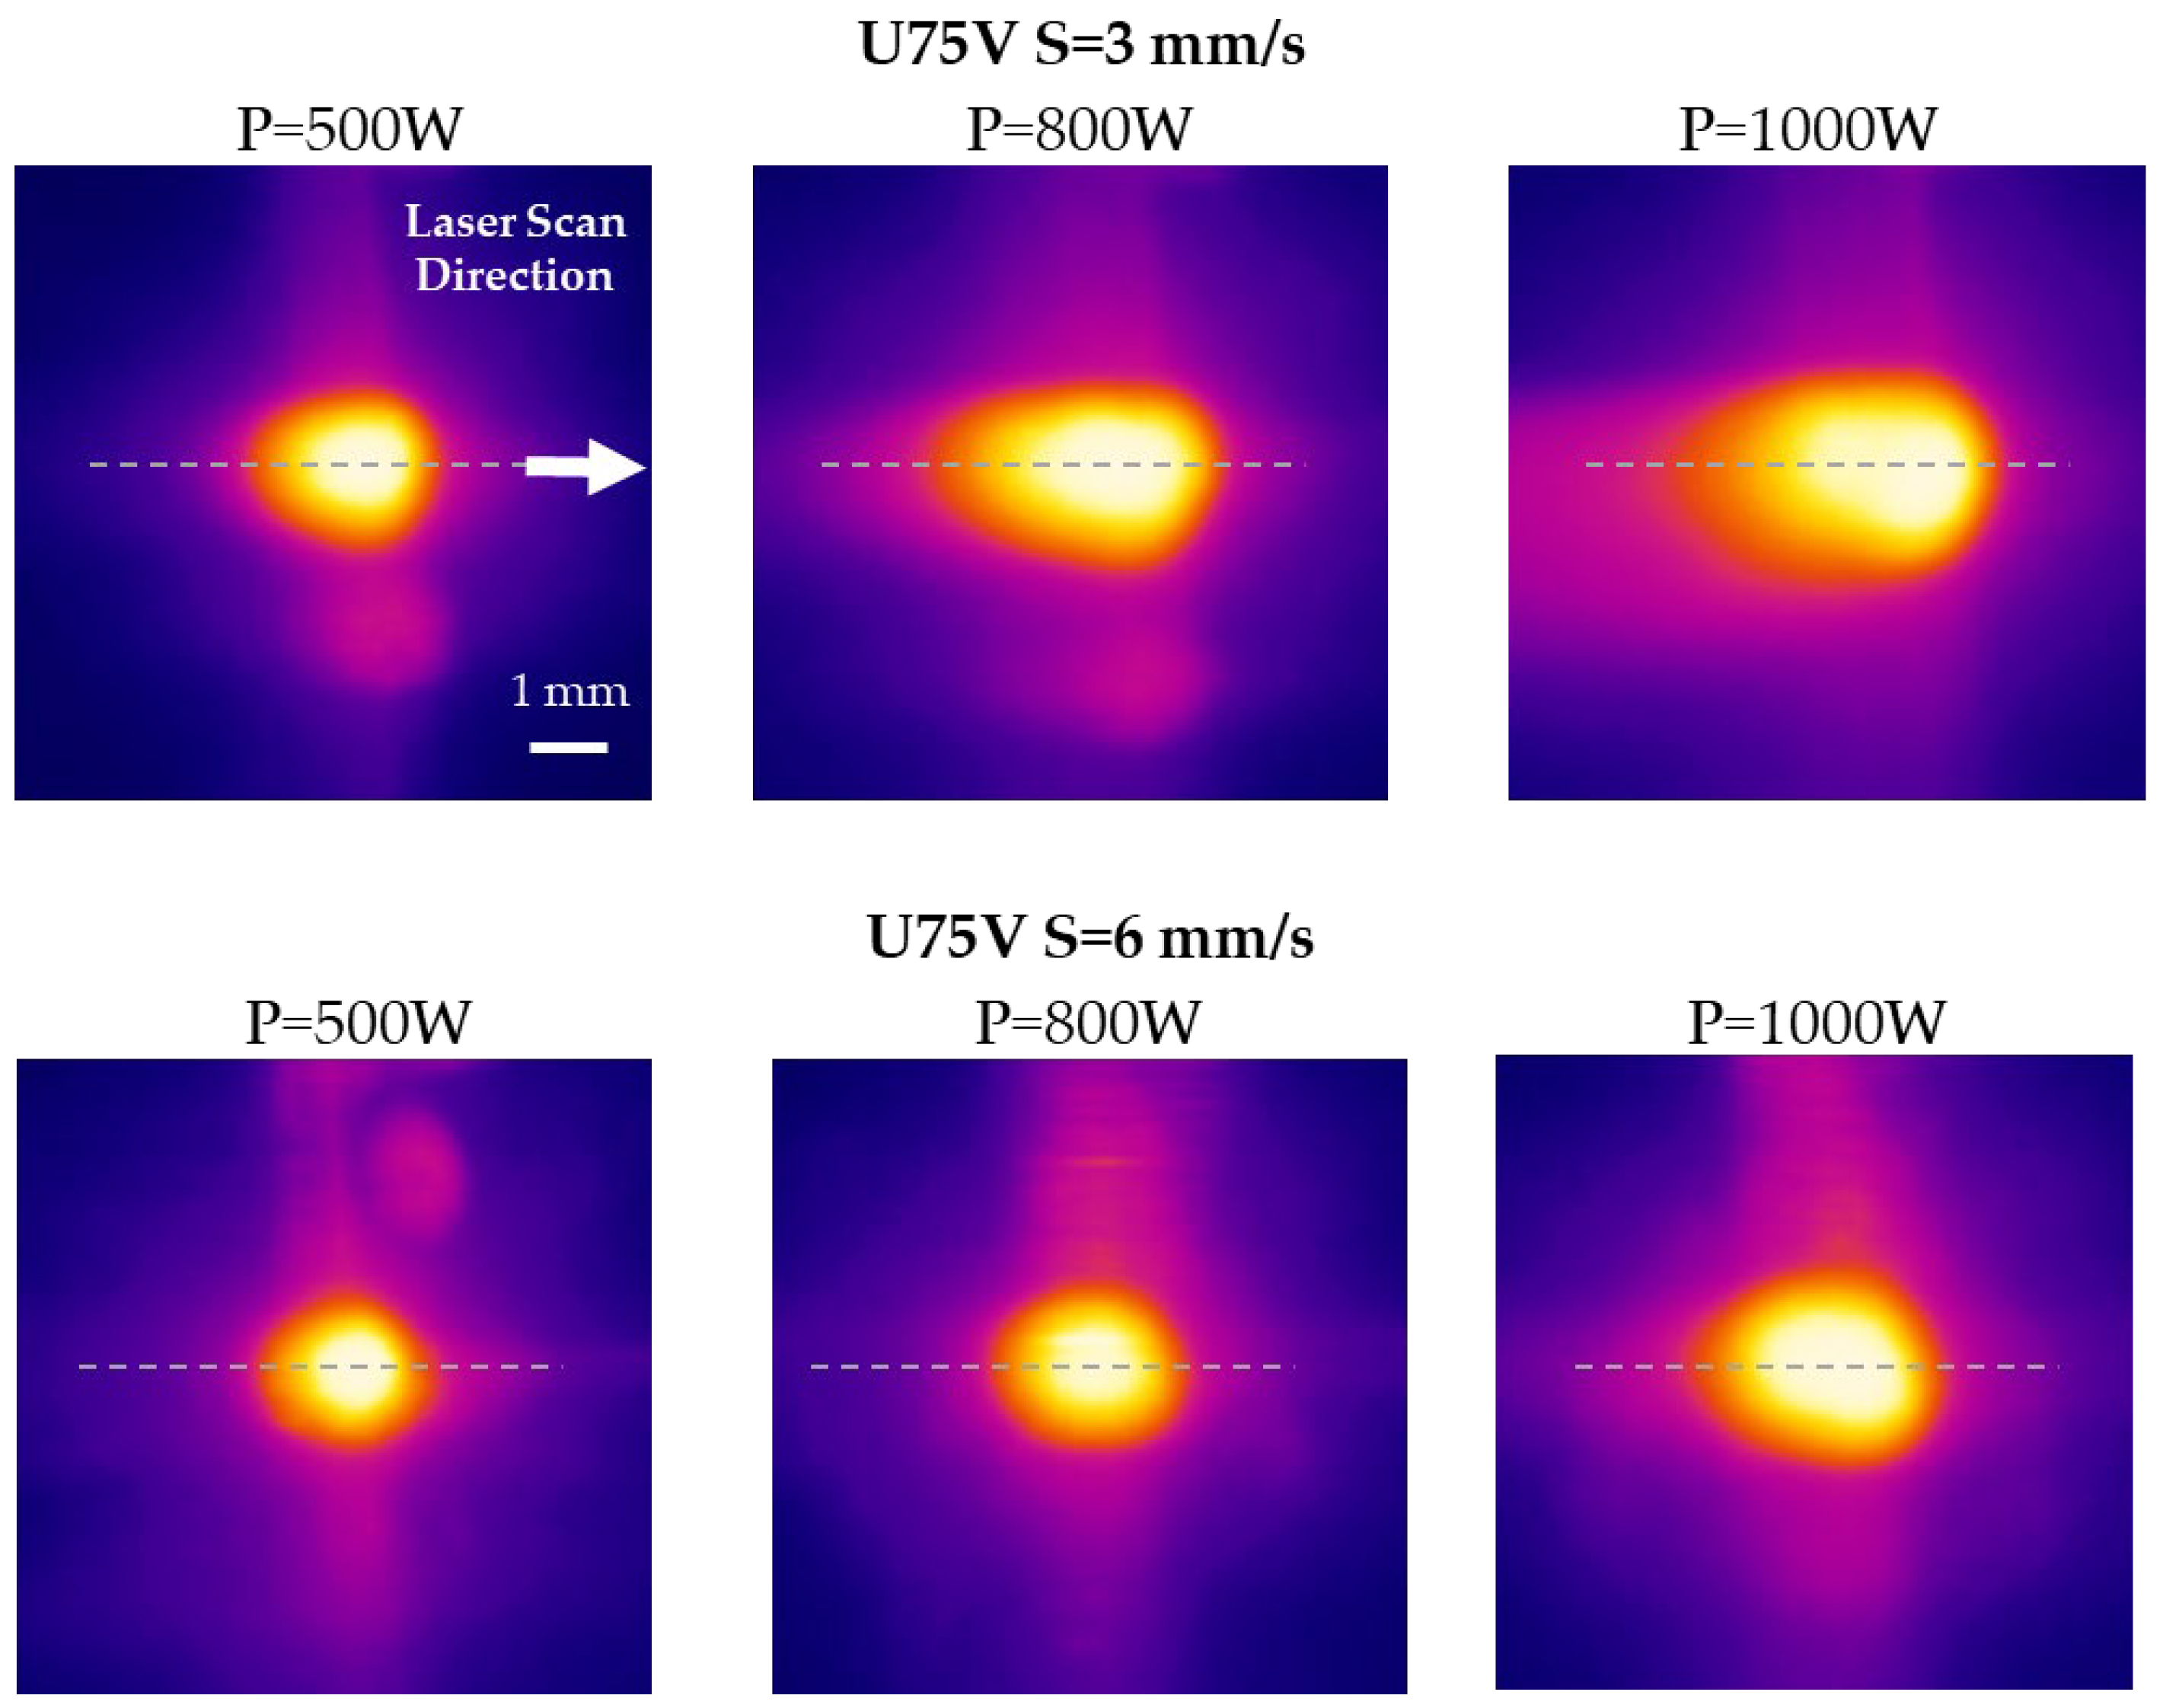
3.2. Infrared Images

Figure 7 shows the temperature of a molten pool during laser cladding at various laser powers and scanning speeds. There were four clad layers formed by the laser traveling a total distance of 120 mm back and forth. The temperature changed considerably when the laser crossed the substrate’s left and right edges. In the central section of the substrate, the temperatures from the infrared images were relatively steady and changed according to the laser power and the scanning speed. The cladding temperature for various conditions is summarized in Table 3. The cladding temperatures of the molten pool were between 1450 and 1650 °C. The cladding temperatures were well above the liquidus temperature of the steel substrate, indicating that the alloys are completely melted in the molten pool. These temperatures were rather relative, since they were averaged from the selected area. Even though the temperature of the molten pool fluctuated frequently due to spatters and particles, the temperature fluctuation during cladding on each layer was only about 15 °C (1%) for all conditions. When comparing the temperature to that on the same layer, the temperatures were clearly distinct for different conditions.
The cladding temperatures were higher for the successive layers in all conditions, and the temperatures of the last layer were greatly varied. Since the size of the hot spot affected the temperature, a higher temperature indicated that the molten pool for subsequent layers was larger. Heat accumulation from the previous layer could cause the cladding temperature to rise. Because the prior layer had an increasingly rough surface as more layers were deposited, the temperature of the last layer fluctuated the most. As a result, relying solely on temperature to determine cladding conditions was not ideal.
The infrared image also offered more information regarding the size, length, and width of the molten pool of laser cladding. Figure 8 shows infrared images of various laser-cladding conditions during the laser-cladding process. As the laser power increased, the laser spot became not only larger but also longer in length. As greater laser power was given to the substrate, the size of the laser hot spots grew larger. The laser spot elongated along the laser scan direction as heat accumulated on the surface.
Figure 9 plots the temperature profiles across the dashed lines of the hot spots in Figure 8. Due to laser energy accumulation on the substrate, the profiles exhibited a greater temperature on the tailing side (left side). When a higher laser power was used, the heat stayed on the substrate for longer before dissipating, resulting in a slower cooling rate. In other words, because heat was limited locally, employing low laser power and fast scanning resulted in a more circular hot spot. According to Figure 8 and Figure 9, the shape of the hot spot was highly related to the condition of the laser cladding and was useful for determining the quality of the cladded substrate. The poor cladding quality can be clearly identified when the hot spot is not well defined and has an irregular shape with a dark region included. Our results agreed with other studies of quality monitoring for laser welding [11,12].
During laser cladding, the temperature seemed to fluctuate, and the shape of the molten pool was more reliable for process condition monitoring. Therefore, using LabVIEW software, the hot spot’s width, length, and area can be extracted in real time for analysis. Table 3 shows the infrared temperature, thermal gradient, length, width, and area of the hot spots. The length of the hot spot (along the scan direction) depended more on the laser scanning speed than the laser power. The cooling rate was calculated by using the slope of the left temperature gradient curve at around 1000 °C.

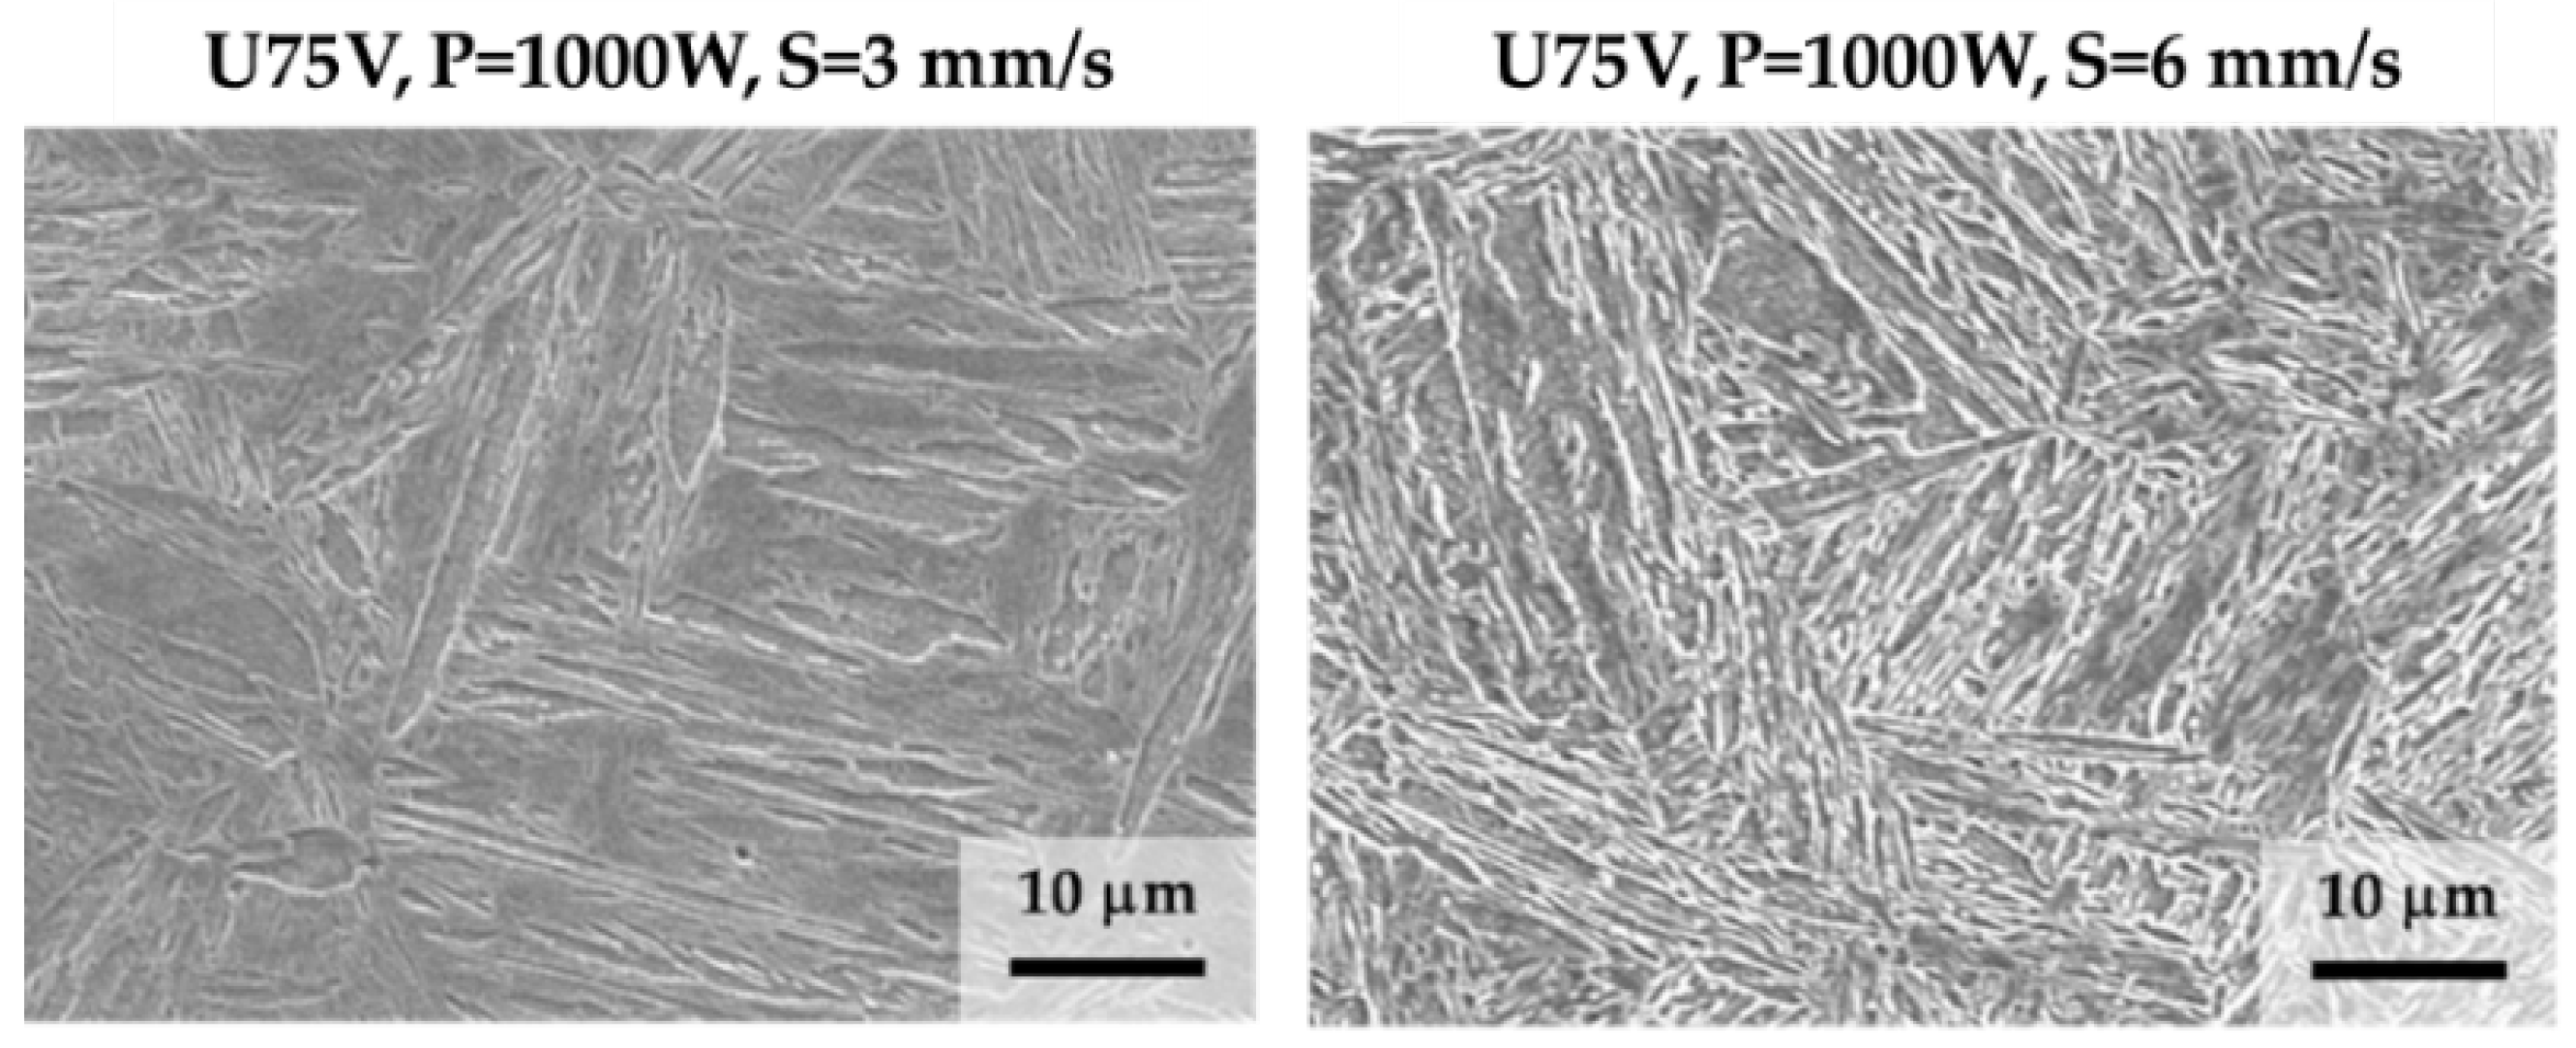
3.3. Microstructure and Microhardness

The laser-cladding cross-section consisted of three primary four regions: the cladding zone, interfacial zone, heat-affected zone (HAZ), and substrate [5]. The microstructure of the interfacial region was critical in determining the quality of laser cladding and in observing bonding, cracking, porosities, and other defects. Figure 10 shows the SEM images of the microstructure in the interface zone just below the clad layer. The SEM images captured the region below the interfacing zone, and there was little alloying between the melt zone and the HAZ zone. The austenization temperature also has a great influence on the prior austenite grain size and the consequent grain size of martensite. In this work, the faster laser scanning speed led to lower cladding temperatures and a faster cooling rate. The lower cladding temperature resulted in a lower austenization temperature, which could reduce the prior austenite grain size [23]. The martensitic transformation start (Ms) temperature is decreased with decreasing the austenite’s grain size [24]. Meanwhile, it is reported that the increased cooling rate could promote the decrease of Ms, although the martensitic transformation is usually considered as a thermal transformation [25]. The decreased Ms caused by reduced austenite grain size and increased cooling rate can also promote the formation of martensite at a lower temperature and finally refine the martensite.
The hardness of the cross-section of the cladded steels was measured by using a micro-Vickers hardness test with a 0.5 kg force on different regions and is presented in Table 4. Each data point was calculated by averaging three measurements. U75V steel substrate has a microhardness of about 400 HV. The Inconel 625 coating had a microhardness of roughly 210–250 HV, which was similar to the base substrate for effective bonding for repair. The HAZ zone had a hardness increase to about 420–490 HV due to the martensite structure induced by laser hardening on U75V steel. Using a faster laser scanning speed resulted in slightly higher hardness in the HAZ region due to the smaller grain size of the microstructure. Our results suggest that the laser power had less of an impact on the microhardness of the substrate.

4. Discussion

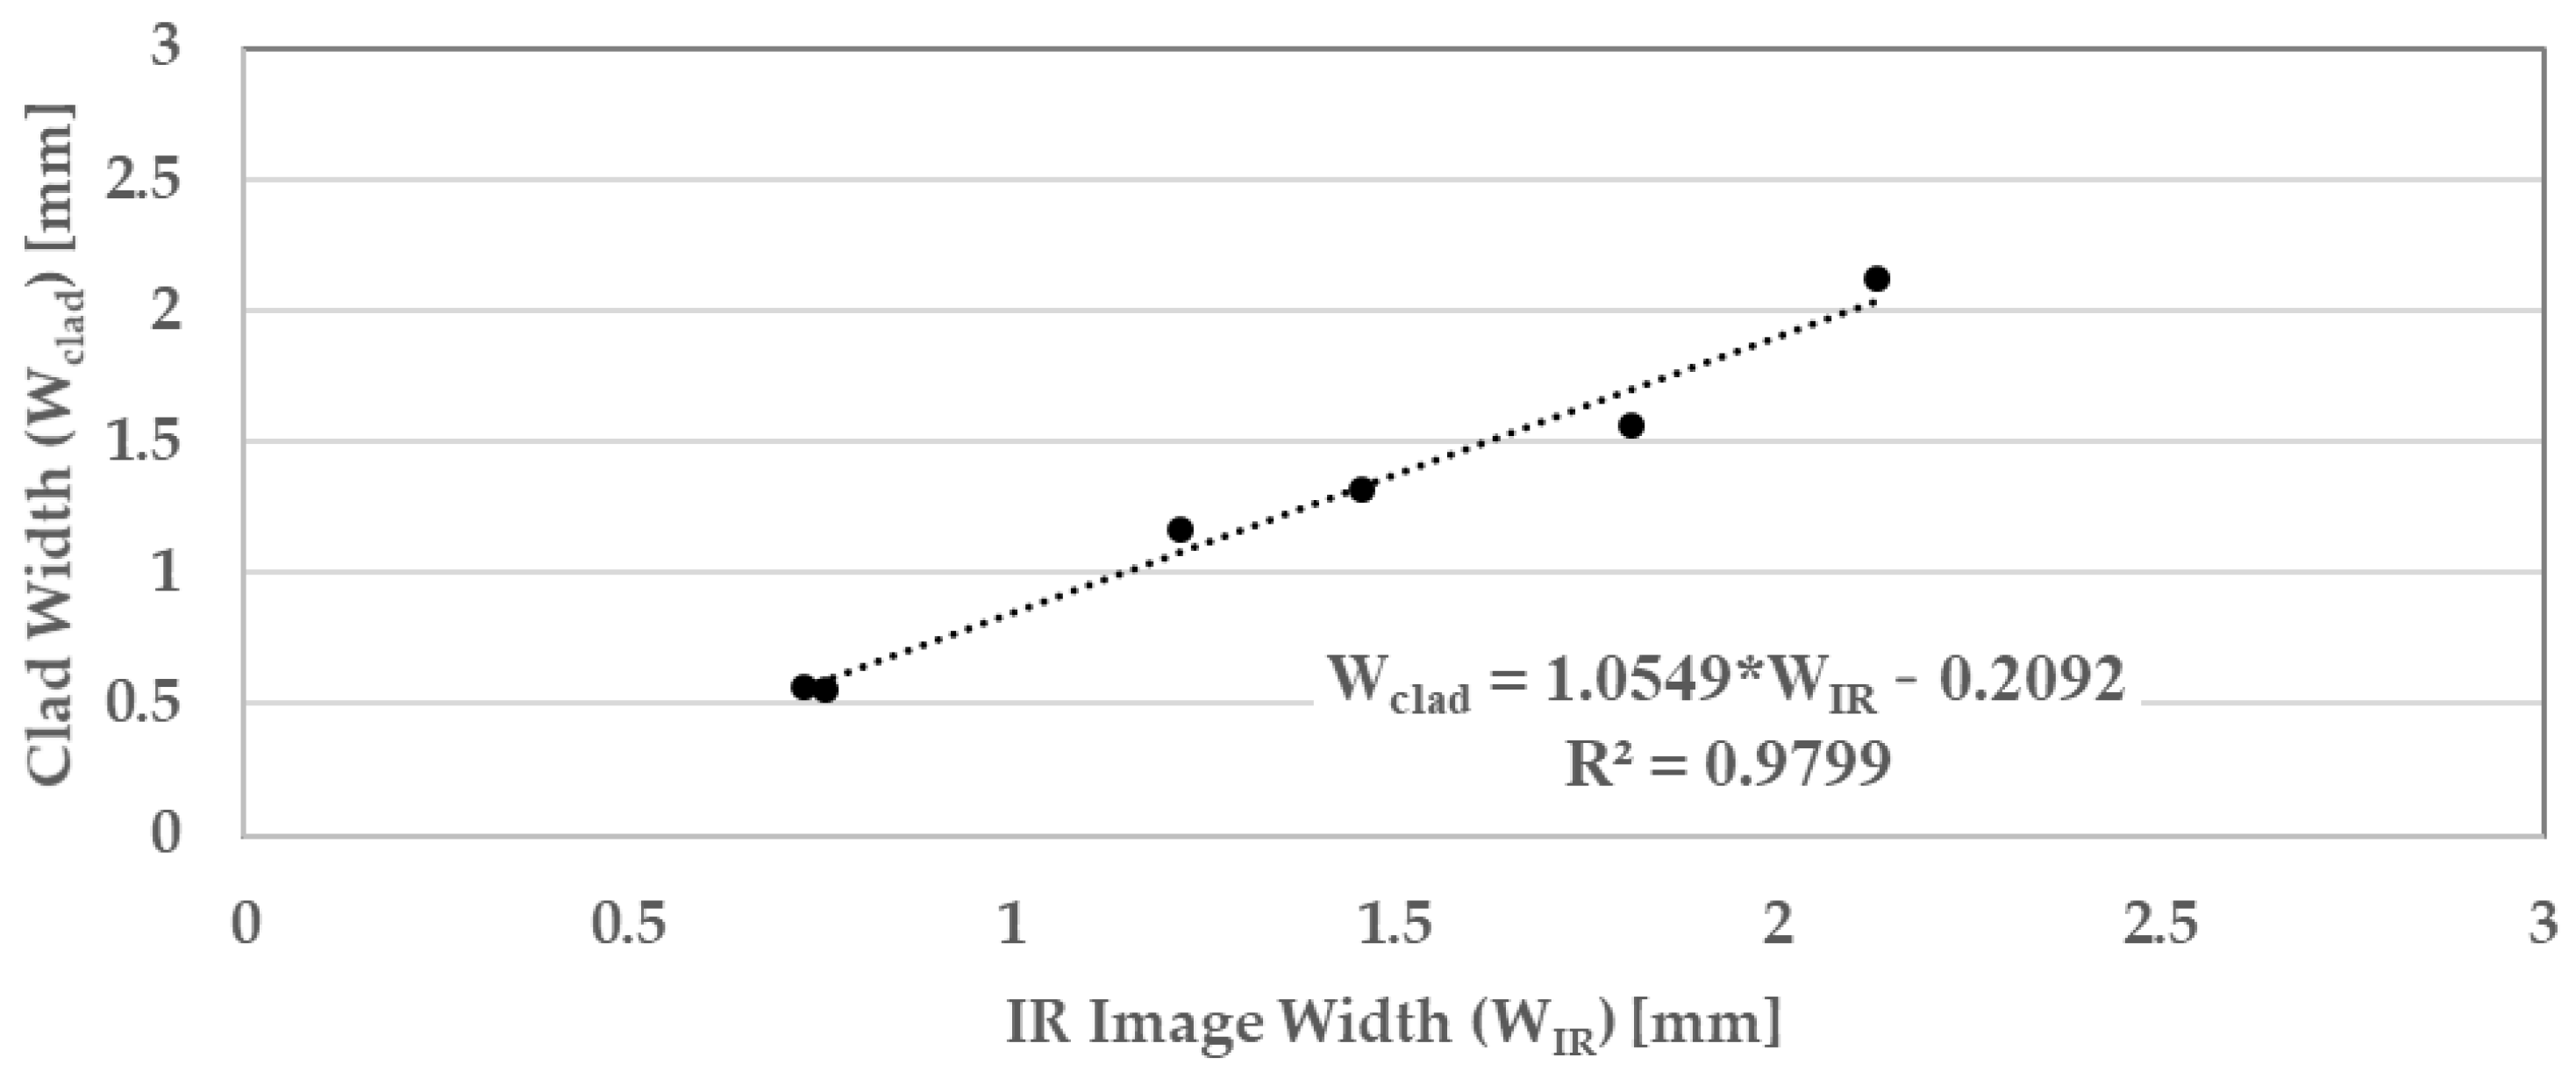
4.1. Correlation between Infrared Images and Cladded Geometry

When comparing the data from Table 2 and Table 3, we find that the width, length, and area of the hot spot correlate with the clad geometry. The shape of the molten pool was directly affected by the laser-cladding process conditions. Figure 11 compares the width and length of the molten-pool image for different laser powers and scanning speeds. The laser power had a greater impact on the molten pool’s width than the scanning speed had on the molten pool’s length. In other words, the cladding width was determined by the input laser power and laser-beam diameter, while the slower scanning speed created a longer heat track, affecting the length of the hot spot. In fact, as shown in Figure 12, the width of the IR hot spot (WIR) was most closely related to the width of the clad (WClad). Since the infrared camera directly observed the molten pool of laser cladding, the hot spot’s width was translated into the width of the clad line. Clad height and depth, on the other hand, were affected by the number of clad layers deposited on the substrate, which was more difficult to determine from imaging.

4.2. Correlation between Infrared Images and Microstructure

The infrared image contained information on the temperature, hot-spot profile, and dynamics of molten pool change during cladding that related to the macro- and microstructure of the cladded substrate. For instance, the cooling rate of the laser spot can be extracted from Figure 8. Therefore, the different cooling rates of laser cladding affected the microstructure formed during laser cladding. When using lower laser power, the temperature gradient exhibited a faster cooling rate, resulting in a smaller grain size, leading to higher microhardness.
Infrared imaging of the process could detect potential problems from laser power, laser scanning, power flow, environmental disturbance, and other factors. For example, to build a continuous cladded line with a laser power of 500 W, a low scanning speed of 1 mm/s was necessary, as illustrated in Figure 13. The infrared image of this condition showed an irregular hot spot. The middle part of the hot spot in Figure 13c appeared to be darker. This suggests that, due to incomplete melting, the temperature in the molten pool was not distributed evenly. Figure 13d–f shows SEM images of the cross-section of this substrate that revealed porosities inside the HAZ zone.
In addition, we applied this approach to U20Mn (Fe-0.2C-2.25Mn-0.9Si-0.6Cr-0.6Ni-0.4Mo) steel with a granular bainitic structure and a martensitic/austenitic isolated structure. The results were in good agreement with those of U75V steel. The infrared image of the molten pool during cladding can be analyzed to distinguish process conditions and predict the resulting structure of cladded substrates.

5. Conclusions

Online process monitoring of the laser cladding of Inconel 625 powder on U75V and U20Mn rail substrates was carried out successfully, and the following conclusions can be drawn:
  • Melt pool of laser cladding of rail steel was observed in real time, using infrared camera and image-analysis software. This method was able to detect discrepancies from different cladding conditions, different clad layers, and small disturbances. It was useful for determining the clad geometry and predicting the microstructure of the cladded substrate.
  • The cladding temperature was calculated from the infrared image of its melt pool and had a good relationship with the process condition of laser cladding. The cladding temperature was shifted during the cladding process in different layers, so using temperature solely was not enough to monitor the process.
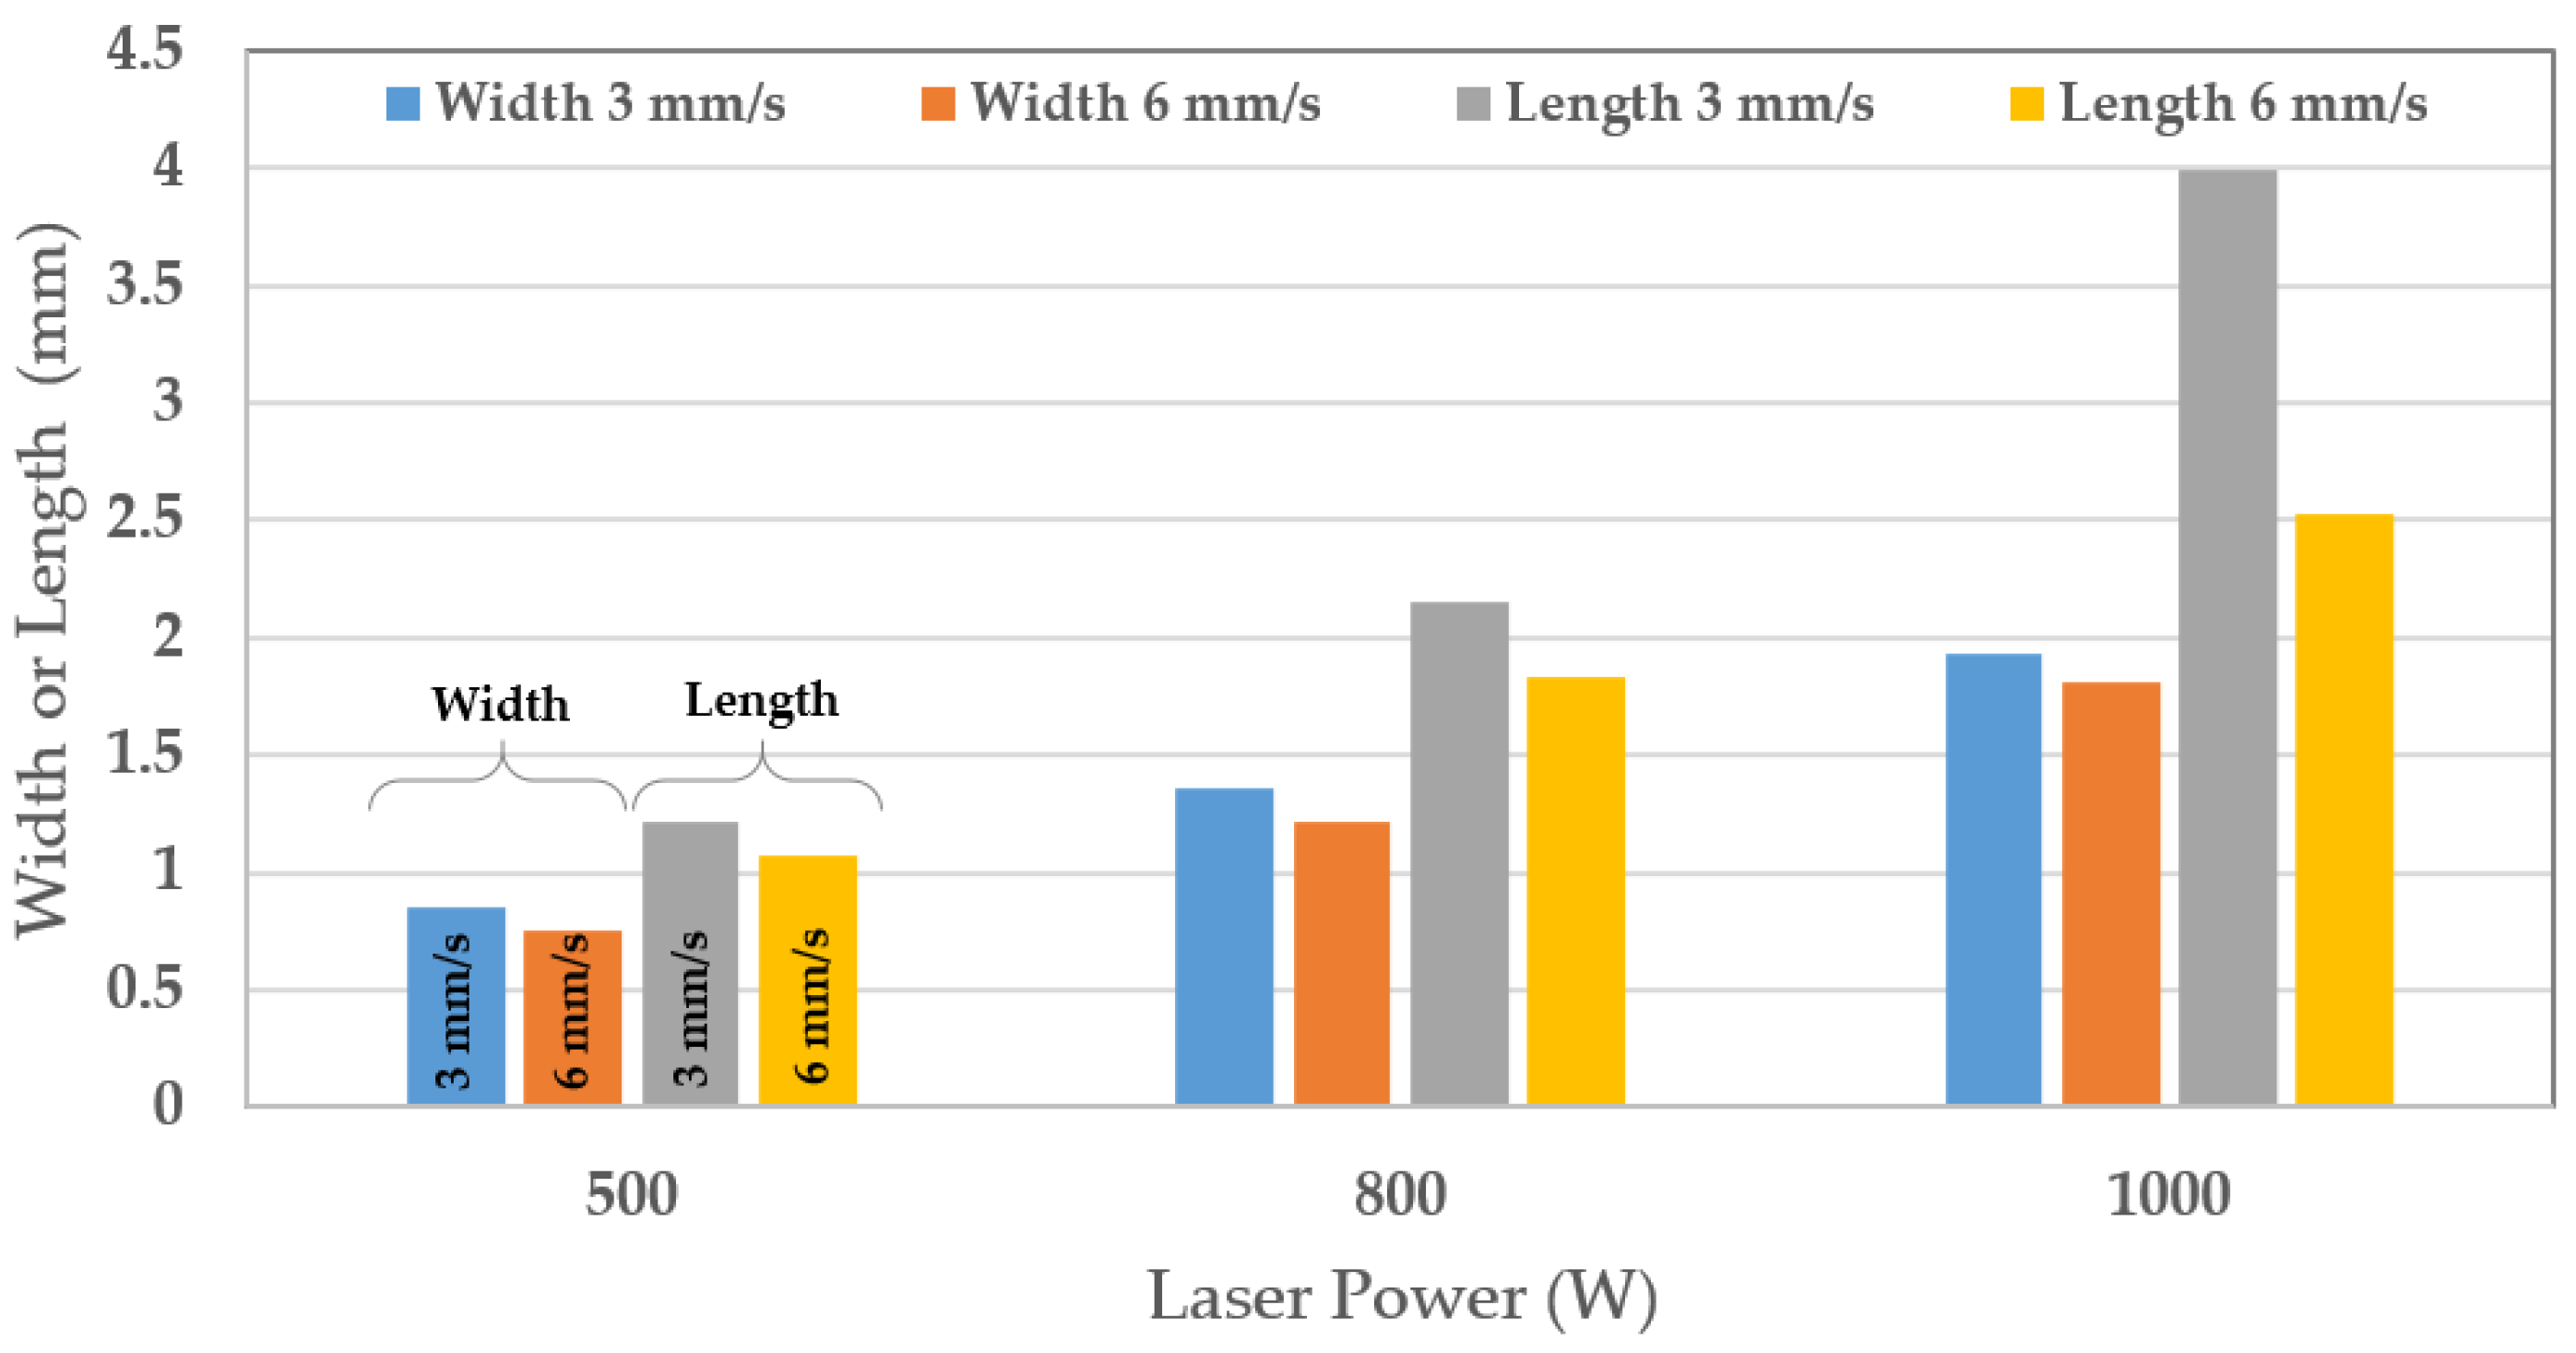
  • The laser hot spot’s width, length, and area changed accordingly with the laser power and laser scanning speed. For all cladding conditions, the molten pool’s width matched well with the clad’s width. The molten pool’s spot profile correlated well with the process condition. The molten pool’s width was affected more by the laser power, and the molten pool’s length was affected more from the scanning speed.
  • The cladding temperature and the cooling rate from the temperature gradient were correctly related to the measured microhardness and microstructure of the HAZ region. The faster laser scanning speed caused a lower cladding temperature and faster cooling rate at the interfacing layer, resulting in a smaller martensite microstructure and slightly higher hardness in the HAZ region.
  • Further research is needed to identify a deeper relationship between the dynamic imaging of the molten pool and other cladding characteristics, including the cladding layer, particle uniformity, surface roughness, and so on.

Author Contributions

P.S., methodology, investigation, formal analysis, writing—original draft preparation, and funding acquisition; B.K., methodology and investigation; G.G., writing—review and editing, and supervision; Z.Y., writing—review and editing, and supervision. All authors have read and agreed to the published version of the manuscript.

Funding

This research was funded by Thailand Science Research and Innovation Fund, and King Mongkut’s University of Technology North Bangkok (Contract No. KMUTNB-MHESI-64-03).

Data Availability Statement

The data presented in this study are available upon request from the corresponding author.

Acknowledgments

The experiment was supported by Center of Innovation in Design and Engineering for Manufacturing (CoI-DEM), KMUTNB and EIT Lasertechnik Corporation Co., Ltd.

Conflicts of Interest

The authors declare no conflict of interest.

References

  1. He, H.; Zhang, T.; Ma, M.; Liu, W. Microstructure and wear resistance of laser cladding particulate reinforced Fe-based composite coating on railway steel. J. Laser Appl. 2017, 29, 022503. [Google Scholar] [CrossRef]
  2. Clare, A.T.; Oyelola, O.; Abioye, T.E.; Farayibi, P.K. Laser cladding of rail steel with Co–Cr. Surf. Eng. 2013, 29, 731–736. [Google Scholar] [CrossRef]
  3. Lai, Q.; Abrahams, R.; Yan, W.; Qiu, C.; Mutton, P.; Paradowska, A.; Soodi, M. Investigation of a novel functionally graded material for the repair of premium hypereutectoid rails using laser cladding technology. Compos. Part B Eng. 2017, 130, 174–191. [Google Scholar] [CrossRef]
  4. Roy, T.; Lai, Q.; Abrahams, R.; Mutton, P.; Paradowska, A.; Soodi, M.; Yan, W. Effect of deposition material and heat treatment on wear and rolling contact fatigue of laser cladded rails. Wear 2018, 412, 69–81. [Google Scholar] [CrossRef]
  5. Zhu, L.; Xue, P.; Lan, Q.; Meng, G.; Ren, Y.; Yang, Z.; Xu, P.; Liu, Z. Recent research and development status of laser cladding: A review. Opt. Laser Technol. 2021, 138, 106915. [Google Scholar] [CrossRef]
  6. Wang, X.; Lei, L.; Yu, H. A review on microstructural features and mechanical properties of wheels/rails cladded by laser cladding. Micromachines 2021, 12, 152. [Google Scholar] [CrossRef]
  7. Lewis, S.R.; Fretwell-Smith, S.; Goodwin, P.S.; Smith, L.; Lewis, R.; Aslam, M.; Fletcher, D.I.; Murray, K.; Lambert, R. Improving rail wear and RCF performance using laser cladding. Wear 2016, 366, 268–278. [Google Scholar] [CrossRef]
  8. Fu, Z.K.; Ding, H.H.; Wang, W.J.; Liu, Q.Y.; Guo, J.; Zhu, M.H. Investigation on microstructure and wear characteristic of laser cladding Fe-based alloy on wheel/rail materials. Wear 2015, 330, 592–599. [Google Scholar] [CrossRef]
  9. Narayanan, A.; Mostafavi, M.; Pirling, T.; Kabra, S.; Lewis, R.; Pavier, M.J.; Peel, M.J. Residual stress in laser cladded rail. Tribol. Int. 2019, 140, 105844. [Google Scholar] [CrossRef]
  10. You, D.Y.; Gao, X.D.; Katayama, S. Review of laser welding monitoring. Sci. Technol. Weld. Join. 2014, 19, 181–201. [Google Scholar] [CrossRef]
  11. Kaewprachum, B.; Srisungsitthisunti, P. Real-Time Process Monitoring of Laser Welding by Infrared Camera and Image Processing. In Key Engineering Materials; Trans Tech Publications Ltd.: Bäch, Switzerland, 2020; Volume 856, pp. 160–168. [Google Scholar]
  12. Lei, T.; Rong, Y.; Xu, J.; Huang, Y. Experiment study and regression analysis of molten pool in laser welding. Opt. Laser Technol. 2018, 108, 534–541. [Google Scholar] [CrossRef]
  13. Gao, J.Q.; Qin, G.L.; Yang, J.L.; He, J.G.; Zhang, T.; Wu, C.S. Image processing of weld pool and keyhole in Nd: YAG laser welding of stainless steel based on visual sensing. Trans. Nonferrous Met. Soc. China 2011, 21, 423–428. [Google Scholar] [CrossRef]
  14. Chen, Z.; Gao, X. Detection of weld pool width using infrared imaging during high-power fiber laser welding of type 304 austenitic stainless steel. Int. J. Adv. Manuf. Technol. 2014, 74, 1247–1254. [Google Scholar] [CrossRef]
  15. Cai, W.; Wang, J.; Cao, L.; Mi, G.; Shu, L.; Zhou, Q.; Jiang, P. Predicting the weld width from high-speed successive images of the weld zone using different machine learning algorithms during laser welding. Math. Biosci. Eng. 2019, 16, 5595–5612. [Google Scholar] [CrossRef]
  16. Smurov, I.; Doubenskaia, M.; Zaitsev, A. Comprehensive analysis of laser cladding by means of optical diagnostics and numerical simulation. Surf. Coat. Technol. 2013, 220, 112–121. [Google Scholar] [CrossRef]
  17. Muvvala, G.; Karmakar, D.P.; Nath, A.K. Online monitoring of thermo-cycles and its correlation with microstructure in laser cladding of nickel based super alloy. Opt. Lasers Eng. 2017, 88, 139–152. [Google Scholar] [CrossRef]
  18. Erfanmanesh, M.; Abdollah-Pour, H.; Mohammadian-Semnani, H.; Shoja-Razavi, R. An empirical-statistical model for laser cladding of WC-12Co powder on AISI 321 stainless steel. Opt. Laser Technol. 2017, 97, 180–186. [Google Scholar] [CrossRef]
  19. Guo, D.; Yu, D.; Zhang, P.; Duan, Y.; Zhang, B.; Zhong, Y.; Qiu, J. Laminar plasma jet surface hardening of the U75V rail steel: Insight into the hardening mechanism and control scheme. Surf. Coat. Technol. 2020, 394, 125857. [Google Scholar] [CrossRef]
  20. Seo, J.W.; Kim, J.C.; Kwon, S.J.; Jun, H.K. Effects of laser cladding for repairing and improving wear of rails. Int. J. Precis. Eng. Manuf. 2019, 20, 1207–1217. [Google Scholar] [CrossRef]
  21. Ren, W.Q.; Wang, L.; Xue, Z.L.; Li, C.Z.; Zhu, H.Y.; Huang, A.; Li, C. A thermodynamic assessment of precipitation, growth, and control of MnS inclusion in U75V heavy rail steel. High Temp. Mater. Processes 2021, 40, 178–192. [Google Scholar] [CrossRef]
  22. Wirth, F.; Wegener, K. A physical modeling and predictive simulation of the laser cladding process. Addit. Manuf. 2018, 22, 307–319. [Google Scholar] [CrossRef]
  23. Li, X.; Wei, Y. Effect of austenitising heat treatment on microstructure and properties of a nitrogen bearing martensitic stainless steel. Open Phys. 2019, 17, 601–606. [Google Scholar] [CrossRef] [Green Version]
  24. Yang, H.S.; Bhadeshia, H.K.D.H. Austenite grain size and the martensite-start temperature. Scr. Mater. 2009, 60, 493–495. [Google Scholar] [CrossRef]
  25. Souza, S.D.S.D.; Moreira, P.S.; Faria, G.L.D. Austenitizing temperature and cooling rate effects on the martensitic transformation in a microalloyed-steel. Mater. Res. 2020, 23. [Google Scholar] [CrossRef]
Figure 1. Experimental setup for process monitoring of laser cladding.
Metals 12 00825 g001
Figure 2. Online monitoring of laser-cladding experiment’s equipment.
Metals 12 00825 g002
Figure 3. Laser-cladding process and infrared image of the laser hot spot on the substrate taken by an IR camera.
Metals 12 00825 g003
Figure 4. Image-analysis steps with LabVIEW to determine the molten pool’s size from infrared image.
Metals 12 00825 g004
Figure 5. Parametric study of laser cladding on (a,b) U75V and (c,d) U20Mn rail steels. For all cases, the laser cladded four times (four layers) on the substrates. (a,c) Effect of scanning speed and (b,d) effect of laser power.
Metals 12 00825 g005
Figure 6. SEM images from cross-section of cladded rail steels at different conditions. For all cases, the laser cladded four times (four layers) on the substrates.
Metals 12 00825 g006
Figure 7. Temperature converted from infrared images during laser cladding for different laser powers and scanning speeds.
Metals 12 00825 g007
Figure 8. Laser hot-spot profiles during laser cladding on U75V substrate for different laser powers and scanning speeds.
Metals 12 00825 g008
Figure 9. Temperature profile of laser hot spots plotted along the dashed lines from Figure 8.
Metals 12 00825 g009
Figure 10. Microstructure of the interface zone between the cladded material and the heat-affected zone of substrate on U75V rail steels with different scanning speeds.
Metals 12 00825 g010
Figure 11. Correlation between IR image width (molten pool’s width) and clad width from experiment.
Metals 12 00825 g011
Figure 12. Correlation between IR image width (WIR) and actual clad width (WClad) from experiment.
Metals 12 00825 g012
Figure 13. Laser cladding on U75V with laser power 500 W scan speed 1 mm/s with 10-layer deposition resulted in porosities. (a) Cladded substrate, (b) substrate’s cross-section, (c) IR image during laser cladding, (d,e) SEM images at the interface region and (f) SEM at the HAZ region.
Metals 12 00825 g013
Table 1. Laser-cladding process parameters.
Experiment ParametersValues
Laser power500, 800, 1000 W
Cladding materialInconel 625
Cladding scanning speed3, 6 mm/s
Powder feed rate15 g/min
Angle of laser beam10 degrees
Laser focusing distance15 mm
Argon flow rate15 L/min
Angle of IR Camera45 degrees
Distance from work piece to IR camera550 mm
Table 2. Geometry of cladded lines due to different laser powers and scanning speeds.
Scan
Speed
Laser
Power
Clad
Height
Clad
Width
Clad
Depth
Clad
Area
(mm/s)(W)(mm)(mm)(mm)(mm2)
35000.150.540.150.25
38000.711.320.352.20
310001.062.200.374.94
65000.090.570.150.21
68000.171.170.441.12
610000.531.560.412.30
Table 3. Extracted data from infrared images of the cladding hot spot.
Scan SpeedLaser
Power
Average IR
Temperature
Cooling RateWidthHot Spot
Length
Area
(mm/s)(W)(°C)(°C/mm)(mm)(mm)(mm2)
35001480540.90.851.222.9
38001529249.31.362.158.7
31000156982.91.933.9922.5
65001446670.80.751.072.0
68001509209.21.221.836.9
610001517249.31.812.5313.5
Table 4. Microhardness of cross-section on cladded substrates.
Scan SpeedLaser PowerMicrohardness (HV)
(mm/s)(W)Cladding HAZSubstrate
3500228.2 ± 2.7461.6 ± 3.3407.0 ± 1.1
3800218.7 ± 1.8438.9 ± 5.8 402.2 ± 1.5
31000231.6 ± 2.1423.1 ± 7.3400.7 ± 2.3
6500241.5 ± 1.6483.9 ± 7.6401.3 ± 1.4
6800226.6 ± 1.0456.1 ± 5.5400.1 ± 1.5
61000230.2 ± 3.2477.6 ± 9.6410.2 ± 2.7
Publisher’s Note: MDPI stays neutral with regard to jurisdictional claims in published maps and institutional affiliations.

