
Molecular Dynamics Simulations of Xe Behaviors at the Grain Boundary in UO2
by
 ,
,
Yaping Xia
1, 
Zhen Wang
2,*,
Li Wang
3,
Yangchun Chen
1,
Zhixiao Liu
3,
Qingqing Wang
2,
Lu Wu
2 and
Huiqiu Deng
1,* 1
School of Physics and Electronics, Hunan University, Changsha 410082, China
2
The First Sub-Institute, Nuclear Power Institute of China, Chengdu 610041, China
3
College of Materials Science and Engineering, Hunan University, Changsha 410082, China
*
Authors to whom correspondence should be addressed.
Metals 2022, 12(5), 763; https://doi.org/10.3390/met12050763
Submission received: 21 March 2022
/
Revised: 25 April 2022
/
Accepted: 26 April 2022
/
Published: 29 April 2022
(This article belongs to the Special Issue Numerical Modeling of Materials under Extreme Conditions)
Abstract
:In this study, we investigated the behavior of xenon (Xe) bubbles in uranium dioxide (UO2) grain boundaries using molecular dynamics simulations and compared it to that in the UO2 bulk. The results show that the formation energy of Xe clusters at the Σ5 grain boundaries (GBs) is much lower than in the bulk. The diffusion activation energy of a single interstitial Xe atom at the GBs was approximately 1 eV lower than that in the bulk. Furthermore, the nucleation and growth of Xe bubbles in the Σ5 GBs at 1000 and 2000 K were simulated. The volume and pressure of bubbles with different numbers of Xe atoms were simulated. The bubble pressure dropped with increasing temperature at low Xe concentrations, whereas the volume increased. The radial distribution function was computed to explore the configuration evolution of Xe bubbles. The bubble structures in the GB and bulk material at the same temperature were also compared. Xe atoms were more regular in the bulk, whereas multiple Xe atoms formed a planar structure at the GBs.
1. Introduction
Uranium dioxide (UO2) has been widely used as fuel for nuclear reactors owing to its properties, such as there being no specific deformation when it is strongly irradiated, having an unchanged lattice structure at high temperatures, being non-volatile and being chemically unreactive with water [1]. During the operation of nuclear reactors, the nuclear fuel elements are subjected to a harsh working environment and numerous radioactive fission products are produced during the fission of the fuel assembly in the reactor core. With the development of burnup, solid and gas fission products are produced in the fuel elements and their volume is greater than that of the material before fission. The volume of the fuel element increases with the development of burnup, which is called irradiation swelling. The radiation swelling of nuclear fuel induces interactions between fuel pellets and cladding, resulting in radial deformation and transverse tension of the cladding tube, causing damage to the cladding tube, which seriously threatens the safe operation of the reactor [2]. Swelling caused by solid fission products is simple and increases linearly with burnup; the behavior of gas fission products is complex and this field has not been extensively studied.
Due to the numerous radiation and structural changes experienced during the life of UO2 and storing, understanding and controlling the microstructural changes requires a comprehensive approach that considers all aspects of the material’s behavior, from basic radiation damage processes to longer-term changes in the material microstructure. To better understand the fission gas behavior, such as microstructural changes and swelling, many experimental and theoretical studies have been conducted [3,4,5,6,7,8]. It is difficult to analyze the behavior of xenon (Xe) atoms in UO2 through experiments [9,10,11,12] because the growth mechanism of Xe bubbles and the entire physical process are not well understood. Therefore, intragranular rare bubbles under dynamic conditions, cannot be studied through experiments, making computational simulations the only choice. Niemiec et al. proposed a basic evolution equation describing the kinetics of the nucleation and growth phase transitions to study phase transformation or microstructure formation kinetics in physical systems originally composed of several grains [13]. Atomistic simulations are vital to a provide good insight into the atomic structure and damage mechanisms.
To date, all simulations have been conducted in monocrystals. Gadomski et al. [14] studied the kinetic anomalies occurring in nucleation and growth phenomena in complex systems, such as polycrystalline partly ordered alloys, quasicrystal line assemblies, and mesomorphs, to understand the kinetics of the evolution of the microstructure and the system during growth. UO2 pellets are manufactured through traditional powder metallurgical processes; hence, they are polycrystalline materials composed of particles with a diameter of approximately 10 μm. The opening at the grain boundaries (GBs) is a crucial phenomenon since the energy of defects decreases near the GB and fission gas, which causes aggregation at the GB, and can be released to the outside of the fuel. As a result, the properties of UO2 GBs at the atomic scale have been studied [15,16,17,18,19]. In this study, we compare the early behavior of Xe bubbles in the GBs and the entire block of UO2. Previous numerical studies on this subject have mainly focused on metal systems, such as metallic tungsten [20,21,22]. Herein, we focus on the behavior of Xe atoms at the GBs and the bulk UO2, including the migration of a single Xe interstitial atom, the nucleation and growth of Xe bubbles and the bubble pressure and expansion associated with bubble growth. This study serves as a good reference for higher length scale simulation models.
2. Simulation Method
2.1. Interatomic Potential
Molecular dynamics (MD) simulation is an effective means of studying the microworld, providing insight into the atomic structure and the mechanism of bubble growth. An MD simulation program, LAMMPS [23], was employed for all simulations in this study. However, the accuracy of MD simulations depends largely on the potential function of the atoms used to support the simulation.
Yang et al. studied the influence of different potential functions on the growth of high-pressure Xe bubbles [3]. With the continuous addition of Xe atoms, the pressure of the bubbles is divided into two stages. In stage I, where the bubble pressure is monotonically increased, the bubble characteristics and the microstructure evolution of UO2 are relatively independent with the interatomic potential used; thus, the results of the five potential functions are approximately the same. In stage II, the bubble pressure is released and then fluctuates and the volume and pressure of the bubbles, as well as the evolution of the bubble configuration and the UO2 matrix as a function of the number of Xe atoms, highly depend on the potentials used [3]. In addition, the formation energy of Xe at the same location in UO2 varies significantly with the potential of UO2 and Xe–UO2 [3,24,25].
To ensure the accuracy of MD simulations herein, we evaluated different sets of potential functions and compared them with density functional theory (DFT) or DFT + U data to select a better comprehensive potential function for adding Xe to UO2 [26,27,28,29,30].
The first and second sets of potentials have the same UO2 potential and were developed by Basak et al. [31]. However, IPR [27] and Geng [32] potentials were used to interact with Xe–UO2. In the third and fourth sets of potentials, the potential reported by Morelon [33] was used for the UO2 matrix, whereas those reported by Chartier [29] and IPR [27] were used to describe the Xe–UO2 interaction. In the fifth and sixth sets of potentials, the CRG potential [25] was used as a potential function of UO2 and the interaction of Xe–UO2 was described by Cooper [34] and IPR [27]. Therefore, the six sets of potentials are called Basak/IPR, Basak/Geng, Morelon/IPR, Morelon/Chartier, CRG/Cooper and CRG/IPR, respectively. Among them, three potential functions of UO2, are paired with different potential functions of Xe–UO2, because the interactions between Xe–U and Xe–O are determined in Xe–UO2. Thus, even in the case of the same UO2 potential function, we simulated it with different Xe–UO2 potential functions and the results are different.
We can determine the accuracy of using interatomic potentials by comparing them with the energetics of relatively small defects calculated using MD [3]. We developed several physically relevant benchmarks to compare the six sets of potentials on an equal basis. We placed Xe at different sites in UO2 (small, intermediate and large vacant sites). For small incorporation, we used the following defects: Xe in an interstitial (IntXe) and Xe on a uranium site with uranium in the neighboring interstitial (SubXe-IntU). The formation energies of the intermediate-sized incorporation sites are a Xe atom located at a U vacancy (Xe in Vu), an O vacancy (Xe in Vo), two nearest U and O vacancies (Xe in Vuo), or the three configurations of Schottky defect clusters (Xe in SD). Finally, we calculated the defect energetics of a single large incorporation site with Xe in a double Schottky defect cluster (Xe in 2SDs). To directly compare the MD values, a 2 × 2 × 2 supercell of the cubic fluorite unit cell (96 atoms for stoichiometric UO2) with a lattice constant of 5.454 Å was used in the molecular statics calculations. The simulation results are compared with the data in Table 1 [3]. The difference in energy is small, the maximum error value is 0.28 eV and the difference is 0.1 eV. The energy difference may be attributed to the difference in the machines used. However, in general, the results show that the potentials used are adequate. Then, through the MD simulations, we used a larger supercell (12,000 atoms) for better convergence to calculate the energies of Xe atoms at different sites in the UO2 lattice. In addition to the formation energies, we calculated the migration energy of interstitial Xe (). The results are compared with selected DFT and DFT + U data in Table 1. The results obtained using the CRG/IPR potentials show the best consistency with the DFT results; thus, we chose CRG/IPR as the potential function for adding Xe to UO2 for our subsequent simulations.
2.2. Model Building
The structure of GBs is essential for predicting the behavior of Xe bubbles. Up to now, most theoretical studies on the properties of GB have been based on molecular statics (MS) or DFT [35,36] without considering the influence of temperature. However, experimental observations have shown that GB microstructures and corresponding properties reflect the effect of temperature on GBs to a certain extent [37,38,39] because temperature changes may cause the relative sliding of grains at GBs [17,19]. Therefore, heat treatment of GBs is a necessary process to expand the understanding of GB. Hong et al. [40] reported that high temperature can cause complex ion transitions in some GBs. In this study, the symmetrically tilted GB, Σ5(310)/[100], in UO2 was used as a GB model because the Σ5 symmetric tilt GB has been extensively studied both experimentally and theoretically [17,41,42,43]; thus, we could compare our results with the available data.
In this study, the symmetrically tilted GB Σ5(310)/[100] in UO2 were formed by rotating perfect UO2 crystals. Symmetrically tilted GB means that the crystals on both sides of the GB are tilted towards each other and the interface of the GB is symmetrical to the two grains. The specific process of constructing the GB is as follows. First, half of the perfect UO2 crystal simulation box is rotated along the axis by half of the orientation difference angle. Then, the second crystal is constructed through mirror inversion, taking the first crystal as a reference. However, this method causes an overlap of the atoms at the crystal interface. Thus, we removed the overlapped interface atoms to maintain a neutral charge.
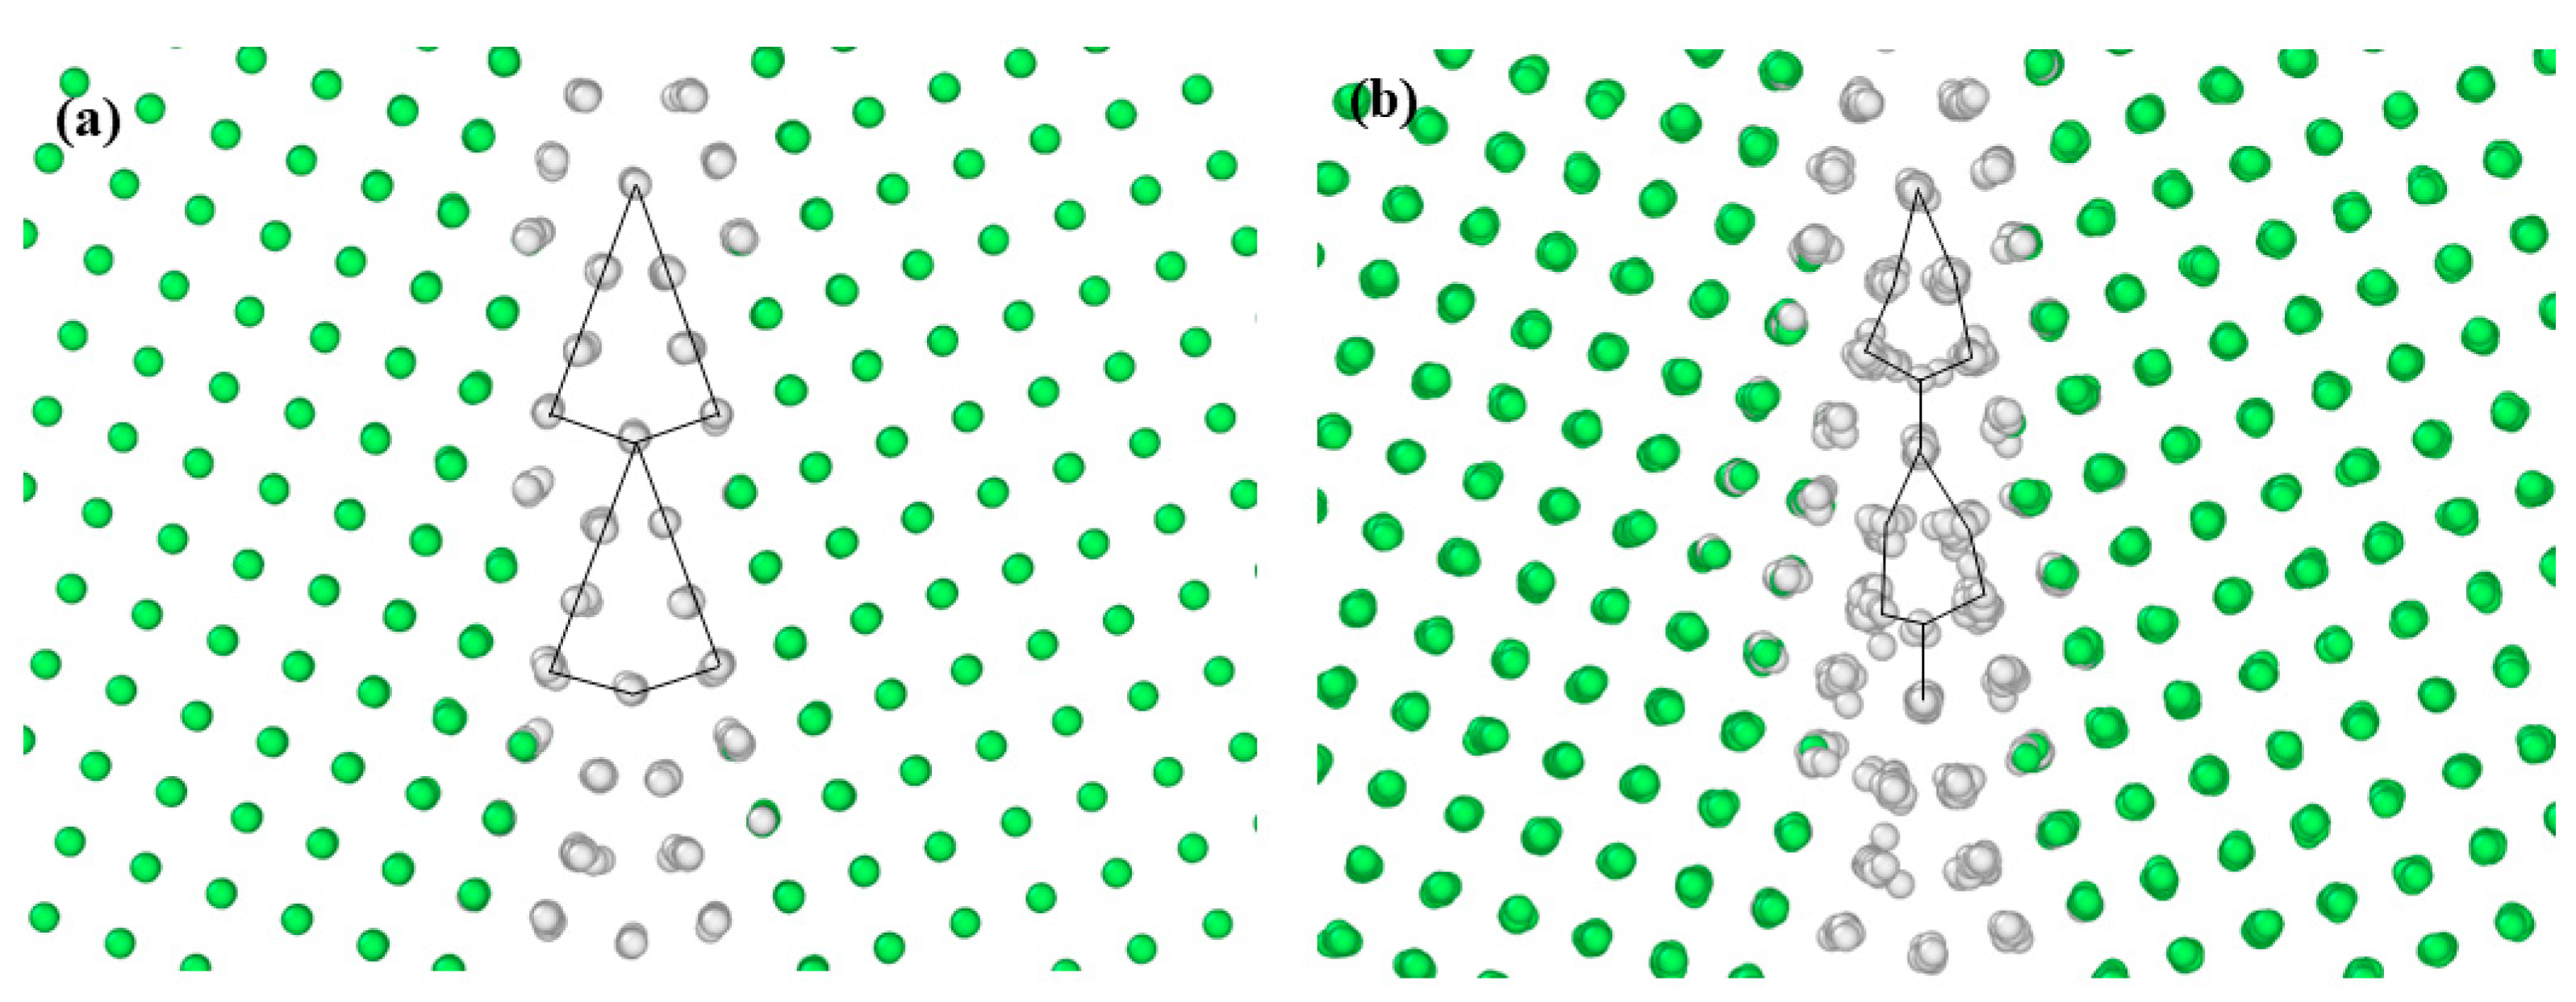
The annealed structures of the Σ5(310) GB based on MD are shown in Figure 1 and a common neighbor analysis was performed to identify the GB region and bulk region. The atomic configuration was viewed using OVITO software [44]. At 1000 K, the structure of the interface is conserved with the repetition of a triangular-like pattern (depicted by lines in Figure 1); however, at 2000 K, a structural change occurs with the boundary showing reduced diamond shapes arranged end-on-end. Previous simulation results show that, with an increase in temperature, the disorder degree of GB increases [45]; e.g., at 2000 K, the Σ5(310) GB has a more distorted triangular pattern [19].
2.3. MD Simulation Setup
For all MD simulations, the time step was set as 0.001 ps. For static relaxation, energy minimization was performed and the minimization algorithm was set as the conjugate gradient method (cg), with the stopping criteria for energy tolerance of 10−25 s−1 and a force tolerance of 10−25 eV/Å.
We studied the characteristics of Xe atoms in UO2 GB, including the formation energy of a single Xe atom in the GB, the migration of a single Xe atom in UO2 GB and the nucleation of Xe bubbles, and compared them with those in the bulk. The specific simulation processes for various characteristics are different. Thus we constructed two simulation boxes of different sizes: one contains 38,290 atoms, with a size of 10 a0 × 20 a0 × 10 a0 (a0 is the lattice constant of UO2) and was used to calculate the migration of a single Xe interstitial atom at the GB, and periodic boundary conditions were used in three directions of the box; the second is a 25 a0 × 40 a0 × 25 a0 large system simulation box and was used to simulate the nucleation and growth of Xe bubbles and the energy of Xe atoms at the GB, and periodic boundary conditions were used in three directions of the box. Similarly, in the bulk, a cubic box of 10 a0 × 10 a0 × 10 a0 containing 12,000 atoms was used with periodic boundary conditions to calculate the migration of a single Xe interstitial atom. The other system is 25 a0 × 25 a0 × 25 a0 with 187,500 atoms and was used to simulate the nucleation and growth of Xe bubbles and the energy of Xe atoms. We performed the same simulation process at the GB and in the bulk to better compare the differences in the behavior of Xe bubbles. A cutoff distance of 1.1 nm was adopted and used for all potentials used in this study.
To determine the stable configuration of Xe atoms in the GB, the stable structures of Xe clusters with different sizes (the number of atoms less than six) were obtained by adding Xe atoms gradually and performing MS simulations for each configuration.
After determining the stable Xe site in the GB, the diffusion mechanism of a single Xe interstitial atom at the GB was studied. The migration of a single Xe atom at the GB was studied using MD and the nudged elastic band (NEB) methods [46,47,48]. Then, the mean square displacement (MSD) method was used to calculate the diffusion coefficient and diffusion energy barrier of a single Xe atom at the GB.
Finally, to study the evolution mechanism of Xe bubbles, the microcanonical NVT (constant volume and temperature) ensemble was used to simulate Xe bubbles in UO2 GB. To describe the bubble characteristics during bubble evolution, the volume V and pressure P of the bubble after inserting each Xe atom were calculated by MD. The number of Xe atoms in the bubble is too small (only 50 Xe atoms) to obtain a good statistical result. V is the sum of the volumes of all Xe atoms, which were calculated using the Voronoi technology implemented in LAMMPS [49] and the pressure of the Xe bubble was calculated from the sum of the diagonal component of the atomic stress tensor and the bubble volumes as follows [8,50]:
where n is the number of Xe atoms in the bubble, is the diagonal component of the stress tensor for atom i, V is the volume of all Xe atoms.
Before the first Xe atom was randomly introduced into the simulation box, energy minimization was performed and the minimization algorithm was set using the conjugate method (cg), with the stopping criteria for energy tolerance and force tolerance of 10−25. Then, the first Xe atom was randomly added to the system. The initial system with Xe atoms was minimized to avoid long-distance movements of inadvertently overlapping atoms and the temperatures were set to 1000 K and 2000 K, respectively. The velocities of atoms were set and an additional 10 ps simulation was performed using microcanonical NVT (constant volume and temperature). Following this thermal equilibration (i.e., no change in the various properties of the system over time), Xe atoms were sequentially inserted one by one every 10 ps into the Xe bubble center of mass until 50 Xe atoms were contained in the bubble. After inserting each Xe atom, to avoid introducing artificial energy into the system resulting from atoms placed too close together, the system energy was minimized using the conjugate gradient (cg) and then simulated under NVT conditions for 10 ps at 1000 K and 2000 K.
3. Results
3.1. Formation Energy and Diffusion Behavior of a Single Xe Atom at the GB
The interaction between Xe atoms and the microstructure of UO2 fuel is key in fission-gas release. To simulate the redistribution of fission gas atoms in the UO2 microstructure, the interaction range between fission gas atoms and GB must be determined first, to determine the stable structure of migrated Xe atoms at the GB. We calculated the formation energy of a single Xe atom at different positions from the Σ5(310) GB.
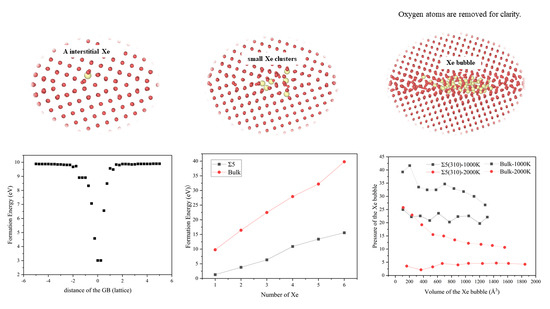
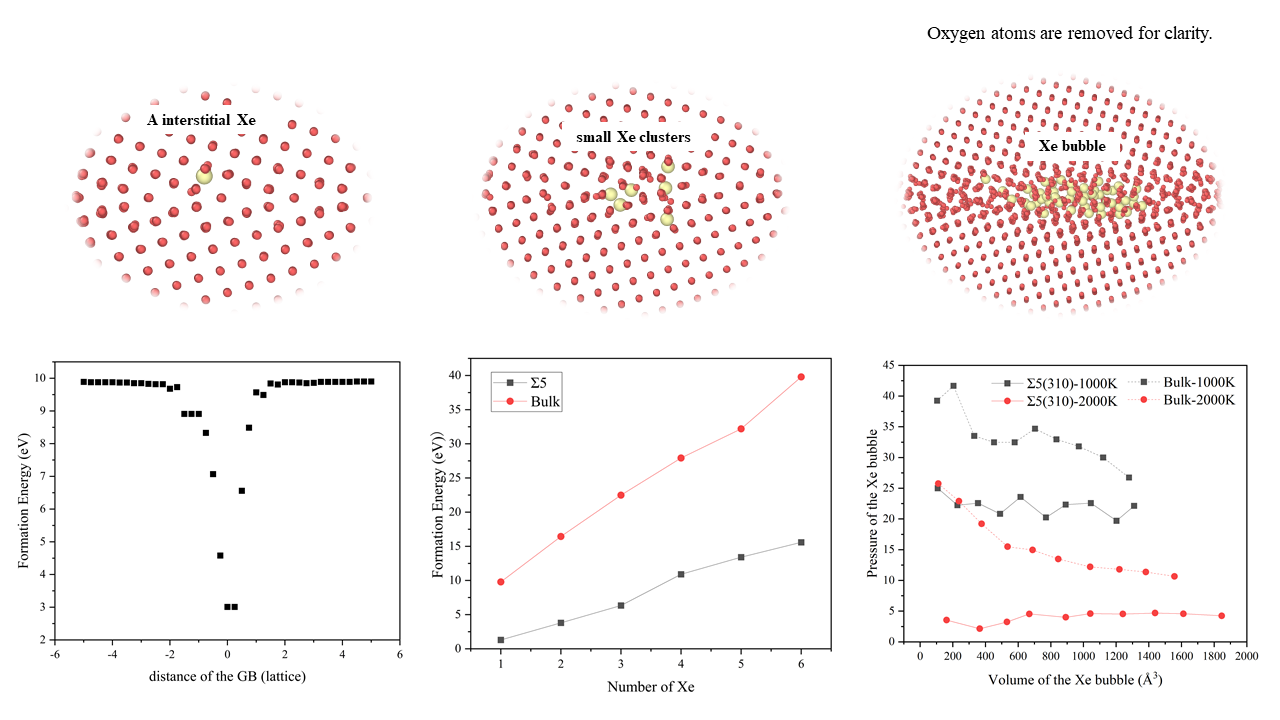
There are two distinct regions of a Xe interstitial atom near the GB, as indicated by E in Figure 2. The first region is located at a distance of more than 1.5 a0 for interstitial Xe, in which the energy is almost equal to the calculated formation energy of Xe interstitial atoms in the bulk (9.89 eV), indicating that the driving force for the segregation of Xe atoms to GB can be ignored. In the second region, where the distance is within 1.5 a0 from the GB, E decreases, having a maximum value of approximately 6.88 eV, which indicates that interstitial Xe can be absorbed by GB. Thus, the interaction range between Xe interstitial atom and GB is approximately 1.5 a0 from the plane of GB. Figure 2 also shows that the lowest energy point for interstitial Xe is located at the GB. Thus, it is energetically favourable for interstitial Xe to be absorbed by the GB region.
The behavior of fission gas in nuclear fuel is the main factor that determines the change in radiation swelling with fuel consumption. Therefore, it is necessary to study the migration of fission gas in UO2 GB.
Herein, we calculated the migration of an interstitial Xe atom in UO2 GB using NEB, i.e., a direct hopping mechanism from one octahedral site to another. NEB showed an energy barrier of 3.87 eV. Thus, whether migration is along or perpendicular to the GB direction, the calculated energy barrier is high. These results suggest that the migration of Xe between the two interstitial sites is not the main mechanism due to the higher energy barrier [51]. The relatively high energy barrier is mainly attributed to the lattice deformation caused by Xe movement between two adjacent interstitial sites, indicating that the octahedral interstitial position in UO2 is highly strained and, therefore, energetically unfavourable [52,53].
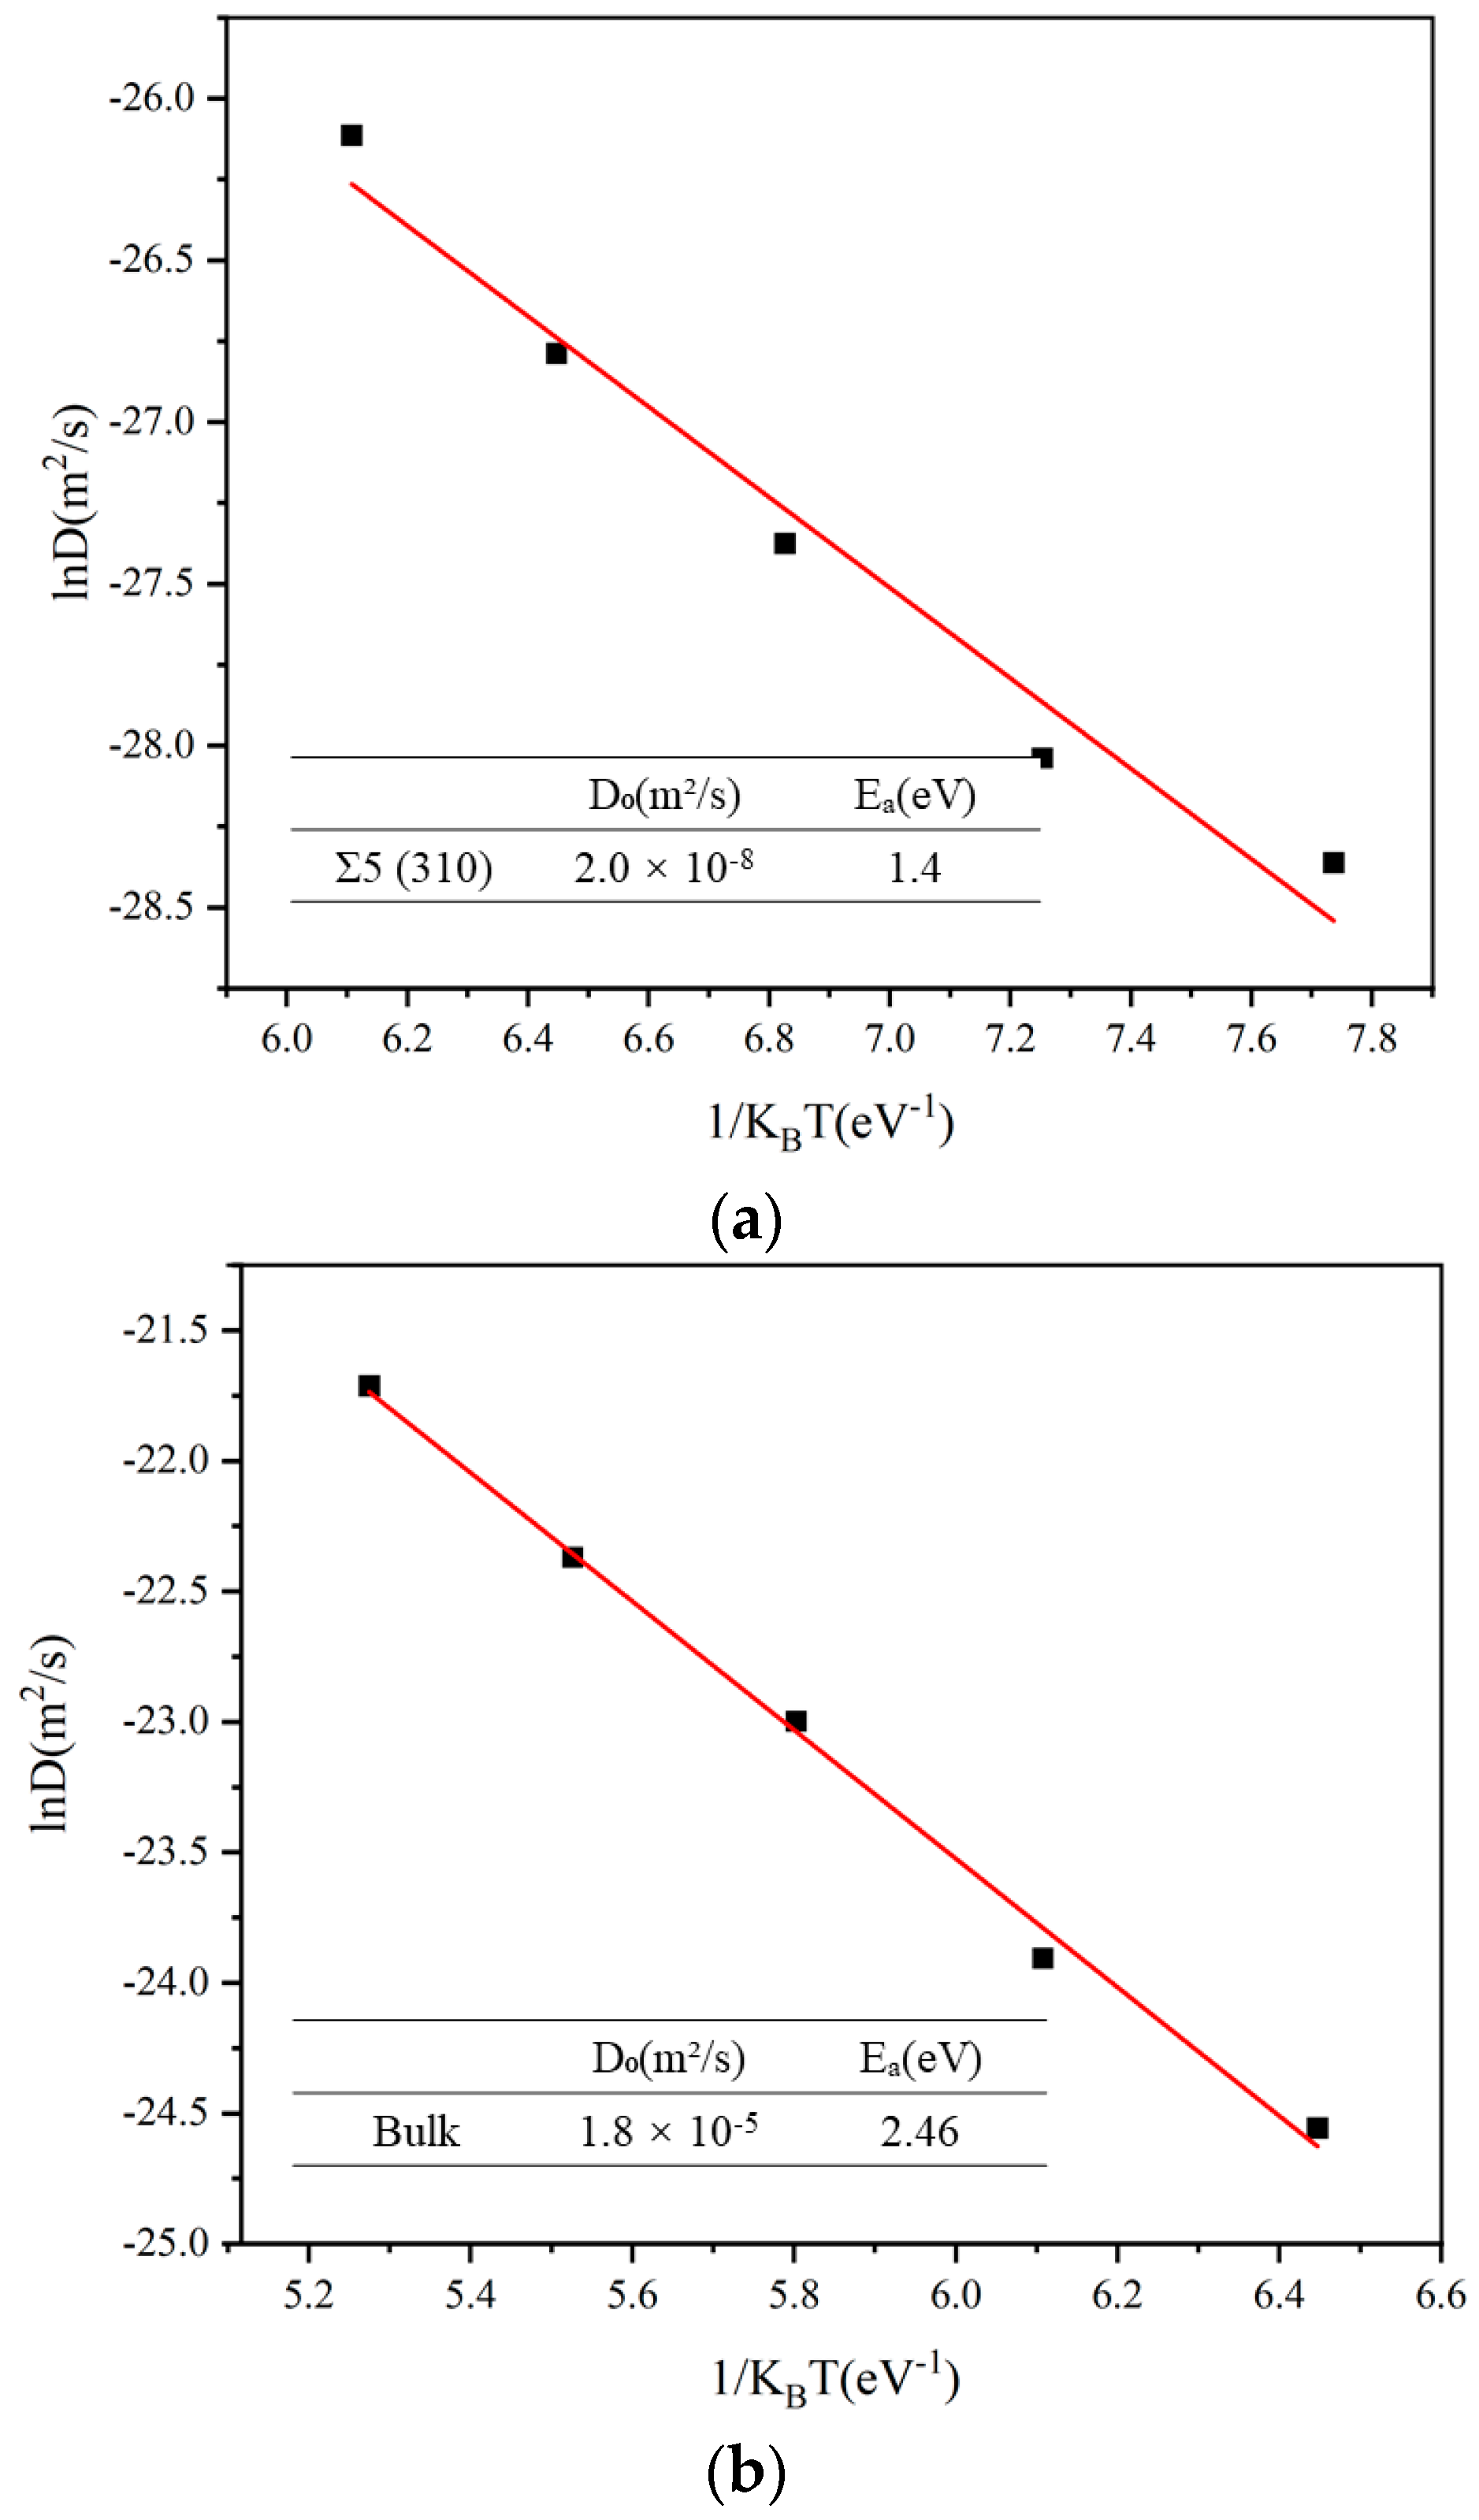
In addition to NEB, we employed the MSD method to calculate the diffusion coefficients and diffusion energy barriers of a single Xe atom at the GB. A long simulation time and a short distance between the position were employed to obtain information on the atomic position. The results were obtained by dividing the tracks of the MSD and averaging them several times. As shown in Figure 3, we calculated the diffusion coefficient and diffusion energy barrier separately at the GB and in the bulk. The diffusion energy barrier of the Xe atoms at the GB was 1.40 eV and that in the bulk was 2.46 eV. The magnitude of the preexponential factor was used to describe the ease of diffusion of a Xe atom. We conclude that Xe atom diffuse more easily at the GB than in the bulk.
The diffusion barrier calculated using MSD and the migration barrier calculated using NEB are different. When NEB was used, the single Xe atom showed a high energy barrier in the interstitial site, which is consistent with that of the bulk. However, the calculation results with MSD are different. This is because Xe may not diffuse directionally in UO2. The temperature accelerated dynamics simulations revealed that the dynamics of defect clusters strongly depends on their size and the diffusion direction is not one-dimensional [54].
3.2. Formation Energies of Small Xe Clusters at the GB
We calculated the formation energies of Xe atoms and atomic clusters at the GB and compared them with those in the bulk. The formation energies of Xe atoms at the GB are shown in Table 2. The formation energy of the Xe bubble is defined as:
where is the total energy of the simulation supercell containing n Xe atoms in the bubble, is the total energy of the supercell without bubbles and is the isolated Xe atom energy, which was set to zero. As shown in Table 2, the energy of a single Xe interstitial atom at the GB was 1.3 eV, whereas that in the bulk it was 9.79 eV. The total energy difference (ΔE) was 8.49 eV. As the number of Xe atoms increases, ΔE increases. Whether at the GB or the bulk, the formation energy increases with an increase in the number of Xe atoms. At all stages, the formation energy of Xe clusters at the GB is smaller than that in the bulk, indicating that Xe bubbles are easier to form at the GB than in the bulk. This is because Xe atoms are at the GB plane, which improves the energy compared to that in the bulk. Similar to previous results [8], at smaller bubble sizes (1–5 Xe atoms), the Xe bubble nucleus at the GB has a much lower formation energy than that of bubbles in the bulk with a similar size.
3.3. Nucleation of Xe Bubbles at the GB
Early-stage nucleation and growth of Xe bubbles were simulated using the MD method. We simulated the nucleation and growth of Xe bubbles at 1000 and 2000 K. When the system reached a thermodynamic equilibrium after relaxing the system at a given temperature and volume, Xe atoms were regularly added to the bubble. For each Xe atom added, the system needed 10 ps to relax, to ensure there was no change in the properties of the system over time, i.e., the equilibrium state was reached. Thus, the Xe bubble growth was simulated until the bubbles could contain 50 Xe atoms.
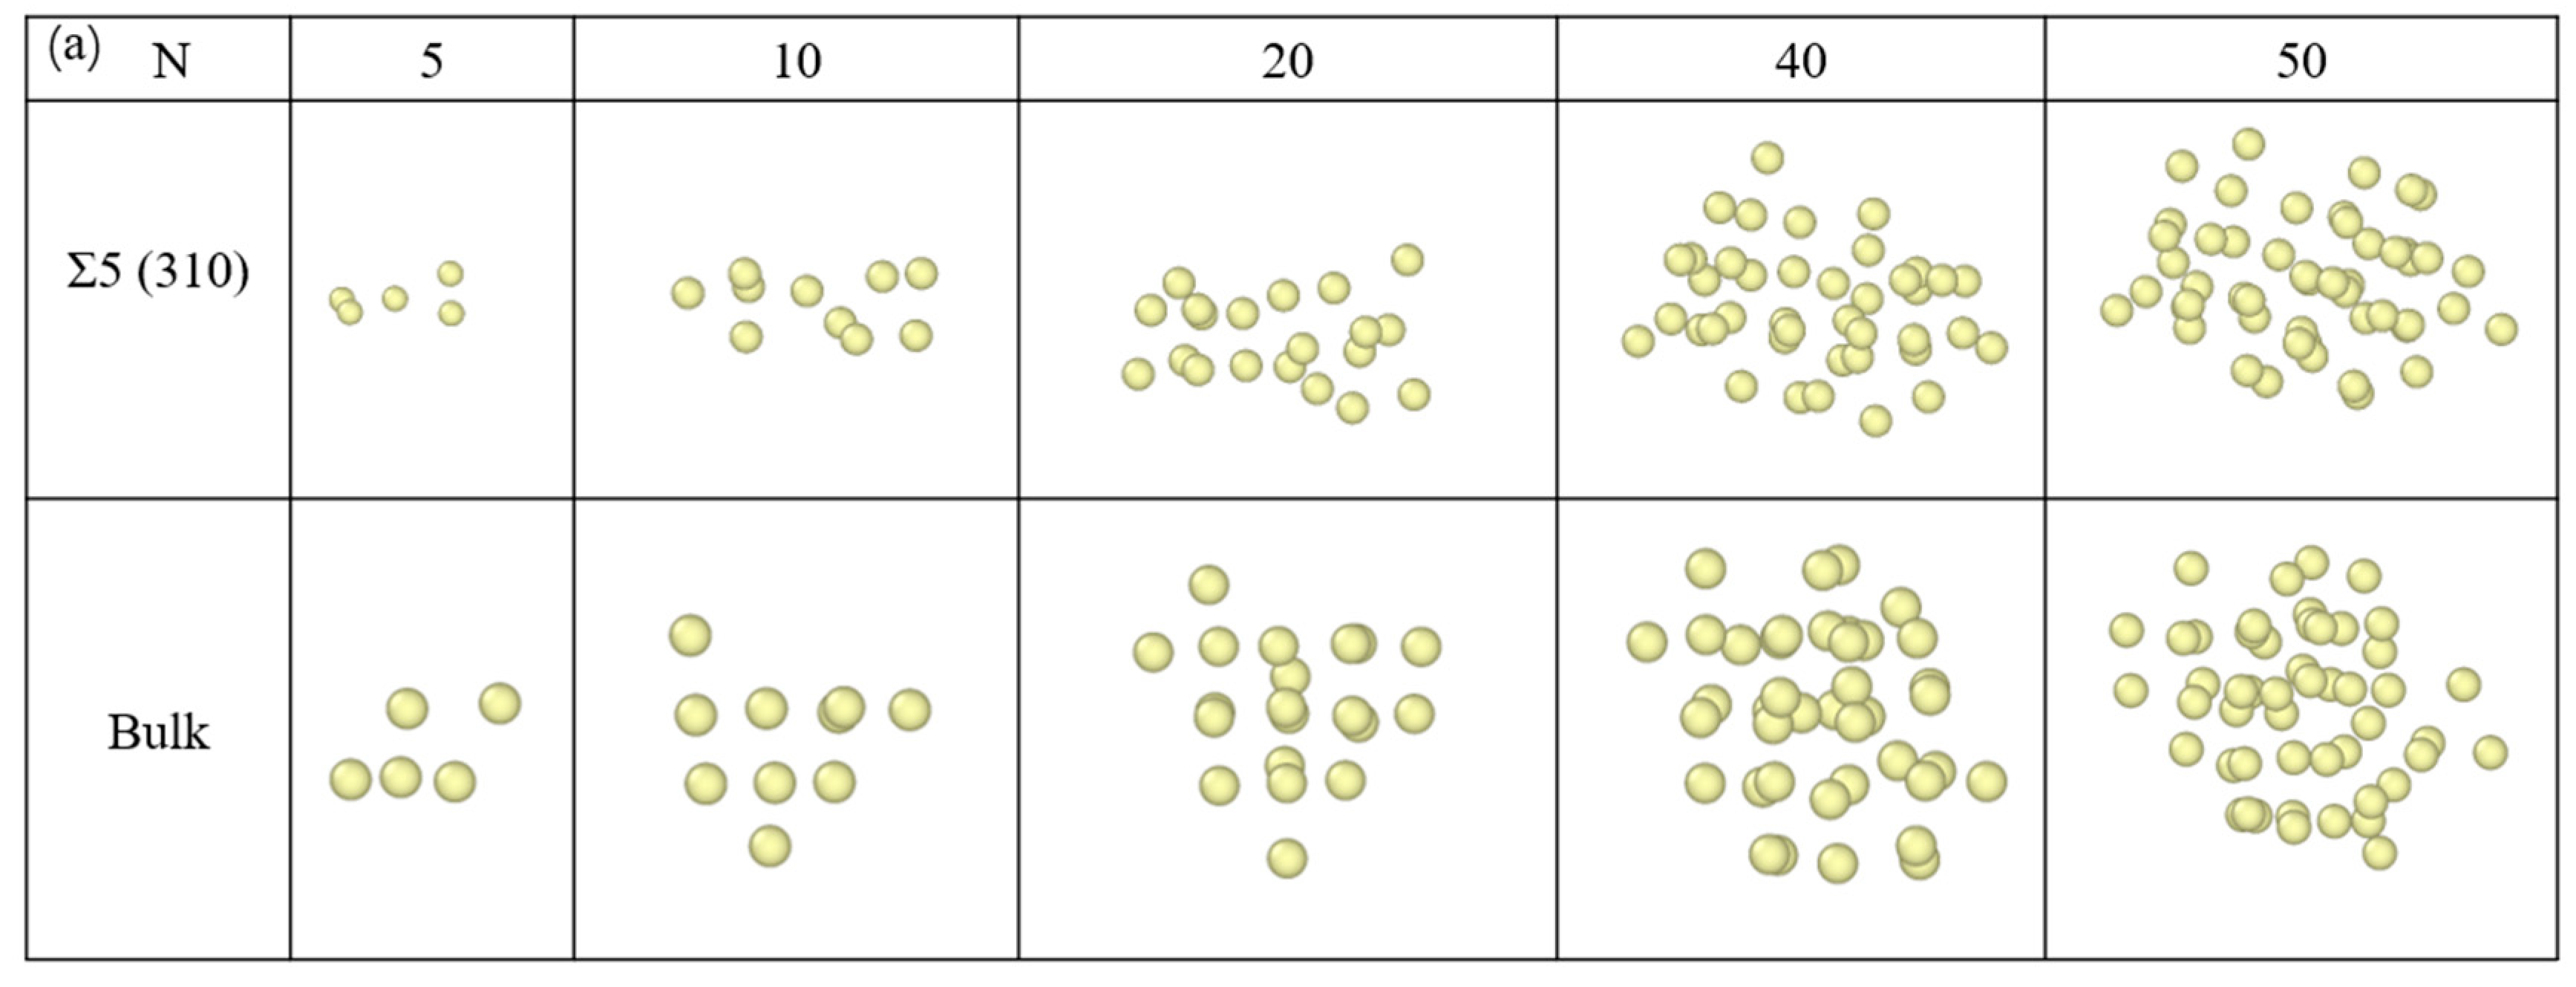
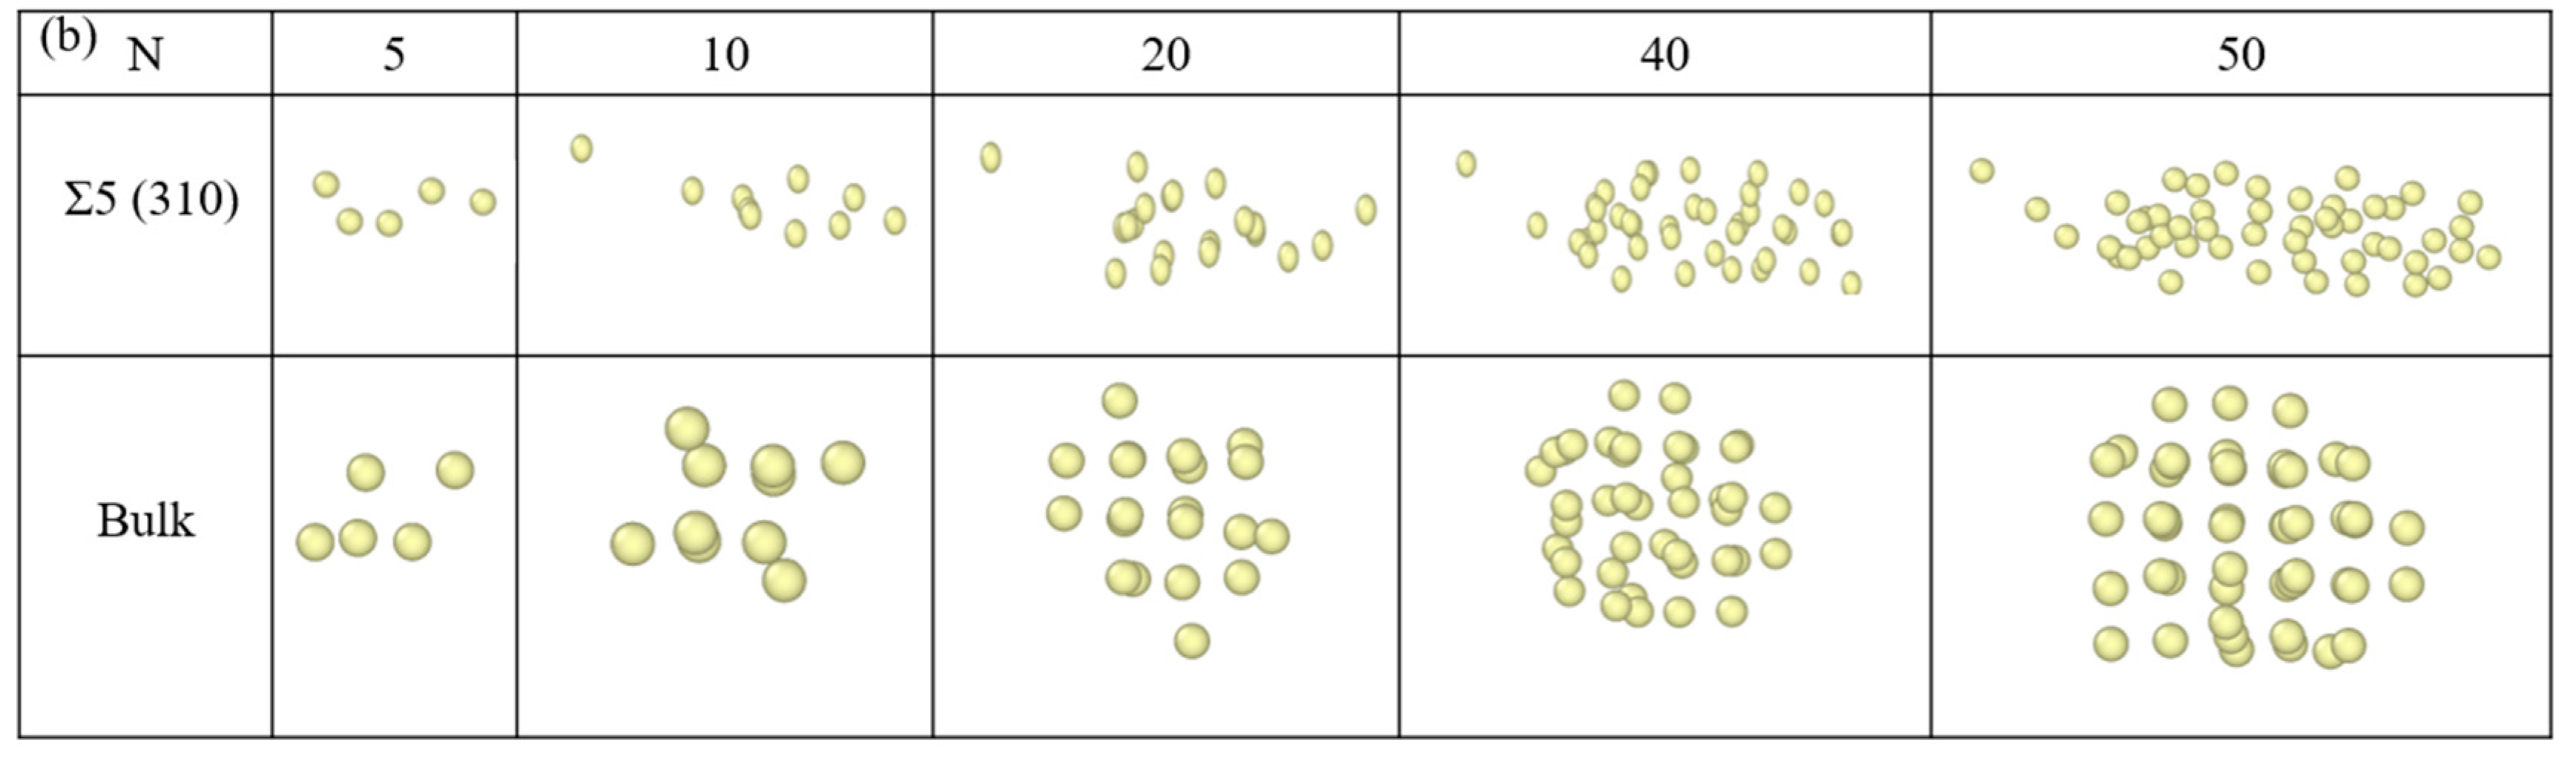
Figure 4 lists the differences in the nucleation configurations of Xe bubbles at the Σ5(310) GB and the bulk. At 2000 K, Xe atoms were more regular in the bulk (Figure 4b). This is consistent with a previous report [3], which showed that Xe bubbles evolve into a glassy/amorphous state, a nearly face-centred cubic (FCC) solid structure and subsequently to a high density amorphous or glassy state. At the GB, Xe atoms are absorbed by the GB and multiple Xe atoms form a planar structure, which is similar to the case of rhenium (Re) atoms in metals [55]. The results are consistent with the figure showing the formation energies of an interstitial Xe at the GB. However, comparing the configurations at 1000 K, as shown in Figure 4a, we found that at a smaller bubble size (20 Xe atoms), Xe atoms at the GB remain at the GB plane. However, with the growth of Xe bubbles, most Xe atoms in the larger bubbles are located in the bulk-like region away from the GB plane. This is attributed to the increase in temperature, which causes a change in the lattice constant and the reconstruction of the GB. An increase in temperature decreases the interfacial energy and it is easy to form segregation at the GB, where the energy of Xe atoms in the bulk is higher than that of the atoms at the GB. Thus, Xe atoms spontaneously converge toward the GB.
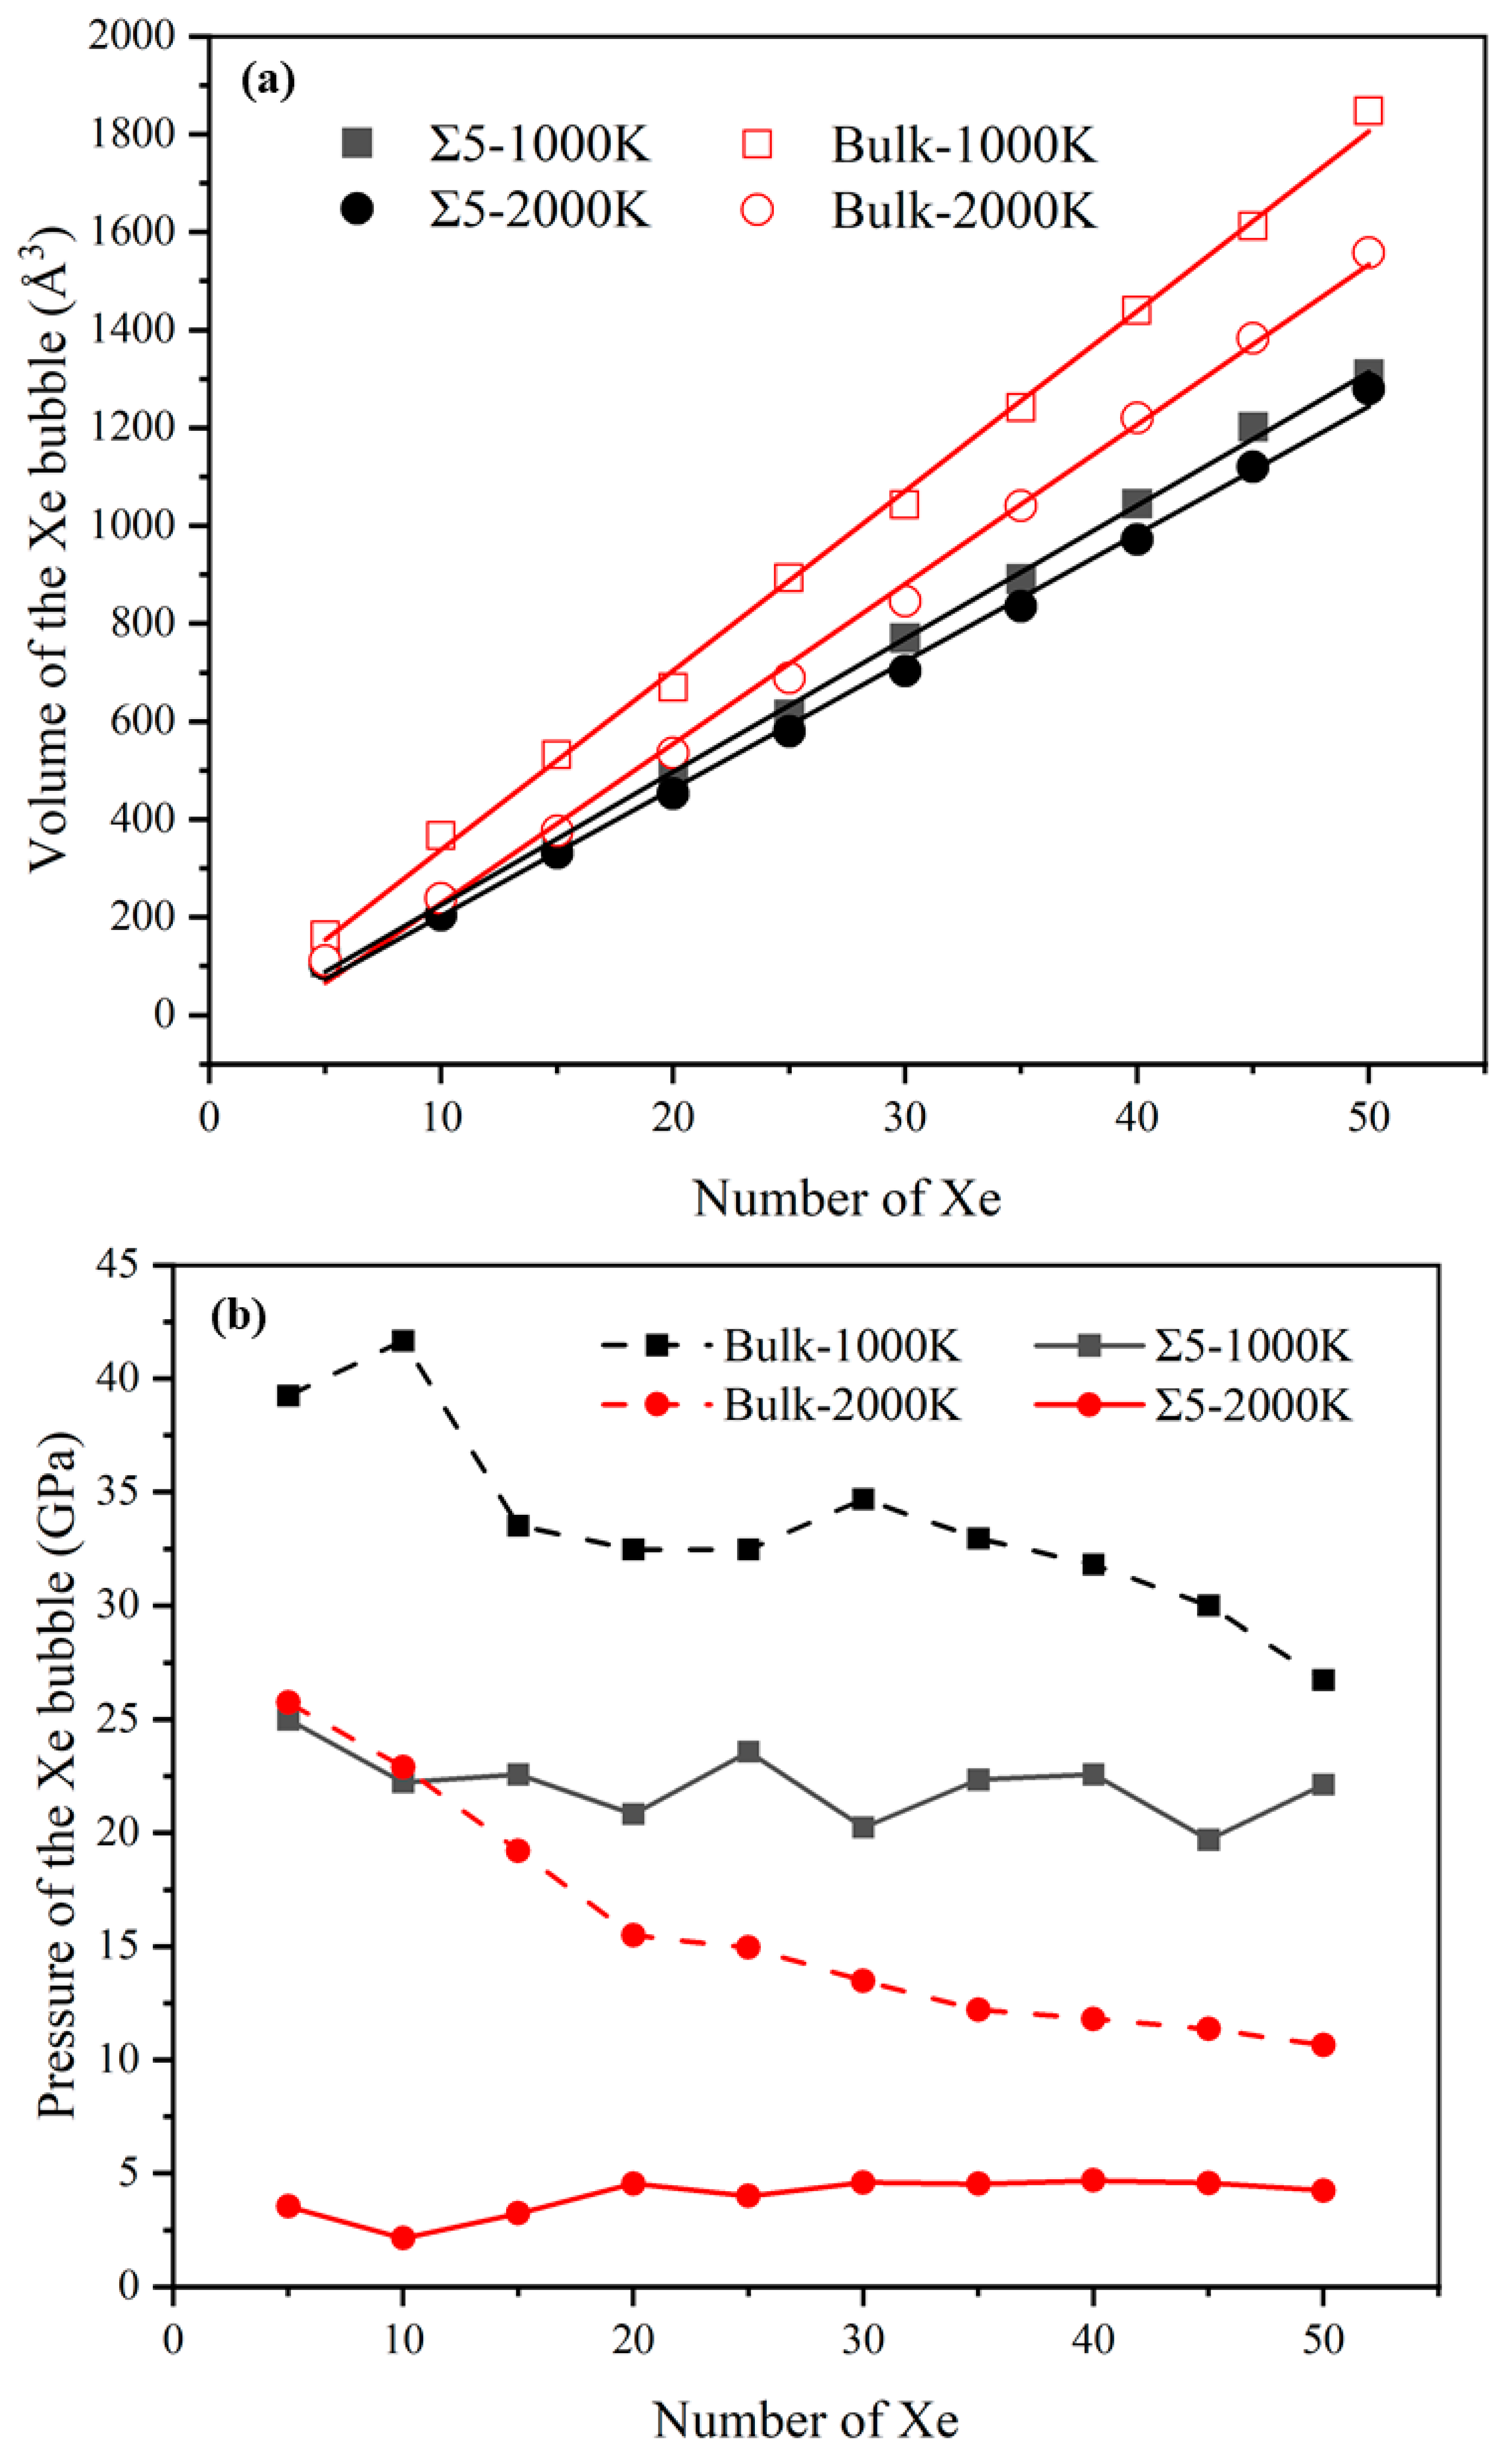
Next, to analyze the characteristics of Xe bubbles, the volume (V) and pressure (P) of the bubbles after inserting each Xe atom were calculated. Figure 5 shows the relationship between the volume and pressure of Xe bubbles and the number of Xe atoms in the bubble. The inset of Figure 5a shows that the volume of Xe bubbles increases with an increase in temperature and, during bubble growth, the volume of Xe bubbles increases approximately linearly with an increase in the number of Xe atoms. However, at the same temperature, the volume of Xe bubbles at the GB is higher than that of the bubbles in the bulk. This is because GBs are surface defects in solid materials and there are many defects, such as vacancies, at the GBs. Thus, under the same conditions, the volume of Xe bubbles at the GB is larger than that of the bubbles in the bulk. Also, it reflects the influence of temperature on the volume of Xe bubbles, which is attributed to the increase in temperature, which changes the lattice constant and the reconstruction of GBs [19]. At 2000 K, the Σ5(310) GB consists of a more distorted triangular pattern, the middle gap is larger and the lattice constant increases. In Figure 5b, at the GB, the pressure of the Xe bubble is initially quite high and then drops with increasing Xe concentration until the number of Xe atoms reaches 10. When there are more Xe atoms in the bubbles, the pressure increases with an increase in the number of Xe atoms, which is consistent with that of Xe in the UO2 bulk [4,8]. Then, with an increase in bubble growth, the bubble pressure generally decreases with some fluctuations involving several peaks and drops. This is because the bubbles may be far from the equilibrium, from which they grow because of rapid changes in temperature or insufficient local lattice vacancies [56]; thus, the smallest bubbles have a very high pressure, which results in a density comparable to that of solid Xe [57]. For larger bubbles, the density and pressure are relatively low. Experiments have shown that at the very early stages of bubble development, the bubble density is high with little evidence of deviation from circular bubbles. However, extensive bubble coalescence can greatly reduce the density of bubbles [58]. Under the same conditions, the pressure of Xe bubbles at the GB is less than that of the bubbles in the bulk. The internal pressure of Xe bubbles depends on not only the external stress on UO2 but also the surface tension of the bubble voids [56].
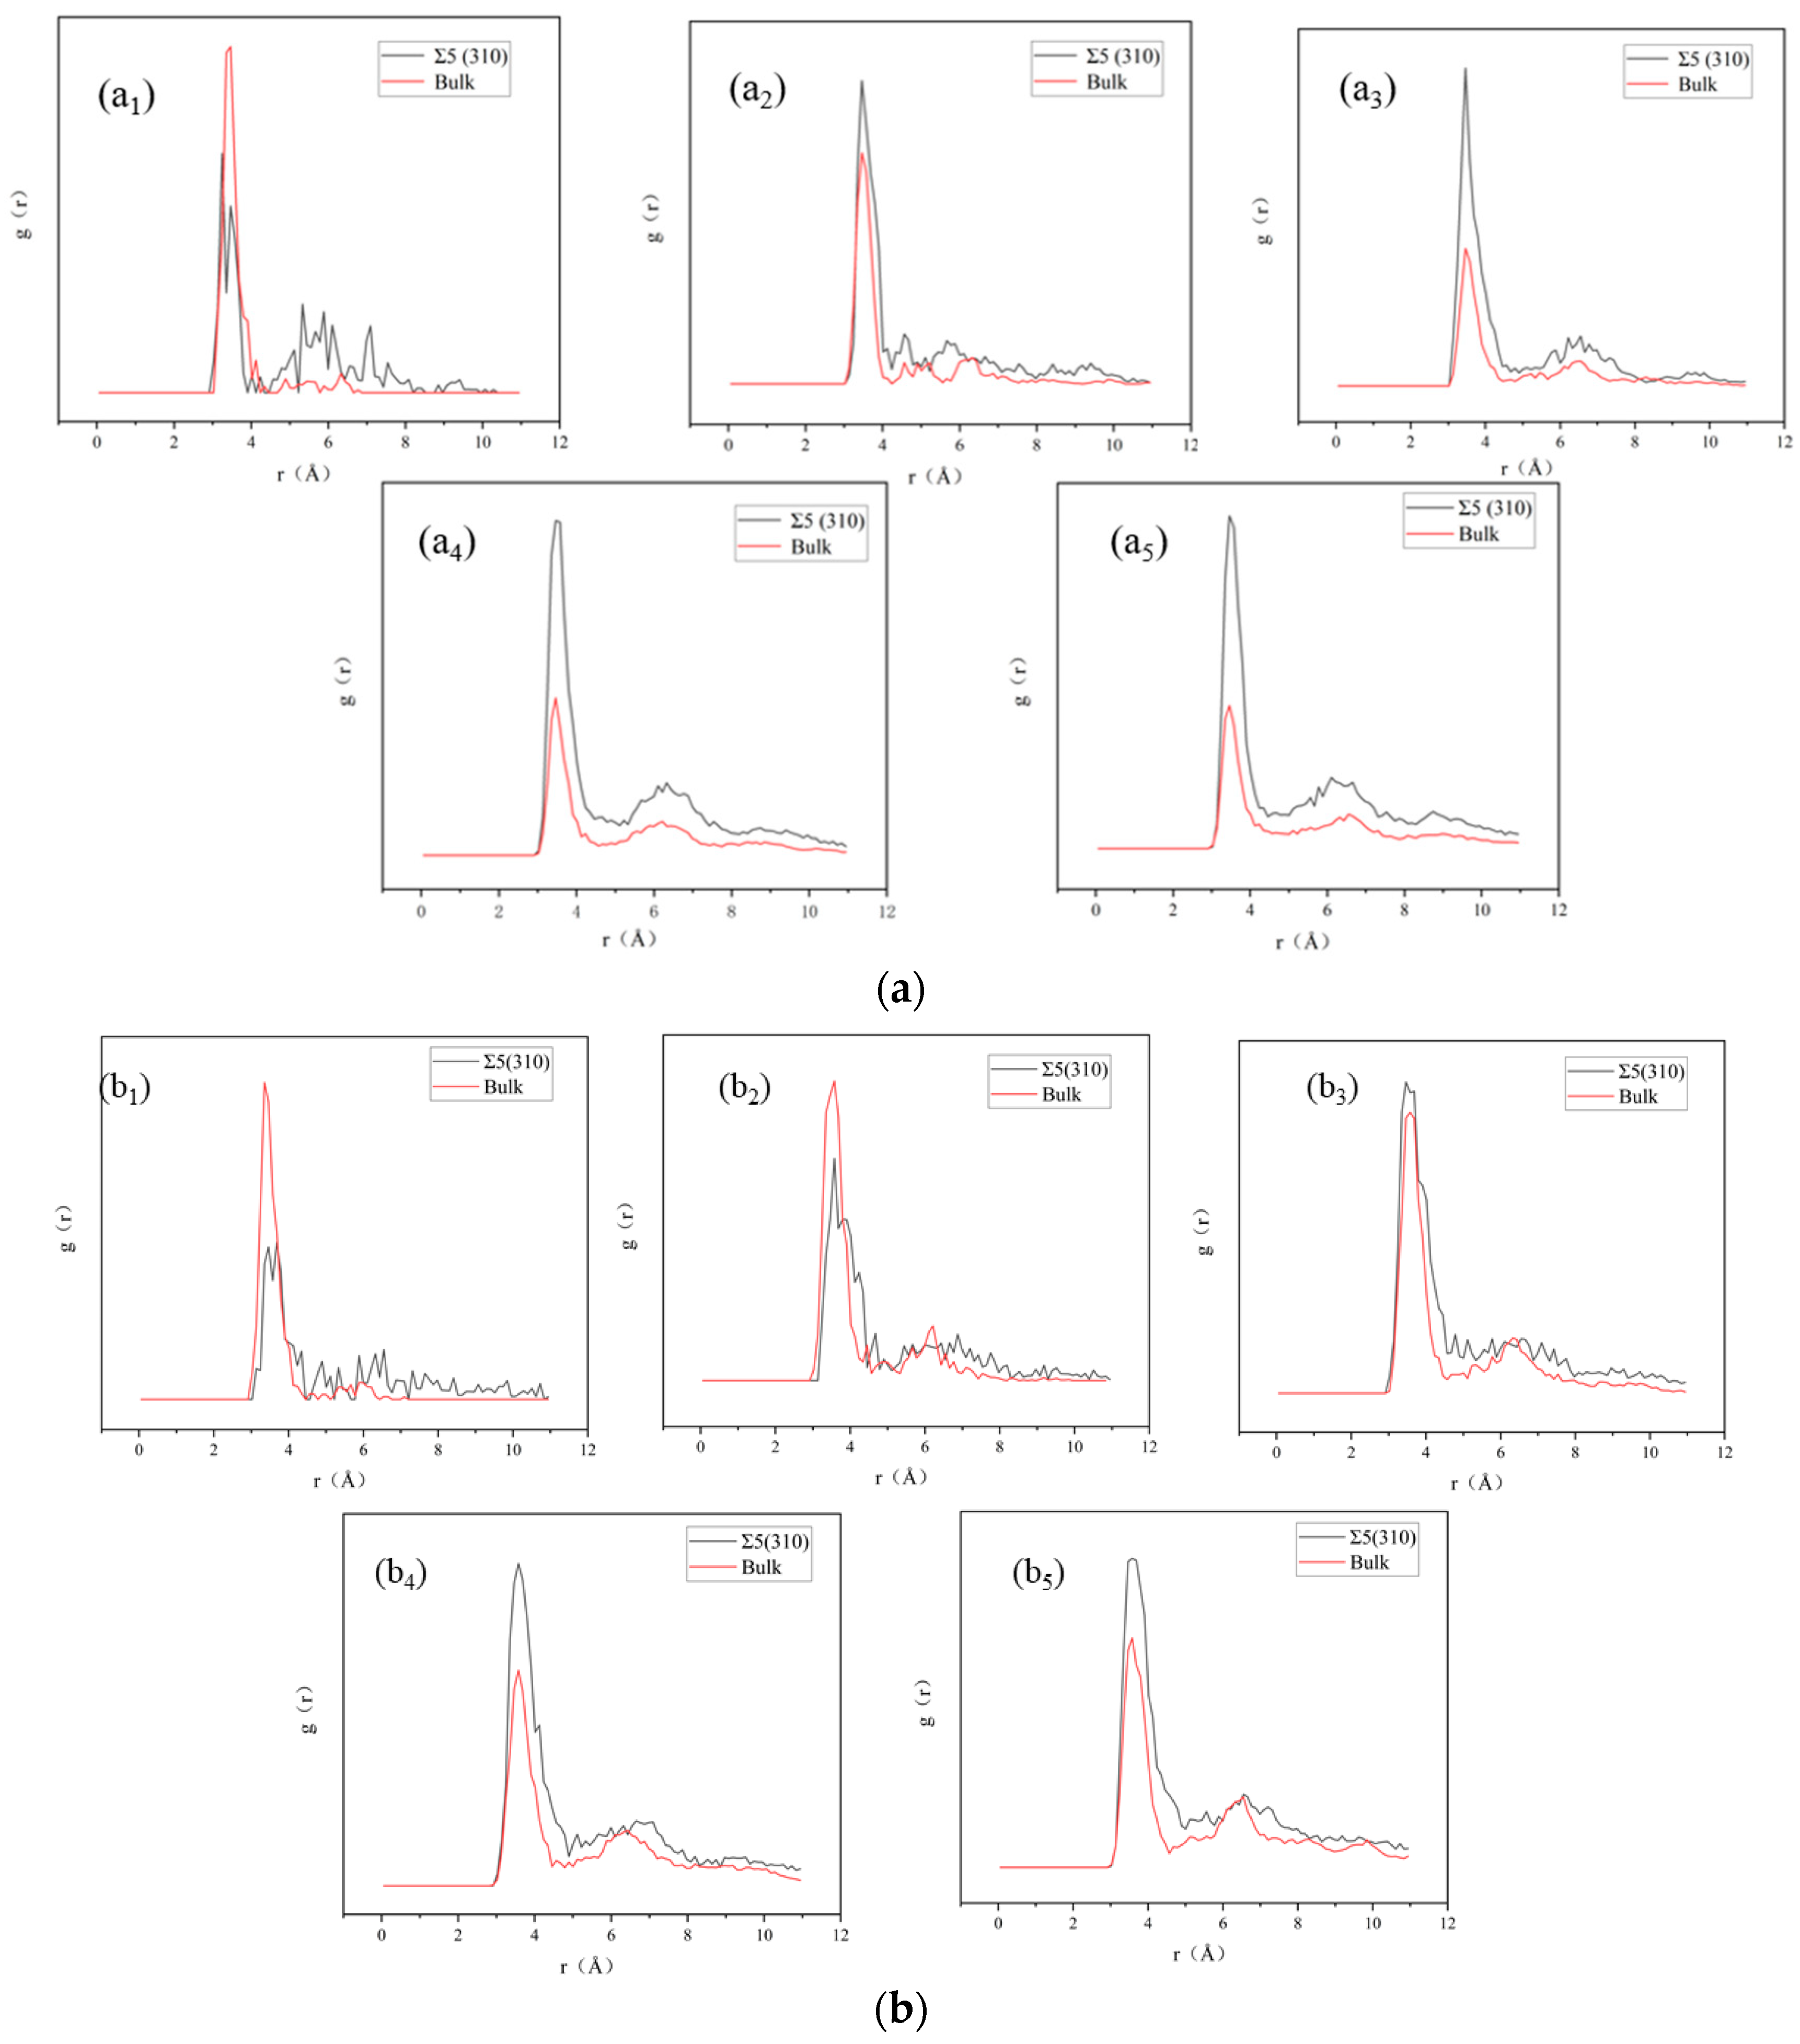
In addition to volume and pressure, we evaluated the configuration of Xe bubbles at 1000 and 2000 K. Snapshots of the radial distribution function of Xe atoms at 1000 and 2000 K are shown in Figure 6. To avoid thermal fluctuations at 1000 and 2000 K, the positions of Xe atoms were obtained by taking an average total time of 50 ps before inserting the next Xe atom into the bubble. As shown in Figure 6, the peak is smaller and fuzzy at high temperatures because the atomic amplitude is large at high temperatures; thus, it is easy to deviate from the equilibrium position and approach the liquid state. With an increase in Xe atoms, Xe in the bubble evolves into a glassy/amorphous state, indicating that the behavior of Xe atoms in UO2 is similar to that of a system with a hard spherical liquid in a solid. This observation is consistent with the results of Geng et al. [32]. For smaller bubbles (1–5 Xe atoms), the distribution of Xe atoms at the GB is more dispersed than that in the bulk, which also shows that Xe atoms at the GB diffuse more easily than those in the bulk, according to the MSD results. In the bulk, there is only one peak of Xe atoms at the beginning, indicating the uniform distribution of Xe atoms in the UO2 matrix. With an increase in Xe atoms, the first peak gradually grows and the second peak appears, indicating the formation of Xe clusters and the emergence of the second layer of atoms in the clusters.
4. Conclusions
In this study, MD and static simulations were employed to investigate the energy and diffusion of a single Xe atom and small Xe clusters and the nucleation and growth of Xe bubbles at the UO2 Σ5(310) GB. The results show that the formation energies of single Xe atoms and small Xe clusters at the GB are much lower than those in the bulk, indicating that impure Xe atoms are more stable at the GB and can precipitate into clusters. The diffusion activation energy of a single interstitial Xe atom at the GB is approximately 1 eV lower than that in the bulk. The energy barrier for interstitial Xe atoms to diffuse through the interstitial mechanism is high, which is mainly due to lattice deformation caused by the movement of Xe between two adjacent interstitial sites. The growth of Xe bubbles at the GB was simulated by sequentially inserting Xe atoms into a pre-existing Xe bubble. Then, the bubble volume and pressure were estimated for different numbers of Xe atoms. The pressure dropped with an increase in temperature, whereas the volume increased. At low Xe concentrations, the Xe bubble volume increased approximately linearly with an increase in the number of Xe atoms. We also compared the configurations of Xe atoms at the GB and in the bulk at the same temperature and found that Xe atoms are more regular in the bulk, whereas, at the GB, multiple Xe atoms form a planar structure.
Author Contributions
Conceptualization, H.D.; Investigation, Y.X.; Methodology, Y.X., Z.W., L.W. (Li Wang), Y.C., Z.L., Q.W. and L.W. (Lu Wu); Validation, Y.X., Z.W., L.W. (Li Wang), Y.C., Z.L., Q.W. and L.W. (Lu Wu); Formal analysis, Y.X., L.W. (Li Wang), Y.C. and Z.L.; Resources, Z.W., Z.L., Q.W., L.W. (Lu Wu) and H.D.; Writing—original draft, Y.X.; Writing—review & editing, Y.X. and H.D.; Supervision, H.D. All authors have read and agreed to the published version of the manuscript.
Funding
This research received no external funding.
Institutional Review Board Statement
Not applicable.
Informed Consent Statement
Not applicable.
Data Availability Statement
Data sharing is not applicable to this article.
Conflicts of Interest
The authors declare no conflict of interest.
References
- International Atomic Energy Agency. Thermophysical Properties Database of Materials for Light Water Reactors and Heavy Water Reactors; IAEA TECDOC Series No. 1496; International Atomic Energy Agency: Vienna, Austria, 2006. [Google Scholar]
- Turnbull, J. The distribution of intragranular fission gas bubbles in UO2 during irradiation. J. Nucl. Mater. 1971, 38, 203–212. [Google Scholar] [CrossRef]
- Yang, L.; Wirth, B. Evolution of pressurized xenon bubble and response of uranium dioxide matrix: A molecular dynamics study. J. Nucl. Mater. 2021, 544, 152730. [Google Scholar] [CrossRef]
- Xiao-Feng, T.; Chong-Sheng, L.; Zheng-He, Z.; Tao, G. Molecular dynamics simulation of collective behaviour of Xe in UO2. Chin. Phys. B 2010, 19, 057102. [Google Scholar] [CrossRef]
- Olander, D.R. Fundamental Aspects of nuclear Reactor Fuel Elements; TID-26711-Pl (Atomic Energy Commission, 1976); California University: Berkeley, CA, USA, 1976. [Google Scholar] [CrossRef]
- Jeon, B.; Asta, M.; Valone, S.M.; Gronbech-Jensen, N. Simulation of ion-track ranges in uranium oxide. Nucl. Instrum. Methods Phys. Res. Sect. B Beam Interact. Mater. At. 2010, 268, 2688–2693. [Google Scholar] [CrossRef] [Green Version]
- Govers, K.; Lemehov, S.; Verwerft, M. On the solution and migration of single Xe atoms in uranium dioxide–An interatomic potentials study. J. Nucl. Mater. 2010, 405, 252–260. [Google Scholar] [CrossRef]
- Liu, X.-Y.; Andersson, D. Molecular dynamics study of fission gas bubble nucleation in UO2. J. Nucl. Mater. 2015, 462, 8–14. [Google Scholar] [CrossRef] [Green Version]
- Nerikar, P.V.; Rudman, K.; Desai, T.G.; Byler, D.; Unal, C.; McClellan, K.J.; Phillpot, S.R.; Sinnott, S.B.; Peralta, P.; Uberuaga, B.P. Grain boundaries in uranium dioxide: Scanning electron microscopy experiments and atomistic simulations. J. Am. Ceram. Soc. 2011, 94, 1893–1900. [Google Scholar] [CrossRef]
- Ray, I.; Thiele, H. Transmission electron microscopy study of fission product behaviour in high burnup UO2. J. Nucl. Mater. 1992, 188, 90–95. [Google Scholar] [CrossRef]
- Djourelov, N.; Marchand, B.; Marinov, H.; Moncoffre, N.; Pipon, Y.; Nédélec, P.; Toulhoat, N.; Sillou, D. Variable energy positron beam study of Xe-implanted uranium oxide. J. Nucl. Mater. 2013, 432, 287–293. [Google Scholar] [CrossRef]
- Sabathier, C.; Vincent, L.; Garcia, P.; Garrido, F.; Carlot, G.; Thome, L.; Martin, P.; Valot, C. In situ TEM study of temperature-induced fission product precipitation in UO2. Nucl. Instrum. Methods Phys. Res. Sect. B Beam Interact. Mater. At. 2008, 266, 3027–3032. [Google Scholar] [CrossRef]
- Niemiec, M.; Gadomski, A.; Łuczka, J.; Schimansky-Geier, L. Phase transformation kinetics in d-dimensional grains-containing systems: Diffusion-type model. Phys. A Stat. Mech. Its Appl. 1998, 248, 365–378. [Google Scholar] [CrossRef]
- Gadomski, A. Kinetic Approach to the Nucleation-and-Growth Phase Transition in Complex Systems. Nonlinear Phenom. Complex Syst. Minsk. 2000, 3, 321–352. [Google Scholar]
- Tschopp, M.A.; Horstemeyer, M.; Gao, F.; Sun, X.; Khaleel, M. Energetic driving force for preferential binding of self-interstitial atoms to Fe grain boundaries over vacancies. Scr. Mater. 2011, 64, 908–911. [Google Scholar] [CrossRef] [Green Version]
- Lejcek, P. Grain Boundary Segregation in Metals; Springer Science & Business Media: Cham, Switzerland, 2010; Volume 136. [Google Scholar]
- Van Brutzel, L.; Vincent-Aublant, E. Grain boundary influence on displacement cascades in UO2: A molecular dynamics study. J. Nucl. Mater. 2008, 377, 522–527. [Google Scholar] [CrossRef]
- Zhang, Y.; Millett, P.C.; Tonks, M.R.; Bai, X.-M.; Biner, S.B. Molecular dynamics simulations of intergranular fracture in UO2 with nine empirical interatomic potentials. J. Nucl. Mater. 2014, 452, 296–303. [Google Scholar] [CrossRef]
- Williams, N.R.; Molinari, M.; Parker, S.C.; Storr, M.T. Atomistic investigation of the structure and transport properties of tilt grain boundaries of UO2. J. Nucl. Mater. 2015, 458, 45–55. [Google Scholar] [CrossRef]
- Liu, L.; Chen, Y.; Gao, N.; Hu, W.; Xiao, S.; Gao, F.; Deng, H. Atomistic simulations of the interaction between transmutation-produced Re and grain boundaries in tungsten. Comput. Mater. Sci. 2020, 173, 109412. [Google Scholar] [CrossRef]
- Gao, N.; Ghoniem, A.; Gao, X.; Luo, P.; Wei, K.; Wang, Z. Molecular dynamics simulation of Cu atoms interaction with symmetrical grain boundaries of BCC Fe. J. Nucl. Mater. 2014, 444, 200–205. [Google Scholar] [CrossRef]
- Li, X.; Liu, W.; Xu, Y.; Liu, C.; Fang, Q.; Pan, B.; Chen, J.-L.; Luo, G.-N.; Wang, Z. An energetic and kinetic perspective of the grain-boundary role in healing radiation damage in tungsten. Nucl. Fusion 2013, 53, 123014. [Google Scholar] [CrossRef]
- Plimpton, S. Fast parallel algorithms for short-range molecular dynamics. J. Comput. Phys. 1995, 117, 1–19. [Google Scholar] [CrossRef] [Green Version]
- Govers, K.; Lemehov, S.; Hou, M.; Verwerft, M. Comparison of interatomic potentials for UO2. Part I: Static calculations. J. Nucl. Mater. 2007, 366, 161–177. [Google Scholar] [CrossRef]
- Cooper, M.; Rushton, M.; Grimes, R. A many-body potential approach to modelling the thermomechanical properties of actinide oxides. J. Phys. Condens. Matter 2014, 26, 105401. [Google Scholar] [CrossRef]
- Jelea, A.; Pellenq, R.-M.; Ribeiro, F. An atomistic modeling of the xenon bubble behavior in the UO2 matrix. J. Nucl. Mater. 2014, 444, 153–160. [Google Scholar] [CrossRef]
- Thompson, A.E.; Meredig, B.; Wolverton, C. An improved interatomic potential for xenon in UO2: A combined density functional theory/genetic algorithm approach. J. Phys. Condens. Matter 2014, 26, 105501. [Google Scholar] [CrossRef]
- Brillant, G.; Gupta, F.; Pasturel, A. Fission products stability in uranium dioxide. J. Nucl. Mater. 2011, 412, 170–176. [Google Scholar] [CrossRef]
- Chartier, A.; Van Brutzel, L.; Freyss, M. Atomistic study of stability of xenon nanoclusters in uranium oxide. Phys. Rev. B 2010, 81, 174111. [Google Scholar] [CrossRef]
- Yun, Y.; Kim, H.; Kim, H.; Park, K. Atomic diffusion mechanism of Xe in UO2. J. Nucl. Mater. 2008, 378, 40–44. [Google Scholar] [CrossRef]
- Basak, C.; Sengupta, A.; Kamath, H. Classical molecular dynamics simulation of UO2 to predict thermophysical properties. J. Alloy. Compd. 2003, 360, 210–216. [Google Scholar] [CrossRef]
- Geng, H.; Chen, Y.; Kaneta, Y.; Kinoshita, M. Molecular dynamics study on planar clustering of xenon in UO2. J. Alloy. Compd. 2008, 457, 465–471. [Google Scholar]
- Morelon, N.-D.; Ghaleb, D.; Delaye, J.-M.; Van Brutzel, L. A new empirical potential for simulating the formation of defects and their mobility in uranium dioxide. Philos. Mag. 2003, 83, 1533–1555. [Google Scholar]
- Cooper, M.; Kuganathan, N.; Burr, P.; Rushton, M.; Grimes, R.; Stanek, C.; Andersson, D. Development of Xe and Kr empirical potentials for CeO2, ThO2, UO2 and PuO2, combining DFT with high temperature MD. J. Phys. Condens. Matter 2016, 28, 405401. [Google Scholar] [CrossRef] [PubMed] [Green Version]
- Scheiber, D.; Pippan, R.; Puschnig, P.; Romaner, L. Ab initio calculations of grain boundaries in bcc metals. Model. Simul. Mater. Sci. Eng. 2016, 24, 035013. [Google Scholar] [CrossRef]
- Zheng, H.; Li, X.-G.; Tran, R.; Chen, C.; Horton, M.; Winston, D.; Persson, K.A.; Ong, S.P. Grain boundary properties of elemental metals. Acta Mater. 2020, 186, 40–49. [Google Scholar] [CrossRef] [Green Version]
- Watanabe, T. Grain boundary engineering: Historical perspective and future prospects. J. Mater. Sci. 2011, 46, 4095–4115. [Google Scholar] [CrossRef]
- Randle, V. Grain boundary engineering: An overview after 25 years. Mater. Sci. Technol. 2010, 26, 253–261. [Google Scholar] [CrossRef]
- Lee, S.B.; Sigle, W.; Kurtz, W.; Rühle, M. Temperature dependence of faceting in Σ5 (310)[001] grain boundary of SrTiO3. Acta Mater. 2003, 51, 975–981. [Google Scholar] [CrossRef]
- He, H.; Ma, S.; Wang, S. Survey of Grain Boundary Energies in Tungsten and Beta-Titanium at High Temperature. Materials 2021, 15, 156. [Google Scholar] [CrossRef]
- Borde, M.; Germain, A.; Bourasseau, E. Molecular dynamics study of UO2 symmetric tilt grain boundaries around [001] axis. J. Am. Ceram. Soc. 2021, 104, 2879–2893. [Google Scholar] [CrossRef]
- Galvin, C.O.; Cooper, M.W.D.; Fossati, P.; Stanek, C.R.; Grimes, R.W.; Andersson, D. Pipe and grain boundary diffusion of He in UO2. J. Phys. Condens. Matter 2016, 28, 405002. [Google Scholar] [CrossRef]
- Bourasseau, E.; Mouret, A.; Fantou, P.; Iltis, X.; Belin, R.C. Experimental and simulation study of grain boundaries in UO2. J. Nucl. Mater. 2019, 517, 286–295. [Google Scholar] [CrossRef]
- Stukowski, A. Visualization and analysis of atomistic simulation data with OVITO–the Open Visualization Tool. Model. Simul. Mater. Sci. Eng. 2009, 18, 015012. [Google Scholar] [CrossRef]
- Dillon, S.J.; Harmer, M.P. Multiple grain boundary transitions in ceramics: A case study of alumina. Acta Mater. 2007, 55, 5247–5254. [Google Scholar] [CrossRef]
- Sheppard, D.; Terrell, R.; Henkelman, G. Optimization methods for finding minimum energy paths. J. Chem. Phys. 2008, 128, 134106. [Google Scholar] [CrossRef] [Green Version]
- Henkelman, G.; Uberuaga, B.P.; Jónsson, H. A climbing image nudged elastic band method for finding saddle points and minimum energy paths. J. Chem. Phys. 2000, 113, 9901–9904. [Google Scholar] [CrossRef] [Green Version]
- Henkelman, G.; Jónsson, H. Improved tangent estimate in the nudged elastic band method for finding minimum energy paths and saddle points. J. Chem. Phys. 2000, 113, 9978–9985. [Google Scholar] [CrossRef] [Green Version]
- Rycroft, C.H.; Grest, G.S.; Landry, J.W.; Bazant, M.Z. Analysis of granular flow in a pebble-bed nuclear reactor. Phys. Rev. E 2006, 74, 021306. [Google Scholar] [CrossRef] [Green Version]
- Yang, L.; Gao, F.; Kurtz, R.J.; Zu, X.; Peng, S.; Long, X.; Zhou, X. Effects of local structure on helium bubble growth in bulk and at grain boundaries of bcc iron: A molecular dynamics study. Acta Mater. 2015, 97, 86–93. [Google Scholar] [CrossRef] [Green Version]
- Chen, D.; Gao, F.; Deng, H.-Q.; Liu, B.; Hu, W.-Y.; Sun, X. Migration of defect clusters and xenon-vacancy clusters in uranium dioxide. Int. J. Mod. Phys. B 2014, 28, 1450120. [Google Scholar] [CrossRef]
- Thompson, A.E.; Wolverton, C. First-principles study of noble gas impurities and defects in UO2. Phys. Rev. B 2011, 84, 134111. [Google Scholar] [CrossRef]
- Yun, Y.; Eriksson, O.; Oppeneer, P.M.; Kim, H.; Park, K. First-principles theory for helium and xenon diffusion in uranium dioxide. J. Nucl. Mater. 2009, 385, 364–367. [Google Scholar] [CrossRef]
- Ichinomiya, T.; Uberuaga, B.P.; Sickafus, K.E.; Nishiura, Y.; Itakura, M.; Chen, Y.; Kaneta, Y.; Kinoshita, M. Temperature accelerated dynamics study of migration process of oxygen defects in UO2. J. Nucl. Mater. 2009, 384, 315–321. [Google Scholar] [CrossRef]
- Zhang, B.; Li, Y.-H.; Zhou, H.-B.; Deng, H.; Lu, G.-H. Segregation and aggregation of rhenium in tungsten grain boundary: Energetics, configurations and strengthening effects. J. Nucl. Mater. 2020, 528, 151867. [Google Scholar] [CrossRef]
- Parfitt, D.C.; Grimes, R.W. Predicting the probability for fission gas resolution into uranium dioxide. J. Nucl. Mater. 2009, 392, 28–34. [Google Scholar] [CrossRef]
- Nogita, K.; Une, K. High resolution TEM observation and density estimation of Xe bubbles in high burnup UO2 fuels. Nucl. Instrum. Methods Phys. Res. Sect. B Beam Interact. Mater. At. 1998, 141, 481–486. [Google Scholar] [CrossRef]
- White, R.J. The development of grain-face porosity in irradiated oxide fuel. J. Nucl. Mater. 2004, 325, 61–77. [Google Scholar] [CrossRef]
Figure 1.
Structures of grain boundaries (GBs) simulated at (a) 1000 K and (b) 2000 K. Oxygen atoms are removed for clarity. The atoms in the GB and bulk regions are colored white and green, respectively.
Figure 1.
Structures of grain boundaries (GBs) simulated at (a) 1000 K and (b) 2000 K. Oxygen atoms are removed for clarity. The atoms in the GB and bulk regions are colored white and green, respectively.

Figure 2.
Formation energy of interstitial Xe as a function of the distance from the Σ5(310) GB.

Figure 3.
Diffusion coefficients of Xe (a) at the Σ5 GB and (b) in the bulk UO2. The lines are linear Arrhenius fits.
Figure 3.
Diffusion coefficients of Xe (a) at the Σ5 GB and (b) in the bulk UO2. The lines are linear Arrhenius fits.

Figure 4.
Comparison of the configurations bubbles at the Σ5(310) GB and bulk UO2 at (a) 1000 K and (b) 2000 K.
Figure 4.
Comparison of the configurations bubbles at the Σ5(310) GB and bulk UO2 at (a) 1000 K and (b) 2000 K.


Figure 5.
(a) Volume (Å3) and (b) pressure (GPa) of Xe bubbles as a function of the number of Xe atoms in the bubbles. The lines are linear Arrhenius fits.
Figure 5.
(a) Volume (Å3) and (b) pressure (GPa) of Xe bubbles as a function of the number of Xe atoms in the bubbles. The lines are linear Arrhenius fits.

Figure 6.
Radial distribution function of Xe atoms in Xe bubbles at (a) 1000 K and (b) 2000 K. The icons 1, 2, 3, 4 and 5 correspond to the number of Xe atoms 5, 10, 20, 40 and 50, respectively.
Figure 6.
Radial distribution function of Xe atoms in Xe bubbles at (a) 1000 K and (b) 2000 K. The icons 1, 2, 3, 4 and 5 correspond to the number of Xe atoms 5, 10, 20, 40 and 50, respectively.


Table 1.
Comparison of energy of xenon (Xe) point defects in uranium dioxide (UO2) bulk calculated using various interatomic potentials at 0 K. Charge corrections for charge defects were not considered in the calculations herein.
Table 1.
Comparison of energy of xenon (Xe) point defects in uranium dioxide (UO2) bulk calculated using various interatomic potentials at 0 K. Charge corrections for charge defects were not considered in the calculations herein.
| Basak/Geng | Morelon/Chartier | Basak/IPR | Morelon/IPR | CRG/IPR | CRG/Cooper | DFT | |
|---|---|---|---|---|---|---|---|
| 22.73 | 11.94 | 9.68 | 8.32 | 9.79 | 11.70 | 9.73 [27] 9.71 [28] 9.7–12.0 [26] | |
| 5.76 | 5.31 | 1.84 | 0.70 | 1.72 | 3.60 | 2.0–5.8 [26] 1.95 [28] | |
| 20.55 | 9.31 | 8.41 | 7.17 | 7.96 | 8.26 | 7.5–9.1 [26] 7.85 [28] | |
| 5.32 | 4.98 | 1.52 | 0.61 | 1.56 | 2.96 | 1.6 [26] 1.55 [28] | |
| 20.77 | Unstable | 11.89 | 10.76 | 10.29 | 12.27 | 11.33 [29] | |
| (1) | 4.82 | 4.33 | 0.91 | 0.48 | 0.95 | 1.99 | 1.06 [27] 1.2 [29] |
| (2) | 4.92 | 4.77 | 1.53 | 0.67 | 1.68 | 3.02 | 1.83 [27] 1.8 [29] |
| (3) | 5.02 | 4.70 | 1.81 | 0.65 | 1.89 | 3.45 | 1.94 [27] 2.3 [29] |
| 3.46 | 2.79 | 0.19 | 0.16 | 0.18 | 0.59 | 0.27 [27] | |
| 0.76 | 0.84 | 5.54 | 3.28 | 4.32 | 1.91 | 4.48 [30] |
Table 2.
Formation energies of Xe atoms at the GB and in the bulk UO2.
| N | 1 | 2 | 3 | 4 | 5 | 6 |
|---|---|---|---|---|---|---|
| (eV) | 1.3 | 3.8 | 6.34 | 10.91 | 13.41 | 15.59 |
| (eV) | 9.79 | 16.44 | 22.49 | 27.92 | 32.19 | 39.79 |
Publisher’s Note: MDPI stays neutral with regard to jurisdictional claims in published maps and institutional affiliations. |
© 2022 by the authors. Licensee MDPI, Basel, Switzerland. This article is an open access article distributed under the terms and conditions of the Creative Commons Attribution (CC BY) license (https://creativecommons.org/licenses/by/4.0/).
Share and Cite
MDPI and ACS Style
Xia, Y.; Wang, Z.; Wang, L.; Chen, Y.; Liu, Z.; Wang, Q.; Wu, L.; Deng, H. Molecular Dynamics Simulations of Xe Behaviors at the Grain Boundary in UO2. Metals 2022, 12, 763. https://doi.org/10.3390/met12050763
AMA Style
Xia Y, Wang Z, Wang L, Chen Y, Liu Z, Wang Q, Wu L, Deng H. Molecular Dynamics Simulations of Xe Behaviors at the Grain Boundary in UO2. Metals. 2022; 12(5):763. https://doi.org/10.3390/met12050763
Chicago/Turabian StyleXia, Yaping, Zhen Wang, Li Wang, Yangchun Chen, Zhixiao Liu, Qingqing Wang, Lu Wu, and Huiqiu Deng. 2022. "Molecular Dynamics Simulations of Xe Behaviors at the Grain Boundary in UO2" Metals 12, no. 5: 763. https://doi.org/10.3390/met12050763
Note that from the first issue of 2016, this journal uses article numbers instead of page numbers. See further details here.