Article

Study on Reduction of Partially Oxidized Cauliflower-like Copper Powder by Hydrogen

1
School of Metallurgy and Energy Engineering, Kunming University of Science and Technology, Kunming 650093, China
2
School of Metallurgical and Materials Engineering, Chongqing University of Science & Technology, Chongqing 401331, China
3
Kunming Metallurgical Research Institute, Kunming 650031, China
*
Authors to whom correspondence should be addressed.
Metals 2022, 12(3), 413; https://doi.org/10.3390/met12030413
Submission received: 6 January 2022 / Revised: 21 February 2022 / Accepted: 23 February 2022 / Published: 26 February 2022
(This article belongs to the Topic Recent Advances in Metallurgical Extractive Processes)

Abstract

:
The copper powder produced by electrolysis has a dendritic structure, which gives it excellent green strength as a raw material for producing powder metallurgical components. Yet its large specific surface makes it susceptible to oxidation. Although the oxidation tends to occur only on the surface, it still needs to be reduced. The partially oxidized cauliflower-like copper powder was reduced by hydrogen in this paper. Internal diffusion was found as the rate controlling step for the hydrogen reduction reaction, in which the apparent activation energy was determined to be 14.18 kJ/mol using the Arrhenius-based expression for the diffusion coefficient. Controlling copper powder particles were still compact after reduction, and the tips of dendrite arms became round and smooth. The apparent density decreased after reduction, but excess temperature led to sintering, and as a result, increased apparent density of metallic powder. Therefore, lower reduction temperature and appropriately long reduction times yielded better apparent density. These research results can provide reference for metallic powder plants.

1. Introduction

Copper powder is one of the most important basic raw materials in the powder metallurgy industry, which can be prepared by electrolysis, atomization, as well as chemical reduction [1,2,3]. The copper powder produced by the atomization is mostly spherical and irregular, while that obtained by chemical reduction is spherical, flaky, and irregular. The micromorphology of copper powder prepared by the electrochemical method is different because of electrolysis conditions (current density, electrolytic concentration, and time of powder collection, etc.) [4,5,6]. According to the development of branches, the micromorphology of copper powder particles can appear to be fishbone-like, corn-like, cauliflower-like, or arborescent, which has a direct effect on the apparent density of the powder [7,8].
From the perspective of industrial production, atomization has gradually become the main method of spherical copper powder, because of the relatively concise technology and large annual production. Alloy powder can be produced availably by atomization. The chemical method is limited by the complex process and has not been used in large-scale industrial applications of copper powder. Compared with atomization, although the electrochemical process is more complex, it is currently the only effective way to produce dendritic copper powder.
The developed dendritic copper powder particles are more susceptible to oxidation because of their larger specific surface area. Production of copper powder by electrolysis is mostly carried out in aqueous solutions of sulphuric acid and copper sulfate. The copper powder electrodeposited on the cathode plate is scraped down for collection after electrolysis for a period, which is then washed, dehydrated, and dried. In the above process, the copper powder will contact air and can be oxidized on the dendrite surface, even with anti-oxidation treatment after washing. These limited oxidations occur only on the surface of the copper powder. However, to ensure the purity and performance of copper powder, it still needs to be reduced so that its oxygen content is not greater than 0.1%. Reduction by hydrogen does not introduce additional impurities. Moreover, it does not produce greenhouse gases and is more environment-friendly compared with CO [9,10].
Copper oxides nucleate on the surface of the dendrite, which causes the dendrite arms to become brawnier, with smaller gaps between the dendrite arms. These changes have significant impacts on the apparent density of copper powder, which is a key indicator for the quality of metallic powders. It has been reported that the apparent density of copper powder diminishes after oxidation [11,12,13]. Jelić found that the volume of copper powder particles become significantly larger after reduction, which lead to changes in the apparent density and particle size of copper powder [12]. However, the changes of apparent density were not reported in detail. A partially oxidized commercial copper powder, produced by electrolysis, was reduced by hydrogen in this paper, in which the kinetics control of the reduction process, the surface morphology of the cauliflower-like copper powder, and the apparent density were investigated.

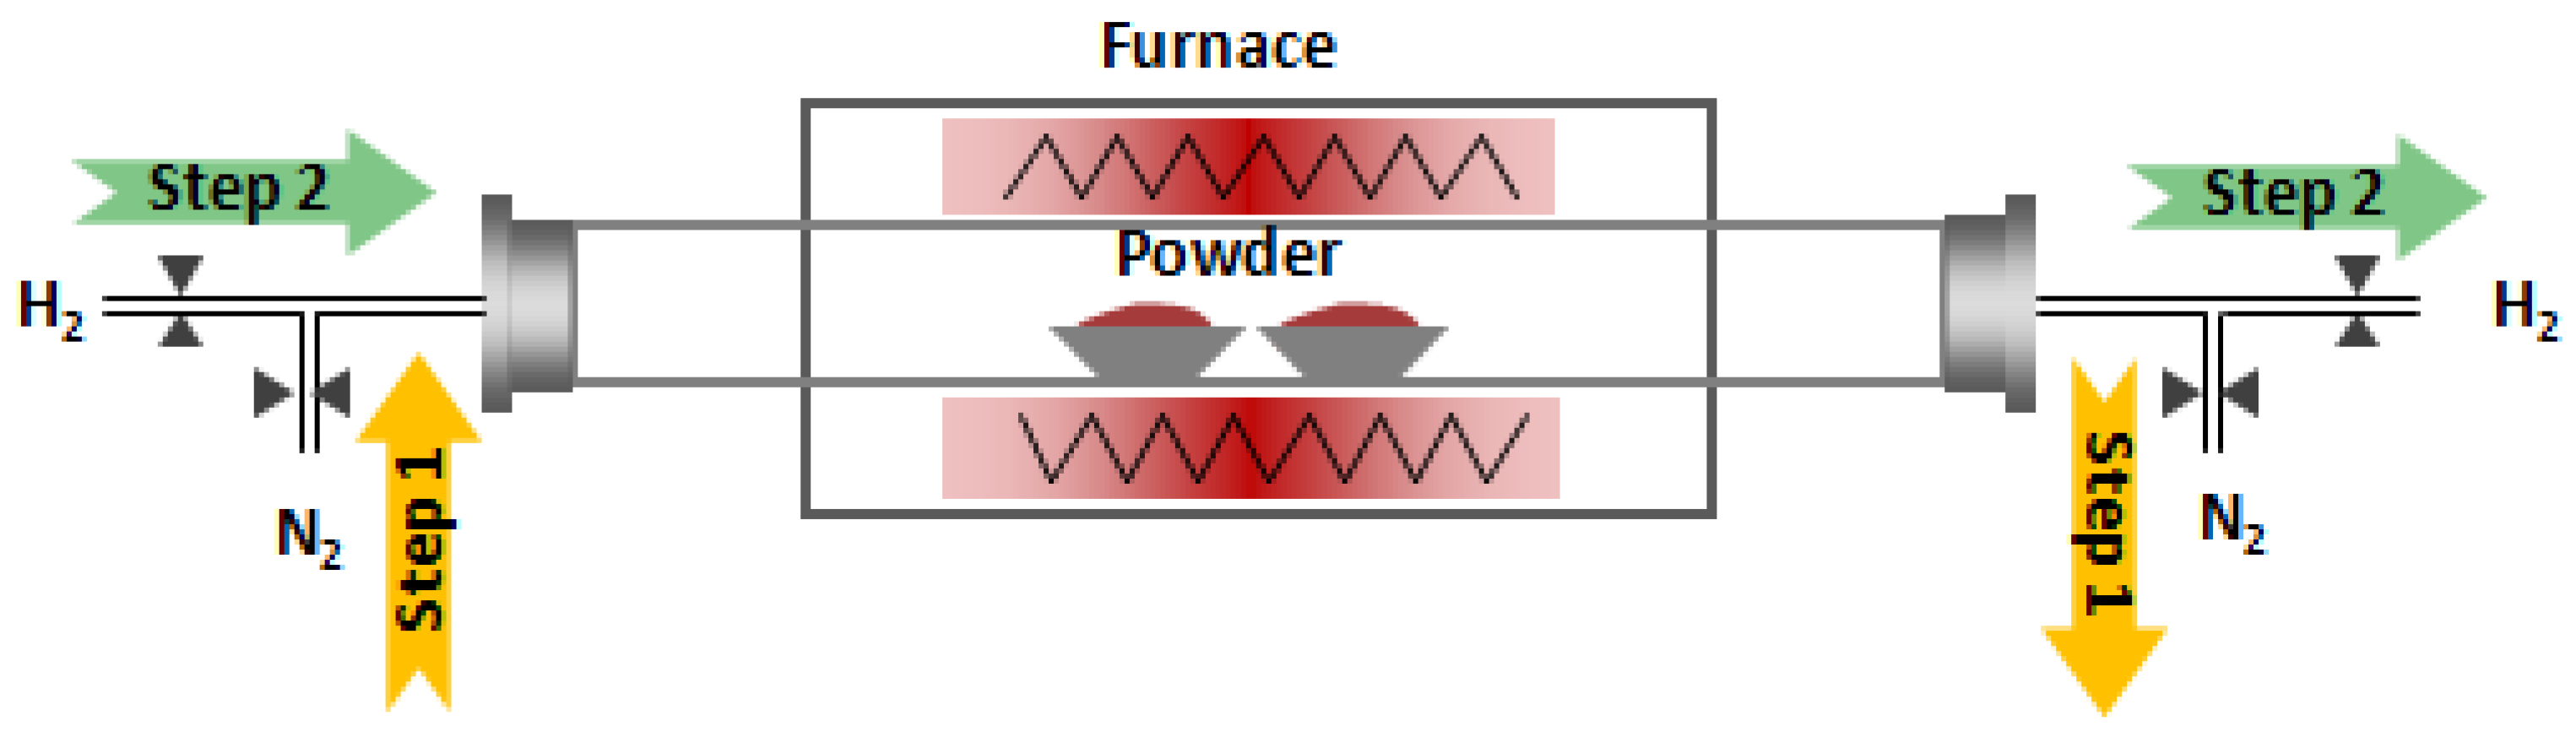
2. Materials and Methods

Copper powder used in this study was from a metallic powder manufacturer (Chongqing Youyan Heavy Metallurgy New Material Co., Ltd.) in Chongqing province of China, which was electrodeposited in the solution of copper sulfate and sulphuric acid. The copper powder was washed with deionized water after being scraped and then washed twice with soapy water and dried finally. During the above processes, the powder was partially oxidized, presenting a dark color. The X-ray diffraction (XRD, Smartlab-9, Rigaku Corporation, Tokyo, Japan) result is shown in Figure 1. Only Cu and CuO were present, and there were no other copper oxides. The apparent density of this sample was measured as 2.21 g cm−3 by the funnel method [3,14]. The powder flowed at a constant rate through a funnel into a measuring cup with a volume of 25 cm3, and then the apparent density was calculated through a mass of the powder over the volume of the cup.
Thermogravimetric analysis (TGA) is a common and essential method to measure the reaction rate, which is widely used to investigate the reduction of metallic oxide by hydrogen [10,11,12,13]. However, it is difficult to study the reduction kinetics of this partially oxidized copper powder by TGA, due to the very little weight loss throughout the process. The weight reduction method was used in this paper. The amount of sample used was much greater than that in TGA. The process of reduction was investigated based on the loss of sample weight during the process. In addition, greater weight of samples can also reduce the experimental error.
The reduction experiments were carried out in a tube furnace as shown in Figure 2. First, 60.0000 ± 0.1000 g copper powder samples were measured and spread flat in a porcelain boat. Two samples were weighed for each experiment and were averaged when the weight loss was calculated. The two porcelain boats were placed in the middle of the furnace to ensure efficient heating. To maintain consistency of the whole experimental procedure, the heating speed of each experiment was keep constant at 7 °C min−1. The airtightness of the experimental system had to be checked. Nitrogen (99.99%) was first used to flush the furnace for the 10 min at a flow rate of 0.5 L·min−1 to remove the air. Then furnace was heated to the set temperatures at a ramp rate of 7 °C. When the reaction lasted for the set time, the machine automatically stopped heating and cooled down at 5 °C·min−1 with the help of air-cooling device inside the furnace. After the temperature dropped to 30 °C, the samples were removed and weighed quickly. The micromorphology of copper powder was analyzed by scanning electron microscopy (SEM) (JSM-7800F, JEOL Ltd., Tokyo, Japan), the composition was analyzed by energy dispersion spectrometer (EDS) (JSM-7800F, JEOL Ltd., Tokyo, Japan), and the apparent density was examined by the funnel method [14].
The reduction rate X was calculated as follows:
X = Δ m Δ m = m O m R Δ m × 100 %
where Δm is weight loss of samples in g; Δm is total weight loss of samples after the complete reduction, in g; mO is the mass of the sample, in g; mR is the mass of samples at different reduction levels, in g. Under the isothermal reduction in this study, it was considered that there was no Cu2O during the progress. When the reaction time was long enough, the final product was only copper [11,15]. The reaction proceeded according to Equation (2).
H 2 + CuO = Cu + H 2 O
According to the experimental results in Section 3.1, the samples were completely reduced at 400 °C for 165 min, and the loss of weight was the mass of the removed oxygen elements. Based on the mass of samples, the mass percentage of CuO was determined to be 1.96%, thus Δm = mO × 1.96%.

3. Results and Discussion

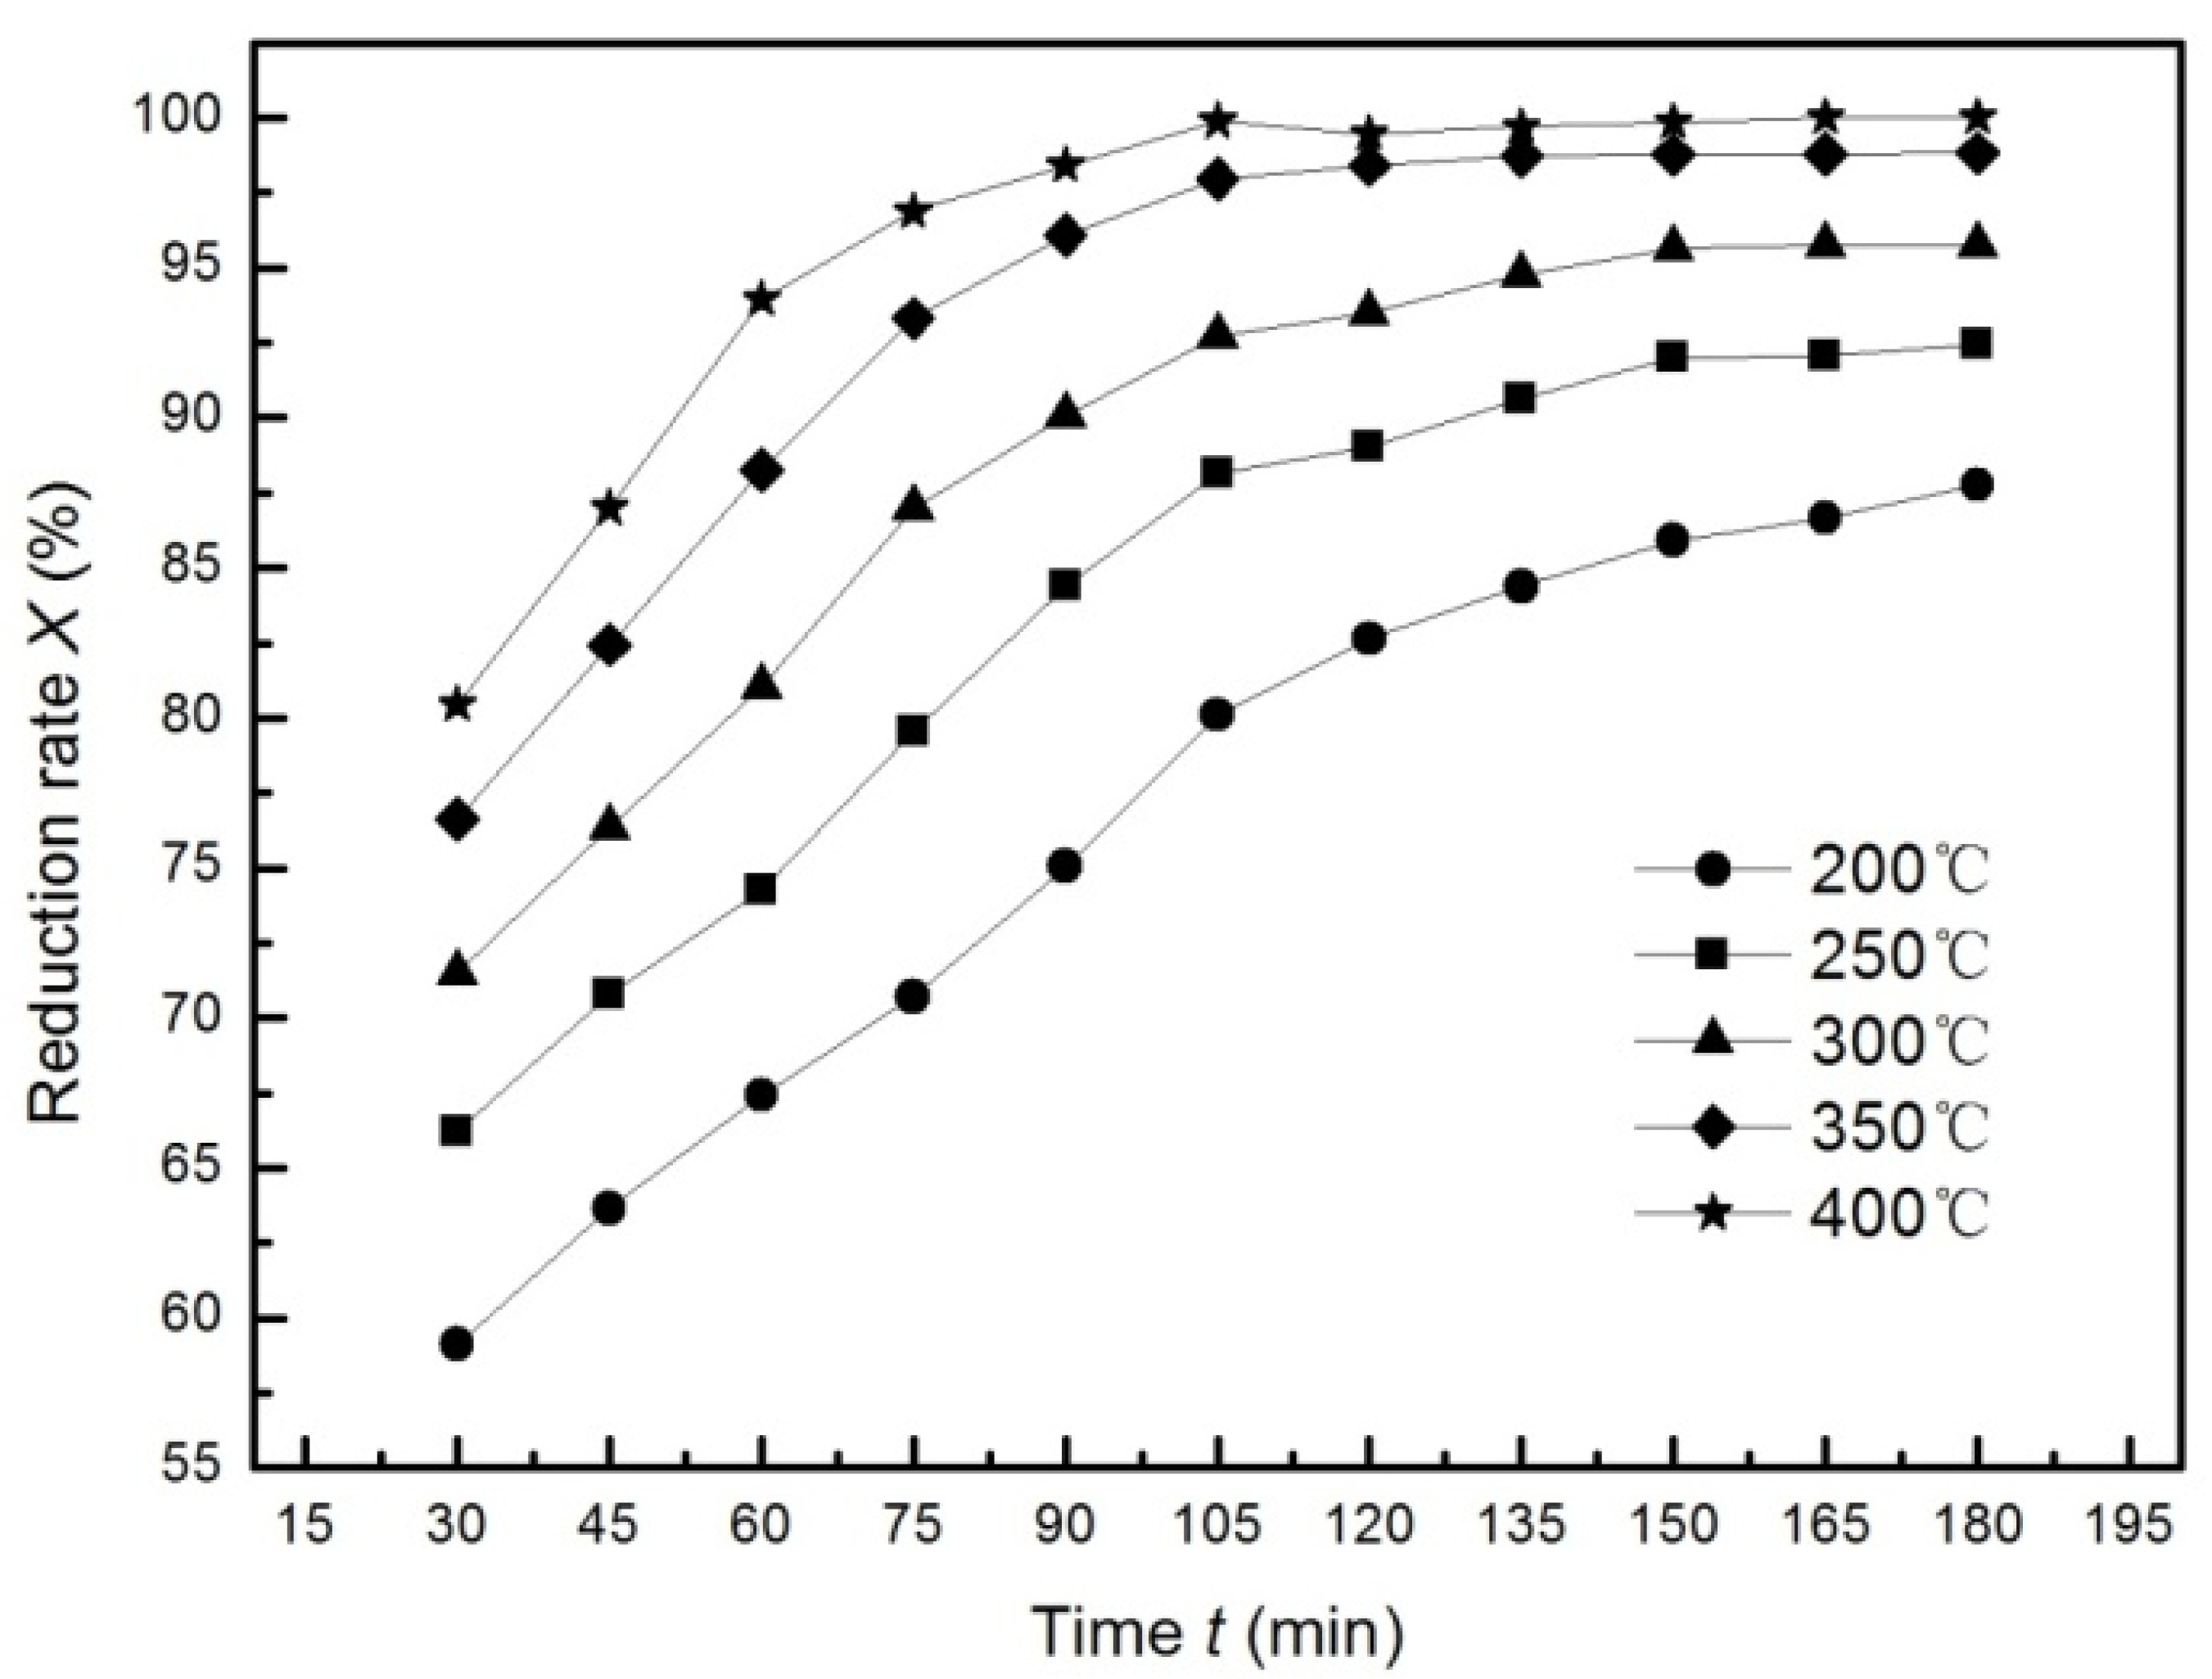
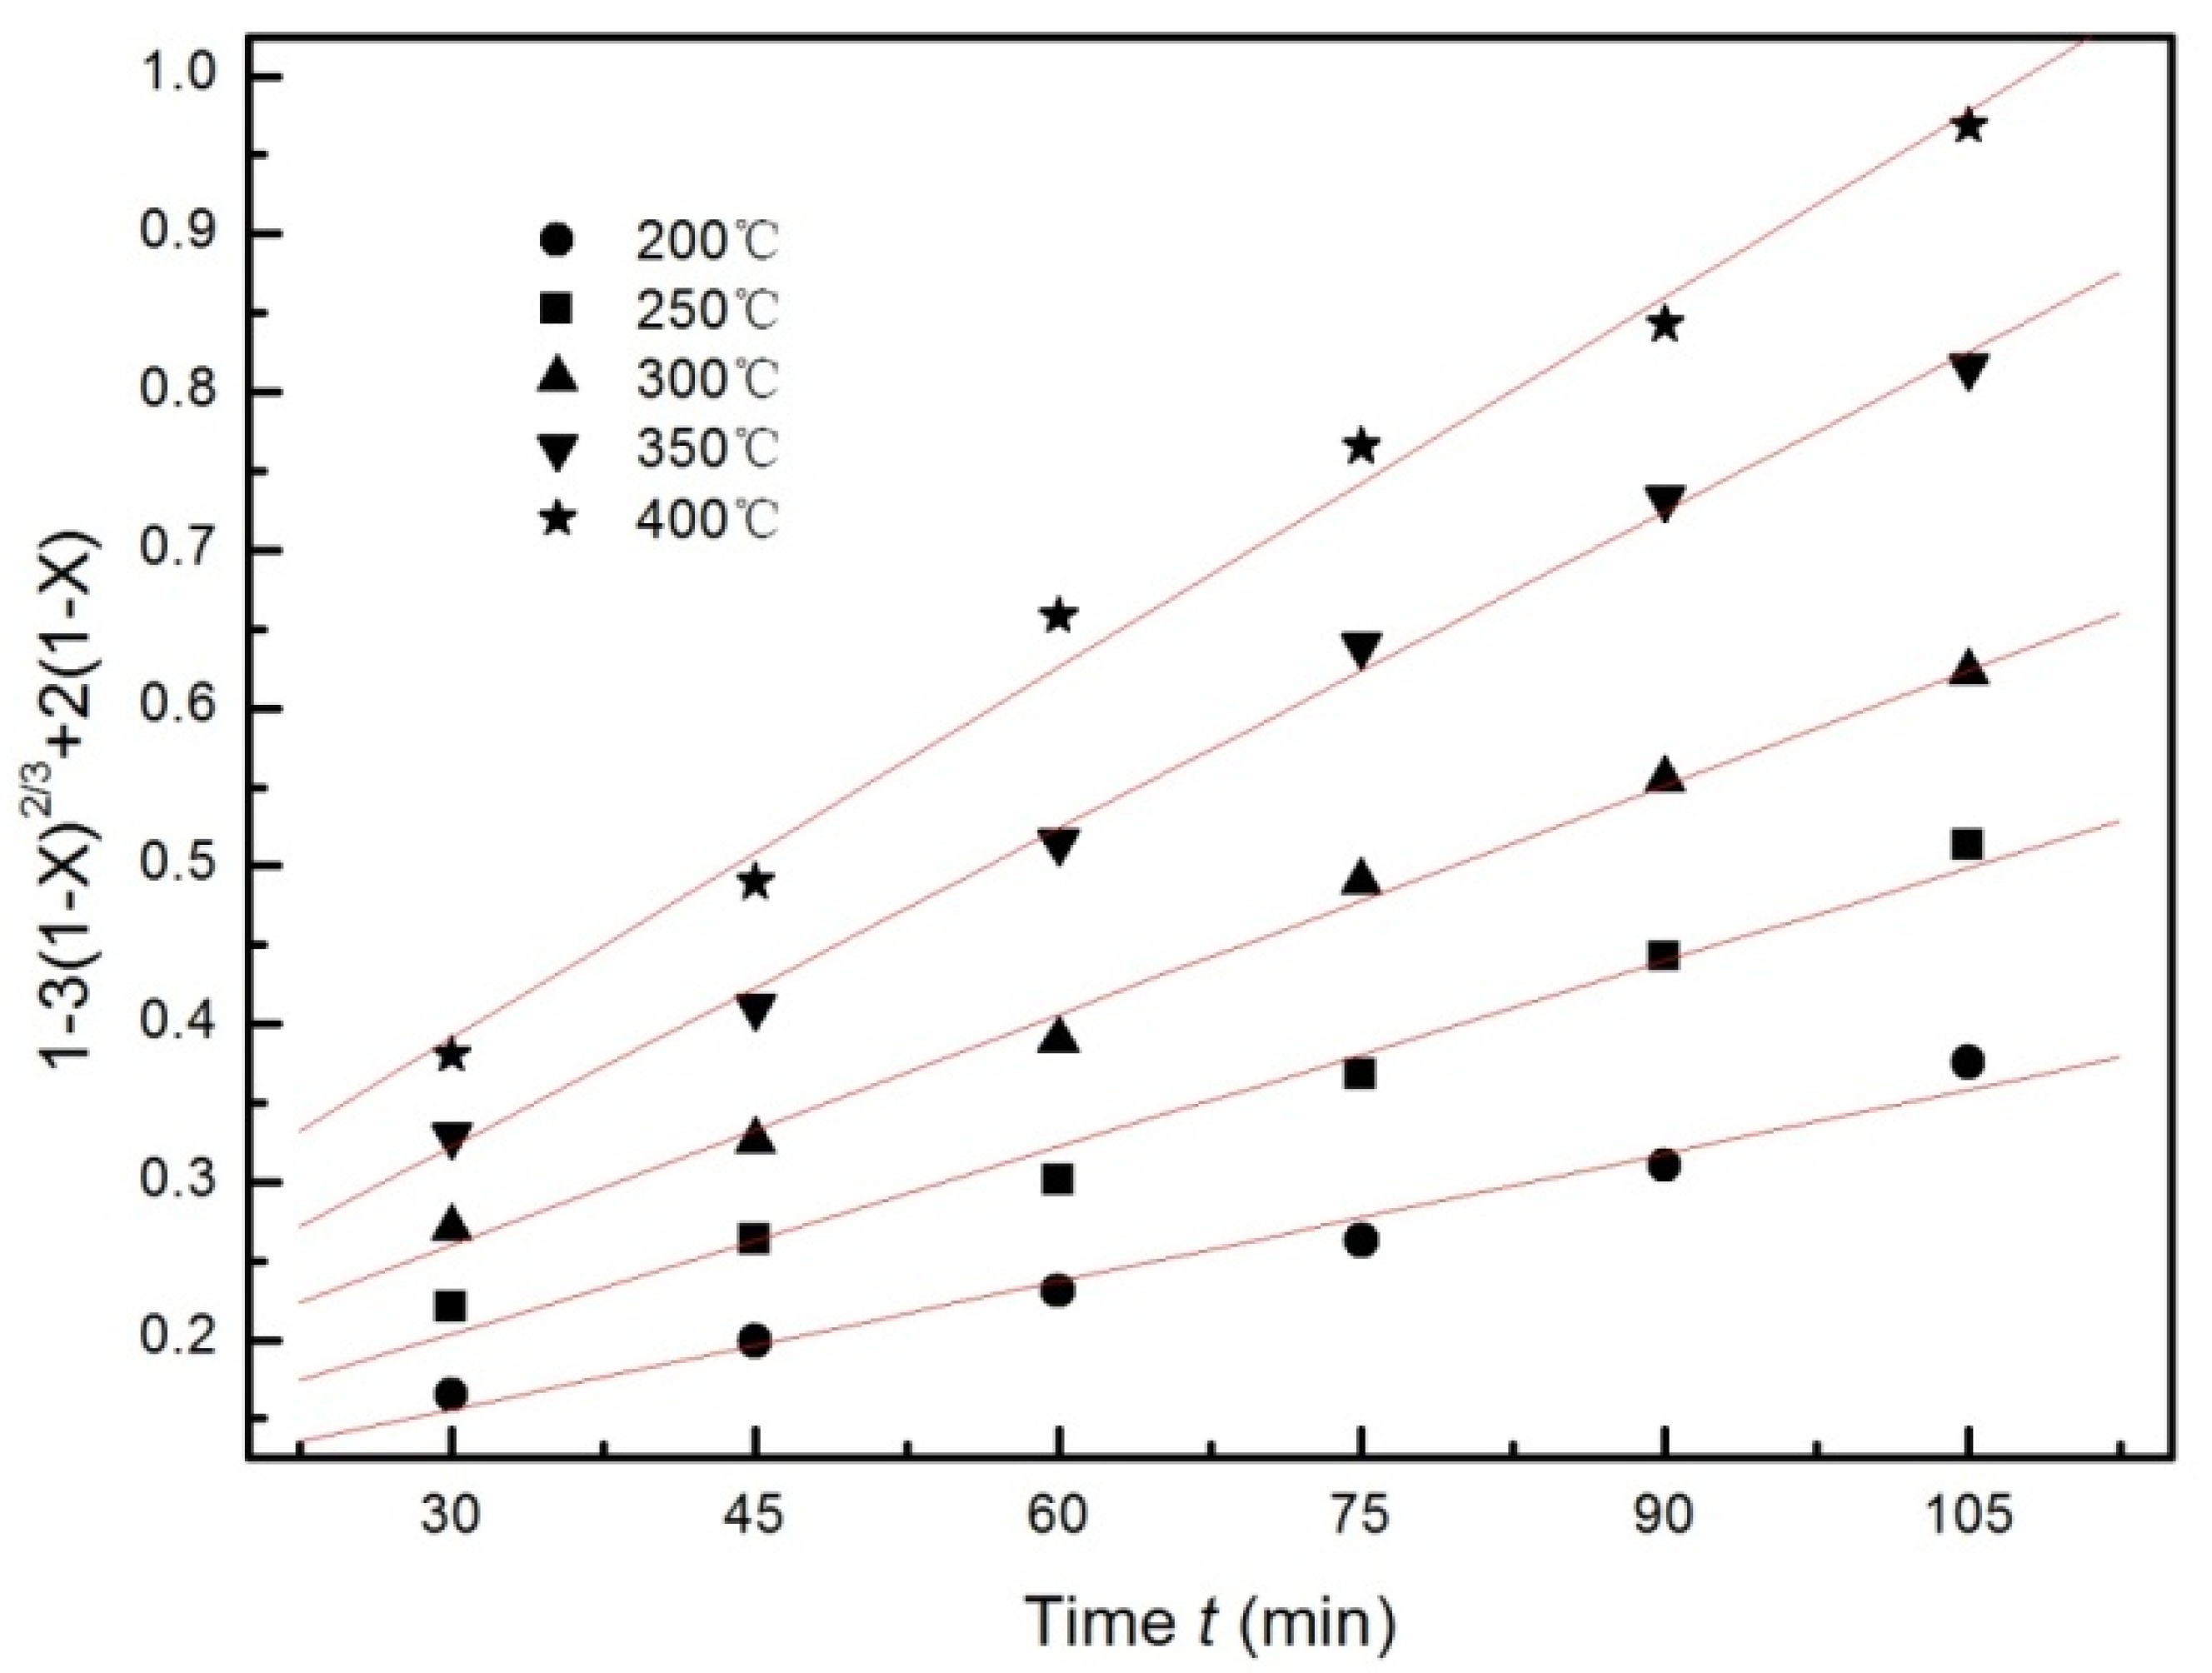
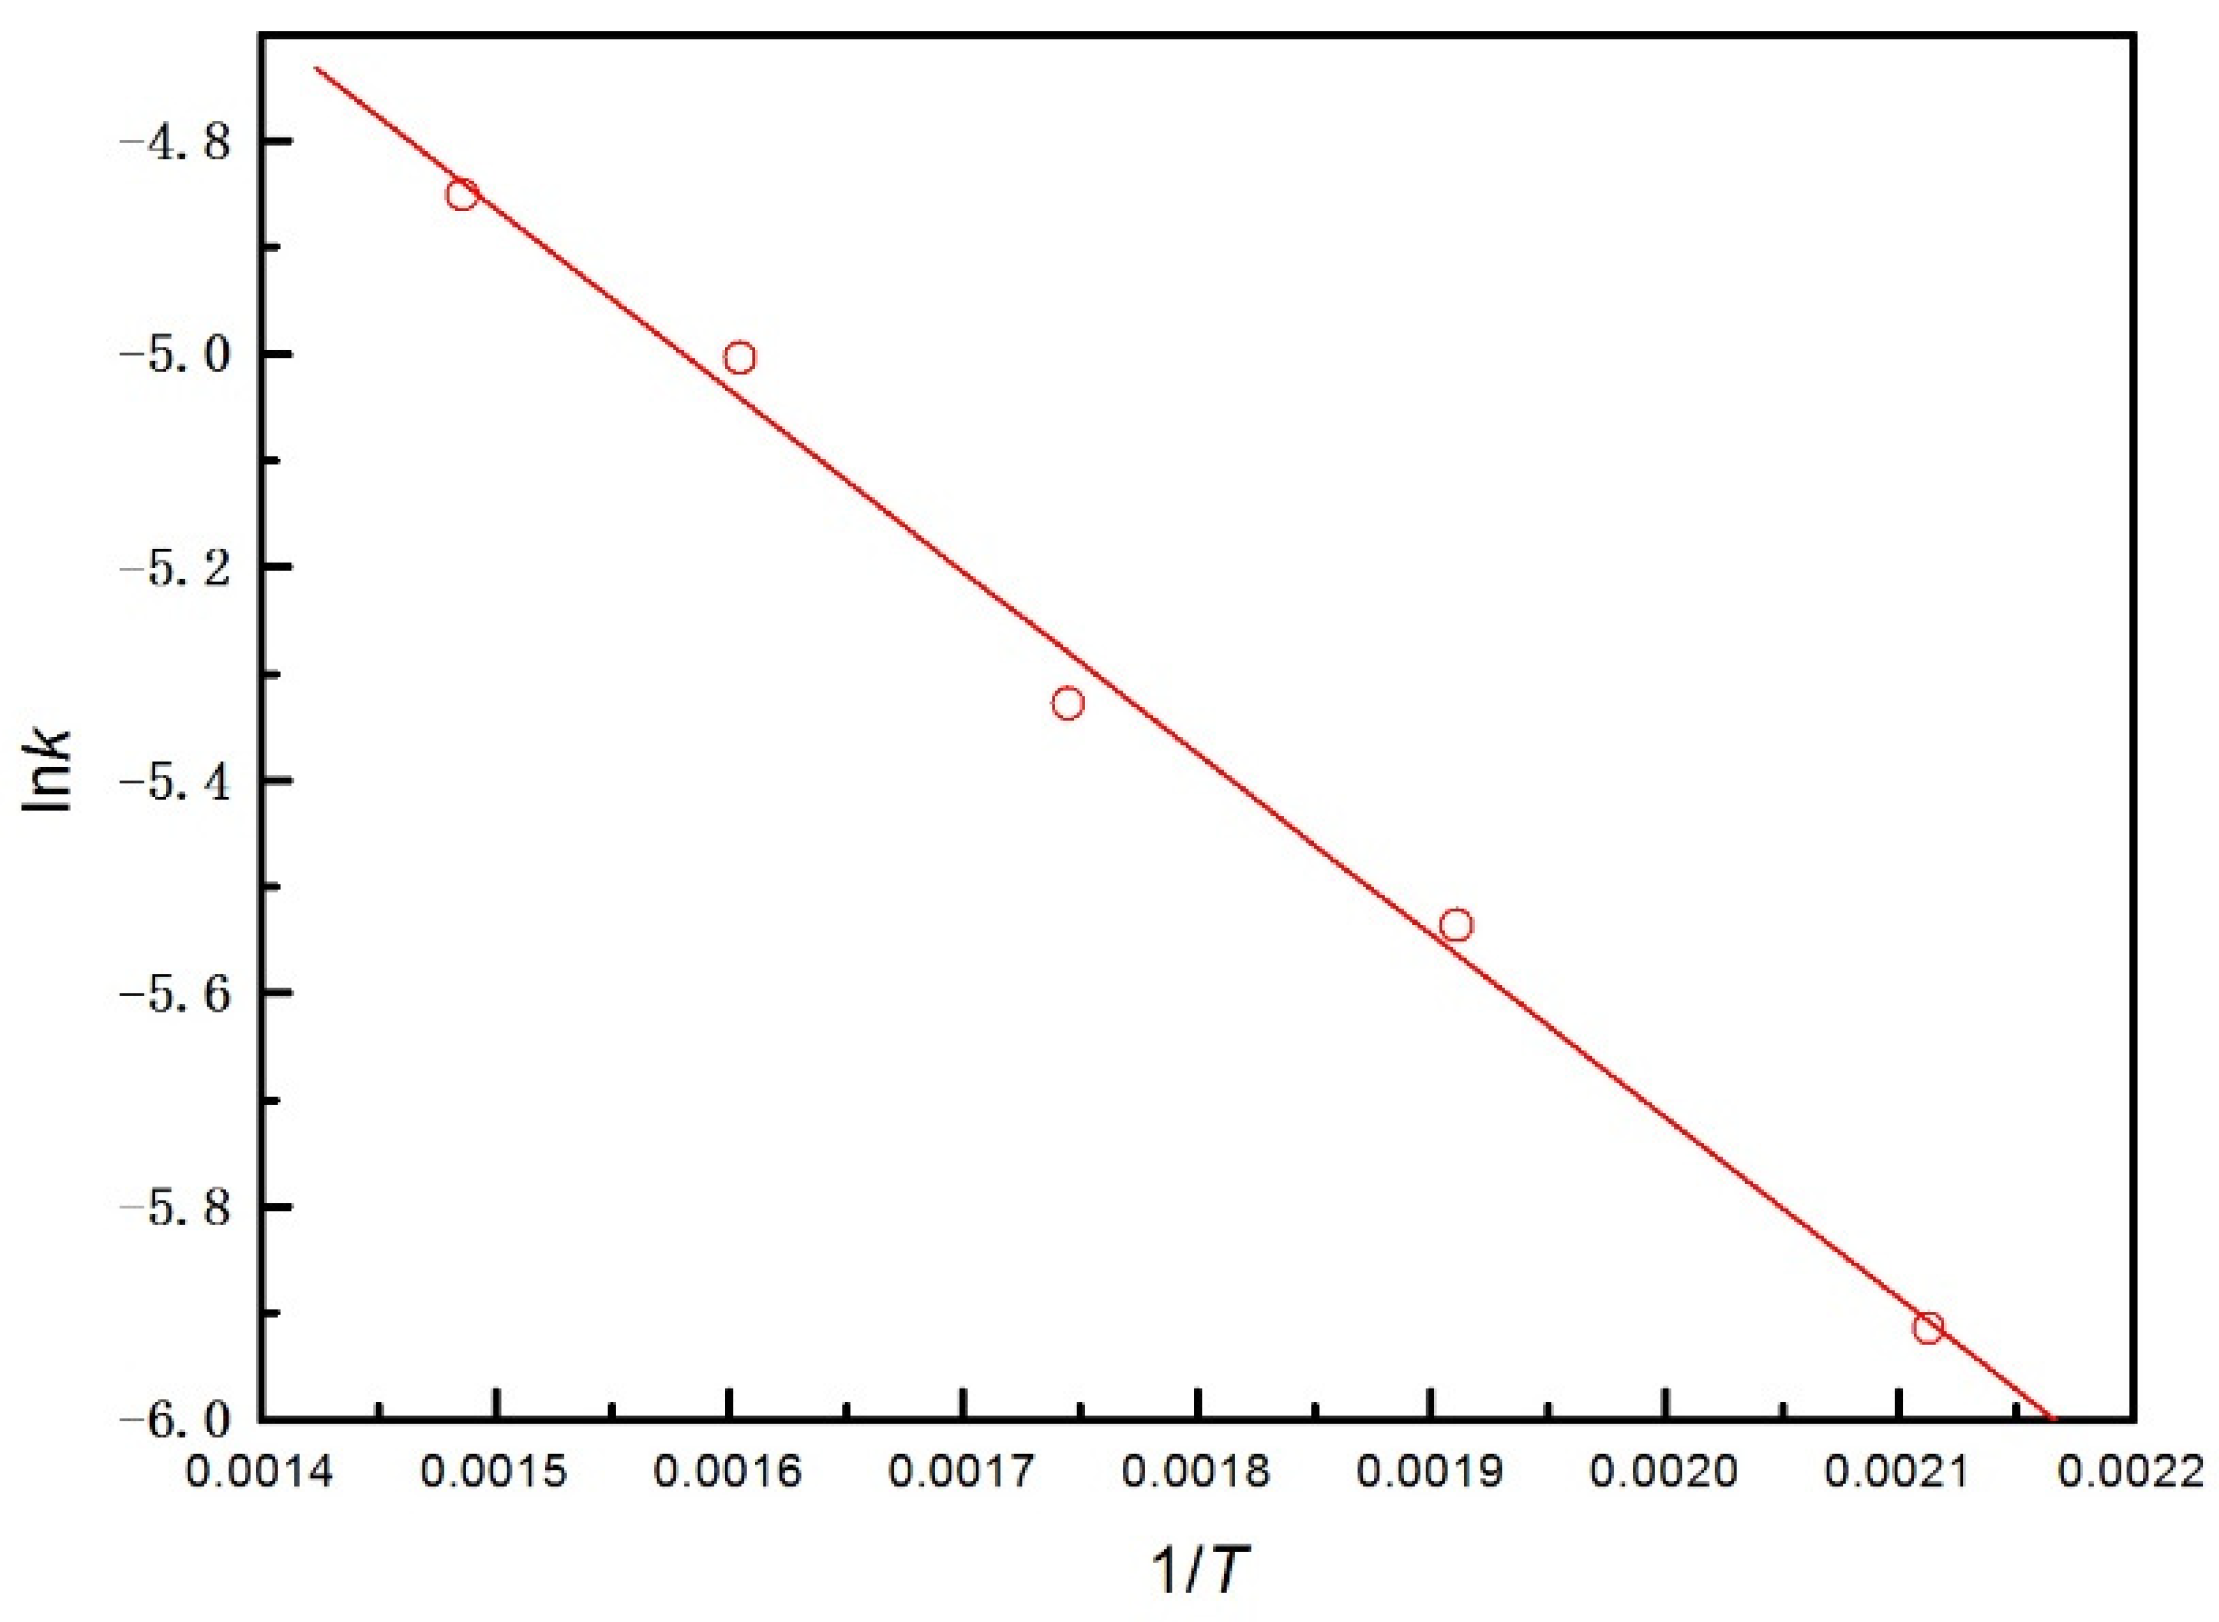
3.1. Reduction Rate and the Kinetics Study

Reduction experiments were performed at 200 °C to 400 °C for 30 min to 180 min with a temperature interval of 50 °C and a time interval of 15 min. The changes of reduction rate as a function of time and temperature are shown in Figure 3. It has been reported that the process of reduction of CuO by hydrogen has an induction period and autocatalysis, and the reduction rate over time presents a typical “S” curve [10,12,13]. The induction phase is mainly due to a gas membrane formed by the moisture on the sample surface. This membrane prevents the contact between hydrogen and CuO.
Since there was no reduction rate before 30 min, it is uncertain if there was an induction period here. The samples were dried at 105 °C in a vacuum drying oven for 3 h before reduction. According to the literature [12,16], it is very likely that there is no significant induction period. It is well known that the flow rate of hydrogen and heating rate are related to whether the copper oxide with intermediate valence is generated during reduction [11,15]. When the flow rate of hydrogen is less than 0.3 L min−1, Cu2O may be generated; while when the flow rate is large, no copper oxides other than CuO are generated [13]. The flow rate of hydrogen in this study was 0.5 L min−1, which ensured enough hydrogen in the reduction process, so that there were no copper oxides with intermediate valence, and a one-step reaction. Moreover, this flow rate eliminated the effect of external gas diffusion of the sample particles.
Figure 3 shows that the temperature had an evident effect on the reduction rates. The kinetics model and the rate limiting steps of reduction process were studied using the Arrhenius-based expression, as shown in Equation (3) [10]. When controlled by an interfacial chemical reaction, the relationship between reduction rate X and time t agrees with Equation (4) [13].
ln k = ln A E a R T
1 ( 1 X ) 1 3 = k   t
where k is the apparent rate constant; t is time in min. In plot 1 ( 1 X ) 1 3 vs. t, poor anastomosis was found, and the correlation coefficient R2 did not exceed 0.98. Thus, the interfacial reaction was not the limiting step in the reduction of CuO control.
During reduction, copper nucleates at the active site on the particle surface [13] because of the branching structure of powder and the larger number of defects, which favors nucleation. Ramos showed new copper nuclei started to form and grow, until the particle surface was completely covered with metallic copper by SEM micrographs at different reaction times [10].
Jelić and Ramos both believe that the water generated by the reduction process forms the moisture film on the surface of powder particles, and the surface is covered by metallic copper gradually as the reaction progresses. This leads to the controlling step of reaction rate to turn into internal diffusion, due to the closure of metallic copper [10,12]. Hydrogen was excessive under the flow rate in this study; therefore, we believe that external diffusion is not the controlling step [13]. The equation of the internal diffusion controlling step is as shown in Equation (5) [10].
1 3 ( 1 X ) 2 3 + 2 ( 1 X ) = k   t
By plotting 1 3 ( 1 X ) 2 3 + 2 ( 1 X ) vs. t (shown in Figure 4), good consistency was obtained, with R2 greater than 0.98, and P less than 0.005, as shown in Table 1.
The slope B is the apparent reaction rate constant k . Ea was calculated as 14.18 KJ mol−1 using the Arrhenius-based expression, as shown in Figure 5 and Table 2, which agrees with the results of previous studies [11,15].

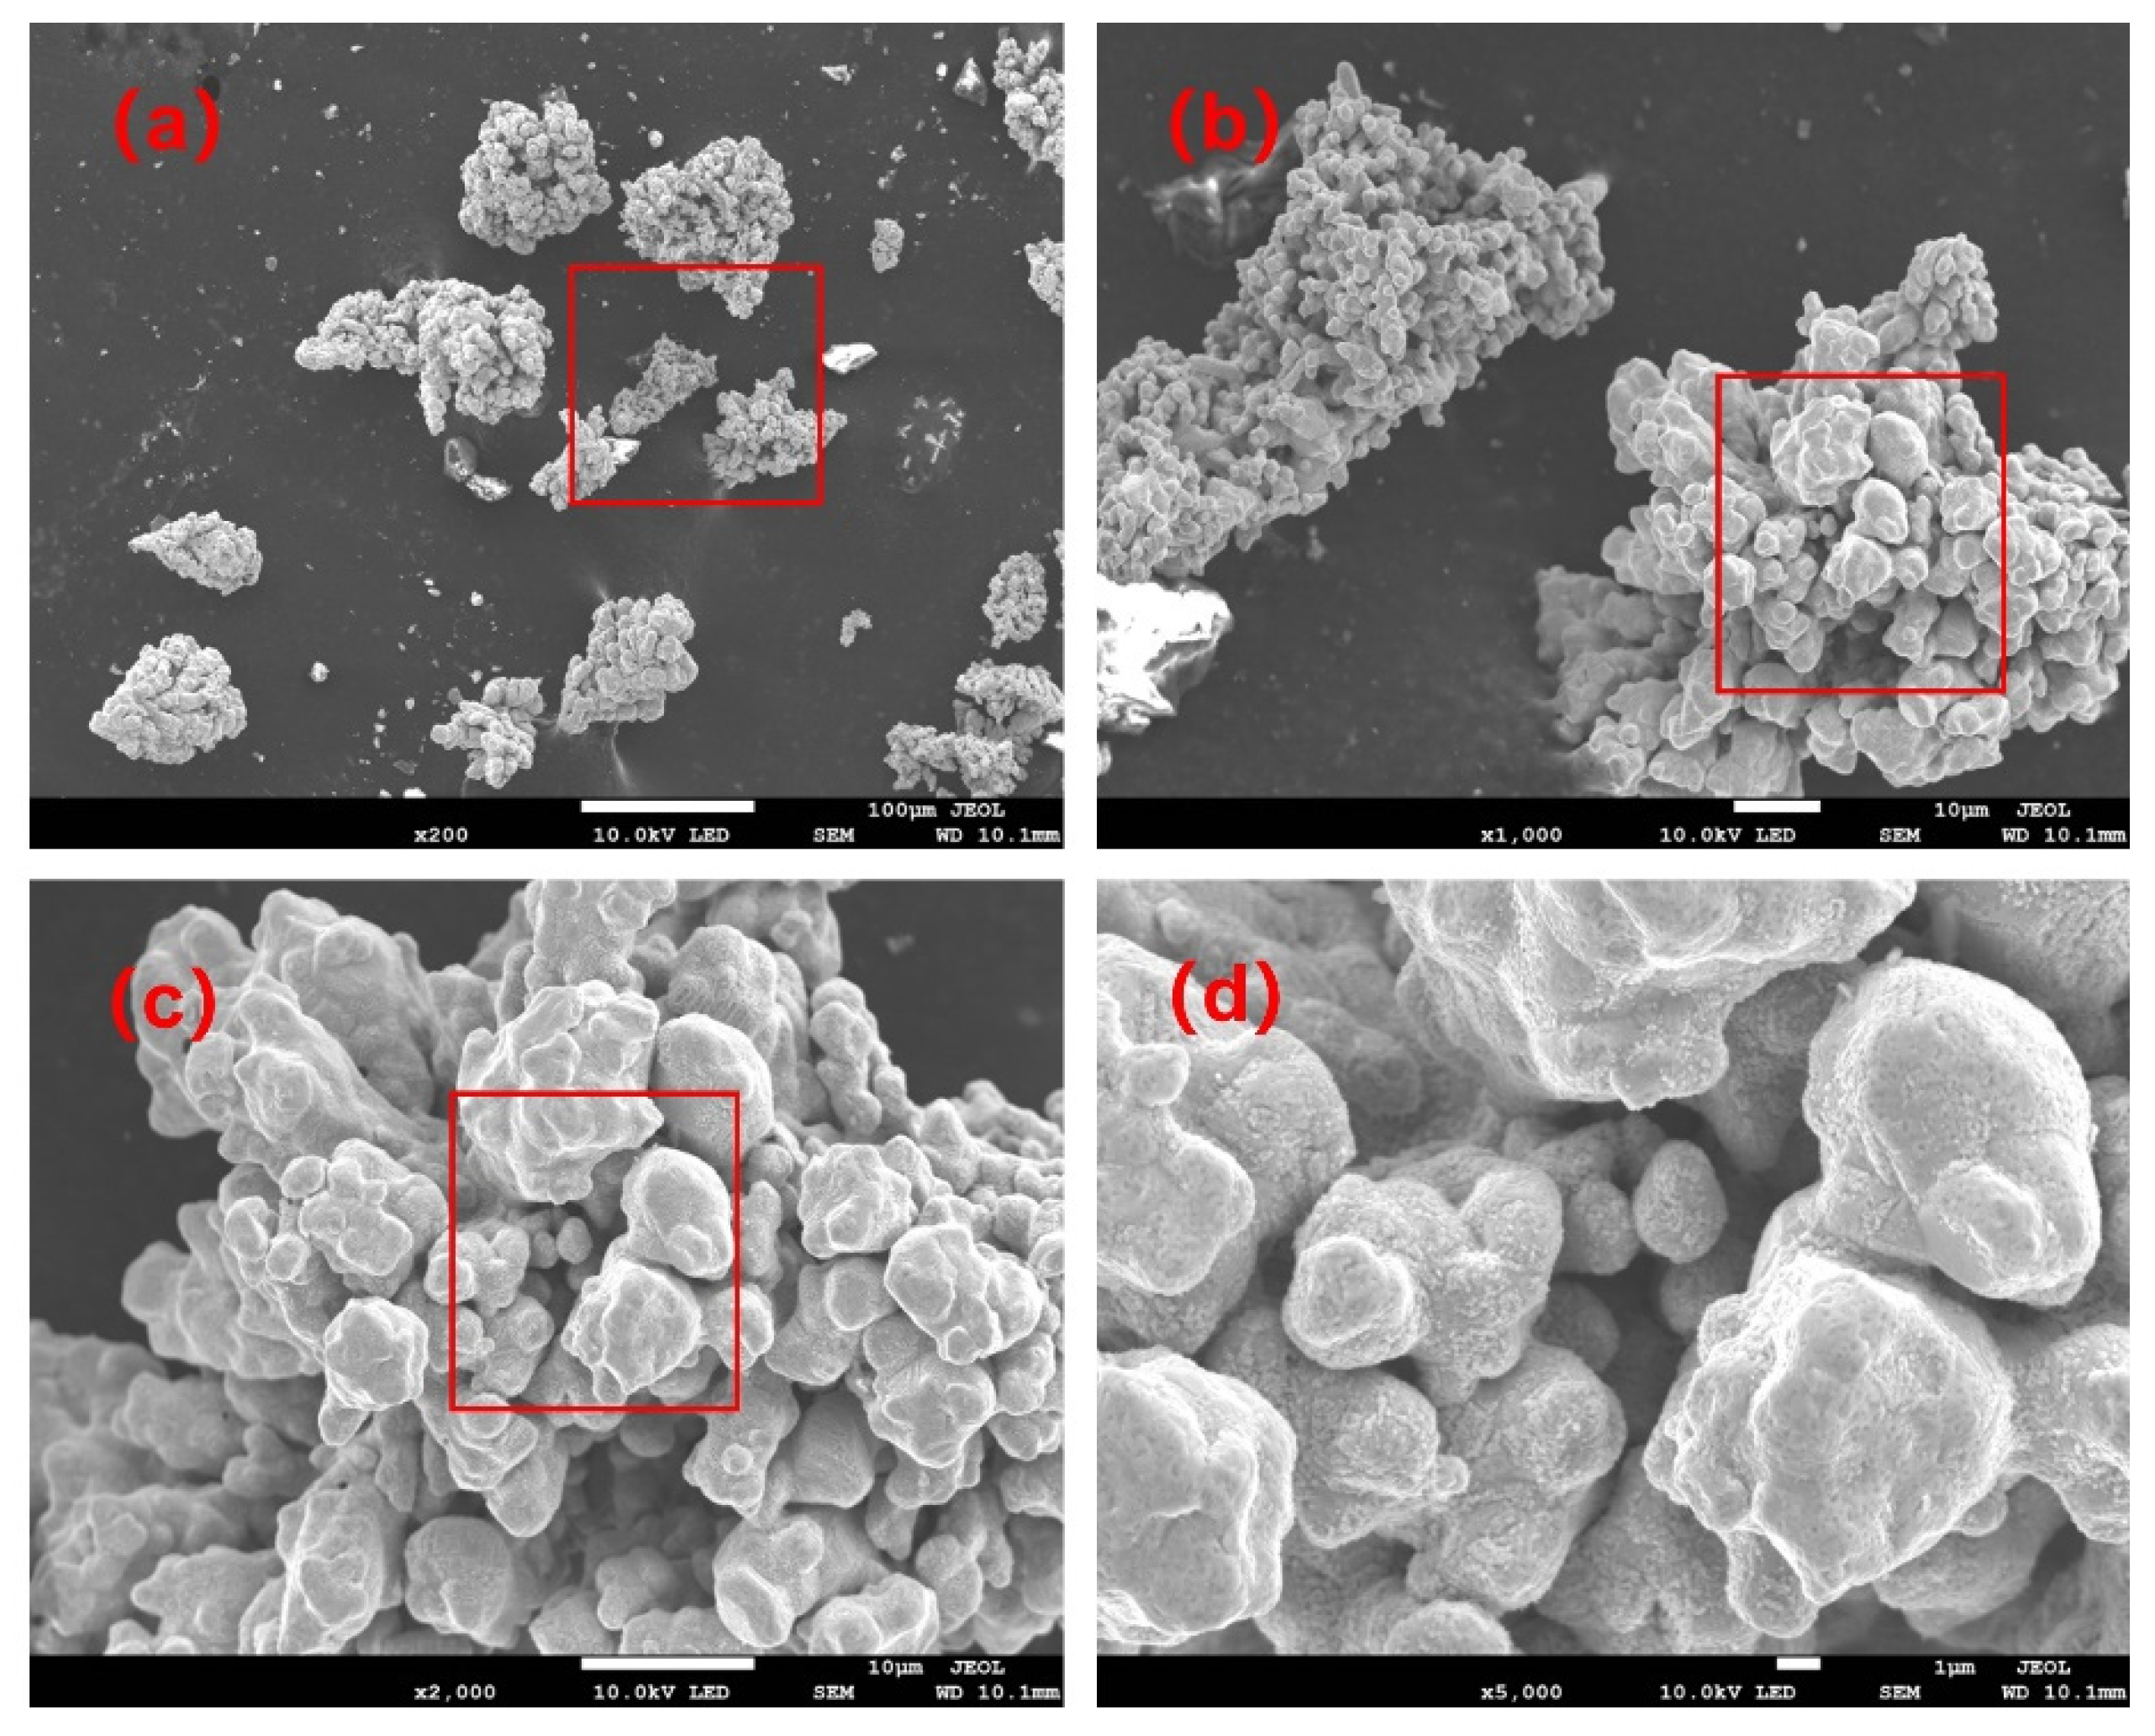
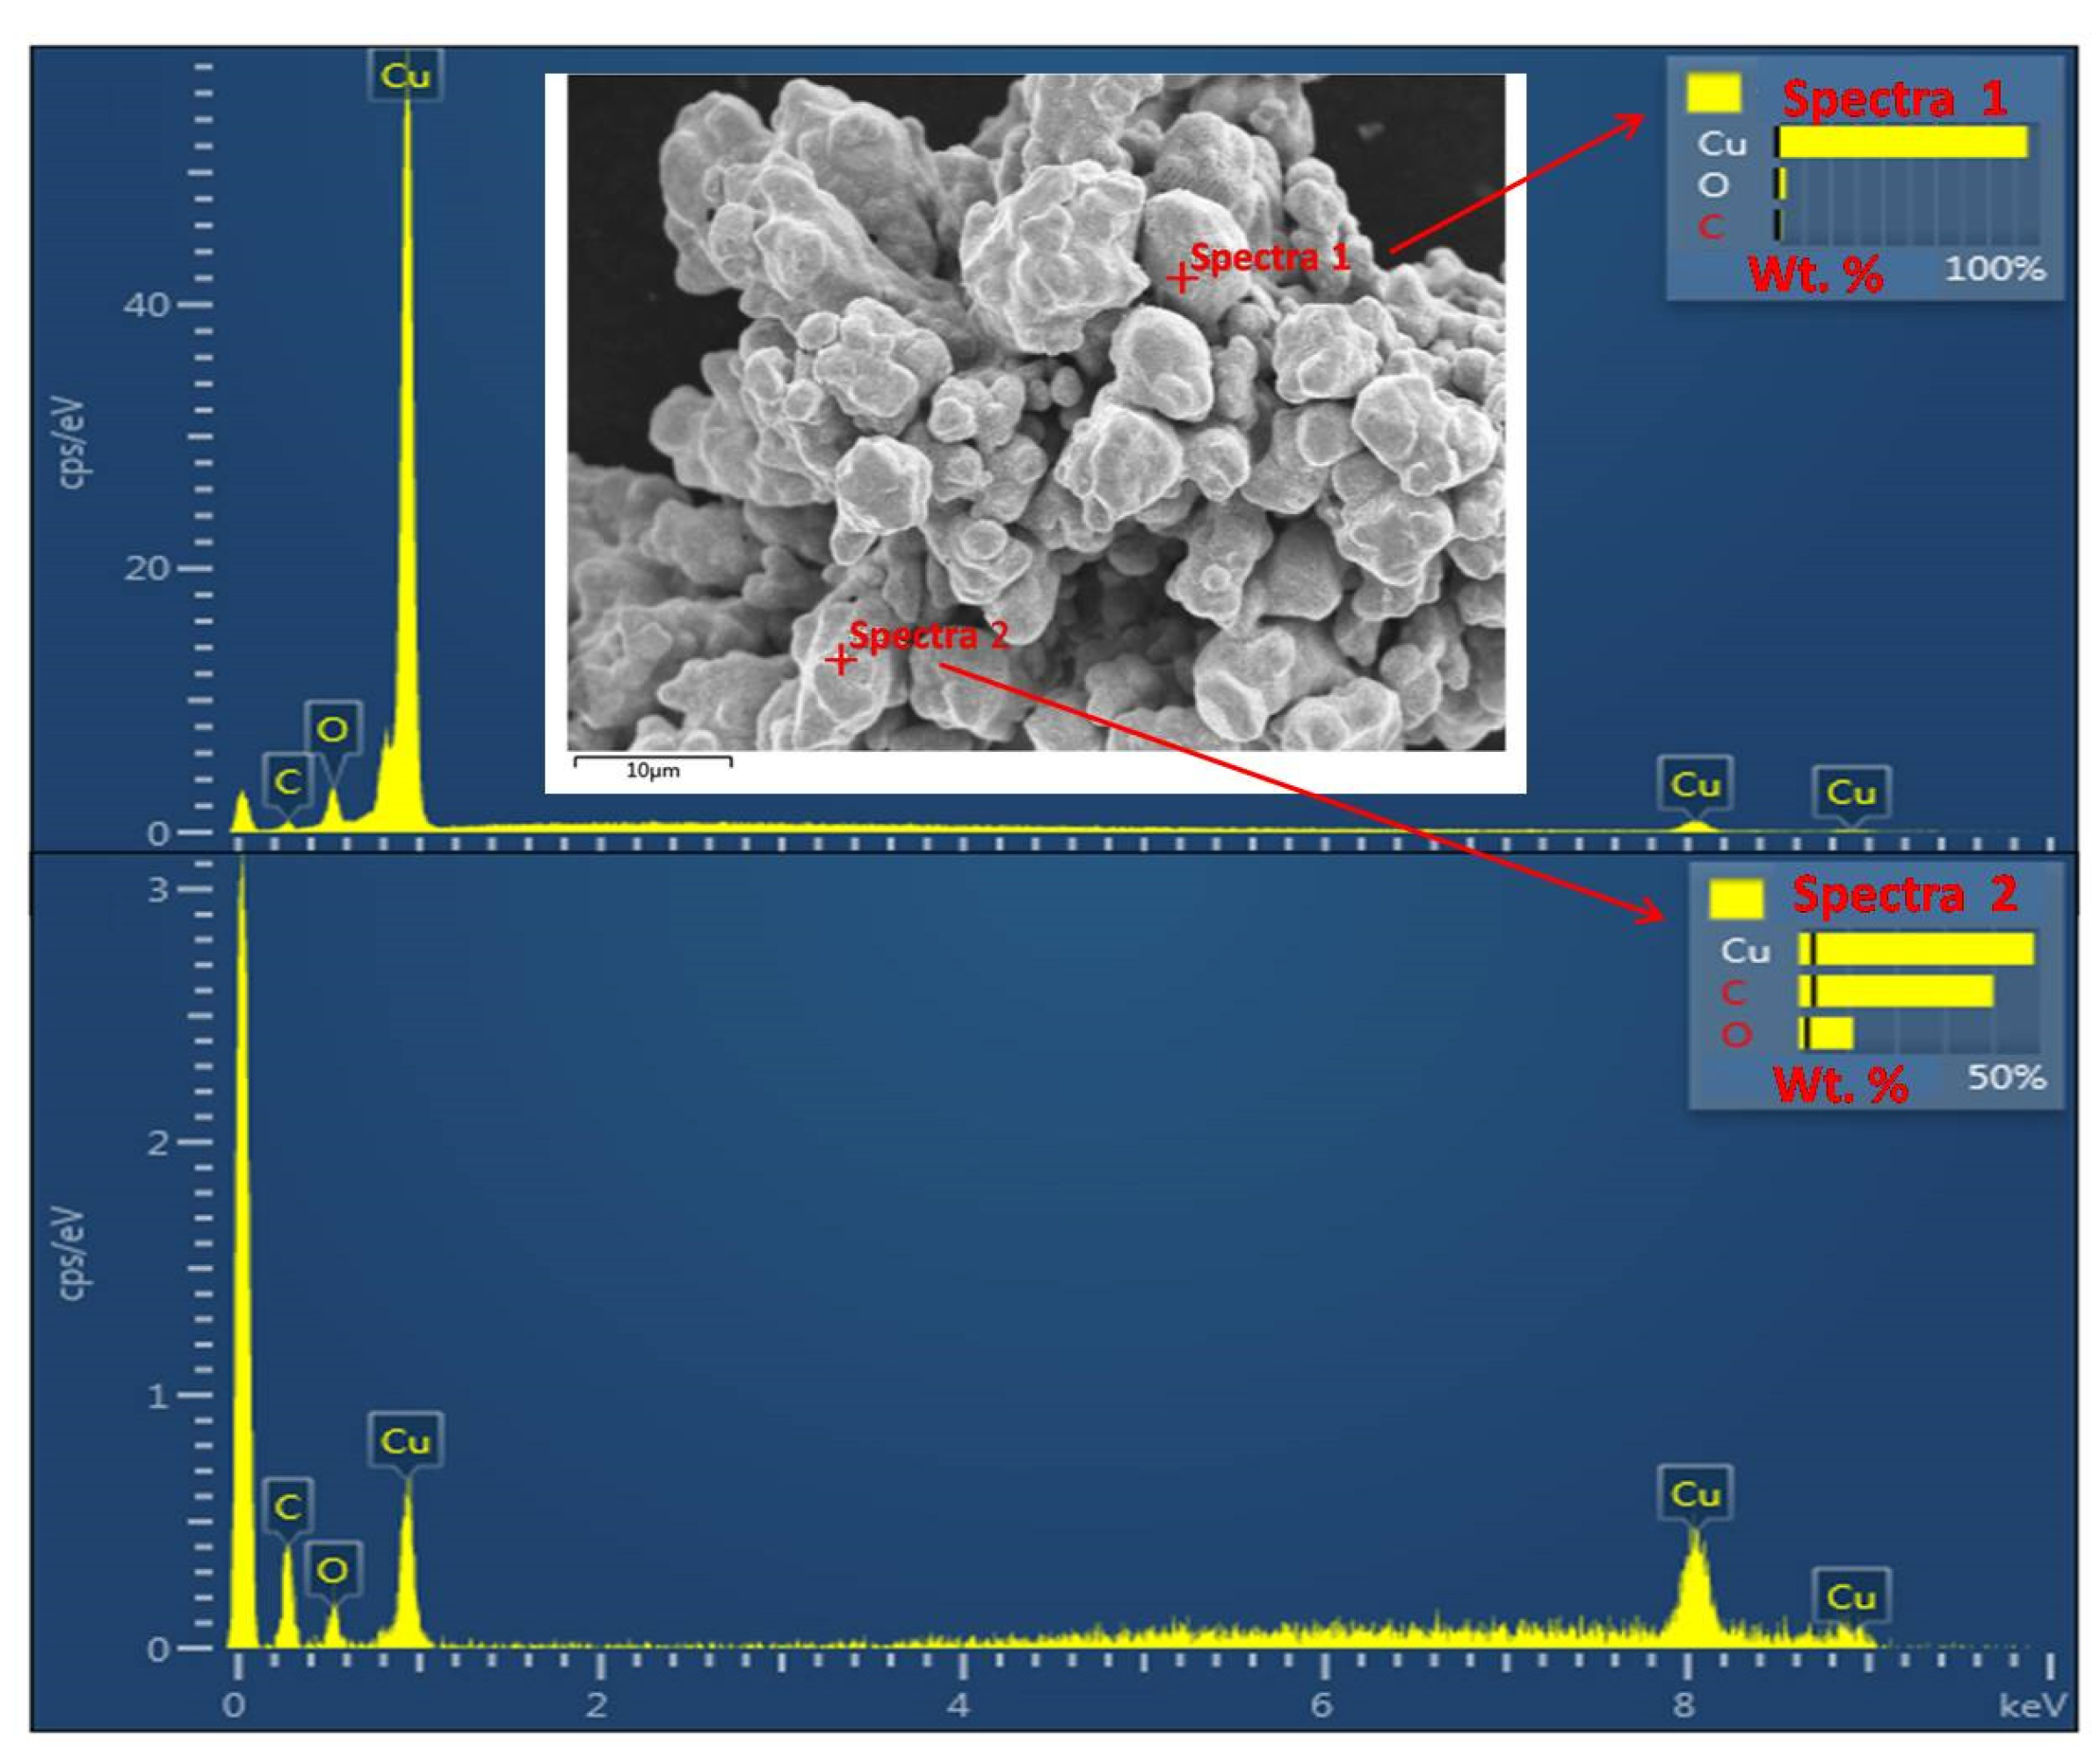
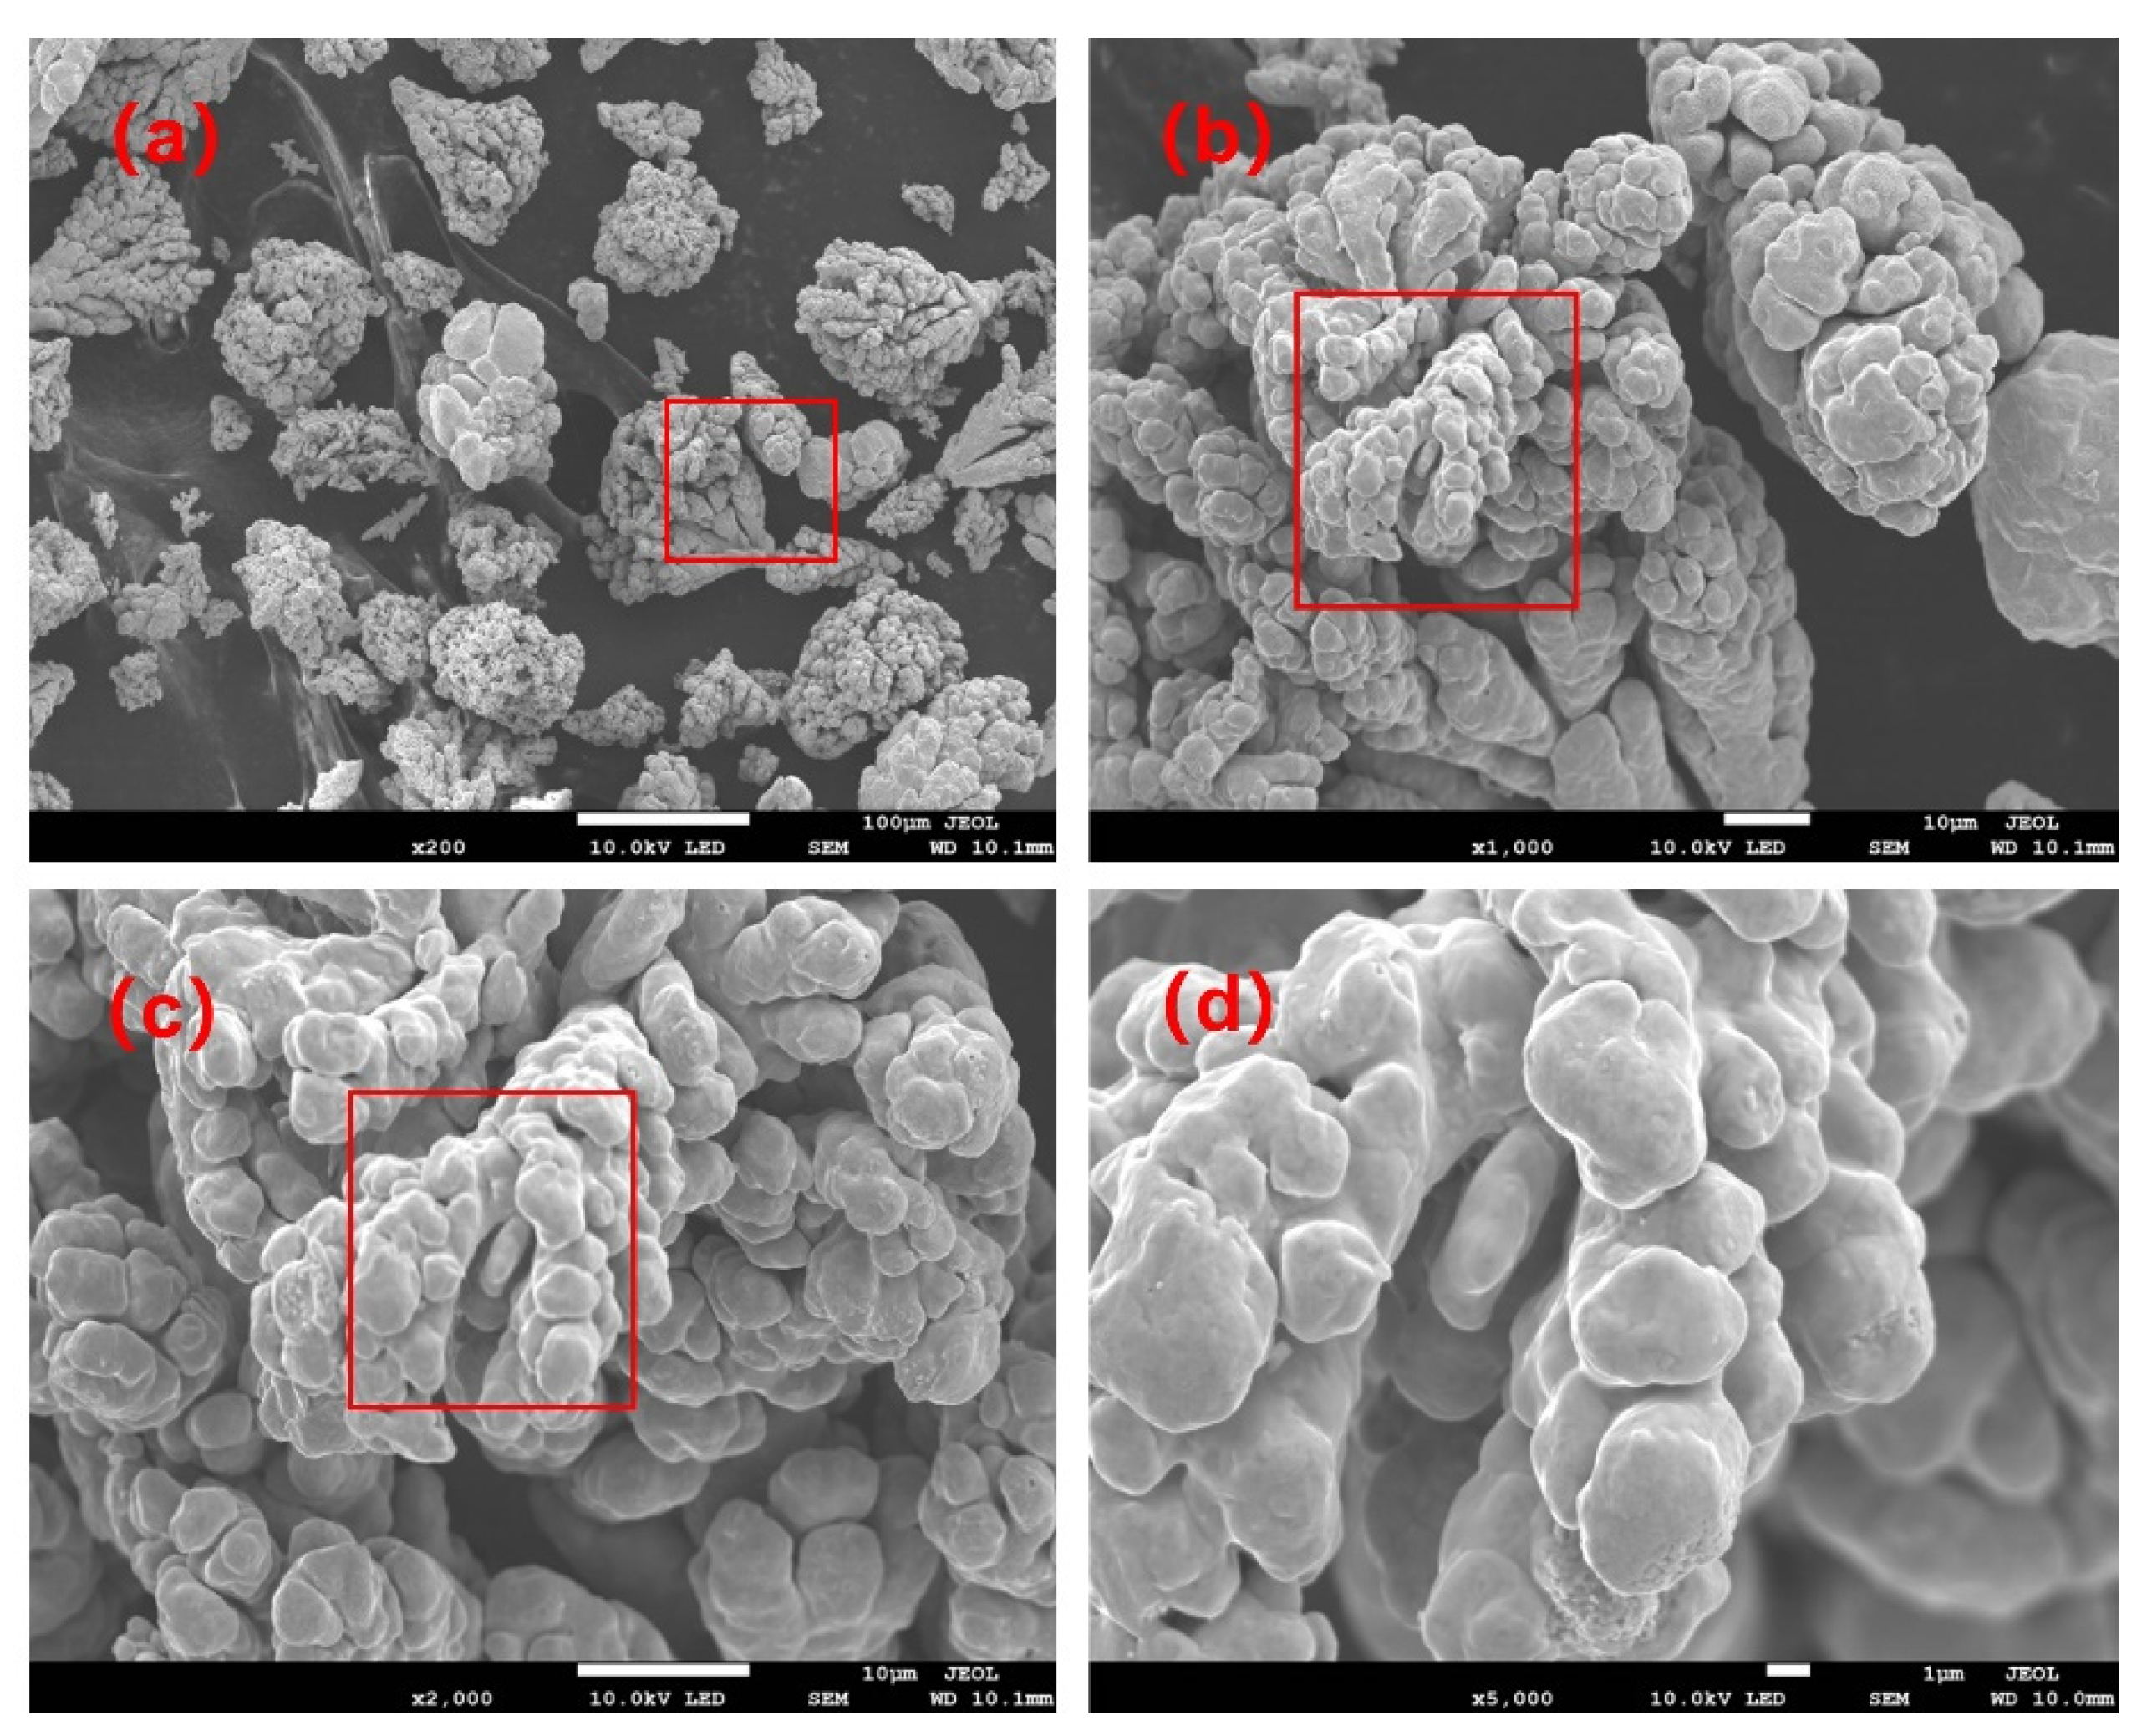
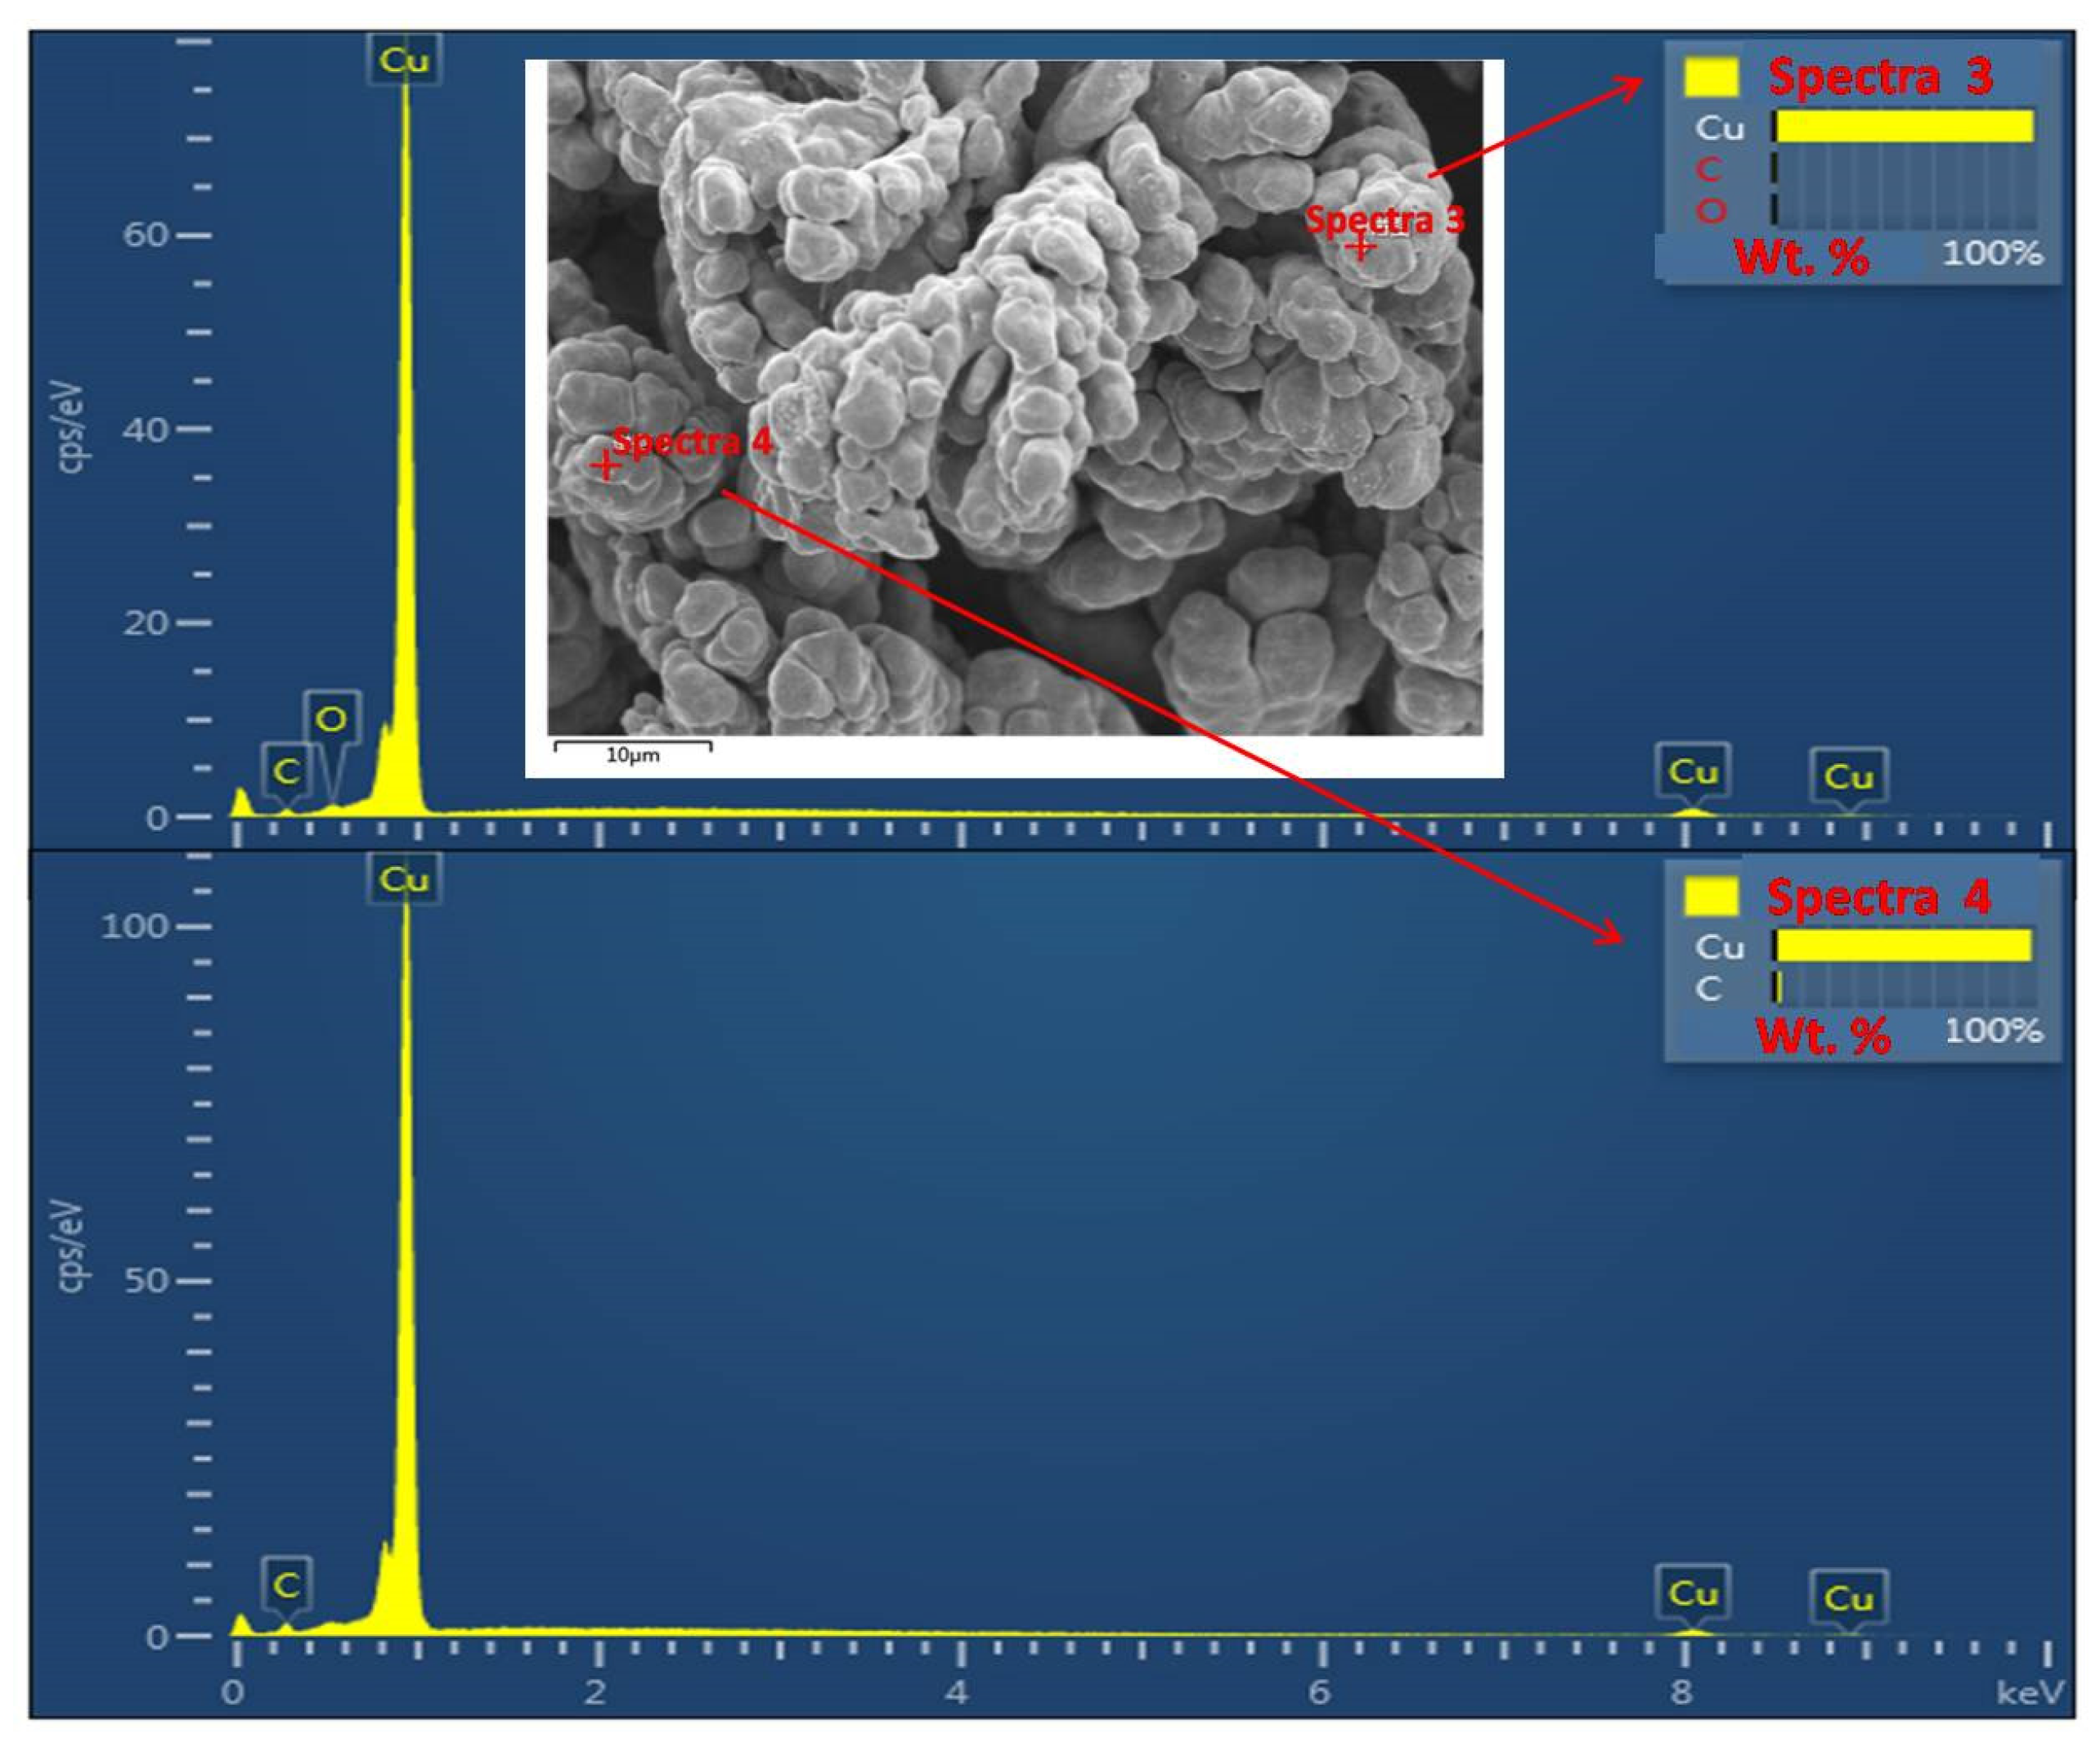
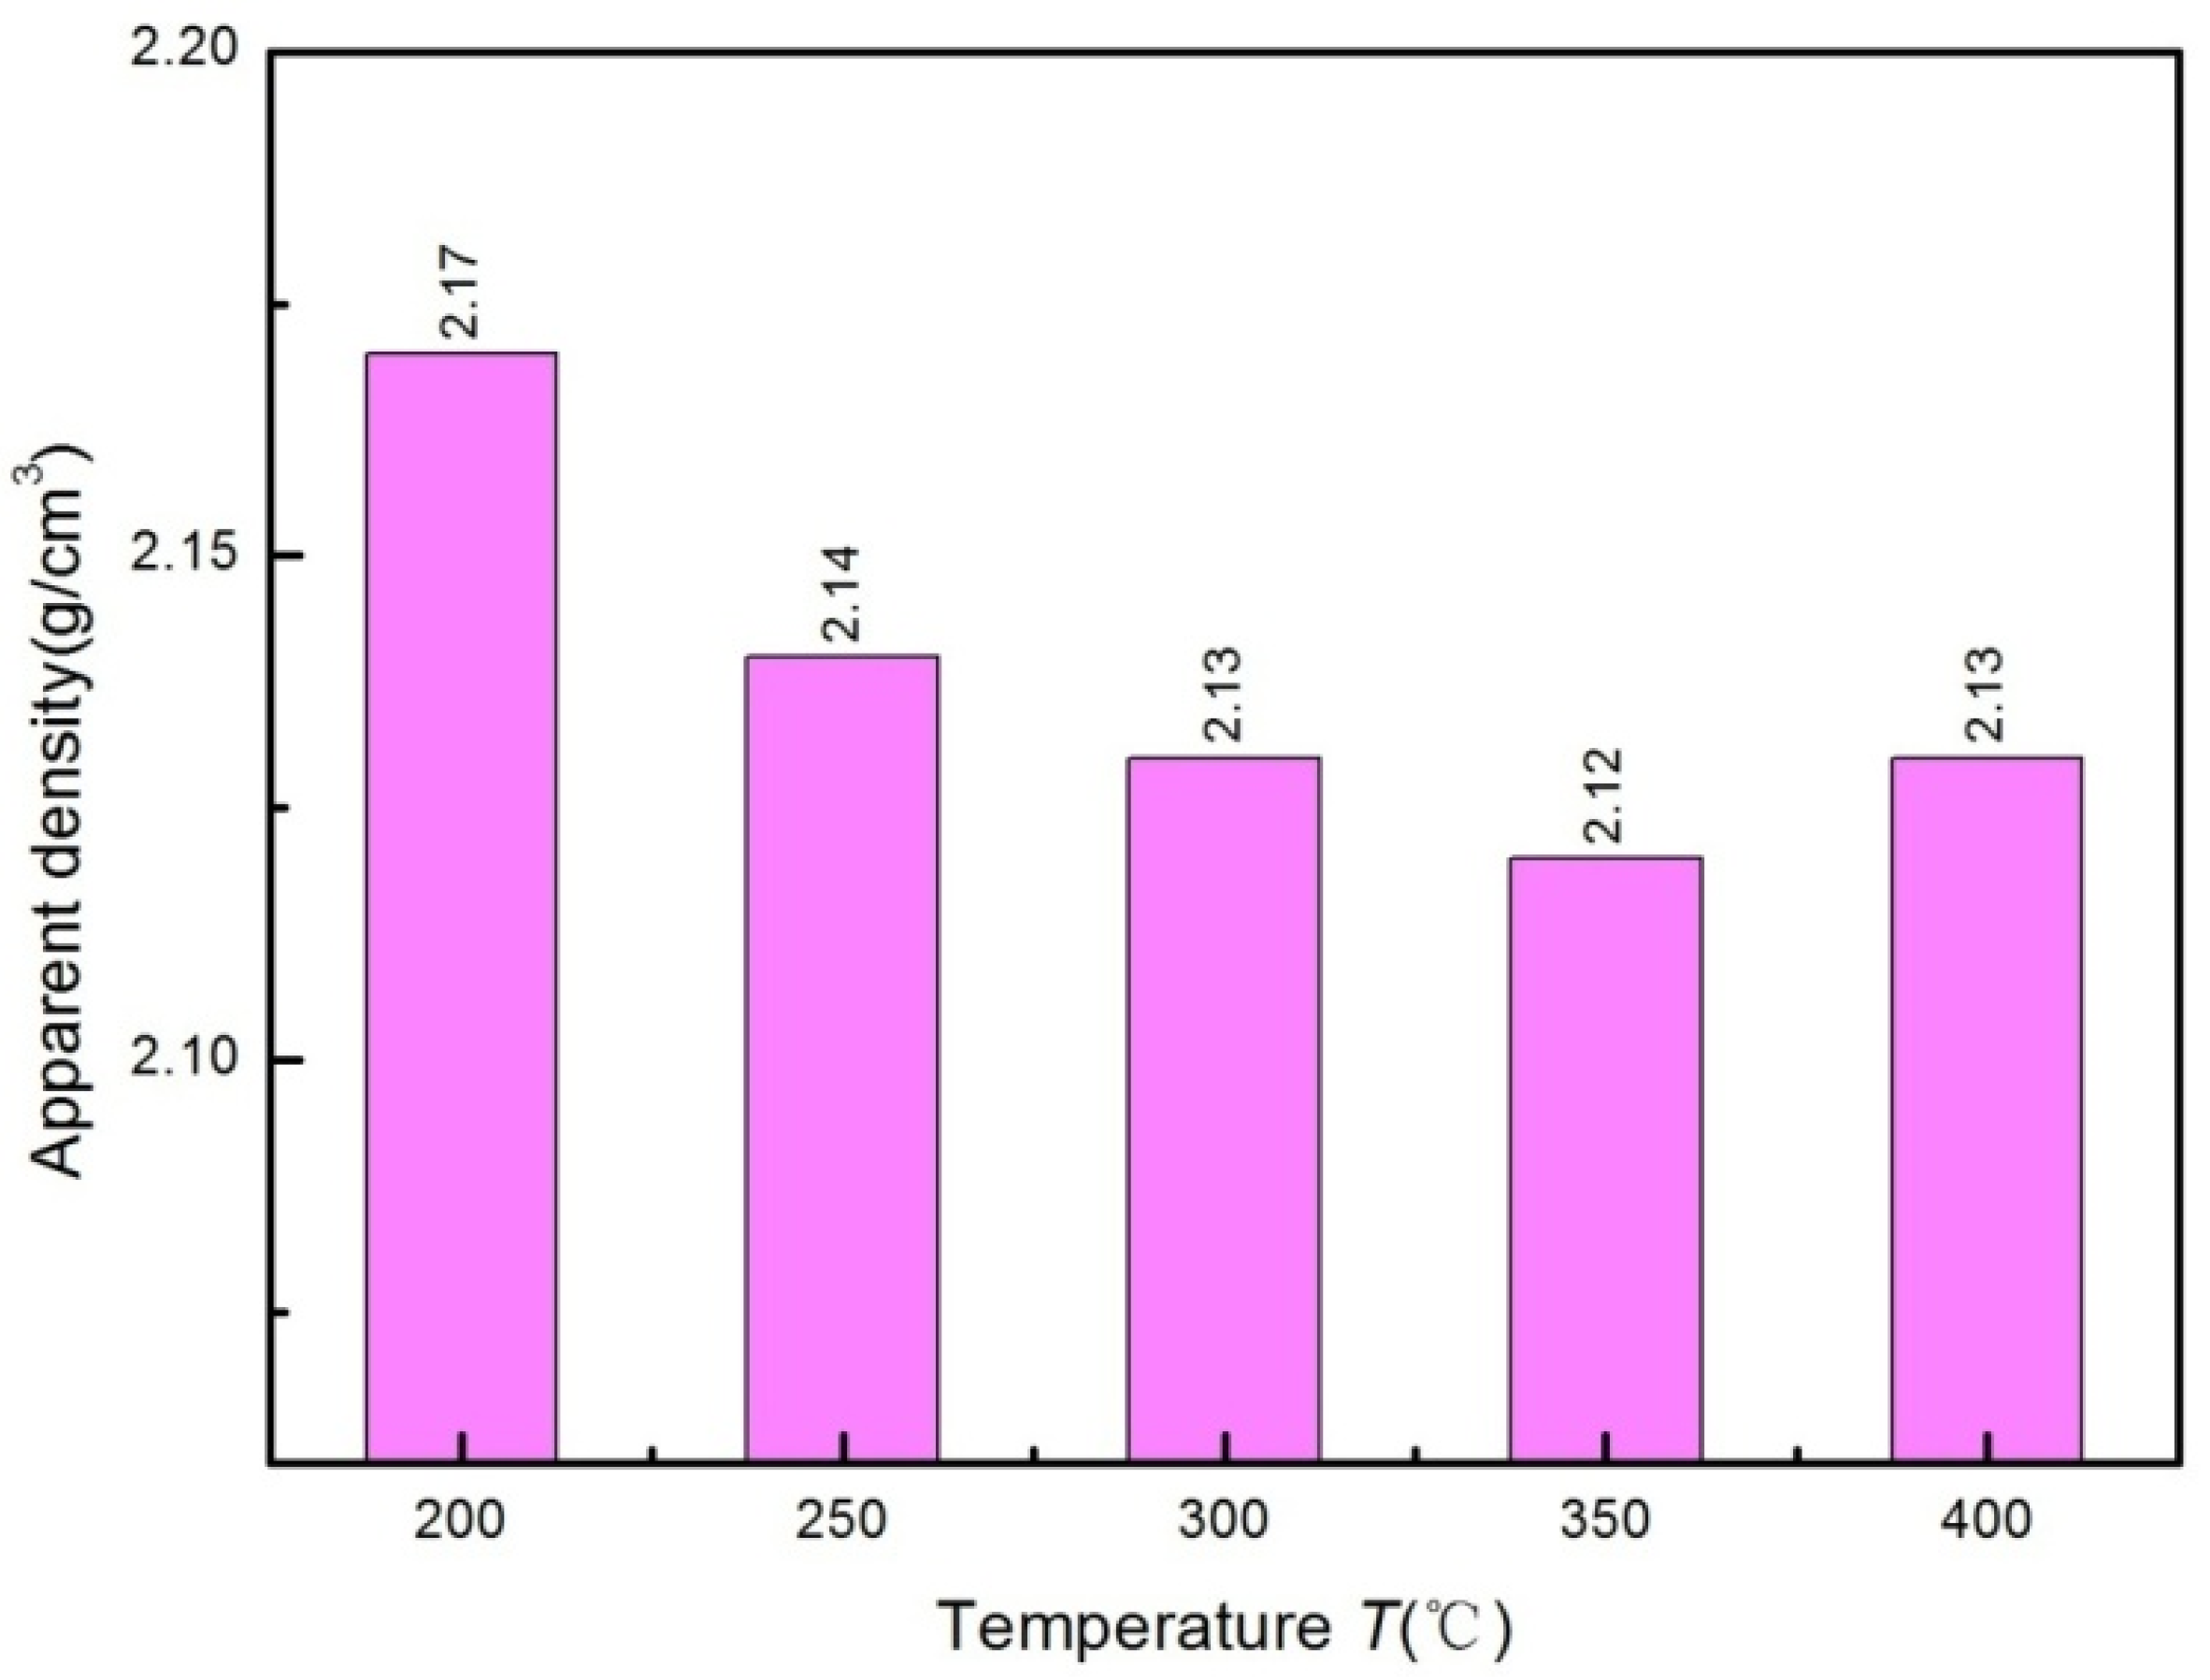
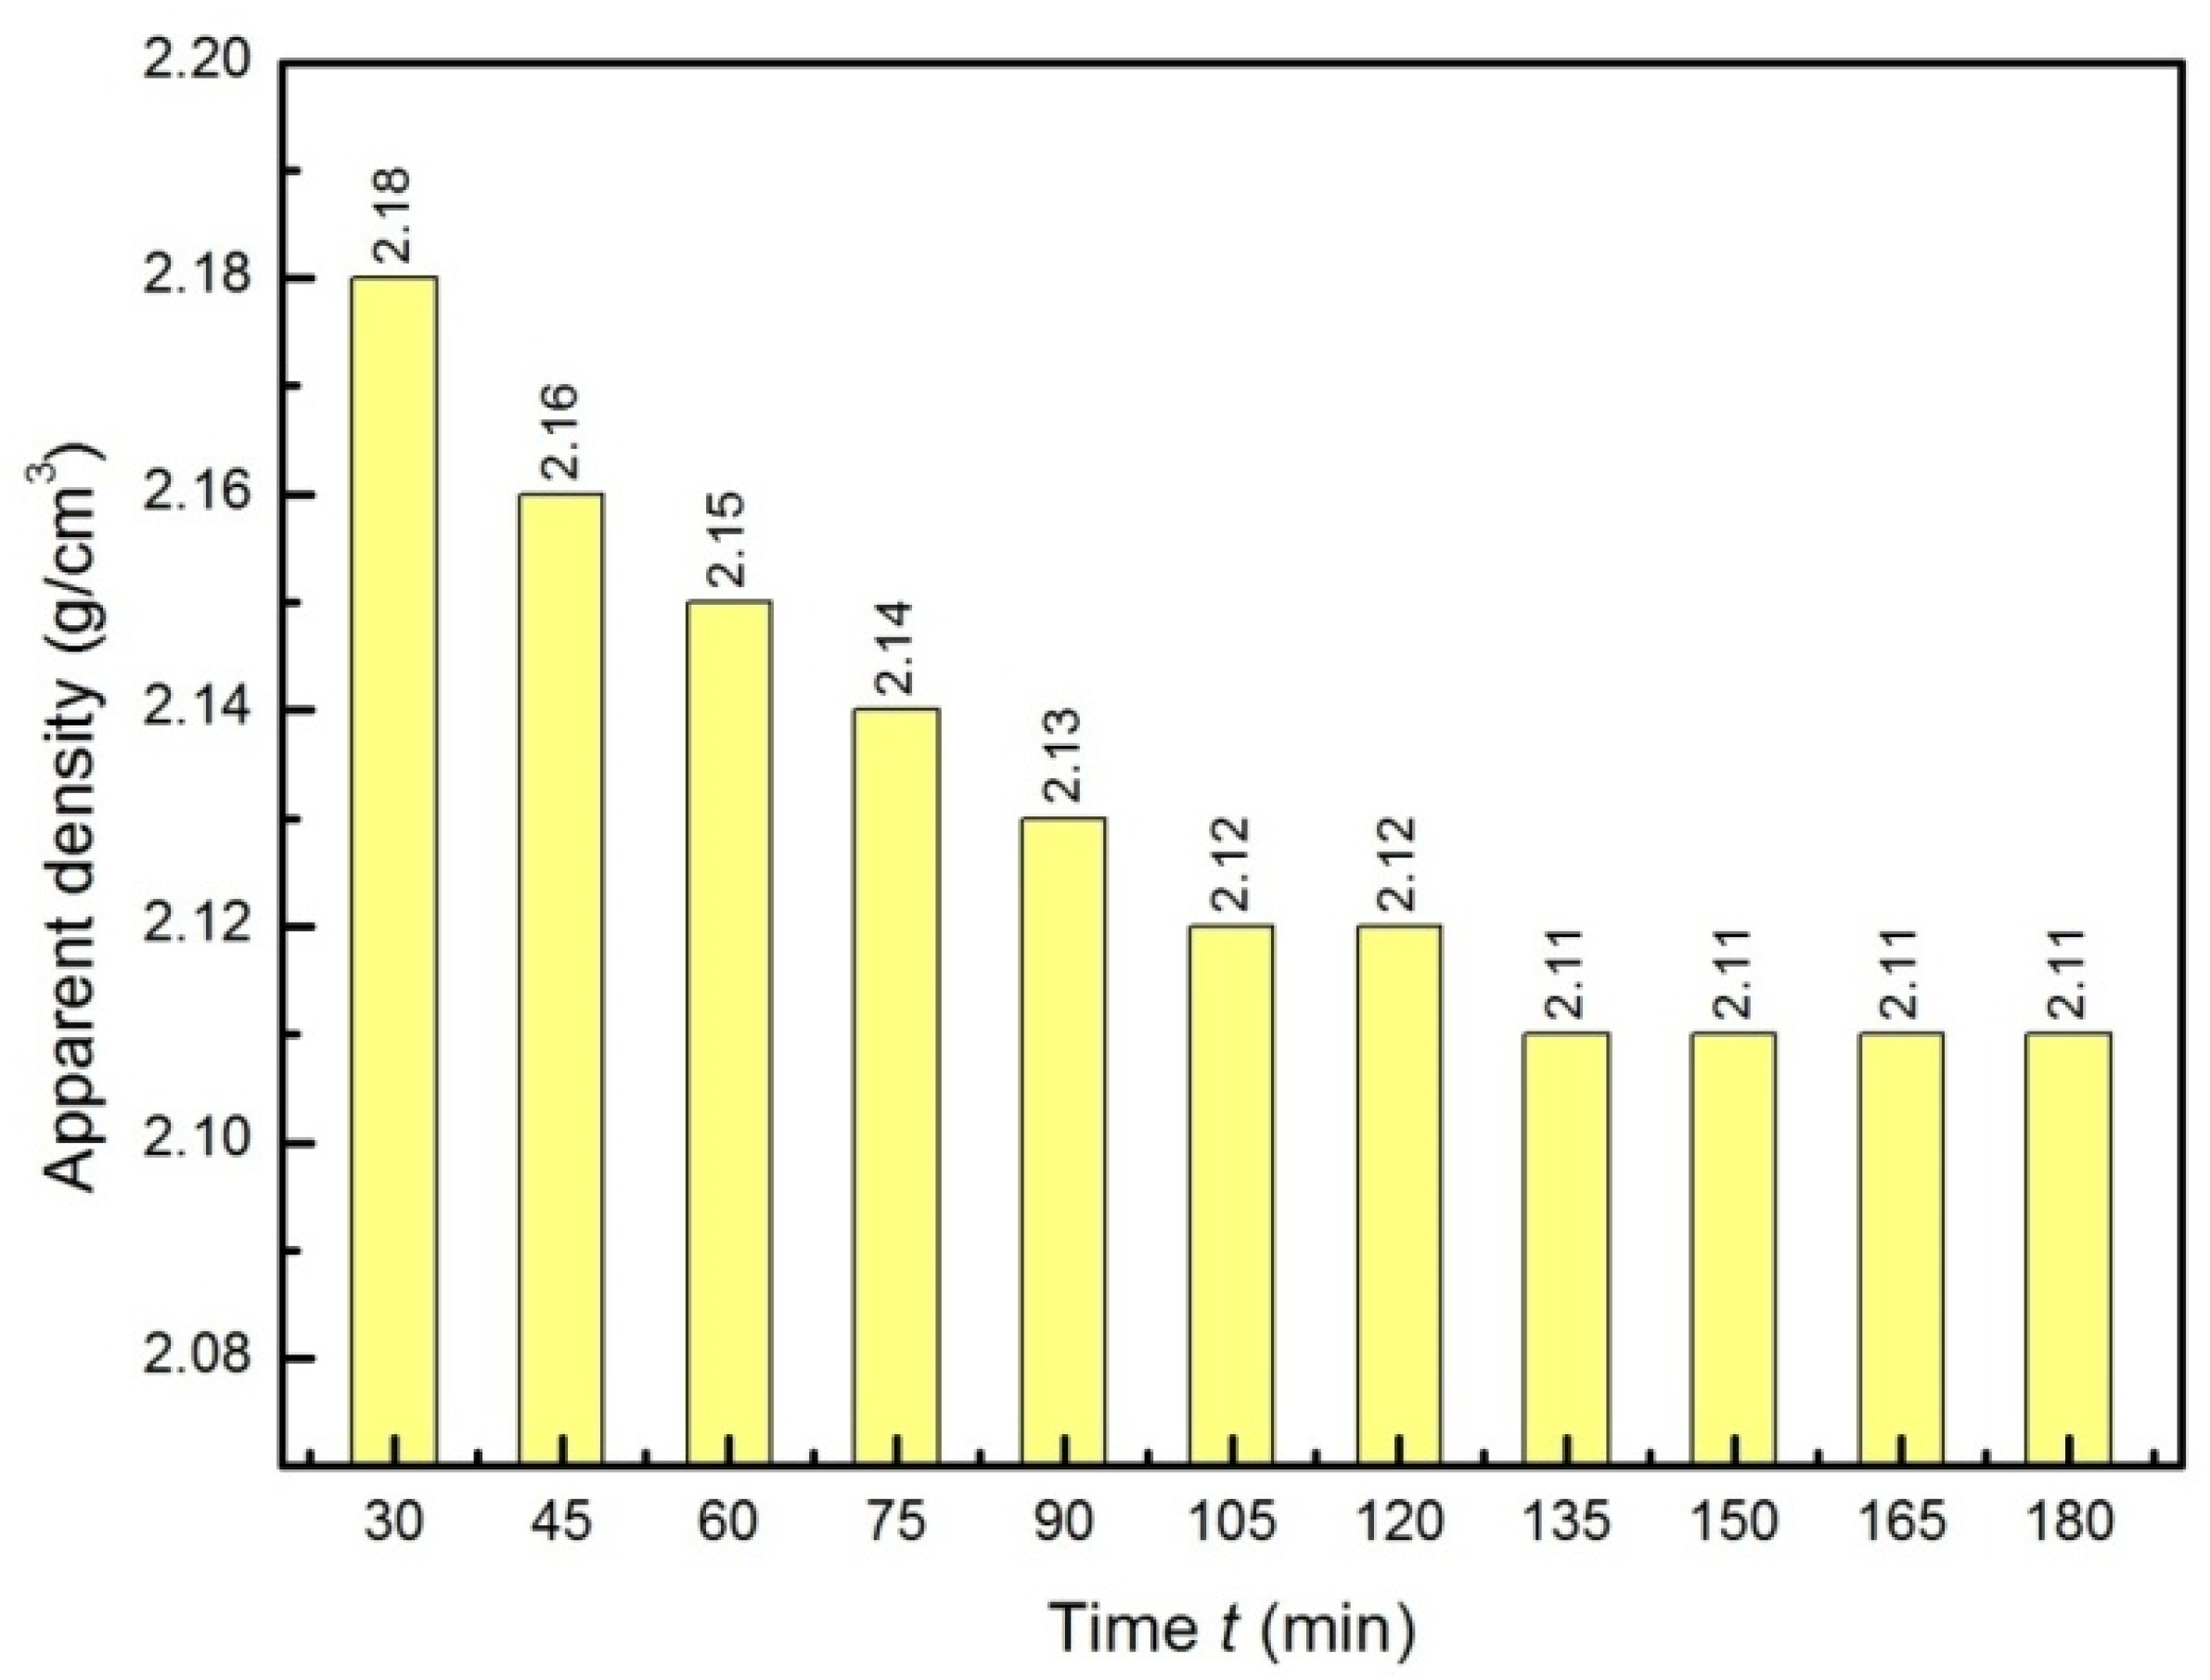
3.2. Characteristics of Microscopic Morphology and Apparent Density

The higher the dendritic degree of copper powder, the greater the specific surface area. Cauliflower-like and shrub-like copper powder with multistage dendrite arms have similar porous structures from the point of individual copper powder particles. This structure gives copper powder good green strength, which is very important for powder metallurgical parts. Excellent green strength guarantees that the green compact is not damaged after it is removed from the forming die and transported to sintering equipment.
The micromorphology of the oxidized copper powder is illustrated in Figure 6. The copper powder dendrites presented stronger dendrite arms, less gap between dendrite arms, and big dendrons. Both the surface and tip of dendrite arms were no longer in sharp states but had rounded dendritic shapes, as shown in Figure 6c. The surface of dendrons was rough due to the nucleus of copper oxide on the surface of the copper powder particles, as seen in Figure 6d. The surface on the tip of arms was not that rough relative to the inner position on the dendrite arms.
Figure 7 is an EDS diagram of the partially oxidized copper powder in this study. It indicates that the dendritic surface was not entirely covered with copper oxide. The amount of copper oxide was relatively small, and oxidation only occurred on the particle surface, as shown in Figure 6d.
Copper powder after reduction kept gaps between dendrite arms, as shown in Figure 8. This means that once the copper powder was oxidized, the micromorphology of copper powder was not restored to that before oxidation. Figure 8d shows that the dendrite surface, especially the tip, became relatively smooth in a dendritic cellular state. However, some dendrite arms may still not have been fully reduced. The EDS spectrum (Figure 9) revealed that the copper powder particles contained almost no oxygen.
The apparent density of copper powder was examined after reduction. Two of these groups were selected, and one was reduced for 90 min at 200 °C, 250 °C, 350 °C, 350 °C, and 400 °C, and the other group was reduced at 350 °C for 30 min to 180 min.
The apparent density of the partially oxidized copper powder samples was 2.21 g·cm−3. As shown in Figure 10, the apparent density decreased gradually when the reduction temperature rose from 200 °C to 350 °C. The copper powder samples had a certain degree of enlargement during the process of reduction [12]. New metallic nuclei formed on the sample surface and grew with the reduction time during the process, which means that more and more particles fixed progressively at longer interparticle distances and led later to shorter interparticle distances. Higher temperatures facilitated this process. This was the main cause for smaller apparent density. However, when the reduction temperature continued to rise to 400 °C, apparent density increased slightly. The possible reason is that sintering occurred at this temperature.
Although the melting point of metal copper reached 1357 K (101.325 kPa, 273.15 K), the tips of copper powder dendrites tended to sinter at lower temperatures because of their dendritic structure. In fact, we carried out reduction experiments at 500 °C and found that even the copper powder in contact with the surface of the porcelain boat strongly sintered and became flat. Figure 11 shows the effect of reduction time on apparent density. The apparent density of samples gradually decreased as the reduction reaction proceeded. When the copper oxide covered on the sample surface was all reduced, apparent density no longer changed.
The micromorphology of metal powder particles has a considerable impact on apparent density, which affects the strength when pressed into a raw blank [14,17,18]. Green density and pressing pressure are also affected by the micromorphology of particles. This dependence is weaker for spherical particles, slightly stronger for irregular particles, and strongest for dendrites [19]. The relationship between micromorphology and apparent density has been consistently reported. That is, the higher the degree of powder irregularities, the greater the apparent density [20]. To reduce the apparent density of copper powder after reduction, high temperatures cannot be adopted. Otherwise, the gap between the dendrite arms will decreases and the particles will be more compact. A better apparent density can be obtained at relatively low temperatures along with an appropriate extension of reduction time.

4. Conclusions

(1)
There is no significant induction during the hydrogen reduction of cauliflower-like copper powder. Due to the closure of metallic copper, internal diffusion becomes the controlling step of reduction reaction rate. The apparent activation energy is calculated to be 14.18 KJ·mol−1.
(2)
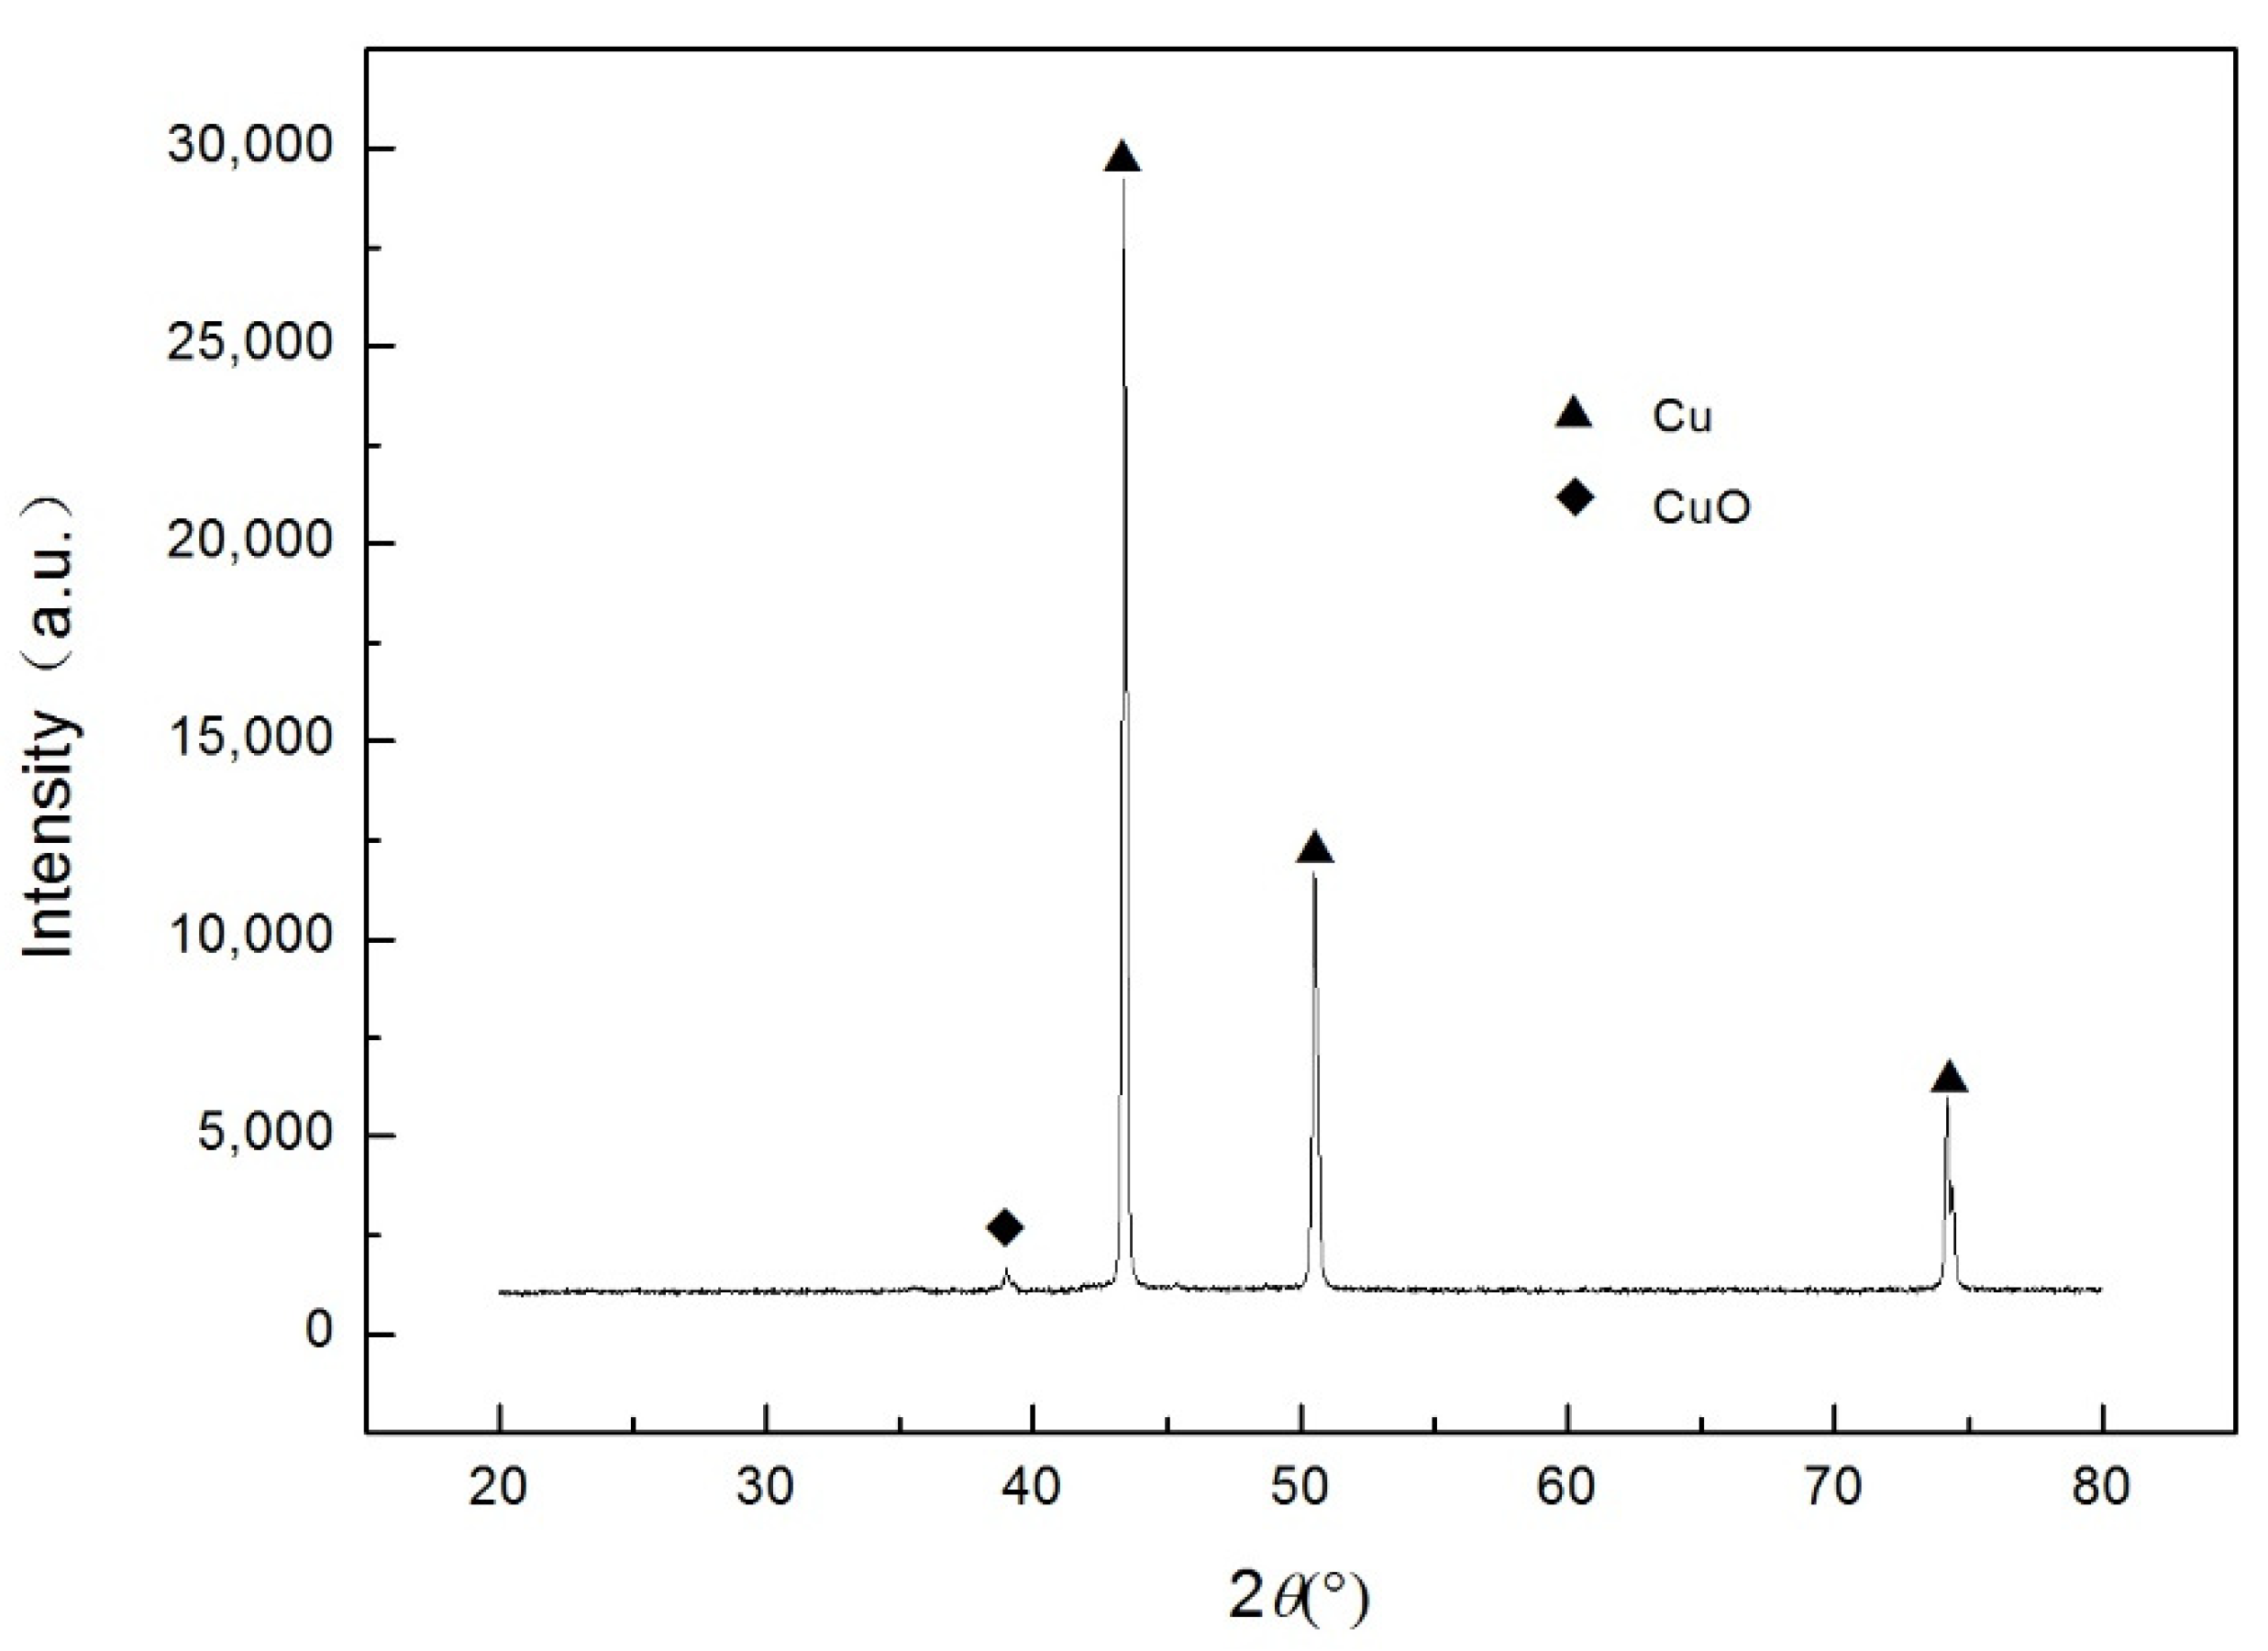
The oxidation of the copper powder samples occurs only on the surface, and the particles remain compact after reduction. Yet the tips of dendrite arms become smooth and round, appearing in a dendritic cellular state.
(3)
The apparent density of copper powder shows an overall decreasing trend after reduction, but it will reach a platform value, that is, with increase of reduction time, apparent density will not further decrease. However, excess temperature will lead to increased apparent density of copper powder, mainly due to the sintering of copper particles.

Author Contributions

Methodology, J.A. and G.X.; formal analysis, W.X.; investigation, J.A. and K.L.; data curation, J.A. and K.L.; writing—original draft preparation, J.A.; writing—review and editing, J.A., W.X., G.X., X.Y., H.A. and H.W.; supervision, G.X. and X.Y.; funding acquisition, W.X. and H.W. All authors have read and agreed to the published version of the manuscript.

Funding

This research was funded by the Science and Technology Research Program of Chongqing Municipal Education Commission, grant number KJQN202001533; the National Natural Science Foundation of China, grant number 52174331; the Natural Science Foundation of Chongqing, grant number cstc2020jcyj-msxmX0471; Science and Technology Leading Talents Training Plan, grant number 2017HA012; the Natural Science Foundation of Chongqing, grant number cstc2021jcyj-msxmX0573; and the Natural Science Foundation of Chongqing, grant number cstc2021jcyj-msxmX0743.

Institutional Review Board Statement

This study does not require ethical approval.

Informed Consent Statement

This study does not involve humans.

Data Availability Statement

This study did not report any data.

Conflicts of Interest

The authors declare no conflict of interest.

References

  1. Orhan, G.; Hapçı, G. Effect of electrolysis parameters on the morphologies of copper powder obtained in a rotating cylinder electrode cell. Powder Technol. 2010, 201, 57–63. [Google Scholar] [CrossRef]
  2. Hu, C.; Wang, X.; Lim, M.K.; Chen, W.Q. Characteristics of the global copper raw materials and scrap trade systems and the policy impacts of China’s import ban. Ecol. Econ. 2020, 172, 106626. [Google Scholar] [CrossRef]
  3. Wang, H.; Wang, Q.; Xia, W.; Ren, B. Effect of jet flow between electrodes on power consumption and the apparent density of electrolytic copper powders. Powder Technol. 2019, 343, 607–612. [Google Scholar] [CrossRef]
  4. Nikolić, N.; Popov, K.; Pavlović, L.J.; Pavlović, M. Morphologies of copper deposits obtained by the electrodeposition at high overpotentials. Surf. Coatings Technol. 2006, 201, 560–566. [Google Scholar] [CrossRef]
  5. Nikolic, N.; Branković, G.; Pavlović, M.G. Correlate between morphology of powder particles obtained by the different regimes of electrolysis and the quantity of evolved hydrogen. Powder Technol. 2012, 221, 271–277. [Google Scholar] [CrossRef]
  6. An, J.; Xie, G.; Xia, W.; Wang, H.; Ren, B.; Liu, K. Preparation of fine copper powders by galvanostatic regime of electrolysis of copper scrap in a cylindrical electrochemical cell. Powder Technol. 2021, 386, 193–198. [Google Scholar] [CrossRef]
  7. Nikolic, N.; Pavlović, L.J.; Pavlović, M.; Popov, K. Morphologies of electrochemically formed copper powder particles and their dependence on the quantity of evolved hydrogen. Powder Technol. 2008, 185, 195–201. [Google Scholar] [CrossRef]
  8. Maksimović, V.M.; Pavlović, L.J.; Pavlović, M.G.; Tomic, M.V. Characterization of copper powder particles obtained by electrodeposition as function of different current densities. J. Appl. Electrochem. 2009, 39, 2545–2552. [Google Scholar] [CrossRef]
  9. Ding, C.; Lv, X.; Xuan, S.; Tang, K.; Bai, C. Isothermal reduction kinetics of powdered hematite and calcium ferrite with CO–N2 gas mixtures. ISIJ Int. 2016, 56, 2118–2125. [Google Scholar] [CrossRef] [Green Version]
  10. Ramos, S.V.; Cisquini, P.; Nascimento, R.C., Jr.; Franco, A.R., Jr.; Vieira, E.A. Morphological changes and kinetic assessment of Cu2O powder reduction by non-thermal hydrogen plasma. J. Mater. Res. Technol. 2021, 11, 328–341. [Google Scholar] [CrossRef]
  11. Kim, J.Y.; Rodriguez, J.A.; Hanson, J.C.; Frenkel, A.I.; Lee, P.L. Reduction of Cu2O and Cu2O with H2 Hembedding and kinetic effects in the formation of suboxides. J. Am. Chem. Soc. 2003, 125, 10684–10692. [Google Scholar] [CrossRef] [PubMed]
  12. Jelić, D.; Tomić-Tucaković, B.; Mentus, S. A kinetic study of copper(II) oxide powder reduction with hydrogen, based on thermogravimetry. Thermochim. Acta 2011, 521, 211–217. [Google Scholar] [CrossRef]
  13. Hamada, S.; Kudo, Y.; Tojo, T. Preparation and reduction kinetics of uniform copper particles from copper(I) oxides with hydrogen. Colloids Surfaces 1992, 67, 45–51. [Google Scholar] [CrossRef]
  14. Pavlovic, M.; Pavlovic, L.; Ivanovic, E.; Radmilovic, V.; Popov, K. The effect of particle structure on apparent density of electrolytic copper powder. J. Serbian Chem. Soc. 2001, 66, 923–933. [Google Scholar] [CrossRef]
  15. Rodriguez, J.A.; Kim, J.Y.; Hanson, J.C.; Perez, M.; Frenkel, A.I. Reduction of CuO in H2 in situ time-resolved XRD studies. Catal. Lett. 2003, 85, 247–254. [Google Scholar] [CrossRef]
  16. Lewis, J.S. 105. The reduction of copper oxide by hydrogen. J. Chem. Soc. (Resumed) 1932, 820–826. Available online: https://doi.org/10.1039/JR9320000820 (accessed on 1 January 2022). [CrossRef]
  17. Popov, K.; Pavlovic, L.; Ivanovic, E.; Radmilovic, V.; Pavlovic, M. The effect of reversing current deposition on the apparent density of electrolytic copper powder. J. Serbian Chem. Soc. 2002, 67, 61–67. [Google Scholar] [CrossRef]
  18. Zhu, H.; Fuh, J.; Lu, L. The influence of powder apparent density on the density in direct laser-sintered metallic parts. Int. J. Mach. Tools Manuf. 2007, 47, 294–298. [Google Scholar] [CrossRef]
  19. Kirchhof, R. The particle shape influence on the apparent density and electric conductivity of pressed powder materials. Mater. Chem. 1981, 6, 209–222. [Google Scholar] [CrossRef]
  20. Popov, K.; Zivkovic, P.; Krstic, S. The apparent density as a function of the specific surface of copper powder and the shape of the particle size distribution curve. J. Serbian Chem. Soc. 2003, 68, 903–907. [Google Scholar] [CrossRef]
Figure 1. The XRD pattern of partially oxidized copper powder sample.
Metals 12 00413 g001
Figure 2. Schematic diagram of reduction device.
Metals 12 00413 g002
Figure 3. Effects of temperature and time on the reduction rate.
Metals 12 00413 g003
Figure 4. Relationship between 1 3 ( 1 X ) 2 3 + 2 ( 1 X ) and t.
Metals 12 00413 g004
Figure 5. Arrhenius plots for the revolution of the internal diffusion controlling step.
Metals 12 00413 g005
Figure 6. SEM micrographs of the partially oxidized copper powder (the original commercial sample): (a) ×200, (b) ×1000, (c) ×2000, (d) ×5000.
Metals 12 00413 g006
Figure 7. EDS spectrum of the partially oxidized copper powder (the original commercial sample).
Metals 12 00413 g007
Figure 8. SEM micrographs of reduced copper powder (reduction temperature 350 °C, time 135 min): (a) ×200, (b) ×1000, (c) ×2000, (d) ×5000.
Metals 12 00413 g008
Figure 9. The EDS spectrum of reduced copper powder (reduction temperature 350 °C, time 135 min).
Metals 12 00413 g009
Figure 10. Effects of reduction temperature on apparent density (reduction time 90 min).
Metals 12 00413 g010
Figure 11. The effect of reduction time on apparent density (reduction temperature 350 °C).
Metals 12 00413 g011
Table 1. Fitting results of 1 3 ( 1 X ) 2 3 + 2 ( 1 X ) vs. t.
Temperature (°C)200250300350400
Fitting Parameters
B0.00270.003940.004850.006710.00782
R20.988070.991190.996870.998210.99497
SD0.013190.016510.012080.012630.02471
P0.00020.0001<0.0001<0.0001<0.0001
Table 2. Fitting results of l n k vs. 1/T
Fitting ParametersABR2SDP
values2.30581704.980.99350.03940.0002
Publisher’s Note: MDPI stays neutral with regard to jurisdictional claims in published maps and institutional affiliations.

