Article

Rejuvenation-to-Relaxation Transition Induced by Elastostatic Compression and Its Effect on Deformation Behavior in a Zr-Based Bulk Metallic Glass

1
Jiangsu Key Laboratory for Advanced Metallic Materials, School of Materials Science and Engineering, Southeast University, Nanjing 211189, China
2
Institute of Massive Amorphous Metal Science, China University of Mining and Technology, Xuzhou 221116, China
*
Authors to whom correspondence should be addressed.
Metals 2022, 12(2), 282; https://doi.org/10.3390/met12020282
Submission received: 1 January 2022 / Revised: 24 January 2022 / Accepted: 31 January 2022 / Published: 4 February 2022
(This article belongs to the Section Entropic Alloys and Meta-Metals)

Abstract

:
The effect of uniaxial elastostatic compression on the deformation behavior of the Zr41.2Ti13.8Cu12.5Ni10Be22.5 (Vit1) bulk metallic glass (BMG) was reported. The as-cast alloy was pre-compressed under various time (20, 40 and 60 h) at a preloading level of 87% of its yield strength. It was found that elastostatic compression can lead to structural rejuvenation or relaxation depending on the pre-compression time. Elastostatic compression, for 40 h, increased the free volume and improved the plasticity of the BMGs from 1.4% to 3.4%, but preloading for 60 h decreased the free volume and worsened the plasticity. In addition, the heterogeneous structure evolution during creep deformation has been analyzed by the Maxwell-Voigt model with two Kelvin units, revealing that more (less) defects with larger size are activated after elastostatic compression treatment for 40 h (60 h). This work sheds new light on the correlation between heterogeneous structure and plasticity/creep behaviors of Zr-based BMGs.

1. Introduction

Cooling a glass-forming metallic liquid to room temperature results in a metallic glass. Compared with traditional alloys, bulk metallic glasses (BMGs) are fascinating structural and functional materials which attract considerable attention all over the world, owing to their outstanding magnetic, chemical and mechanical properties, such as excellent soft magnetic properties, high strength, large elastic limit and high Young’s modulus [1,2,3,4]. However, their poor plasticity at room temperature severely restricts the structural application [5]. It has been well accepted that the poor plasticity is attributed to the formation of highly localized narrow (~10 nm) shear bands (SBs) [1,6] and shear softening at room temperature [7]. The interplay between shear localization and strain softening has a profound effect on the macroscopic deformation and fracture, i.e., a shear band can easily become runaway, leading to the catastrophic failure or brittle fracture of BMGs [8].
To improve the plasticity of BMGs at room temperature, three types of general strategies have been developed as follows:
  • modifying compositions of BMGs;
  • producing composite structure that comprises amorphous matrix and second phase particles or dendrites [9,10,11];
  • introducing structural heterogeneity in BMGs [12,13].
Compared with the former two strategies, the third strategy has the advantage of easy utilization and independence of the composition of BMGs. Techniques including high-pressure treatment [14], cold rolling [15], cryogenic thermal cycling (CTC) treatment [16,17,18,19] and elastostatic compression [20,21] have been widely used. Among them, elastostatic compression is one of the effective methods inducing irreversible structural disordering into the materials without producing shear bands or changing the shape and dimensions of BMGs.
In 2008, Lee et al. reported that compressive loading of a Cu65Zr35 bulk metallic glass at 90% of macroscopic yield stress for 12 h led to rejuvenation and improvement of the plastic strain from zero to 5.2% [22]. Following this work, numerous efforts were made to explore the effect of elastostatic compression conditions on the deformation behavior of various BMG systems [6,23,24,25,26]. For example, Tong et al. reported that a threshold stress should be applied for rejuvenation in thermos-mechanical creep [27]. Majid et al. studied the effects of cryothermal cycling and tensile elastostatic loading of Zr-based BMGs and found that the application of both processes leads to a considerable increase in stored energy [28]. The elastic loading was done to change the mechanical properties and investigate structural evolution of a Ti-based BMGs. It was reported that the relaxation enthalpy increases with increasing stress levels, indicating the increase of free volume contents [29]. Majid et al. also studied the effects of rejuvenation on atomic-level stresses and nanoscale spatial heterogeneity of a Zr-based BMG and indicated that the increase in loading value leads to the structural disordering [30]. Zhang et al. showed that aged Zr-based BMGs could easily rejuvenated by elastostatic pre-loading and, hence, improve the plasticity [31].
Although there were plenty of studies regarding how the elastostatic compression can change the energy state and tune the plasticity of BMGs, it remains elusive about the relationship between evolution of heterogeneous structure at different length scales during elastostatic compression and deformation. To shed further light onto this correlation, the effects of elastostatic compression time with the same compression stress on the energy state and plastic behavior of Zr41.2Ti13.8Cu12.5Ni10Be22.5 (Vit1) BMG samples were systematically investigated in this paper. Moreover, the effect of elastostatic compression on creep deformation was explored in virtue of nanoindentation techniques for the first time.
The Maxwell-Voigt model with two Kelvin units was utilized to analyze the defect activation during creep deformation of Vit1 BMGs at room temperature. It was found that the free volume variation, defect activation during creep deformation and plastic deformation are correlated with each other.

2. Experimental Methods

Copper mold casting method was used to fabricate cylindrical rods with a diameter of 3 mm of the Vit1 BMG samples. The rods were cut into short rods with length slightly longer than 6 mm using a low-speed diamond saw. The two ends of each short rod were carefully polished to acquired rod geometry with a length to diameter ratio of 2:1.
The critical stress of the transition from mechanical rejuvenation-to-relaxation may vary for different BMGs, depending on the chemical elements and aspects of their amorphous structures. In current Vit1 BMG samples, the elastostatic compression stress was selected after trying different parameters (such as 87%, 92% of their yield strength) to find whether such a transition really exists. Prior to the compression tests, the rod samples were elastostatic compressed under stress at a preloading level of 87% of the yield strength at room temperature for 20 h, 40 h and 60 h using a Sans 5305 testing machine (Sans, Shenzhen, China) with a strain rate of 1 × 10⁻⁴ s−1. The as-cast sample and elastostatic compression treated samples for 20 h, 40 h and 60 h are denoted as AC, T20, T40 and T60 samples, respectively. All the preloaded samples were left at room temperature for specific time to recover the anelastic strain components created during the elastostatic compression and subsequently compressed until failure. Hardened tool steel with the hardness and strength higher than those of the BMGs was used to make anvils that prevent the deformation of anvils during the deformation processes.
Samples for nanoindentation were selected randomly in the whole horizontal plane and were polished to acquire a mirror-like surface. The nanoindentation test was performed on a NanoTest Vantage (Micro Materials Ltd., Wrexham, UK) with a standard Berkovich diamond indenter. A standard fused silica sample was utilized for nanoindentation tests with the machine compliance calibration for the transducer-tip configuration and tip area functional calibration before each measurement. The load and displacement resolutions are 750 nN and 0.3 nm, respectively. Creep measurements were conducted according to the following sequence: tests at constant loading rates of 0.5, 10 and 50 mN/s were conducted to the maximum load of 50 mN followed by a holding period of 120 s to monitor the creep displacement and then unloaded at the same loading rates. At least five independent measurements were carried out under each condition to discard the biased results that are significantly against the others. The surface morphologies of the fractured samples were observed by field emission scanning electron microscope (Sirion 200, FEI, Shanghai, China). The thermal analysis of samples was carried out by differential scanning calorimeter (DSC, Netzsch 404 F3, Shanghai, China) at a heating rate of 20 K/min. In order to measure the relaxation enthalpy (ΔHrel), a second run using the same experimental procedure was carried out right after the first heating process and used as a baseline to be subtracted from the first DSC curve.

3. Results and Discussions

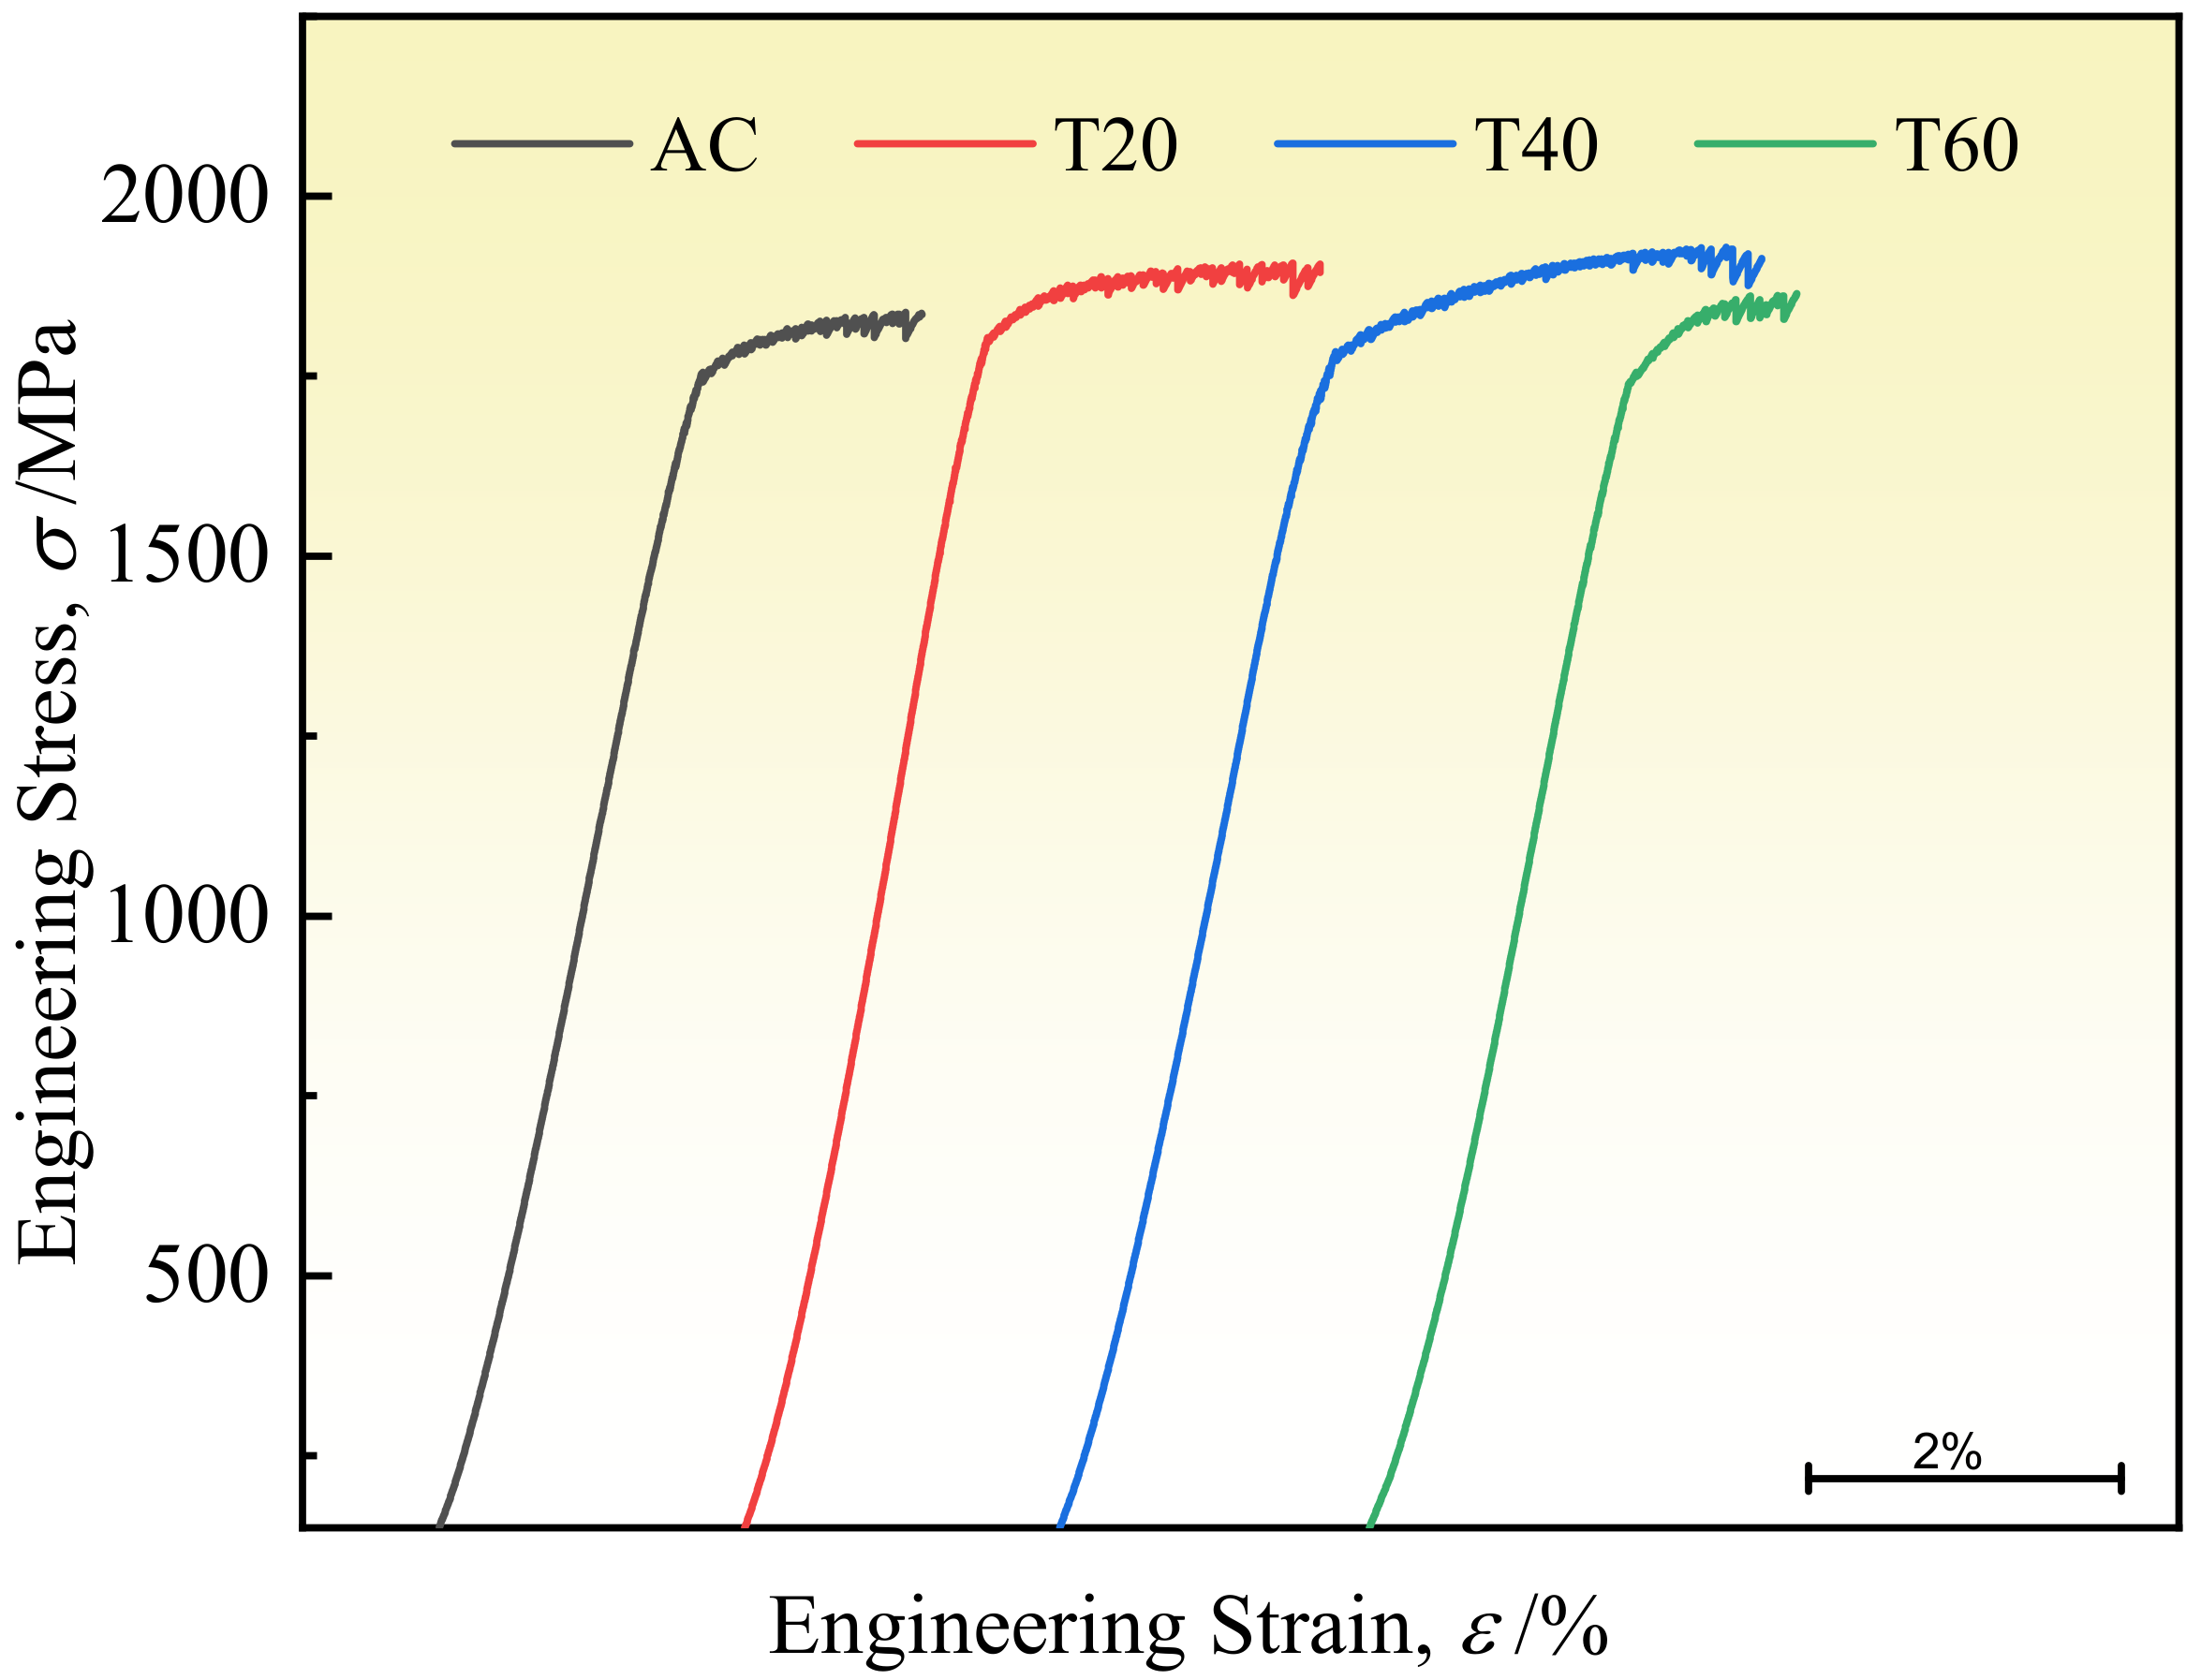
3.1. Mechanical Performance

Figure 1 shows the representative engineering stress-strain curves of the AC and elastostatic compression treated samples. It is obvious that the plasticity increases with the elastostatic compression duration increasing from 20 h to 40 h, then decreases with further increasing to 60 h. The plasticity of the AC sample was 1.4%. Applying the elastostatic compression for 20 and 40 h led to the increase of plasticity to 2.1% and 3.4%, respectively. Further increasing the preloaded time to 60 h resulted in substantial decrease of the ductility to 1.1%, even below that of AC sample. Despite the plasticity varies with different elastostatic compression durations, all the AC and pre-compression treated samples have the similar strength of the AC sample, which is consistent with the former report [32].
It is well known that a failure occurring in BMGs was caused by the formation of shear bands upon loading. The plastic deformation achieved by BMGs depending on the density of shear bands is virtually confined in narrow regions near shear bands [19]. The different fracture behaviors of the AC and elastostatic compression treated samples may be attributed to the density number and shape of shear bands. To further understand the deformation behavior related to the elastostatic compression duration, SEM (Sirion 200, FEI, Shanghai, China) observation was conducted on the fractured samples. Figure 2 displays the fracture morphologies of the AC and samples after elastostatic compression treatment for different durations. Fracture surface of each alloy has typical vein patterns that extent towards the shear stress direction. Vein patterns are characteristics of most metallic glasses, which can be attributed to melting within the main shear band induced by the elastic energy release during the instantaneous fracture. The mechanism of vein patterns is still controversial. At present, it is most widely accepted that the Taylors meniscus zone is responsible for the formation of vein patterns [19,33,34]. According to the model, the tensile fracture of metallic glass is just like two solid planes with a layer of viscous fluid. During the crack process, the contact interface between the fluid and air is subjected to negative pressure, which leads to fluid meniscus instability (Taylor instability) and, finally, forms vein patterns.
The density of vein patterns has an important effect on the plasticity of amorphous alloy. Denser vein patterns mean comparatively good plasticity of BMGs [35]. As shown in Figure 2c, it is worthy to notice that the fracture surface of the T40 sample possess more developed and denser vein patterns compared to the other samples, indicating a better plasticity for this alloy. In contrast, the T60 sample exhibits the morphology containing a large number of smooth zones without vein patterns which is the reflection of the low plasticity as illustrated in Figure 2d. Therefore, the result of the fracture morphology variation is consistent with that of the representative stress-strain curve in terms of plasticity.

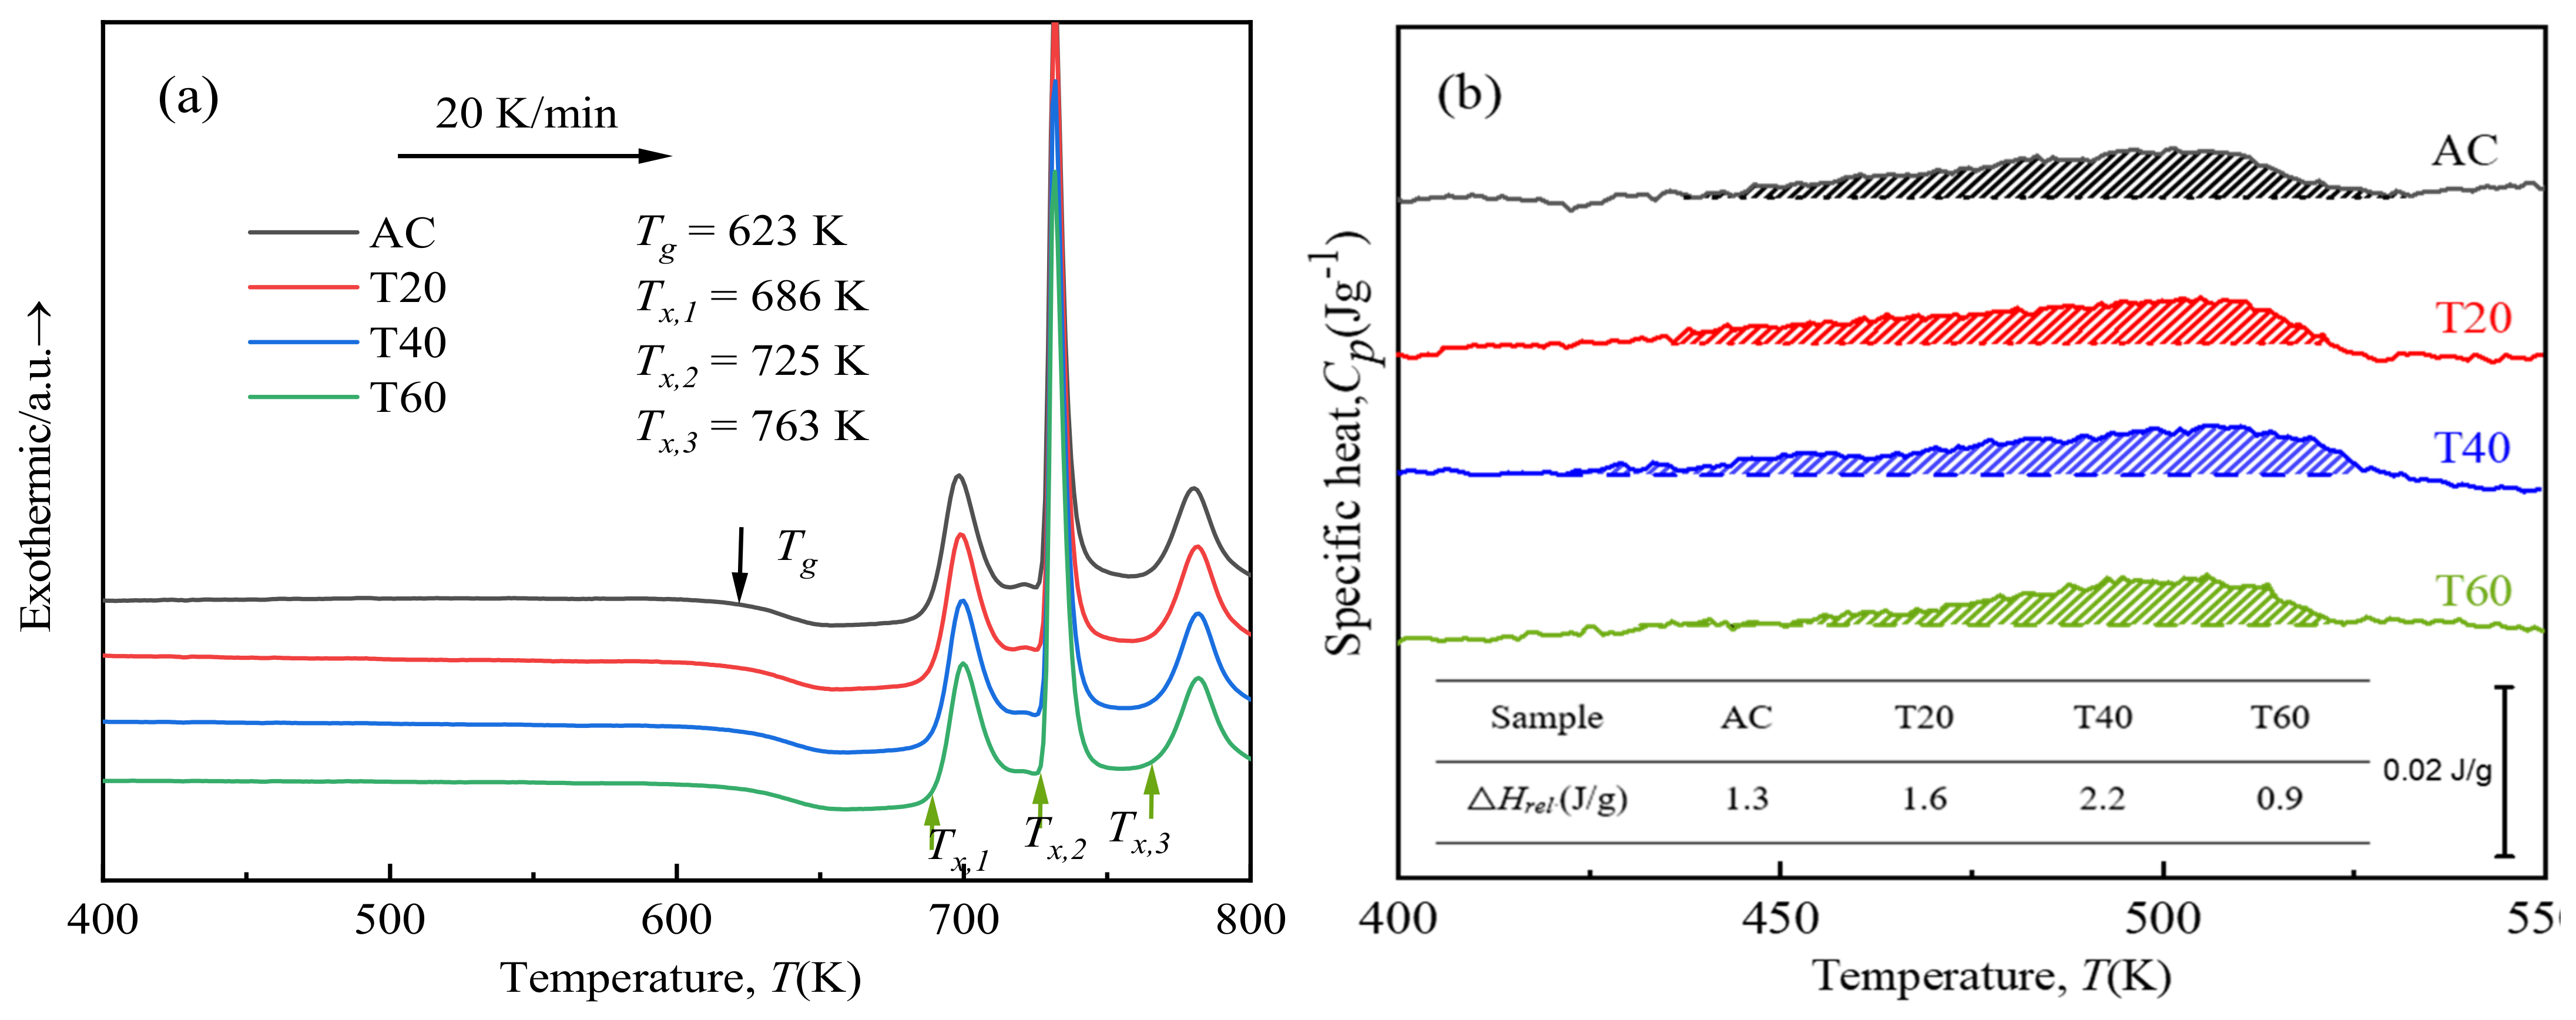
3.2. Differential Scanning Calorimetry Measurement

It has been known that elastostatic compression can lead to irreversible structural change, create excess free volume in BMGs and significantly affect the plasticity [36]. In addition, the increase of free volume is associated with an increase of the concentration of flow defects, corresponding to increased structural heterogeneities [37]. The change of free volume can be reflected by the variation of relaxation enthalpy (ΔHrel) in BMGs. Hence, it is possible to evaluate the effect of elastostatic compression on the free volume through measuring the variation of ΔHrel using DSC analysis.
Figure 3a compares the DSC traces of the as-cast and elastostatic compression treated Vit1 samples. It is clearly seen from Figure 3a that all samples have the same glass transition temperature (Tg) at 623 K and the same crystallization onset temperatures. Figure 3b shows the relaxation enthalpy of AC and pre-compression treated Vit1 samples derived from DSC measurements. The values of the ΔHrel are calculated from the shaded area upper the horizontal dashed line in the figure. Compared to that of the AC sample, the ΔHrel increases with the duration increasing from 20 h to 40 h, followed by decreasing sharply for the T60 sample. The increased ΔHrel is a sign of rejuvenation, during which the BMG evolves into a state of higher energy and more disordered structure. Therefore, the variation of ΔHrel in Figure 3b implies that the free volume increased via elastostatic compression with duration of 20 h and 40 h, while decreased via elastostatic compression with duration of 60 h. Park et al. indicated that excess free volume is created as a result of shear-induced atomic dilation even under a deformation below the yield stress and the amount of free volume reaches saturation after long-time loading [32]. In addition, free volume induced by appropriate elastostatic compression promotes atom arrangement, leading to improvement of structural heterogeneity, which is responsible for the enhancement of plasticity [36]. This does well agree with the variation of free volume and plasticity during elastostatic compression in present work. In addition, it was reported that free volume may decrease during inhomogeneous plastic deformation [38]. The coalescence of the excess free volume could condense into nanovoids, also resulting in the decreased amount of free volume [39,40]. Therefore, the lowest free volume content for the T60 sample is due to the occurrence of the structural inhomogeneous plastic deformation under the longest elastostatic compression duration. This explains our observation that a very long compression duration may reduce the free volume.

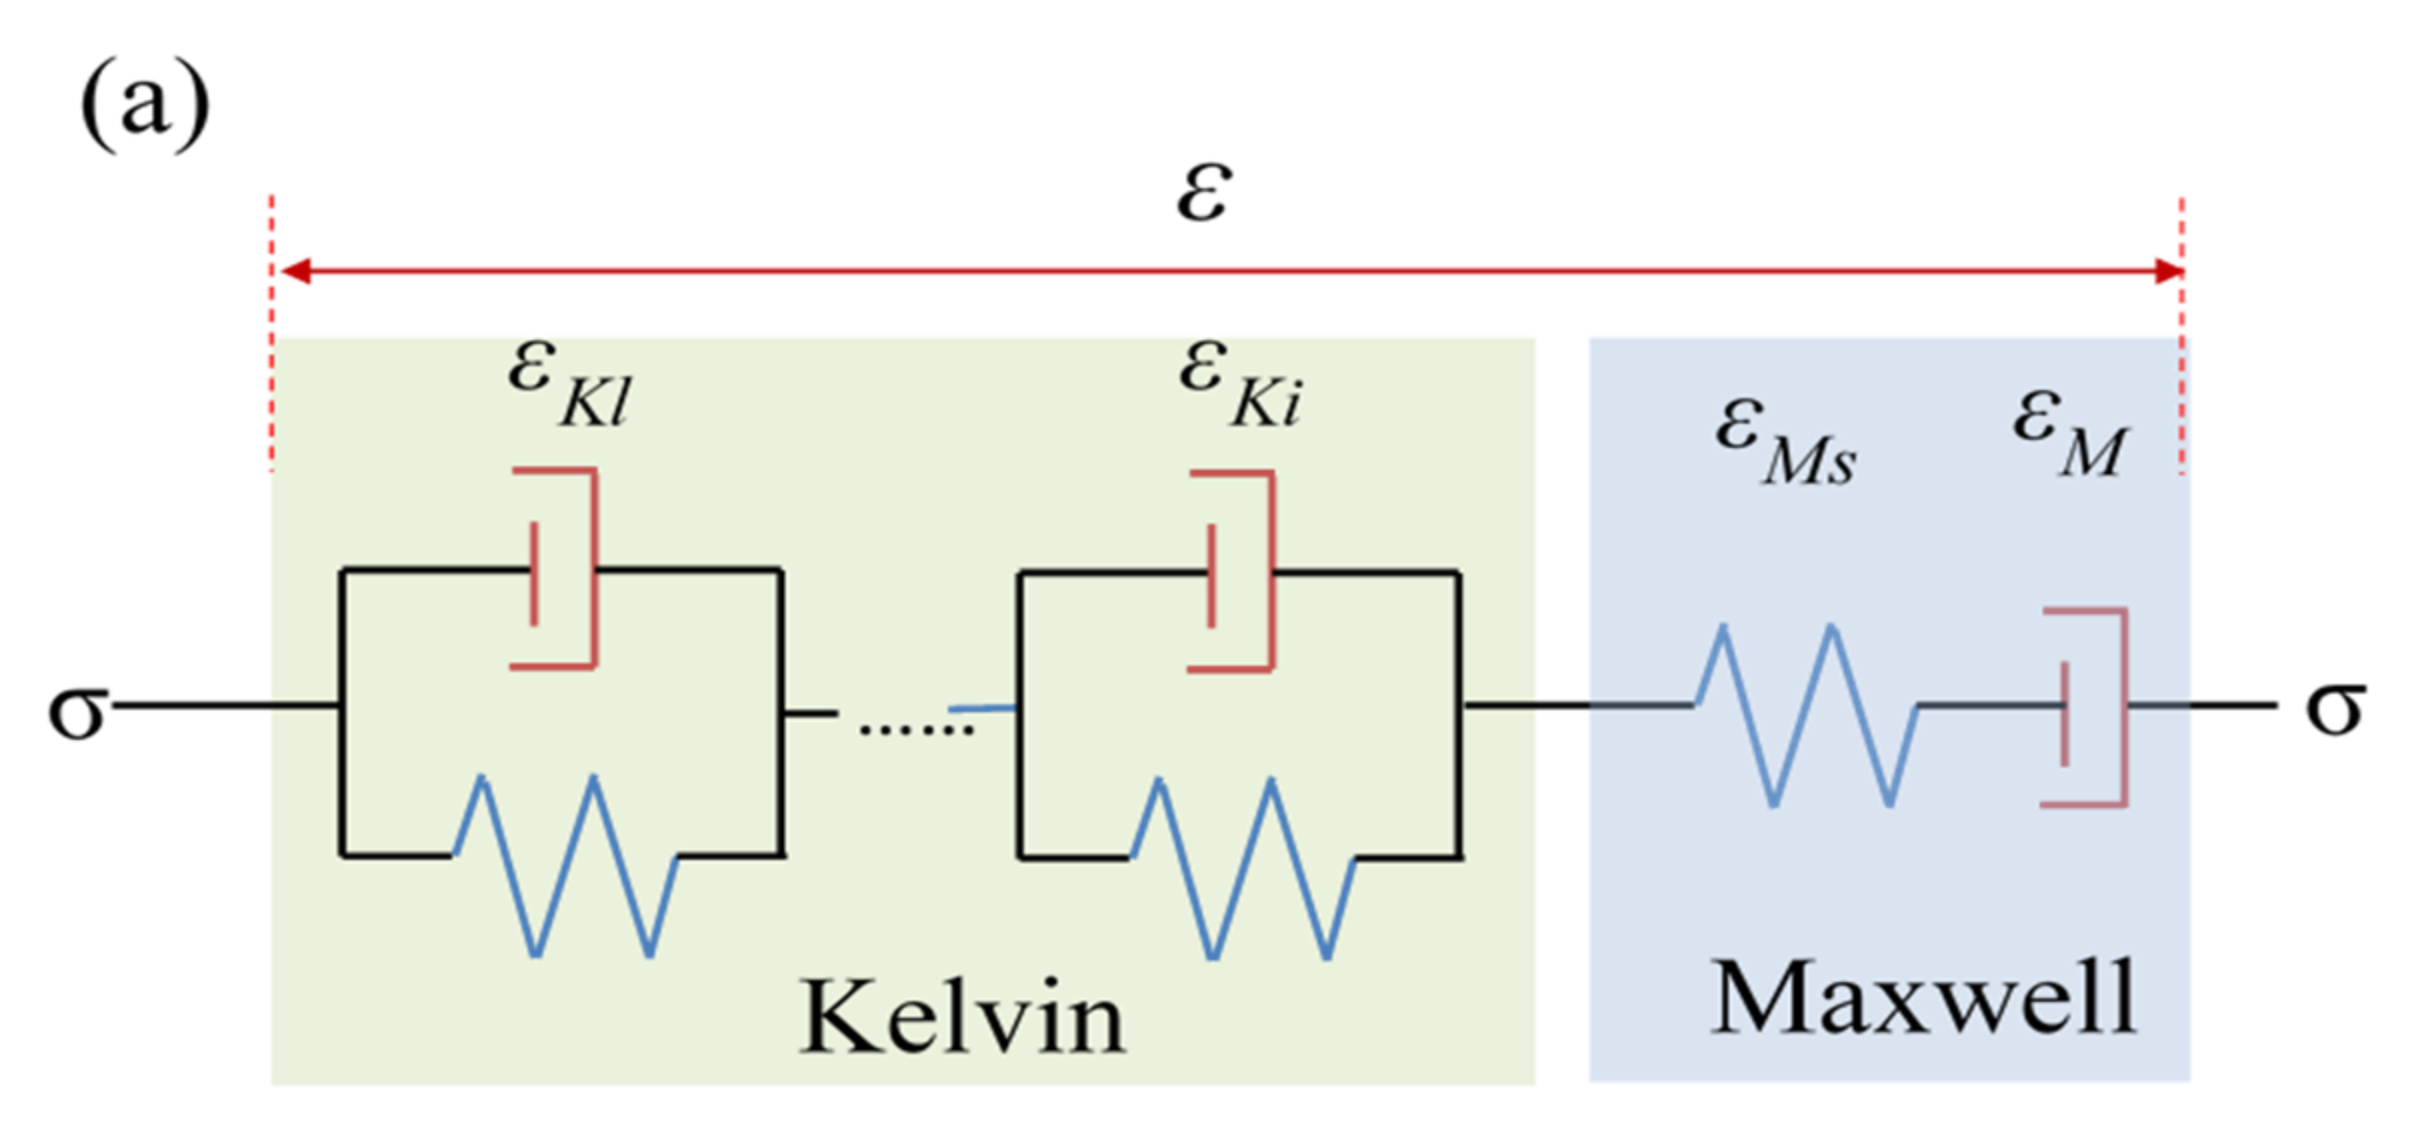
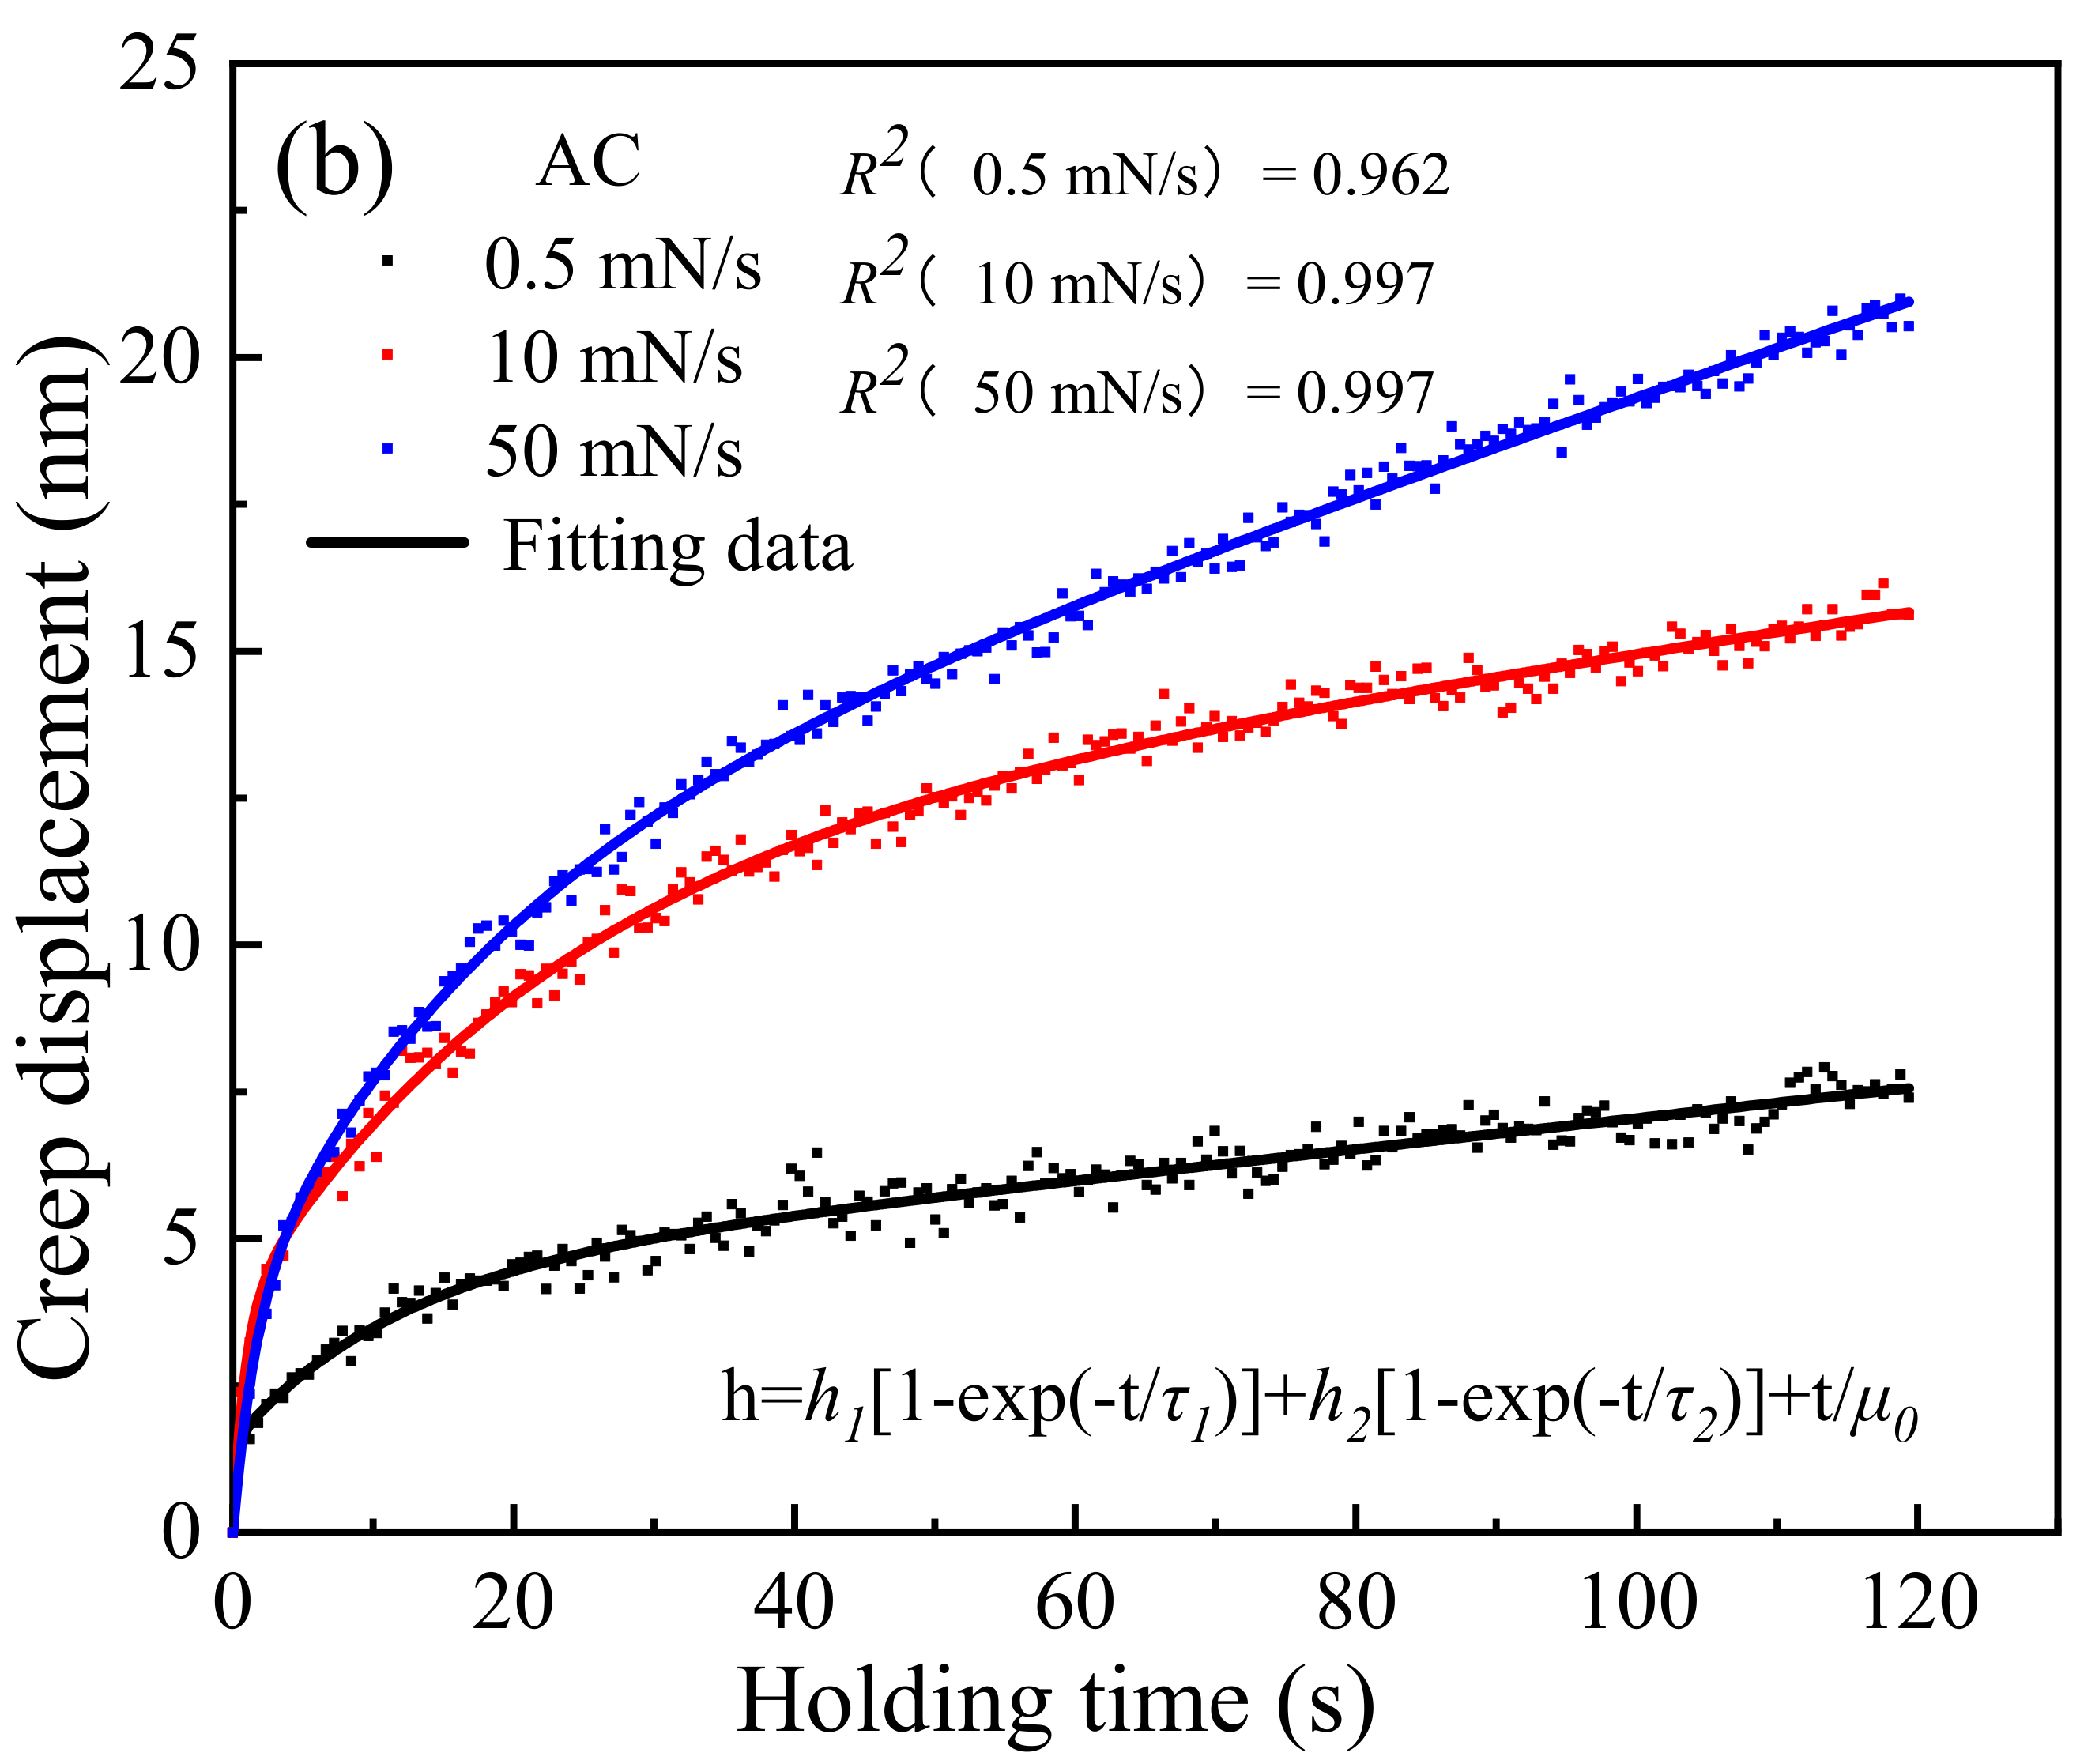
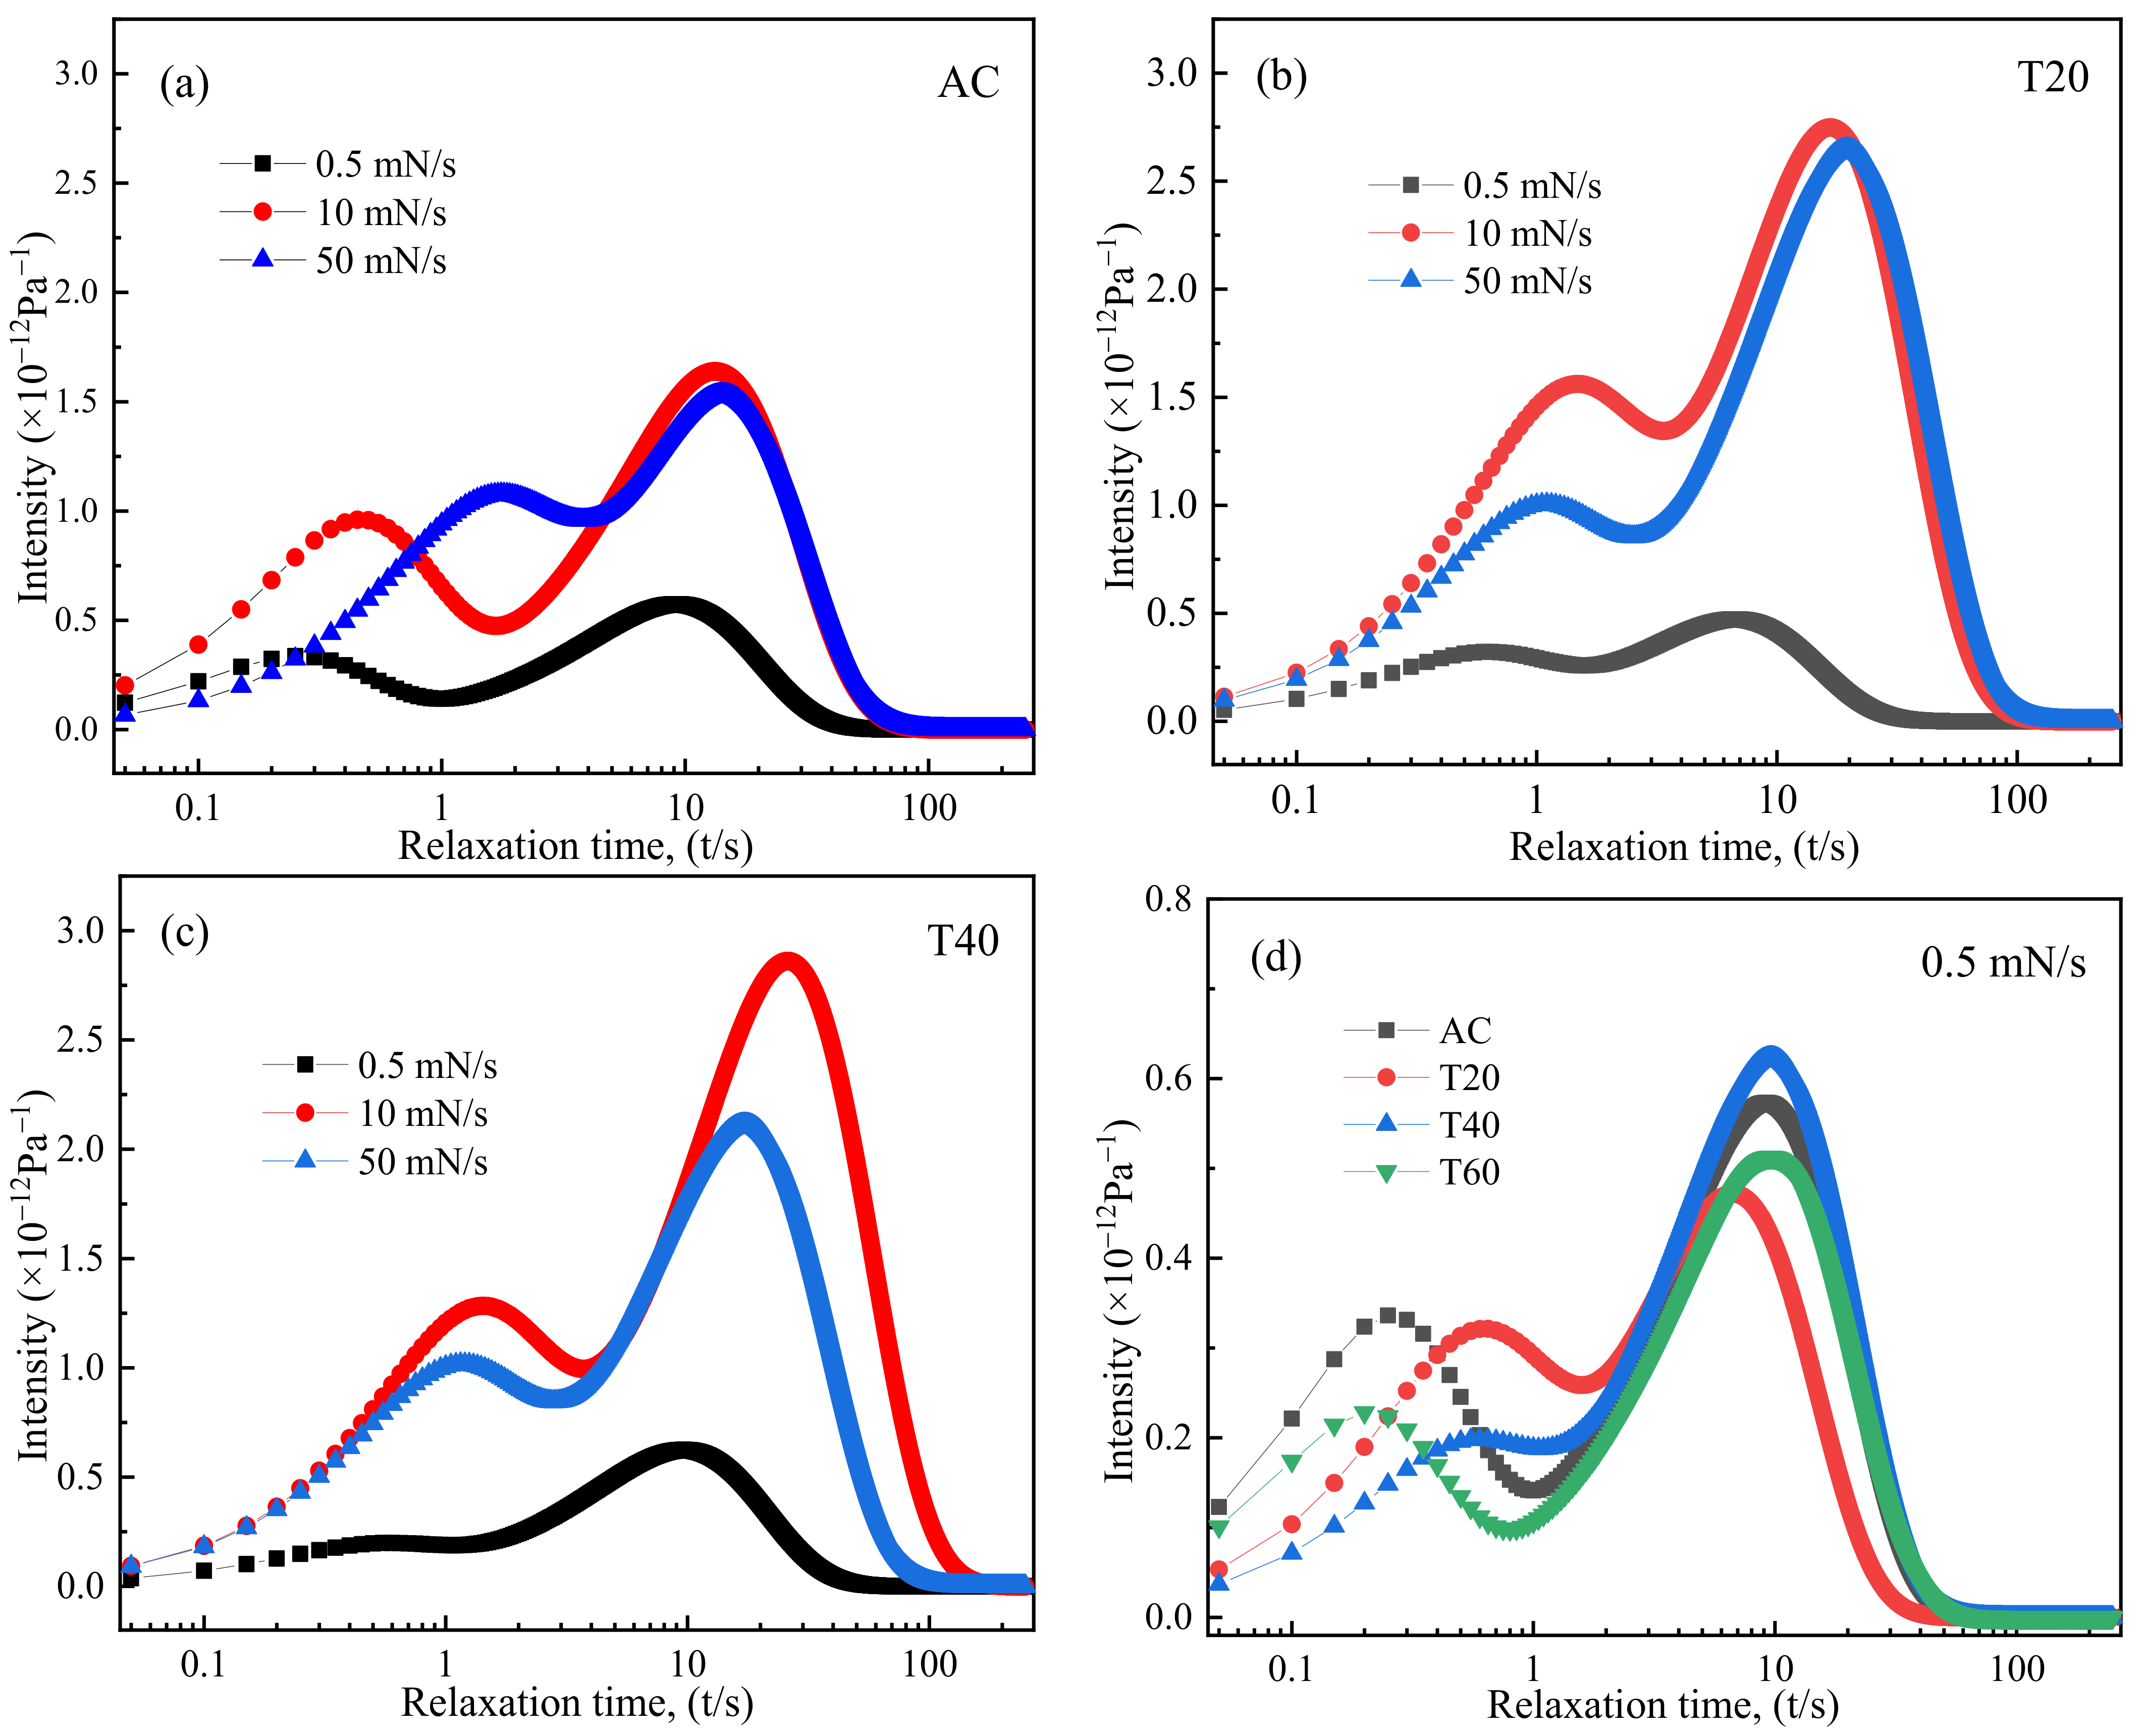
3.3. Nanoindentation Creep Deformation

To further comprehend the effect of preloading time on creep deformation behavior and heterogeneous structural arrangements, nanoindentation experiments were conducted. The samples were firstly loaded to 50 mN, holding for 120 s, then completely unloaded to zero at the same rate as the loading rate. Typical load-displacement (P-h) curves of the AC and elastostatic compression treated Vit1 samples at the loading rates of 0.5, 10 and 50 mN/s are shown in Figure 4a–d. The obvious serration behavior is observed in all the samples at a constant loading rate lower than 50 mN/s. Previous studies show that the serrated flow strongly depends on the strain rate of the BMGs during deformation, which relates closely to the formation and propagation of shear bands [41,42]. Serrated flow almost disappears at the loading rate of 50 mN/s, which can be ascribed to the improved atomic motion with the rise of loading rate. In this case, the multiple shear bands can be generated at the same time, resulting in a more uniform plastic deformation along with the disappearance of serrated flow. In addition, the maximum creep displacement of the T40 sample increases from 15 to 27 nm with increasing loading rate from 0.5 to 50 mN/s. These creep displacement values are similar to those of other BMGs [43]. The creep displacement of BMGs is affected by both internal factors (free volume) and external factors (loading rate). In addition, for a given sample, the creep displacement varies at different positions due to heterogeneous nature of metallic glasses. The maximum creep displacement of T60 is slightly higher than that of AC sample at the same loading rate. In our experiment, at least five independent measurements were carried out under each condition for each sample. In addition, we find that the difference of the average creep displacement between the two samples was comparable to the error.
The creep displacement in the nanoindentation process is analyzed using the Maxwell-Voigt model that contains Maxwell units and Kelvin units as illustrated in Figure 5a [44]. BMG systems are structurally heterogeneous at the sub-nano to nanoscale and considered to contain liquid-like and solid-like regions. The two-phase model as proposed in BMGs can be characterized by the two relaxation processes during the creeping process with different relaxation time [45]. Here, two Kelvin units with a Maxwell unit were chosen to analyze the creep displacement of the studied BMGs. After assuming that the sudden elastic strain before the first stage of anelastic deformation is zero, the creep displacement can be described by [43]:
H t = h 1 1   -   e - t / τ 1 + h 2 1   -   e - t / τ 2 + t / μ 0
where t is the holding time, hi the indentation depth and τi the characteristic relaxation time of the i-th anelastic Kelvin unit and μ0 the viscoplastic constant of the Maxwell dashpot (proportional to the viscosity coefficient). Figure 5b shows the experimental and fitted creep curves of AC sample as a function of loading rate. The creep curves of AC sample can be fitted very well with Equation (1), which show a loading rate dependent behavior of the primary elastic and secondary viscous components of creep deformation. The fitting parameters for the creep displacement-holding time of AC and pre-compression treated samples at different loading rates are listed in Table 1. At room temperature, the μ0−1 that represents the viscoplastic deformation ability of BMGs almost keeps a constant, independent of loading rates, which is in good agreements with previous research results [46]. The displacements h1 and h2 of two Kelvin units during primary and secondary relaxation processes increases significantly with increasing loading rate from 0.5 mN/s to 10 mN/s, followed by a decrease with the loading rate increases subsequently. The relaxation time τ1 and τ2 show the same tendency.
In addition, the creep processes can be analyzed in terms of isothermal relaxation time spectra by using the following equation [47]:
L τ = 1 + t τ i h i τ i e -   t τ i A 0 P 0 h in t | t   =   2 τ
where L presents the spectrum intensity, hin the maximum indentation depth and A0/P0 the inverse of hardness. The relaxation spectrum is a statistical result of the relaxation process of two different characteristic time in the system, corresponding to each peak as marked in Figure 6. Figure 6a shows the typical relaxation spectra of AC sample obtained at loading rates of 0.5, 10 and 50 mN/s. The higher the peak intensity, the more the relaxation processes of the characteristic time involved, i.e., more defects are activated. It can be seen clearly that both the intensity and characteristic time of first and secondary peaks of AC sample increases when the loading rate increases from 0.5 to 10 mN/s. Thus, more defects with longer relaxation time can be activated at a larger loading rate, which is according with that observed in other BMGs [44]. Similar loading rate dependent behavior has been observed in the pre-compression treated samples as indicated in Figure 6b,c. Two characteristic relaxation peaks have also been found in the relaxation spectrum of many other BMGs such as Fe- [44,47], Zr-based BMGs [48], which is in good agreement with present study. Based on the core-shell model [45], the defects with more free volume are able to dissipate the stress concentrates in the elastic matrix by consuming a long relaxation time. In addition, the variation of the secondary relaxation peak in the studied BMGs is more pronounced compared with the primary relaxation peak with increasing loading rate. It indicates that the defects with longer relaxation times tend to be activated at higher loading rate. However, further increasing the loading rate to 50 mN/s, the intensity of the relaxation spectra decreases. These abnormal behaviors may arise from the saturation effect of the activated defects at a loading rate of 50 mN/s.
Compared with the AC sample, the relaxation time spectrum of the pre-compression treated samples is more sensitive to the loading rate. As shown in Figure 6d, a remarkable increase of the intensity of the secondary relaxation peaks at the loading rate of 0.5 mN/s is observed in the T40 sample. It implies more defects with longer relaxation time are activated upon pre-compression duration of 40 h. In addition, a significant increase of relaxation time (corresponding to the first relaxation peaks) is observed in T40, suggesting that defects with longer relaxation time in glass are more likely to be stimulated after elastostatic compression. In contrast, the intensity of the first and secondary relaxation peaks of T60 sample is lower than that of AC sample. This indicates that less defects are activated during creep deformation after long-time pre-compression in T60 sample, corresponding to a deteriorative plasticity.

4. Conclusions

The plastic and creep deformation behaviors of the AC and pre-loaded Vit1 BMG were thoroughly investigated. We found that elastostatic compression at a given stress level of 87% of the yield strength can lead to a rejuvenation-to-relaxation transition of the BMG. Through adjusting the pre-loading duration, the T40 sample exhibits an improved plasticity of 3.4% due to the increased local excess free volume induced by the elastostatic compression. However, the T60 sample shows a deteriorative plasticity owing to the relaxation caused by its longer elastostatic compression. By using nanoindentation technique, it is found that the evolution of creep displacement varies with the loading rate and can be well described by the Maxwell-Voigt model with two Kelvin units. A remarkable increase of the intensity of the relaxation time spectrum is observed in the T40 sample. Meanwhile, the characteristic relaxation time shifts to a longer time region. It implies the more defects with larger size are activated after appropriate pre-compression duration. These results shed light on the correlation between structure heterogeneity and plasticity/creep deformation, which would be helpful for the development of BMGs with superior properties.

Author Contributions

Conceptualization, J.C. and Q.L.; data curation, J.C. and S.D.; investigation, Z.Z.; writing-original draft preparation, J.C.; writing-review and editing, Q.L.; funding acquisition, Q.L. and B.S. All authors have read and agreed to the published version of the manuscript.

Funding

This research was funded by the National Natural Science Foundation of China (Grant Nos. 51971061 and 51631003).

Data Availability Statement

The data that support the findings of this study are available from the corresponding author upon reasonable request.

Conflicts of Interest

The authors declare no conflict of interest.

References

  1. Ghidelli, M.; Orekhov, A.; Bassi, A.L.; Terraneo, G.; Djemia, P.; Abadias, G.; Nord, M.; Béché, A.; Gauquelin, N.; Verbeeck, J.; et al. Novel class of nanostructured metallic glass films with superior and tunable mechanical properties. Acta Mater. 2021, 213, 116955. [Google Scholar] [CrossRef]
  2. Wang, W.H. Roles of minor additions in formation and properties of bulk metallic glasses. Prog. Mater. Sci. 2007, 52, 540–596. [Google Scholar] [CrossRef]
  3. Liu, Y.H.; Wang, G.; Wang, R.J.; Zhao, D.Q.; Pan, M.X.; Wang, W.H. Super plastic bulk metallic glasses at room temperature. Science 2007, 315, 1385–1388. [Google Scholar] [CrossRef] [PubMed]
  4. Nandam, S.H.; Ivanisenko, Y.; Schwaiger, R.; Śniadecki, Z.; Mu, X.; Wang, D.; Chellali, R.; Boll, T.; Kilmametov, A.; Bergfeldt, T.; et al. Cu-Zr nanoglasses: Atomic structure, thermal stability and indentation properties. Acta Mater. 2017, 136, 181–189. [Google Scholar] [CrossRef]
  5. Bazlov, A.I.; Igrevskaya, A.G.; Tabachkova, N.Y.; Chen, C.; Cheverikin, V.V.; Pozdniakov, A.V.; Jiang, J.; Louzguine-Luzgin, D.V. Thermo-mechanical processing of a Zr62.5Cu22.5Fe5Al10 glassy alloy as a way to obtain tensile ductility. J. Alloy. Compd. 2021, 853, 157138. [Google Scholar] [CrossRef]
  6. Yang, J.; Zhao, Z.; Mu, J.; Wang, Y. Effect of pre-plastic-deformation on mechanical properties of TiZr-based amorphous alloy composites. Mater. Sci. Eng. A 2018, 716, 23–27. [Google Scholar] [CrossRef]
  7. Feng, S.D.; Chan, K.C.; Zhao, L.; Pan, S.P.; Qi, L.; Wang, L.M.; Liu, R.P. Rejuvenation by weakening the medium range order in Zr46Cu46Al8 metallic glass with pressure preloading: A molecular dynamics simulation study. Mater. Des. 2018, 158, 248–255. [Google Scholar] [CrossRef]
  8. Dong, J.; Shen, J.; Sun, Y.H.; Ke, H.B.; Sun, B.A.; Wang, W.H.; Bai, H.Y. Composition and size dependent torsion fracture of metallic glasses. J. Mater. Sci. Technol. 2021, 82, 153–160. [Google Scholar] [CrossRef]
  9. Duan, G.H.; Jiang, M.Q.; Liu, X.F.; Dai, L.H.; Li, J.X. In-situ observations on shear-banding process during tension of a Zr-based bulk metallic glass composite with dendrites. J. Non Cryst. Solids 2021, 565, 120841. [Google Scholar] [CrossRef]
  10. Hofmann, D.C.; Suh, J.Y.; Wiest, A.; Duan, G.; Lind, M.L.; Demetriou, M.D.; Johnson, W.L. Designing metallic glass matrix composites with high toughness and tensile ductility. Nature 2008, 451, 1085–1089. [Google Scholar] [CrossRef]
  11. Wei, R.; Yang, S.; Chang, Y.; Li, Y.F.; Zhang, C.J.; He, L. Mechanical property degradation of a CuZr-based bulk metallic glass composite induced by sub-Tg annealing. Mater. Des. (1980–2015) 2014, 56, 128–138. [Google Scholar] [CrossRef]
  12. Qiao, J.C.; Wang, Q.; Pelletier, J.M.; Kato, H.; Casalini, R.; Crespo, D.; Pineda, E.; Yao, Y.; Yang, Y. Structural heterogeneities and mechanical behavior of amorphous alloys. Prog. Mater. Sci. 2019, 104, 250–329. [Google Scholar] [CrossRef]
  13. Liu, C.; Maaß, R. Elastic Fluctuations and Structural Heterogeneities in Metallic Glasses. Adv. Funct. Mater. 2018, 28, 1800388. [Google Scholar] [CrossRef]
  14. Wang, C.; Yin, Y.Y.; Gong, Y.; Gu, L.; Wang, W.H.; Bai, H.Y. High stored energy of metallic glasses induced by high pressure. Appl. Phys. Lett. 2017, 110, 111901. [Google Scholar] [CrossRef]
  15. Liu, J.W.; Cao, Q.P.; Chen, L.Y.; Wang, X.D.; Jiang, J.Z. Shear band evolution and hardness change in cold-rolled bulk metallic glasses. Acta Mater. 2010, 58, 4827–4840. [Google Scholar] [CrossRef]
  16. Di, S.Y.; Wang, Q.Q.; Zhou, J.; Shen, Y.Y.; Li, J.Q.; Zhu, M.Y.; Yin, K.B.; Zeng, Q.S.; Sun, L.T.; Shen, B.L. Enhancement of plasticity for FeCoBSiNb bulk metallic glass with superhigh strength through cryogenic thermal cycling. Scr. Mater. 2020, 187, 13–18. [Google Scholar] [CrossRef]
  17. Ketov, S.V.; Trifonov, A.S.; Ivanov, Y.P.; Churyumov, A.Y.; Lubenchenko, A.V.; Batrakov, A.A.; Jiang, J.; Louzguine-Luzgin, D.V.; Eckert, J.; Orava, J.; et al. On cryothermal cycling as a method for inducing structural changes in metallic glasses. NPG Asia Mater. 2018, 10, 137–145. [Google Scholar] [CrossRef] [Green Version]
  18. Ketov, S.V.; Sun, Y.H.; Nachum, S.; Lu, Z.; Checchi, A.; Beraldin, A.R.; Bai, H.Y.; Wang, W.H.; Louzguine-Luzgin, D.V.; Carpenter, M.A.; et al. Rejuvenation of metallic glasses by non-affine thermal strain. Nature 2015, 524, 200–203. [Google Scholar] [CrossRef] [Green Version]
  19. Li, B.S.; Xie, S.; Kruzic, J.J. Toughness enhancement and heterogeneous softening of a cryogenically cycled Zr–Cu–Ni–Al–Nb bulk metallic glass. Acta Mater. 2019, 176, 278–288. [Google Scholar] [CrossRef]
  20. Lee, S.C.; Lee, C.M.; Lee, J.C.; Kim, H.J.; Shibutani, Y.; Fleury, E.; Falk, M.L. Structural disordering process of an amorphous alloy driven by the elastostatic compression at room temperature. Appl. Phys. Lett. 2008, 92, 151906. [Google Scholar] [CrossRef]
  21. Lee, S.C.; Lee, C.M.; Yang, J.W.; Lee, J.C. Microstructural evolution of an elastostatically compressed amorphous alloy and its influence on the mechanical properties. Scr. Mater. 2008, 58, 591–594. [Google Scholar] [CrossRef]
  22. Lee, J.C. Irreversible Structural Change Induced by Elastostatic Stress imposed on an Amorphous Alloy and Its Influence on the Mechanical Properties. Met. Mater. Int. 2008, 14, 9–13. [Google Scholar] [CrossRef]
  23. Hashim, I.M.; Ghazi, I.F.; Kuzichkin, O.R.; Shakirova, I.A.; Surendar, A.; Thangavelu, L.; Dorofeev, A.E.; Zhu, Y. Effects of Primary Stored Energy on Relaxation Behavior of High Entropy Bulk Metallic Glasses Under Compressive Elastostatic Loading. Trans. Indian Inst. Met. 2021, 74, 1295–1301. [Google Scholar] [CrossRef]
  24. Samavatian, M.; Gholamipour, R.; Amadeh, A.A.; Mirdamadi, S. Role of tensile elastostatic loading on atomic structure and mechanical properties of Zr55Cu30Ni5Al10 bulk metallic glass. Mater. Sci. Eng. A 2019, 753, 218–223. [Google Scholar] [CrossRef]
  25. Wei, R.; Chang, Y.; Li, Y.F.; Li, G.; Yang, S.; Zhang, C.J.; He, L. Effect of lateral pre-compression on the compressive behavior of a CuZr-based bulk metallic glass composite containing B2-CuZr phase. Mater. Sci. Eng. A 2013, 587, 233–239. [Google Scholar] [CrossRef]
  26. Xing, Q.; Zhang, K.; Wang, Y.; Leng, J.; Jia, H.; Liaw, P.K.; Wang, Y. Effects of pre-compression on the microstructure, mechanical properties and corrosion resistance of RE65Co25Al10 (RE=Ce, La, Pr, Sm and Gd) bulk metallic glasses. Intermetallics 2015, 67, 94–101. [Google Scholar] [CrossRef]
  27. Tong, Y.; Dmowski, W.; Bei, H.; Yokoyama, Y.; Egami, T. Mechanical rejuvenation in bulk metallic glass induced by thermo-mechanical creep. Acta Mater. 2018, 148, 384–390. [Google Scholar] [CrossRef]
  28. Samavatian, M.; Gholamipour, R.; Amadeh, A.A.; Mirdamadi, S. Extra rejuvenation of Zr55Cu30Al10Ni5 bulk metallic glass using elastostatic loading and cryothermal treatment interaction. J. Non Cryst. Solids 2019, 506, 39–45. [Google Scholar] [CrossRef]
  29. Wang, X.D.; Song, S.L.; Zhu, Z.W.; Zhang, H.F.; Ren, X.C. Structural evolution under elastic cyclic loading in a Ti-based metallic glass. J. Non Cryst. Solids 2022, 577, 121263. [Google Scholar] [CrossRef]
  30. Samavatian, M.; Gholamipour, R.; Amadeh, A.A.; Samavatian, V. Inherent relation between atomic-level stresses and nanoscale heterogeneity in Zr-based bulk metallic glass under a rejuvenation process. Phys. B Condens. Matter 2020, 595, 412390. [Google Scholar] [CrossRef]
  31. Zhang, S.; Shi, B.; Wang, J.; Xu, Y.; Jin, P. Rejuvenation of a naturally aged bulk metallic glass by elastostatic loading. Mater. Sci. Eng. A 2021, 806, 140843. [Google Scholar] [CrossRef]
  32. Park, K.W.; Lee, C.M.; Wakeda, M.; Shibutani, Y.; Falk, M.L.; Lee, J.C. Elastostatically induced structural disordering in amorphous alloys. Acta Mater. 2008, 56, 5440–5450. [Google Scholar] [CrossRef]
  33. Argon, A.S.; Salama, M. The Mechanism of fracture in glassy materials capable of some inelastic deformation. Mater. Sci. Eng. 1976, 23, 219–230. [Google Scholar] [CrossRef]
  34. Ghidelli, M.; Gravier, S.; Blandin, J.J.; Raskin, J.P.; Lani, F.; Pardoen, T. Size-dependent failure mechanisms in ZrNi thin metallic glass films. Scr. Mater. 2014, 89, 9–12. [Google Scholar] [CrossRef]
  35. Liu, S.; Wang, L.; Ge, J.; Wu, Z.; Ke, Y.; Li, Q.; Sun, B.; Feng, T.; Wu, Y.; Wang, J.T.; et al. Deformation-enhanced hierarchical multiscale structure heterogeneity in a Pd-Si bulk metallic glass. Acta Mater. 2020, 200, 42–55. [Google Scholar] [CrossRef]
  36. Wang, Y.B.; Qu, D.D.; Wang, X.H.; Cao, Y.; Liao, X.Z.; Kawasaki, M.; Ringer, S.P.; Shan, Z.W.; Langdon, T.G.; Shen, J. Introducing a strain-hardening capability to improve the ductility of bulk metallic glasses via severe plastic deformation. Acta Mater. 2012, 60, 253–260. [Google Scholar] [CrossRef]
  37. Flores, K.M.; Sherer, E.; Bharathula, A.; Chen, H.; Jean, Y.C. Sub-nanometer open volume regions in a bulk metallic glass investigated by positron annihilation. Acta Mater. 2007, 55, 3403–3411. [Google Scholar] [CrossRef]
  38. Bhowmick, R.; Raghavan, R.; Chattopadhyay, K.; Ramamurty, U. Plastic flow softening in a bulk metallic glass. Acta Mater. 2006, 54, 4221–4228. [Google Scholar] [CrossRef]
  39. Li, J.; Wang, Z.L.; Hufnagel, T.C. Characterization of nanometer-scale defects in metallic glasses by quantitative high-resolution transmission electron microscopy. Phys. Rev. B 2002, 65, 14. [Google Scholar] [CrossRef] [Green Version]
  40. Li, J.; Spaepen, F.; Hufnagel, T.C. Nanometre scale defects in shear bands in a metallic glass. Philos. Mag. A 2002, 82, 2623–2630. [Google Scholar] [CrossRef]
  41. Xiang, W.; Wei, X.; Liu, S.N.; Liu, Y.; Lan, S.; Wang, J.T. Negative Strain Rate Sensitivity Induced by Structure heterogeneity in ZrCuAlNi bulk metallic glasses. Metals 2021, 11, 339. [Google Scholar]
  42. Dubach, A.; Dallatorre, F.; Loffler, J. Constitutive model for inhomogeneous flow in bulk metallic glasses. Acta Mater. 2009, 57, 881–892. [Google Scholar] [CrossRef]
  43. Yuan, C.C.; Lv, Z.W.; Pang, C.M.; Zhu, W.W.; Wang, X.L.; Shen, B.L. Pronounced nanoindentation creep deformation in Cu-doped CoFe-based metallic glasses. J. Alloy. Compd. 2019, 806, 246–253. [Google Scholar] [CrossRef]
  44. Lv, Z.W.; Yuan, C.C.; Ke, H.B.; Shen, B.L. Defects activation in CoFe-based metallic glasses during creep deformation. J. Mater. Sci. Technol. 2021, 69, 42–47. [Google Scholar] [CrossRef]
  45. Ye, J.C.; Lu, J.; Liu, C.T.; Wang, Q.; Yang, Y. Atomistic free-volume zones and inelastic deformation of metallic glasses. Nat. Mater. 2010, 9, 619–623. [Google Scholar] [CrossRef]
  46. Ke, H.B.; Zhang, P.; Sun, B.A.; Zhang, P.G.; Liu, T.W.; Chen, P.H.; Wu, M.; Huang, H.G. Dissimilar nanoscaled structural heterogeneity in U-based metallic glasses revealed by nanoindentation. J. Alloy. Compd. 2019, 788, 391–396. [Google Scholar] [CrossRef]
  47. Yuan, C.C.; Liu, R.; Pang, C.M.; Zuo, X.F.; Li, B.F.; Song, S.C.; Hu, J.Y.; Zhu, W.W.; Shen, B.L. Anelastic and viscoplastic deformation in a Fe-based metallic glass. J. Alloy. Compd. 2021, 853, 157233. [Google Scholar] [CrossRef]
  48. Yuan, C.C.; Lv, Z.W.; Pang, C.M.; Li, X.; Liu, R.; Yang, C.; Ma, J.; Ke, H.B.; Wang, W.H.; Shen, B.L. Ultrasonic-assisted plastic flow in a Zr-based metallic glass. Sci. China Mater. 2020, 64, 448–459. [Google Scholar] [CrossRef]
Figure 1. The representative engineering stress-strain curves of the AC (as-cast) and pre-compression treated (T20, T40, T60) Vit1 BMG samples.
Metals 12 00282 g001
Figure 2. SEM images of the fracture samples of (a) AC, (b) T20, (c) T40 and (d) T60 Vit1 BMG samples, which were compressed to failure.
Metals 12 00282 g002
Figure 3. (a) DSC traces corresponding to the AC and T20, T40 and T60 Vit1 BMG samples (Tg—glass transition temperature; Tx,1, Tx,2, Tx,3—crystallization onset temperatures). (b) The relaxation enthalpy for the AC and T20, T40 and T60 Vit1 BMG samples.
Metals 12 00282 g003
Figure 4. The typical load-displacement (P-h) curves of (a) AC, (b)T20, (c) T40 and (d) T60 Vit1 BMG samples at different loading rates under a maximum load of 50 mN.
Metals 12 00282 g004
Figure 5. (a) The Maxwell-Voigt model used for analyzing creep curves. (b) The typically fitting creep curve of AC Vit1 BMG samples at different loading rates under a maximum load of 50 mN (R2—correlation coefficient).
Metals 12 00282 g005aMetals 12 00282 g005b
Figure 6. The relaxation spectrum of the (a) AC, (b) T20, (c) T40 Vit1 BMG samples measured at different loading rates with a maximum load of 50 mN, (d) the relaxation spectrum of the AC and pre-compressed samples measured under the loading rate of 0.5 mN/s based on the anelastic part of the creep displacement curves.
Metals 12 00282 g006
Table 1. The fitting parameters of creep displacement curves of Vit1 BMG samples using the Maxwell-Voigt model at different loading rates.
SampleLoading Rate
(mN/s)
h1
(nm)
τ1
(s)
h2
(nm)
τ2
(s)
μ0−1
(nm/s)
AC0.51.54 ± 0.180.30 ± 0.232.88 ± 0.1711.36 ± 1.390.03
104.83 ± 0.201.76 ± 0.188.06 ± 0.4630.13 ± 3.200.06
503.68 ± 0.271.62 ± 0.247.34 ± 0.2117.56 ± 1.240.083
T200.52.38 ± 0.218.28 ± 1.121.24 ± 0.230.62 ± 0.330.04
1012.59 ± 0.1518.43 ± 0.593.81 ± 0.171.06 ± 0.140.18
505.42 ± 0.201.41 ± 0.1312.92 ± 0.1920.61 ± 0.820.15
T400.50.69 ± 0.170.52 ± 0.503.14 ± 0.1511.89 ± 1.170.02
105.06 ± 0.171.45 ± 0.1414.34 ± 0.5132.09 ± 1.890.05
503.70 ± 0.171.15 ± 0.1510.13 ± 0.1821.28 ± 0.980.05
T600.51.05 ± 0.150.24 ± 0.312.59 ± 0.1411.87 ± 1.380.07
1014.28 ± 0.2524.87 ± 0.925.07 ± 0.151.10 ± 0.100.12
506.05 ± 0.201.30 ± 0.1212.35 ± 0.2423.10 ± 1.110.15
Publisher’s Note: MDPI stays neutral with regard to jurisdictional claims in published maps and institutional affiliations.

