Article

Gallic Acid as a Potential Green Corrosion Inhibitor for Aluminum in Acidic Solution

by
Przemysław Kwolek
1,*,
Kamil Dychtoń
1,
Barbara Kościelniak
1,
Andrzej Obłój
1,
Agnieszka Podborska
2 and
Marek Wojnicki
3
1
Department of Materials Science, Faculty of Mechanical Engineering and Aeronautics, Rzeszow University of Technology, Żwirki i Wigury Street 4, 35-036 Rzeszow, Poland
2
Academic Centre for Materials and Nanotechnology, AGH University of Science and Technology, Mickiewicza Avenue 30, 30-059 Krakow, Poland
3
Faculty of Non-Ferrous Metals, AGH University of Science and Technology, Mickiewicza Avenue 30, 30-059 Krakow, Poland
*
Author to whom correspondence should be addressed.
Metals 2022, 12(2), 250; https://doi.org/10.3390/met12020250
Submission received: 29 December 2021 / Revised: 20 January 2022 / Accepted: 26 January 2022 / Published: 28 January 2022

Abstract

:
Plant extracts are intensively studied as green corrosion inhibitors of aluminum. Because these extracts are complex systems, the influence of their individual constituents on the corrosion of aluminum should be determined. In this work, gallic acid was tested for the first time as a corrosion inhibitor of aluminum in orthophosphoric acid aqueous solution. So far, its potential inhibiting properties in acidic solutions were only suggested based on promising results obtained for various plant extracts. Evaluation of the potential inhibiting properties of gallic acid was performed using electrochemical methods. The corrosion potential, polarization curves, and impedance spectra of aluminum in 0.5 M orthophosphoric acid, at T = 303 K, were determined. The corrosion potential, corrosion current density, and corrosion rate of aluminum in orthophosphoric acid were equal to −1.151 V vs. Ag|AgCl (3M KCl) reference electrode, 36 μA∙cm−2 and 0.39 mm∙year−1, respectively. These values did not change with the addition of gallic acid. The results obtained show that gallic acid does not inhibit aluminum corrosion. UV-Vis absorption spectra of gallic acid solutions and quantum mechanical calculations show that this organic compound did not adsorb onto the aluminum surface under the studied conditions.

1. Introduction

Aluminum alloys, due to their high strength-to-weight ratio, are commonly applied, especially in the aircraft industry [1]. Their applications usually require good corrosion resistance. This is based on the natural ability of aluminum to form a compact layer of Al2O3. This protective layer becomes chemically unstable in acidic and alkaline solutions and these environments are corrosive for aluminum and its alloys [2]. Thus, when aluminum is exposed to an acidic or alkaline solution, an efficient corrosion inhibitor should be used. This problem is especially important in industrial processes, for instance, during electrochemical etching and acid pickling of components made of aluminum alloys or when the anodic coating must be stripped off the substrate without dissolution of the latter.
Probably the most effective inorganic inhibitor of aluminum corrosion in acidic solutions is chromium trioxide CrO3. For example, it is used during the gravimetric determination of anodic coating’s weight. The coating is quickly dissolved in hot 0.5 M H3PO4 whereas the metallic substrate is efficiently protected with hexavalent chromium species [3]. Among the less toxic inorganic corrosion inhibitors than CrO3, probably the most important is sodium molybdate Na2MoO4. It efficiently protects aluminum of technical purity [4,5] but is less effective for Cu-rich aluminum alloys [6]. Nevertheless, it is now recommended inhibitor for anodic coating’s weight determination, together with CrO3 [7]. The vast amount of organic corrosion inhibitors was also studied. This group contains amines, N- heterocyclic compounds, azole, imidazole, and thiazole derivatives, polymers, organic dyes, and Schiff bases. These compounds adsorb on the metal surface through the heteroatoms N, S, O, and P, which serve as active centers for adsorption [8,9].
Another group of corrosion inhibitors called green inhibitors is attracting increasing attention. This is partly because of the potential toxicity of many inorganic and organic corrosion inhibitors but also due to the negative environmental impact of synthetic chemistry processes. On the contrary, green corrosion inhibitors are ecologically acceptable, biodegradable, and renewable. Their most important drawbacks are a decreased inhibition efficiency upon prolonged storage and a potential problem with reproducibility of the inhibition efficiency. [10,11,12,13].
Green corrosion inhibitors that attract the greatest scientific attention are plant extracts, natural oils, biopolymers, and drugs. Their influence on the corrosion of aluminum and its alloys in acidic media is summarized in several extensive review articles [10,11,12,13]. Further discussion will be restricted to plant extracts. Their main constituents are polyphenols, terpenes, carboxylic acids, and alkaloids. There is a great deal of experimental evidence that plant extracts act as corrosion inhibitors of aluminum and other metals [10]. Unfortunately, many published corrosion studies do not identify which constituent of the extract is responsible for corrosion inhibition. In fact, experimental studies, in which individual components of plant extracts are applied as corrosion inhibitors, constitute a minority of the available literature. To date, successful inhibition of corrosion of aluminum and its alloys in acidic solutions was reported for rutin [14], tannin [15], quercetin [16], and derivatives of baicalin [17].
Rutin, which belongs to the family of flavonoids, provided efficient corrosion protection for the 6063 aluminum alloy in 0.5 M HCl. Inhibition efficiency was greater than 90% in the wide temperature range, between 303 and 333 K, when the rutin concentration was 40 ppm [14]. A slightly lower inhibition efficiency of 89% was obtained for the same alloy in 0.5 M HCl when quercetin of 40 ppm was used as the corrosion inhibitor [16]. High (>90%) inhibition efficiencies were reported for tannin. This polyphenolic biomolecule was used as the corrosion inhibitor of the 7075 aluminum alloy in 0.1 M HCl. However, this time, the corrosion inhibitor concentration was much higher, 14 g∙dm−3 [15]. Baicalin, a flavone traditionally used in Chinese medicine, was also regarded a promising green corrosion inhibitor. Baicalin esters were applied as inhibitors of aluminum corrosion in 1.0 M HCl because of the insufficient solubility of baicalin in water. These esters provided a high inhibition efficiency, approximately 94%, when their concentration was 0.9 g∙dm−3 [17].
Thus, still a lot of experimental work is needed in this field. It should focus on understanding the role of individual components of plant extracts in the corrosion mechanism. Identification of the most efficient corrosion inhibitors in plant extracts is necessary for their successful industrial application. In this work, 3,4,5-trihydroxybenzoic acid (Figure 1), commonly known as gallic acid, was applied as a potential inhibitor of aluminum corrosion in orthophosphoric acid aqueous solution. Gallic acid can be found in many plants and foodstuffs, including tea [18,19]. It was a component of several plant extracts that inhibited the corrosion of aluminum or its alloys in hydrochloric and sulfuric acid aqueous solutions. These extracts were obtained from Morus nigra L. fruits [20], Phoenix dactylifera leaves [21], Hemerocallis fulva leaves [22], areca nut [23], and areca flower [24]. In these works, gallic acid was suggested to act as a corrosion inhibitor, but no direct evidence was provided; for instance, a relatively high content of this compound was reported in the extract obtained from Hemerocallis fulva leaves [22].
The aim of this work is the evaluation of gallic acid as the green corrosion inhibitor for aluminum in an orthophosphoric acid aqueous solution. This was not performed yet and thus constitutes the novelty of this study. This lack of experimental determination of inhibiting properties of gallic acid in acidic solution is surprising, because of the promising results mentioned above obtained for plant extracts [20,21,22,23,24]. Furthermore, gallic acid was already tested as a corrosion inhibitor of the 6061 aluminum alloy in an alkaline solution (3.5% NaCl, pH = 12) and relatively high inhibition efficiencies, between 72% and 96% were obtained [25]. The adsorption of gallic acid onto aluminum oxide [26,27] and an ultrathin layer of Al2O3 on Al substrate were also studied [28]. These studies show that gallic acid adsorbs onto the oxidized aluminum surface. Gallic acid also enhances the dissolution of Al2O3 at pH = 5, because of its ability to complex aluminum ions [26]. Thus, its application in neutral solutions, where aluminum oxide protects the metallic substrate from corrosion, is rather unlikely.
Corrosion studies in this work were performed in 0.5 M H3PO4. Orthophosphoric acid at various concentrations is frequently used in the aluminum finishing industry for pickling [3], at 0.5 M concentration is used for gravimetric determination of anodic coating’s weight [7]. The potential green corrosion inhibitors were only rarely studied in orthophosphoric acid solutions. Most of the experimental work was performed in aqueous solutions of hydrochloric acid and sulfuric(VI) acid [10].

2. Materials and Methods

High purity aluminum, 99.999 wt.%, obtained from Sigma Aldrich® was used for the corrosion studies. These studies were carried out using electrochemical methods. Working electrodes (WEs) for the electrochemical experiments were prepared according to the following procedure. An aluminum slug of 6.35 mm in diameter and 12.7 mm in length was screwed onto the thin aluminum alloy rod, acting as an electrical connection for the electrode. The slug and the slug-rod connection were mounted in epoxy resin. The rod was insulated from the electrolyte using a heat shrink tube. The surface area of the WEs was 0.32 cm2. Before every experiment, the WEs were ground with emery paper, grit 500 and 1000, rinsed with demineralized water, and dried with air.
Corrosion studies were performed in 0.5 M H3PO4 aqueous solutions, pH = 1.1. These solutions contained different amounts of gallic acid (GA). Its concentration, CGA = 0, 1, 10, and 38 mM. Concentrated, 85 wt.% orthophosphoric acid of analytical purity was obtained from Chempur®, Poland. Gallic acid, >98% purity, was obtained from Merck KGaA.
Corrosion tests were conducted in the thermostated glass electrochemical cell, placed in the Faraday cage, at 303 K. The cell was filled with 100 cm3 of the electrolyte. The electrolyte was deoxygenated using Ar for 15 min prior to each experiment. Ar was also constantly applied over the electrolyte’s surface during the experiments. The corrosion tests were conducted in electrolytes agitated with a magnetic stirrer. The agitation rate was 300 rpm. Electrochemical corrosion tests were conducted in the three-electrode system. The counter electrode was made of platinum. Its surface area was 20 cm2. Ag|AgCl (3M KCl) was used as a reference electrode (REF). Its potential was 0.210 V vs. the Standard Hydrogen Electrode (SHE). The reference electrode was placed in a Luggin probe with a very short tip, filled with 0.5 M H3PO4 solution. The impedance of such a setup was 500 Ω.
Electrochemical characterization of the Al-H3PO4-GA system was conducted using SP-300 potentiostat (Bio-Logic SAS, Seyssinet–Pariset, France). This characterization included open circuit potential (OCP), electrochemical impedance spectroscopy (EIS), chronoamperometry (CA), and potentiodynamic polarization (PDP) measurements. First, the OCP was measured for 3 h. Such a time was sufficient for the system to achieve its stationary state. Then, impedance spectra and polarization curves were measured. Impedance spectra were determined in the frequency domain between 200 kHz and 10 mHz. The root mean square of the applied sinusoidal perturbation was 5 mV. All spectra were validated using KK Test 1.01 software. This software, developed by Bernard Boukamp [29,30], calculates Kramers–Kronig transformation of the impedance spectra. Then the spectra were approximated using electrical equivalent circuits. Applied circuits are discussed further in the text. The approximation was performed using Zview 3.5d software (Scribner Associates, Southern Pines, NC, USA). Relatively small values of the χ2 parameter, indicating good quality of the approximation, were obtained. Parameter χ2 was calculated by the approximating software as the square of the standard deviation between the measured and calculated data.
The anodic and cathodic polarization curves were obtained separately, starting from the OCP, with the potential scanning rate 10 mV∙min−1. Manual ohmic drop correction was applied to the registered polarization curves. The solution resistance necessary for this calculation was determined from the EIS spectra. It was between 20 and 22 Ω.
Statistical analysis of some of the results was also provided. Uncertainty Δx of an experimentally determined physical quantity x was calculated using Equation (1):
Δ x = t s x n
where sx represents the standard deviation of the average value of x and t is the Student t-factor. It was equal to 2.7764 for 95% confidence level and the number of independent experiments n = 5 [31].
The surface of corroded Al was examined with a Phenom XL scanning electron microscope (Thermo Fisher Scientific Inc., Waltham, MA, USA). Prior microscopic examination, the specimens freely corroded for 3 h in deaerated 0.5 M H3PO4 solutions containing CGA = 0 and 38 mM, T = 303 K. The Al/electrolyte surface to volume ratio was the same as in the electrochemical experiments.
The chemical structure of the gallic acid molecule in acidic solution was proposed from its UV-Vis absorption spectra; these spectra were determined experimentally as a function of pH and calculated using the DFT method. Four solutions with the gallic acid concentration equal to 0.65 mM were prepared. The first solution was obtained when gallic acid was dissolved in deionized water. The pH of the obtained solution was 4.4. The second solution was prepared in the same manner, but its pH was set at the level of 6.0 using 1 M NaOH solution. The third and fourth solutions were obtained when gallic acid was dissolved in 0.5 M H3PO4 and 0.1 M HCl, respectively. The absorption spectra were measured on a Cary 60 UV-Vis spectrophotometer (Agilent Technologies Inc., Santa Clara, CA, USA) in a 10 mm quartz cuvette. The aforementioned solutions were diluted 10-fold with the appropriate diluent (water or mineral acid) before spectrophotometric analysis.
All quantum mechanical calculations were performed using the Gaussian 09 program package. The molecular structures were optimized at the density functional theory (DFT) level of theory using the Becke, 3-parameter, Lee–Yang–Parr (B3LYP) functional, with the 6–311G(d) basis set. Time-Dependent DFT (TD-DFT) was used for the calculations of the UV-Vis spectra with the same basis. In addition, the solvation effect was accounted for using the polarizable continuum model (CPCM) in all calculations. Charge distribution and UV–Vis spectra were visualized using the GaussView5.0 program. All calculations were supported by high-power computers in part by PL-Grid Infrastructure.

3. Results and Discussion

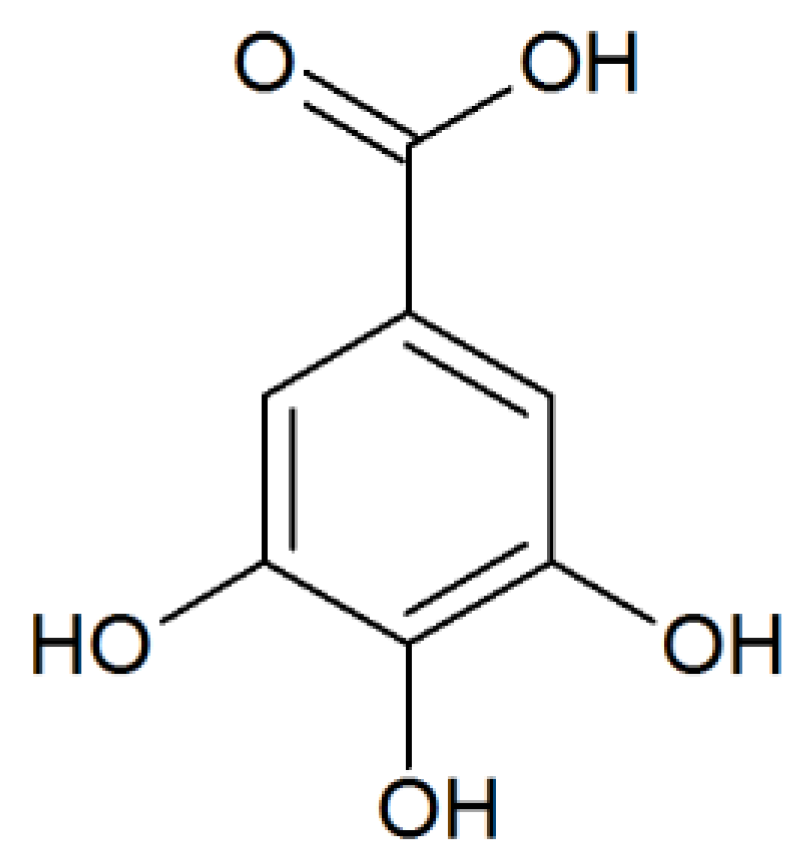
3.1. Inhibiting Ability of Gallic Acid

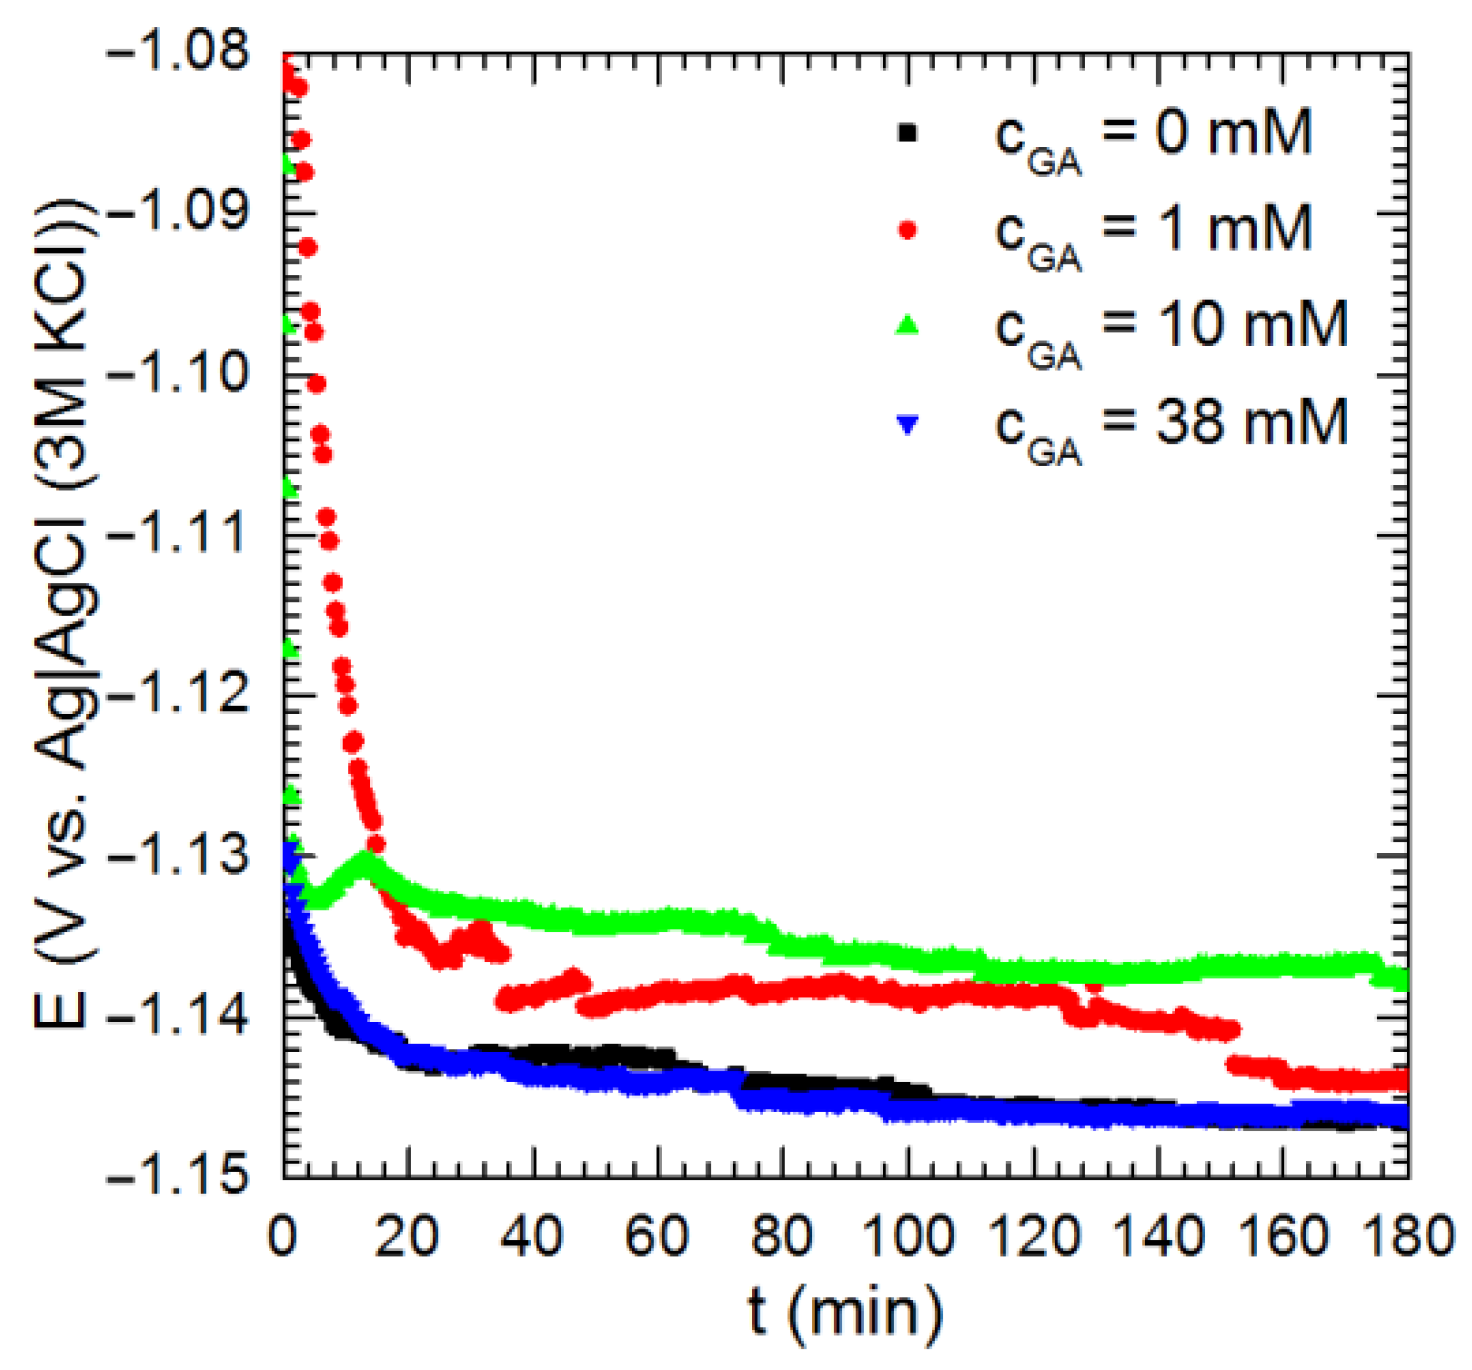
The evaluation of the inhibiting ability of gallic acid was started from the determination of the aluminum corrosion potential. This was performed using the open circuit potential measurements. The OCP vs. time dependencies were determined in deaerated 0.5 M H3PO4 aqueous solutions containing gallic acid (Figure 2). OCP decreases immediately when aluminum is exposed to an acidic solution because this solution rapidly dissolves a thin layer of Al2O3 formed on the aluminum electrode in air. Subsequent decrease in the OCP is much slower, and after circa 3 h the stationary value is reached. This corresponds to the corrosion potential Ecorr and was calculated as the average of the OCP values obtained during the last 5 min of the corrosion experiment. It can be concluded that gallic acid does not influence Ecorr. To confirm this, a statistical analysis of the corrosion potential was conducted using Equation (1). The following values were obtained: −1.151 ± 0.008 V and −1.154 ± 0.009 V vs. REF for CGA = 0 and 38 mM, respectively.
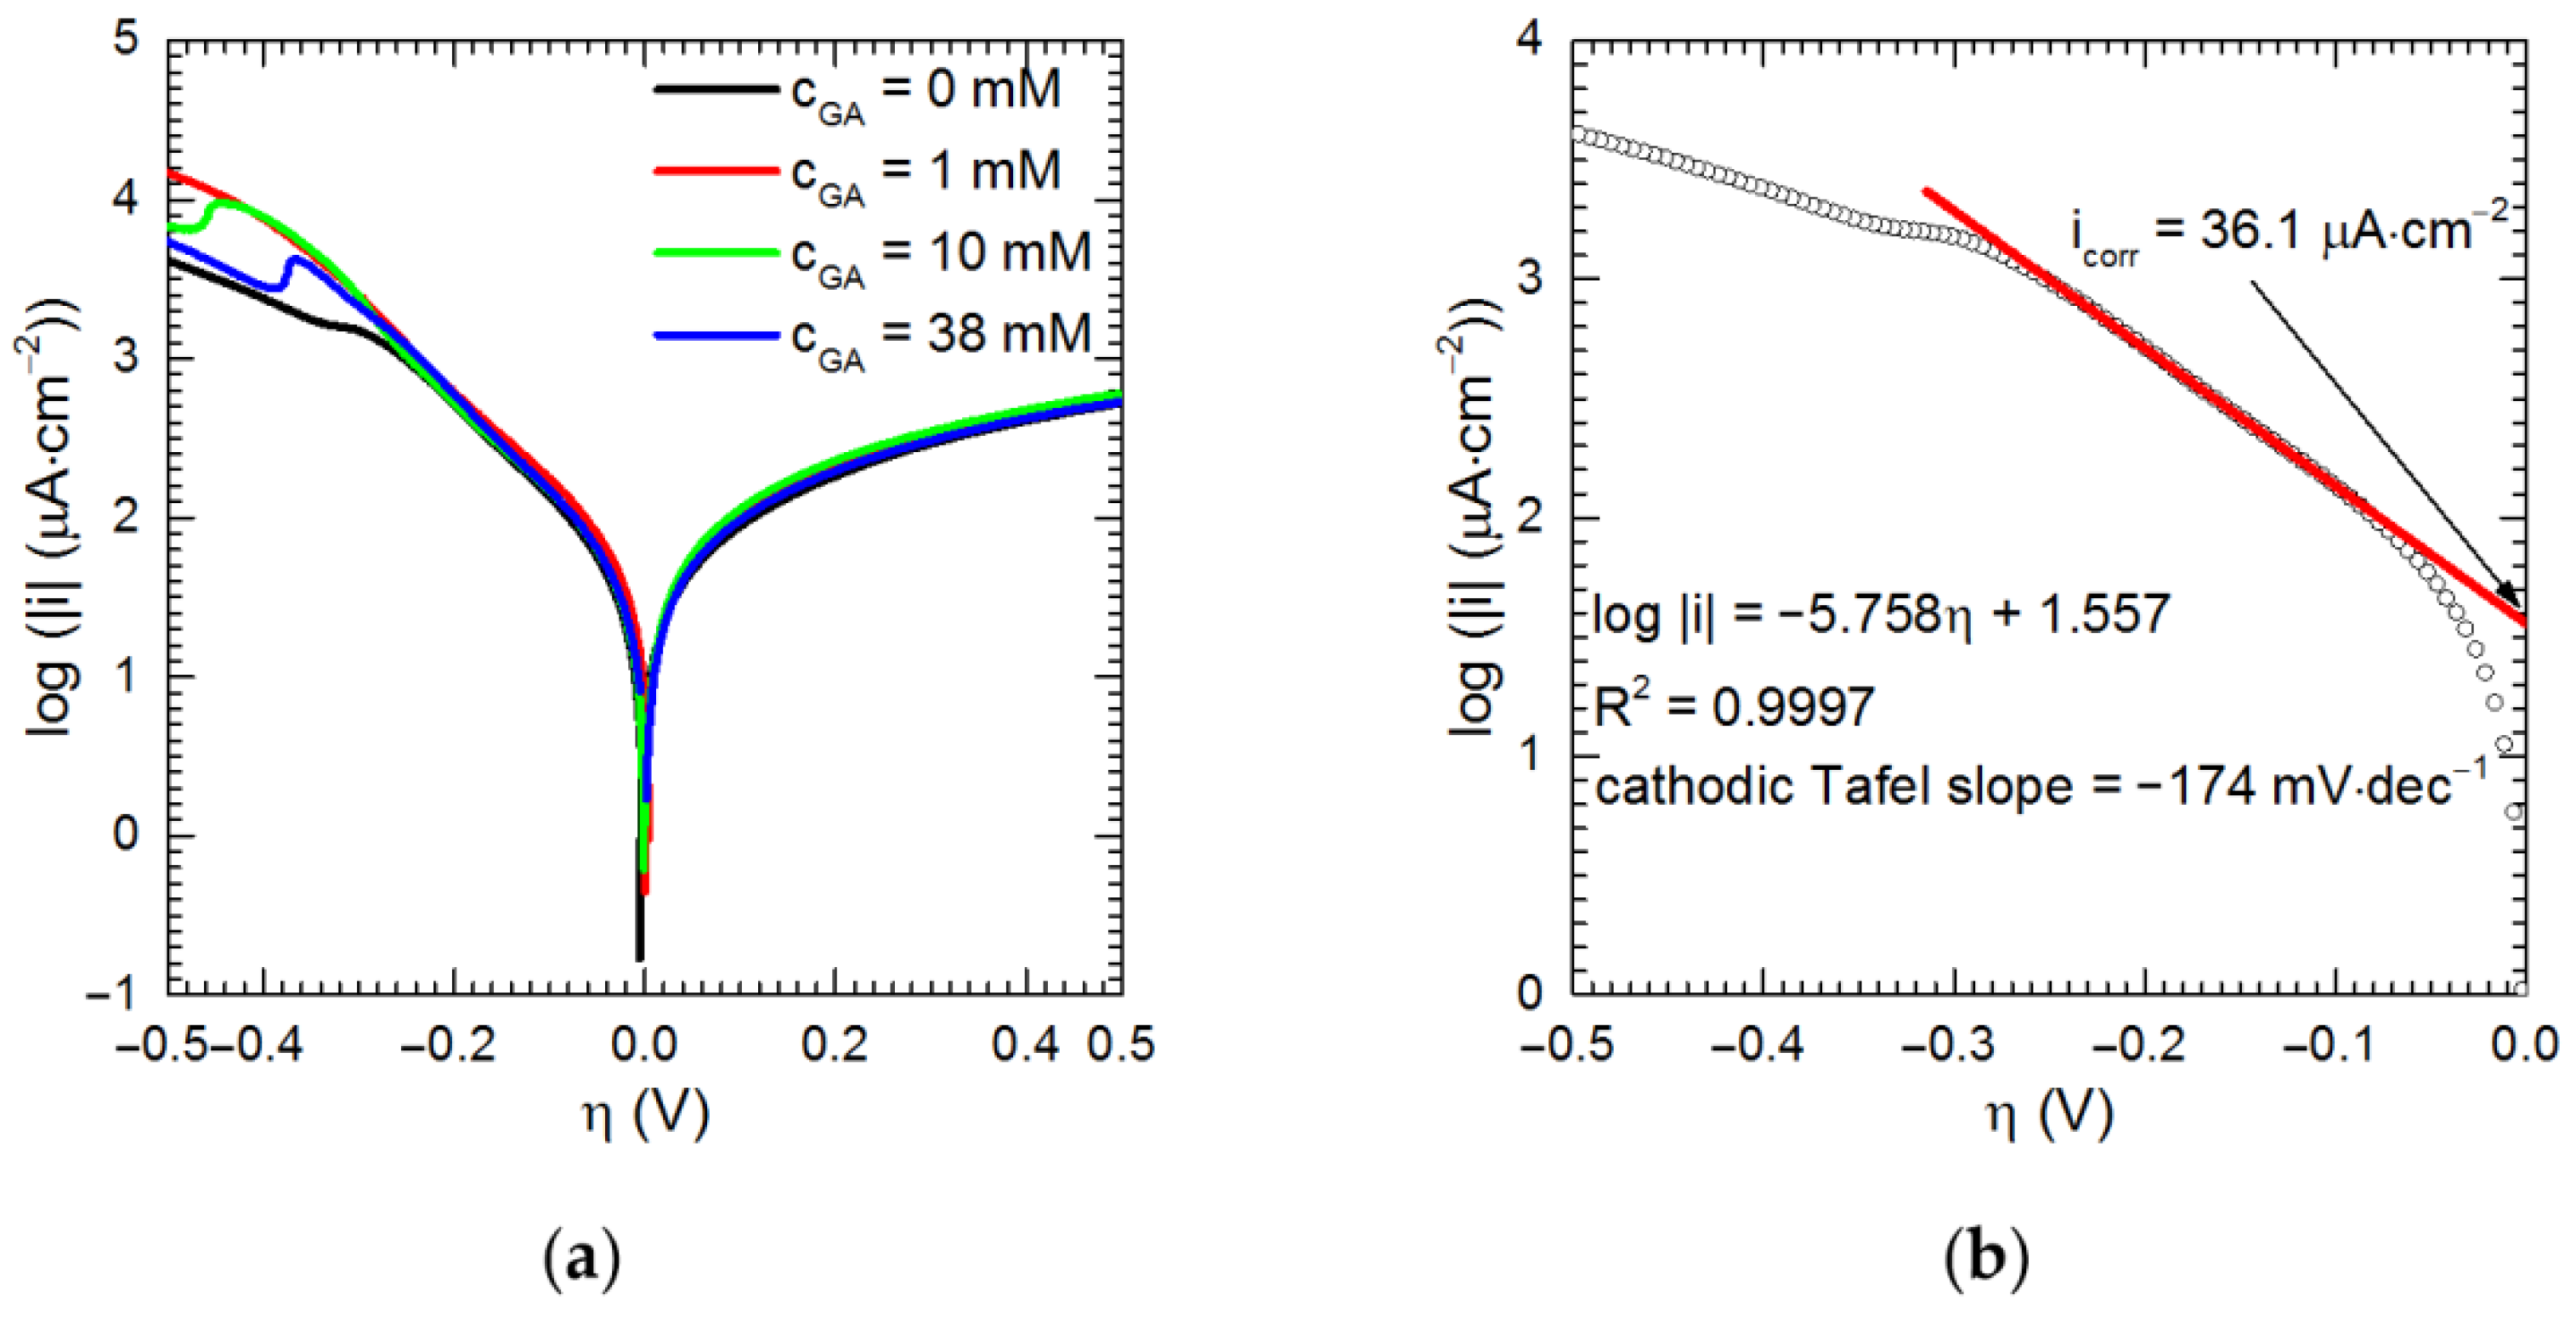
The potentiodynamic polarization method is commonly applied in corrosion studies. It helps to understand the corrosion mechanism and offers the possibility to estimate the corrosion rate. In this work, the polarization curves were determined as a function of the initial concentration of gallic acid, in 0.5 M H3PO4 aqueous solutions (Figure 3a).
The anodic polarization curves have a typical shape for aluminum with no linear part visible [2]. Thus, only cathodic curves can be used for the determination of the corrosion current density. The kinetics of the anodic reaction, which is aluminum oxidation, does not depend on the concentration of gallic acid.
The cathodic polarization curves describe mainly a hydrogen evolution process. They exhibit a rather short linear part corresponding to about one decade of the current density. This occurs between the overpotential η = −0.1 and −0.2 V. When the overpotential is more negative than −0.2 V, the polarization curves deviate from linearity and reduction peaks appear. These peaks correspond to the reduction of gallic acid. When its concentration CGA = 1 mM, the maximum of the reduction peak is located at η < −0.5 V and is not visible in Figure 3a. The peak positions are shifted in an anodic direction as CGA increases. Gallic acid is not reduced when −0.2 V < η < 0 V, because all the polarization curves in Figure 3a overlap with the one obtained at CGA = 0 mM. This also means that gallic acid does not influence the cathodic process in the corrosion cell when aluminum corrodes at the corrosion potential.
It remains unclear why the reduction peak also appears when CGA = 0 mM. The following three explanations can be proposed. The first one is the reduction of impurities from the electrolyte. Orthophosphoric acid applied in all experiments was of analytical purity and contained 0.00005 wt. % of As, 0.00002 wt. % of Cu, 0.00005 wt. % of Pb, and 0.0005 wt. % of Fe. This corresponds to the following concentrations of impurities in the electrolyte: 29 μg∙dm−3 of As, 11 μg∙dm−3 of Cu, 29 μg∙dm−3 of Pb, and 287 μg∙dm−3 of Fe. These are rather low values and probably do not affect the shape of the cathodic polarization curve. The other explanation is the reduction of oxygen. The electrolyte was always thoroughly deoxygenated with Ar before the experiments. Argon was also applied to the electrochemical cell over the electrolyte’s surface during the experiments. Nevertheless, oxygen is produced on the counter electrode during cathodic polarization and may diffuse toward the working electrode and undergo reduction. The last explanation is the reduction of H3PO4, which is the most abundant in the studied system among the possible electroactive species. The possible reactions are listed in Table 1. The driving force for these reactions is high because the reduction peak is centered at circa −1.45 V vs. REF (Ag|AgCl (3M KCl)).
The Tafel extrapolation method was applied to determine the corrosion current density icorr and the Tafel slopes for the cathodic reactions (see example in Figure 3b). The obtained Tafel slopes do not depend on CGA and are within the range between −166 and −181 mV∙dec−1. These values are more negative than −120 mV∙dec−1 obtained for aluminum in acetic or sulfuric acid [33]. This means that when η is between −0.2 V and 0 V there is an additional electrochemical process apart from hydrogen evolution. Corrosion current densities are between 36 and 49 μA∙cm−2 and do not depend on the gallic acid initial concentration. These values correspond to linear corrosion rates between 0.39 and 0.53 mm∙year−1. The corrosion rates are much lower when compared to those obtained for aluminum of technical purity in 0.5 M H3PO4: 1.96 mm∙year−1 [5] and 2.56 mm∙year−1 [34].
The linear corrosion rate describes well the studied system because of the uniform character of the corrosion. This was confirmed microscopically (Figure 4). SEM analysis of the corroded aluminum specimens did not reveal any significant influence of gallic acid on the corrosion process. The uniform character of corrosion is related to the high purity of aluminum. Usually the corrosion of aluminum alloys, even in acidic solutions, has a localized character, due to the presence of numerous intermetallic particles in their microstructure [35].

3.2. Corrosion Mechanism

Electrochemical impedance spectroscopy was used to provide a deeper understanding of the system studied. First, the impedance spectra were recorded at the open circuit potential, after 3 h of exposure of aluminum in the corrosive environment, as a function of CGA (Figure 5 and Table 2). The impedance spectra for CGA = 1 and 10 mM are not shown, because they are essentially the same as those obtained for CGA = 0 and 38 mM.
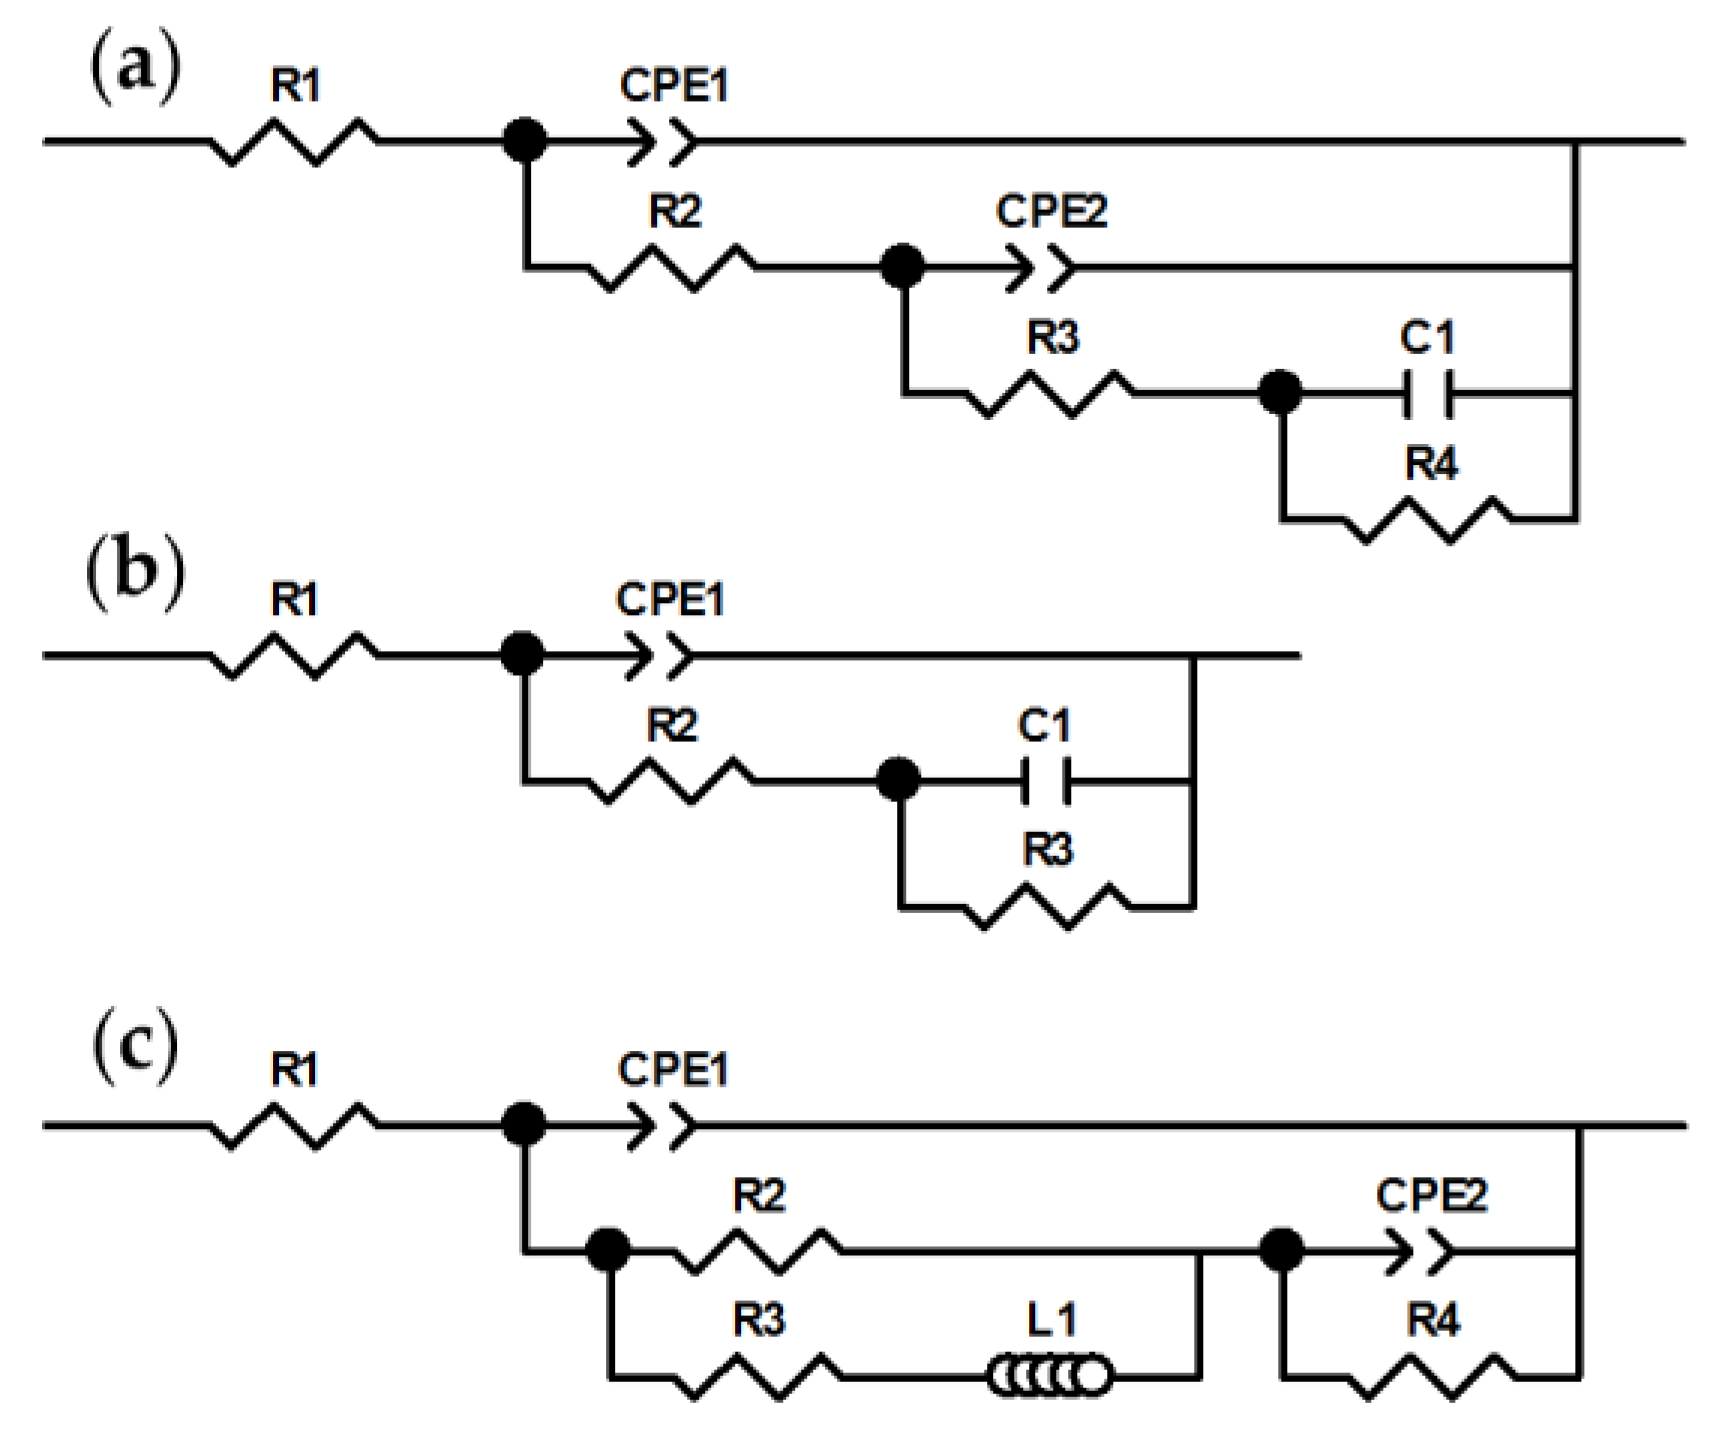
The impedance spectra were quantitatively analyzed using the electrical equivalent circuits. The spectra recorded at OCP were approximated using the equivalent circuit presented in Figure 6a. This circuit consists of resistors R1R4, constant phase elements CPE1, CPE2, and the capacitor C1. The physical meaning of R1, R2, and CPE1 is straightforward, while the interpretation of R3, R4, CPE2, and C1 is complicated and requires detailed knowledge of the system studied.
Resistors R1 and R2 correspond to the solution resistance and the charge transfer resistance, respectively. The latter takes into account both anodic and cathodic processes because the spectra were recorded at the OCP. CPE1 corresponds to the double layer capacitance. The electrical capacity of the double layer is usually not modeled using the capacitor because it describes the idealized electrode/electrolyte interface with only one time constant of the charge transfer process. In reality, there is always a certain distribution of these time constants. Thus, the constant phase element is typically used to obtain the capacitance of the electrical double layer. The impedance of CPE is given by Equation (2) [36]:
Z C P E = 1 T ( j ω ) α
where T is a parameter corresponding to the capacitance, α is the parameter describing the deviation from the purely capacitive behavior, ω is the angular frequency, and j is the imaginary number.
The capacitance of the electrode’s double layer, Cdl, can be calculated using Equation (3), assuming the surface distribution of time constants of the charge transfer process [36]:
C d l = T 1 1 / α ( 1 R 1 + 1 R 2 ) 1 1 / α
Elements R3, R4, CPE2, and C1 correspond to the adsorption of e.g., reaction intermediates and/or corrosion inhibitor as well as the formation of the protective layer onto aluminum. Impedances of these elements are related to the rate constants of the aforementioned processes and changes in the surface coverage in the case of both adsorption and the formation of the protective layer. These dependencies are complex and interrelated [36,37].
The fitting results together with their statistical analysis are provided in Table 2. This analysis confirms that gallic acid does not influence the corrosion process of aluminum in the orthophosphoric acid solution. Polarization resistance Rp, which is the sum of the four resistances, equals 1013 ± 97 Ω∙cm2 and 936 ± 45 Ω∙cm2 for CGA = 0 and 38 mM, respectively. This means virtually the same value of corrosion rate in both cases. The same values of T2, α2, R3, C1, and R4 obtained for CGA = 0 and 38 mM indicate that gallic acid molecules do not adsorb onto aluminum. Therefore, these elements of the equivalent circuit correspond to adsorption of reaction intermediates and/or the formation of the protective layer. Adsorption of reaction intermediates seems to be plausible only for the cathodic process, where adsorbed hydrogen atoms are formed [36]. The charge transfer related to aluminum oxidation in acidic solutions is believed to be too rapid to observe the formation of any intermediates [38]. The protective layer that could be formed and dissolved simultaneously is Al2O3. This explains the lack of the linear part on the anodic polarization curves in Figure 3a. Double layer capacitances also support the hypothesis of partial coverage of the electrode with Al2O3, because they are smaller when compared to the typical value for metallic electrodes, 20 μF∙cm−2 [39]: Cdl = 9.1 ± 0.6 μF∙cm−2, and 9.6 ± 0.3 μF∙cm−2 for CGA = 0 and 38 mM, respectively.
The important question arises as to why gallic acid does not adsorb onto aluminum. Gallic acid is a weak acid with pK = −4.152 [40]. This means that at pH = 6.0 it is almost completely (98%) dissociated. When the solution becomes acidic, gallic acid is protonated. Thus, it was important to check whether at pH = 1.1 gallic acid exists as the neutral molecule or if further protonation is possible, e.g., of the oxygen from the carbonyl group. The protonation of gallic acid can be studied using UV-Vis spectrophotometry because it produces a bathochromic shift of the absorption bands. Gallic acid has two absorption bands in the ultraviolet part of the spectrum. These bands are related to π → π* transitions [41]. At pH = 6.0, when gallic acid is almost completely dissociated, these bands are centered at 212 and 259 nm. They are only slightly shifted at pH = 4.4, where circa 64% of gallic acid molecules are dissociated, and much stronger at pH = 1.1 (Figure 7a). The absorption spectra obtained for gallic acid dissolved in H3PO4 and HCl at this pH are the same. This means that there are no specific interactions between gallic and orthophosphoric acids.
The absorption spectrum obtained in 0.5 M H3PO4 can be compared with the one calculated for an undissociated gallic acid molecule using the TD-DFT method (Figure 7b). Positions of absorption bands in both spectra are comparable. This, and agreement with the already published data [41,42], strongly suggest that during the corrosion tests, gallic acid was in the form of an undissociated molecules. For additional confirmation, the UV-Vis absorption spectrum of the gallic acid molecule with protonated oxygen atom from the carbonyl group was calculated. This protonation process produces a strong bathochromic shift of the absorption band centered at λ = 278 nm to λ = 341 nm, and an additional absorption band also appears at 388 nm. There are no absorption bands at λ > 320 nm in the experimentally obtained spectra. Therefore, the oxygen atom from the carbonyl group is not protonated at pH = 1.1.
Adsorption onto a metallic electrode is related to the electrical charge of both counterparts. The sign of the electrical charge on aluminum depends on its potential in the electrolyte. In this work, the corrosion process was studied mainly at the corrosion potential. Its average value, circa −1.15 V vs. REF, is more negative when compared to the potential of zero charge of aluminum, −0.73 V vs. REF [
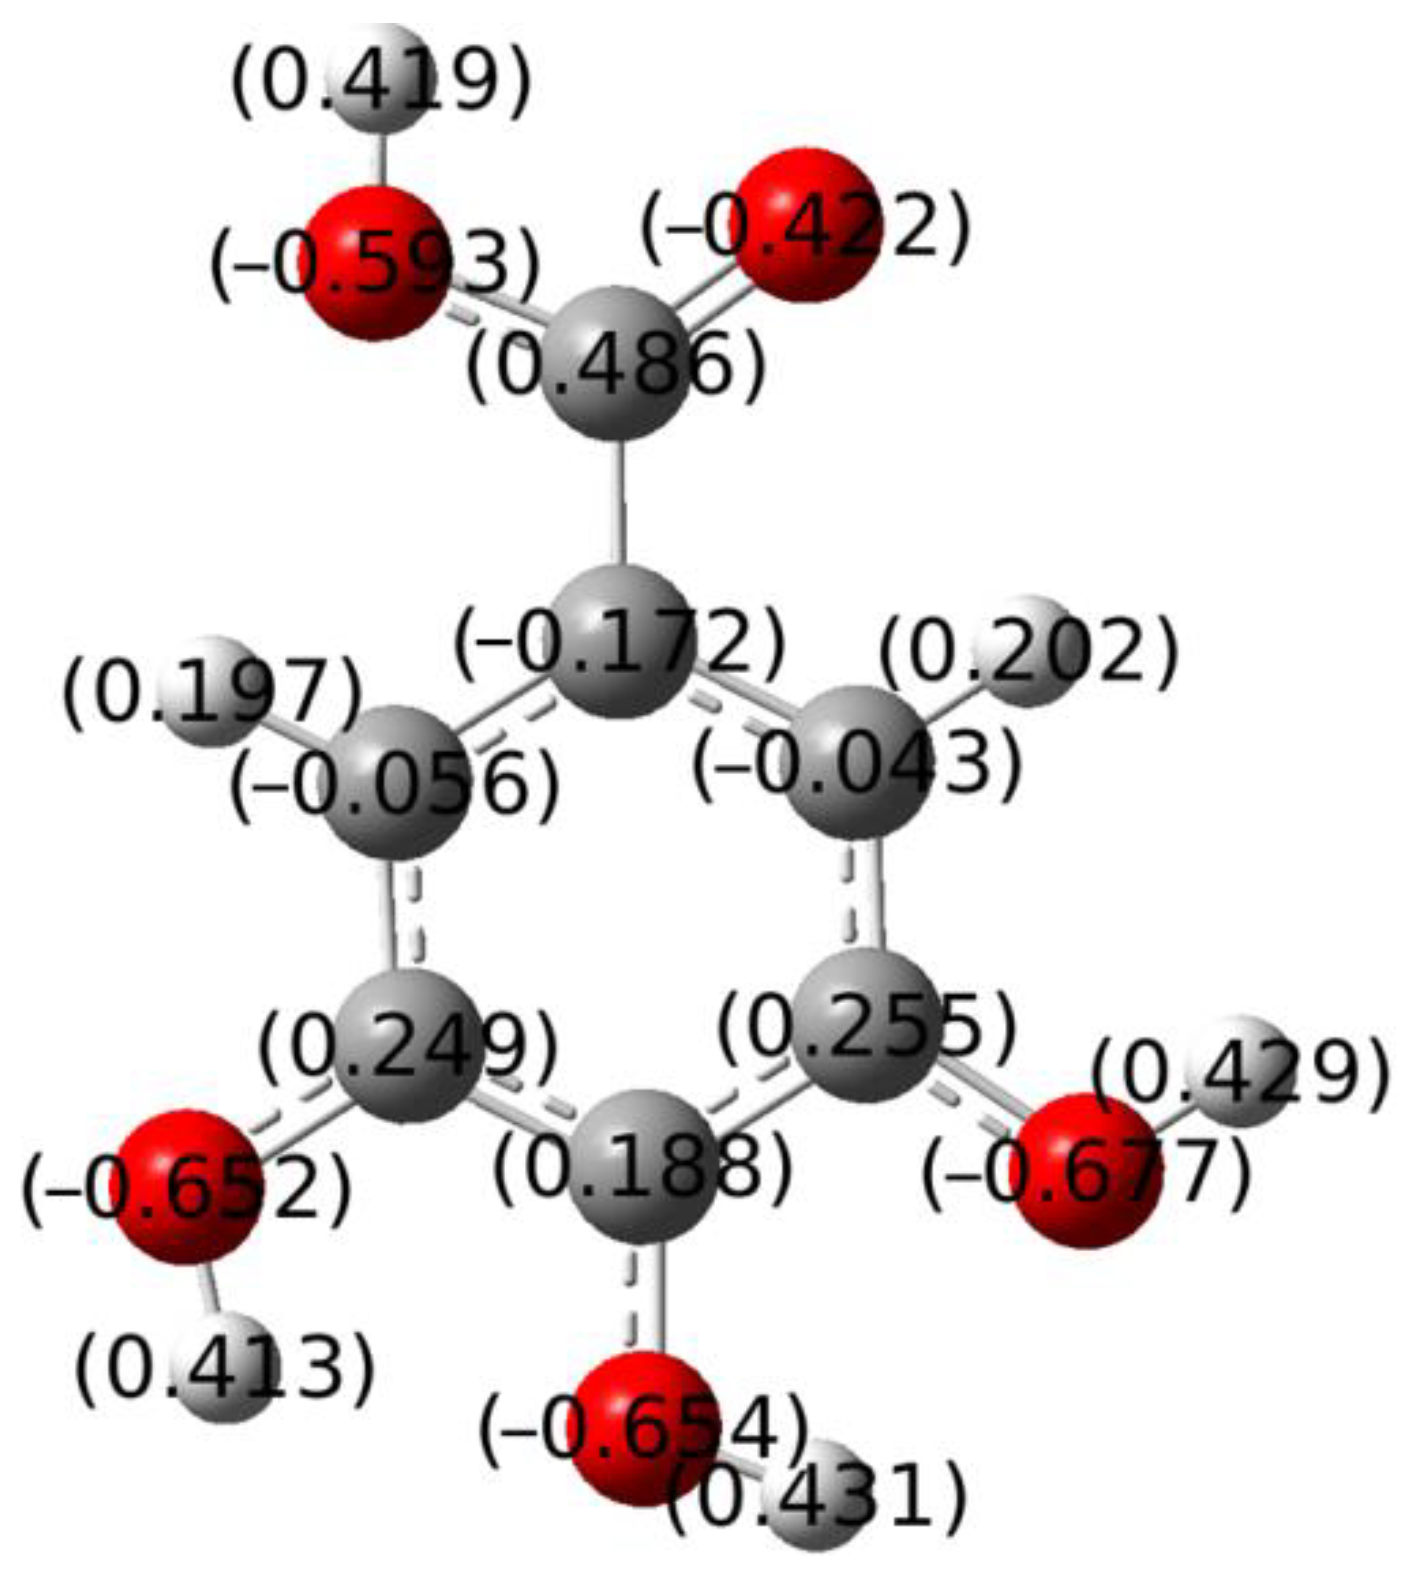
43]. The value of corrosion potential is between the potentials of anodic and cathodic areas in the corrosion cell. This means that, under studied conditions, at least the anodic areas are negatively charged. The electrical charge at the cathodic areas cannot be deduced in this manner; it can be positive of negative. The interaction of gallic acid with the metallic surface is possible via hydroxyl or carbonyl groups. All of them are negatively charged as is shown in Figure 8. Thus, the probability of adsorption of gallic acid on the anodic areas of the corrosion cell is low and the anodic process in the corrosion cell is not inhibited. In fact, there is an overall positive charge at the benzene ring, but it apparently does not facilitate adsorption on anodic areas of corroding aluminum. Further studies, e.g., with local electrochemical methods, are necessary to explain why gallic acid does not adsorb at the cathodic areas in the corrosion cell. Adsorption of the neutral molecule should be possible at a potential close to the potential of zero charge [44]. Adsorption of gallic acid onto aluminum oxide is possible at pH = 1.1, because the oxide surface is positively charged then [45].
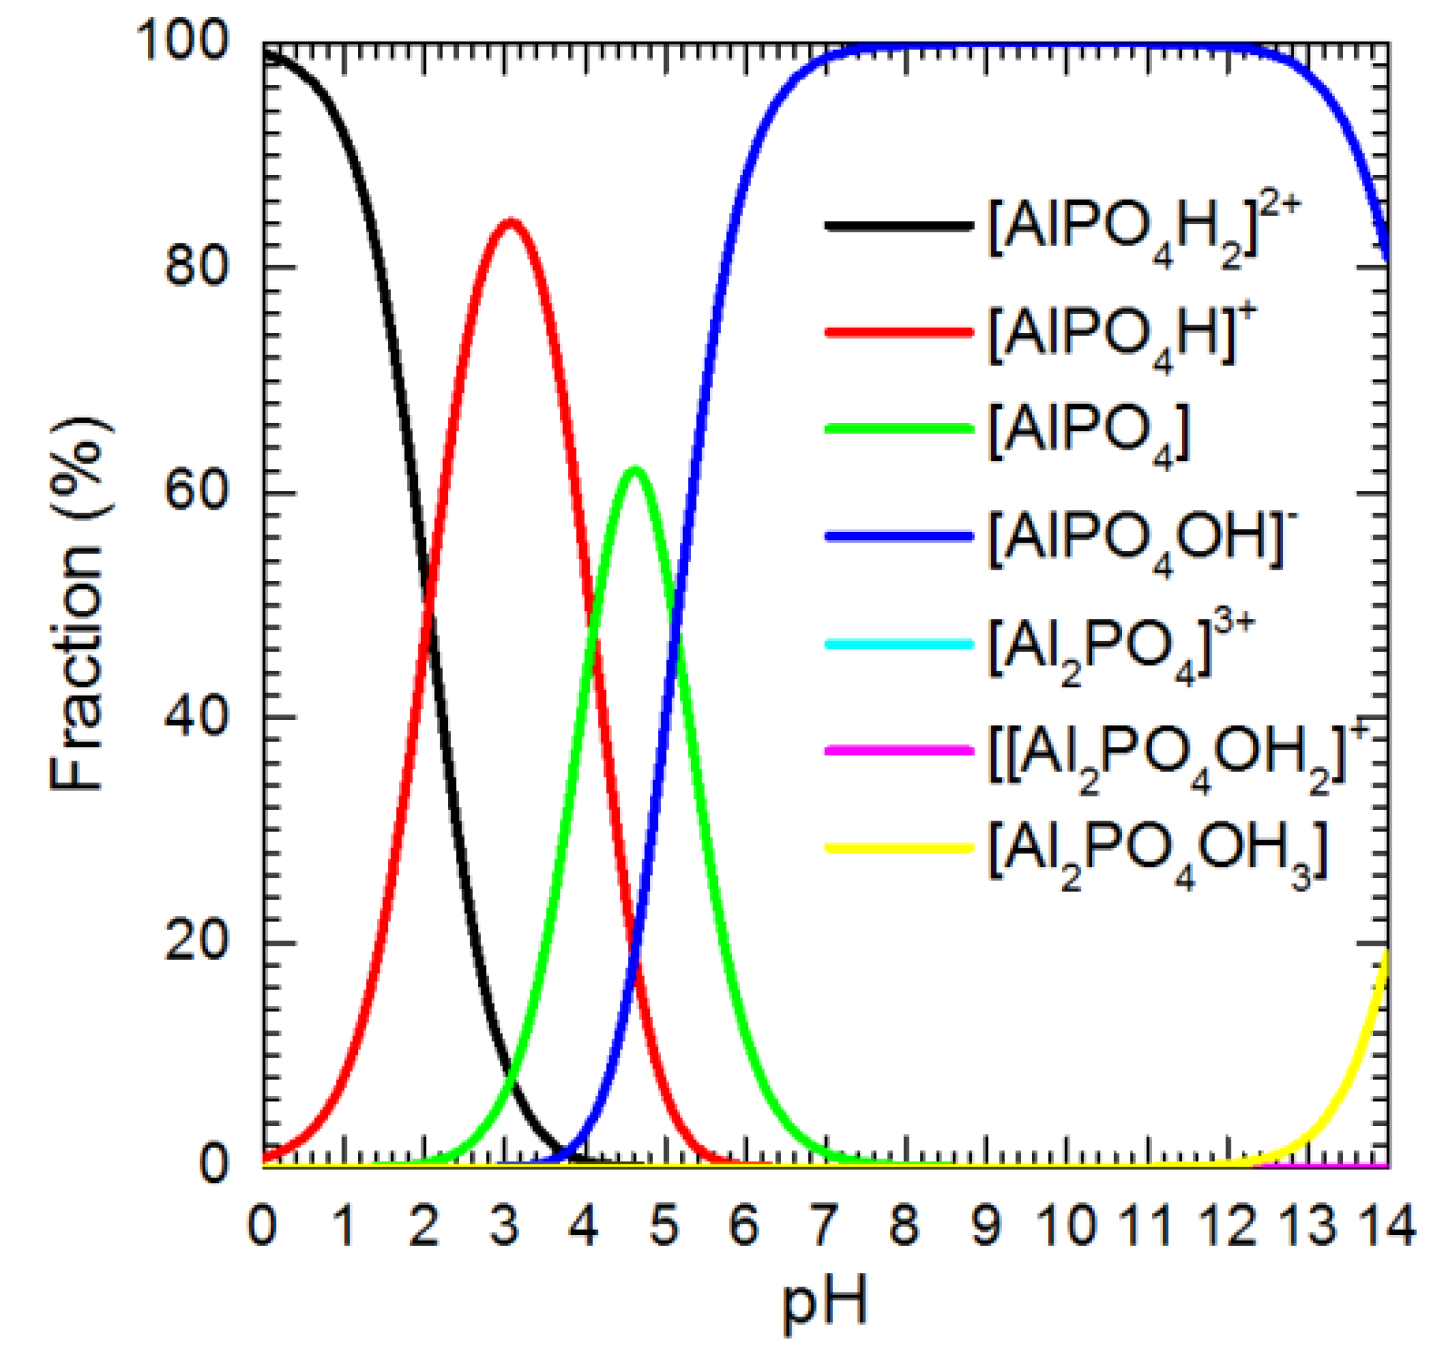
The negatively charged surface of aluminum attracts cations from the electrolyte. These are, in addition to hydronium, aluminum complexes such as [AlPO4H2]2+ and [AlPO4H]+. Their presence in the solution at pH = 1.1 can be suggested based on thermodynamic calculations (Figure 9). Complexes of gallic acid with aluminum are not formed because they are less stable than complexes with phosphate anions [40,46]. This confirms the results of corrosion experiments. The formation of stable complexes of aluminum with gallic acid would result in an increased corrosion rate.
Impedance spectra recorded at the OCP characterize both anodic and cathodic processes in the corrosion cell. These processes were studied separately using the following methodology. First, aluminum corroded freely at the OCP for 3 h, and the impedance spectrum was recorded. Subsequently, the working electrode was polarized either −0.1 V or +0.1 V vs. OCP. The constant potential was then held for 1 h, and the impedance spectrum was recorded. This procedure was carried out for CGA = 0 and 38 mM, and again, there was no influence of gallic acid on the studied processes (Figure 5a,b, Table 3 and Table 4).
The impedance spectrum characterizing the anodic processes, i.e., obtained at η = +0.1 V, consists of two time constants (Figure 5a) and was approximated with the electrical equivalent circuit presented in Figure 6b. This circuit can describe the passivation process [37], where R3 and C1 correspond to the formation of the protective layer. The impedances of these two elements depend on the charge transfer resistance and describe how the electric current changes when the surface is gradually covered with the protective layer or when the resistivity of this layer increases. When the electrode potential is below the active-passive transition potential R3 has a positive value and dissolution of the protective layer prevails. Nevertheless, a certain deviation from the Tafelian behavior is visible in the polarization curve. The higher the value of R3, the more significant this deviation is. The active-passive transition occurs when R3 goes to infinity. When the metal is in the passive state, R3 is negative [37].
It can be observed that R3 = 374 Ω∙cm2, obtained for the anodically polarized electrode (Table 4), and this is significantly higher than both R3 = 150 Ω∙cm2 and R4 = 136 Ω∙cm2 obtained at the OCP (Table 3). Thus, anodic polarization enhances the formation of the protective layer. This should decrease the double layer capacitance of the electrode because the dielectric permittivity of Al2O3 is lower when compared to that of water. This seems to occur in the studied system. Cdl decreases from 8.6 to 7.8 μF∙cm−2 when CGA = 0 mM and from 9.3 to 8.2 μF∙cm−2 when CGA = 38 mM. These, however, are small differences, and further statistical analysis is necessary to prove it. The protective layer is simultaneously formed and dissolved in an orthophosphoric acid solution, and either the surface coverage or the film thickness is insufficient to induce the active–passive transition. Gallic acid does not influence the passivation process; therefore, virtually the same values of C1 and R3 were obtained for CGA = 0 and 38 mM.
The impedance spectrum characterizing the cathodic processes consists of the three time constants, with the inductive loop at the low-frequency range (Figure 5b). The impedance spectrum was approximated using the electrical equivalent circuit presented in Figure 6c. This circuit consists of resistors R1R4, constant phase elements CPE1 and CPE2 as well as the inductor L1. Resistors R1 and R2 correspond to the solution and the charge transfer resistance, respectively. The constant phase element CPE1 represents the double layer capacitance. Resistors R3 and R4, CPE2, and L1 can be related to the adsorption of two different species [47].
The results of approximation of the impedance spectra obtained at OCP and subsequent cathodic polarization are presented in Table 5 and Table 6 respectively. Cathodic polarization caused a very small change in the double layer capacitance. Cdl decreased with polarization from 8.5 to 8.2 μF∙cm−2 when CGA = 0 mM and from 9.9 to 9.2 μF∙cm−2 when CGA = 38 mM. On the contrary to the anodic polarization, the cathodic one caused a significant decrease in charge transfer resistance (R2 in all equivalent circuits). This is understandable because cathodic polarization should facilitate charge transfer from the electrode to hydrogen ions in the electrolyte. More interesting is the nature of the inductive loop appearing upon cathodic polarization. The most important cathodic process in the studied system is hydrogen evolution. Typically, this process is modeled with a simple equivalent circuit, such as presented in Figure 6b [36]. This might suggest that the inductive loop corresponds to the adsorption process that is not related to hydrogen evolution. It has already been mentioned that there is more than one cathodic process in the system studied. The following possibilities were proposed: reduction of impurities from the electrolyte, oxygen generated at the counter electrode, and orthophosphoric acid. The latter seems to be the most plausible. That is because the first two of them should be diffusion-controlled due to the low concentration of either impurities or oxygen in the electrolyte. Diffusion processes, contrary to adsorption, do not manifest in the impedance spectra in the form of the inductive loop [36].
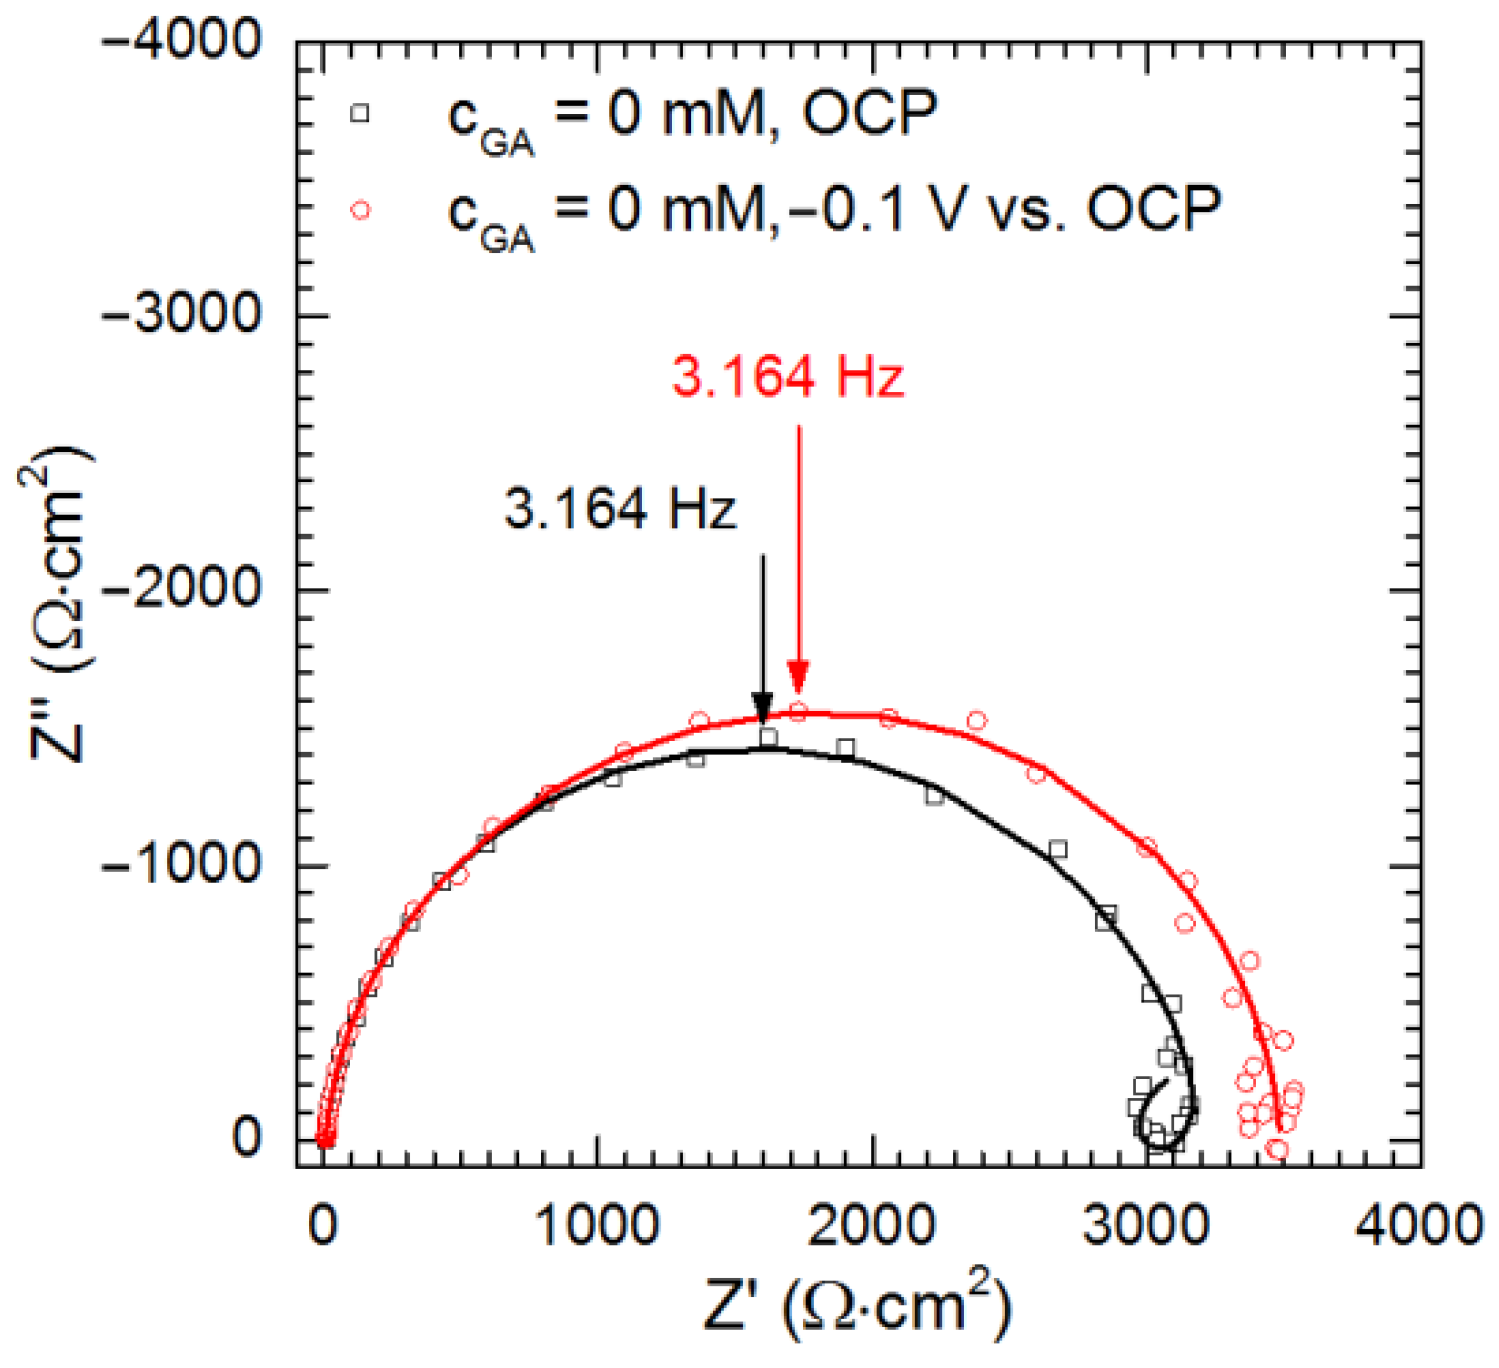
An additional corrosion experiment was performed to verify whether the inductive loop is related to the presence of orthophosphoric acid in the studied system. During this experiment, aluminum corroded freely in a 0.1 M HCl aqueous solution for 5 h. Then, the impedance spectrum was recorded. Subsequently, the electrode was polarized cathodically vs. OCP, η = −0.1 V. The potential was held for 1 h and the impedance spectrum was recorded (Figure 10).
The impedance spectrum obtained at the cathodic polarization can be approximated using the equivalent circuit from Figure 6b, which is typical for hydrogen evolution [36] (results in Table 7). This confirms the assumption that the inductive loop obtained in 0.5 M H3PO4 at η = −0.1 V (Figure 5b) is related to the adsorption of a reduced form of orthophosphoric acid.
It is also interesting to compare the impedance spectra obtained at the OCP in 0.1 M HCl and 0.5 M H3PO4. The former exhibit the inductive loop at the low frequencies, thus the equivalent circuit from Figure 6c was applied (Table 8). Similar spectra were recorded for iron in an acidic solution, at the potential below the active-passive transition potential [37]. Because the data points at the low frequencies are scattered and their number is too small a reliable determination of R4 was not possible. Nevertheless, this value is very high. This fact, together with the high value of the charge transfer resistance, R2, indicates that at the same pH, orthophosphoric acid is much more corrosive than hydrochloric acid. This, in turn, can be related to the formation of stable aluminum complexes in the H3PO4 aqueous solution.

4. Conclusions

The corrosion behavior of aluminum in orthophosphoric acid was studied in the presence of gallic acid as a potential corrosion inhibitor using electrochemical methods. A relatively low value of corrosion potential of aluminum, −1.151 ± 0.008 V vs. REF, was obtained. This value did not change with the addition of gallic acid to the corrosive environment. Gallic acid also did not affect the kinetics of anodic and cathodic reactions in the corrosion cell. Consequently, virtually the same corrosion rates were obtained in the solution without and with gallic acid: CGA = 38 mM, 0.39 and 0.40 mm∙year−1, respectively. Thus, this organic compound does not act as a corrosion inhibitor in the system studied. Impedance spectra analysis confirms this conclusion. Polarization resistances were equal to 1013 ± 97 and 936 ± 45 for CGA = 0 and 38 mM, respectively.
It was also shown that there are two cathodic processes in the corrosion cell. The main process is hydrogen evolution; the other one is presumably the reduction in phosphorus-containing species. Anodic processes in the corrosion cell involve aluminum oxidation and the formation of a protective layer, most probably aluminum oxide. The latter is chemically dissolved, and thus the specimen cannot be passivated. Again, gallic acid inhibited neither aluminum oxidation, nor the protective oxide layer dissolution.
The aim of this work was to verify whether gallic acid is capable of inhibiting aluminum corrosion in orthophosphoric acid aqueous solution. Electrochemical characterization of the Al-H3PO4-GA system clearly shows that gallic acid does not act as a corrosion inhibitor under the conditions adopted in this work. This occurs because the organic molecules do not adsorb on the surface of aluminum. This is related to the net negative electric charge located at the possible adsorption sites of gallic acid, hydroxyl or carbonyl groups, and negatively charged surface of anodic areas in the corrosion cell. The sign of the electrical charge located at the cathodic areas in the corrosion cell remains unknown. Inhibiting effect of the plant extracts containing gallic acid was observed in HCl and H2SO4 solutions. The corrosion potential of aluminum or its alloys was then circa 0.25–0.65 V higher than reported in this study. This may facilitate the adsorption of the organic molecules. Verification of this hypothesis requires additional corrosion studies. Another possibility is that gallic acid simply does not act as the corrosion inhibitor in the aforementioned extracts.
The experimental results presented in this work show that systematic studies on the influence of the individual constituents of plant extracts on aluminum corrosion are necessary. The plant extracts are very complex, multicomponent systems, where some antagonistic or synergistic effects between constituents can occur. Thus, in our opinion, the promising results obtained using plant extracts are just the first step toward more detailed corrosion studies.

Author Contributions

Conceptualization, P.K.; methodology, P.K.; formal analysis, P.K.; investigation, P.K., K.D., B.K., A.O., M.W., A.P.; writing—original draft preparation, P.K.; writing—review and editing, P.K., M.W.; supervision, P.K. All authors have read and agreed to the published version of the manuscript.

Funding

This research was partially funded by National Science Centre, Poland, grant number 2016/23/D/ST5/01343.

Institutional Review Board Statement

Not applicable.

Informed Consent Statement

Not applicable.

Data Availability Statement

The data presented in this study are available on reasonable request from the corresponding author.

Acknowledgments

This research was supported in part by PL-Grid Infrastructure. DFT calculations were performed at the Academic Computer Centre CYFRONET AGH within computational grant LIIPS3.

Conflicts of Interest

The authors declare no conflict of interest.

References

  1. Starke, E.A.; Staley, J.T. Application of modern aluminium alloys to aircraft. Prog. Aerosp. Sci. 2010, 32, 131–172. [Google Scholar] [CrossRef]
  2. Vargel, C. Corrosion of Aluminium; Elsevier B.V.: Amsterdam, The Netherlands, 2004. [Google Scholar]
  3. Sheasby, P.G.; Pinner, R.; Wernick, S. The Surface Treatment and Finishing of Aluminium and Its Alloys; ASM International: Trowbridge, UK, 2001; ISBN 9780904477214. [Google Scholar]
  4. Li, X.; Deng, S.; Fu, H. Sodium molybdate as a corrosion inhibitor for aluminium in H3PO4 solution. Corros. Sci. 2011, 53, 2748–2753. [Google Scholar] [CrossRef]
  5. Kwolek, P.; Kamiński, A.; Dychtoń, K.; Drajewicz, M.; Sieniawski, J. The corrosion rate of aluminium in the orthophosphoric acid solutions in the presence of sodium molybdate. Corros. Sci. 2016, 106, 208–216. [Google Scholar] [CrossRef]
  6. Dychtoń, K.; Kwolek, P. The replacement of chromate by molybdate in phosphoric acid-based etch solutions for aluminium alloys. Corros. Eng. Sci. Technol. 2018, 53, 234–240. [Google Scholar] [CrossRef]
  7. Standard ISO 2106:2019; Anodizing of Aluminium and Its Alloys—Determination of Mass per Unit Area (Surface Density) of Anodic Oxidation Coatings—Gravimetric Method. International Organization for Standarization: Geneva, Switzerland, 2019.
  8. Desai, M.N. Corrosion Inhibitors for Aluminium Alloys. Mater. Corros. 1972, 23, 475–482. [Google Scholar] [CrossRef]
  9. Xhanari, K.; Finšgar, M. Organic corrosion inhibitors for aluminium and its alloys in acid solutions: A review. RSC Adv. 2016, 6, 62833–62857. [Google Scholar] [CrossRef]
  10. Xhanari, K.; Finšgar, M.; Knez Hrnčič, M.; Maver, U.; Knez, Ž.; Seiti, B. Green corrosion inhibitors for aluminium and its alloys: A review. RSC Adv. 2017, 7, 27299–27330. [Google Scholar] [CrossRef]
  11. Marzorati, S.; Verotta, L.; Trasatti, S.P. Green corrosion inhibitors from natural sources and biomass wastes. Molecules 2019, 24, 48. [Google Scholar] [CrossRef] [Green Version]
  12. Chaubey, N.; Savita; Qurashi, A.; Chauhan, D.S.; Quraishi, M.A. Frontiers and advances in green and sustainable inhibitors for corrosion applications: A critical review. J. Mol. Liq. 2021, 321, 114385. [Google Scholar] [CrossRef]
  13. Quraishi, M.A.; Chauhan, D.S.; Saji, V.S. Heterocyclic biomolecules as green corrosion inhibitors. J. Mol. Liq. 2021, 341, 117265. [Google Scholar] [CrossRef]
  14. Reena Kumari, P.D.; Kumari, D. Experimental and Theoretical Evaluation of Rutin as Eco-Friendly Corrosion Inhibitor for Aluminum 6063 Alloy in Acidic Medium. J. Fail. Anal. Prev. 2018, 18, 856–867. [Google Scholar] [CrossRef]
  15. Guedes, L.A.L.; Bacca, K.G.; Lopes, N.F.; da Costa, E.M. Tannin of Acacia mearnsii as green corrosion inhibitor for AA7075-T6 alluminum alloy in acidic medium. Mater. Corros. 2019, 70, 1288–1297. [Google Scholar] [CrossRef]
  16. Kumari, D.; Venugopal, P.P.; Kumari P. D., R.; Chakraborty, D. Exploring the potential role of quercetin in corrosion inhibition of aluminium alloy 6063 in hydrochloric acid solution by experimental and theoretical studies. J. Adhes. Sci. Technol. 2021. [Google Scholar] [CrossRef]
  17. Du, Y.T.; Wang, H.L.; Chen, Y.R.; Qi, H.P.; Jiang, W.F. Synthesis of baicalin derivatives as eco-friendly green corrosion inhibitors for aluminum in hydrochloric acid solution. J. Environ. Chem. Eng. 2017, 5, 5891–5901. [Google Scholar] [CrossRef]
  18. Hodgson, J.M.; Morton, L.W.; Puddey, I.B.; Beilin, L.J.; Croft, K.D. Gallic acid metabolites are markers of black tea intake in humans. J. Agric. Food Chem. 2000, 48, 2276–2280. [Google Scholar] [CrossRef] [PubMed]
  19. Ó’Coinceanainn, M.; Hynes, M.J. The kinetics and mechanisms of the reactions of aluminium(III) with gallic acid, gallic acid methyl ester and adrenaline. J. Inorg. Biochem. 2001, 84, 1–12. [Google Scholar] [CrossRef]
  20. Ali, A.I.; Foaud, N. Inhibition of aluminum corrosion in hydrochloric acid solutionusing black mulberry extract. J. Mater. Environ. Sci. 2012, 3, 917–924. [Google Scholar]
  21. Shalabi, K.; Fouda, A.S.; Elewady, G.Y.; El-Askalany, A. Adsorption and inhibitive properties of Phoenix dactylifera L. Extract as a green inhibitor for aluminum and aluminum-silicon alloy in HCl. Prot. Met. Phys. Chem. Surfaces 2014, 50, 420–431. [Google Scholar] [CrossRef]
  22. Chung, I.M.; Malathy, R.; Kim, S.H.; Kalaiselvi, K.; Prabakaran, M.; Gopiraman, M. Ecofriendly green inhibitor from Hemerocallis fulva against aluminum corrosion in sulphuric acid medium. J. Adhes. Sci. Technol. 2020, 34, 1483–1506. [Google Scholar] [CrossRef]
  23. Raghavendra, N.; Ishwara Bhat, J. Green approach to inhibition of corrosion of aluminum in 0.5 M HCl medium by tender arecanut seed extract: Insight from gravimetric and electrochemical studies. Res. Chem. Intermed. 2016, 42, 6351–6372. [Google Scholar] [CrossRef]
  24. Raghavendra, N.; Ishwara Bhat, J. Inhibition of Al corrosion in 0.5 M HCl solution by Areca flower extract. J. King Saud Univ.-Eng. Sci. 2019, 31, 202–208. [Google Scholar] [CrossRef]
  25. Ali, E.H.; Himdan, T.A.; Ahmed, Z.W. Gallic Acid as Corrosion Inhibitor for Aluminum 6061 in Alkali Solutions. Ibn AL- Haitham J. Pure Appl. Sci. 2019, 32, 16. [Google Scholar] [CrossRef]
  26. Moreau, P.; Colette-Maatouk, S.; Gareil, P.; Reiller, P.E. Modelling of the adsorption of phenolic acids onto α,γ-alumina particles. Colloids Surfaces A Physicochem. Eng. Asp. 2013, 435, 97–108. [Google Scholar] [CrossRef] [Green Version]
  27. Ribeiro, T.; Motta, A.; Marcus, P.; Gaigeot, M.P.; Lopez, X.; Costa, D. Formation of the OOH• radical at steps of the boehmite surface and its inhibition by gallic acid: A theoretical study including DFT-based dynamics. J. Inorg. Biochem. 2013, 128, 164–173. [Google Scholar] [CrossRef]
  28. Costa, D.; Ribeiro, T.; Cornette, P.; Marcus, P. DFT modeling of corrosion inhibition by organic molecules: Carboxylates as inhibitors of aluminum corrosion. J. Phys. Chem. C 2016, 120, 28607–28616. [Google Scholar] [CrossRef]
  29. Boukamp, B. A linear Kronig-Kramers transform test for immittance data validation. J. Electrochem. Soc. 1995, 142, 1885–1894. [Google Scholar] [CrossRef]
  30. Boukamp, B. Electrochemical impedance spectroscopy in solid state ionics: Recent advances. Solid State Ion. 2004, 169, 65–73. [Google Scholar] [CrossRef]
  31. Skoog, D.A.; West, D.M.; Holler, F.J.; Crouch, S.R. Fundamentals of Analytical Chemistry; Cengage Learning: Belmont, CA, USA, 2013; ISBN 9781285607191. [Google Scholar]
  32. Zoski, C.G. Handbook of Electrochemistry; Elsevier: Amsterdam, The Netherlands, 2007; ISBN 9780444519580. [Google Scholar]
  33. Vijh, A.K. Electrolytic hydrogen evolution reaction on aluminum in acidic solutions. J. Phys. Chem. 1968, 72, 1148–1156. [Google Scholar] [CrossRef]
  34. Kwolek, P.; Wojnicki, M. Spectrophotometric study of corrosion inhibition of aluminium in orthophosphoric acid aqueous solutions by using sodium molybdate. Corros. Eng. Sci. Technol. 2018, 54, 199–204. [Google Scholar] [CrossRef]
  35. Kwolek, P.; Mrówka-Nowotnik, G.; Wytrwal-Sarna, M. Corrosion of structural constituents of 2017 aluminium alloy in acidic solutions containing inhibitors. Mater. Corros. 2020, 72, 888–903. [Google Scholar] [CrossRef]
  36. Lasia, A. Electrochemical Impedance Spectroscopy and Its Applications; Springer: New York, NY, USA, 2014. [Google Scholar]
  37. Epelboin, I.; Gabrielli, C.; Keddam, M.; Takenouti, H. The Study of the Passivation Process by the Electrode Impedance Analysis. In Electrochemical Materials Science. Comprehensive Treatise of Electrochemistry; Bockris, J.O., Conway, B.E., Yeager, E., White, R.E., Eds.; Springer: Boston, MA, USA, 1981; pp. 151–192. [Google Scholar]
  38. Péter, L.; Arai, J.; Akahoshi, H. Impedance of a reaction involving two adsorbed intermediates: Aluminum dissolution in non-aqueous lithium imide solutions. J. Electroanal. Chem. 2000, 482, 125–138. [Google Scholar] [CrossRef]
  39. Chen, L.; Lasia, A. Study of the kinetics of hydrogen evolution reaction on Nickel-Zinc powder electrodes. J. Electrochem. Soc. 1992, 139, 3214–3219. [Google Scholar] [CrossRef]
  40. Öhman, L.-O.; Sjöberg, S. Equilibrium and structural studies of silicon(IV) and aluminium(III) in aqueous solution. 4. A potentiometric study of polynuclear aluminium(III) hydroxo complexes with gallic acid in hydrolyzed alunium(III) solutions. Acta Chem. Scand. A 1982, 36, 47–53. [Google Scholar] [CrossRef]
  41. Cappelli, C.; Mennucci, B.; Monti, S. Environmental effects on the spectroscopic properties of gallic acid: A combined classical and quantum mechanical study. J. Phys. Chem. A 2005, 109, 1933–1943. [Google Scholar] [CrossRef] [PubMed]
  42. Badhani, B.; Kakkar, R. DFT study of structural and electronic properties of gallic acid and its anions in gas phase and in aqueous solution. Struct. Chem. 2017, 28, 1789–1802. [Google Scholar] [CrossRef]
  43. Sato, N. Electrochemistry at Metal and Semiconductor Electrodes; Elsevier: Amsterdam, The Netherlands, 1998. [Google Scholar]
  44. Argade, S.D.; Gileadi, E. The Potential fo Zero Charge. In Electrosorption; Gileadi, E., Ed.; Plenum Press: New York, NY, USA, 1967; pp. 87–115. [Google Scholar]
  45. Kosmulski, M. Isoelectric points and points of zero charge of metal (hydr)oxides: 50 years after Parks’ review. Adv. Colloid Interface Sci. 2016, 238, 1–61. [Google Scholar] [CrossRef] [PubMed]
  46. Lakatos, A.; Evanics, F.; Dombi, G.; Bertani, R.; Kiss, T. Speciation of AlIII in blood serum-The AlIII-citrate-phosphate ternary system. Eur. J. Inorg. Chem. 2001, 2001, 3079–3086. [Google Scholar] [CrossRef]
  47. Cao, C. On the impedance plane displays for irreversible electrode reactions based on the stability conditions of the steady state II. Two state variables besides electrode potential. Electrochim. Acta 1990, 35, 837–844. [Google Scholar] [CrossRef]
Figure 1. Gallic acid molecule.
Metals 12 00250 g001
Figure 2. Open circuit potential of aluminum immersed in deaerated 0.5 M H3PO4 aqueous solution as a function of initial concentration of gallic acid and exposition time; agitation rate 300 rpm, T = 303 K.
Metals 12 00250 g002
Figure 3. Polarization curves of aluminum: (a) as a function of the initial concentration of gallic acid; (b) an example showing how corrosion current density was determined; the red line indicates the approximation of the linear part of the polarization curve. Experiments were performed in deaerated 0.5 M H3PO4 aqueous solutions with an agitation rate of 300 rpm, T = 303 K.
Metals 12 00250 g003
Figure 4. Scanning electron microscopy (SEM) micrographs of corroded aluminum: (a) CGA = 0 mM; (b) CGA = 38 mM. Experiments were performed in deaerated 0.5 M H3PO4 aqueous solutions with an agitation rate of 300 rpm, T = 303 K.
Metals 12 00250 g004
Figure 5. Impedance spectra of aluminum: (a) recorded at OCP and subsequent anodic polarization; (b) recorded at OCP and subsequent cathodic polarization. Continuous lines indicate an approximation of these spectra using appropriate electrical equivalent circuit. Experiments were performed in a deaerated 0.5 M H3PO4 aqueous solution with an agitation rate of 300 rpm, T = 303 K.
Metals 12 00250 g005
Figure 6. Electrical equivalent circuits used for approximation of impedance spectra: (a) recorded at open circuit potential; (b) recorded at η = +0.1 V; (c) recorded at η = −0.1 V.
Metals 12 00250 g006
Figure 7. Absorption spectra of aqueous solutions of gallic acid: (a) measured experimentally as a function of pH, CGA = 65 μM; (b) obtained using quantum mechanical calculations.
Metals 12 00250 g007
Figure 8. Electrical charge distribution in gallic acid molecule; C, O, and H atoms are depicted as grey, red, and white balls, respectively.
Metals 12 00250 g008
Figure 9. Speciation diagram for Al-H3PO4-GA-H2O system. Calculations were performed for 0.5 M H3PO4 aqueous solution. Total aluminum concentration of 5 mM was obtained from corrosion rate, assuming t = 3 h, the total gallic acid concentration was 38 mM. Stability constants for complex ions are from [40,46].
Metals 12 00250 g009
Figure 10. Impedance spectra of aluminum in 0.1 M HCl aqueous solution recorded at OCP and subsequent cathodic polarization. Continuous lines indicate an approximation of these spectra using appropriate electrical equivalent circuit. Experiments were performed in deaerated, agitated solutions with an agitation rate of 300 rpm, T = 303 K.
Metals 12 00250 g010
Table 1. Standard electrode potentials of phosphorus-containing species in aqueous solutions, data from [32].
ReactionStandard Electrode Potential (V vs. Ag|AgCl (3M KCl))
H3PO4 + 2H+ + 2e = H3PO3 + H2O−0.070
H3PO3 + 2H+ + 2e = H3PO2 + H2O−0.290
H3PO3 + 3H+ + 3e = P + 3H2O−0.290
P + 3H+ + 3e = PH30.150
Table 2. Averaged results of approximation of impedance spectra obtained in 0.5 M H3PO4 at OCP using equivalent circuit from Figure 6a: R1 is solution resistance; T1 and α1 are related to double layer capacitance, R2 is charge transfer resistance; R3, R4, T2, α2, and C1 contribute to Faradaic impedance. Data presented in this table represent average of five independent measurements; thus, the χ2 values indicating goodness of fit were not provided; uncertainties of fitted parameters were obtained from Equation (1).
CGA (mM)R1 (Ω∙cm2)T1 (μF∙sα−1∙cm−2)α1R2 (Ω∙cm2)T2 (μF∙sα−1∙cm−2)α2R3 (Ω∙cm2)C1 (mF∙cm−2)R4 (Ω∙cm2)
0 mM6.9 ± 0.316 ± 10.94 ± 0.01723 ± 61332 ± 690.82 ± 0.06163 ± 2541 ± 13120 ± 19
38 mM7.0 ± 0.217 ± 10.94 ± 0.01647 ± 48358 ± 380.78 ± 0.03164 ± 2145 ± 1598 ± 9
Table 3. Results of approximation of impedance spectra obtained in 0.5 M H3PO4 at OCP prior anodic polarization, using equivalent circuit from Figure 6a: R1 is solution resistance; T1 and α1 are related to double layer capacitance, R2 is charge transfer resistance; R3, R4, T2, α2 and C1 contribute to Faradaic impedance; uncertainties of fitted parameters were obtained from fitting software, χ2 values indicate goodness of fit.
CGA (mM)χ2R1 (Ω∙cm2)T1 (μF∙sα−1∙cm−2)α1R2 (Ω∙cm2)T2 (μF∙sα−1∙cm−2)α2R3 (Ω∙cm2)C1 (mF∙cm−2)R4 (Ω∙cm2)
0 mM0.000147.0 ± 0.115.2 ± 0.20.94 ± 0.01721 ± 13308 ± 390.83 ± 0.05150 ± 1459.7 ± 3.6136 ± 6
38 mM0.000397.2 ± 0.115.8 ± 0.20.94 ± 0.01672 ± 17321 ± 390.74 ± 0.05191 ± 1940.9 ± 3.5101 ± 5
Table 4. Results of approximation of impedance spectra obtained in 0.5 M H3PO4 at η = +0.1V vs. OCP using equivalent circuit from Figure 6b: R1 is solution resistance; T1 and α1 are related to double layer capacitance, R2 is charge transfer resistance; R3 and C1 contribute to Faradaic impedance; uncertainties of fitted parameters were obtained from fitting software, χ2 values indicate goodness of fit.
CGA (mM)χ2R1 (Ω∙cm2)T1 (μF∙sα−1∙cm−2)α1R2 (Ω∙cm2)C1 (mF∙cm−2)R3 (Ω∙cm2)
0 mM0.000536.9 ± 0.114.3 ± 0.10.94 ± 0.01721 ± 212.1 ± 0.3374 ± 6
38 mM0.000537.1 ± 0.115.4 ± 0.10.94 ± 0.01743 ± 212.1 ± 0.4353 ± 8
Table 5. Results of approximation of impedance spectra obtained in 0.5 M H3PO4 at OCP prior cathodic polarization, using equivalent circuit from Figure 6a: R1 is solution resistance; T1 and α1 are related to double layer capacitance, R2 is charge transfer resistance; R3, R4, T2, α2 and C1 contribute to Faradaic impedance; uncertainties of fitted parameters were obtained from fitting software, χ2 values indicate goodness of fit.
CGA (mM)χ2R1 (Ω∙cm2)T1 (μF∙sα−1∙cm−2)α1R2 (Ω∙cm2)T2 (μF∙sα−1∙cm−2)α2R3 (Ω∙cm2)C1 (mF∙cm−2)R4 (Ω∙cm2)
0 mM0.000166.8 ± 0.115.0 ± 0.10.94 ± 0.01739 ± 9308 ± 230.79 ± 0.03186 ± 1140.2 ± 2117 ± 2
38 mM0.000176.8 ± 0.117.1 ± 0.20.94 ± 0.01667 ± 8373 ± 280.80 ± 0.03160 ± 939.5 ± 2105 ± 3
Table 6. Results of approximation of impedance spectra obtained in 0.5 M H3PO4 at η = −0.1V vs. OCP, using equivalent circuit from Figure 6c: R1 is solution resistance; T1 and α1 are related to double layer capacitance, R2 is charge transfer resistance; R3, R4, T2, α2 and L1 contribute to Faradaic impedance; uncertainties of fitted parameters were obtained from fitting software, χ2 values indicate goodness of fit.
CGA (mM)χ2R1 (Ω∙cm2)T1 (μF∙sα−1∙cm−2)α1R2 (Ω∙cm2)T2 (μF∙sα−1∙cm−2)α2R3 (Ω∙cm2)L1 (H∙cm2)R4 (Ω∙cm2)
0 mM0.000176.7 ± 0.115.0 ± 0.20.94 ± 0.01484 ± 16619 ± 740.59 ± 0.052447 ± 3314576 ± 652166 ± 21
38 mM0.000326.8 ± 0.117.1 ± 0.20.94 ± 0.01470 ± 7616 ± 530.69 ± 0.042310 ± 1575040 ± 426125 ± 10
Table 7. Results of approximation of impedance spectra obtained in 0.1 M HCl at η = −0.1V vs. OCP using equivalent circuit from Figure 6b: R1 is solution resistance; T1 and α1 are related to double layer capacitance, R2 is charge transfer resistance; R3 and C1 contribute to Faradaic impedance; uncertainties of fitted parameters were obtained from fitting software, χ2 values indicate goodness of fit.
χ2R1 (Ω∙cm2)T1 (μF∙sα−1∙cm−2)α1R2 (Ω∙cm2)C1 (μF∙cm−2)R3 (Ω∙cm2)
0.000756.5 ± 0.116.0 ± 0.20.96 ± 0.012853 ± 6855.0 ± 11629 ± 67
Table 8. Results of approximation of impedance spectra obtained in 0.1 M HCl at OCP, using equivalent circuit from Figure 6c: R1 is solution resistance; T1 and α1 are related to double layer capacitance, R2 is charge transfer resistance; R3, R4, T2, α2 and L1 contribute to Faradaic impedance; uncertainties of fitted parameters were obtained from fitting software, χ2 values indicate goodness of fit.
χ2R1 (Ω∙cm2)T1 (μF∙sα−1∙cm−2)α1R2 (Ω∙cm2)T2 (mF∙sα−1∙cm−2)α2R3 (Ω∙cm2)L1 (H∙cm2)R4 (Ω∙cm2)
0.000936.5 ± 0.117.0 ± 0.20.95 ± 0.012856 ± 1012.2 ± 0.60.22 ± 0.0411377 ± 173630335 ± 5218n.d.
Publisher’s Note: MDPI stays neutral with regard to jurisdictional claims in published maps and institutional affiliations.

