Article

Kinetics and Mechanisms of Artificial Willemite Leaching in Low-Sulfuric-Acid Solution at Elevated Temperature

1
School of Resources and Environmental Engineering, Jiangsu University of Technology, Changzhou 213001, China
2
Jiangsu Key Laboratory of Electronic Waste Resources Recycling, Jiangsu University of Technology, Changzhou 213001, China
3
Jiangsu Province Engineering Research Center of Ex-Service PV Module Resourceful Utilization, Changzhou Institute of Technology, Changzhou 213032, China
4
Faculty of Metallurgical and Energy Engineering, Kunming University of Science and Technology, Kunming 650093, China
*
Authors to whom correspondence should be addressed.
Metals 2022, 12(12), 2031; https://doi.org/10.3390/met12122031
Submission received: 20 October 2022 / Revised: 17 November 2022 / Accepted: 22 November 2022 / Published: 26 November 2022
(This article belongs to the Section Extractive Metallurgy)

Abstract

:
The present study was undertaken to investigate the effects of temperature, sulfuric acid concentration, agitation speed, and particle size on the high-temperature leaching kinetics of artificial willemite in low sulfuric acid solution. A mathematical model taking into account the change in acid concentration was evaluated for the leaching rate increased with increasing sulfuric acid concentration, temperature, and agitation speed and decreasing particle size. The kinetic analysis indicated that the leaching process was well interpreted by a modified grain model with product layer diffusion as the main rate-controlling step, and the shrinking core model was used to represent the reaction of each grain. The characteristic changes of the sample before and after leaching were studied using a scanning electron microscope/energy dispersive X-ray spectrometer (SEM/EDS) and X-ray diffraction (XRD) to elucidate the leaching mechanism. The apparent activation energy was found to be 22.06 kJ/mol at 373–413 K, and the reaction order with sulfuric acid concentration was 1.6472. On the basis of the grain model, the following rate equation was established: 1.07 ln ( 1 0.93 x ) [ 1.28 ln 0.17 + ( 1 x ) 2 3 0.42 ( 1 x ) 1 3 0.17 + ( 1 x ) 2 3 + 0.84 ( 1 x ) 1 3 + 4.5 arctan ( 2.76 ( 1 x ) 1 3 0.58 ) ] + 3.8 = 43.55 e 22060 R T t .

1. Introduction

Zinc, coming after aluminum and copper, is one of three most important metals in nonferrous metals based on its production and consumption status [1]. Currently available zinc metal is primarily recovered either from sulfide or oxidized ores. Although the majority of zinc produced comes from sulfide ores, oxidized zinc ores are also very important since the easily treated sulfide ores are being depleted [2]. Oxidized zinc ores are common zinc ore deposits that are formed at the upper part of zinc sulfide ores through long-term supergene weathering action [3]. Smithsonite (ZnCO3), hydrozincite (2ZnCO3·3Zn(OH)2), zincite (ZnO), willemite (Zn2SiO4), and hemimorphite (Zn4Si2O7(OH)2·H2O) are the main oxide ore resources of zinc and are generally found in various parts of the world [3,4,5,6].
In nature, oxidized zinc ores—such as willemite and hemimorphite, which are found throughout the gangue minerals containing the high content of silica—can usually coexist with smithsonite [3,4]. At the same time, the minerals exhibit a wide variation in chemical and physical properties due to natural impurities (such as iron, calcium, magnesium, and so on) incorporated into the structural lattice. Thus, beneficiation of such complex ores to individual concentrates is difficult. In the area of zinc metallurgy, for the treatment of oxidized zinc ores existing in silicate form, hydrometallurgical processes seem more promising since pyrometallurgical processes are not likely to be economical due to the high consumption of energy necessary to heat gangue minerals [7]. Sulfuric acid leaching as one such process has been widely put into practice. Impurities present in this kind of ore has been also shown to have significant effects upon sulfuric acid leaching of the said ores [8,9]. Even though many of these oxidized ores cannot at present be worked economically, some can. Sulfuric acid leaching of zinc silicate ore is often considered to be problematic due mainly to the formation of silica gel [7,8,10,11]. For zinc silicate ore, once treated improperly, the silica dissolved in sulfuric acid solution will turn into a silica gel which significantly reduces the solid–liquid separation characteristic of the leaching slurry. Most current knowledge regarding the solubility, polymerization, and precipitation of silica in solution have been comprehensively reviewed and summarized by Iller [12,13,14]. In order to overcome the filtration difficulty, some new attempts—such as the use of different flocculants [11,15] and the application of microwave irradiation and high-temperature leaching processes [7,16]—have been also made by some researchers. The interest in this topic can be encouraged by the application of high-temperature leaching process since high temperatures can induce change in the thermodynamic properties of silicic acid [12] and can bring about the decomposition of formed silicic acid into a filterable silica precipitation [16]. Although much literature is available on the leaching kinetics of sulfide zinc ores in a sulfuric acid medium, work on the kinetics of the high-temperature leaching of oxidized zinc ores, such as silicates is scant. Acid leaching of zinc silicate ore containing 65.1% hemimorphite and 14.25% smithsonite under high temperature has been reported previously [16], but detailed kinetic mechanisms of high-temperature leaching are not available, particularly for willemite. In the literature available, some studies on the leaching mechanism of willemite with sulfuric acid at 293–367 K were reported. The acid leaching kinetics of willemite were studied by Terry and Monhemius, who found that the leaching process was controlled by mixed chemical diffusional steps under the conditions studied [17]. Souza et al. studied the leaching kinetics of roasted zinc silicate concentrates (willemite as the major zinc-containing phase and franklinite as a minor constituent) in sulfuric acid solution [10]. It was found that the zinc-leaching kinetics followed the grain model with porous diffusion control and that the apparent activation energy was 51.9 ± 2.8 kJ/mol. Abdel-Aal studied the acid leaching kinetics of an Egypt zinc silicate ore that contains hemimorphite and willemite as the main zinc phase as well as smithsonite as minor phase and found that diffusion through the product layer was the rate-controlling step, with an activation energy of about 13.4 kJ/mol [2]. The effect of the iron content in zinc silicate concentrates (willemite as main zinc phase) with either high (8–11%) or low (3%) iron on the kinetics of zinc extraction in sulfuric acid solution was investigated by Souza et al. [18]. They found that the leaching kinetics of zinc silicate for both the low- and high-iron concentrates also fit the grain model with porous diffusion control and that the activation energy was 78 ± 12 kJ/mol for zinc silicate concentrates with high iron content and 67 ± 10 kJ/mol for low iron content. However, there is little information available on the detailed kinetics mechanism of acid leaching of willemite under elevated temperature.
In this paper, to investigate the high-temperature leaching mechanism of willemite in sulfuric acid solution, in the absence of suitable natural sample of willemite, pure willemite was synthesized and was first studied as a simple system. The effects of sulfuric acid concentration, temperature, agitation speed, and particle size on the leaching rate of zinc from artificial willemite were investigated. Leaching rates were tested using a version of the grain model to determine the best kinetic model. A profound study on the sample before and after leaching was performed using XRD and SEM/EDS to elucidate the leaching mechanism. The apparent activation energy of leaching process was estimated.

2. Experimental

2.1. Materials

Willemite was synthesized with analytical reagents according to the conventional solid-state reaction method [19,20,21]. Briefly, stoichiometric proportions of zinc oxide and silicon dioxide (Sinopharm) were mixed. The mixed samples were pelletized and then heated at 1473 K for 12 h in an electric furnace. The resultant products cooled to room temperature and were collected and pulverized.
The XRD analysis indicated that willemite was the only phase with very sharp peaks present in the synthetic sample and that no obvious impurity phases were detected. The synthetic willemite was also characterized by SEM/EDS to obtain additional information on the mineralogical species and morphology of sample particles. As observed through SEM observation (Figure 1a), the surface of artificial willemite is rough and porous, and the porous particle is pictured as an aggregate of non-porous sphere-like grains with diameters of 1–2 μm. The EDS analysis (Figure 1b) coming from this particle indicates that the contents of Zn, Si, and O are 51.03%, 18.16%, and 30.81%, respectively. As expected, these elemental concentrations are similar to the theoretical values derived from the pure willemite. This finding may be taken as evidence to support the conclusion obtained from the XRD analysis.
To investigate the effect of particle size distribution on leaching efficiency, 500 g of the sample was ground, sieved, and divided into several size fractions using a Tyler standard sieve. The surface area, total porous volume, and porous average diameter as well as the Zn and SiO2 contents of each size fraction are listed in Table 1.
Sulfuric acid (AR) with a purity of 98% and a density of 1.84 g/mL was used as the lixiviant in all experiments. All the aqueous solutions were prepared by using distilled water.

2.2. Apparatus and Procedure

The major equipment used in this study was a 2 L vertical titanium-lined autoclave consisting of a reactor chamber and a digitally controlled mechanical stirrer. The temperature of the reaction medium was monitored and controlled with an accuracy of ±1 °C by a platinum resistance temperature sensor that was connected to a digital temperature controller. Agitation was provided by a titanium impeller with three blades. The autoclave was equipped with a solids-feeding tube that allowed for the convenient injection of the solid sample into the reactor chamber.
For each run, 2.0 g of solid sample was placed inside the solids-feeding tube, which was fitted firmly to the autoclave head and then connected to a mini buffer tank of air. The leaching solution (1.6 L) containing a required concentration of H2SO4 was added to the reactor chamber and then heated to the required temperature whilst being agitated at 800 rpm. When the temperature reached the preset value and remained stable, the installed sample was injected into the solution by being pushed through a pressurized air stream. At the same time, the partial pressure of air was adjusted to the desired value (usually 1.2 MPa) for the convenience of solution sampling. This moment was considered the starting time for the leaching reaction. At appropriate time intervals, about 10 mL sample of the reaction mixture was collected for the analysis of zinc dissolved in the leach liquor. The zinc in the leach liquor was analyzed by EDTA titration. Reaction extent was estimated depending on the amount of zinc released from the artificial willemite. Zinc extraction was calculated using a volume-correction formula [22].
x i = ( V 0 i = 1 i 1 V i ) × C i + i = 1 i 1 ( V i × C i ) M ( C M 100 )
where xi is the zinc extraction corresponding to the sample i, V0 is the initial volume of the solution, Vi is the volume of the sample i withdrawn each time, Ci is the concentration of zinc in the sample i, M is the initial mass of the sample added to the reactor chamber, and CM is the percentage of zinc in the solid sample.

3. Results and Discussion

3.1. Effects of Parameters

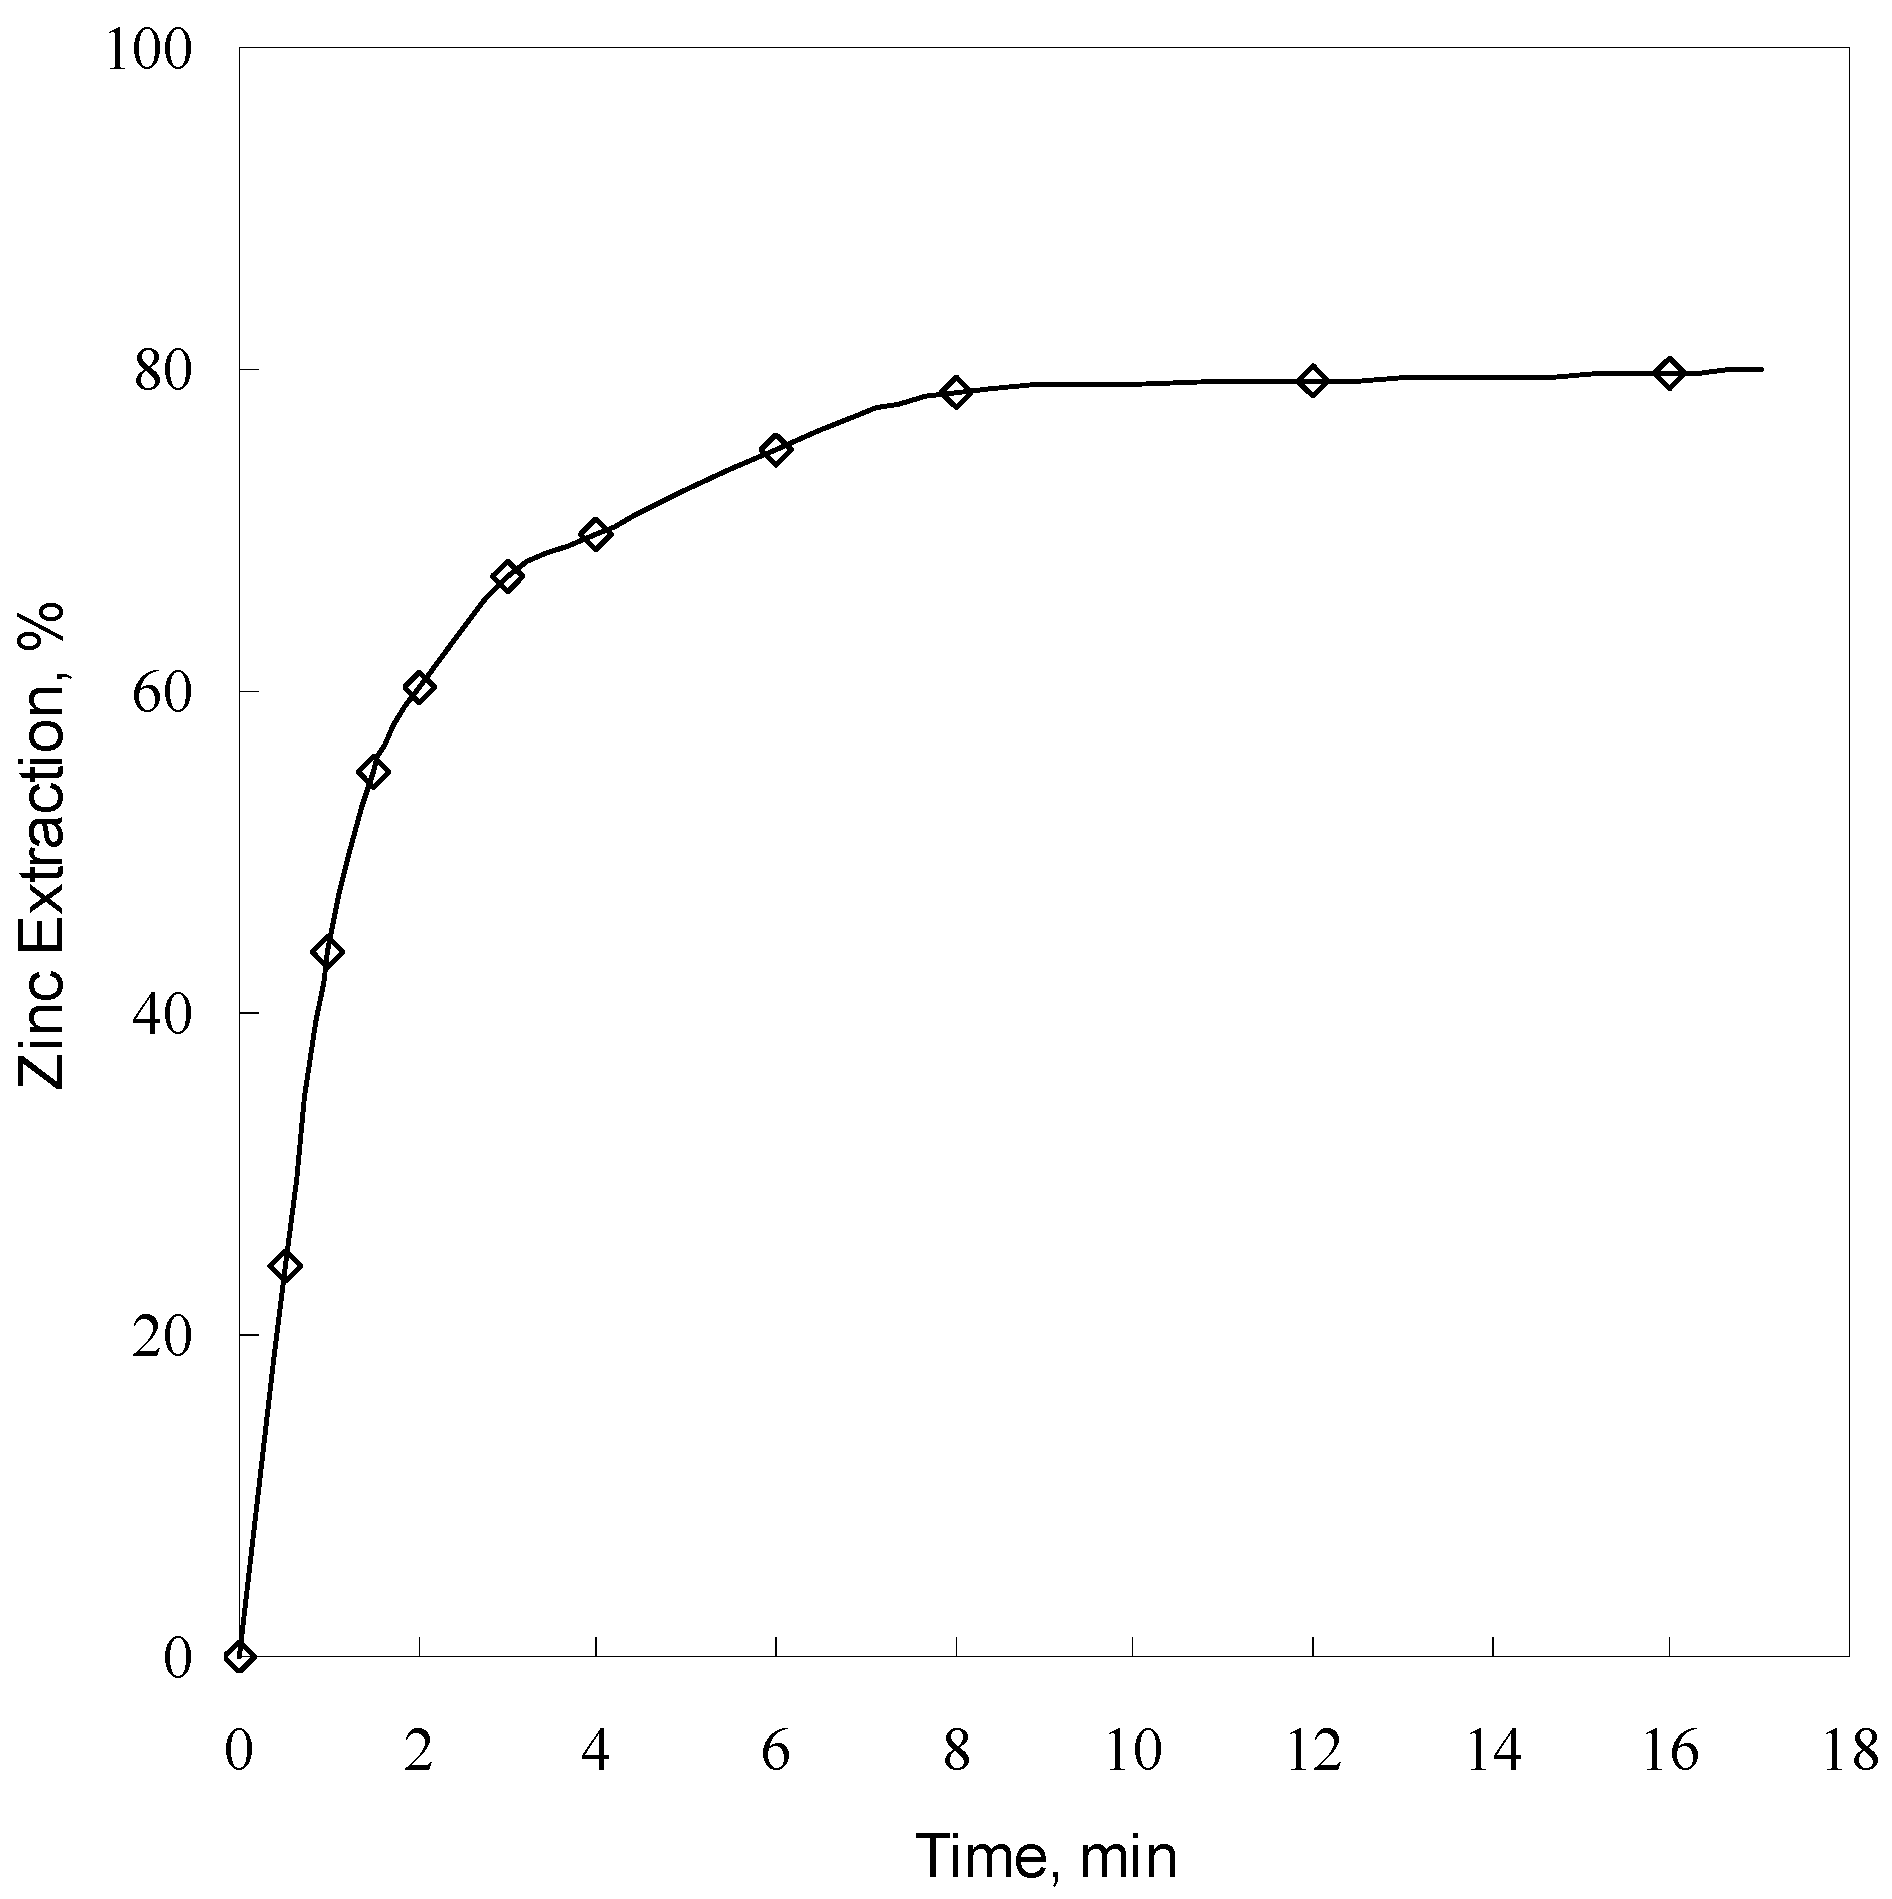
3.1.1. Effect of Leaching Time

The effect of leaching time on the extraction of zinc from synthetic willemite was investigated using −57 + 53 μm particle size at 393 K in an agitated (800 rpm) solution containing 1.0 g/L sulfuric acid. The results are presented in Figure 2. As can be seen, zinc extraction increases with an increase in leaching time. At the beginning of leaching, willemite dissolves very rapidly. The leaching recovery of zinc increases dramatically from 43.85% at 1 min to 75.02% at 6 min and increases slowly to 79.78% with a further increase in leaching time to 16 min.
The leaching behavior of artificial willemite is similar to that obtained from roasted zinc silicate concentrates containing willemite as the major zinc-containing phase and franklinite as a minor constituent by Souza et al. [10]. In their work, the extraction of zinc was also very fast in the first 5 min and then varied very little with time despite the fact that the different experimental conditions were used.
In this study, the fact that reaction kinetics were fast in the first 16 min can be supported by the variation of XRD patterns of the sample before leaching and after leaching of different durations at 393 K, as shown in Figure 3.
Figure 3 shows that for the artificial willemite sample, all the diffraction peaks are indexed to synthetic willemite. As the reaction proceeds, the peaks of willemite become gradually smaller and the peaks of cristobalite get progressively larger. After 16 min, very small peaks for willemite are observed and the main peaks are assigned to cristobalite. Chemical analysis of leaching residue at 16 min showed a content of 9.28% Zn and 79.48% SiO2. Chemical analysis of artificial willemite showed a content of 49.5% Zn and 35.9% SiO2. These findings seem to suggest that high-temperature leaching of willemite in low-sulfuric-acid solution is effective for the selective extraction of zinc over silica. In addition, taking into account the fact that for measuring accurately the leaching rates, a very low acid concentration (1.0 g/L) was used in the present study, it is very likely that the acid concentration was not kept constant throughout the experiment. Additionally, the reaction kinetics slowed down between 8 and 16 min, as shown in Figure 2. This indicates that the first 8 min of leaching are of primary importance for the present kinetic study.

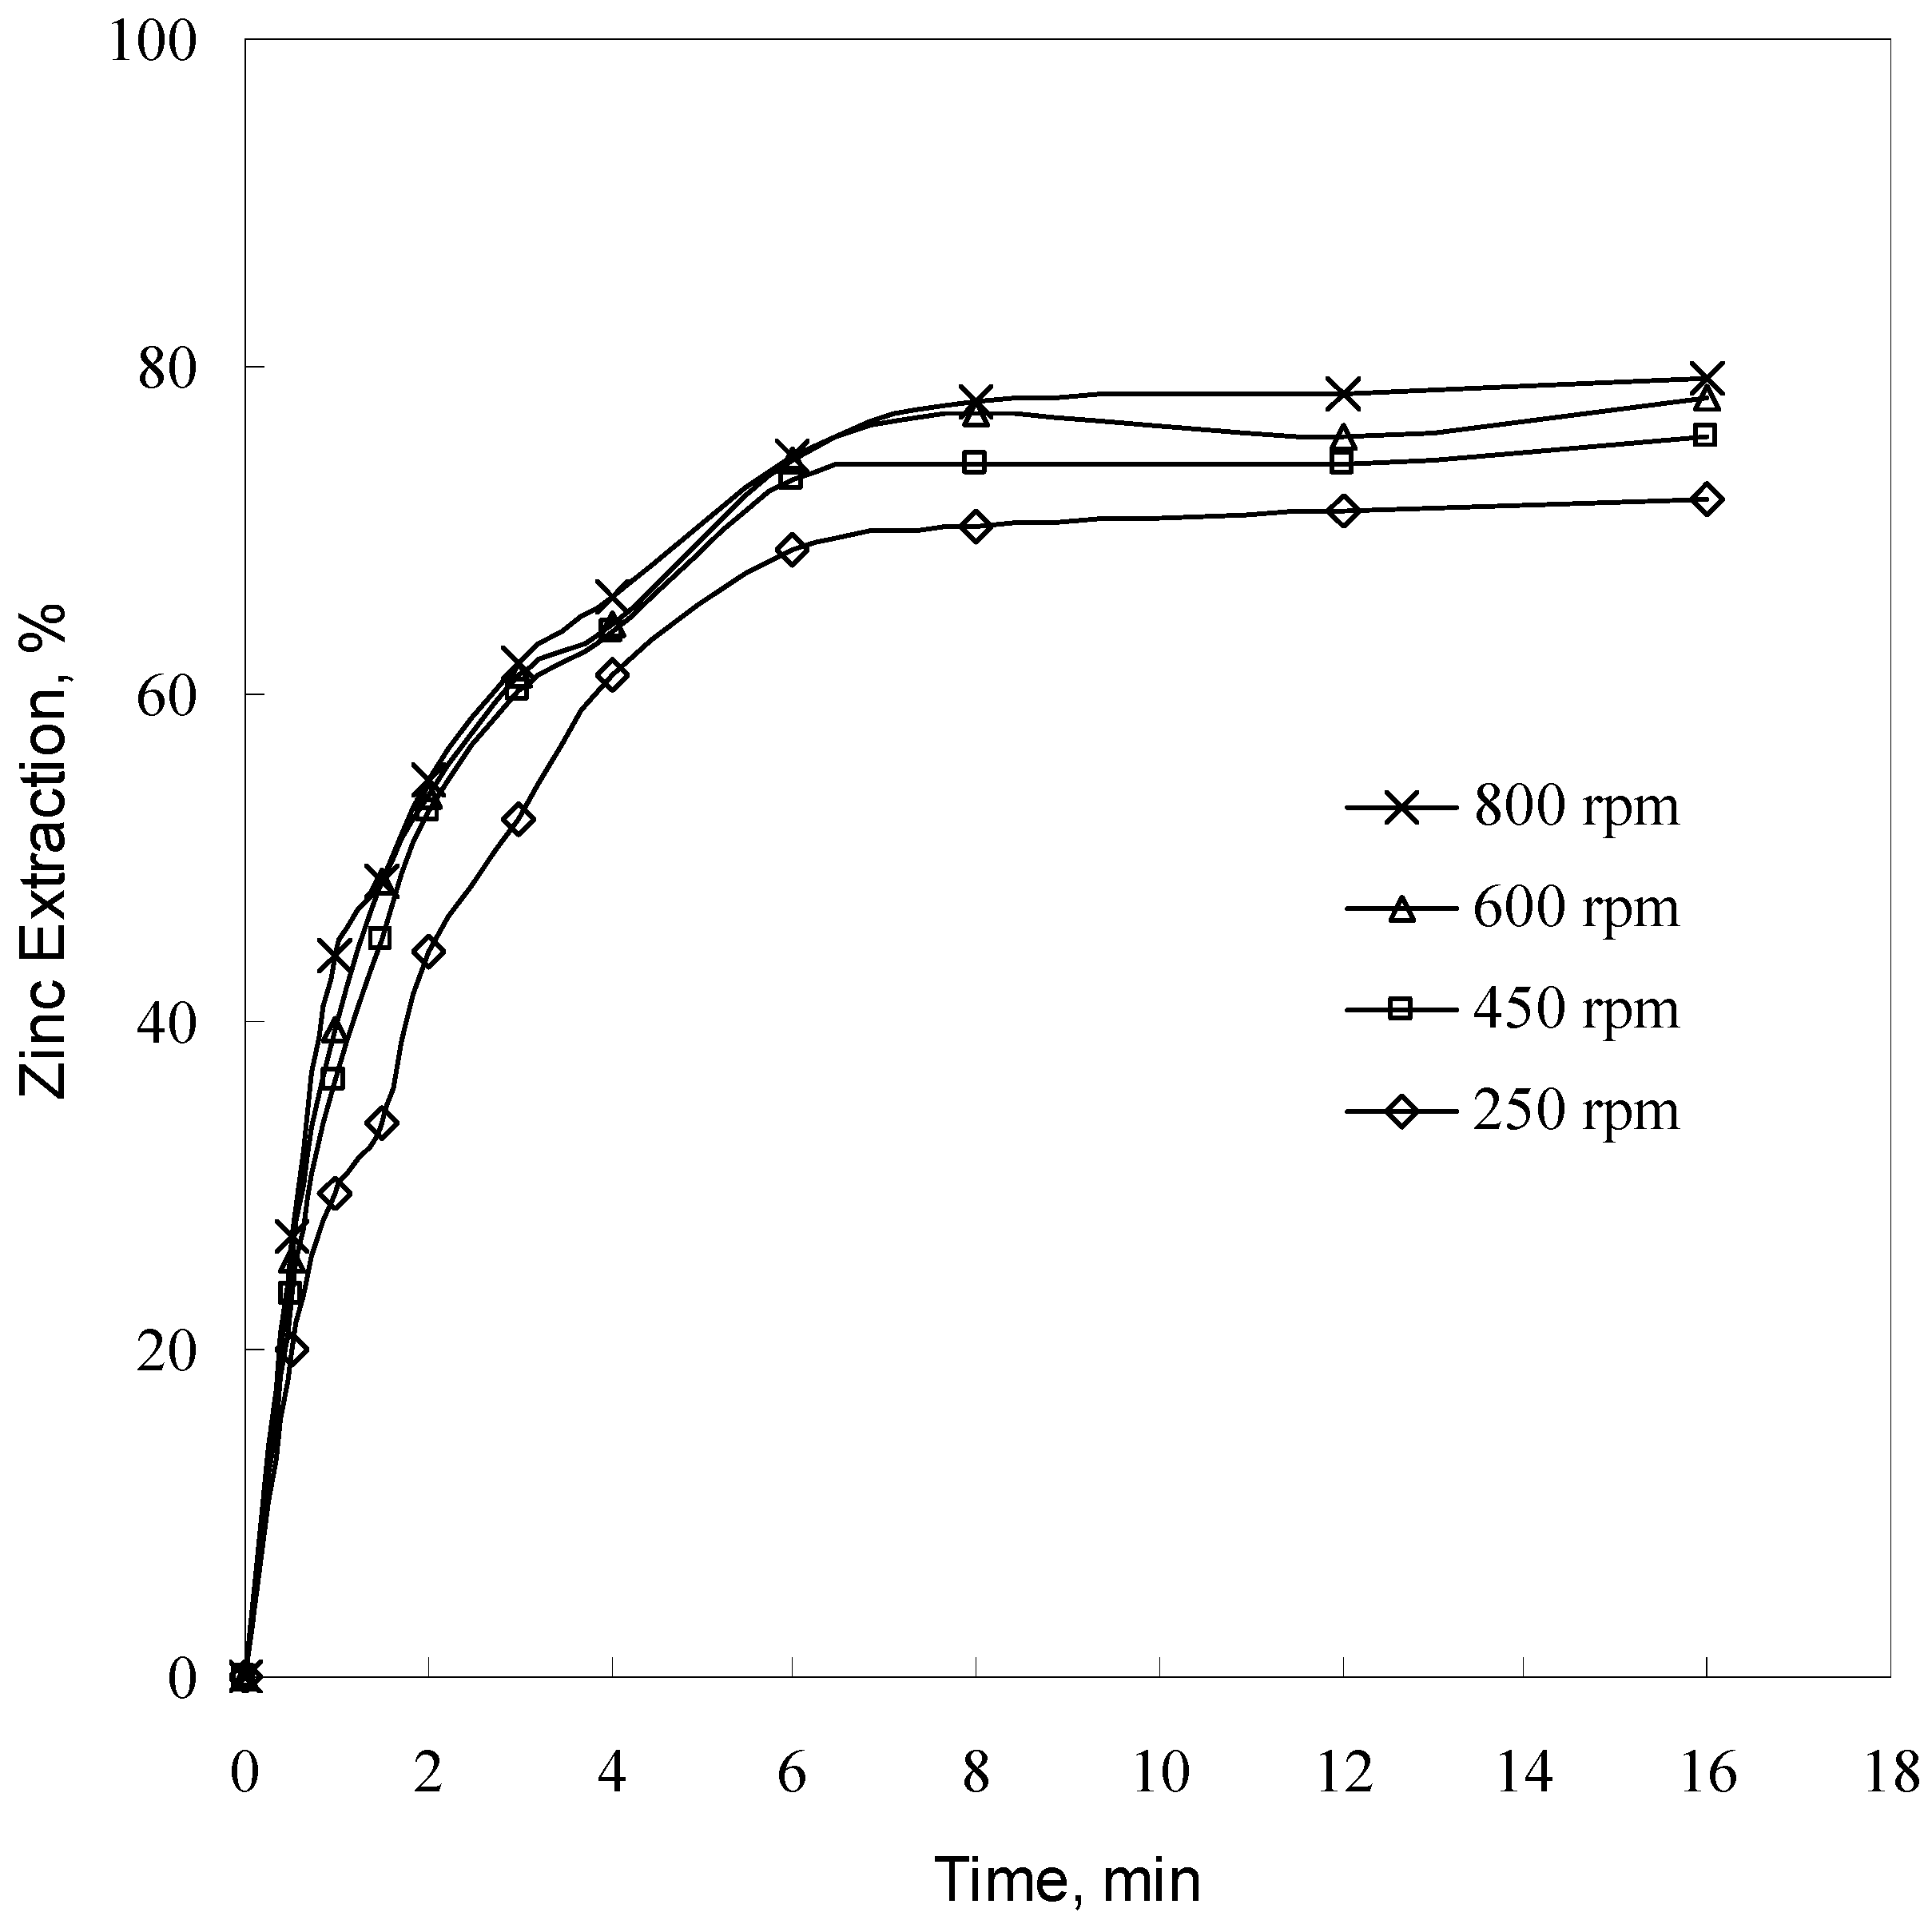
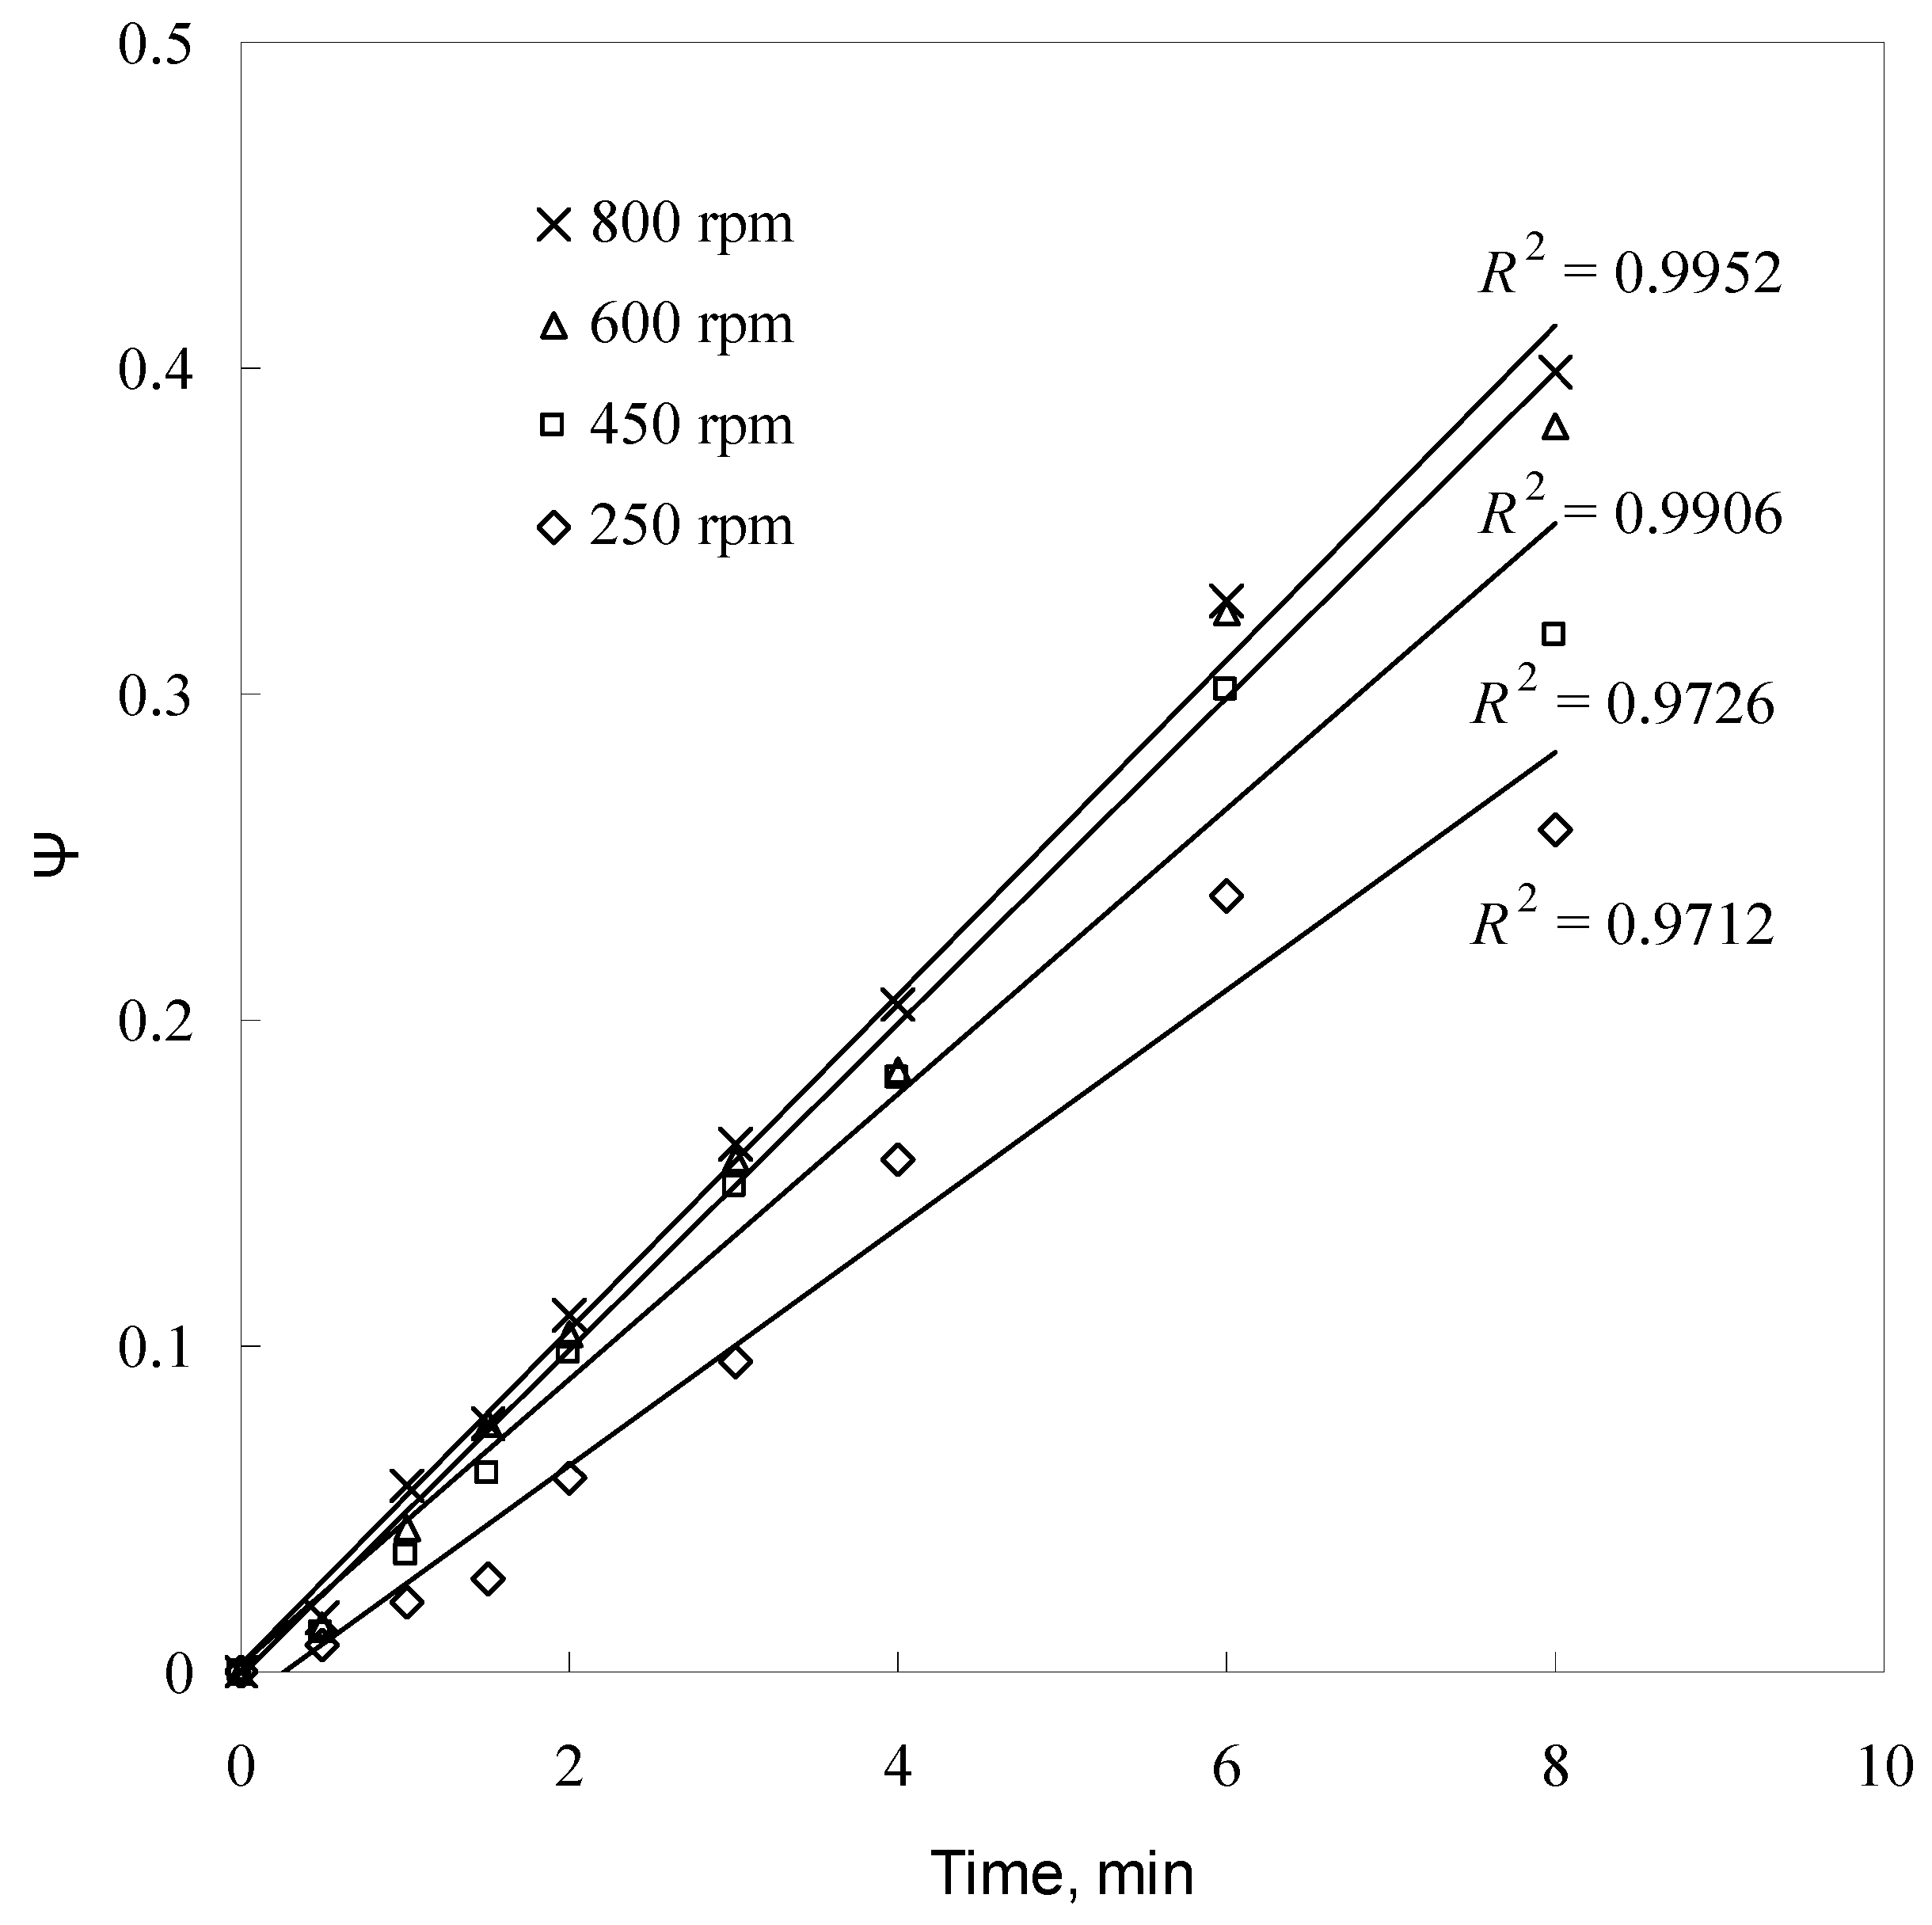
3.1.2. Effect of Agitation Speed

Agitation speed plays an important role in the leaching process by enhancing the mass transfer through the liquid boundary layer around particles. Therefore, the effect of agitation speed applied in the range of 250–800 rpm on the extraction of zinc was investigated using −57 + 53 μm sample at 393 K and 1 g/L sulfuric acid concentration. The results are given in Figure 4. It can be observed that below 450 rpm, the leaching rate increases gradually with increasing agitation speed and that agitation speed in the range of 450–800 rpm has a little effect on the leaching rate, which can suggest that the mass transfer through the liquid boundary layer around particles did not seem to influence the leaching rate. Thus, a preferable agitation speed for investigating the effects of other parameters was 800 rpm.

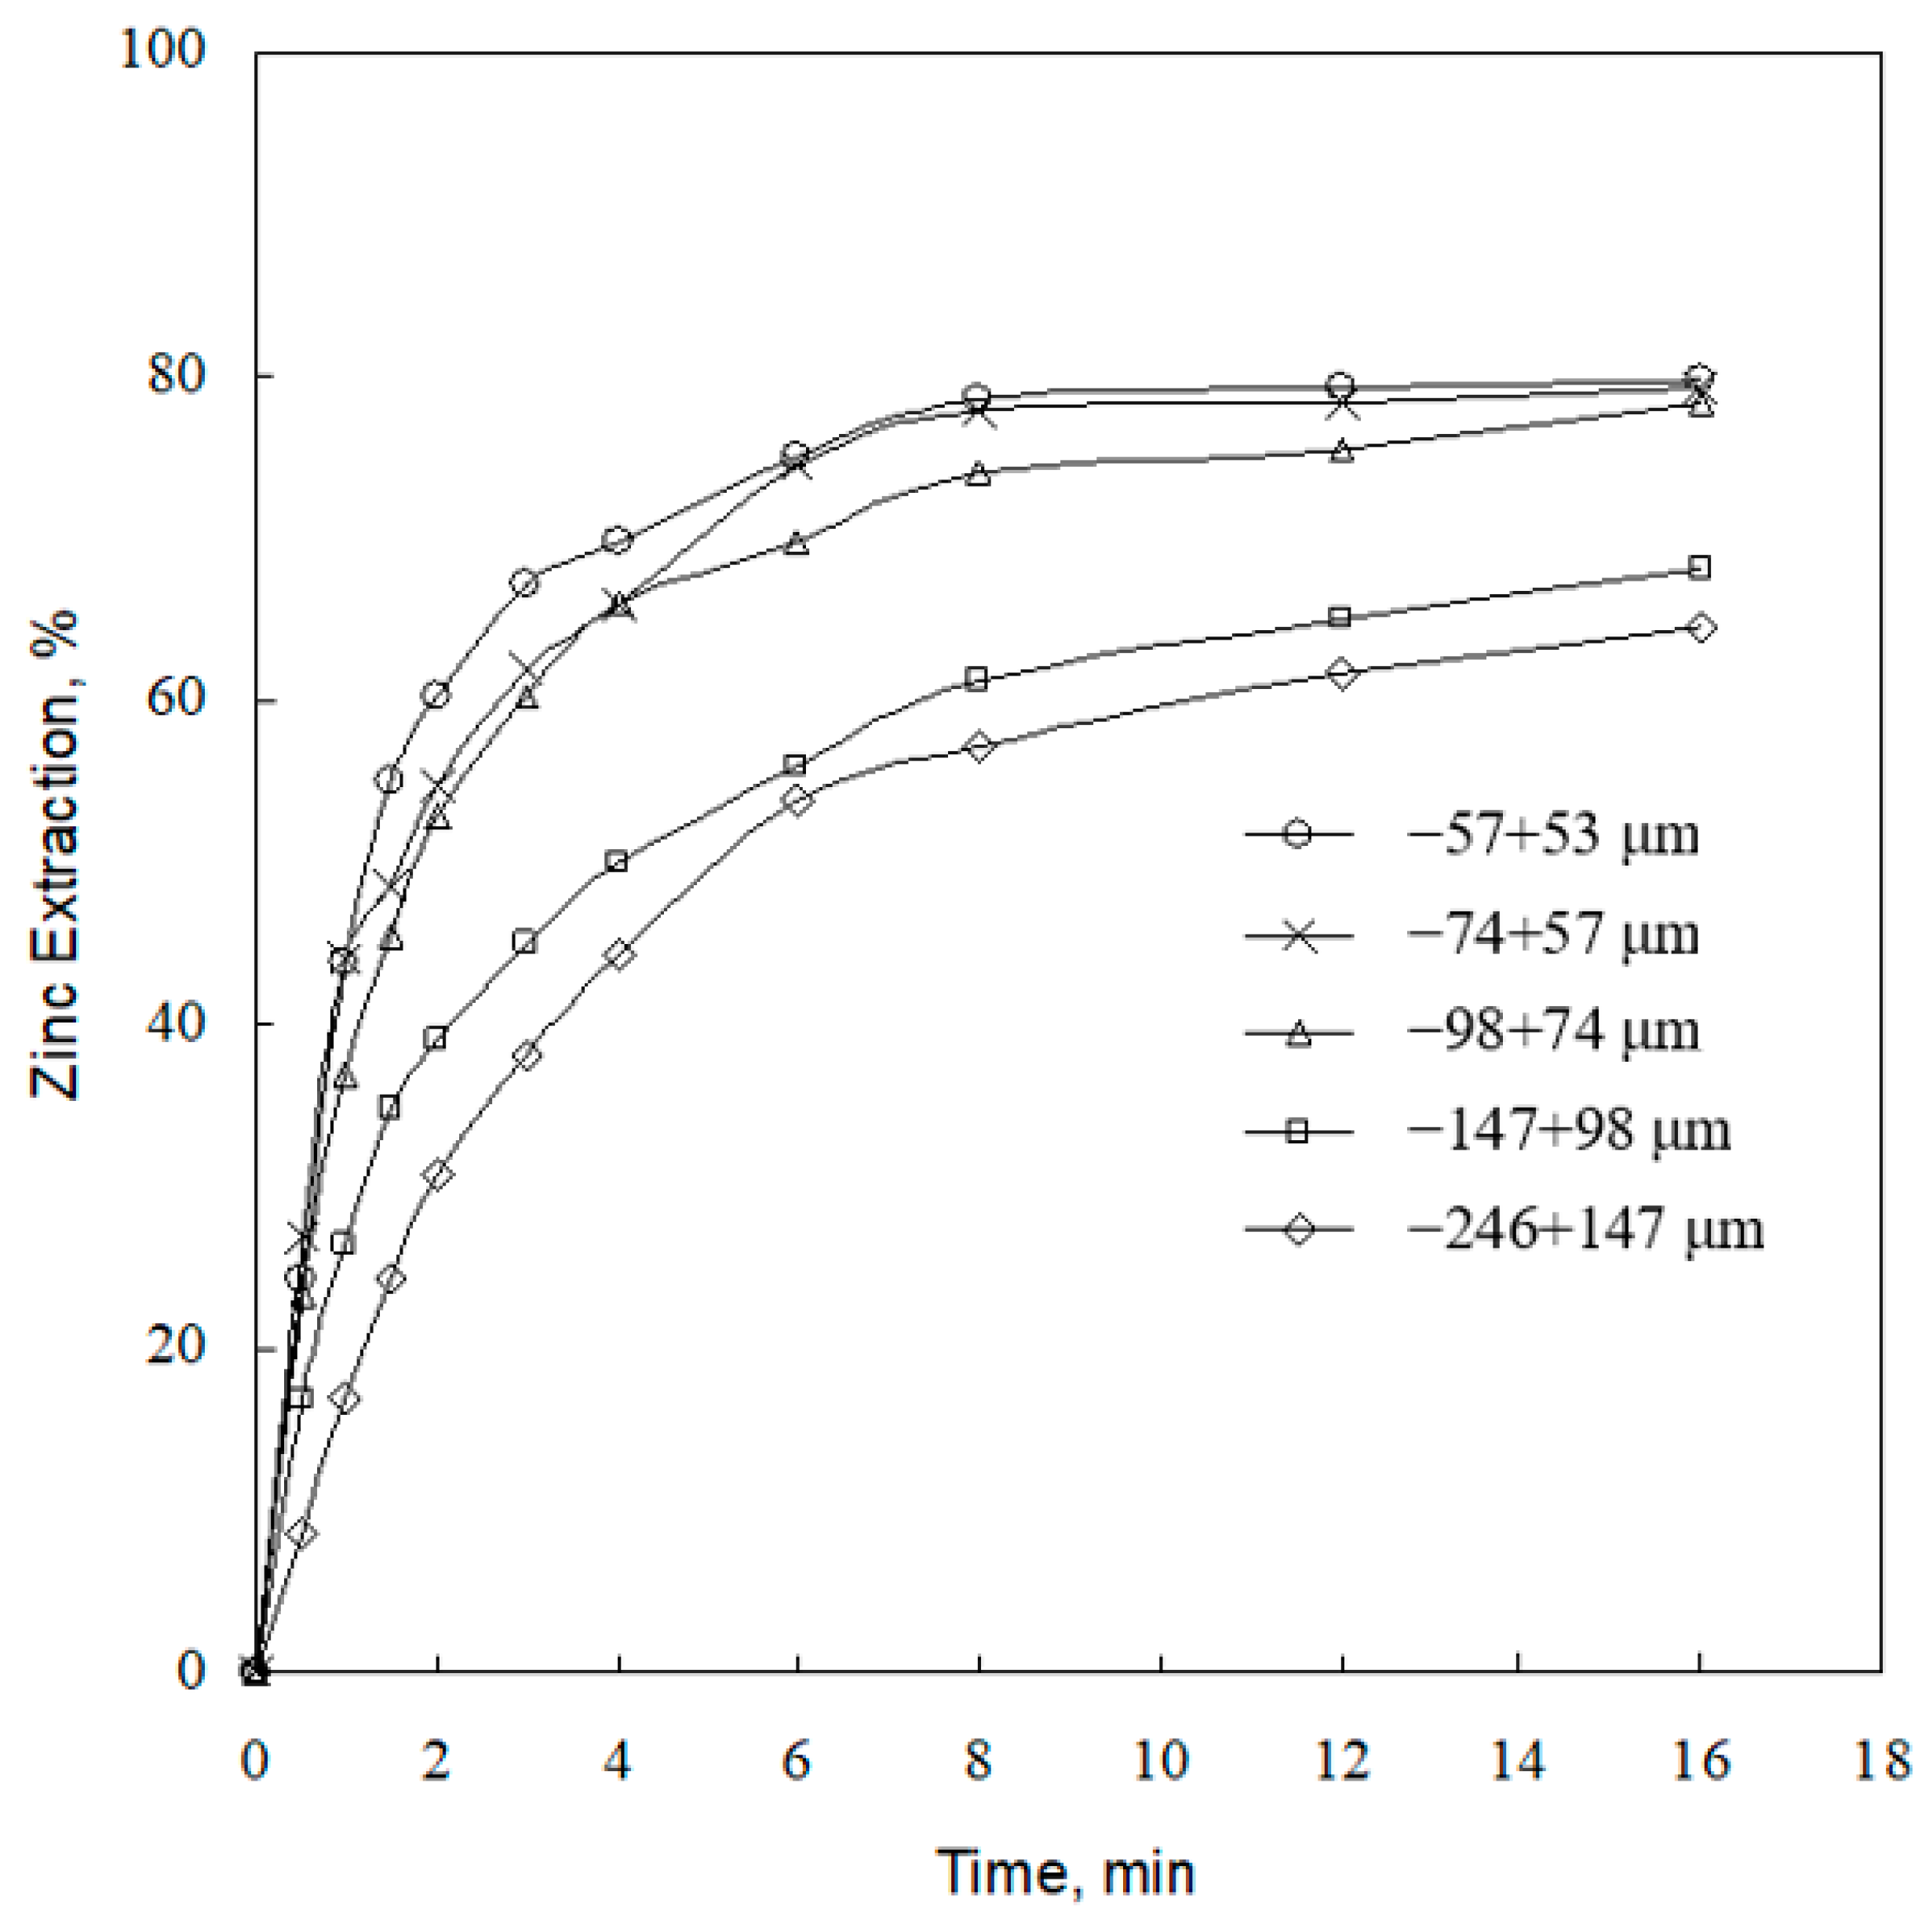
3.1.3. Effect of Particle Size

The effect of particle size on zinc extraction was investigated using five different particle sizes in 1.0 g/L sulfuric acid concentration at 393 K. The results indicate that after 8 min leaching time, 78.5% of zinc is extracted for the fine particle size (−57 + 53 μm). However, for the coarse particle size (−246 + 147 μm), 57.1% of zinc is extracted (Figure 5). It is observed that the decrease in particle size can enhance the leaching rate. This can be attributed to the fact that as the particle size decreases the surface area of particles increases (Table 1), which increases the contact area of particles with lixiviant. The trend that the smaller the particle size, the faster the reaction rate was also reported by Souza et al. [10] and Abdel-Aal [2].

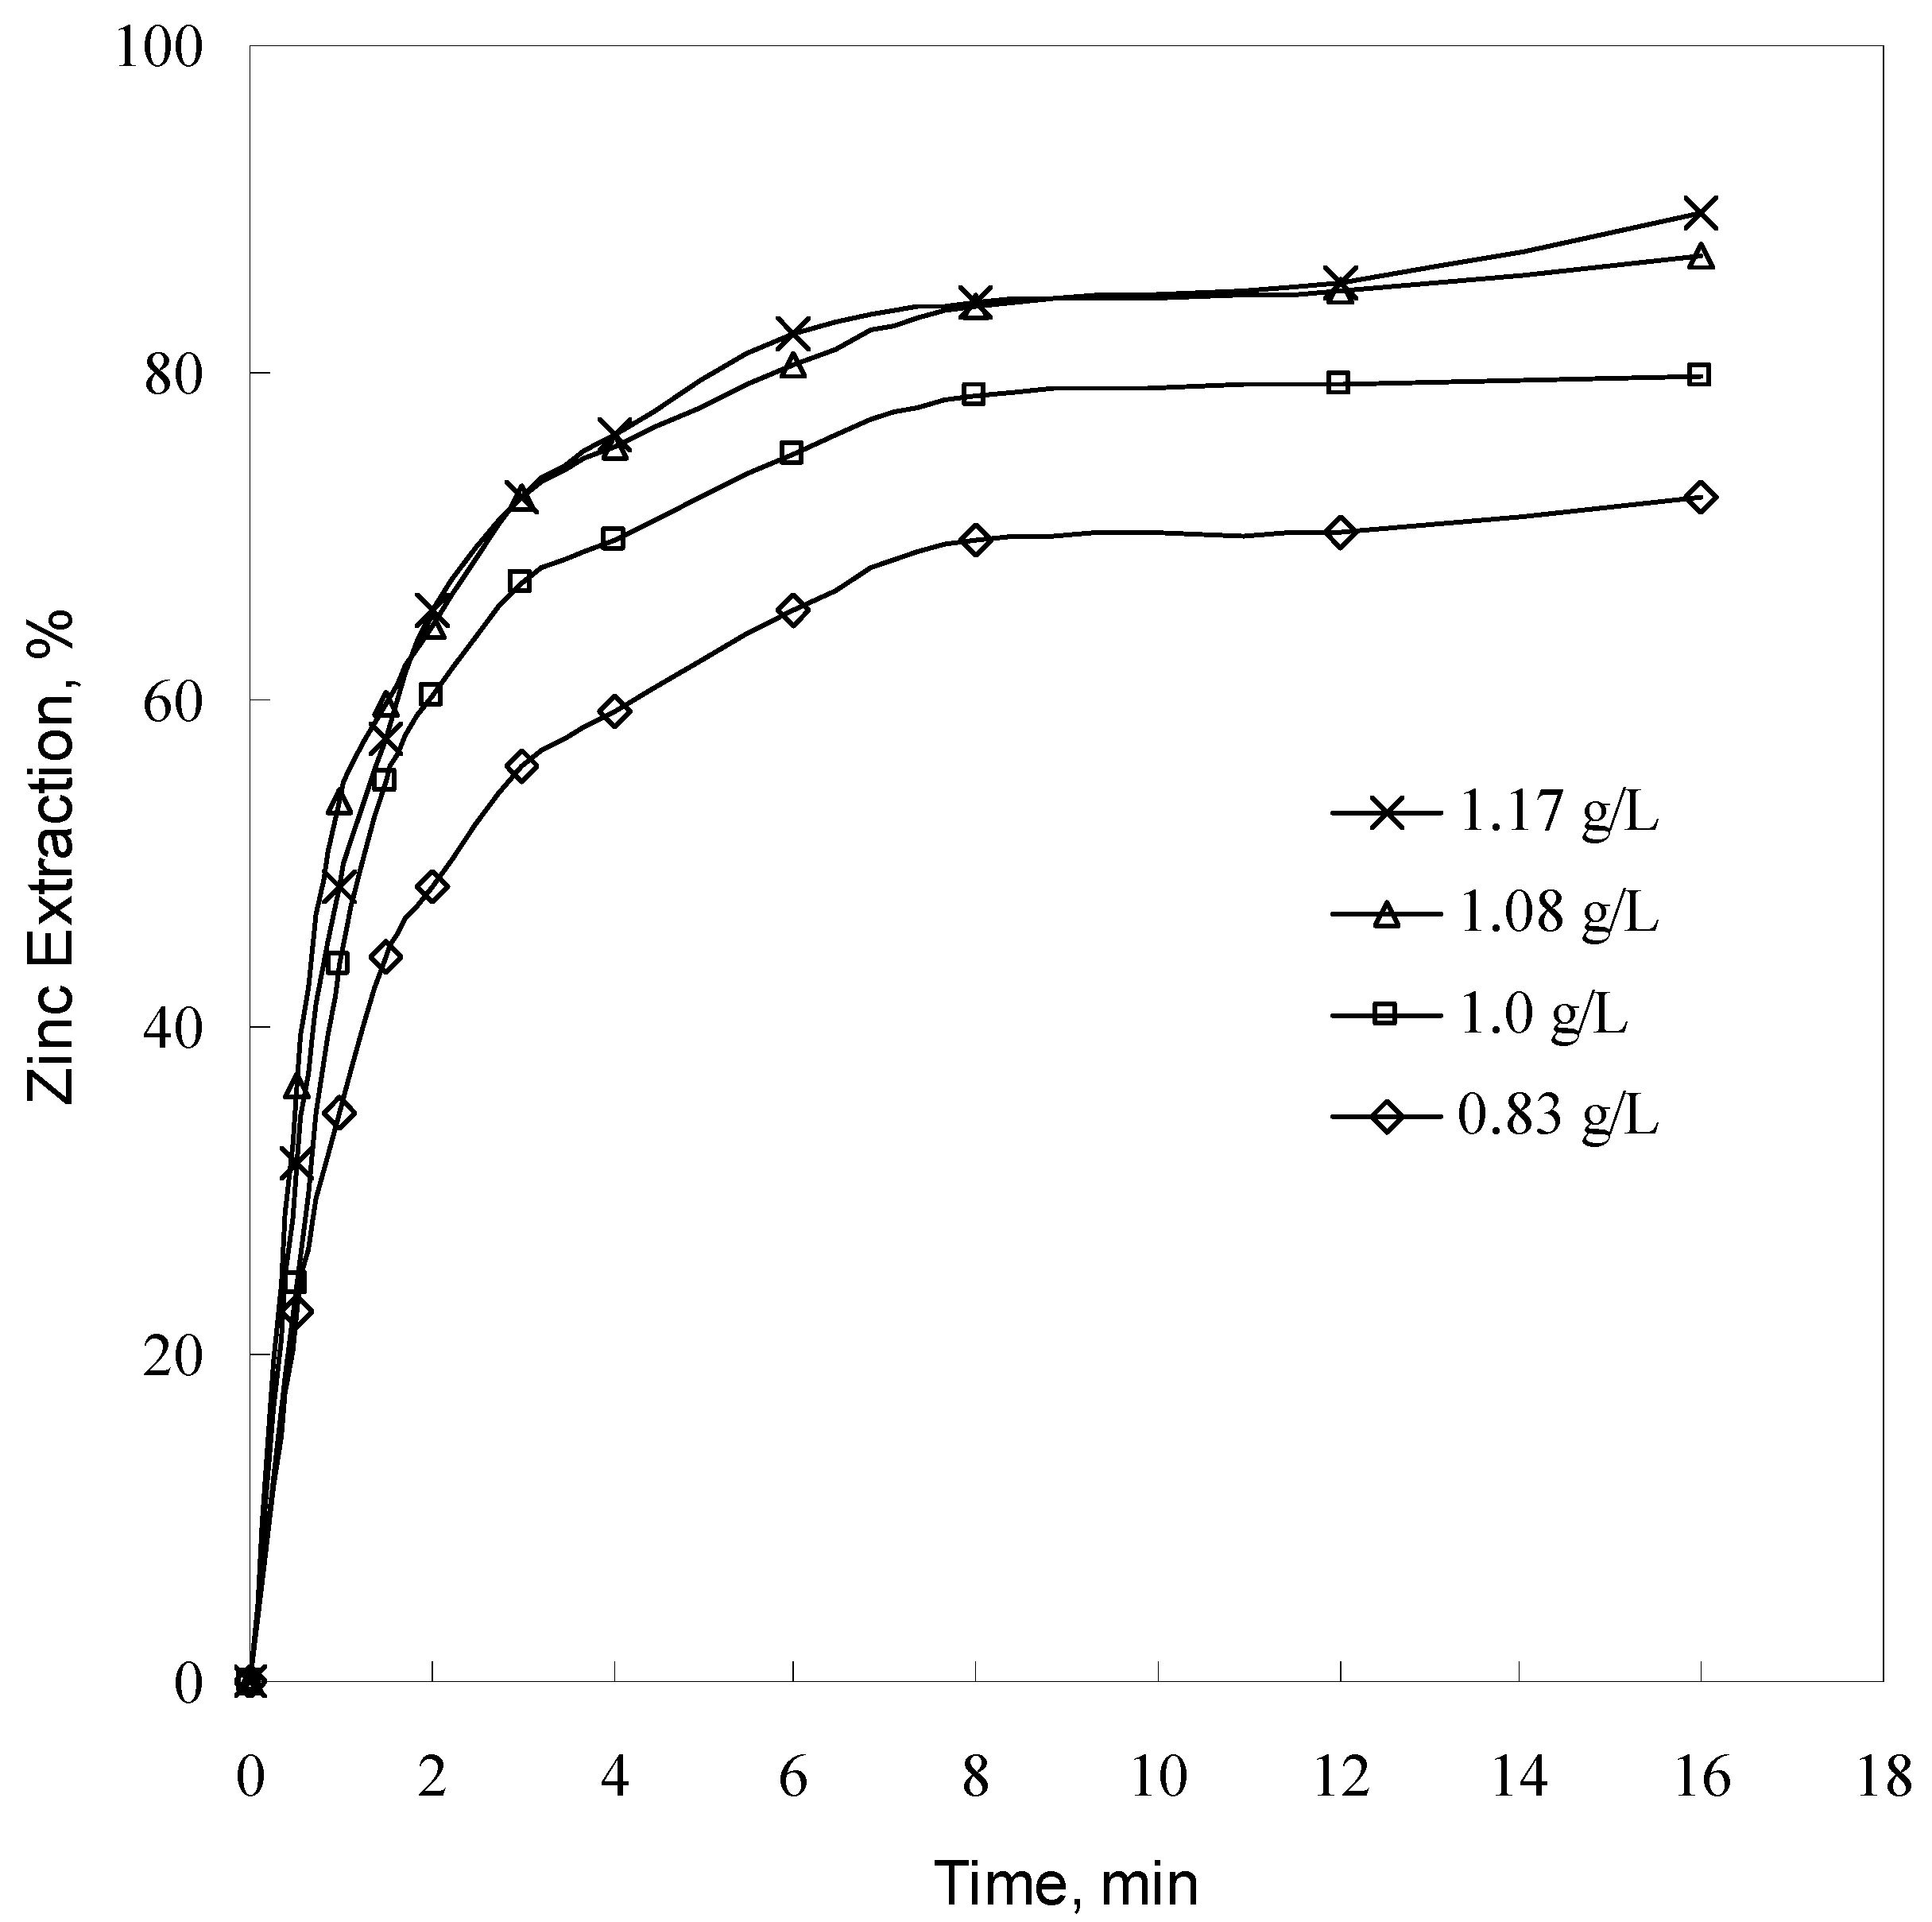
3.1.4. Effect of Sulfuric Acid Concentration

The effect of sulfuric acid concentration (varying concentration in the 0.83–1.17 g/L range) on the leaching rate was studied using a particle size of −57 + 53 μm at 393 K. The results are plotted in Figure 6.
Figure 6 shows that as acid concentration increases from 0.83 to 1.08 g/L, zinc extraction increases from 69.7 to 84.4% at 8 min. Further increasing the acid concentration has no significant effect on the leaching rate. The trend obtained in the present study is similar to that reported by Terry and Monhemius [17] in low-sulfuric-acid solution. In their work, the decrease in pH can clearly increase the leaching rate despite the fact that different temperatures were used.

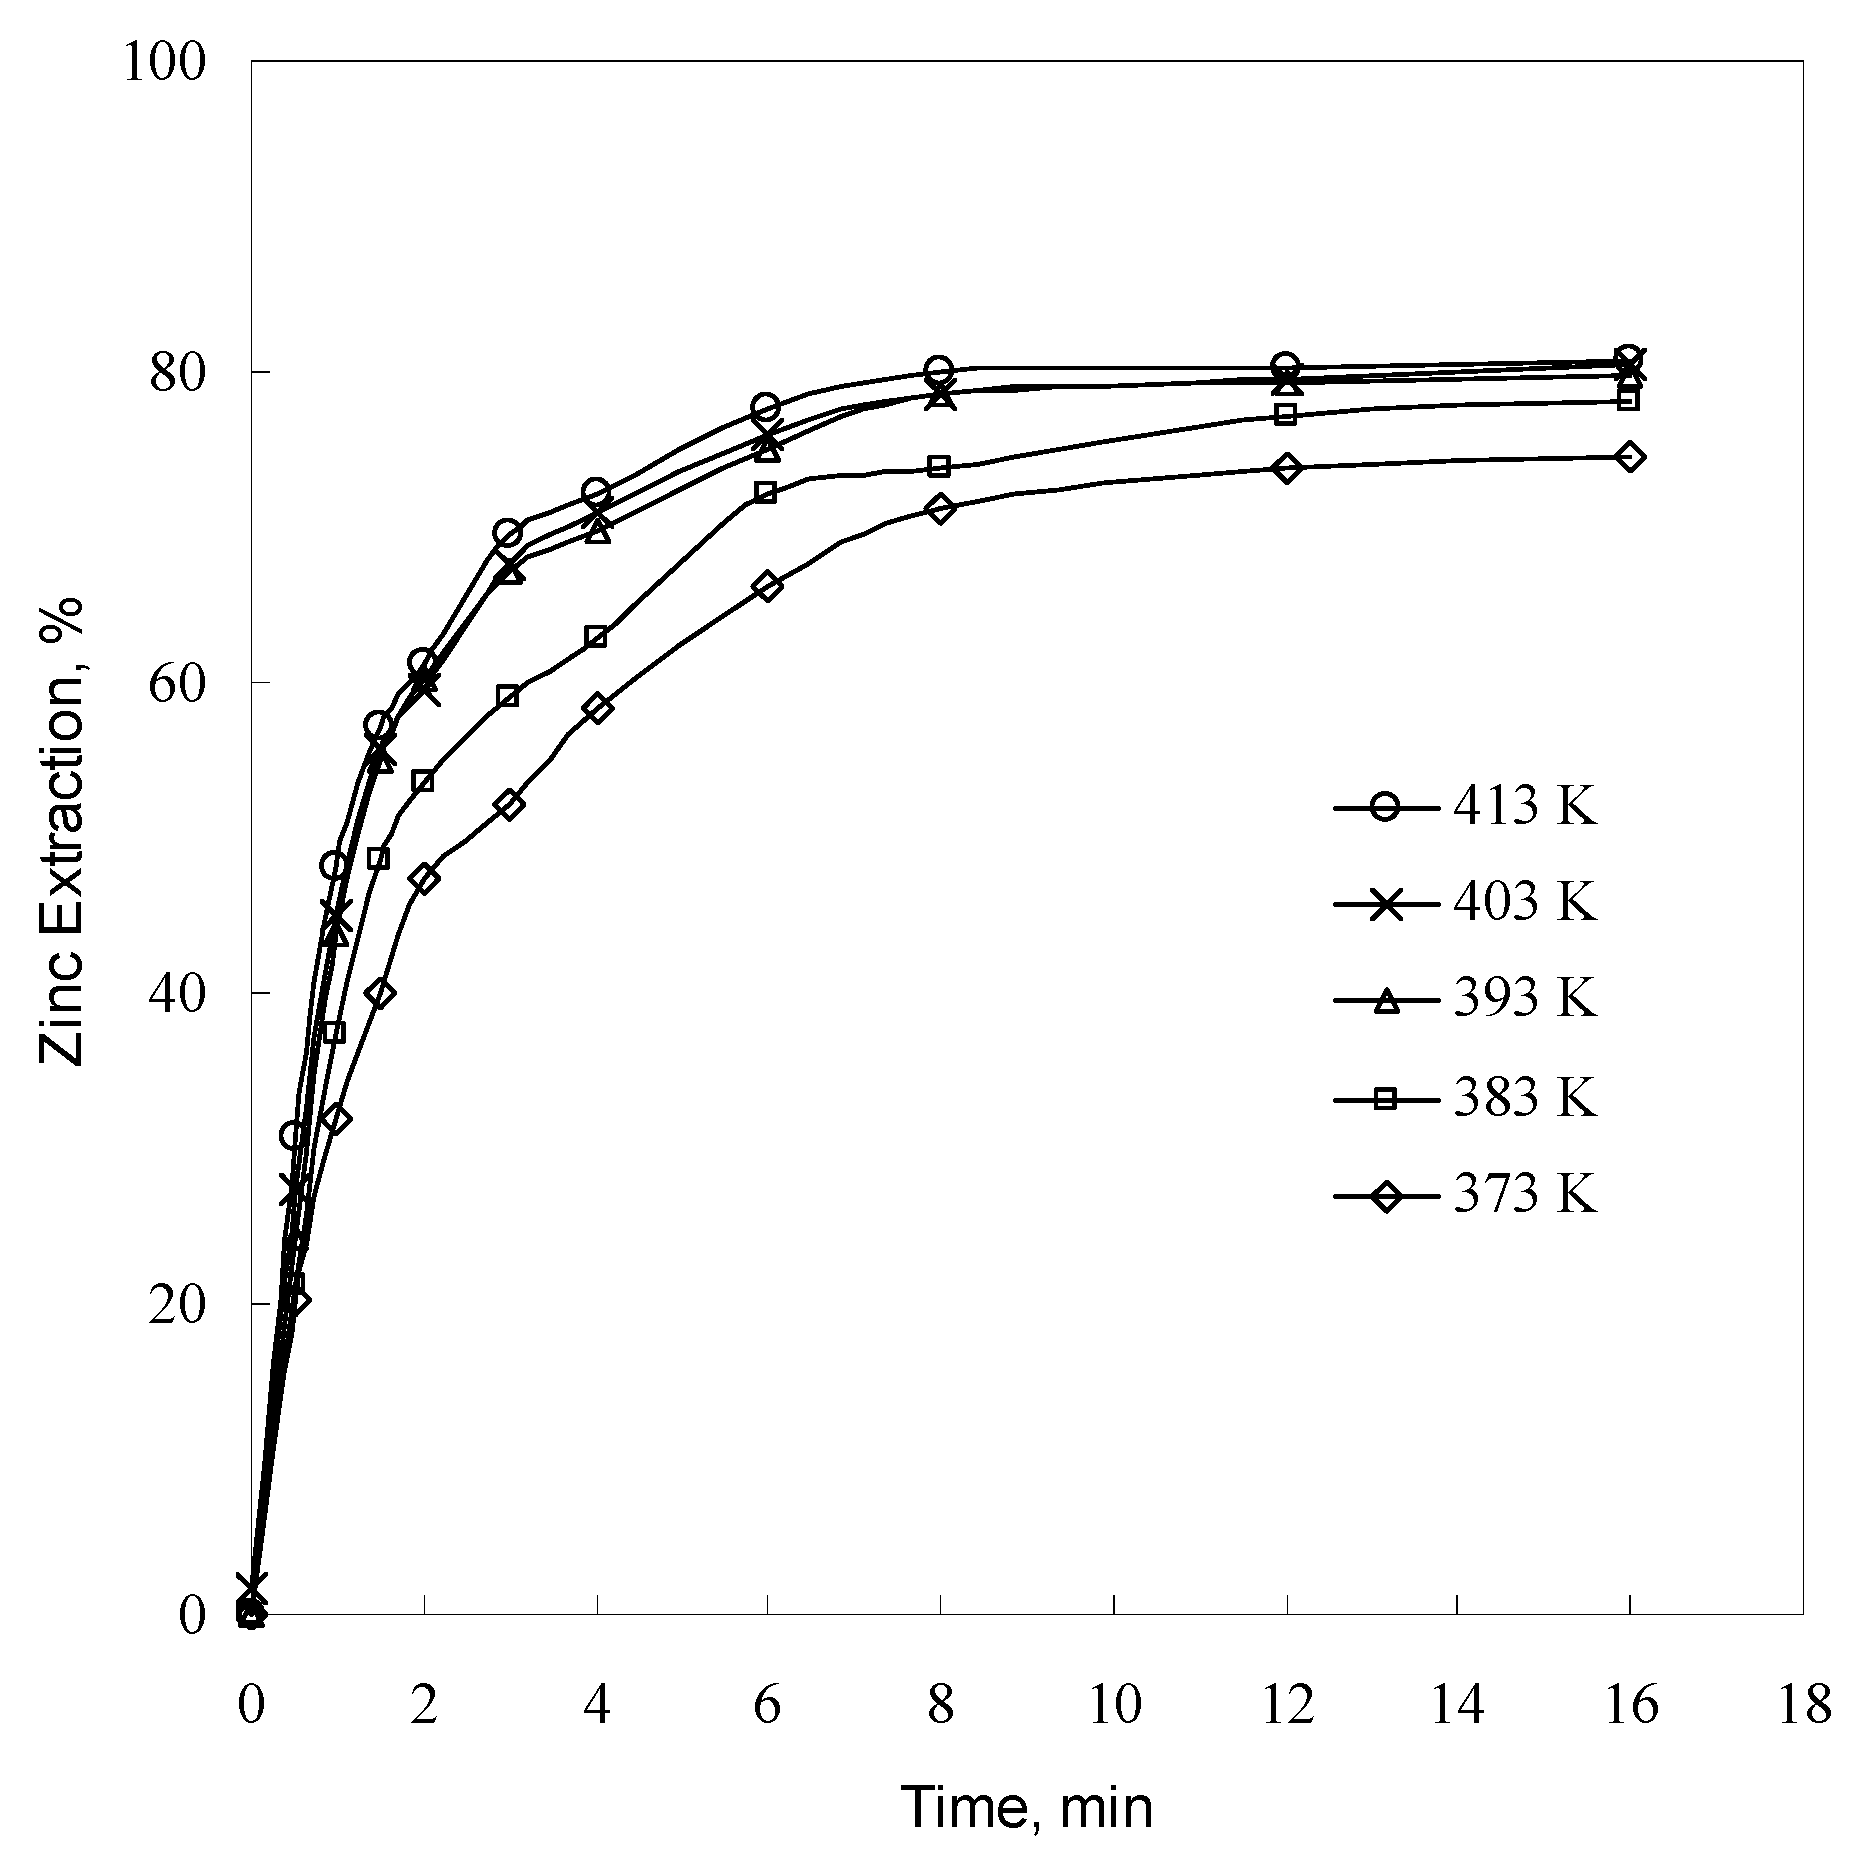
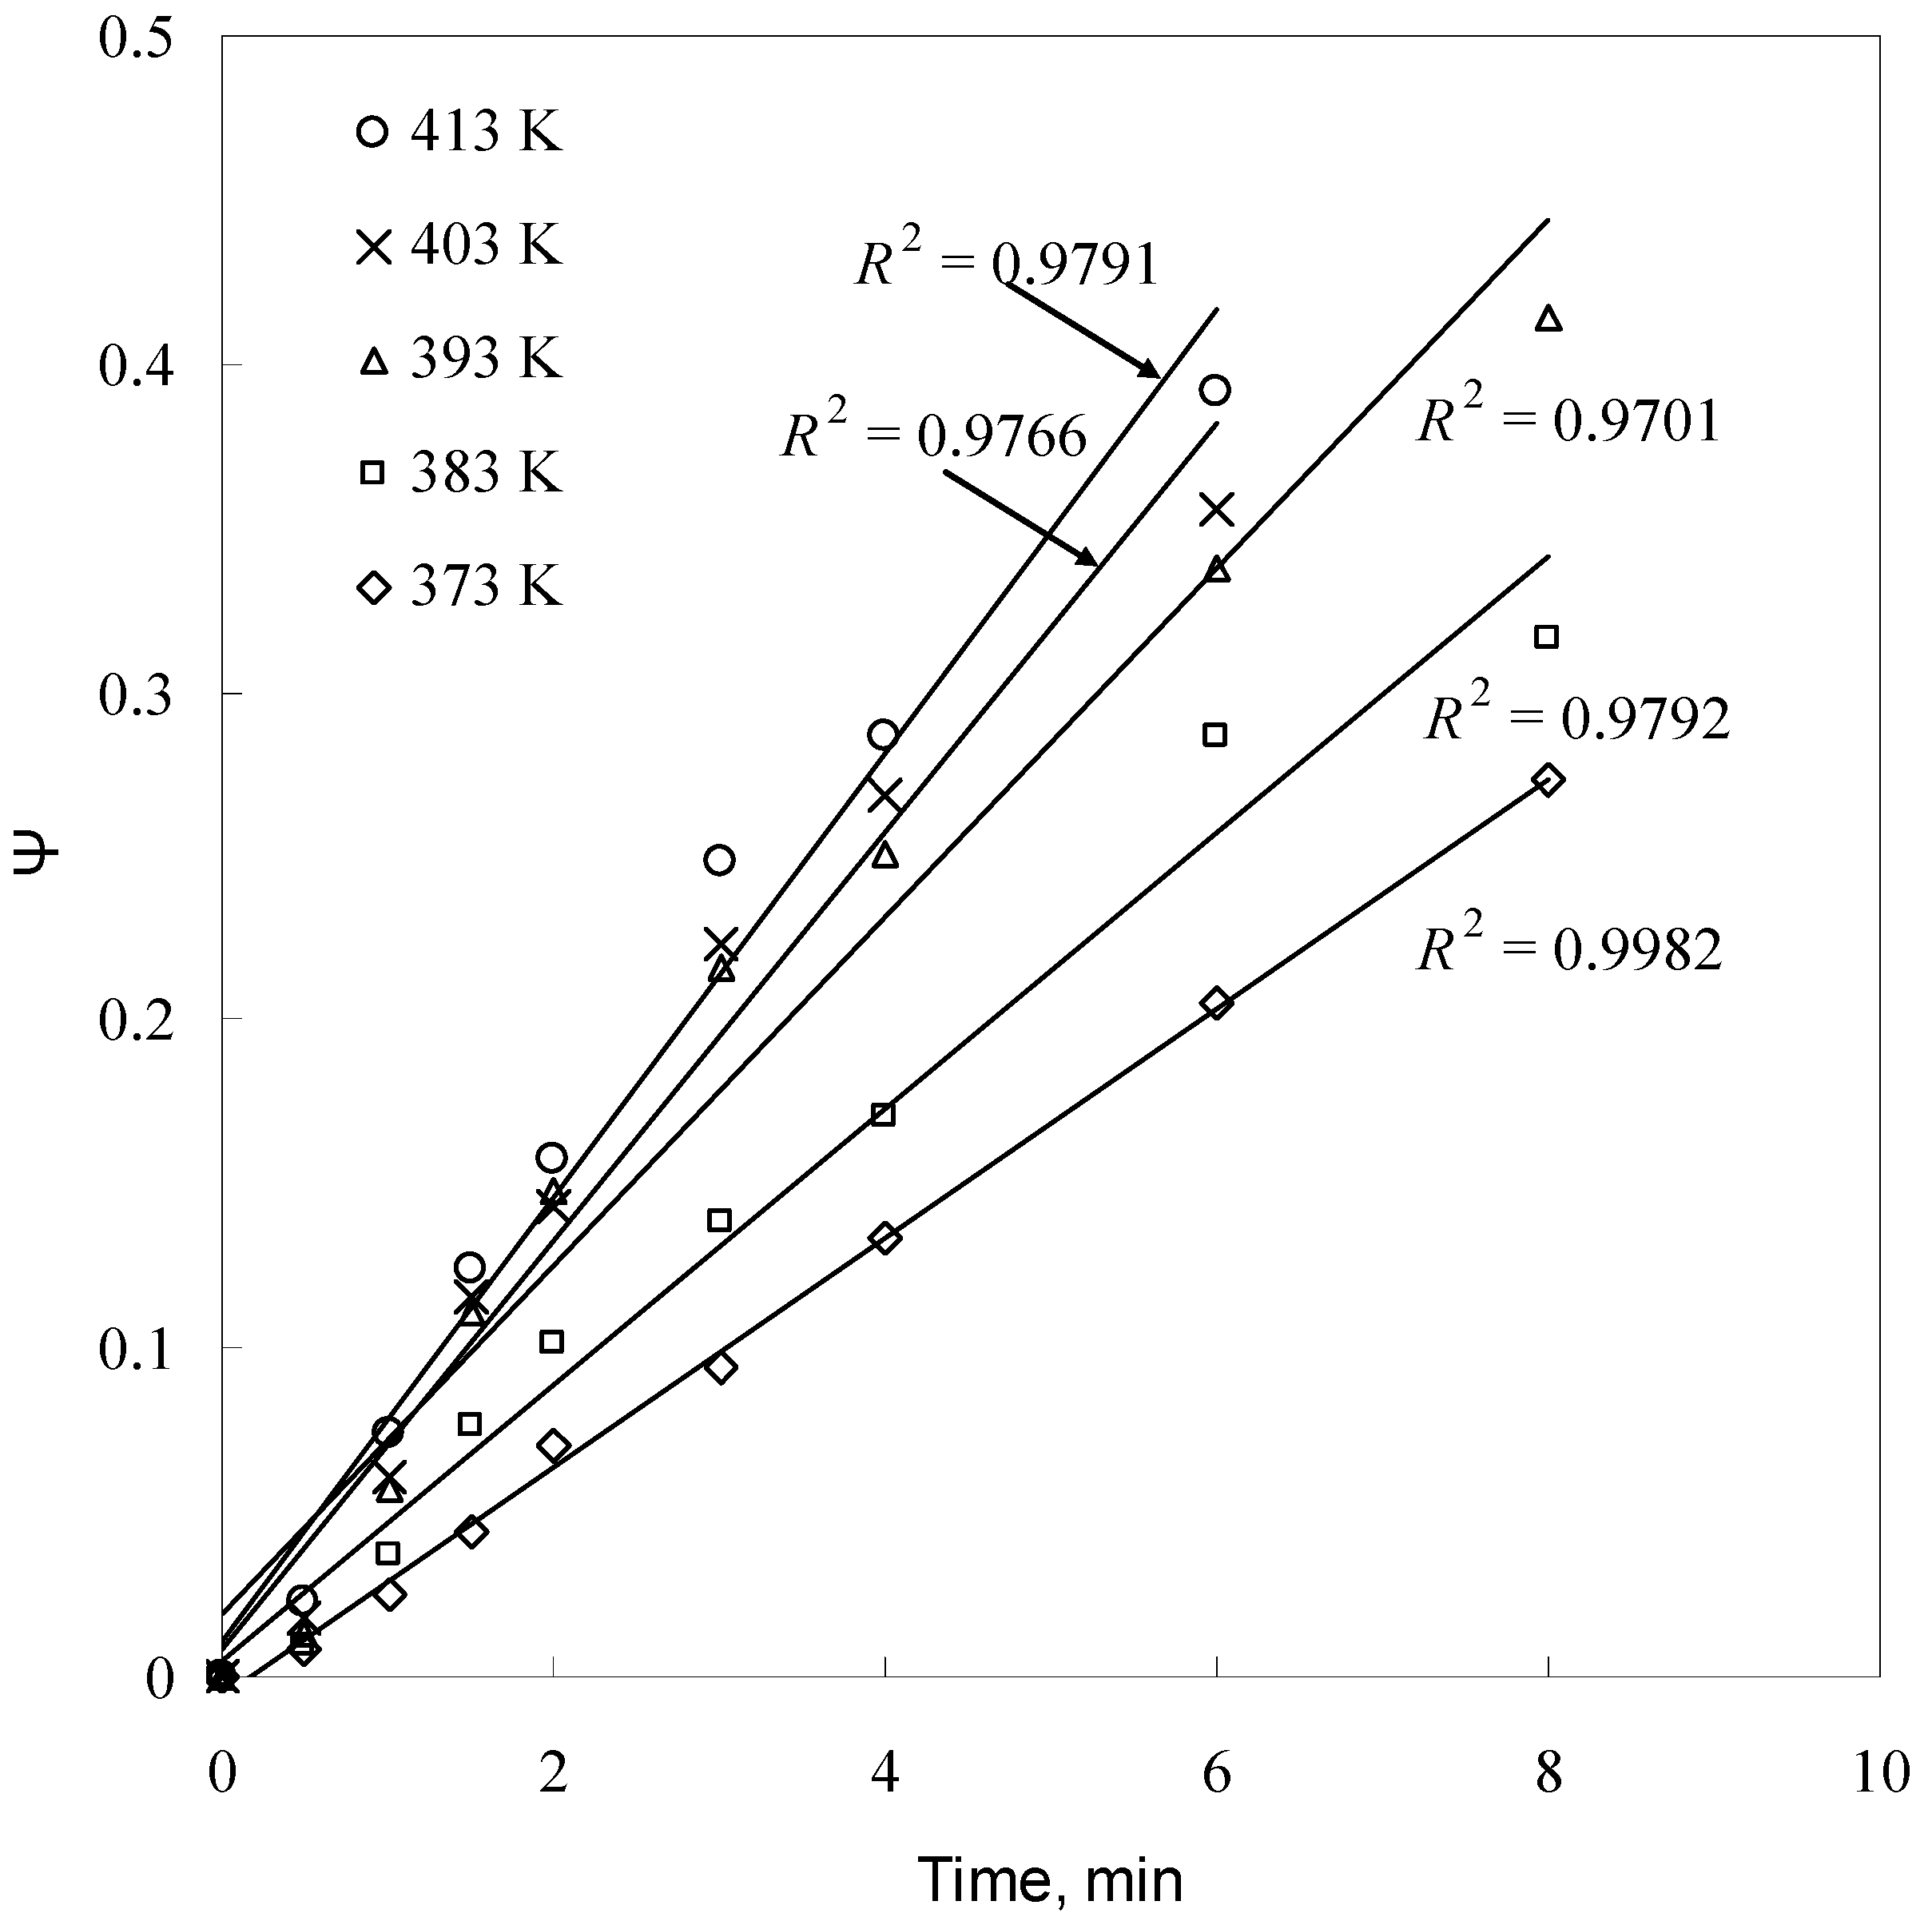
3.1.5. Effect of Temperature

To investigate the effect of temperature on the leaching rate, leaching experiments on −57 + 53 μm sample were carried out at 373–413 K and 1.0 g/L sulfuric acid concentration. The data obtained are shown in Figure 7. As seen in Figure 7, zinc extraction increases with leaching time and temperature. Similar results were reported by Souza et al. [10], who conducted leaching experiments at temperatures ranging from 303 to 333 K using high-sulfuric-acid solution and roasted zinc silicate concentrates containing willemite as the major zinc-containing phase and franklinite as a minor constituent. Evidently, the fact that the reaction rate increases as temperature increases obeys the Arrhenius equation despite the fact that different temperatures were used in both studies.

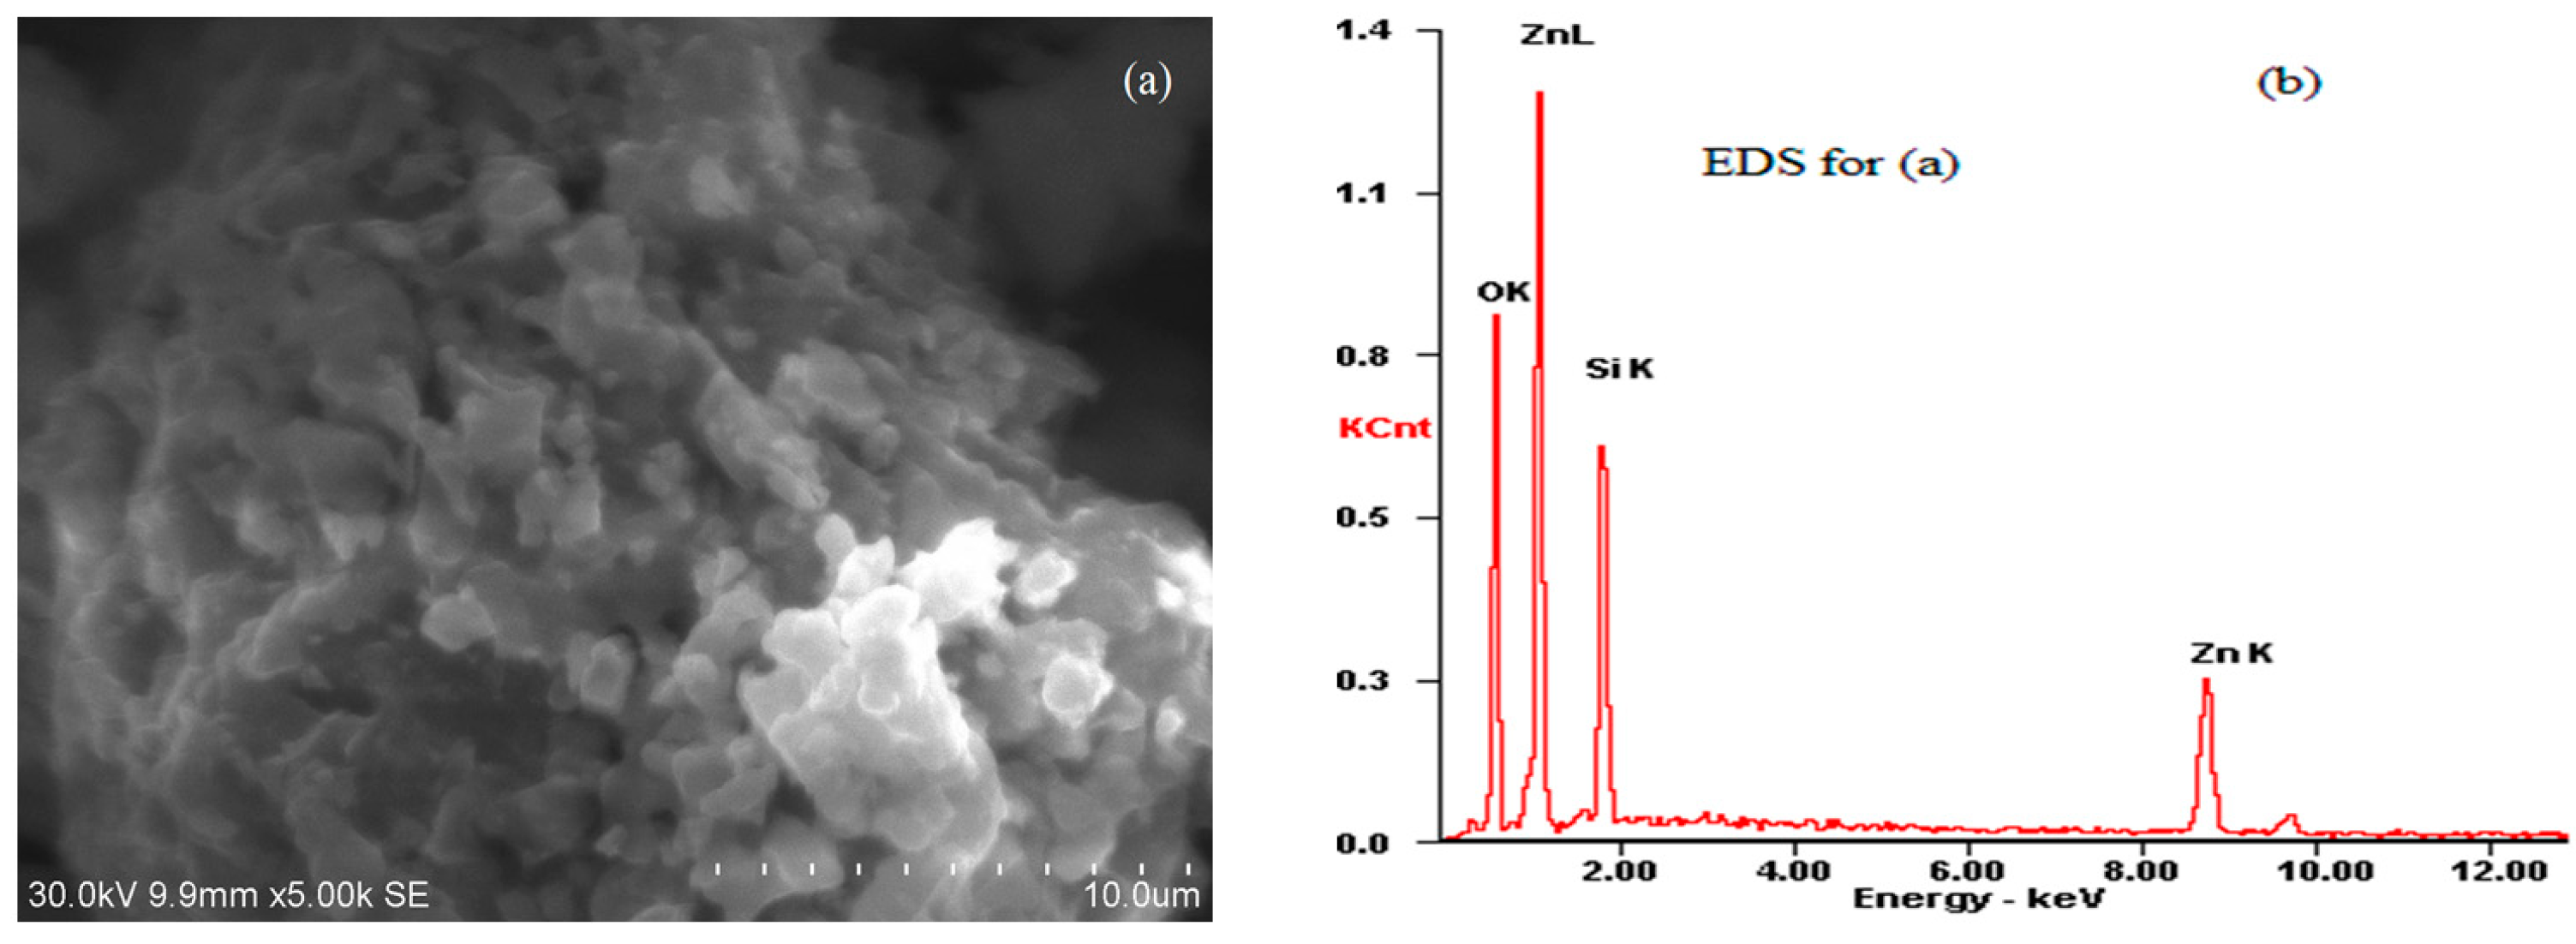
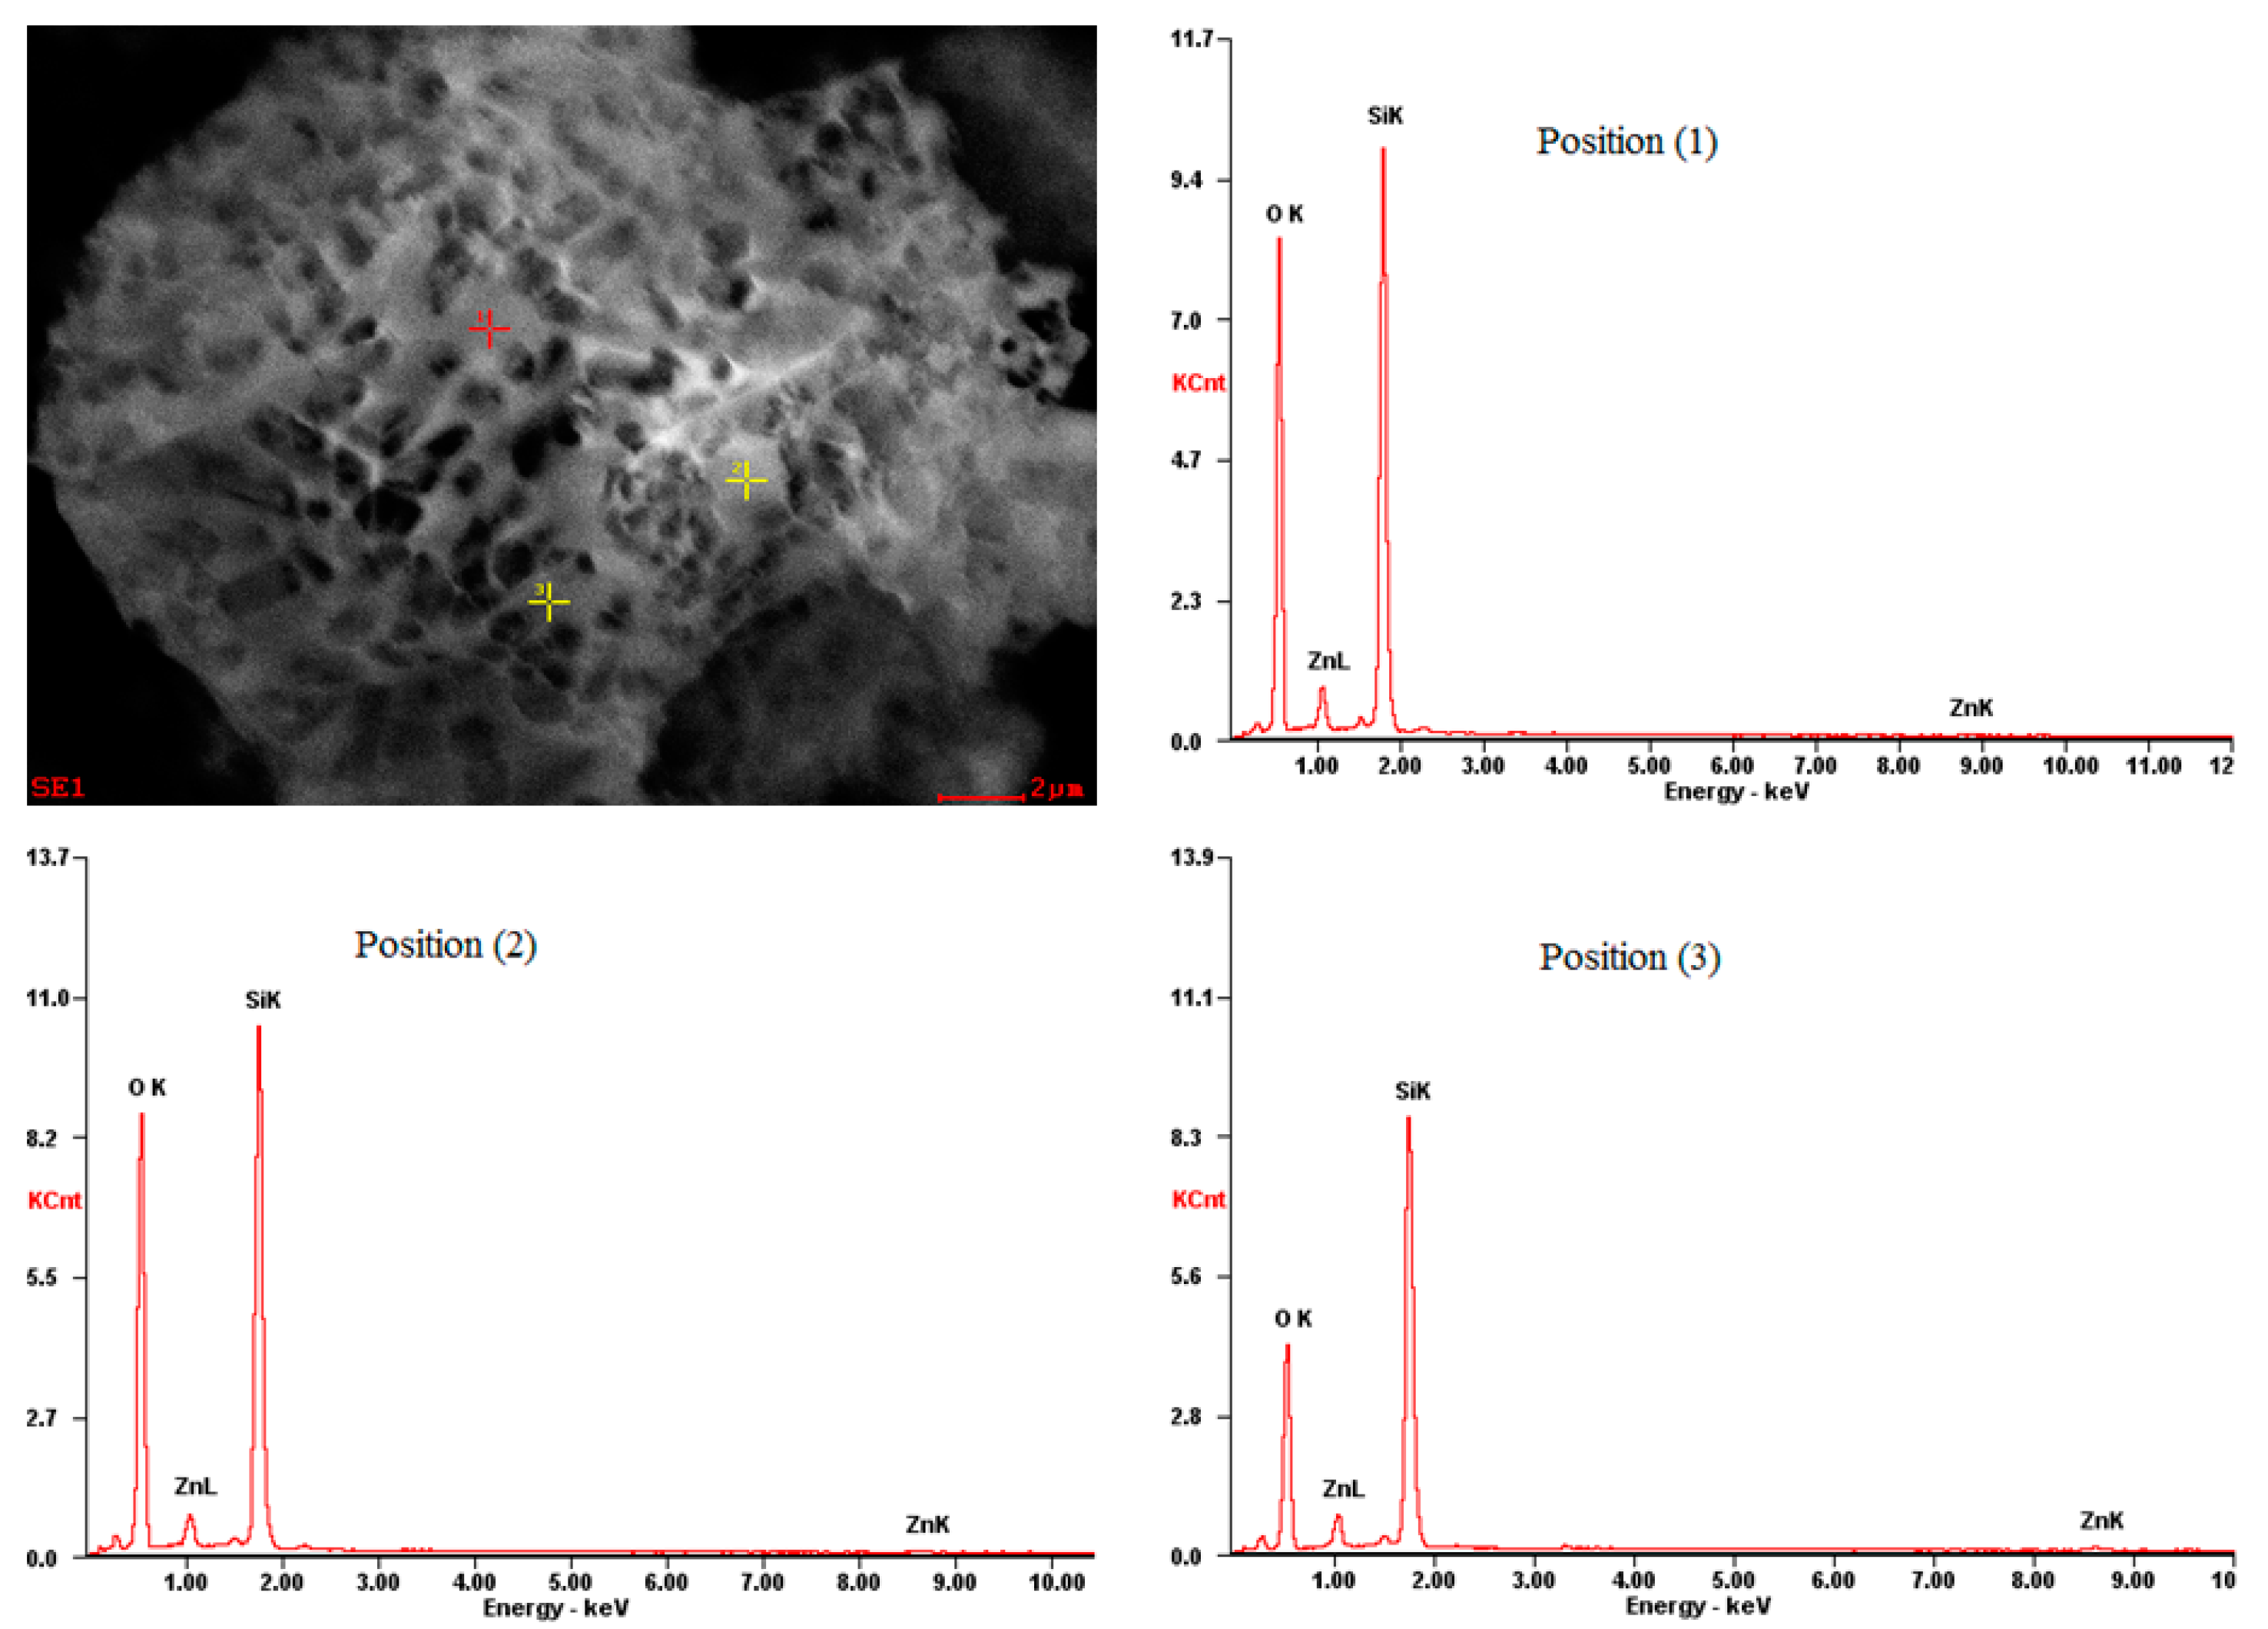
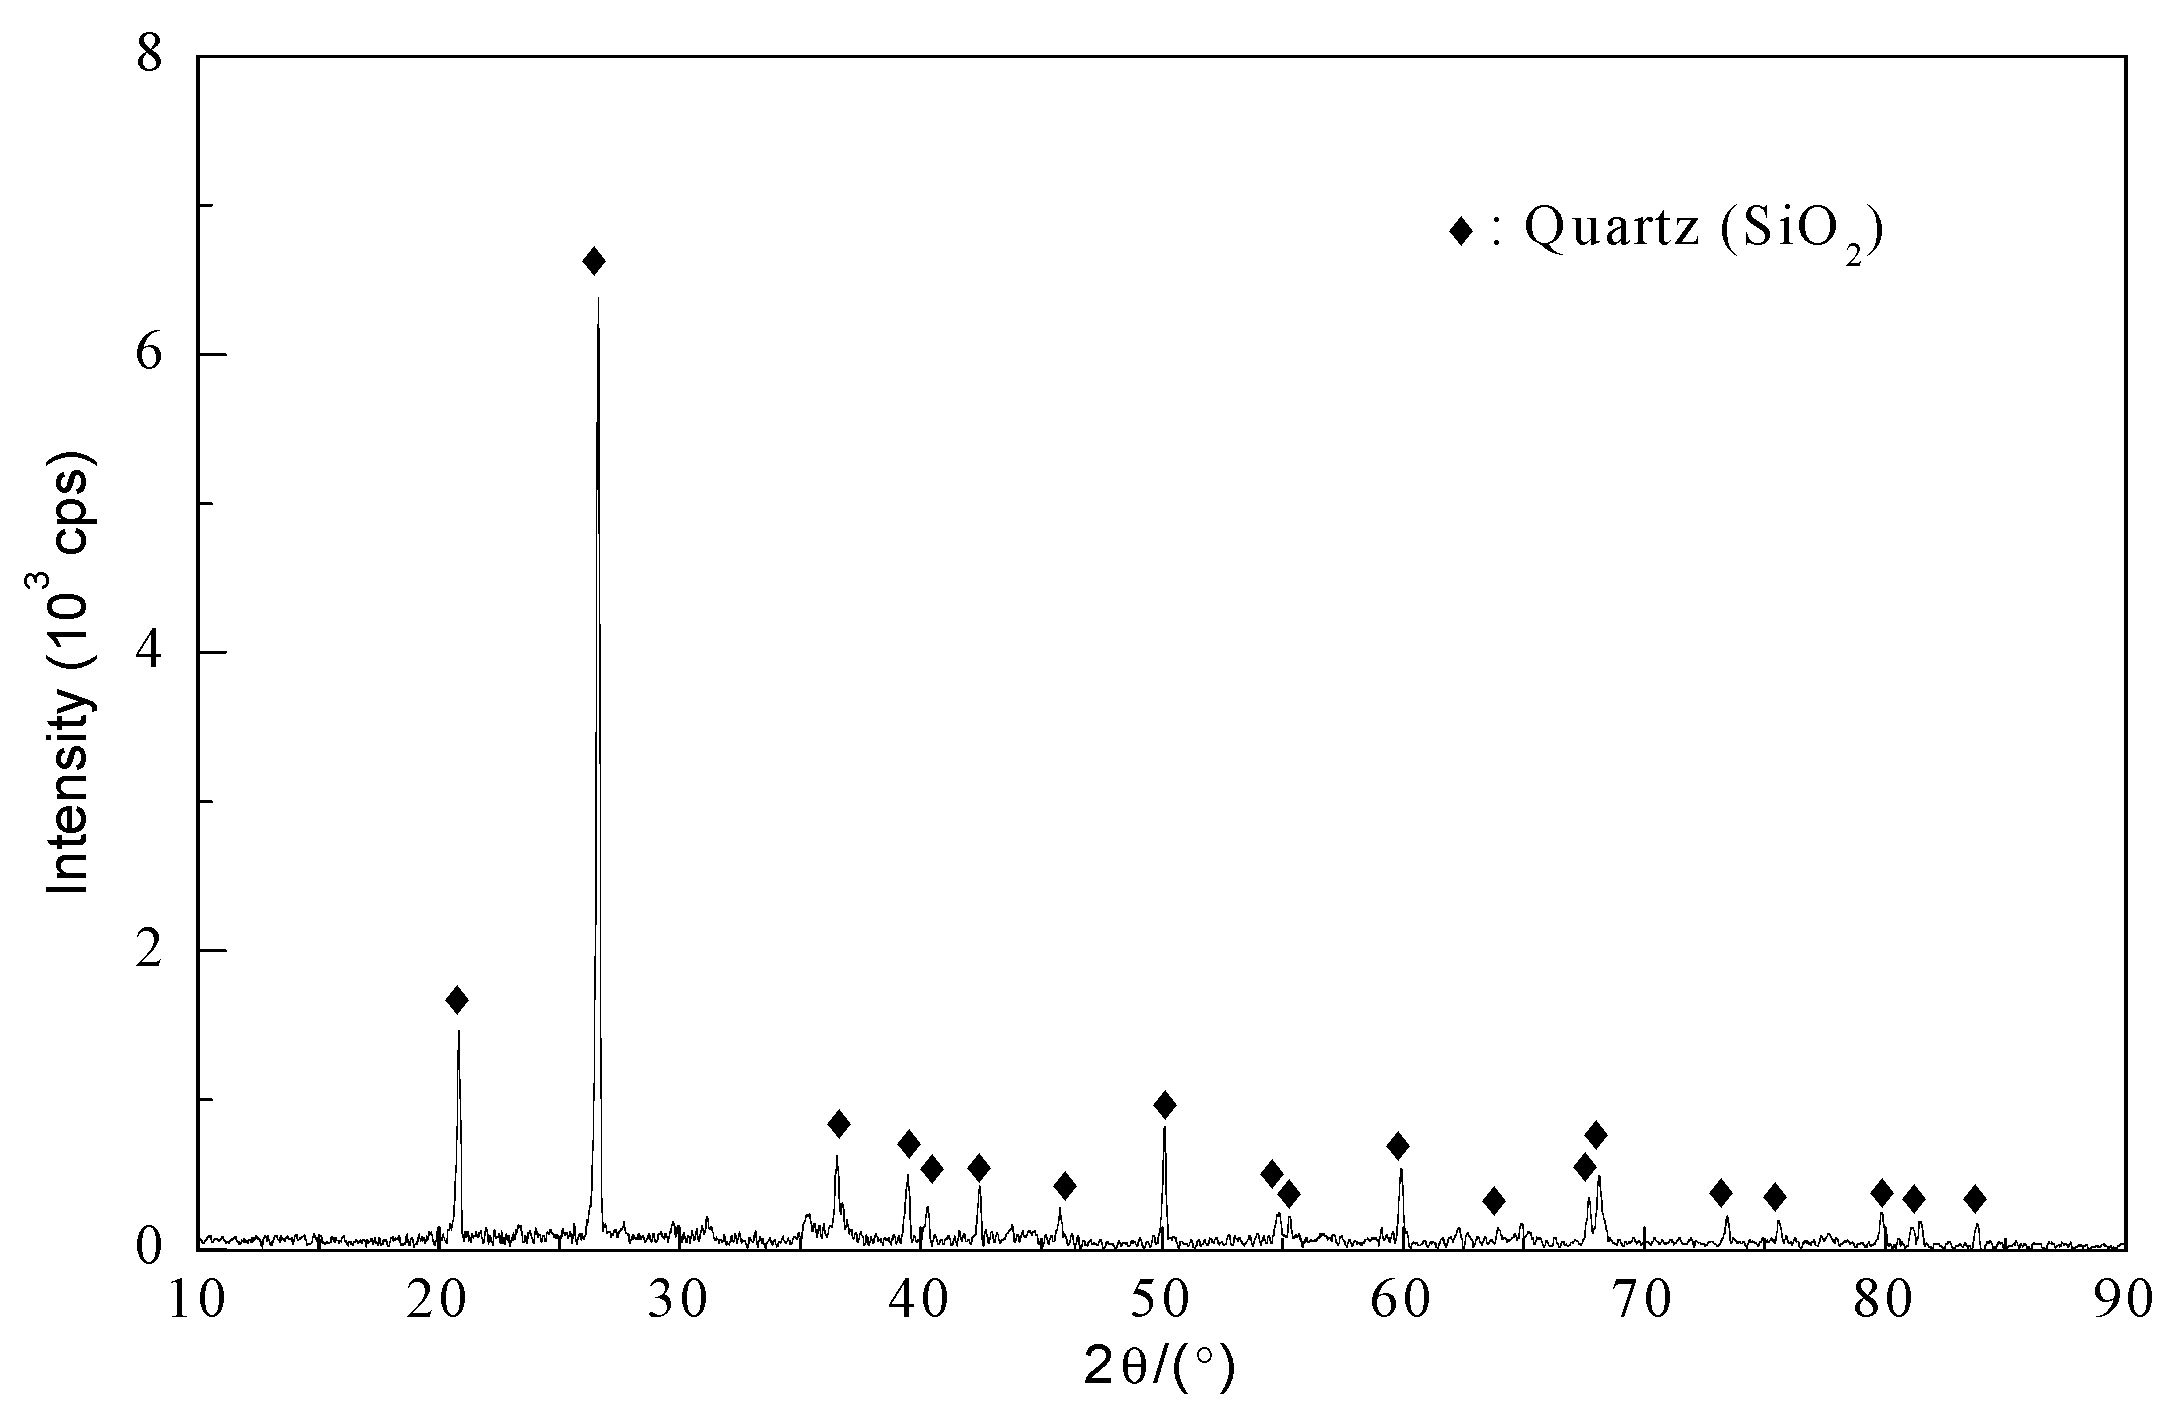
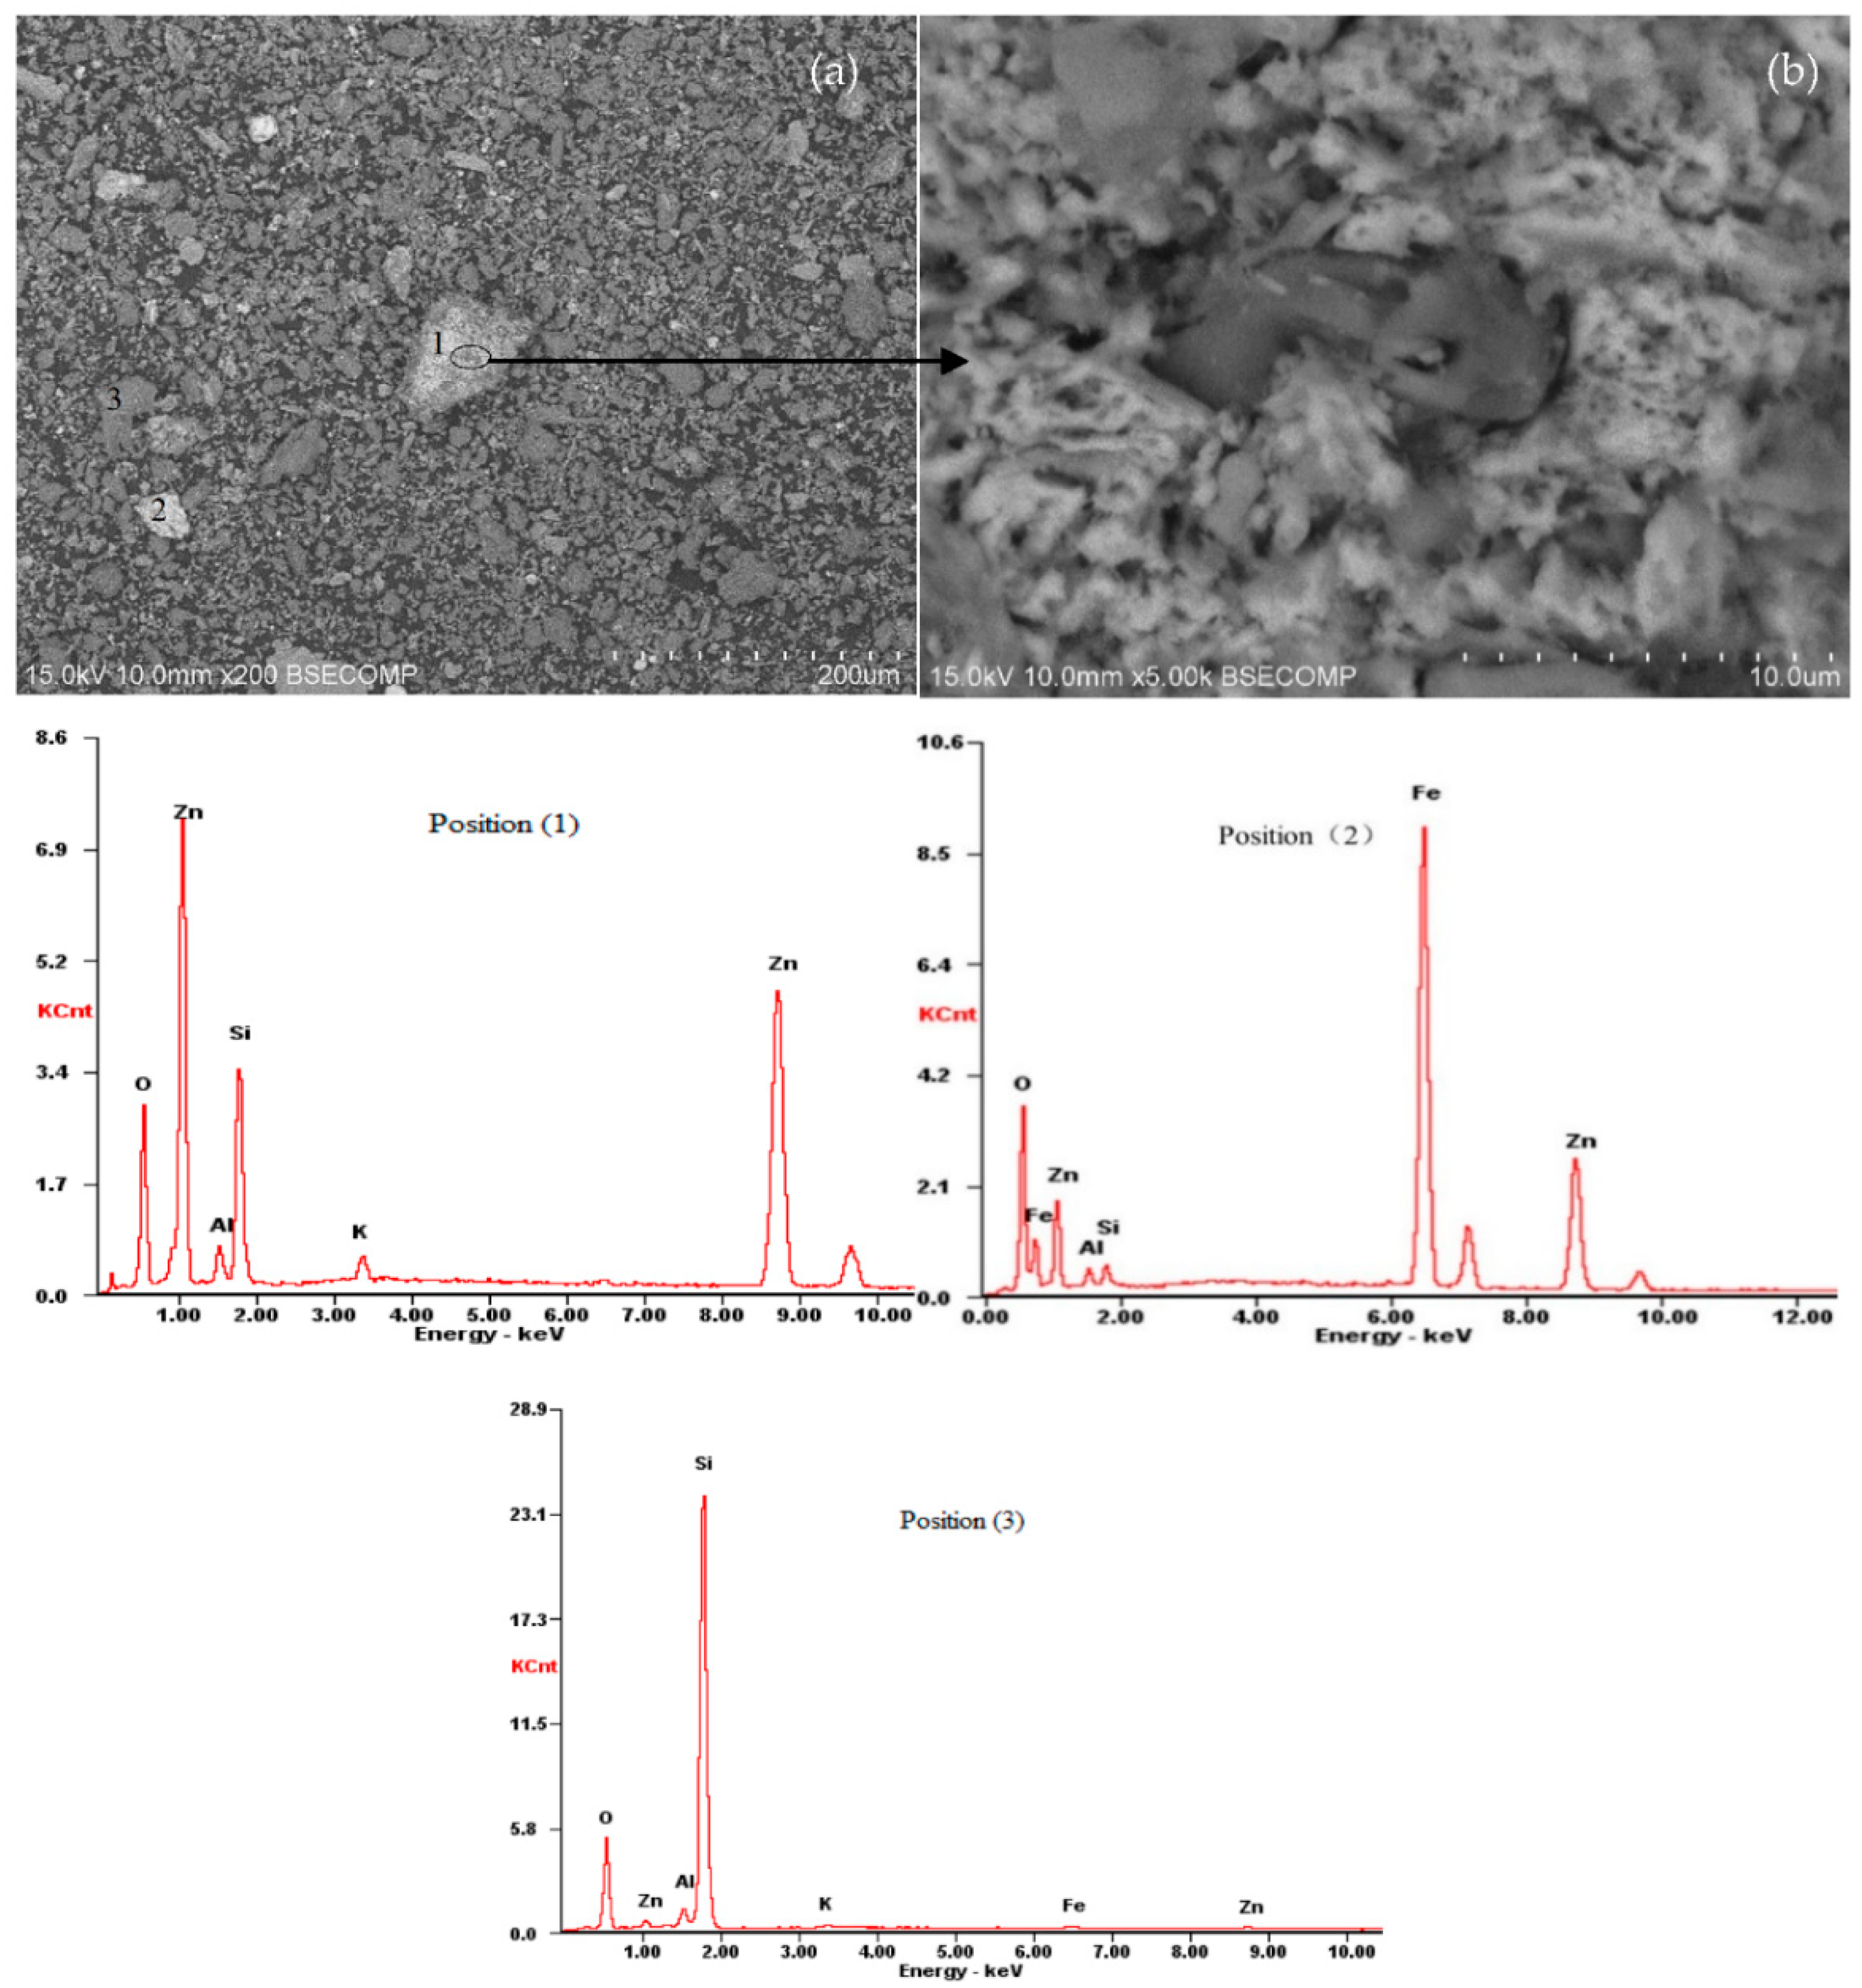
3.2. Characterization of Leaching Residue

The leaching residue was obtained under the following conditions: particle size of −57 + 53 μm, sulfuric acid concentration of 1.0 gl/L, 393 K, and leaching time of 16 min as characterized by SEM/EDS and XRD. The XRD analysis confirms the presence of cristobalite and a small amount of residual willemite (Figure 3). The SEM/EDS results are presented in Figure 8.
The point microanalysis results at positions 1, 2, and 3 (Figure 8) indicate the widespread presence of silicon and oxygen in this particle, but only a very small quantity of zinc was detected. Combining the XRD analysis (Figure 3), the silicon and oxygen in the leaching residue exist mainly as cristobalite and only a small amount is in the form of willemite. Through SEM observation (Figure 8), the microstructure of the residual sample particle after leaching of 16 min presents a porous surface generated by the acid leaching process. On this surface, the contents of Zn, Si, and O (average of positions (1), (2), and (3) in Figure 8) are 3.44%, 39.97%, and 56.6%, respectively (EDS analysis). However, on the surface of the unreacted sample particle (Figure 1), the EDS analysis (Figure 1b) shows a composition of 51.03% Zn, 18.16% Si, and 30.81% O. The change in the content of main elements on the surface of the sample particle before and after leaching indicates that as the reaction proceeded, the zinc content decreased significantly, while the content of silicon and oxygen clearly increased, which may be taken as an evidence to support that under higher temperature, the secondary and filterable silica precipitate (cristobalite) may form with the direct dehydration reaction of silicic acid formed by the reaction of sulfuric acid and willemite. These findings demonstrate that there is a layer of insoluble solid product (cristobalite) existing on the surface of the unreacted core of grains.

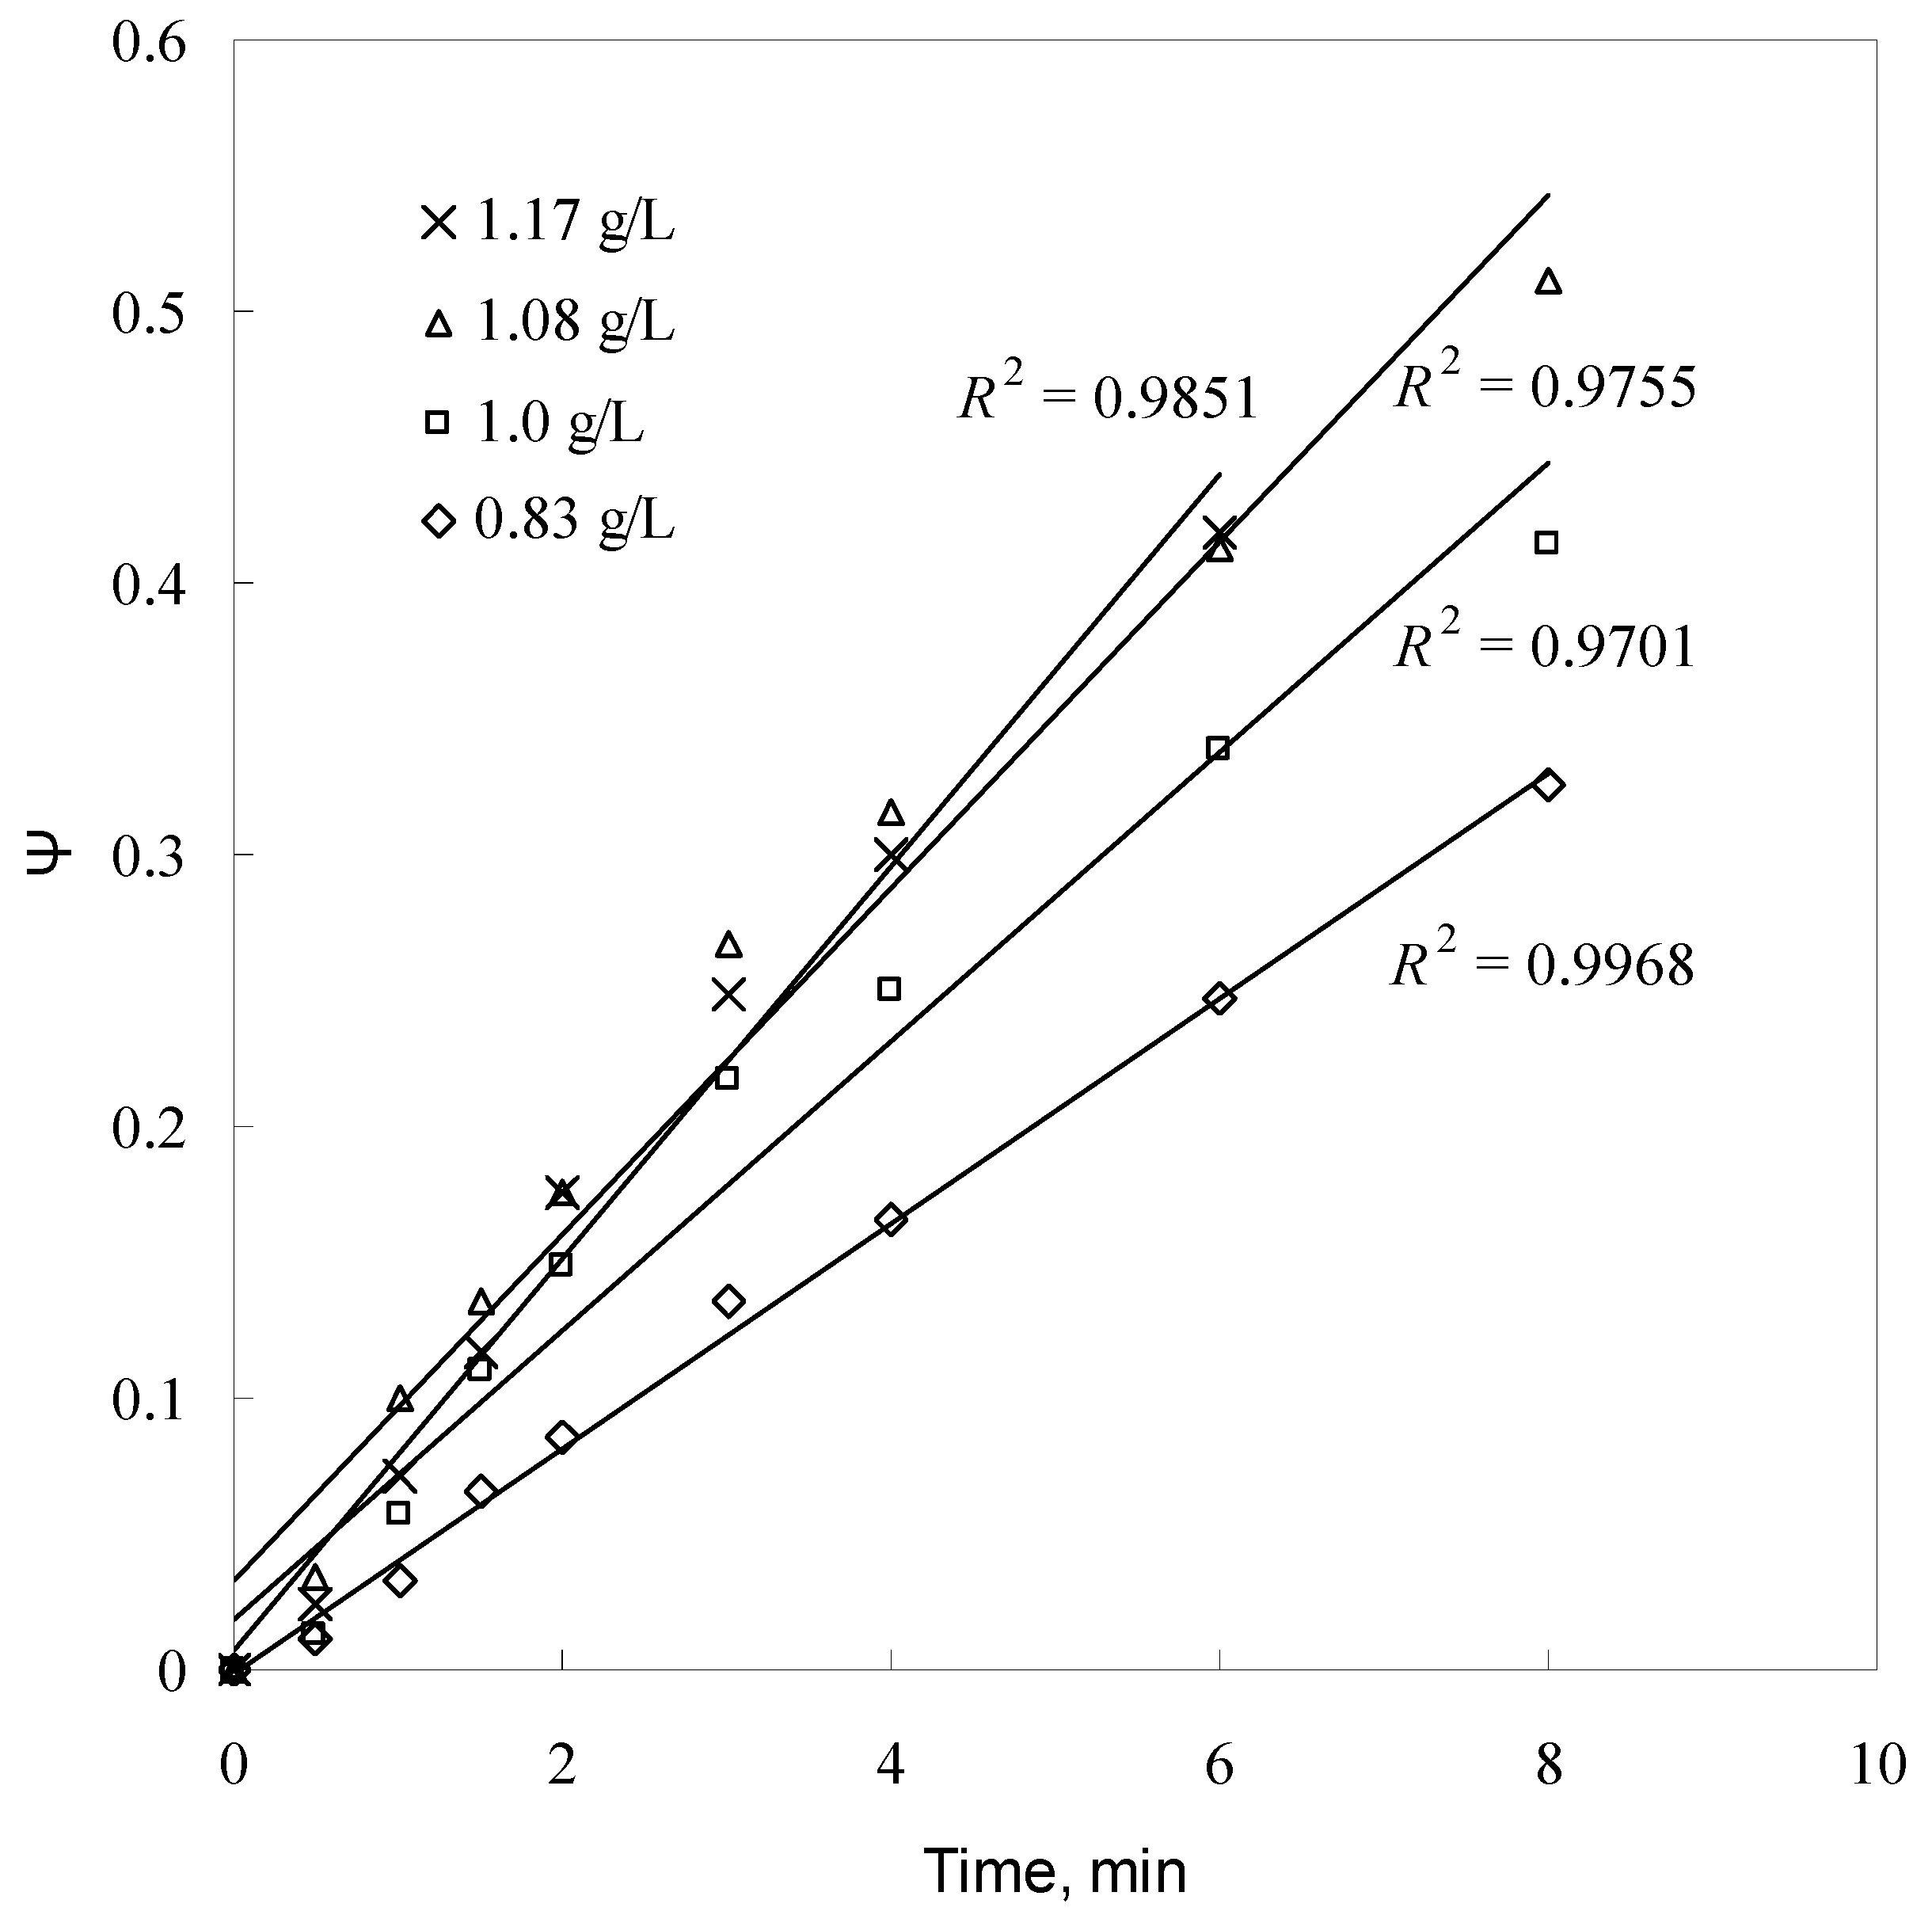
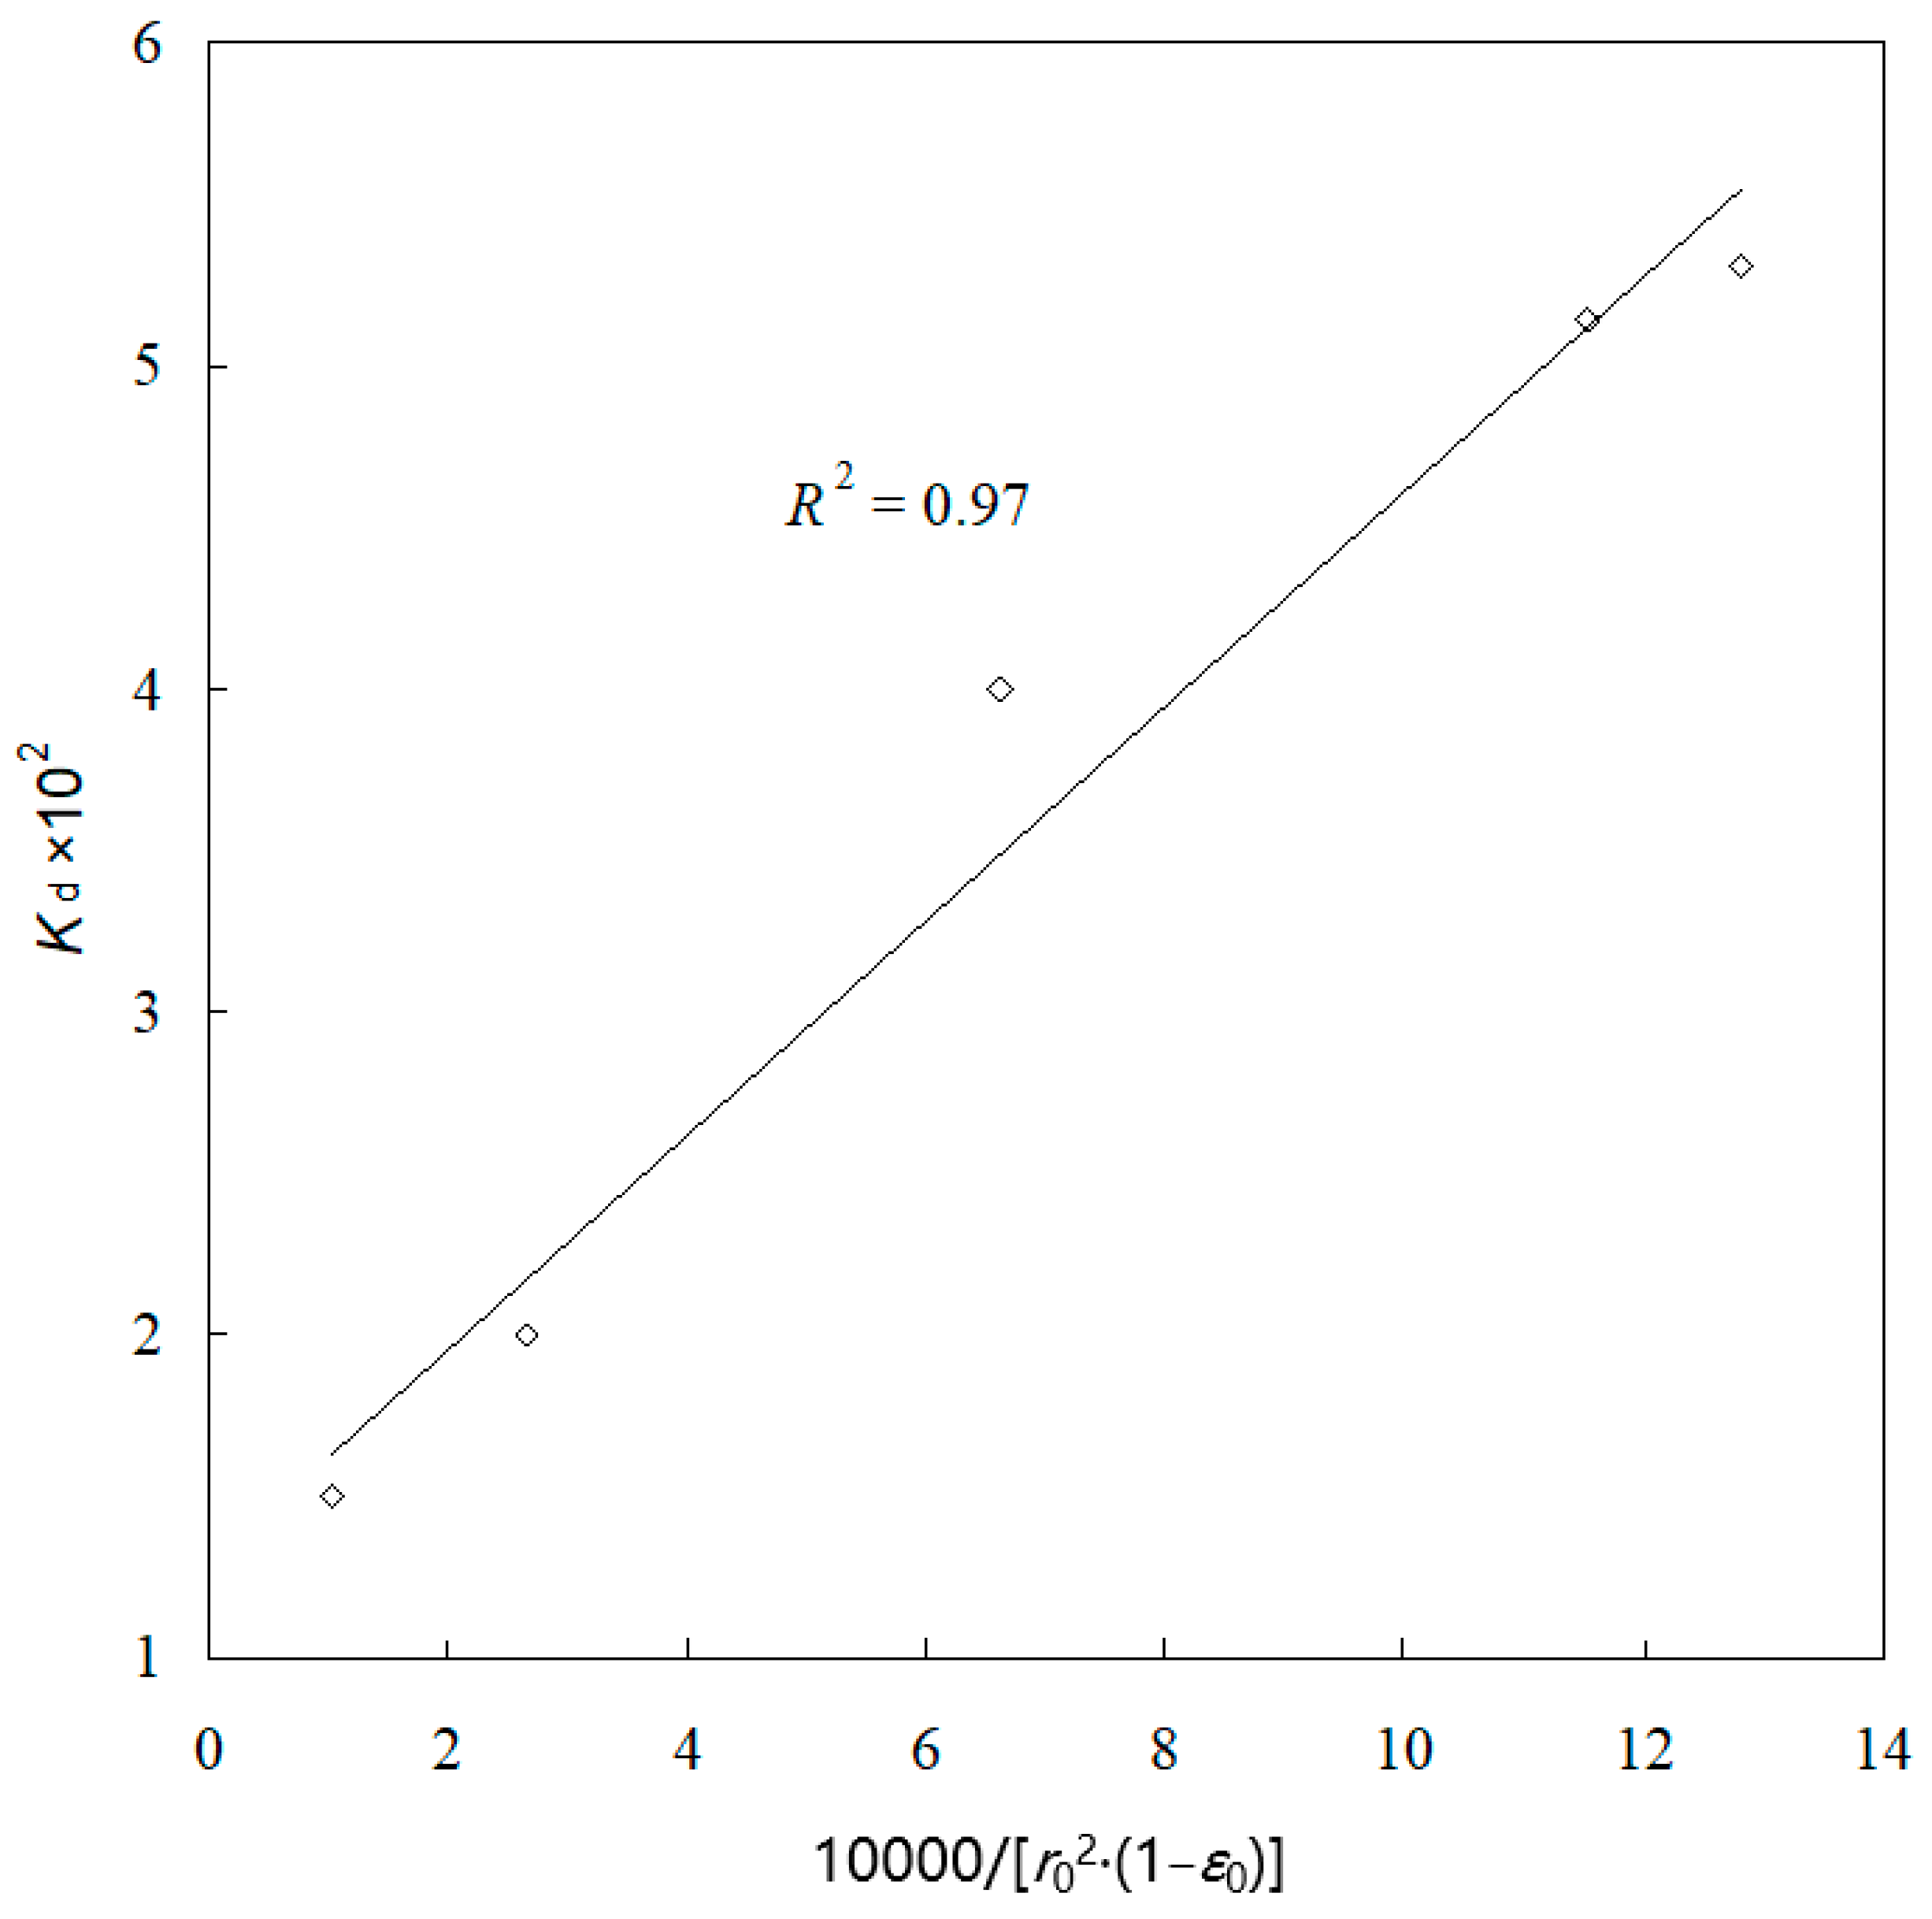
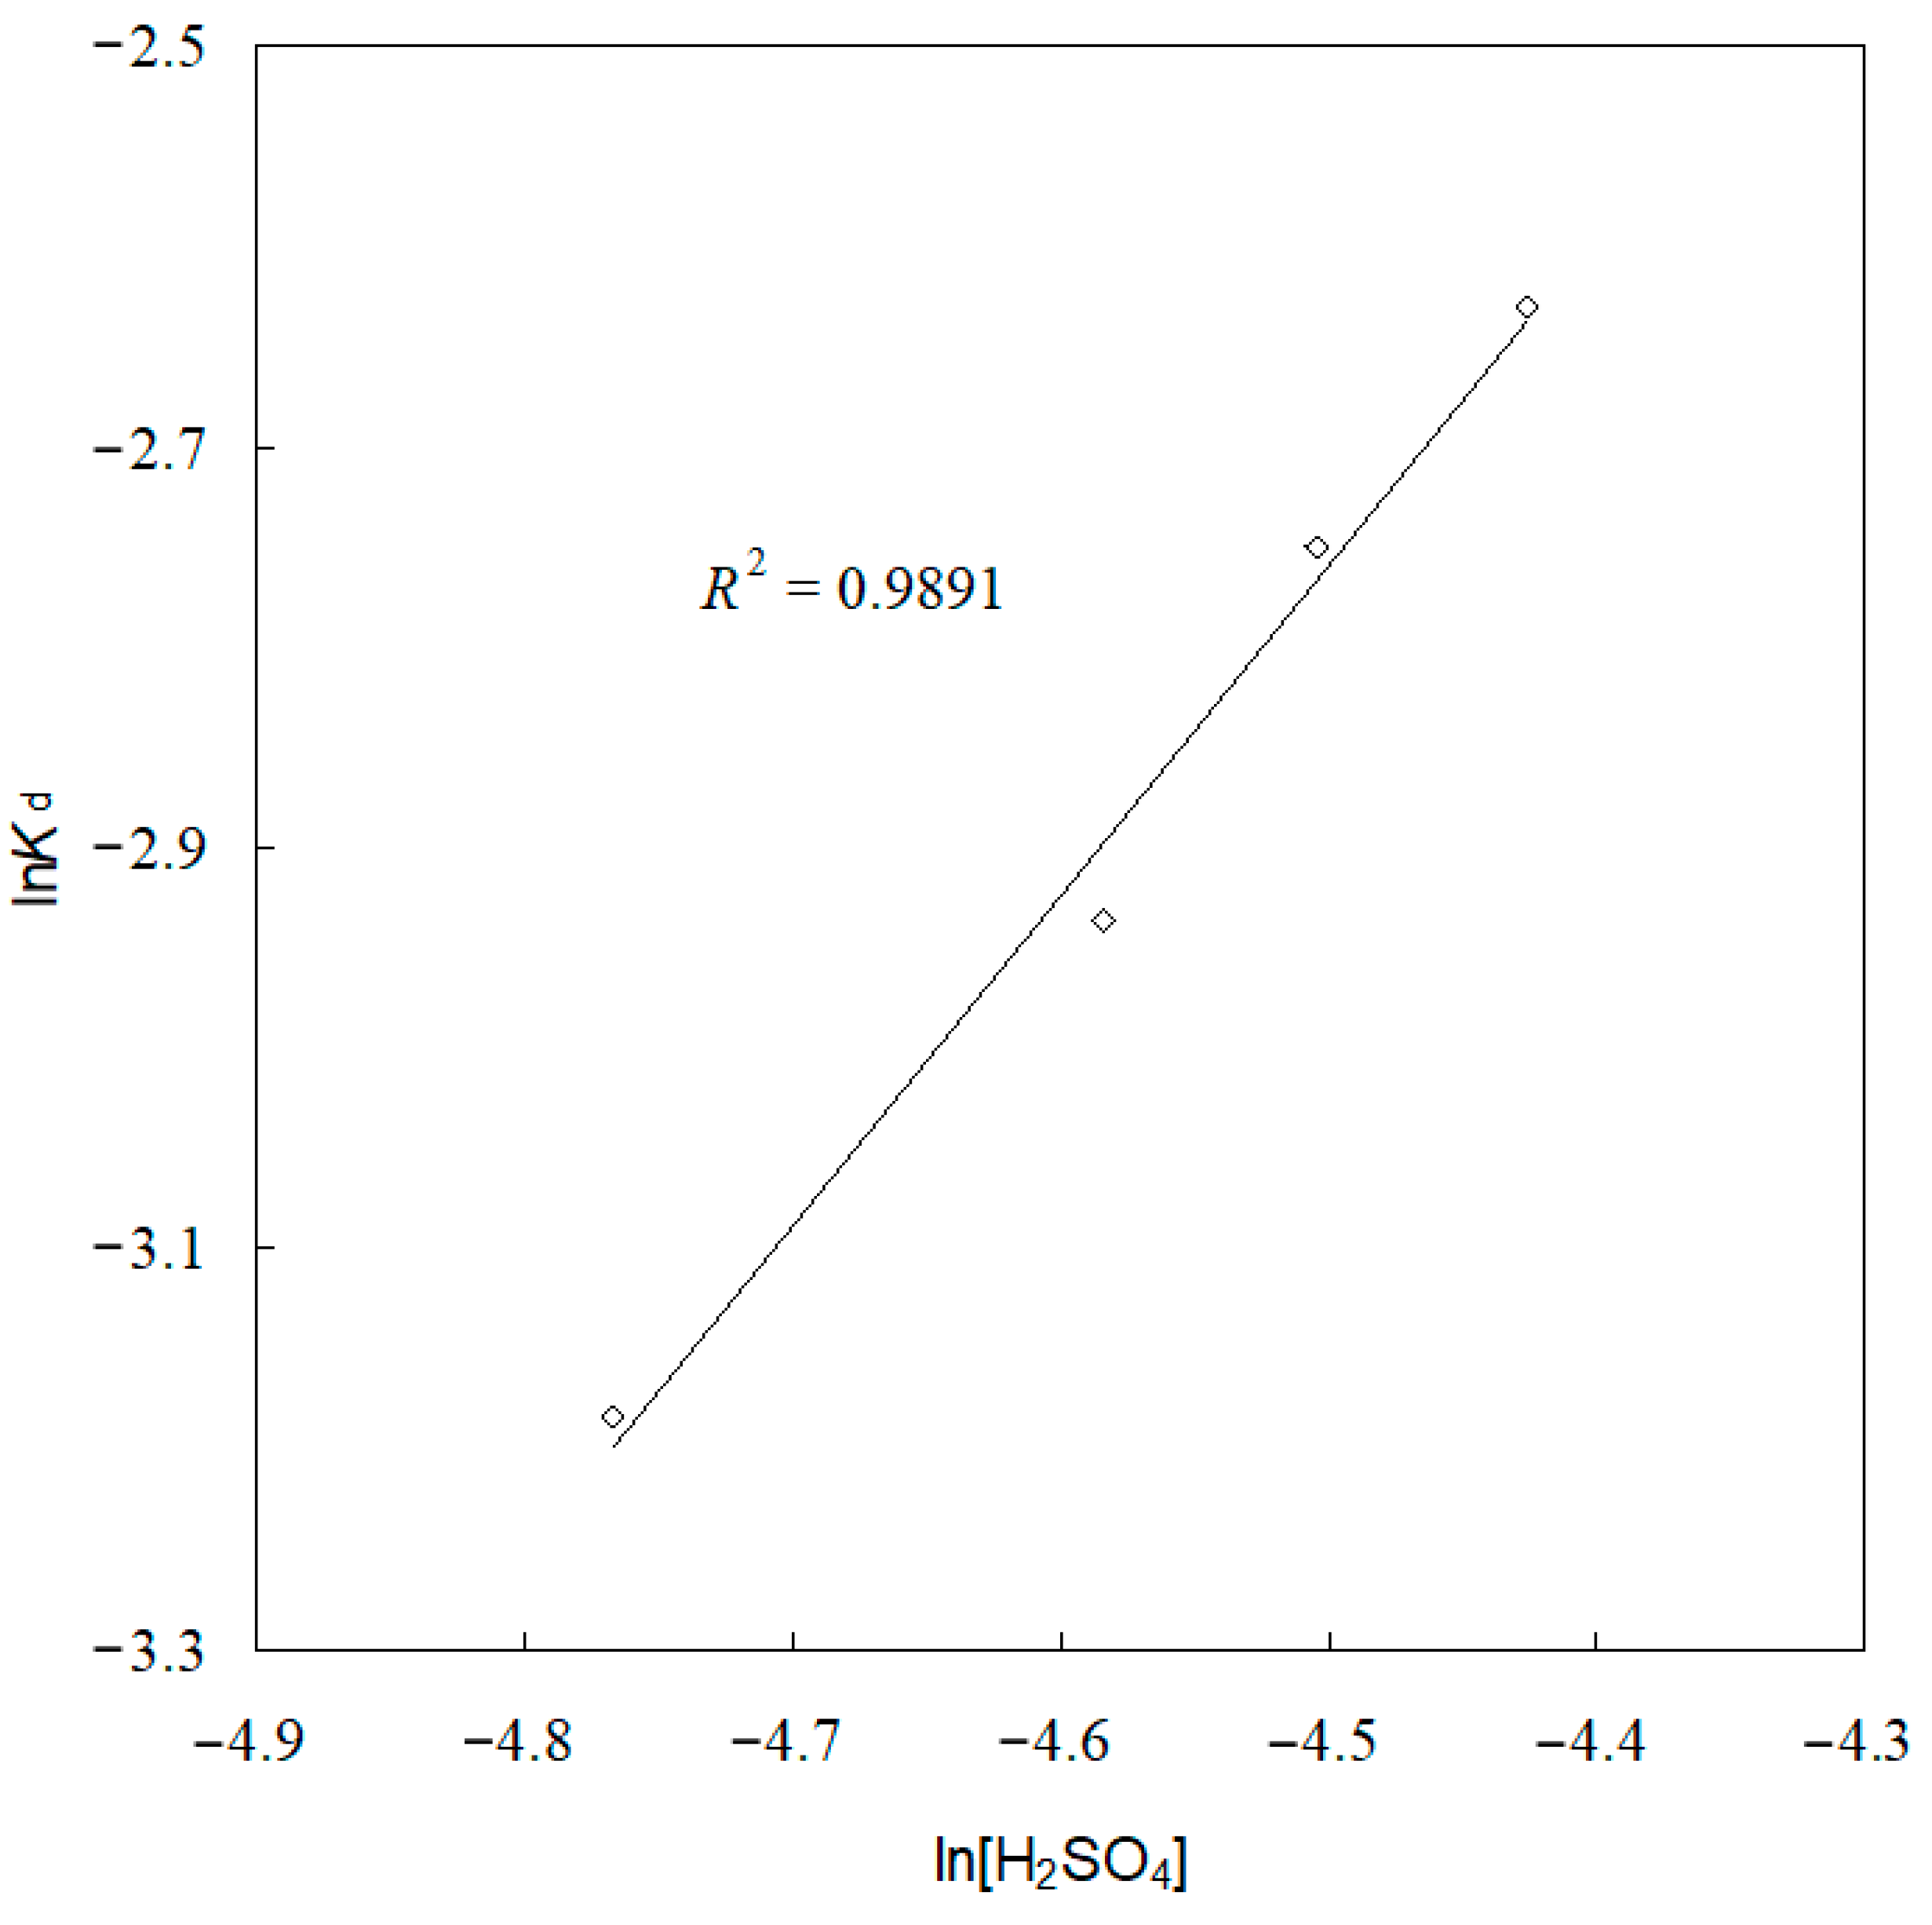
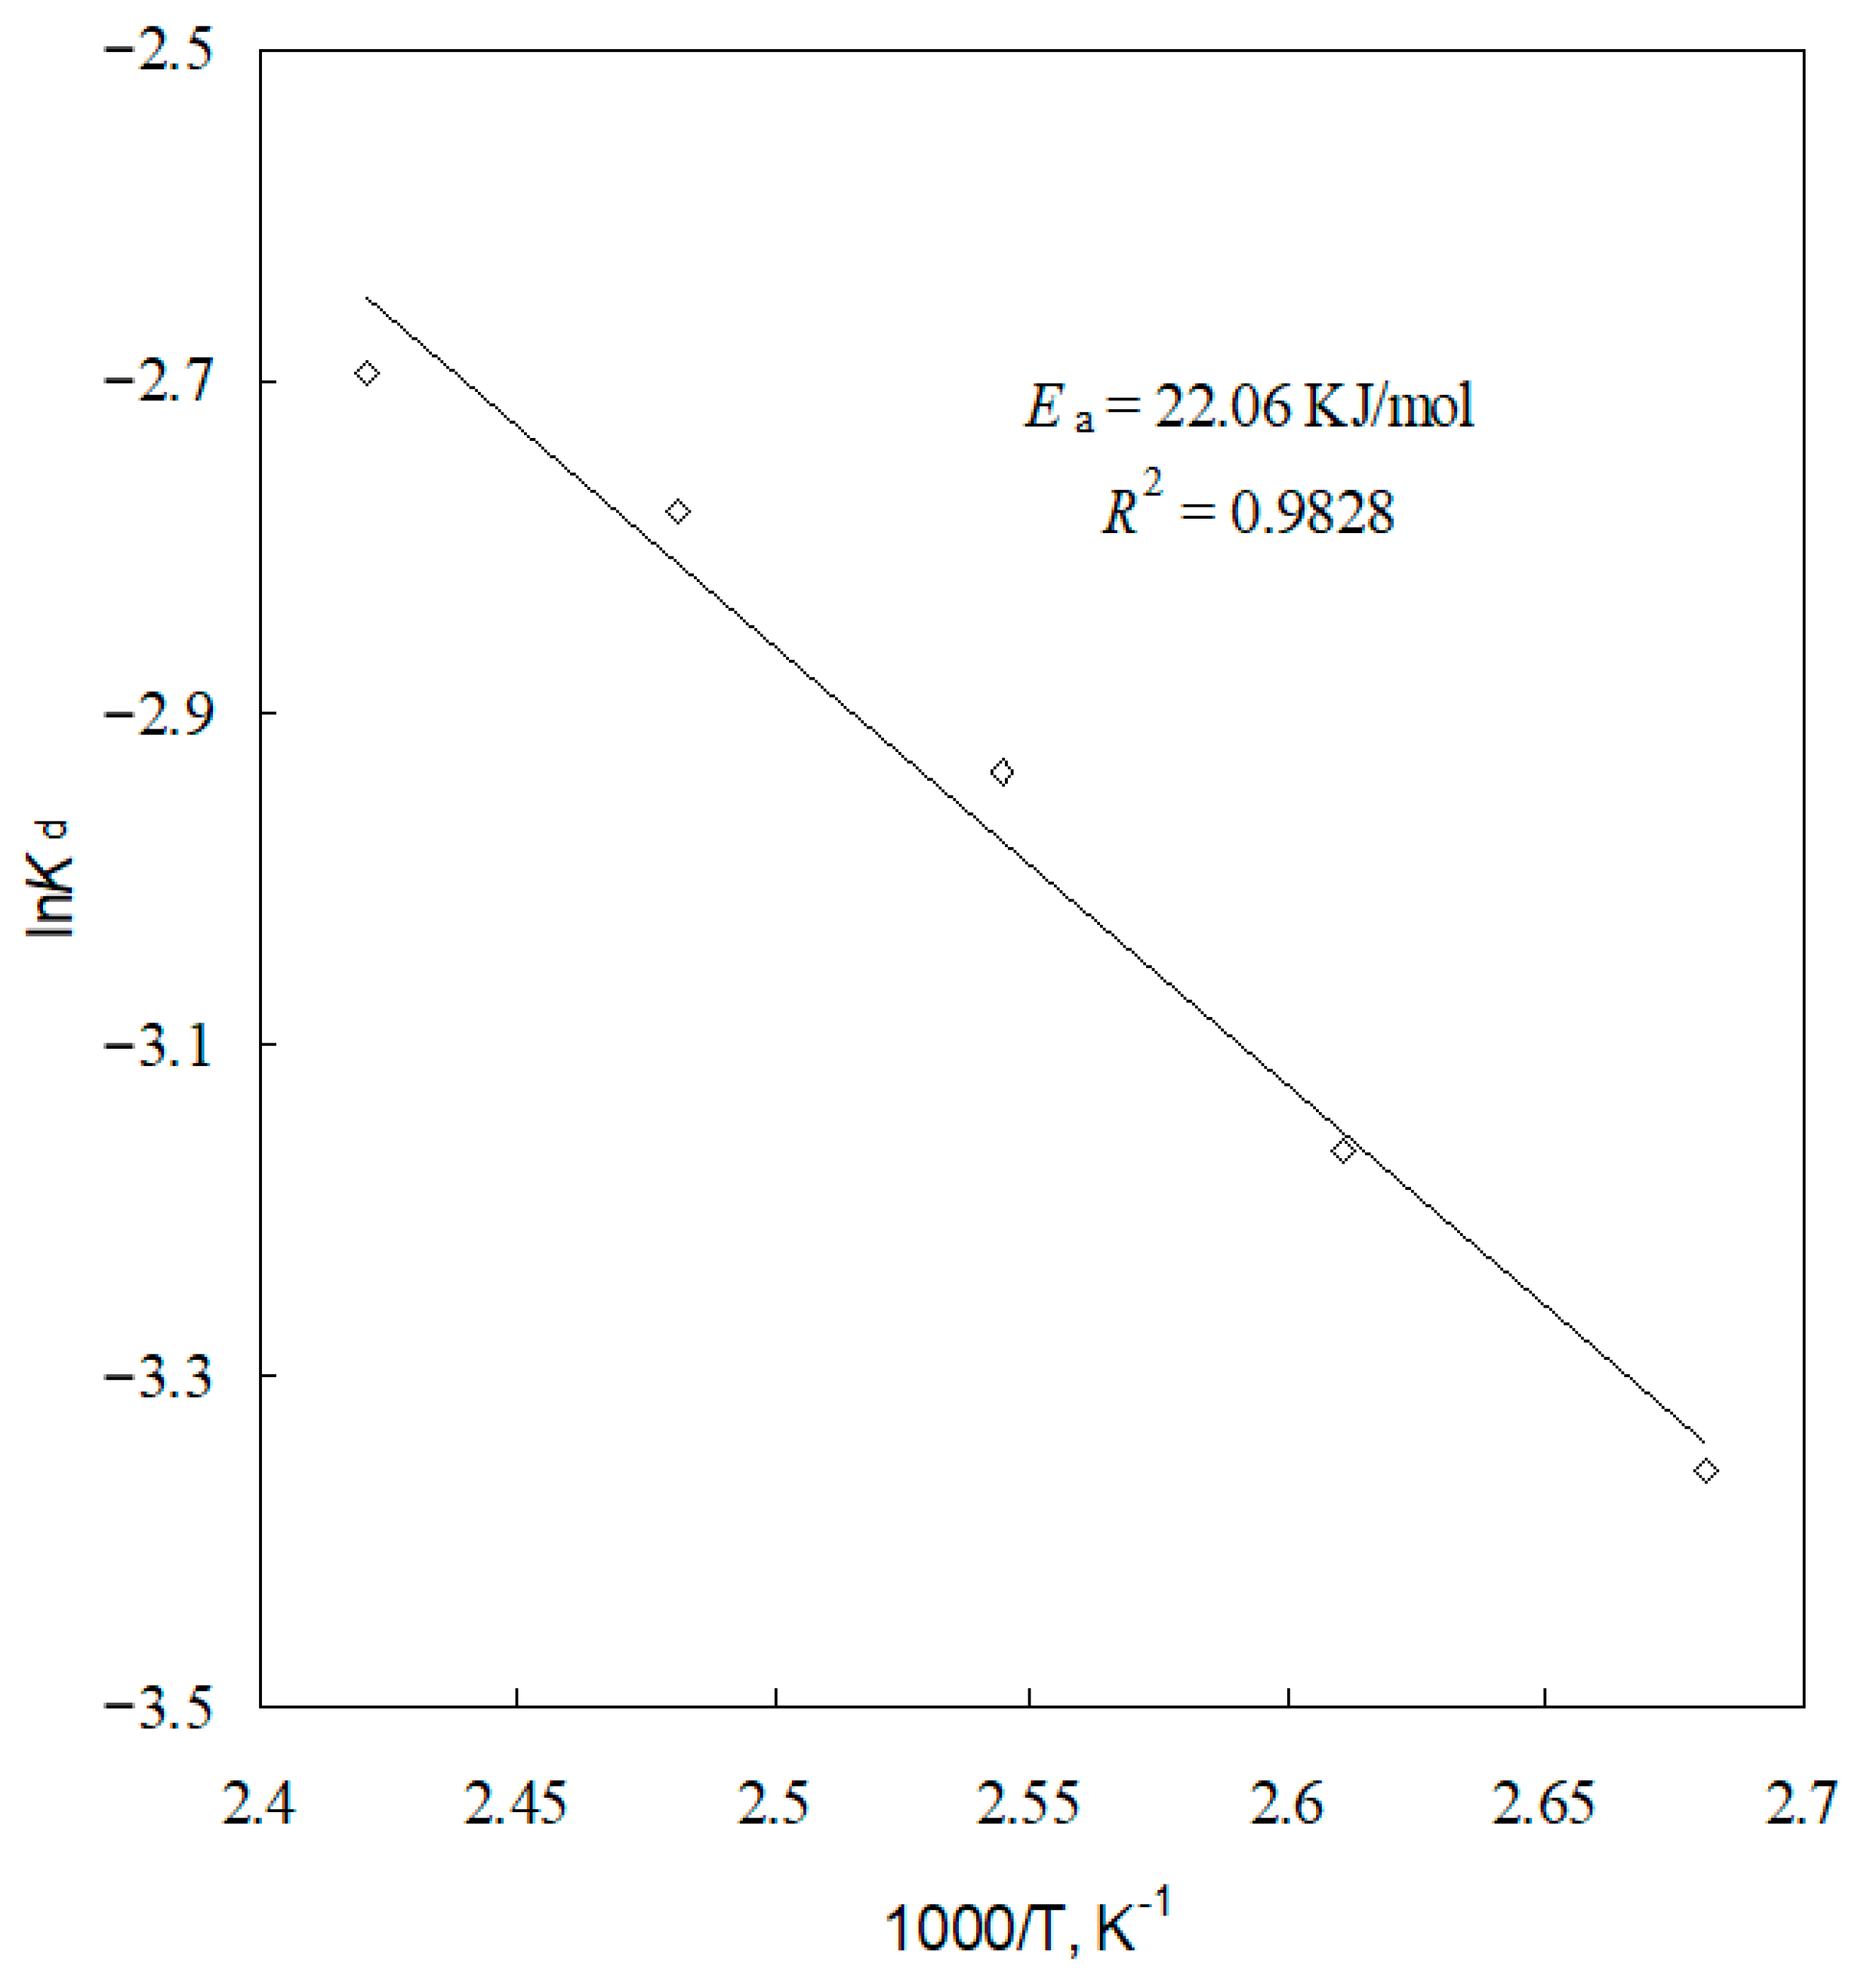
3.3. Kinetic Analysis

The chemical reaction between sulfuric acid and artificial willemite is a noncatalytic, irreversible, and heterogeneous reaction and may be represented by the following equation:
A(l) + bB(s) → Products
In this study, taking into account the fact that the porous structure willemite particle is made up of aggregates of non-porous sphere-like grains (Figure 1) and that there is a layer of insoluble solid product (cristobalite) existing on the surface of the unreacted core of grains (Figure 8), the grain model [23,24,25] in which the porous solid is pictured as an aggregate of fine grains, together with the shrinking core model [25,26] used to represent the reaction of each grain, was evaluated for the analysis of kinetic data. The grain model as one of various models describing said reaction system was the most frequently used. Assuming that the artificial willemite particles have a spherical geometry and that the sulfuric acid concentration remains constant during leaching, and disregarding the external mass transfer through the liquid boundary layer around particles, the general expression of the grain model is given as follows [24,25]:
t = g F g ( x ) + σ g 2 p F g ( x ) + σ 2 p F p ( x )
where
t = b k r C A , b ρ m r g t
g F g ( x ) = 1 ( 1 x ) 1 3
σ g 2 = k r r g 6 D g
p F g ( x ) = p F p ( x ) = 1 3 ( 1 x ) 2 3 + 2 ( 1 x )
σ 2 = r 0 2 k r ( 1 ε 0 ) 6 D e r g
where x is the extraction of zinc, t is the reaction time, t* is the dimensionless time defined by Equation (4), Fg and Fp are respectively the shape factor for grains and particle (=3 for spheres), g(x) and p(x) defined respectively by Equations (5) and (7) are the conversion functions, b is the stoichiometric coefficient, kr is the reaction rate constant, CA,b is the initial concentration of lixiviant A in solution, ρm is the mole density of solid B, De is the effective diffusivity of lixiviant A in the particle, Dg is the effective diffusivity of lixiviant A through the product layer around grains, and rg and r0 are respectively the distance from the center of symmetry to the reaction interface in the grain; in the particle, ε0 is the initial porosity of the solid (B) particle, σ is the generalized liquid–solid reaction modulus defined by Equation (8). σ g , defined by Equation (6), is the dimensionless modulus for the reaction of the grain.
If the overall rate is controlled by chemical kinetics, the following expression can be used:
1 ( 1 x ) 1 3 = b k r C A , b ρ m r g t
If the overall rate is controlled solely by the diffusion of lixiviant through the pores, the following expression can be used:
1 3 ( 1 x ) 2 3 + 2 ( 1 x ) = 6 b D e C A , b ρ m r 0 2 ( 1 ε 0 ) t
If the overall rate is controlled solely by the diffusion of lixiviant through the solid product layer, the following expression can be tested:
1 3 ( 1 x ) 2 3 + 2 ( 1 x ) = 6 b D g C A , b ρ m r g 2 t
To determine rate-controlling step for leaching process, the experimental data shown in Figure 7 were tested using Equations (9)–(11). The left sides of these equations were plotted against leaching time (figures not shown here). The explanation degree of these models on the kinetics data was assessed according to the linear correlation coefficient values (R2) of the fitting curve. The results are given in Table 2.
These values confirm that high-temperature leaching of artificial willemite in low-sulfuric-acid solution can be kinetically controlled by the product layer and pore diffusion and not by chemical reaction in the first 3 min of leaching. It seems to suggest that one or both of diffusions through the product layer and the pore is the main rate-controlling step. However, from Table 2, the deviation between the proposed model and the data is evident for the long-duration leaching. This could be due to the fact that the sulfuric acid concentration decreases gradually as the reaction proceeds since the above models mentioned were developed under the assumption that the lixiviant concentration remains constant during reaction. Clearly, the grain model with product layer and pore diffusion control (Equations (10) and (11)) best fits the kinetic data in the first 3 min, but it is not suited for the long-duration leaching, as seen in Table 2. This is because decreasing lixiviant (sulfuric acid) concentration has little effect on the reaction rate in the first 3 min, but for the long-duration leaching, the effect of the fact that the sulfuric acid concentration decreases significantly as zinc extraction increases on the rate of reaction should not be ignored. Hence, they did not work here because a very low sulfuric acid concentration was used in this study to accurately measure the reaction rate, causing the change in sulfuric acid concentration throughout the experiment.
To find a suitable mathematical model that is able to describe the leaching behavior of willemite in the studied experimental conditions, the fact that the sulfuric acid concentration does not remain constant during leaching must be taken into consideration. In this situation, the sulfuric acid concentration CA is C A , b ( 1 n B 0 x b C A ,   b V ) = C A , b ( 1 σ x ) at time t but not CA,b.
Where nB0 is the initial moles of solid reactant B and V is the volume of the test solution in the system, σ = n B 0 b C A ,   b V .
The relationships, which are presented in the form of the conversion functions g(x) and p(x), defined respectively by Equations (5) and (7), were developed from the shrinking core model used to represent the reaction of each grain, considering the investigated experimental conditions under which the change in sulfuric acid concentration can occur as the reaction proceeds. In Sohn and Wadsworth’s work [25], the effect of the change in lixiviant concentration on the reaction rate was studied, and they attempted to establish the kinetics equation for describing the time variation of the lixiviant concentration. It was reported by Sohn and Wadsworth that the exact solution of the differential equation can likely only be obtained under special condition where the ratio of the total stoichiometric coefficients between solid reactant and lixiviant is equal to one, i.e., σ = 1, while for σ ≠ 1, the approximate solution can be obtained with the method of numerical integration and was not given in their work. In the present study, considering σ ≠ 1 and the time variation of the lixiviant concentration, the general relationships were obtained by combining the differential equation of the shrinking core model with initial conditions t = 0 and x = 0, and may be given by combining Equation (3) as follows:
ψ = 1 + β 3 2 β 2 ln β 2 + λ 2 β λ ( β + λ ) 2 3 ( 1 + β 3 ) β 2 arctan ( 2 λ 3 β 1 3 ) [ 1 + β 3 2 β 2 ln β 2 + 1 β ( β + 1 ) 2 3 ( 1 + β 3 ) β 2 arctan ( 2 3 β 1 3 ) ] = 3 b k r C A , b ρ m r g t = k c t ( For chemical reaction control )
ψ = ( 1 + β 3 )   ln ( 1 1 λ 3 1 + β 3 ) [ 1 + β 3 2 β ln β 2 + λ 2 β λ ( β + λ ) 2 + 3 ( 1 + β 3 ) β arctan ( 2 λ 3 β 1 3 ) ] + 1 + β 3 2 β ln β 2 + 1 β ( β + 1 ) 2 + 3 ( 1 + β 3 ) β arctan ( 2 3 β 1 3 ) = 3 b D g C A , b ρ m r g 2 t = k d t ( For product layer diffusion control )
ψ = ( 1 + β 3 )   ln ( 1 1 λ 3 1 + β 3 ) [ 1 + β 3 2 β ln β 2 + λ 2 β λ ( β + λ ) 2 + 3 ( 1 + β 3 ) β arctan ( 2 λ 3 β 1 3 ) ] + 1 + β 3 2 β ln β 2 + 1 β ( β + 1 ) 2 + 3 ( 1 + β 3 ) β arctan ( 2 3 β 1 3 ) = 3 b D e C A , b ρ m r 0 2 ( 1 ε 0 ) t = k d 0 t ( For pore diffusion control )
where λ = ( 1 x ) 1 3 , β 3 = 1 σ σ , ψ and ψ* are the dimensionless functions of the reaction degree; kc, kd, and kd0—defined in Equations (12)–(14), respectively—are apparent rate constants.
The kinetic equations developed are verified using the data in Figure 7. The left sides of these equations were plotted against leaching time (figures not shown here). The corresponding correlation coefficient values are listed in Table 2. It is found that the model for product layer and pore diffusion control is better than that for chemical reaction control since the former gives a good linear fit with correlation coefficient values higher than 0.97. This finding indicates that the reaction rate is controlled by one or both of two diffusional processes: the diffusion of lixiviant through the product layer and the diffusion of lixiviant through the pores. The following relationship is obtained by combining Equations (13) and (14):
D e D g = r 0 2 ( 1 ε 0 ) r g 2
Equation (15) shows that one or the other predominates depending on the size of particle and grain. It can be seen from Figure 1 that the diameter of the grain is in the range of 1–2 μm. The ratios of the effective diffusivity between product layer diffusion and pore diffusion were estimated by combining the initial porosity and the initial average radius of particle size used. The results are listed in Table 1. As can be seen, De >> Dg, which indicates that the diffusion of the liquid reactant through the product layer around the individual grains is the main rate-controlling step.
To test the validity of product layer diffusion mechanism in the studied experimental conditions, the experimental data for different parameters were fitted according to Equation (13). The results are shown in Figure 9, Figure 10, Figure 11 and Figure 12, respectively, in which the left side (ψ) of Equation (13) is plotted versus t.
As can be seen in these figures, there is a good linear relation between the modified grain model with the product layer diffusion control and the experimental data. Thus, it is confirmed that the reaction rate is controlled by diffusion through the product layer.
Equation (13) reveals that the slope of the line of ψ versus t is the apparent rate constant kd, it must be directly proportional to 1 r g 2 . Combining Equations (13) and (15), it is found that the apparent rate constant kd is also proportional to 1 r 0 2 ( 1 ε 0 ) . The kd values for the five sizes are calculated from Figure 9 and plotted in Figure 13 against 1 r 0 2 ( 1 ε 0 ) . A straight line with a regression coefficient of 0.97 is obtained. This result may be taken as the indirect evidence to support the conclusion that the leaching process follows the grain model with the product layer diffusion control.
Additionally, the kd values for each sulfuric acid concentration are determined from Figure 10. From the kd and sulfuric acid concentration values, a plot of lnkd versus ln[H2SO4] is given in Figure 14. As seen in Figure 14, the reaction order with respect to sulfuric acid concentration was found to be 1.6472, with a correlation coefficient of 0.9891.
The temperature dependence of the apparent rate constant can be expressed by the Arrhenius equation:
k d = A exp ( E a R T )
and   ln k d = ln A E a R T
where A is the Arrhenius pre-exponential factor, Ea is the apparent activation energy of the reaction, R is the universal gas constant, and T is the absolute temperature.
The kd values for different temperatures are calculated from the slopes of the straight lines in Figure 12. The Arrhenius plot of lnkd versus 1/T is an approximate line with a regression coefficient of 0.9828 where the slop is (−Ea/R), as shown in Figure 15. From Ea/R, the apparent activation energy of the leaching reaction was determined to be 22.06 KJ/mol. From the intercept of the straight line in Figure 15, the Arrhenius pre-exponential factor is found to be 43.55 min−1.
Thus, combining β 3 = 1 σ σ = 0.07 and λ = ( 1 x ) 1 3 , Equation (13) can be given as follows:
1.07 ln ( 1 0.93 x ) [ 1.28 ln 0.17 + ( 1 x ) 2 3 0.42 ( 1 x ) 1 3 0.17 + ( 1 x ) 2 3 + 0.84 ( 1 x ) 1 3 + 4.5 arctan ( 2.76 ( 1 x ) 1 3 0.58 ) ] + 3.8 = 43.55 e 22060 R T t
The restrictions to the application of this equation should be considered for potential reuse by other applications. Some of these restrictions include the following: (1) taking into account the fact that the porous structure particle is made up of aggregates of non-porous sphere-like grains and that there is a layer of insoluble solid product existing on the surface of the unreacted shrinking core of grains, (2) the change in sulfuric acid concentration during leaching, and (3) the grain model with the product layer diffusion as the main rate-controlling step. The low activation energy value found in this study confirms that the leaching process is controlled by diffusion through the product layer around the unreacted shrinking core. In order to further understand this work, leaching tests on real samples had been carried out four times under the optimal conditions studied (sulfuric acid concentration of 0.81 mol/L, partial pressure of 1.4 MPa, leaching temperature of 413 K, L/S ratio of 10 mL/g, agitation speed of 550 rpm, leaching time of 60 min, and particle size of −57 + 53 μm), and the results are shown in Table 3.
It can be seen from Table 3 that the leaching residue contains mainly silica, calcium, and iron as well as low zinc, lead, aluminum, and other elements. Through comparison with chemical components of leaching residue and those of willemite concentrate in Table 3, the change in the content of main components before and after leaching indicates that as the leaching reaction proceeded, the zinc content decreased obviously, whereas the silica content increased significantly, which may be regarded as evidence supporting that the secondary and filterable silica precipitate may form with the direct dehydration reaction of silicic acid formed by the high temperature acid leaching of willemite concentrate. The said behaviors were consistent with the leaching behaviors of zinc and silicon studied in this work, and we were instructed to carry out leaching tests on real samples based on the results of this study. In addition, it was found that the amounts of Fe, Pb, Al, and Ca slightly increased as the zinc extraction or the amount of leached willemite concentrate increased. In the available literature [10] and this study, the extraction of zinc was very fast and then varied very little with time despite the fact that the different experimental conditions (such as different acid concentrations) were used. Leaching tests on real samples were conducted by using relatively high concentration and high temperature, longer duration, and so on, due to the fact that dissolution minimization of impurities (such as iron, lead, calcium, silica, and so on) for purification needed to be achieved before impurities could be extracted into leaching solution together with zinc.
The second experiment’s leaching residue was analyzed using SEM/EDS and XRD. The XRD analysis shows the presence of quartz as the main phase (Figure 16). The SEM/EDS results are seen in Figure 17.
It was revealed that the minerals identified are quartz as well as a small amount of franklinite and residual willemite, which are not detected by XRD analysis because of their inhomogeneity and small content. A scanning electron microscopy image shown at position 1 of Figure 17a is accompanied by a higher-resolution, enlarged view (Figure 17b). As observed, the microstructure of residual willemite concentrate presents a porous surface generated by the acid leaching. This phenomenon is similar to the analysis (Figure 8) of leaching residue from the acid leaching of artificial willemite. These findings confirmed that there is a solid layer called the “ash” layer, which consists of insoluble solid product, existing on the surface of the unreacted core.

3.4. High-Temperature Leaching Reaction of Willemite with Sulfuric Acid

It is well known that the direct leaching of willemite with sulfuric acid can be described by the following equation [2,10,17]:
Zn2SiO4(s) + 2H2SO4(aq) → 2ZnSO4(aq) + Si(OH)4(aq)
The monosilicic acid (Si(OH)4) produced in Equation (16) polymerizes over time to produce polysilicic acid, forming a gel [12] which impairs or totally disrupts pulp filtration and limits the mobility of liquid relative to solid phase in the pulp, leading to the reduction of zinc extraction in the solution.
The results presented above show that silicon present in the synthetic willemite is dissolved in the solution and is transformed into silicic acid. However, the polymerization reaction of silicic acid does not seem to occur in this study. The characteristic changes of the sample before and after leaching studied by SEM/EDS and XRD (Figure 1, Figure 3 and Figure 8) indicate that under high temperature, the crystalline silicon dioxide can be precipitated from the solution by the following equation:
Si(OH)4(aq) = SiO2(s, crystalline) + 2H2O(g)
Combining the XRD analysis (Figure 3), the silicon dioxide can be referred to as cristobalite. On the basis of the results mentioned above, the final reaction equation for willemite in a high-temperature and sulfuric acid leaching system is determined and is represented by the following equation:
Zn2SiO4(s) + 2H2SO4(aq) → 2ZnSO4(aq) + SiO2(s, cristobalite) + 2H2O(g).

4. Conclusions

In this study, the leaching kinetics of artificial willemite in low-sulfuric-acid solution were investigated under high temperature. It was found that the leaching rate increased with increasing sulfuric acid concentration and temperature and decreasing particle size and that above 450 rpm, the reaction rate was independent of agitation speed, which indicates that the reaction was not controlled by the diffusion in liquid phase. A variant of the grain mode, together with the shrinking core model, was used to represent the reaction of each grain was proposed for artificial willemite leaching under the studied conditions. The kinetic model took into consideration the change in sulfuric acid concentration during leaching. This model succeeded in describing the kinetic data obtained in this study, which indicates that the leaching process followed the grain model with the product layer diffusion as the main rate-controlling step. The apparent activation energy of the reaction was found to be 22.06 KJ/mol, and the reaction order with respect to sulfuric acid concentration was 1.6472.

Author Contributions

Conceptualization, H.X., Q.Z. and C.W.; data curation, H.X., Y.Q. and J.X.; formal analysis, H.X. and Q.W.; investigation, H.X. and Y.Q.; methodology, Y.Q. and B.Z.; project administration, F.R.; resources, Q.Z. and C.W.; validation, H.X. and Y.Q.; visualization, W.Z. and J.W.; writing—original draft preparation, H.X.; writing—review and editing, Q.Z. and Q.W. All authors have read and agreed to the published version of the manuscript.

Funding

This research was funded by the National Nature Science Foundation of China (51902141), the Natural Science Foundation of Jiangsu Province (BK20181041, BK20191038), the Applied Fundamental Research Project of Changzhou (CJ20210072), the Postgraduate Practice and Innovation Program of Jiangsu University of Technology (XSJCX22_79), and the Teaching Reform and Research Project of Jiangsu University of Technology (11610412036).

Institutional Review Board Statement

Not applicable.

Informed Consent Statement

Not applicable.

Data Availability Statement

Not applicable.

Acknowledgments

The authors would like to thank the Analysis and Testing Centers of Jiangsu University of Technology for the grant of technical support.

Conflicts of Interest

The authors declare no conflict of interest.

References

  1. Guo, X.Y.; Zhong, J.Y.; Song, Y.; Tian, Q.H. Substance flow analysis of zinc in China. Res. Conserv. Recycl. 2010, 54, 171–177. [Google Scholar] [CrossRef]
  2. Abdel-Aal, E.A. Kinetics of sulfuric acid leaching of low-grade zinc silicate ore. Hydrometallurgy 2000, 55, 247–254. [Google Scholar] [CrossRef]
  3. Shi, D.M.; Yang, A. Flotation of Oxidized Lead and Zinc Ores; Yunnan Science and Technology Press: Kun Ming, China, 1996; (In Chinese). ISBN 7541606391. [Google Scholar]
  4. Duan, X.M.; Lou, L. Review on present situation of the flotation of oxidized zinc ore. Min. Metall. 2000, 9, 47–51. (In Chinese) [Google Scholar]
  5. Espiari, S.; Rashchi, F.; Sadrnezhad, S.K. Hydrometallurgical treatment of tailings with high zinc content. Hydrometallurgy 2006, 82, 54–62. [Google Scholar] [CrossRef]
  6. Wei, X.Y.; Han, J.W.; Wang, Y.W.; Huang, R.; Gao, X.S.; Qin, W.Q. Sulfurization transformation behavior and phase transformation mechanism of willemite. Chin. J. Nonferrous Met. 2021, 1–17. Available online: http://kns.cnki.net/kcms/detail/43.1238.TG.20211216.1346.001.html (accessed on 19 October 2022). (In Chinese) [CrossRef]
  7. Zhang, Y.; Hua, Y.; Gao, X.; Xu, C.; Li, J.; Li, Y.; Zhang, Q.; Xiong, L.; Su, Z.; Wang, M.; et al. Recovery of zinc from a low-grade zinc oxide ore with high silicon by sulfuric acid curing and water leaching. Hydrometallurgy 2016, 166, 16–21. [Google Scholar] [CrossRef]
  8. Frenay, J. Leaching of oxidized zinc ores in various media. Hydrometallurgy 1985, 15, 243–253. [Google Scholar] [CrossRef]
  9. Zhao, Y.; Stanforth, R. Production of Zn Powder by Alkaline Treatment of Smithsonite Zn-Pb Ores. Hydrometallurgy 2000, 56, 237–249. [Google Scholar] [CrossRef]
  10. Souza, A.D.; Pina, P.S.; Lima, E.V.O.; da Silva, C.A.; Leão, V.A. Kinetics of sulphuric acid leaching of a zinc silicate calcine. Hydrometallurgy 2007, 89, 337–345. [Google Scholar] [CrossRef]
  11. Bodas, M.G. Hydrometallurgical treatment of zinc silicate ore from Thailand. Hydrometallurgy 1996, 40, 37–49. [Google Scholar] [CrossRef]
  12. Iller, R.K. The Colloid Chemistry of Silica and Silicates; Cornell University Press: New York, NY, USA, 1955. [Google Scholar]
  13. Iller, R.K. Coagulation of colloidal silica by calcium ions: Mechanism and effect of particle size. J. Colloid Interface Sci. 1975, 53, 476–488. [Google Scholar] [CrossRef]
  14. Iller, R.K. The Chemistry of Silica Solubility, Polymerization, Colloid and Surface Properties, and Biochemistry; John Wiley & Sons: New York, NY, USA, 1979; ISBN 047102404X. [Google Scholar]
  15. Gnoinski, J. Skorpion zinc optimization and innovation. J. S. Afr. Inst. Min. Metall. 2007, 107, 657–662. [Google Scholar]
  16. Li, C.X.; Xu, H.S.; Deng, Z.G.; Li, X.B.; Li, M.T.; Wei, C. Pressure leaching of zinc silicate ore in sulfuric acid medium. Trans. Nonferrous Met. Soc. China 2010, 20, 918–923. [Google Scholar] [CrossRef]
  17. Terry, B.; Monhemius, A.J. Acid dissolution of willemite ((Zn, Mn)2SiO4) and hemimorphite (Zn4Si2O7(OH)2H2O). Metall. Mater. Trans. B 1983, 14, 335–346. [Google Scholar] [CrossRef]
  18. Souza, A.D.; Pina, P.S.; Santos, F.M.F.; da Silva, C.A.; Leão, V.A. Effect of iron in zinc silicate concentrate on leaching with sulphuric acid. Hydrometallurgy 2009, 95, 207–214. [Google Scholar] [CrossRef] [Green Version]
  19. Popovich, N.V.; Khristov, T.I.; Galaktionov, S.S. The sol-gel method of fabrication of zinc silicate luminophores. Glass Ceram. 1993, 50, 392–397. [Google Scholar] [CrossRef]
  20. Takesue, M.; Hayashi, H.; Smith, R.L., Jr. Thermal and chemical methods for producing zinc silicate (willemite): A review. Prog. Cryst. Growth Charact. Mater. 2009, 55, 98–124. [Google Scholar] [CrossRef]
  21. Sogabe, N.; Ikenobu, S.; Nishiyama, F.; Sakata, Y.; Kawahara, M. Precipitation of silica in zinc refining process. In Lead-Zinc 2010; Siegmund, A., Centomo, L., Geenen, C., Piret, N., Richards, G., Stephens, R., Eds.; John Wiley & Sons: New York, NY, USA, 2010; pp. 553–563. [Google Scholar]
  22. Georgiou, D.; Papangelakis, V.G. Sulphuric acid pressure leaching of a limonitic laterite: Chemistry and kinetics. Hydrometallurgy 1998, 49, 23–46. [Google Scholar] [CrossRef]
  23. Sohn, H.Y.; Szekely, J. A structural model for gas-solid reactions with a moving boundary III: A general dimensionless representation of the irreversible reaction between a porous solid and a reactant gas. Chem. Eng. Sci. 1972, 27, 763–778. [Google Scholar] [CrossRef]
  24. Sohn, H.Y.; Szekely, J. The effect of intragrain diffusion on the reaction between a porous solid and a gas. Chem. Eng. Sci. 1974, 29, 630–634. [Google Scholar] [CrossRef]
  25. Sohn, H.Y.; Wadsworth, M.E. Rate Processes of Extractive Metallurgy; Plenum Press: New York, NY, USA, 1979. [Google Scholar]
  26. Levenspiel, O. Chemical Reaction Engineering, 3rd ed.; John Wiley & Sons: New York, NY, USA, 1999. [Google Scholar]
Figure 1. SEM image (a) and EDS analysis (b) of the unreacted sample particles.
Metals 12 02031 g001
Figure 2. Effect of leaching time on zinc extraction (particle size −57 + 53 μm, sulfuric acid concentration 1.0 g/L, agitation speed 800 rpm, and temperature 393 K).
Metals 12 02031 g002
Figure 3. XRD patterns of the sample before leaching and after leaching of different durations (conditions as per Figure 2).
Metals 12 02031 g003
Figure 4. Effect of agitation speed on zinc extraction (conditions as per Figure 2).
Metals 12 02031 g004
Figure 5. Effect of particle size on zinc extraction (conditions as per Figure 2).
Metals 12 02031 g005
Figure 6. Effect of sulfuric acid concentration on zinc extraction (conditions as per Figure 2).
Metals 12 02031 g006
Figure 7. Effect of temperature on zinc extraction (conditions as per Figure 2).
Metals 12 02031 g007
Figure 8. SEM image and EDS analysis of leaching residue after 16 min leaching (conditions as per Figure 2).
Metals 12 02031 g008
Figure 9. Plot of ψ versus time for different particle sizes.
Metals 12 02031 g009
Figure 10. Plot of ψ versus time for different sulfuric acid concentrations.
Metals 12 02031 g010
Figure 11. Plot of ψ versus time for different agitation speeds.
Metals 12 02031 g011
Figure 12. Plot of ψ versus time for different temperatures.
Metals 12 02031 g012
Figure 13. Plot of kd against 1 r 0 2 ( 1 ε 0 ) .
Metals 12 02031 g013
Figure 14. Plot for the determination of reaction order with respect to sulfuric acid concentration.
Metals 12 02031 g014
Figure 15. Arrhenius plot.
Metals 12 02031 g015
Figure 16. XRD pattern of leaching residue from the experiment No. 2.
Metals 12 02031 g016
Figure 17. SEM images ((a) ×200 times and (b) ×5000 times) and EDS patterns of leaching residue from the experiment No. 2 (1-residual willemite, 2-franklinite, 3-quartz).
Metals 12 02031 g017
Table 1. Chemical analysis, surface area, and De/Dg values of each size fraction from artificial willemite.
Size Fraction
(μm)
Zn
(%)
SiO2
(%)
Surface Area (m2/g)Total Pore
Volume
(mm3/g)
Pore Average
Diameter (Å)
Initial Porosity (ε0) of Particle (%) D e D g   ( × 10 4 )
−246 + 14748.734.80.4591.116.100.440.96~3.8
−147 + 9849.136.10.4310.915.970.360.37~1.5
−98 + 7449.535.40.4691.016.130.40.15~0.6
−74 + 5749.336.50.5691.017.940.40.087~0.35
−57 + 5349.535.90.6441.019.530.40.078~0.31
Table 2. Correlation coefficient values of different models at different temperatures.
Temp.
(K)
Kinetics Expression
1 ( 1 x ) 1 3   1 3 ( 1 x ) 2 3 + 2 ( 1 x )   ψ* ψ
3 min8 min3 min8 min8 min8 min
3730.91650.87990.98130.98350.9650.9982
3830.90460.82170.96940.94280.9280.9792
3930.91070.77190.97610.90250.90410.9701
4030.90520.8031(6min)0.98070.925(6min)0.9185(6min)0.9766(6min)
4130.89620.797(6min)0.98410.9252(6min)0.9216(6min)0.9791(6min)
: Assuming that the sulfuric acid concentration remains constant during leaching. : The sulfuric acid concentration changes as the reaction proceeds.
Table 3. Chemical components of willemite concentrate and leaching residue under the optimal conditions studied.
Experiment No.1234AverageWillemite Concentrate
Chemical composition of leaching residue (wt.%)Zn2.151.631.971.741.8743.96
Fe2.131.892.061.952.011.23
Pb0.941.131.031.21.070.78
As<0.1<0.1<0.1<0.1<0.1<0.1
SiO277.0475.676.374.6975.938.9
Al2O31.091.221.181.271.190.91
K2O0.530.520.420.480.491.06
MgO0.20.220.230.220.220.27
CaO2.262.32.042.12.21.22
Publisher’s Note: MDPI stays neutral with regard to jurisdictional claims in published maps and institutional affiliations.

