Article

Structural Phase Transformation of Rail Steel in Compression

1
Department of Natural Sciences, Siberian State Industrial University, Novokuznetsk 654007, Russia
2
Plasma Emission Electronics Laboratory, Institute of High Current Electronics of the Siberian Branch of the Russian Academy of Sciences, Tomsk 634055, Russia
3
School of Engineering and Innovation, The Open University, Walton Hall, Milton Keynes MK7 6AA, UK
4
Department of Natural Sciences, T.F. Gorbachev Kuzbass State Technical University, Prokopyevsk Branch, Prokopyevsk 653039, Russia
*
Author to whom correspondence should be addressed.
Metals 2022, 12(11), 1985; https://doi.org/10.3390/met12111985
Submission received: 31 October 2022 / Revised: 16 November 2022 / Accepted: 18 November 2022 / Published: 20 November 2022
(This article belongs to the Special Issue Deformation of Metals and Alloys: Theory, Simulations and Experiments)

Abstract

:
The analysis of structure and defective substructure of rail steel in uniaxial compression to a degree of 50% is carried out. It is revealed that cold hardening has a multi-stage character and is accompanied by fragmentations of pearlite grains which is in field as the degree of deformation increases and reaches ≈ 0.4 volume of the foil studied at ε = 50%. The fragments being formed in ferrite plates are separated by low-angle boundaries. The average size of the fragmented ferrite decreases from 240 nm at ε = 15% to 200 nm at ε = 50%. Concurrently with the ferrite fragmentation, fragments of cementite are also observed. It is found that the sizes of the cementite fragments are in a range of 15 to 20 nm and depend weakly on the degree of sample deformation. The cementite fragmentation is caused by deformation-induced carbon dissolution and dislocation-induced fracture. The carbon atoms diffuse from cementite crystal to dislocations, which move through an interplanar space to form particles of tertiary cementite at nanoscale (2–4 nm). It is found that the increase in the degree of deformation is accompanied by a decrease in the scalar and an excess dislocation density. A physical interpretation of the observations has been given.

1. Introduction

Railway networks have increased consistently over the past decades. The share of railway transport accounts for significant rail freight turnover and passenger traffic. The continuous increase in the requirements for rail reliability under conditions of high axle loads and speeds necessitates the study of the rail’s behavior during long-term operation and the analysis of possible reasons for their replacement [1]. It seems possible to study the nature and evolution of structural-phase changes to rail steel during operation based on the analysis of the deformation behavior of metals under conditions of severe plastic deformation [2,3,4,5]. Under various types and modes of plastic deformation in crystalline materials with different types of crystal lattice, the fundamental phenomenon of fragmentation is observed, i.e., the deformation refinement of the structure down to 100–200 nm [6,7,8].
Rails are an important strategic product. The evolution of the structure and properties of the rails during plastic deformation is an important scientific and technical problem [9,10,11,12,13,14]. During tensile tests, three different types of slip bands were found in pearlitic steels [10]. These are formed as a result of shear deformation in pearlite colonies, at the interfaces of pearlite colonies, and at the ferrite/cementite interface. The application of the tensile test method to C70 pearlitic steel, together with X-ray diffraction analysis, shows that a 1.5-fold decrease in the interlamellar distance leads to an almost twofold increase in the critical shear stress in ferrite [11]. A micro compression test reveals a correlation between strain hardening, the evolution of the size of the coherent scattering region, and the dislocation density [12]. It was shown in [13] that the destruction of the pearlite structure in 9KhF steel during deformation by rolling and impact loading depends little on the loading conditions and begins with the initiation of microcracks in places of locally high stresses—along the “α-phase—cementite” interfaces. Under conditions of cyclic tensile-compressive deformation in pearlitic steel [14], cyclic softening occurred, which was presumably caused by the softening of the ferrite phase due to the reversible motion of dislocations.
Despite the difference in the deformation schemes, the general mechanisms for the formation and evolution of rail steel nanostructures during plastic deformation are the deformation-induced decomposition of cementite under the action of shear stresses, and the subsequent formation of nanosized tertiary cementite as a result of the migration of carbon atoms [15,16].
Thus, knowledge of regularities in the formation of structural-phase states and the properties of steel with a pearlite structure under various types of plastic deformation is necessary to control the process of strain hardening. In the current work, an analysis of the evolution of the structural-phase states of rail steel under plastic deformation by compression is carried out.

2. Materials and Methods

The material studied was DT 350 category rail samples of JSC ‘EVRAZ—West Siberian Metallurgical Plant’ (EVRAZ plc, Novokuznetsk, Russia) production, manufactured from a head of rails fabricated from a vacuum electric steel E76HF according to the requirements of Technical Specifications TU0921-276-01124333-2021 (Table 1). The sample shapes were parallelepiped with sizes 10 × 5 × 5 mm. A uniaxial compressive deformation was performed at room temperature on a testing machine, Instron 3369 (Institute of High Current Electronics of the Siberian Branch of the Russian Academy of Sciences, Tomsk, Russia) with a loading speed of 1.2 mm/min.
A metal structure was studied using the method of transmission (a method using thin foils) electron diffraction microscopy (TEM) [17,18,19] (instrument JEOL JEM 2100F, Tomsk Polytechnic University, Tomsk, Russia). Foils were prepared by electrolytic thinning to a thickness of ~ 200 nm on plates cut using the electric spark method from a middle part of a column parallel to a loading surface. A structural phase state of steel subjected to 15%, 30%, and 50% deformation was analyzed.
A scalar dislocation density ρ of each type of dislocation substructure (DSS) was measured using the technique described in [17,18,19,20]. Its values were determined by the formula:
ρ = M t n 1 l 1 + n 2 l 2 , ( c m 2 )
where n1 and n2 are the numbers of dislocation crossings of horizontal and vertical lines of l1 and l2 lengths, respectively; M is the magnification of a microphotograph; and t is the foil thickness (~200 nm).
The average scalar dislocation thickness of a volume fraction for each type of dislocation substructure was determined by the formula:
ρ = i = 1 Z P V i ρ i , ( c m 2 )
where PVi is the volume fraction of the material occupied by the i-th type dislocation structure; Z is the amount of DSS types; and ρi is the scalar dislocation density in the i-th type dislocation substructure.
The excess dislocation density was detected using the disorientation gradient [20]:
ρ ± = 1 b φ λ , ( c m 2 )
where b is the Burgers vector of dislocations, χ = φ λ is the curvature-torsion of a crystal lattice which was determined by changing the angle of foil inclination φ in a microscope column using a goniometer and recording a displacement of the extinction contour λ .

3. Results

Figure 1a shows a stress-strain curve obtained in the uniaxial compression of a rail sample. As a rule, a change in the cross-sectional area of samples using a method of loading such as this is ignored. Therefore, the diagram presented should be considered a conditional diagram of compression. The steel samples under the compression tests did not achieve the stage of fracture (Figure 1a) i.e., the ultimate compressive strength for them was not able to be determined. It is explained by the fact that the steel studied deforms severely without failure and the samples flatten out.
On the deformation curve of rail steel (Figure 1a), one can distinguish the stage of elastic deformation (stage I) and stage II of plastic deformation with a parabolic functional dependence σ-ε. The dotted lines indicate the elastic limit of the material, equal to σ 0 = 900 930   M P a . The analysis of the curves of cold hardening of metals is based on the doctrine about a stage character of cold hardening which reflects an evolution of dislocation structure in the process of deformation [21,22].
In the majority of cases the following stages are distinguished [21,23,24]: a transient (T) stage following the elastic limit, demonstrating either a growth or a decrease in the coefficient of cold hardening; it is immediately followed by stage II, with a high constant or nearly constant high hardening; next, at stage III, the coefficient of cold hardening decreases; and finally, at stage IV follows with a very low and constant coefficient of hardening (Figure 1b).
A stage character of the plastic flow is related to changes in the hardening mechanism and thus with quantitatively different defective structures originating at consecutive stages of the deformation curve [20]. A scientific paper [21] demonstrated a relationship between the structural behavior of the hardening stage’s character with linear portions along the hardening curve treated at the coordinates σ = f (ε0.5). In the steel studied, the stage character of the material’s plastic flow was also detected along the cold hardening curve treated at the coordinates σ = f (ε0.2) (Figure 1b).
In the initial state, the following constituents were revealed in the structure studied using a morphological feature: the pearlite grains of lamellar morphology, the grains of a ferrite-carbide mixture (containing grains of degenerated pearlite), and the grains of structure-free ferrite (ferrite grains in whose volume there are no carbide-phase particles) [1]. The main type of steel structure studied was pearlite grains whose relative content in the material was ≈0.7; the relative content of the grains of the ferrite-carbide mixture was ≈ 0.26; the balance (≈ 0.04) were grains of structure-free ferrite. In the volume of all steel structural constituents, indicated above, a dislocation substructure in the form of chaotically distributed dislocations, or more rarely, dislocation networks were observed. The scalar dislocation density determined by the techniques [1720] in ferrite grains is 〈 ρ 〉 = 3.2⋅1010 cm−2; in pearlite grains it is 〈 ρ 〉 = 4.2⋅1010 cm−2.
Numerous transformations in the pearlite structure were observed. First, fragmentation intensified with a growing degree of deformation, reaching 0.37 of the foil volume at ε = 50%. A characteristic electron-microscope image of the pearlite structure being formed at the given degree of deformation is shown in Figure 2a. Fragments being formed in ferrite plates are divided using low-angle boundaries (Figure 2b boundaries are indicated by arrows). With an increase in the degree of deformation, the average sizes of fragments of ferrite plates decrease from 240 nm at ε = 15% to 200 nm at ε = 50%.
Simultaneously, with that in the ferrite plates, the fragments of cementite plates (Figure 3), whose sizes varied in a range between 15 and 20 nm and depend weakly on the degree of deformation, were observed.
Concurrent with the fragmentation, a failure of cementite plates was concurrently observed. The first mechanism of failure consisted of cutting the plates using mobile dislocations and carrying out carbon atoms, by them, to a stress field of dislocations [25,26]. The second mechanism consists of pulling the carbon atoms using dislocations from a cementite lattice due to a noticeable difference in the average binding energy of carbon atoms with dislocations (0.6 eV) and with iron atoms in the cementite lattice (0.4 eV) during the process of plastic deformation.
The carbon atoms, which migrated from the cementite crystal lattice to the dislocations, were carried out to an interplanar space and formed particles of a tertiary cementite (Figure 4). The sizes of the particles amounted to 2–4 nm.
A deformation of pearlite grains is accompanied by a transformation of the steel dislocation substructure. If in the initial steel structure, the dislocations were distributed quasi-uniformly through the volume of ferrite plates (Figure 5a) under deformation, the clusters of dislocations (Figure 5b) form around cementite particles.
It was detected that the increase in the degree of deformation was accompanied by a decrease in the scalar density of dislocations located in the volume of fragments (Table 2). This may be caused by an escape of a dislocation to low-angle boundaries in addition to their annihilation. Earlier a similar change in the dislocation substructure under deformation in fragments being formed was observed in the research [27,28,29].
Let us estimate the density of dislocations to form low-angle boundaries of fragments. It was shown that the density of dislocations can be calculated using low-angle boundaries using the following expression when the angle of boundary disorientation is known [17,18,19].
ρ b o u n d = 2 θ b d , ( c m 2 )
where θ is the angle of disorientation between fragments, b is the Burgers vector of dislocations in a low-angle boundary, and d is the average size of a fragment.
It is possible to determine the azimuthal component of the whole angle of disorientation using a corresponding microelectron diffraction pattern (Figure 6) based on the relation
θ = Δ R ,   r a d
where Δ is the value of the spreading of the diffraction maximum, and R is the length of the radius vector of the given reflection (Figure 6b).
Assuming b = 0.25 nm and the value of the average size of fragments d = 200 nm, it is obtained:
ρ b o u n d = 2 θ b d = 0.002   n m 2 = 2.0 10 11   c m 2 .
Taking into account that at ε = 50% a relative content of pearlite with a fragmented structure is around 0.37, finally, the density of dislocations concentrated in the low-angle boundaries of the fragments of steel studied can be obtained as follows:
ρ b o u n d = 0.37 2.0 10 11   c m 2 = 7.4 10 10   c m 2 .
With a fraction of convention, it is possible to consider it to be a dislocation density in the steel at ε = 50%, only this is not the scalar dislocation density.
A steel deformation is accompanied not only by pearlite fragmentation but also results in the formation of clusters of dislocations around cementite particles. The dislocation density in cementite particles is estimated using relation (1). For a steel structure shown in Figure 7 with M = 44⋅104 and t = 200⋅10−7 cm, one obtains
ρ = 9.8 10 10 c m 2 .
Considering that the pearlite content with a fragmented structure is 0.37, suppose that the remaining part of the steel structure (0.63) is occupied by particles surrounded by dislocations, similar to Figure 7. In this case, the scalar dislocation density in steel at ε = 50% amounts to
ρ = 0.63 9.8 10 10   c m 2 = 6.2 10 10   c m 2 .
The analysis of the defective substructure of deformed steel using the methods of transmission electron microscopy has revealed bend extinction contours (Figure 8) in electron microscope images of the structure. Their presence indicates the curvature-torsion of a crystal lattice in the given area of the material, and therefore, in the internal stress fields, curving the thin foil, and correspondingly, strengthening the material [1,2].
By analyzing the bend extinction contours, it is possible to indicate the sources of internal stress fields i.e., to detect stress concentrators and estimate their relative value. As a result of the studies performed in this research, it is found that the sources of internal stress fields are the interfaces of grains and pearlite colonies (Figure 8a), cementite plates in pearlite grains (Figure 8b), and particles of the second phase (Figure 8b) located in the bulk of ferrite plates.
One of the characteristics of the curvature-torsion of a crystal lattice is the excess dislocation density ρ±. The estimation of ρ± has shown that it decreases with the increase in the degree of steel deformation, similar to the value of scalar dislocation density (Table 2). The lower values ρ± in comparison with ρ might be related to the increase in the width of extinction contours, with a growth in the degree of deformation resulting in a decrease in fragment sizes.

4. Conclusions

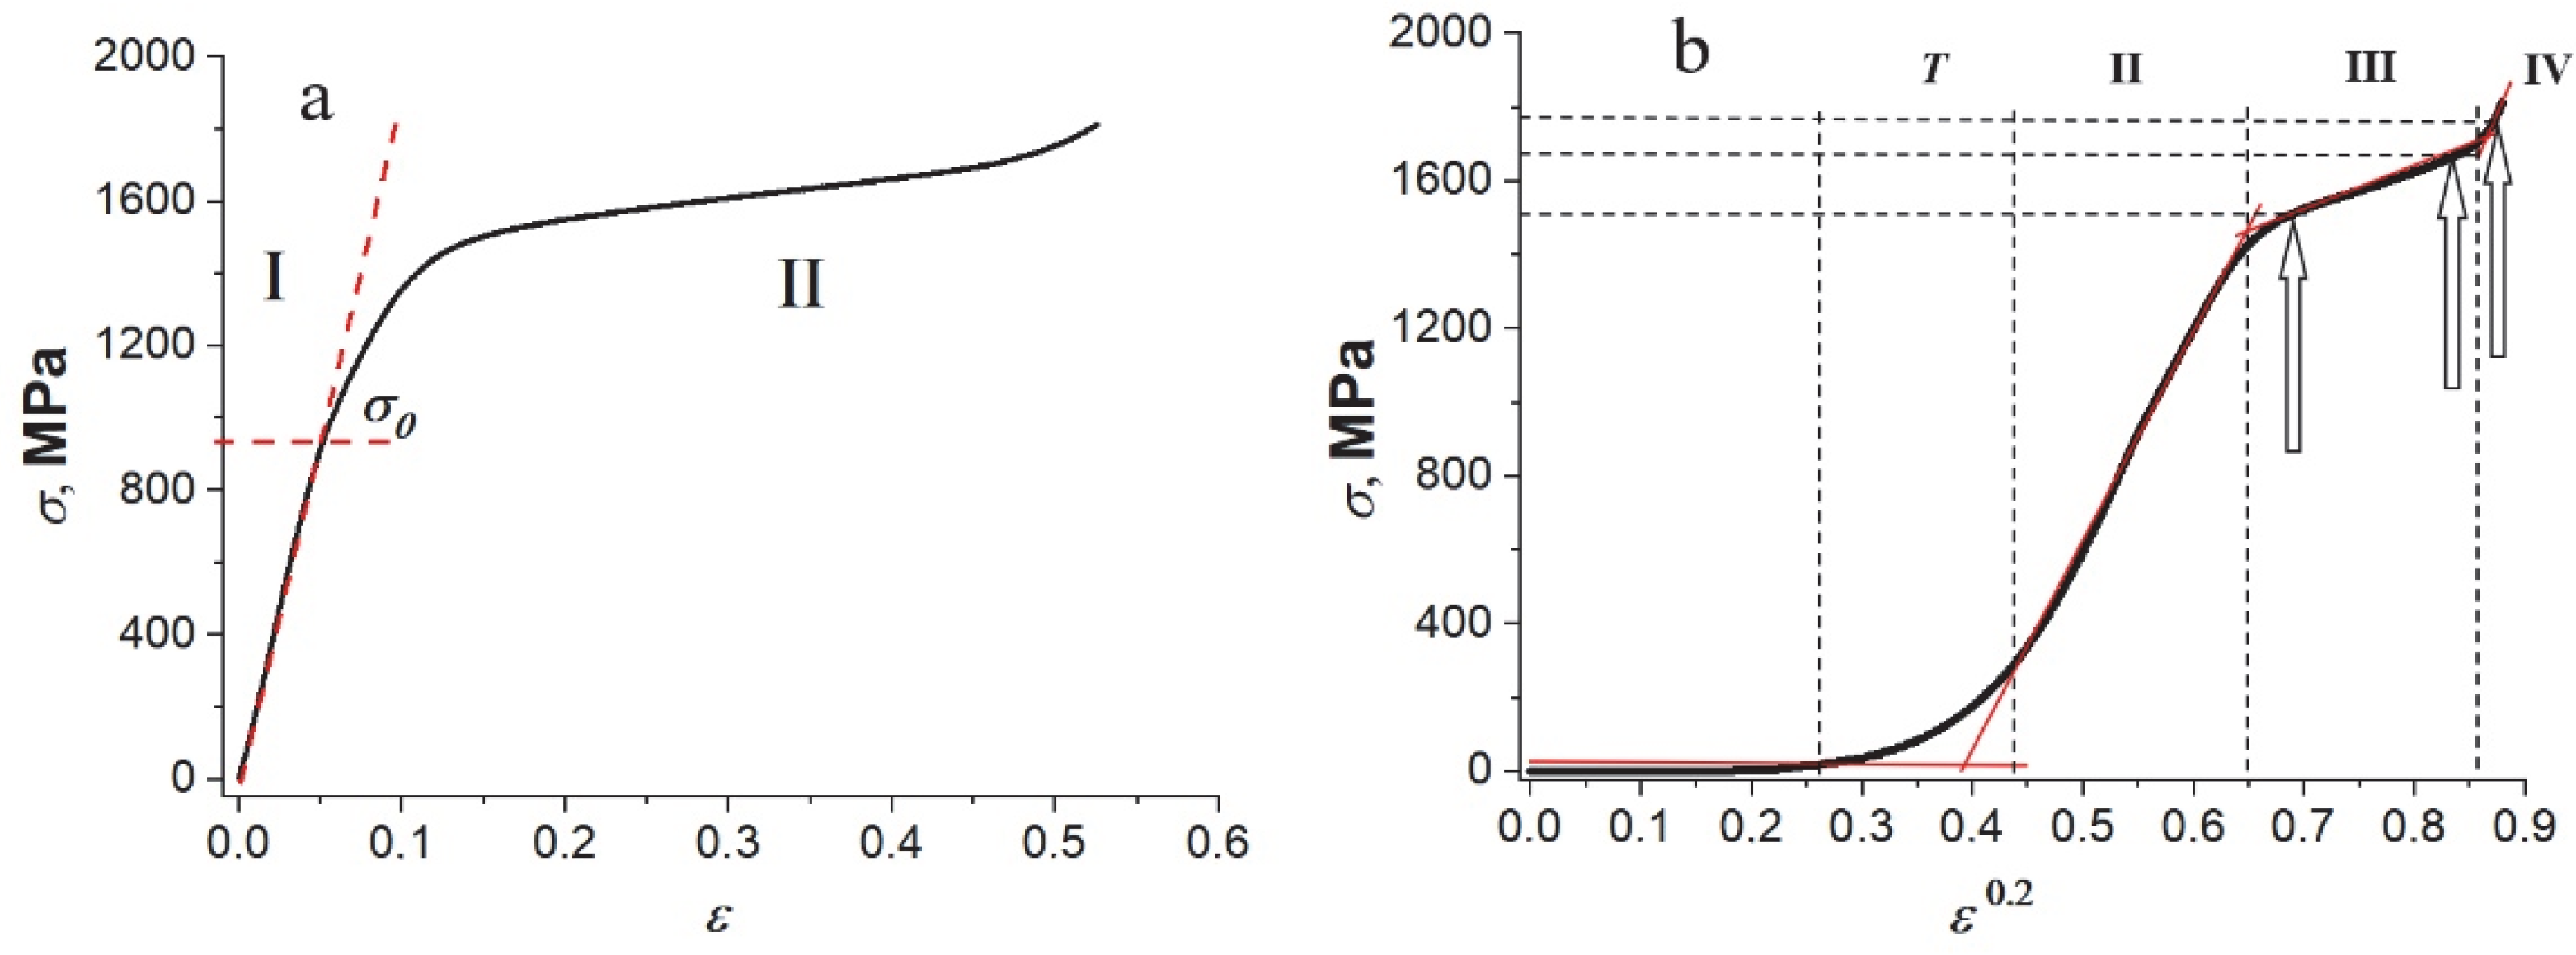
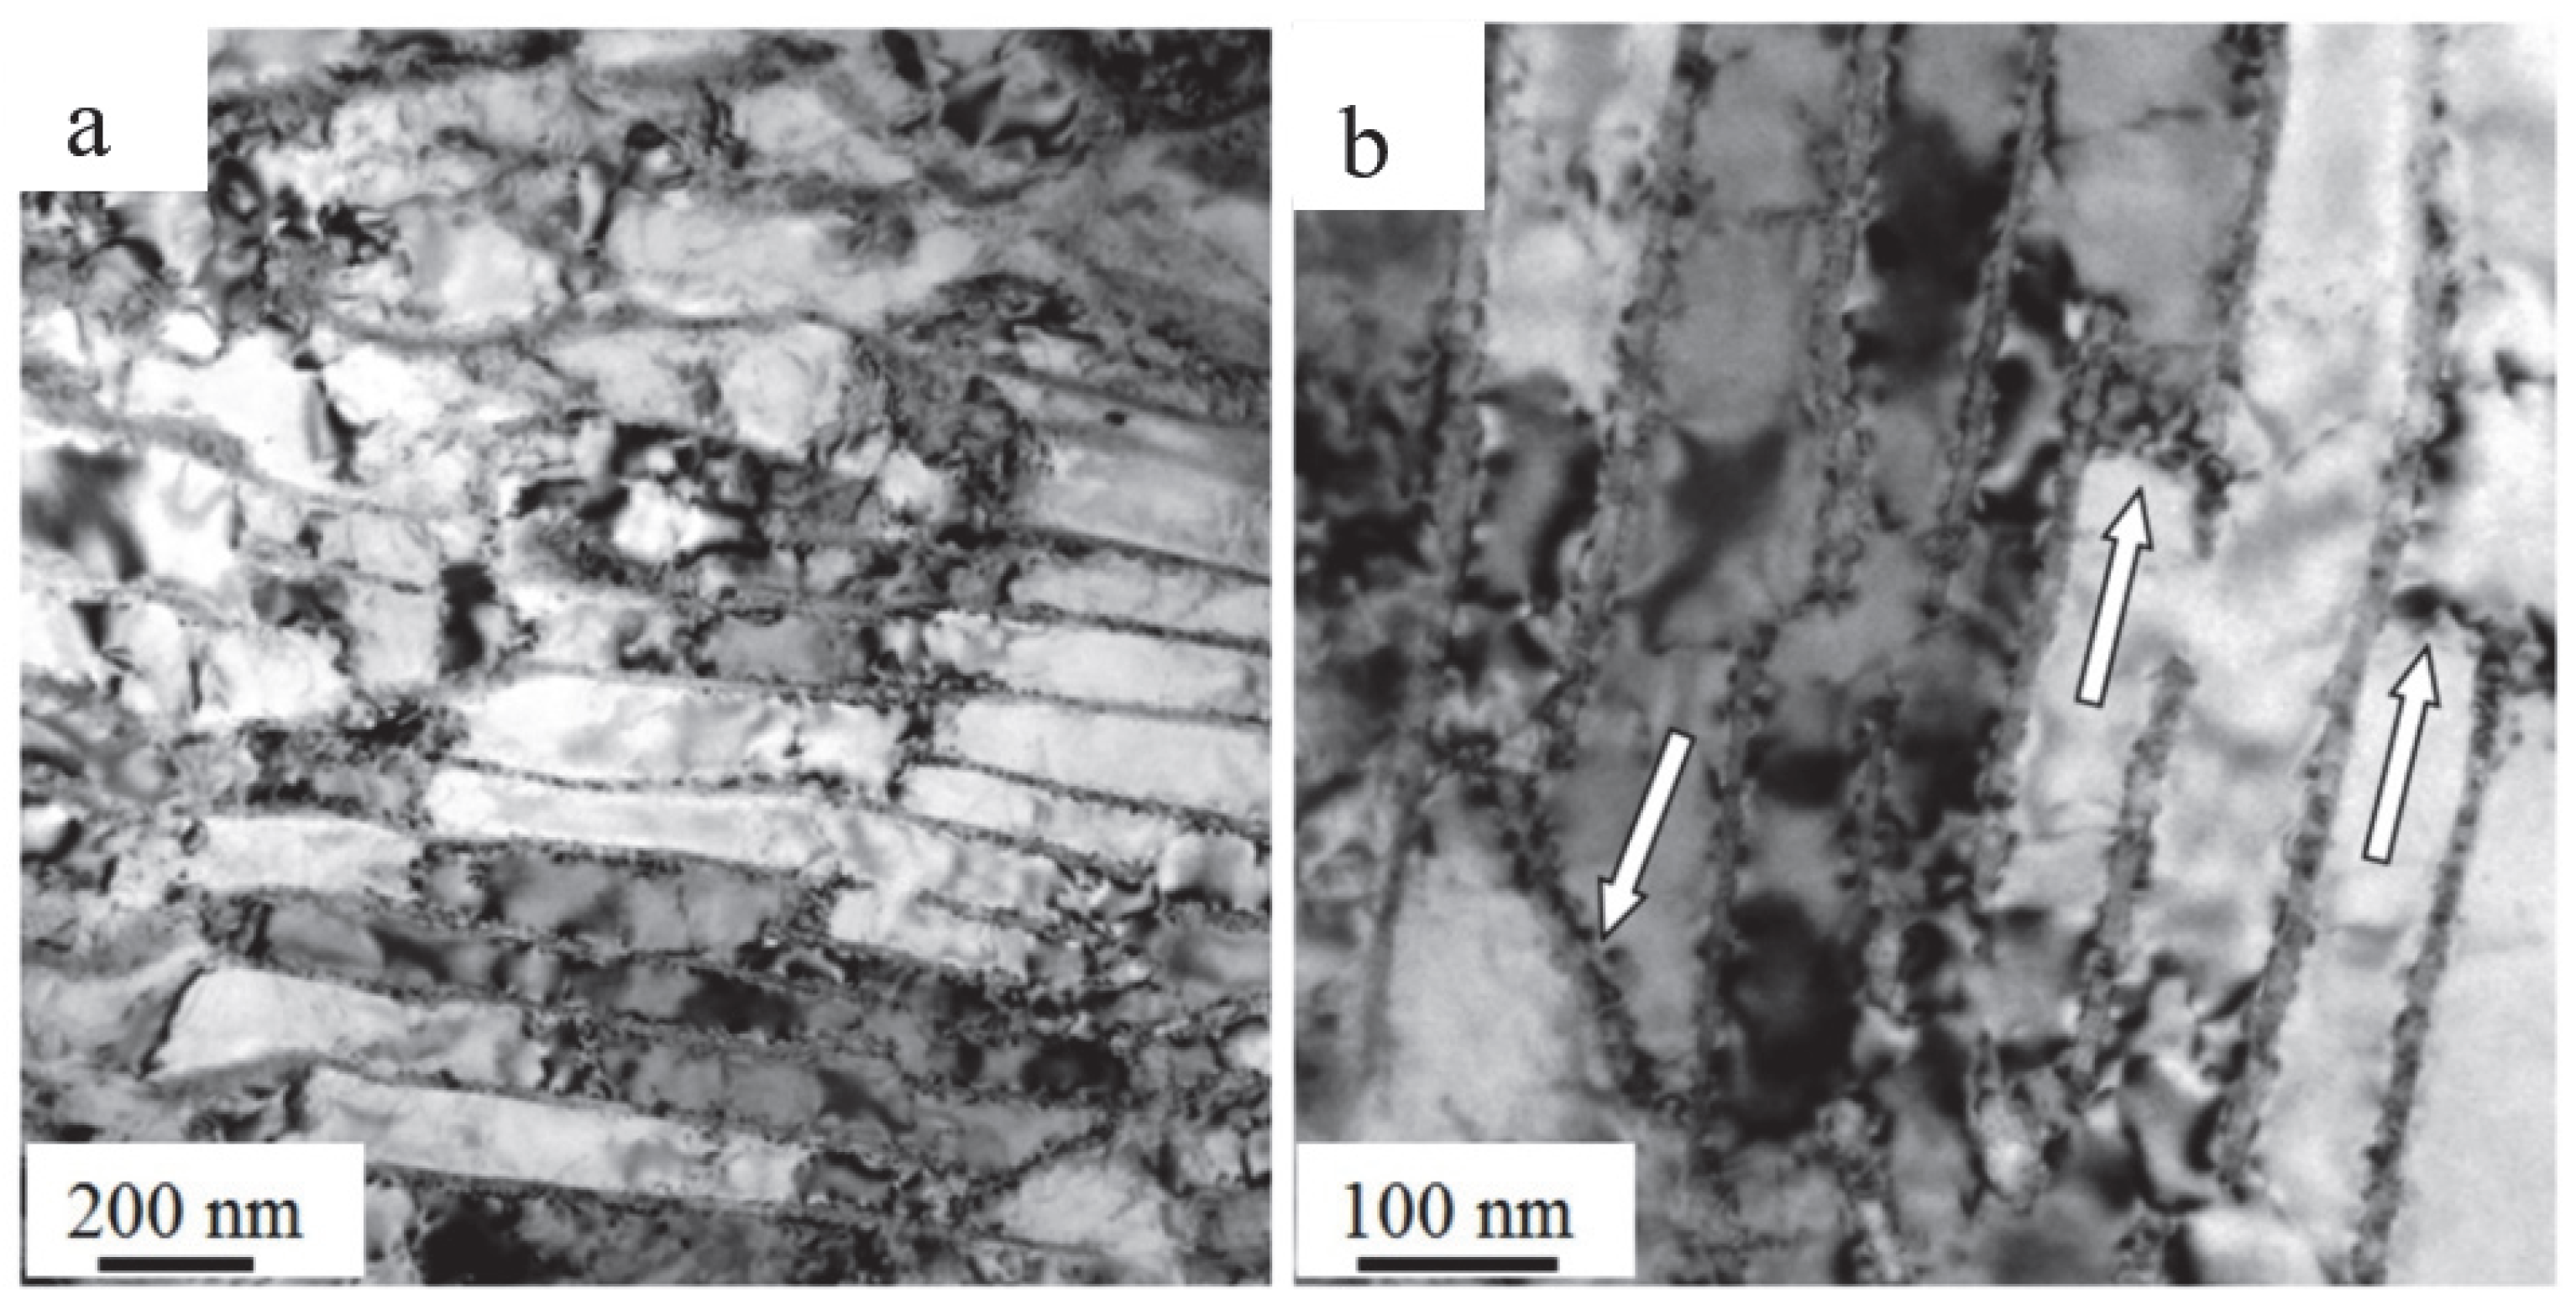
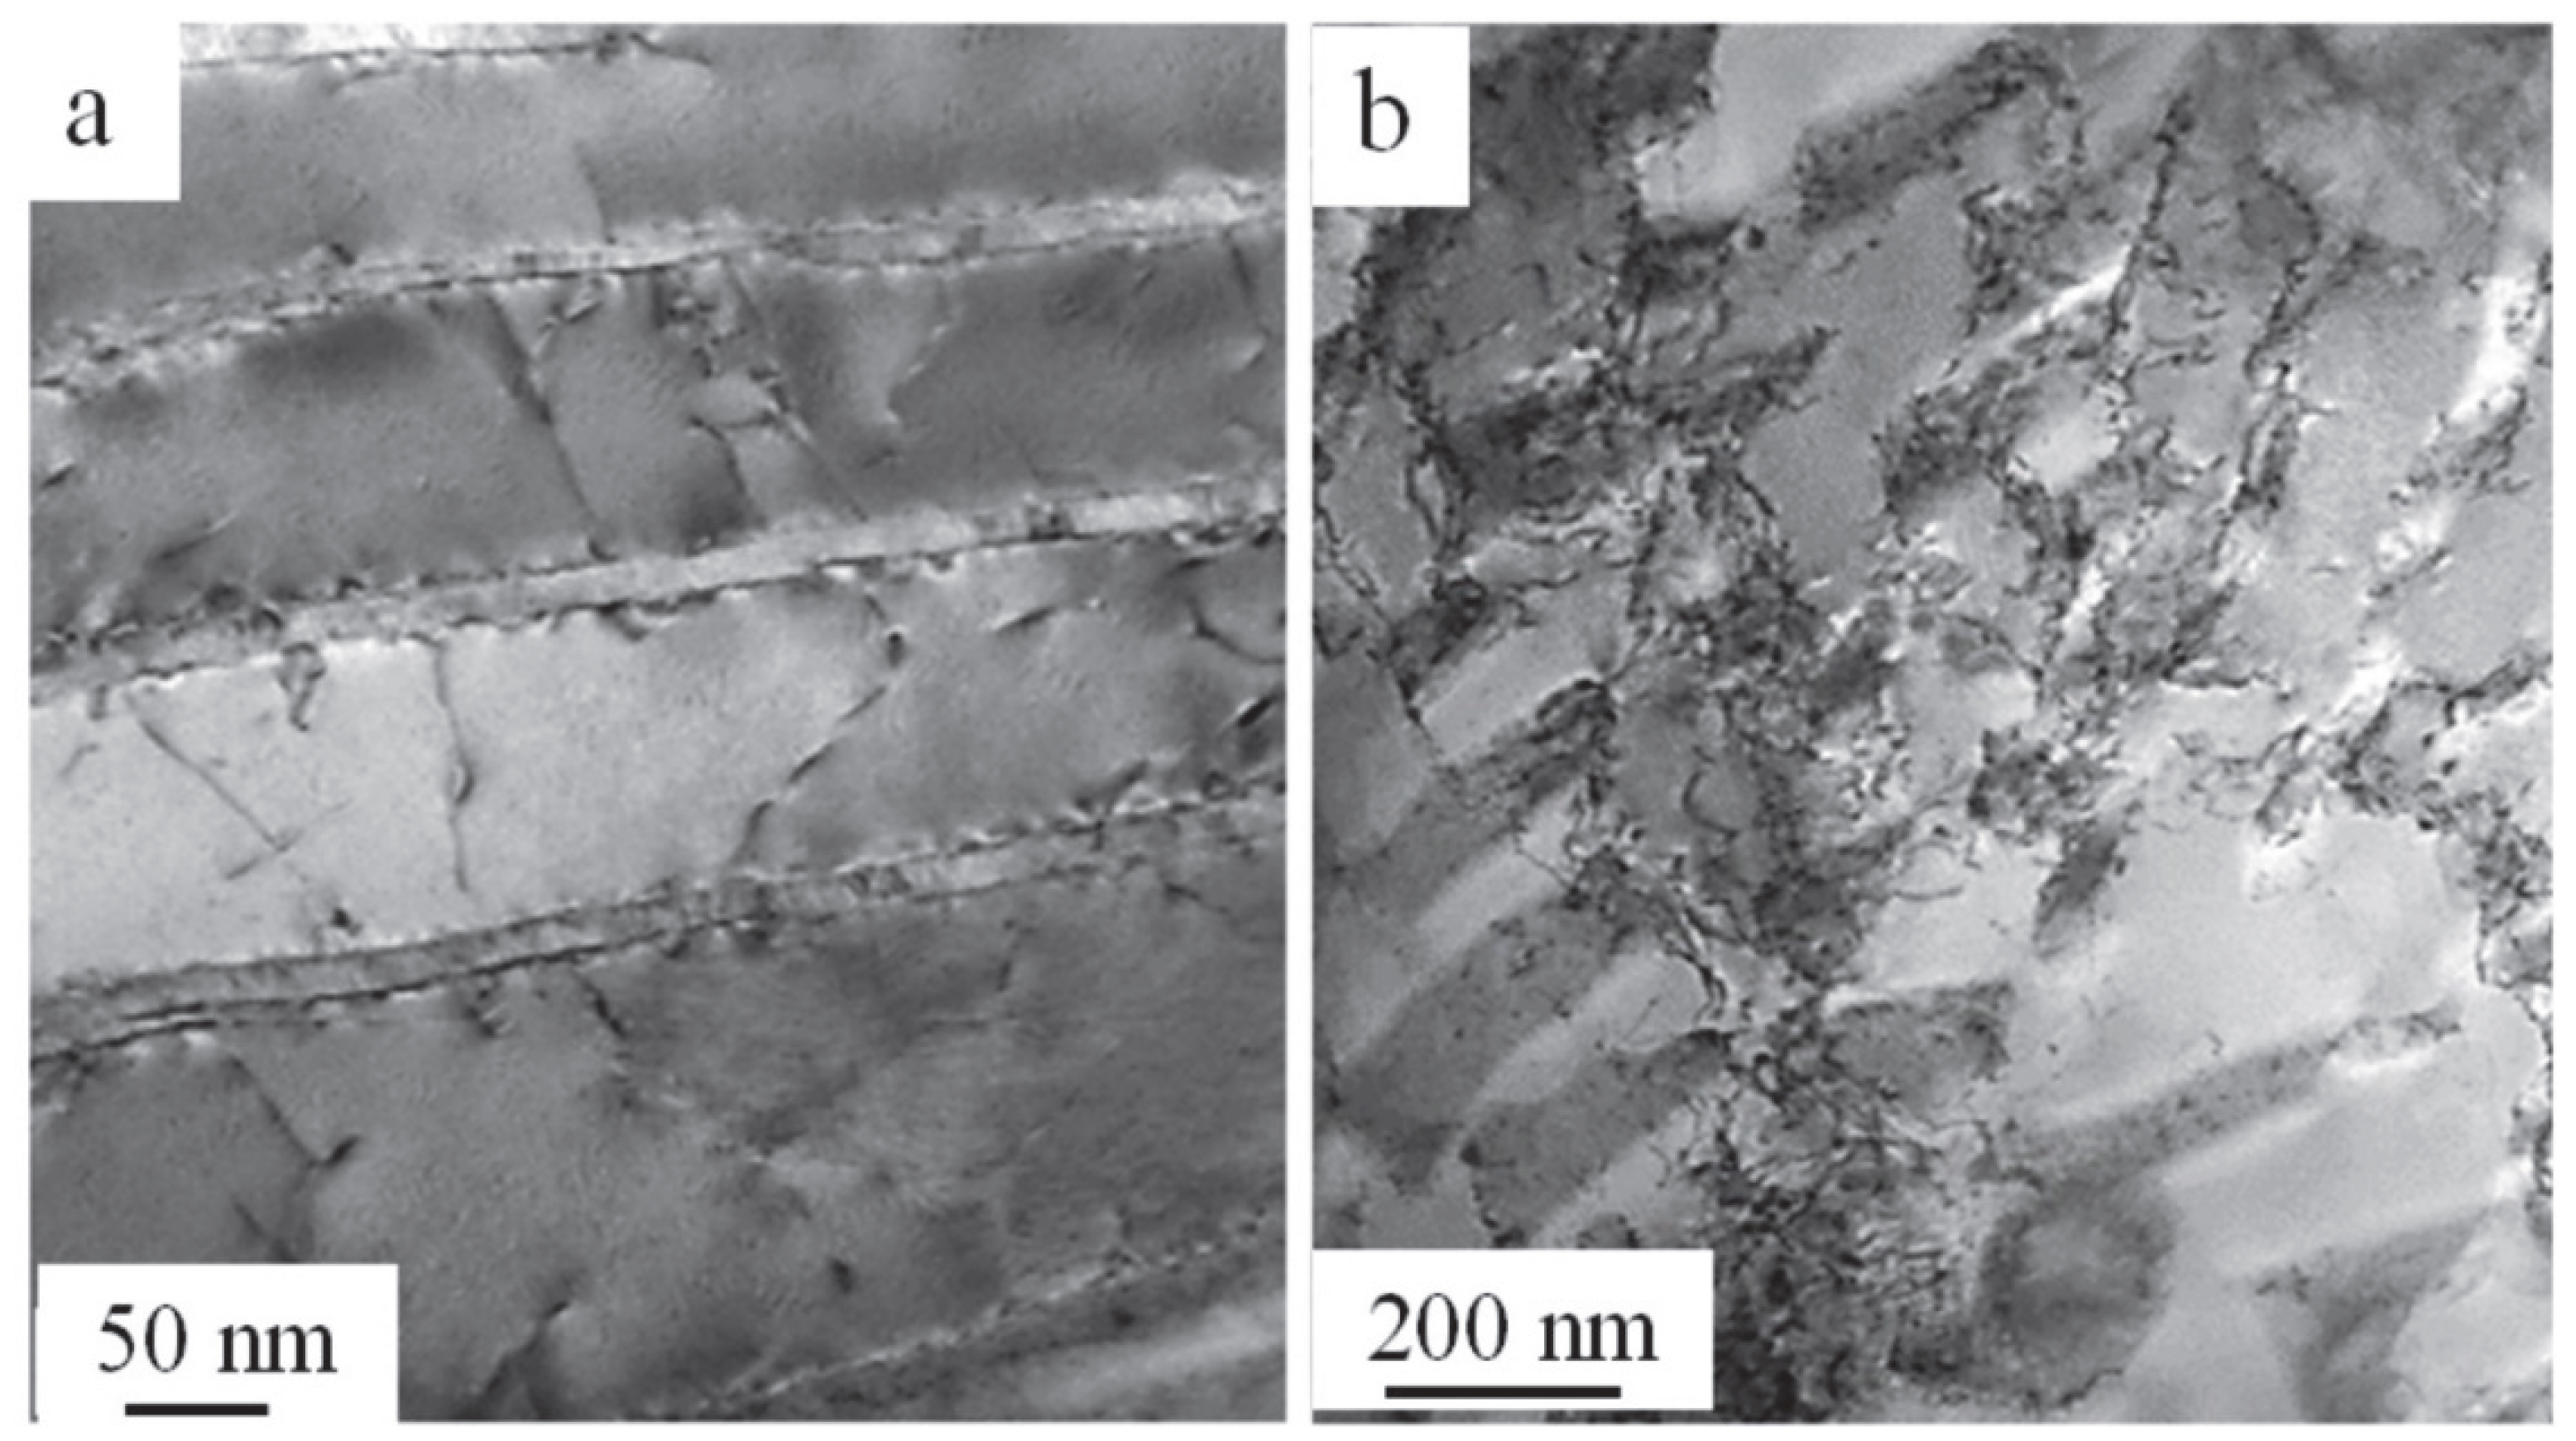
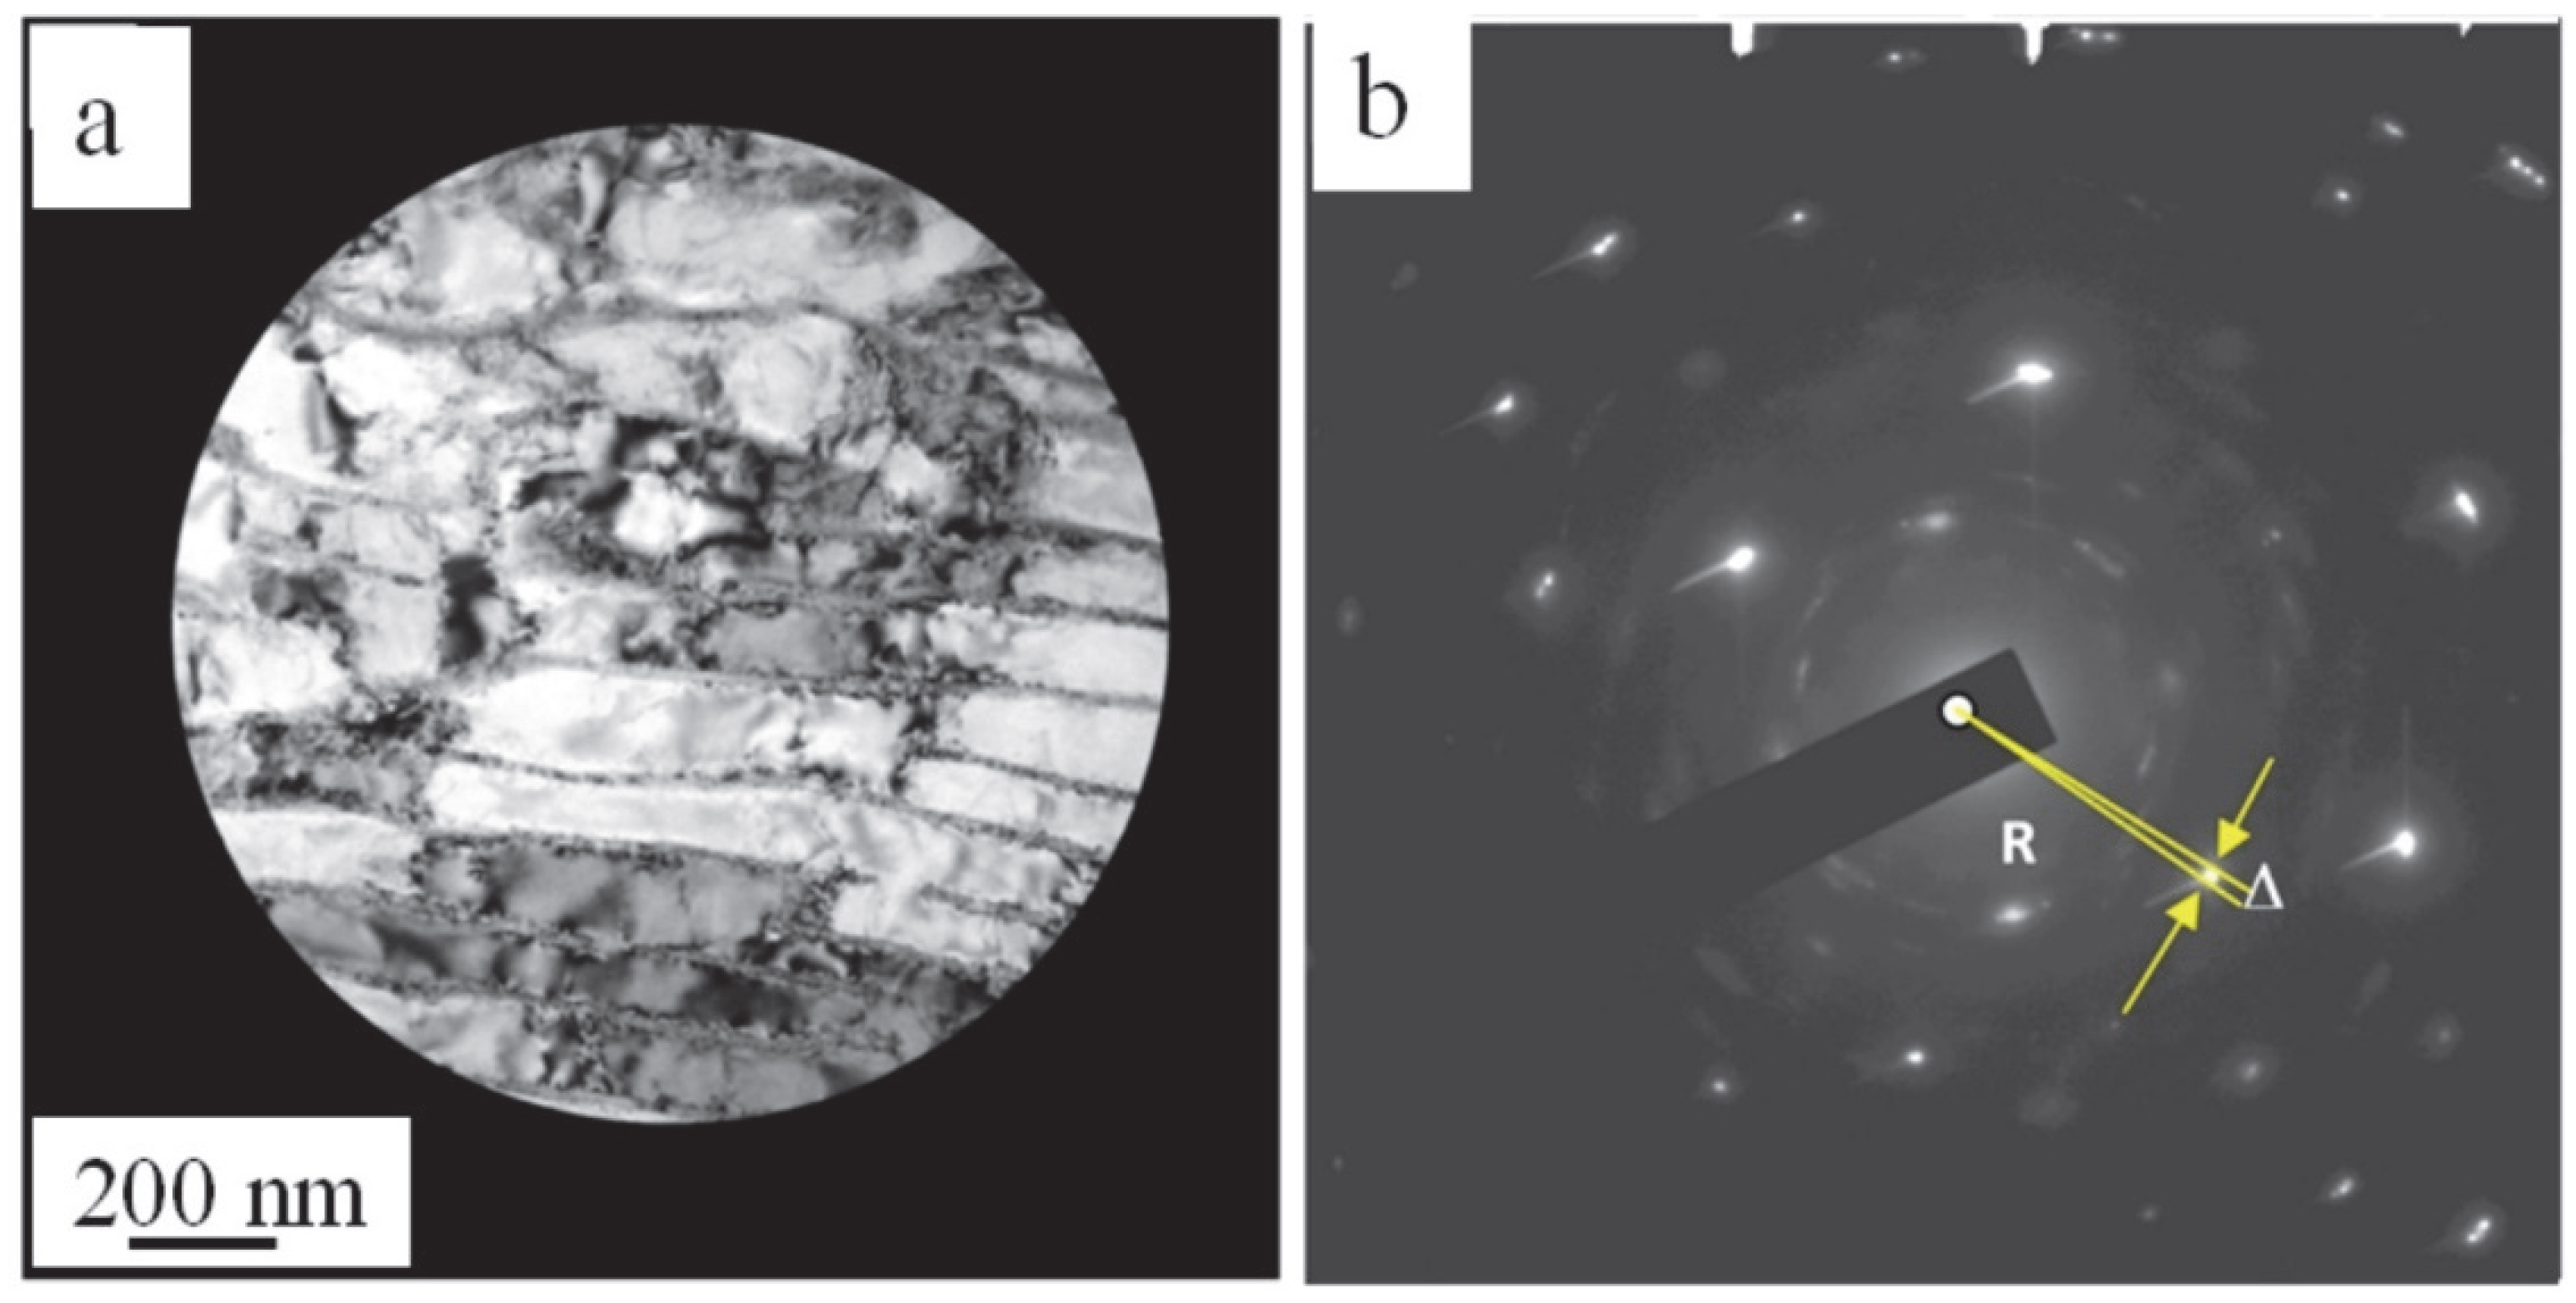
  • The analysis of the defective substructure evolution of rail steel has revealed that cold hardening has a multi-stage character. Steel deformation is accompanied by a fragmentation of pearlite grains which intensifies as the degree of deformation increases and reaches ≈ 0.4 of the material volume at ε = 50%. With the increase in the degree of deformation, the average size of the fragments of the ferrite plates decreases, from 240 nm at ε = 15% to 200 nm at ε = 50%.
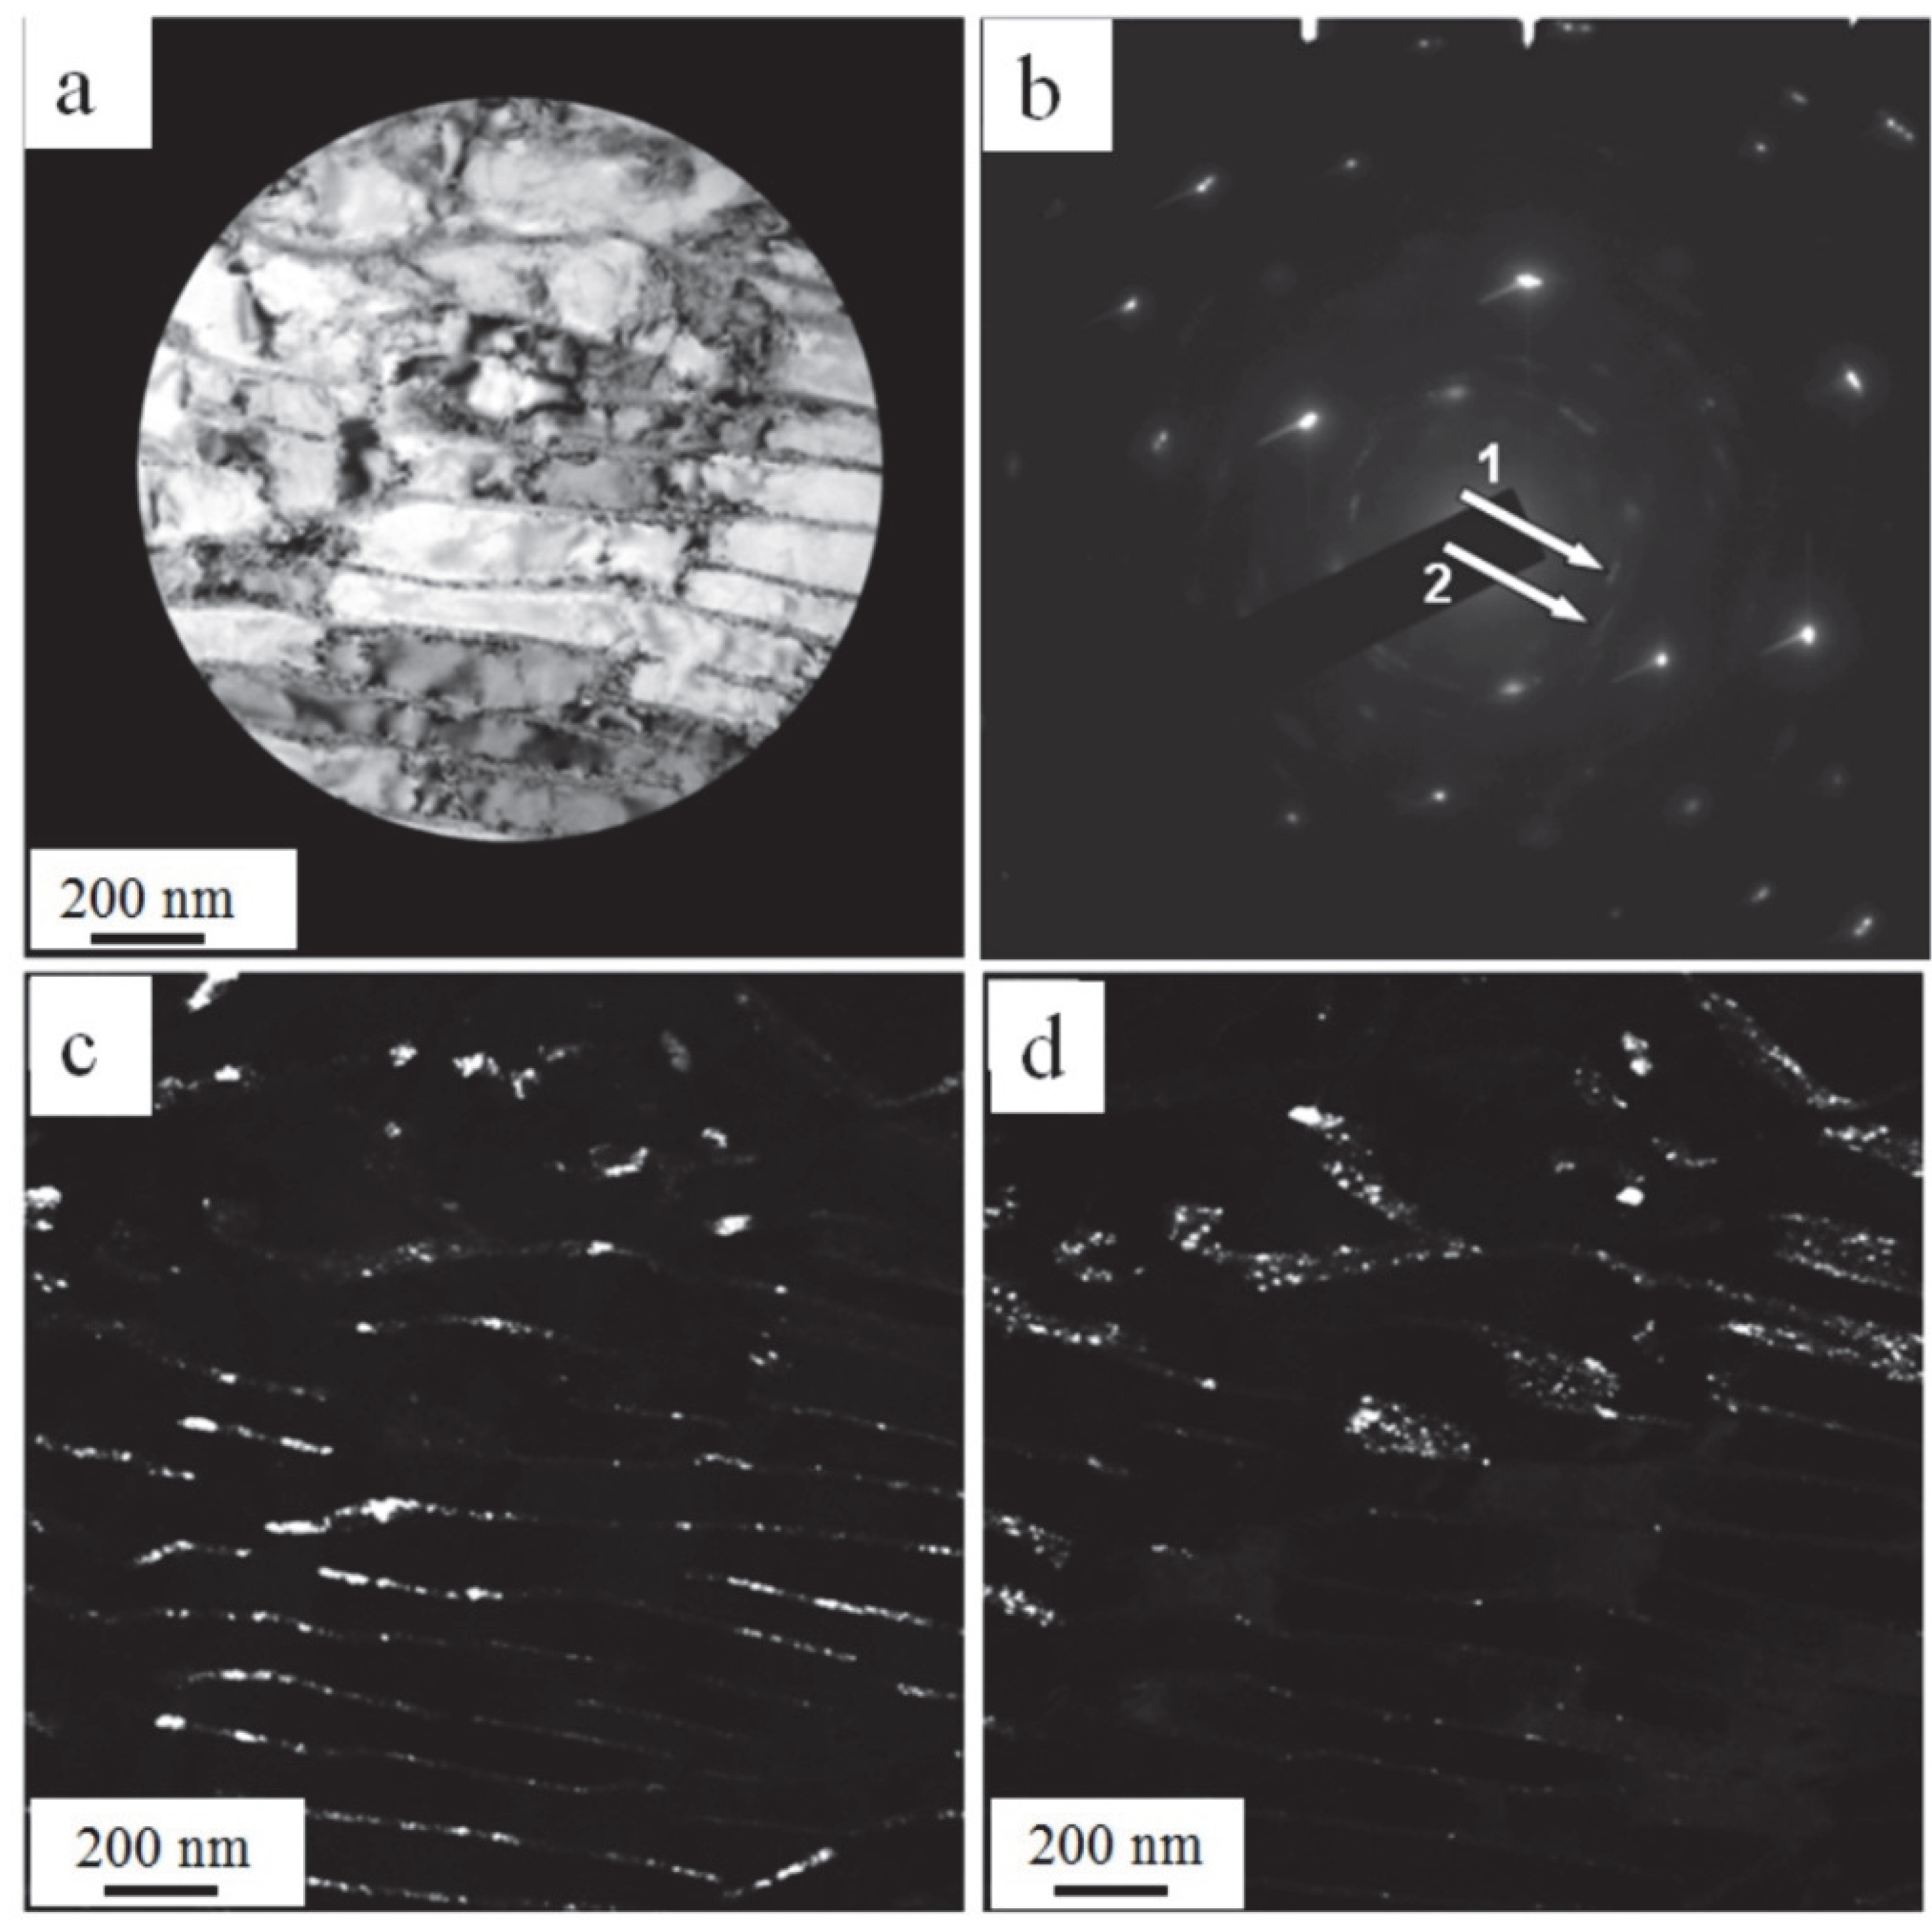
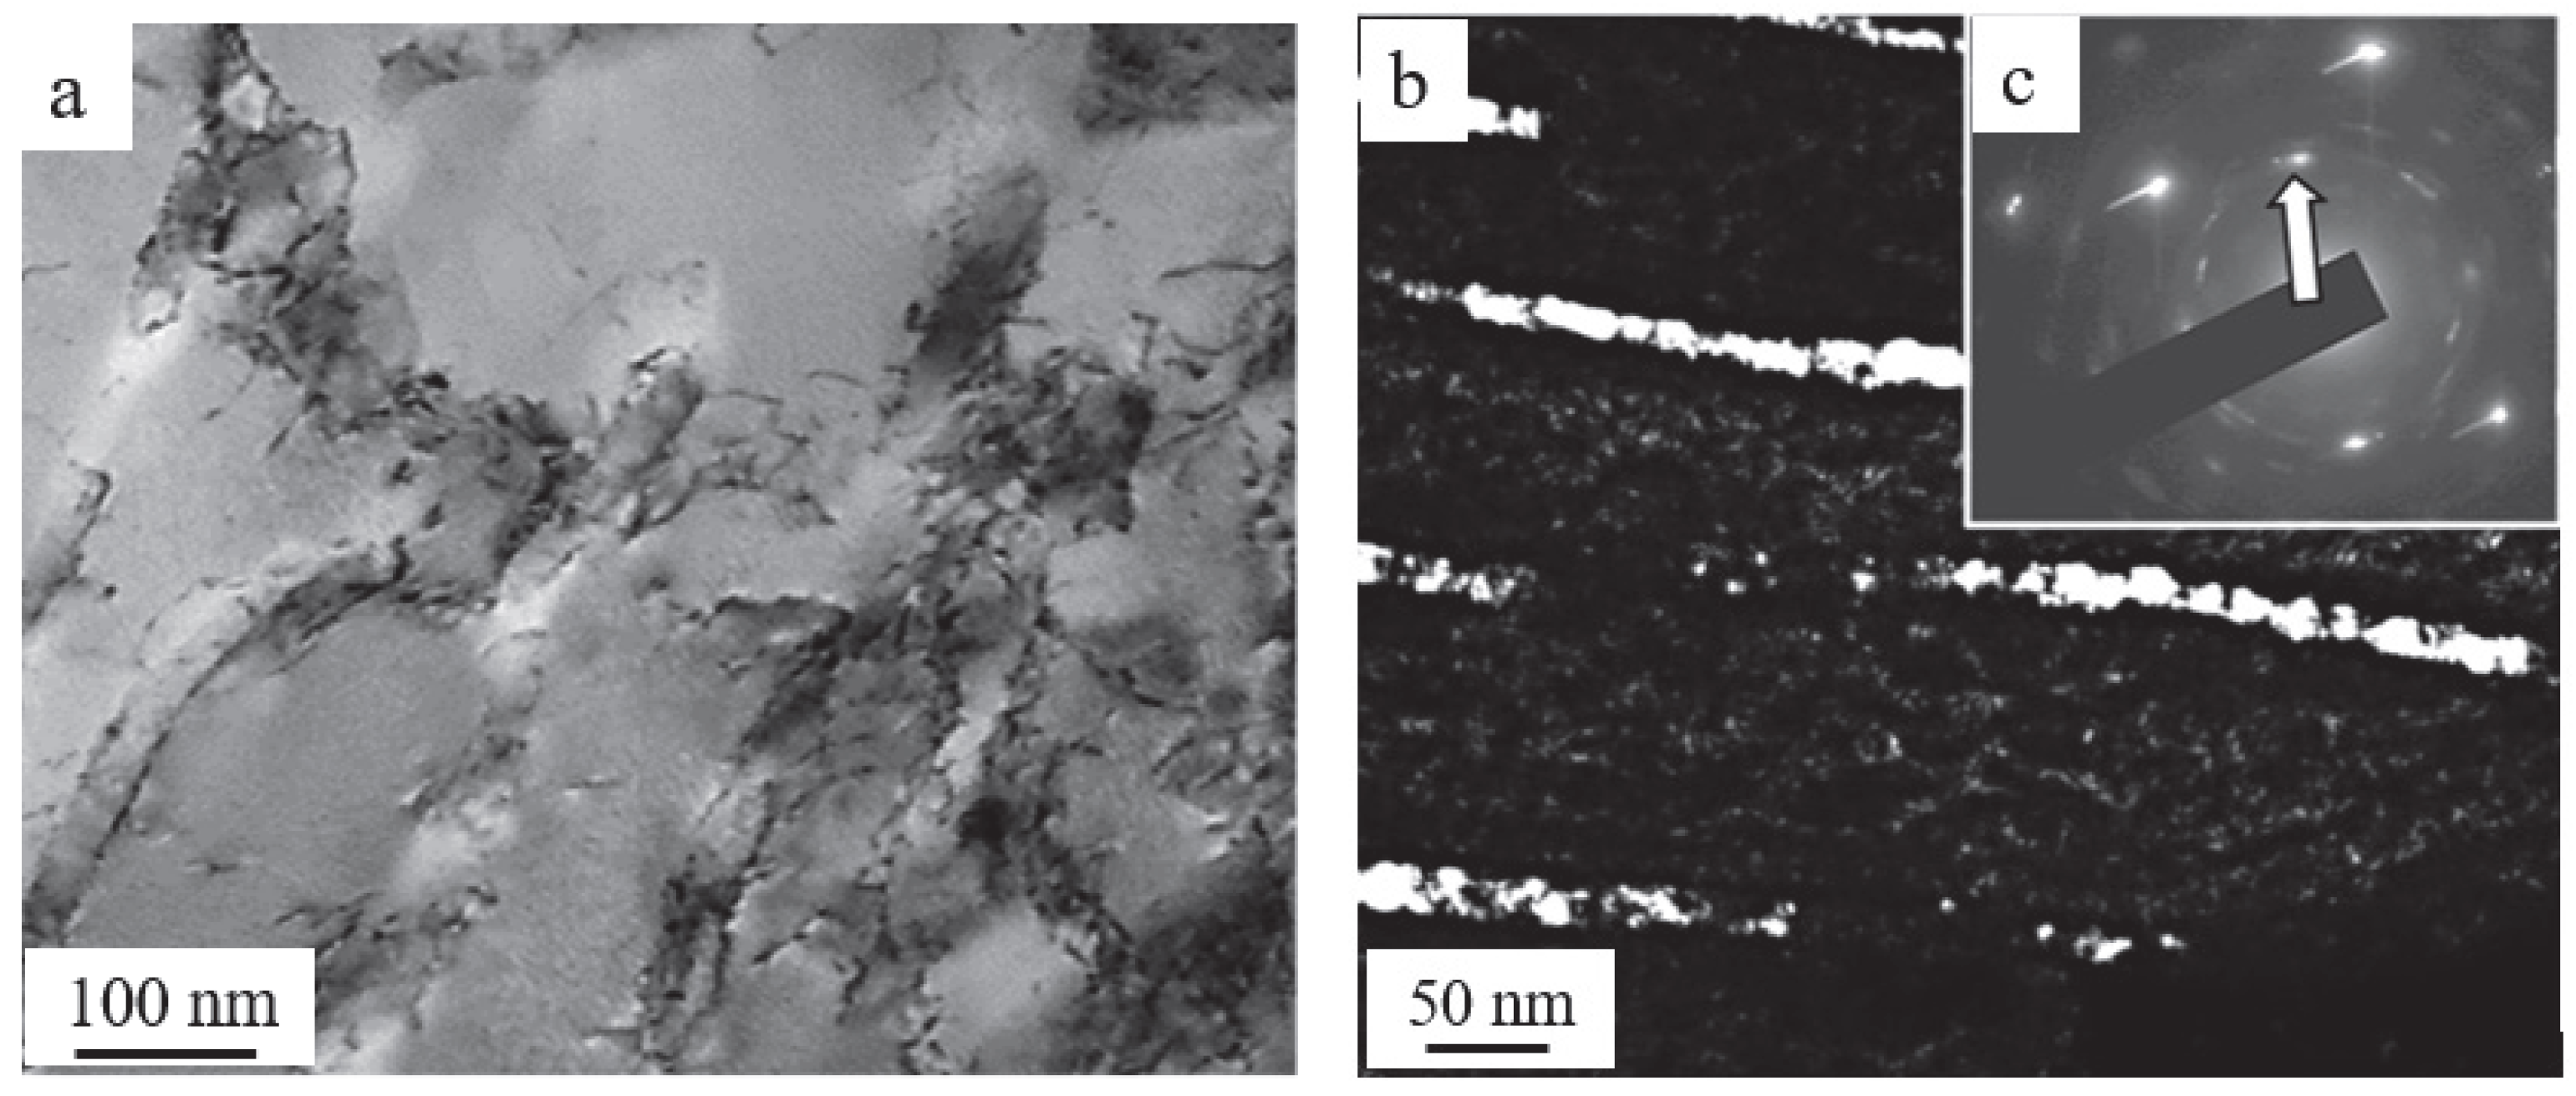
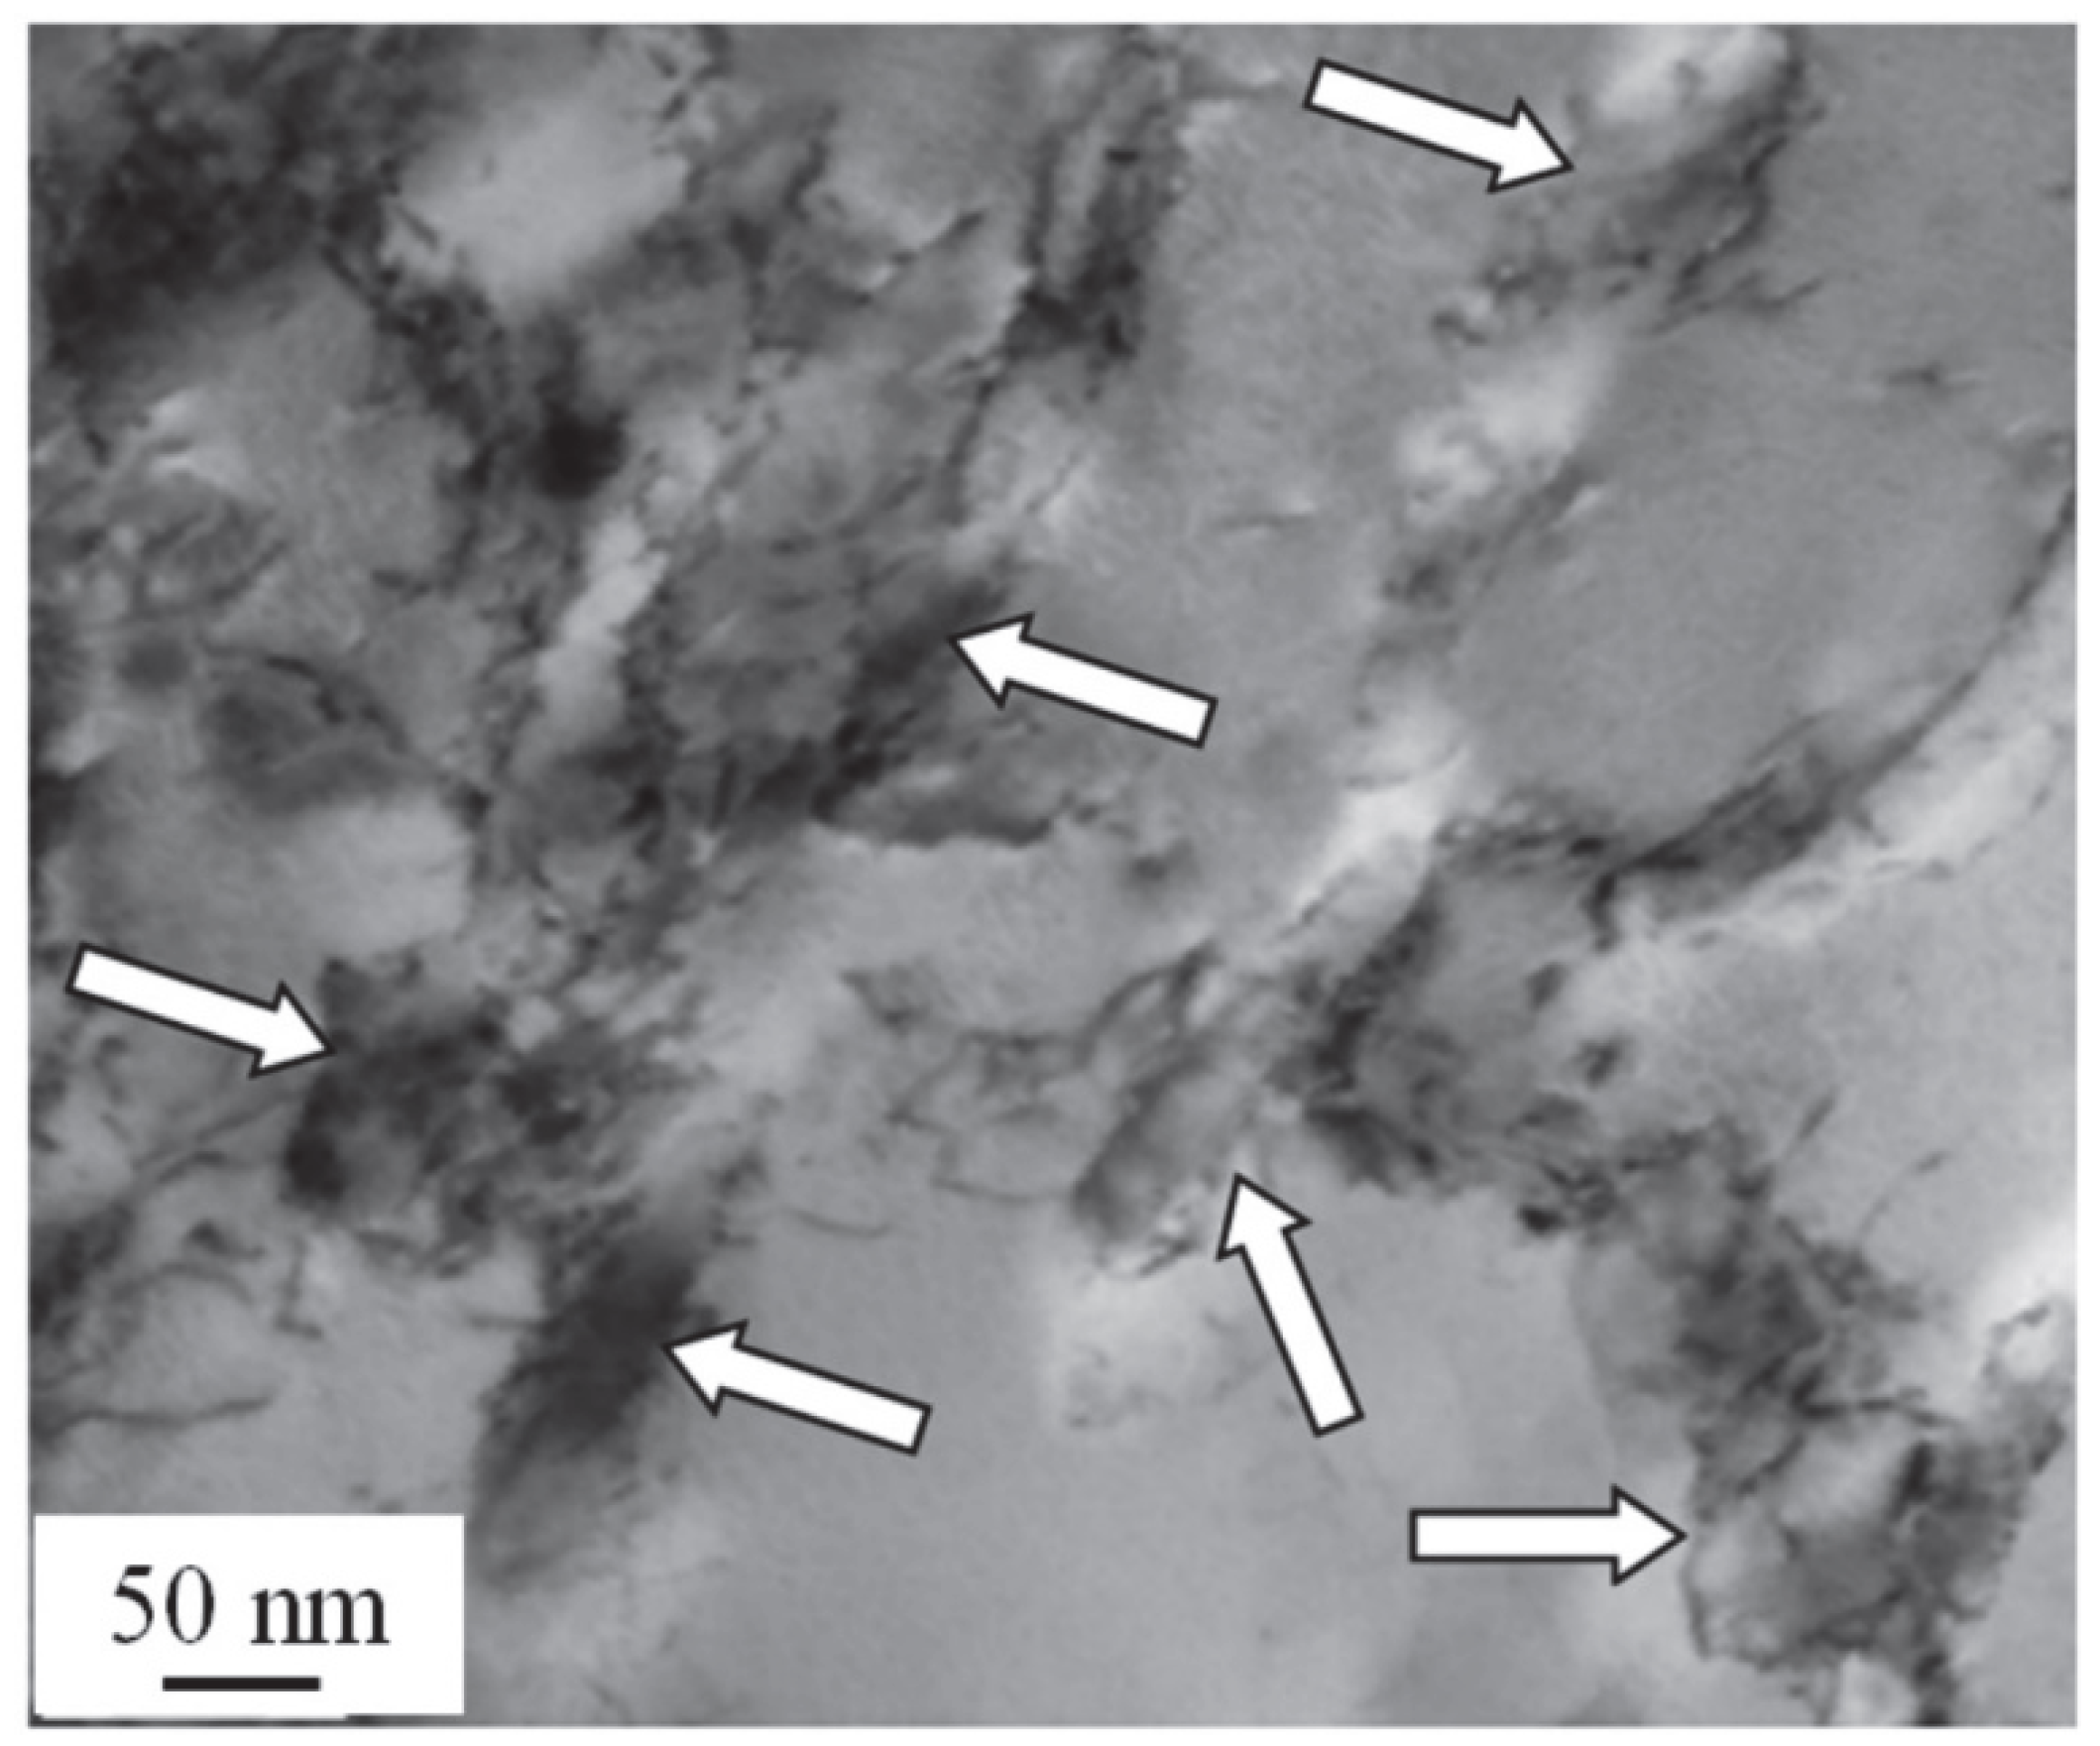
  • The fragmentation of cementite plates has been detected. It is established that fragment sizes vary in a range between 15 and 20 nm and depend weakly on the degree of steel deformation. It is found that the failure of cementite plates is proceeded by the mechanisms of their dissolution and cut with mobile dislocations. It is shown that carbon atoms, having gone from the cementite crystal lattice, are carried out to an interplanar space and form the particles of tertiary cementite whose sizes are between 2 to 4 nm.
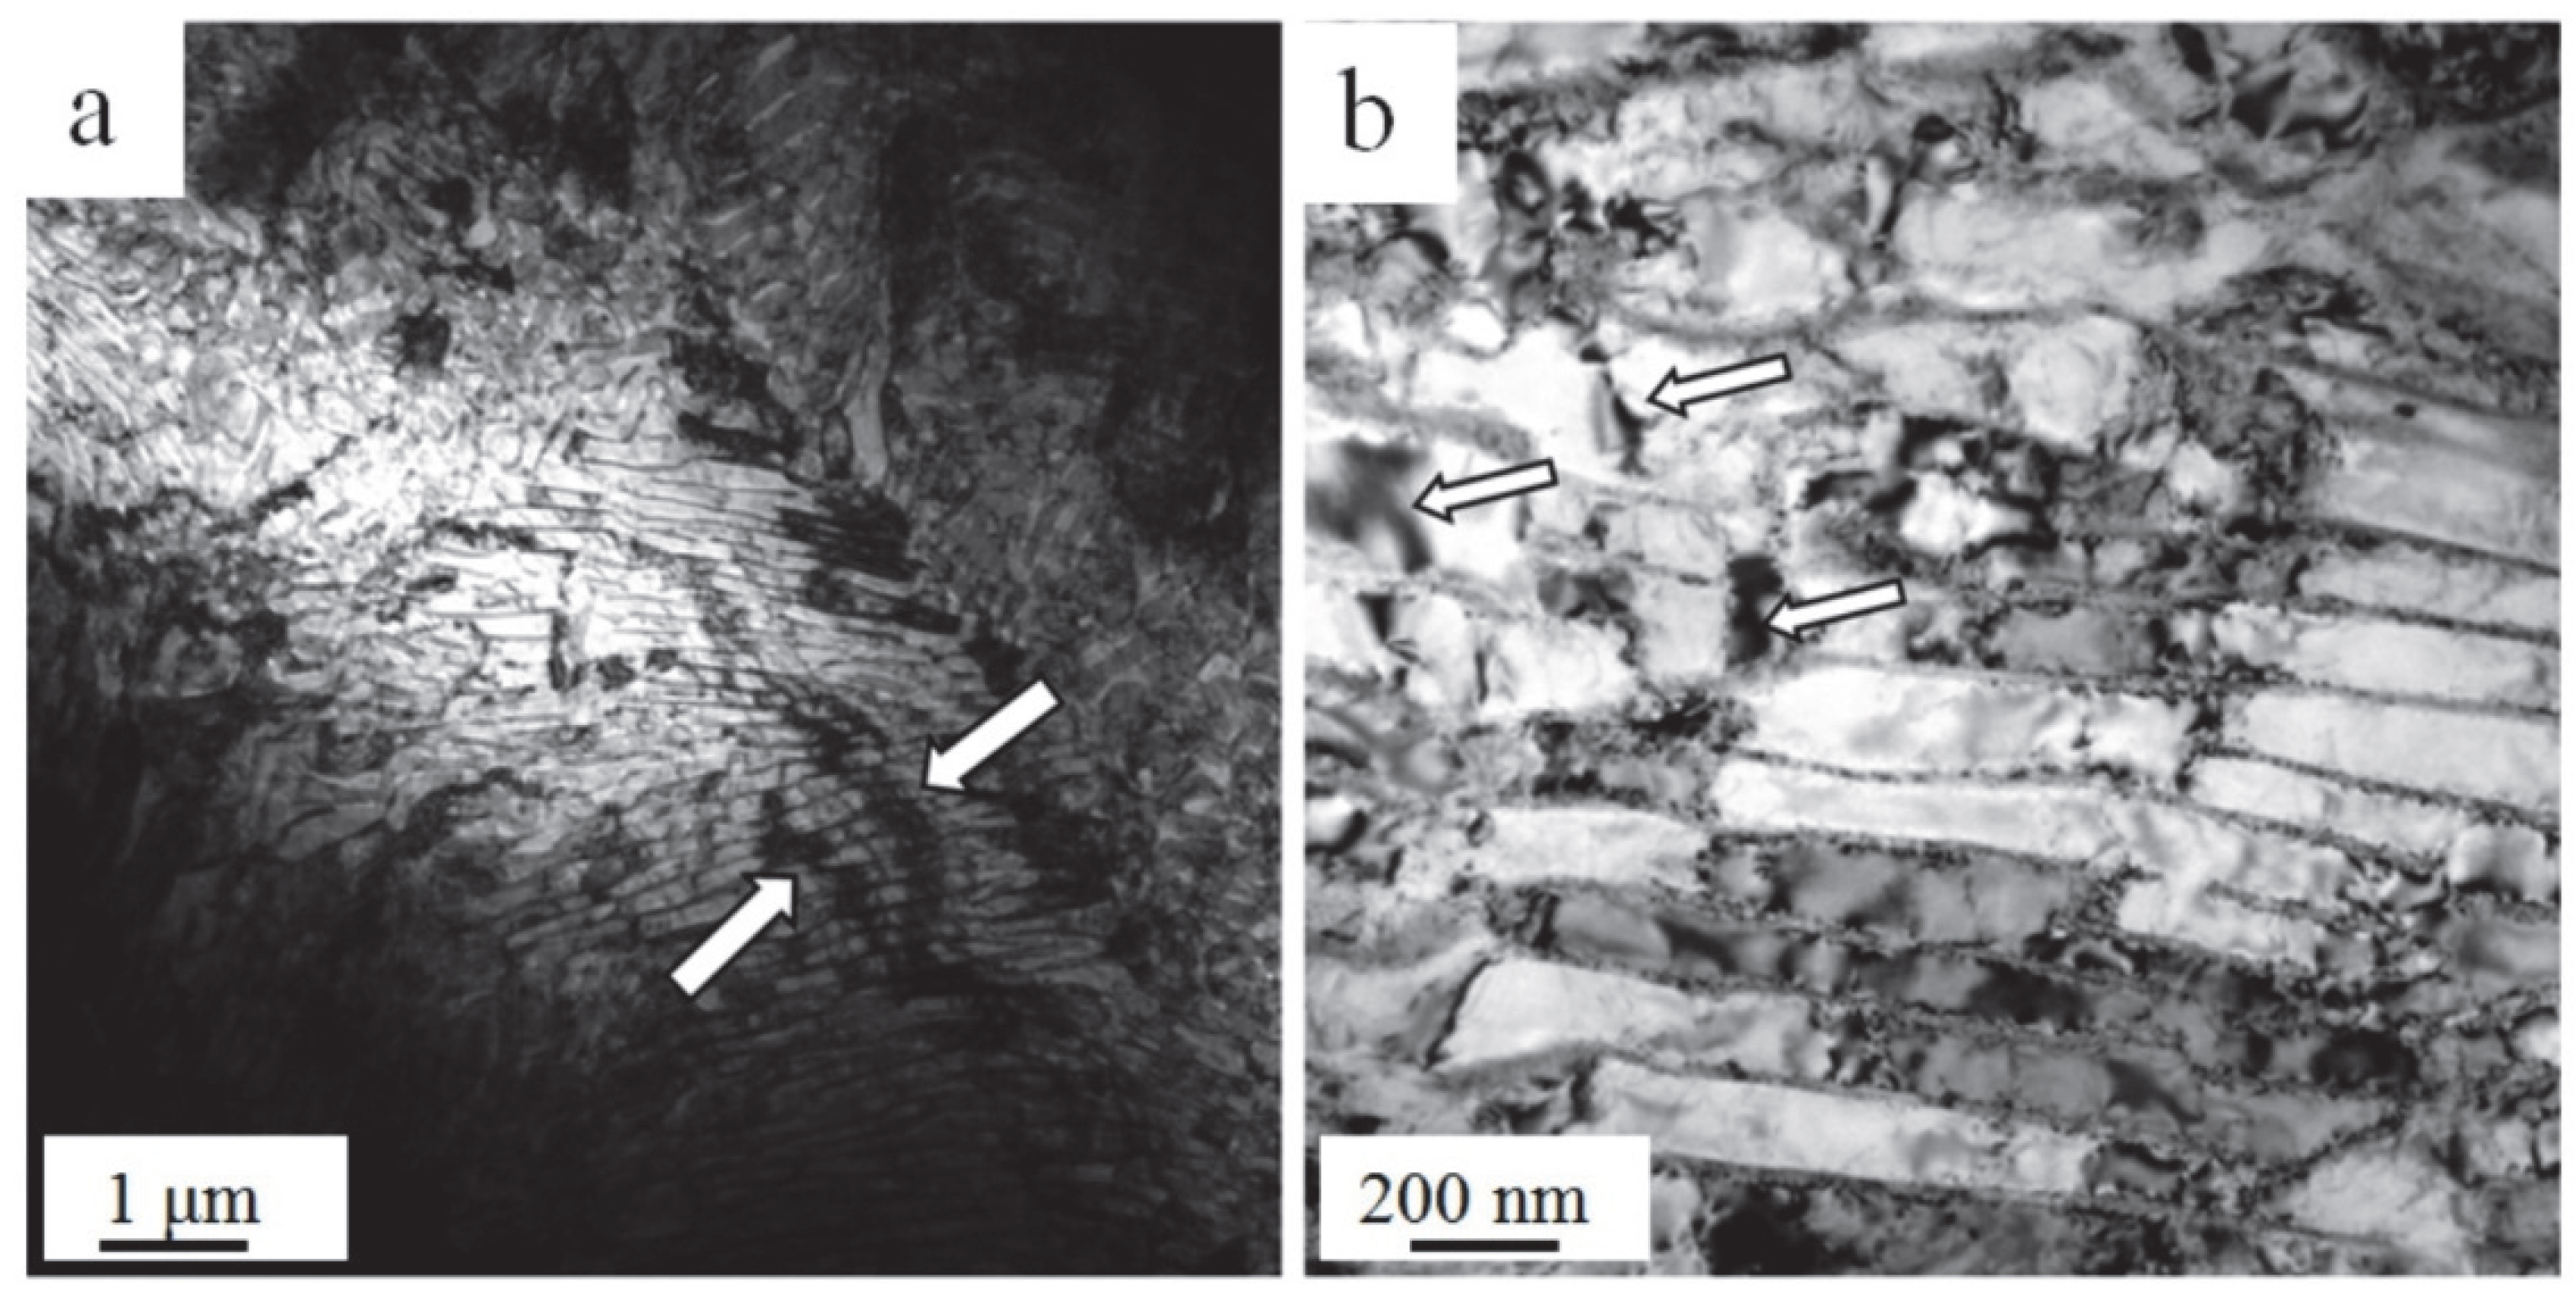
  • A formation of the non-uniform dislocation substructure due to a deceleration of dislocations by cementite particles is revealed in the process of steel deformation. The increase in the degree of deformation is accompanied by a decrease in the scalar and excess dislocation density, which may be caused by the escape of dislocation to low-angle boundaries in addition to their annihilation.

Author Contributions

Conceptualization, V.G. and K.A.; methodology, Y.I.; software, E.V.; validation, V.G. and K.A.; formal analysis, R.Q.; investigation, Y.I.; resources, Y.I.; data curation, V.G.; writing—original draft preparation, Y.I.; writing—review and editing, K.A.; visualization, E.V.; supervision, V.G.; project administration, V.G. and K.A.; funding acquisition, K.A. All authors have read and agreed to the published version of the manuscript.

Funding

The research was financially supported by the scholarship of the Russian Federation President for young scientists and post-graduates realizing the perspective research and developments in priority directions of modernization of the Russian economy (project CH-4517.2021.1).

Data Availability Statement

Not applicable.

Acknowledgments

The authors would like to express gratitude to E.V. Polevoy for providing the rail steel samples and N.A. Popova for help in discussing the experimental results.

Conflicts of Interest

The authors declare no conflict of interest.

References

  1. Yuriev, A.A.; Ivanov, Y.F.; Gromov, V.E.; Rubannikova, Y.A.; Starostenkov, M.D.; Tabakov, P.Y. Structure and Properties of Lengthy Rails after Extreme Long-Term Operation; Materials Research Forum LLC: Millersville, PA, USA, 2021; p. 190. [Google Scholar]
  2. Ivanov, Y.F.; Gromov, V.E.; Nikitina, E.N. Bainite Constructional Steel: Structure and Properties; CISP Ltd.: Cambridge, UK, 2016; p. 179. [Google Scholar]
  3. Vinogradov, A.; Estrin, Y. Analytical and numerical approaches to modelling severe plastic deformation. Prog. Mater. Sci. 2018, 95, 172–242. [Google Scholar] [CrossRef]
  4. Pan, R.; Ren, R.; Chen, C.; Zhao, X. Formation of nanocrystalline structure in pearlitic steels by dry sliding wear. Mater. Charact. 2017, 132, 397–404. [Google Scholar] [CrossRef]
  5. Kapp, M.W.; Hohenwarter, A.; Wurster, S.; Yang, B.; Pippan, R. Anisotropic deformation characteristics of an ultrafine- and nanolamellar pearlitic steel. Acta Mater. 2016, 106, 239–248. [Google Scholar] [CrossRef] [Green Version]
  6. Raabe, D.; Kumar, R. Tensile deformation characteristics of bulk ultrafine-grained austenitic stainless steel produced by thermal cycling. Scr. Mater. 2012, 66, 634–637. [Google Scholar]
  7. Skakov, M.K.; Uazyrkhanova, G.K.; Popova, N.A.; Scheffler, M. Influence of heat treatment and deformation on the phase-structural state of steel 30CrMnSiA. Key Eng. Mater. 2013, 531, 13–17. [Google Scholar] [CrossRef]
  8. Zrnik, J.; Dobatkin, S.; Raab, G.; Fujda, M.; Kraus, L. Ultrafine grain structure development in steel with different initial structure by severe plastic deformation. Rev. Mater. 2010, 15, 240–246. [Google Scholar]
  9. Takahashi, T.; Ochiai, I.; Tashiro, H.; Ohashi, S.; Nishida, S.; Tarui, T. Strenghening of steel wire for tire cord. Nippon. Steel Tech. Rep. 1995, 64, 45–49. [Google Scholar]
  10. Zhao, Y.; Tan, Y.; Ji, X.; Xiang, Z.; Xiang, S. In situ study of cementite deformation and its fracture mechanism in pearlitic steel. Mater. Sci. Eng. A 2018, 731, 93–101. [Google Scholar] [CrossRef]
  11. Yahyaoui, H.; Sidhom, H.; Braham, C.; Baczmanski, A. Effect of interlamellar spacing on the elastoplastic behavior of C70 pearlitic steel: Experimental results and self-consistent modeling. Mater. Des. 2014, 55, 888–897. [Google Scholar] [CrossRef] [Green Version]
  12. Ekh, M.; Larijani, N.; Dartfeldt, E.; Kapp, M.; Pippan, R. Prediction of the mechanical behaviour of pearlitic steel based on microcompression tests, micromechanical models and homogenization approaches. Eur. J. Mech. A. Solids 2018, 67, 272–279. [Google Scholar] [CrossRef]
  13. Veter, V.V.; Zhuleikin, S.G.; Ignatenko, L.N. Gradient structures arising during plastic deformation of pearlitic steel. Proc. Russ. Acad. Sci. Phys. Ser. 2003, 67, 1375–1379. [Google Scholar]
  14. Wang, Y.; Tomota, Y.; Harjo, S.; Gong, W.; Ohmuraa, T. In-situ neutron diffraction during tension-compression cyclic deformation of a pearlite steel. Mater. Sci. Eng. A 2016, 676, 522–530. [Google Scholar] [CrossRef]
  15. Li, Y.J.; Choi, P.; Borchers, C.; Westerkamp, S.; Goto, S.; Raabe, D.; Kirchheim, R. Atomic-scale mechanisms of deformation-induced cementite decomposition in pearlite. Acta Mater. 2011, 59, 3965–3977. [Google Scholar] [CrossRef]
  16. Tung, P.-Y.; Zhou, X.; Mayweg, D.; Morsdorf, L.; Herbig, M. Under-stoichiometric cementite in decomposing binary Fe-C pearlite exposed to rolling contact fatigue. Acta Mater. 2021, 216, 117144. [Google Scholar] [CrossRef]
  17. Egerton, F.R. Physical Principles of Electron Microscopy; Springer International Publishing: Basel, Switzerland, 2016; p. 196. [Google Scholar]
  18. Kumar, C.S.S.R. Transmission Electron Microscopy. In Characterization of Nanomaterials; Springer: New York, NY, USA, 2014; p. 717. [Google Scholar]
  19. Carter, C.B.; Williams, D.B. Transmission Electron Microscopy; Springer International Publishing: Berlin, Germany, 2016; p. 518. [Google Scholar]
  20. Koneva, N.A.; Kozlov, E.V. Nature of substructural strengthening. Proc. High Schools Phys. 1982, 8, 3–14. [Google Scholar]
  21. Trefilov, V.I.; Moiseev, V.F.; Pechkovsky, E.P.; Gornaya, I.D. Cold Hardening and Failure of Polycrystalline Materials; Naukova Dumka: Kiev, Ukraine, 1989; p. 256. [Google Scholar]
  22. Kocks, U.F.; Mesking, H. Physics and phenomenology of strain hardening: The FCC case. Prog. Mater. Sci. 2003, 48, 171–279. [Google Scholar] [CrossRef]
  23. Koneva, N.A. The nature of the stages of plastic deformation. Soros Educ. J. 1998, 10, 99–105. [Google Scholar]
  24. Podrezov, Y.N.; Firstov, S.A. Two approaches to analysis of curves of cold gardening. Phys. Technol. High Press. 2006, 16, 37–48. [Google Scholar]
  25. Gavriljuk, V.G. Effect of interlamellar spacing on cementite dissolution during wire drawing of pearlitic steel wires. Scr. Mater. 2001, 45, 1469–1472. [Google Scholar] [CrossRef]
  26. Gavriljuk, V.G. Decomposition of cementite in pearlite steel due to plastic deformation. Mater. Sci. Eng. A 2003, 345, 81–89. [Google Scholar] [CrossRef]
  27. Gromov, V.E.; Yuriev, A.B.; Morozov, K.V.; Ivanov, Y.F. Microstructure of Quenched Rails; CISP Ltd.: Cambridge, UK, 2016; p. 152. [Google Scholar]
  28. Koneva, N.A.; Kozlov, E.V.; Popova, N.A. Effect of grain and fragment sizes on dislocation density in metallic materials. Fundam. Probl. Mod. Mater. Sci. 2010, 7, 64–70. [Google Scholar]
  29. Kozlov, E.V.; Popova, N.A.; Koneva, N.A. Scalar density of dislocations in fragments with different types of substructures. Lett. About Mater. 2011, 1, 15–18. [Google Scholar] [CrossRef]
Figure 1. A stress-strain curve of rail steel in the uniaxial compression (a) and its treatment in coordinates σ = f (ε 0.2) (b). The dotted lines in (a) indicate the elastic limit σ 0 of the material. Arrows indicate the positions of samples used for studying the structural-phase state of steel on the deformation curve.
Metals 12 01985 g001
Figure 2. A TEM image of the steel at ε = 50%. (a)–fragmented structure; in (b) arrows indicate the low-angle boundaries being present in the ferrite plates of a pearlite colony.
Metals 12 01985 g002
Figure 3. A TEM image of the steel deformed structure (ε = 50%); (a)—bright field; (b)—microelectron diffraction pattern obtained from a foil portion whose image is given on (a); (c,d)—dark fields obtained in cementite reflections [121] Fe3C (c) and [211] Fe3C (d). On (b) arrows indicate reflections of dark fields, 1—(c), 2—(d).
Metals 12 01985 g003
Figure 4. A TEM image of the steel deformed structure (ε = 50%); (a)—bright field; (b)—dark field obtained in the reflection [012]Fe3C+ [110]α-Fe; c—microelectron diffraction pattern. On (c) arrows indicate the reflection of a dark field formation.
Metals 12 01985 g004
Figure 5. A TEM image of the steel dislocation substructure in the initial state (a) and after the compressive deformation at ε = 50% (b).
Metals 12 01985 g005
Figure 6. A TEM image of the steel structure (a); (b)—the microelectron diffraction pattern obtained from the given foil portion. The arrows indicate the reflection determined by azimuthal components of the whole disorientation angle of the steel structure.
Metals 12 01985 g006
Figure 7. A TEM image of the dislocation substructure being formed near cementite particles (indicated by arrows) at ε = 50%.
Metals 12 01985 g007
Figure 8. A structure of the deformed rail steel (ε = 50%). Arrows indicate the bend extinction contours. (a) 1 μm; (b) 200 nm.
Metals 12 01985 g008
Table 1. Chemical composition of DT 350 category rails.
Mass Fraction of Chemical Elements, % (the Rest is Fe)
CMnSiPSCrNiCuTiMoVAl
0.730.750.580.0120.0070.420.070.130.0030.0060.040.003
Table 2. A dependence of the scalar 〈 ρ 〉 and excess ρ ± dislocation density in fragments on the degree of deformation.
Dislocation
Density, 1010, cm−2
Degree of Deformation, ε, %
0153050
ρ 2.52.11.60.6
ρ±1.81.61.00.3
Publisher’s Note: MDPI stays neutral with regard to jurisdictional claims in published maps and institutional affiliations.

