Article

Numerical Study on Welding Residual Stress Distribution of Corrugated Steel Webs

1
School of Civil Engineering, Hunan University of Technology, Zhuzhou 412007, China
2
JSTI Group Co., Ltd., Nanjing 211000, China
*
Author to whom correspondence should be addressed.
Metals 2022, 12(11), 1831; https://doi.org/10.3390/met12111831
Submission received: 30 August 2022 / Revised: 16 October 2022 / Accepted: 25 October 2022 / Published: 27 October 2022
(This article belongs to the Section Welding and Joining)

Abstract

:
Residual stresses are an inevitable result of the welded fabrication process of corrugated steel webs (CSWs), resulting in structures with high and unpredictable stress fields, causing unexpected failures. The residual stress field is affected by structural parameters and the welding path of CSWs. This study proposes the welding process simulation method for CSWs with element birth and death technology. The optimization design method of heat source parameters is proposed. The feasibility of the simulation method is verified by comparing the numerical results with the experimental results of relevant literature. As a part of the study, a comparison of residual stress fields upon cooling welded CSWs with bending angles of 30, 45, and 60 degrees is presented. Thereafter, the effect of two types of single-sided welding paths and double-sided welding construction processes on residual stress distribution is discussed. Generally, the study results have shown that the equivalent residual stress near the weld reaches the maximum 344 MPa, which is very close to the Q345 steel yield strength. The size of the bending angle has no major effect on the residual stress distribution pattern, but it influences the residual stress value at the bending position. The residual stress at the bending position increases with the bending angle of CSWs. Different welding paths significantly impact the residual stress of the weld toe, and selecting a reasonable welding path can effectively reduce the residual stress value by 20 to 40 MPa.

1. Introduction

The composite girder bridge with CSWs differs from the traditional steel–concrete combination structure because it offers lightweight and long-span capability advantages [1,2]. More importantly, the CSWs prevent the problem of cracking concrete webs in the construction process of traditional bridge structures. The CSWs consist of chord plates and steel webs, which are welded together. The steel webs and chord plates are unevenly heated during the welding process, and residual stresses are inevitable upon welding complementation and cooling, as shown in Figure 1. Indeed, residual stresses coupled with other external loads may lead to unexpected failure of the structure [3,4,5].
Nowadays, experimental methods for evaluating residual stress include physical measurements [6,7] and nondestructive measurements [8,9]. For the physical measurement method, the specimens are usually cut and damaged, making it impossible to analyze the effect of residual stress without structural damage. The nondestructive methods expedite the measurement process and reduce its high cost. On the other hand, numerical analysis methods for welding residual stress evaluation developed rapidly in recent years [10,11,12]. The main challenge in the numerical analysis of residual stress is to define the physical coupling [13,14], heat source [15], and temperature-related nonlinear material properties [16,17]. The setting of welding parameters is often based on existing construction experience, which may lead to high residual stresses in the structure [18]. Some researchers carried out analyses of welding parameters affecting residual stress. Amirreza et al. [19] conducted a numerical study of aluminum alloy T-welds and found that an increase in welding speed increases the longitudinal residual tensile stress in the weld. Furthermore, they observed that a higher current input also increases the residual stress. Sepe R et al. [20,21,22,23] developed a modeling technique to simulate the interaction of plates during the welding process in butt weld joints. The phenomenon of plate interaction is usually ignored in the literature. Jie et al. [24] compared four different welding sequences of aluminum alloy weldments and pointed out that a proper welding sequence can effectively reduce residual stresses in welding. Sattari et al. [25] concluded that the initial residual stress in the weld does not affect the final distribution of residual stresses and that the combination of stepwise welding and symmetrical welding sequence can effectively reduce the residual stress.
Nevertheless, the CSWs differ from those studied above. Due to the steel web’s bend angles and the welding’s geometric shape, the steel web details change suddenly [26]. For this reason, it is easy to produce stress concentration at the position of bend angles, which leads to comprehensive residual stress distribution. Currently, studies on the residual stress distribution in CSWs have been limited to consideration of the shear buckling resistance of corrugated webs. Kubo et al. [27] seem to be the first to study the distribution of residual stresses in corrugated webs, and they show that the welding flange clearly influences residual stresses. Kollár [28,29] used numerical simulation to analyze the thermal phenomena in the welding process and their effect on the initial geometric defects of the waveform web. The difference between the presence of inclined folds in CSWS and the planar web may further change the distribution of residual stress [30,31]. In the design process of CSWs, it is necessary to clarify the influence of wave angle and welding path on residual stress. The above literature shows that the impact of the welding process, path, steel web bending angle, and other parameters on the residual stress distribution mechanism is not clear.
This study proposes a numerical simulation method for residual stress evaluation of CSWs using the element birth and death technology. The validity of the numerical simulation method is verified based on experimental data. Thereafter, the effect of single and double-sided welding paths on the distribution of residual stresses in CSWs is discussed. Moreover, the law of the influence of the bending angle on the residual stress of steel web welding is further clarified.

2. Theory of Welding Process

2.1. Welding Heat Transfer Theory

The change of temperature field during the welding process is the key factor for generating residual stress in the welding process. When the welding heat source is applied to the weld area of the weldment, a large temperature difference in the weldment is generated. According to the second law of thermodynamics, heat can spontaneously transfer from high-temperature objects to low-temperature objects, making the heat near the weld gradually diffuse away from the weld area. The diffusion path includes the weldment itself and the external environment. This diffusion is expressed in the finite element thermal analysis as heat transfer. In this regard, Fourier’s heat conduction theory and its heat conduction differential equation are applicable. Indeed, Fourier’s theorem shows that given the heat flux density in a heat conduction phenomenon, the heat transferred is proportional to the rate of change in temperature and cross-sectional area in the direction perpendicular to the equivalent temperature plane. The welding heat transfer equation can be expressed as follows [32]:
q = λ T
where q is the heat flux, λ is the thermal conductivity, and ∇T is the temperature gradient.
Welding is an extremely complex physical and chemical reaction process. The welding process is accompanied by the local heating and cooling of the weldment as a whole. The temperature near the weld in the heating process is usually higher than the melting point of the solder and base metal. The temperature of weldment will change dramatically in time and space with the movement of welding heat source, which will lead to the change of physical parameters of structural materials. Therefore, welding can be considered a nonlinear transient heat transfer process. The basic heat conduction differential equation is defined as [11]:
T t λ c ρ 2 T = Q c ρ
where ρ is the object density, c is the heat capacity, and Q is the internal heat source intensity.
In order to obtain the solution of such a heat transfer differential equation for a specific time and space situation and to know the heat transfer between the weldment and the surrounding medium at any time, namely [11]:
( q n ) s = β T s T e
where β is the heat transfer coefficient, and Te is the temperature of the surrounding medium

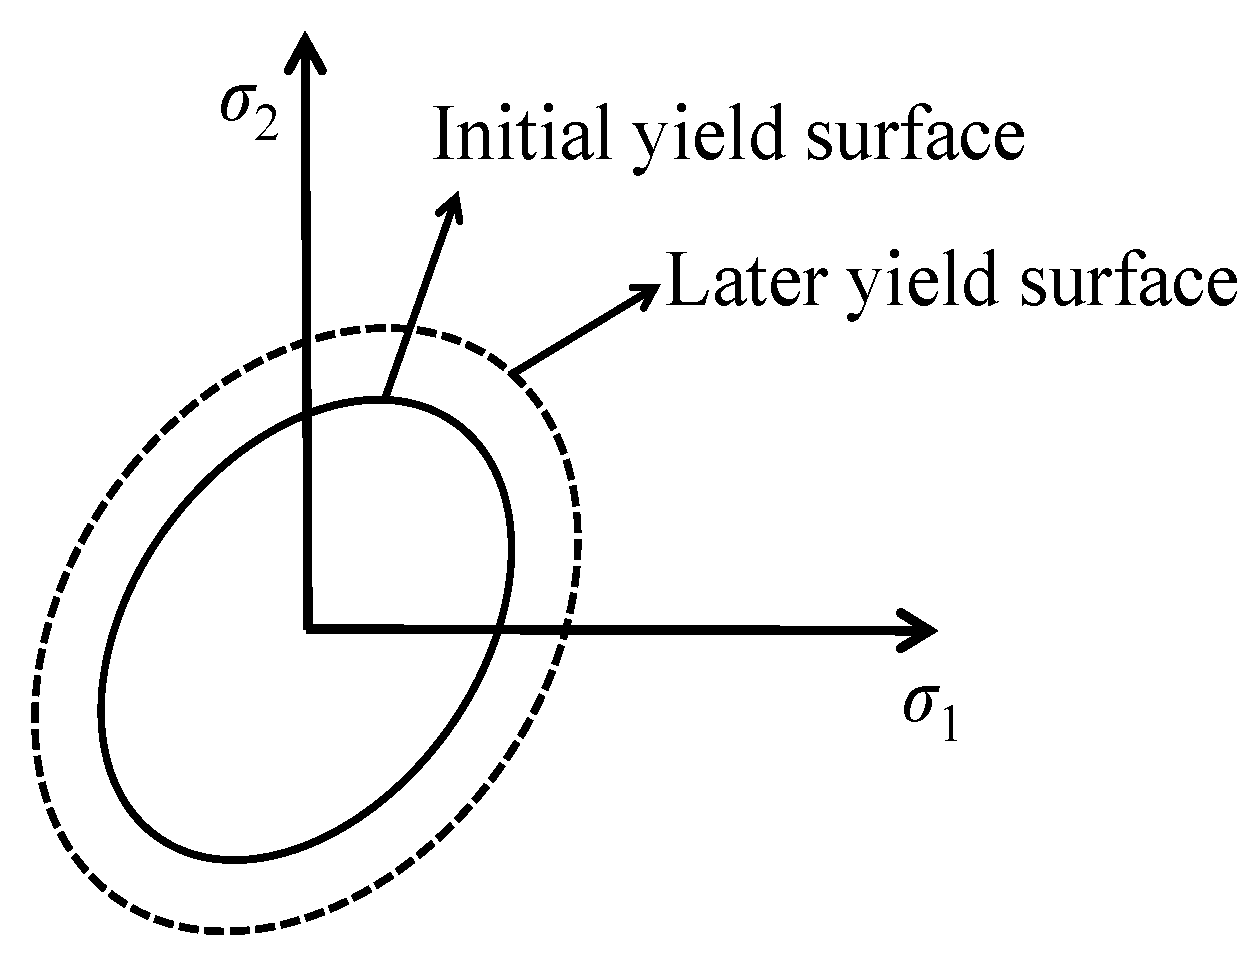
2.2. Material Strength Definition in the Welding Process

In the welding process, the local temperature rises sharply above the material’s melting point, resulting in uneven heating of the entire weldment and uncoordinated tensile and compressive deformation of the weldment. Generally, the yield strength of most steel materials declines with the temperature rise, resulting in the welding process being very easy to enter the elastic–plastic deformation stage from the elastic deformation stage. When the weldments plastic strain through the cooling effect returns to the elastic stage, the weldment material at this time is equivalent to experiencing a strengthening. Hence, the process follows the corresponding rule may be defined.
(1)
Von Mises yield rule
Von Mises yield rule follows the fourth strength theory of material mechanics, with the specific meaning that when the equivalent force somewhere inside the material under the action of an external force reaches a threshold value, it indicates that the zone enters a plastic deformation state. Additionally, the size of the threshold value mainly depends on the performance parameters of the material. The specific expression is [33]:
σ = 2 2 ( σ 1 σ 2 ) 2 + ( σ 2 σ 3 ) 2 + ( σ 3 σ 1 ) 2 σ s
where σ is the equivalent stress, σ1, σ2, and σ3 are the principal stress in x, y, and z directions, respectively, and σs is the uniaxial tensile yield limit of steel.
When σ > σs, the material reaches the yield state, and the expression for the equivalent strain corresponding to the equivalent stress within the material in the yield state is:
ε ¯ = 2 2 1 + μ ( ε x ε y ) 2 + ( ε y ε z ) 2 + ( ε z ε x ) 2 + 3 2 γ x y 2 + γ y z 2 + γ z x 2
where ε is the equivalent strain, μ is the Poisson ratio, εx, εy, and εz are the principal strains in mutually perpendicular directions, and γxy, γyz, and γzx are the shearing strains in xy, yz, and zx surfaces, respectively.
(2)
Plastic flow rule
The plastic flow rule refers to the development law of the plastic strain with the continuous loading of the external force when the weldment enters the elastic–plastic deformation stage after the elastic stage. The specific expression is [33]:
d ε p = d λ σ ¯ σ
where d{ε}p is the plastic strain increment, is the plastic factor, and σ is the quantity function.
(3)
Hardening rule
The hardening rule means that the material is loaded up to its plastic deformation stage and then unloaded, and the material’s ultimate strength is enhanced during the reloading process. In this paper, the isotropic hardening rule describes the strengthening process of materials during thermal welding analysis. The isotropic hardening rule is defined as the yield stress in each direction of the material increasing during the development of plastic strain, and the yield of the material expands uniformly in each direction [34,35], as shown in Figure 1.

3. Numerical Simulation of Welding Process for CSWs

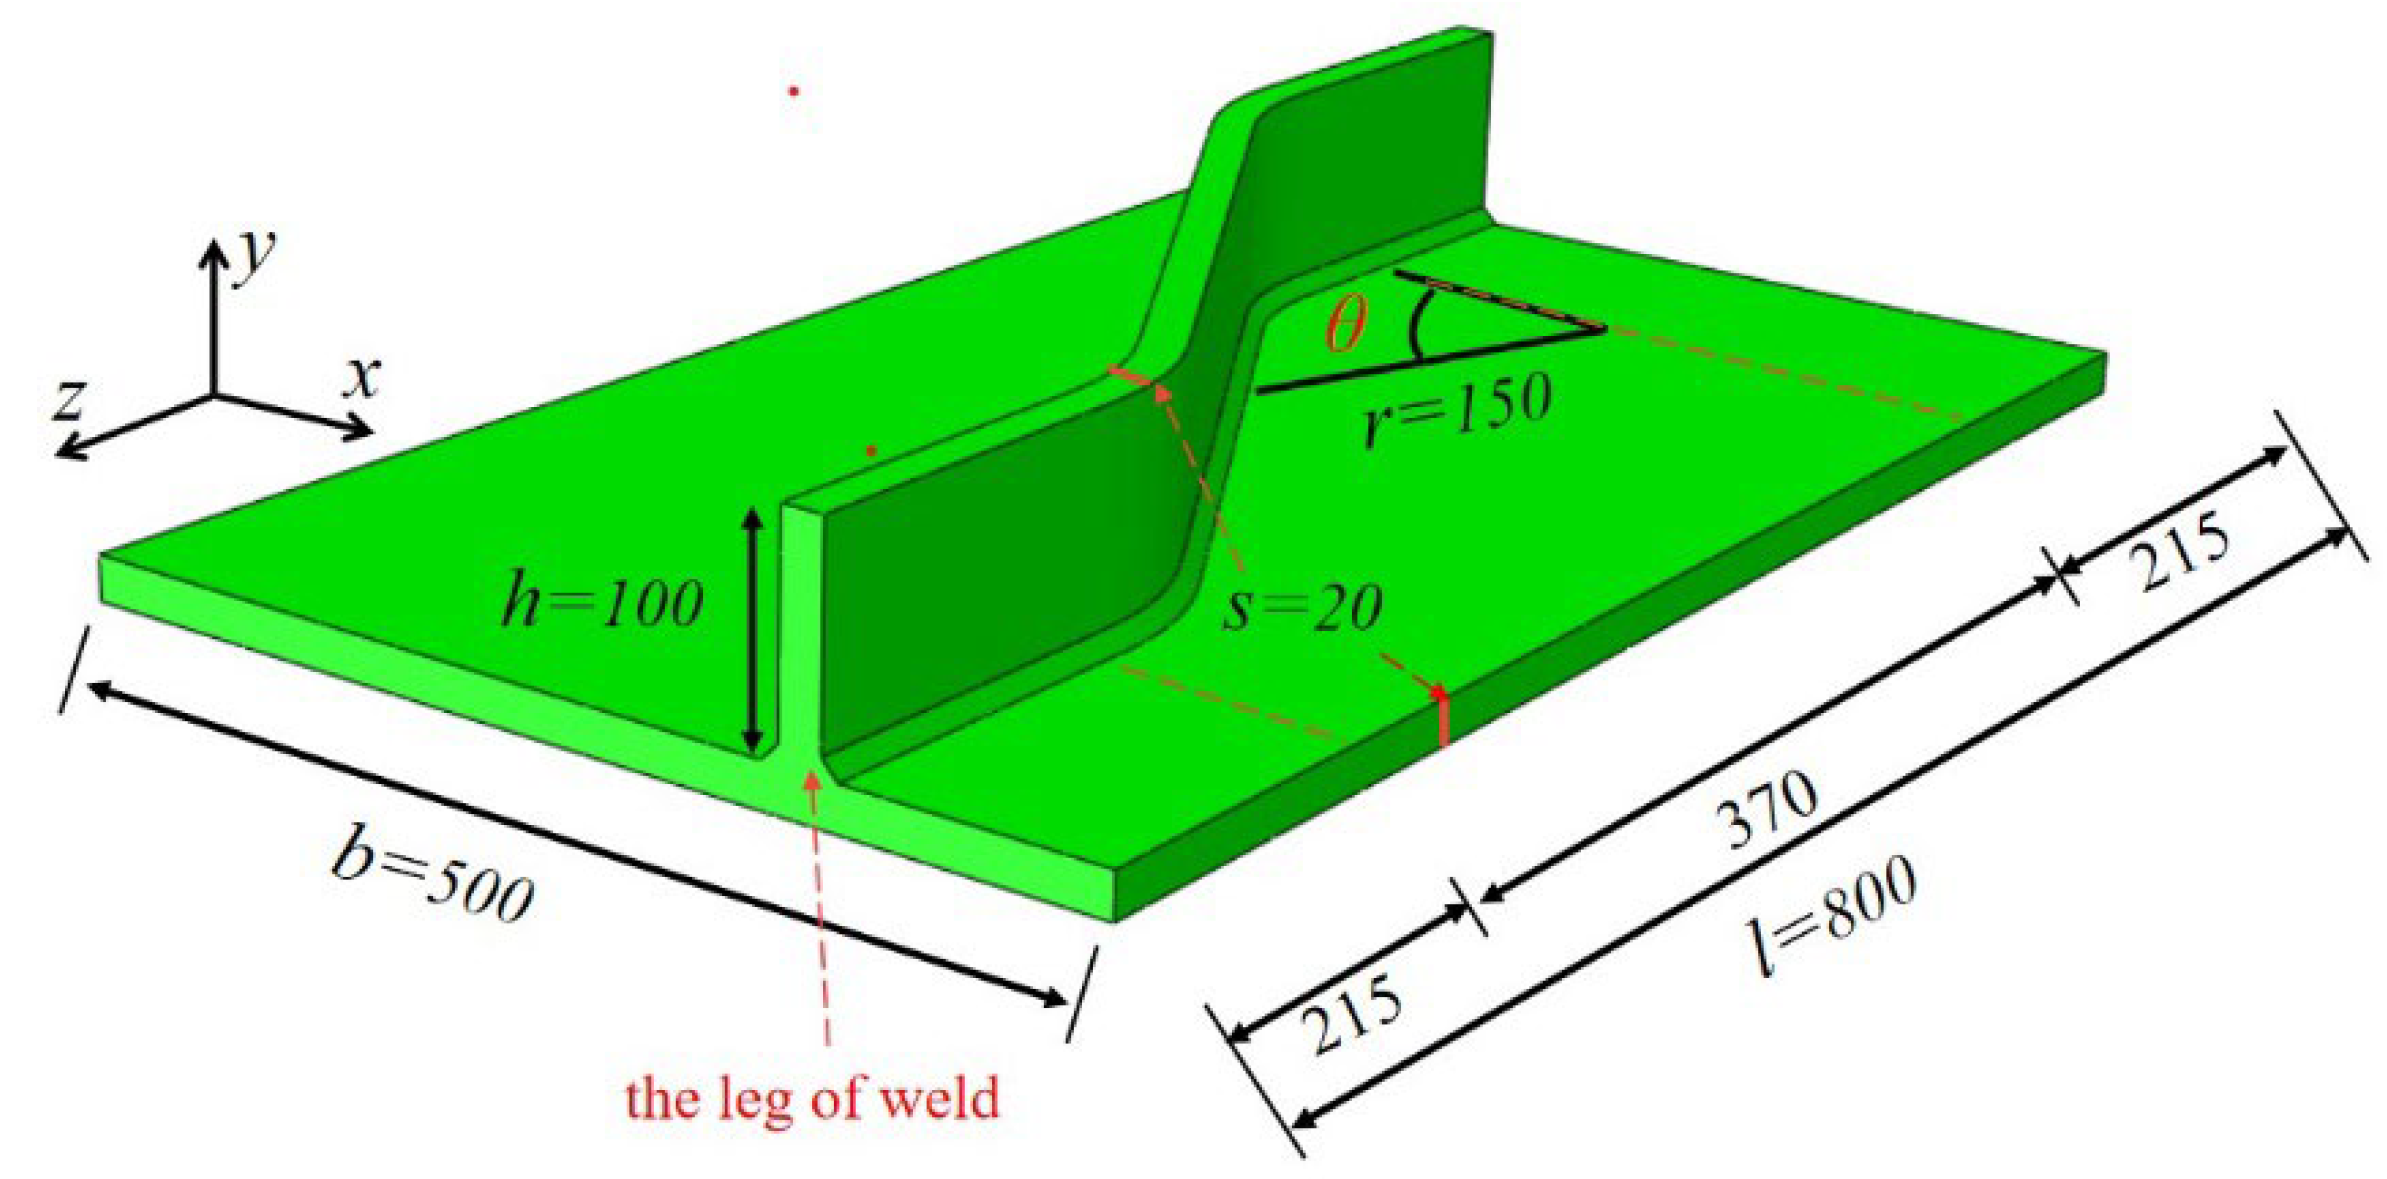
3.1. Materials and Structural Parameters

The Q345 material is selected for the CSWs. The chemical composition of Q345 is shown in Table 1. The FEM size is shown in Figure 2. In this study, the finite element analysis software ABAQUS is used to establish the finite element models of the double-sided weldment with corrugated angle θ of 30°, 45°, and 60°, and the single-sided weldment with corrugated angle θ of 30°.

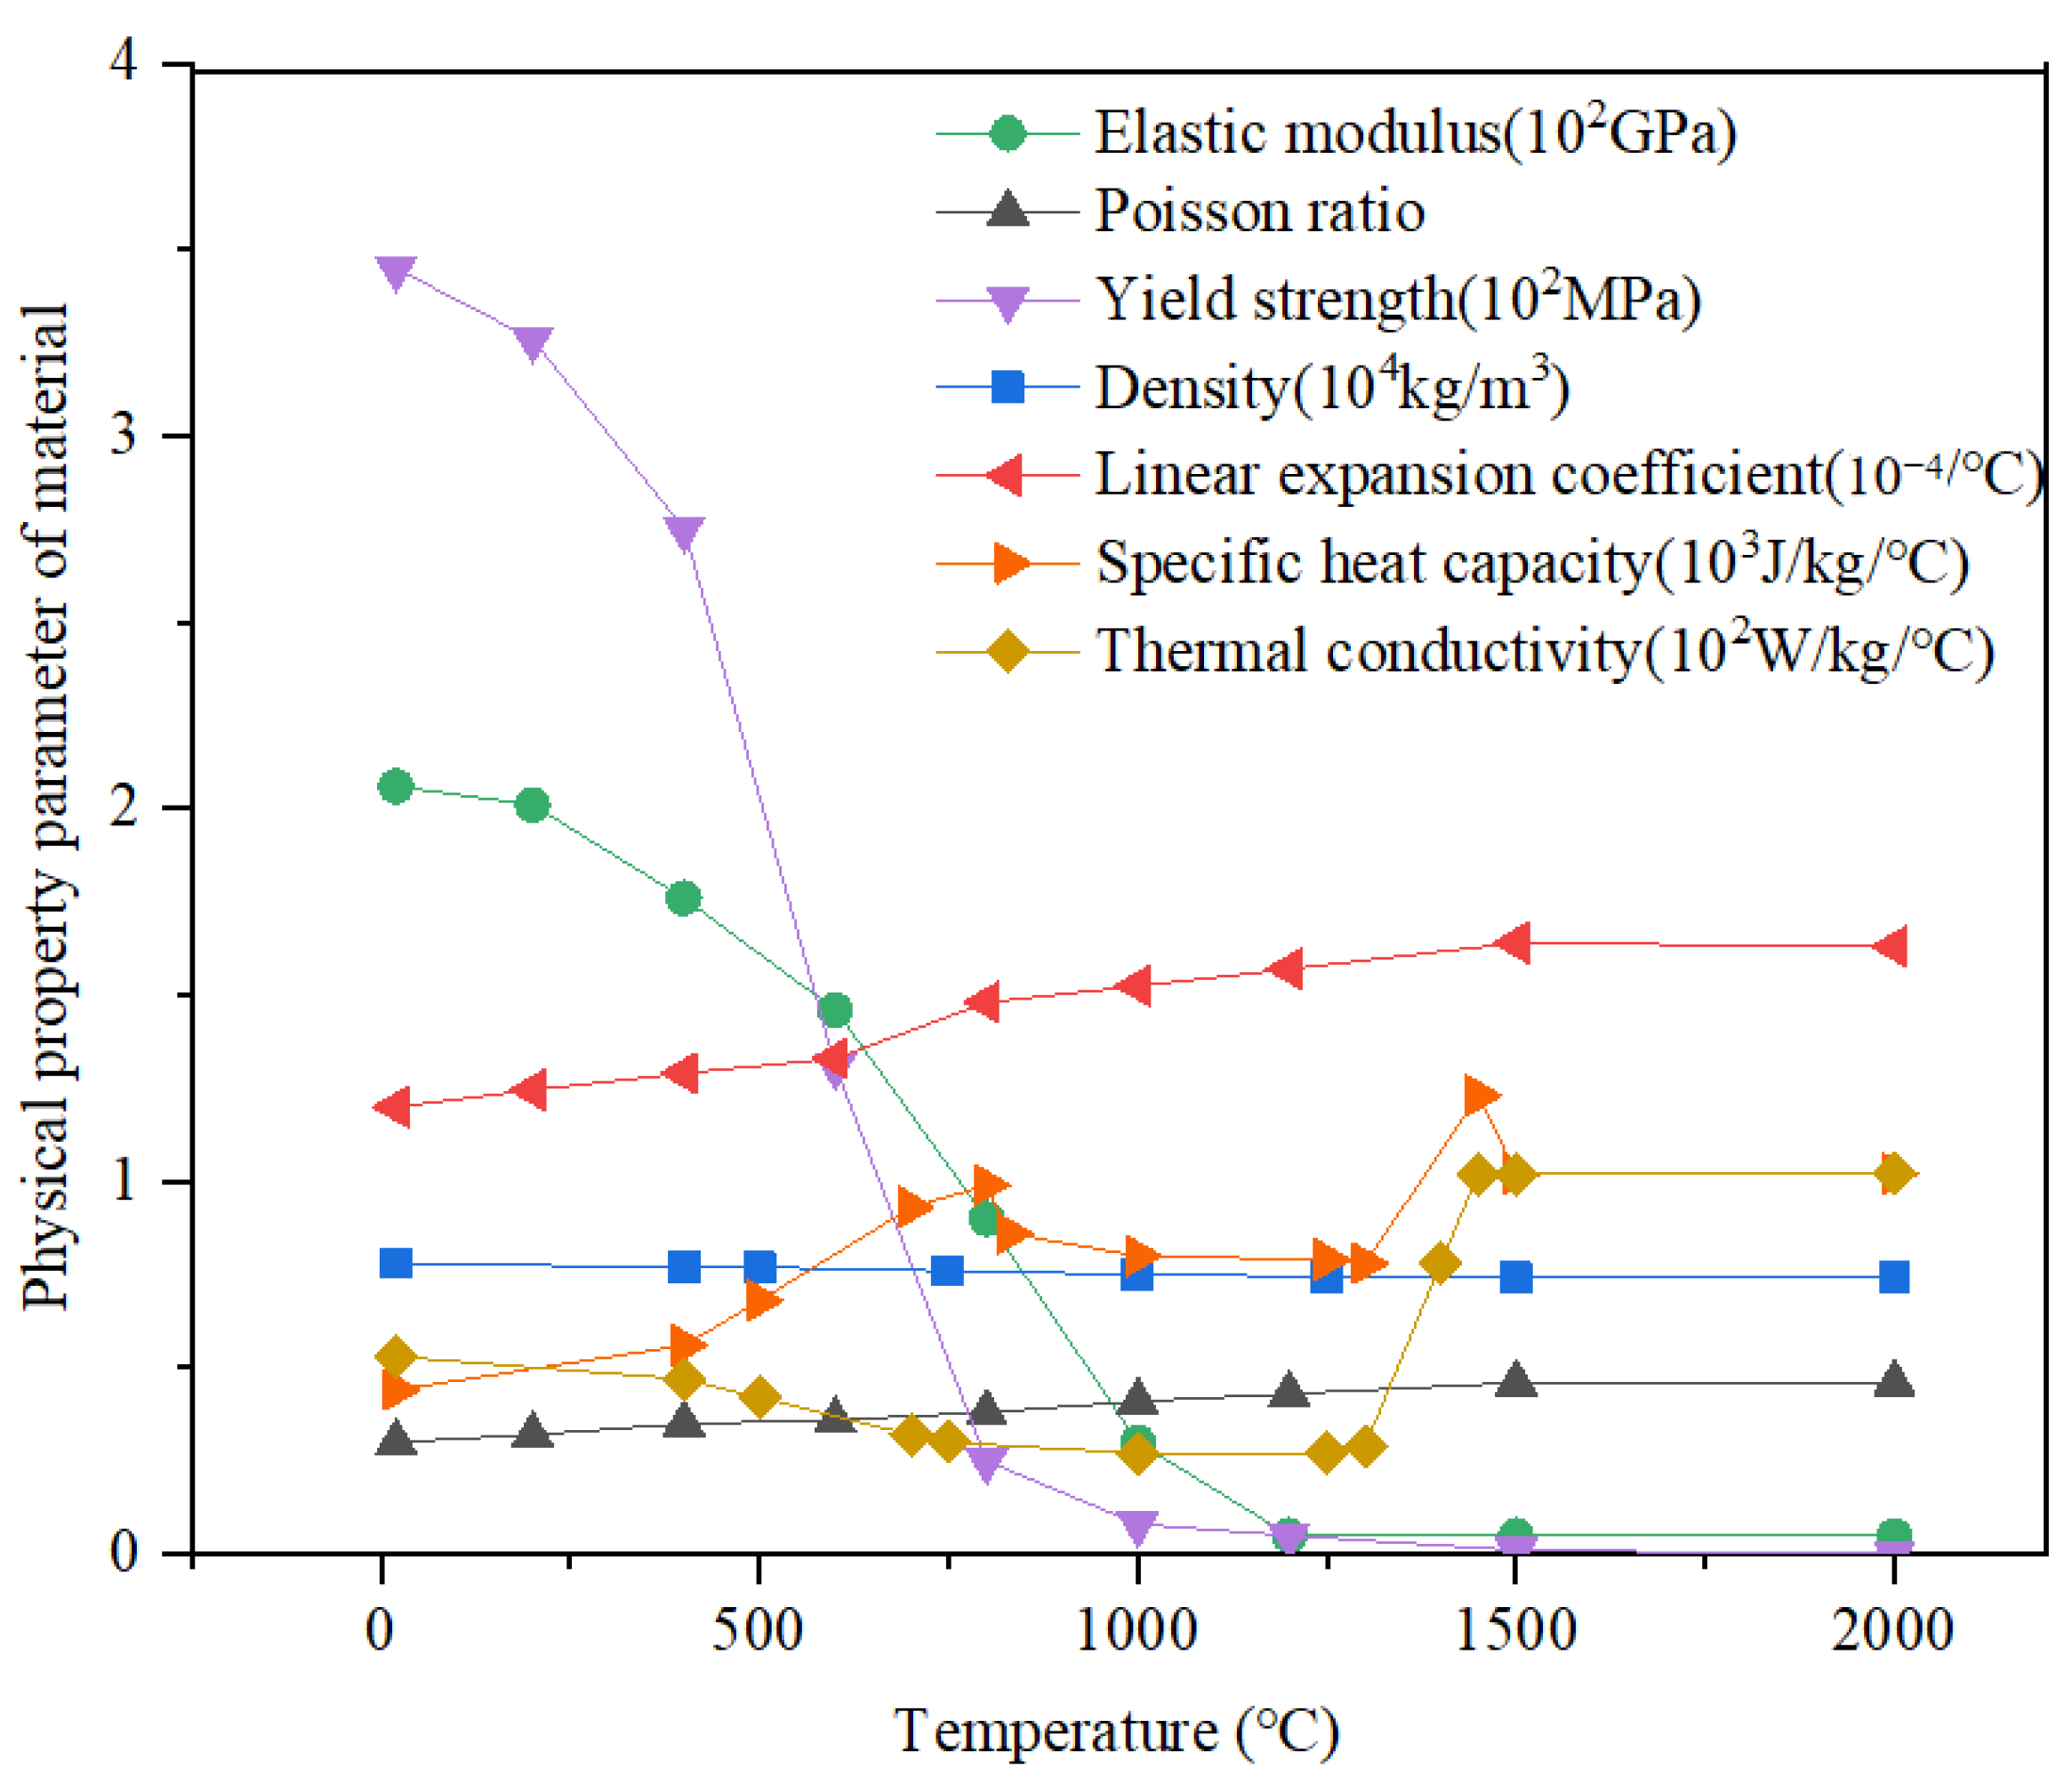
3.2. Thermophysical Properties of Materials

Welding finite element numerical simulation of nonlinear thermophysical parameters of the material is the key factor affecting the calculation of residual welding stress results. This study assumes that the FEM of the CSWs, steel chord plate, and welding electrodes thermophysical are made of Q345 steel. The thermophysical parameters of Q345 are shown in Figure 3, which include elastic modulus, Poisson ratio, yield strength, density, linear expansion coefficient, specific heat capacity, thermal conductivity, etc. The Stefan–Boltzmann constant is 5.67 × 10⁻⁸ W·(m2·°C4)−1 [34]. The convective heat transfer coefficient is affected by many external environmental conditions. In this study, the heat transfer coefficient is assumed to be 20 W/(m2-°C). The radiation heat transfer coefficient, which may be considered to be the proportion of energy stream through the space at the speed of light, and its value is taken as 0.8 in this study [34]. Moreover, the ambient temperature at which the weldment is located is taken as 20 °C.

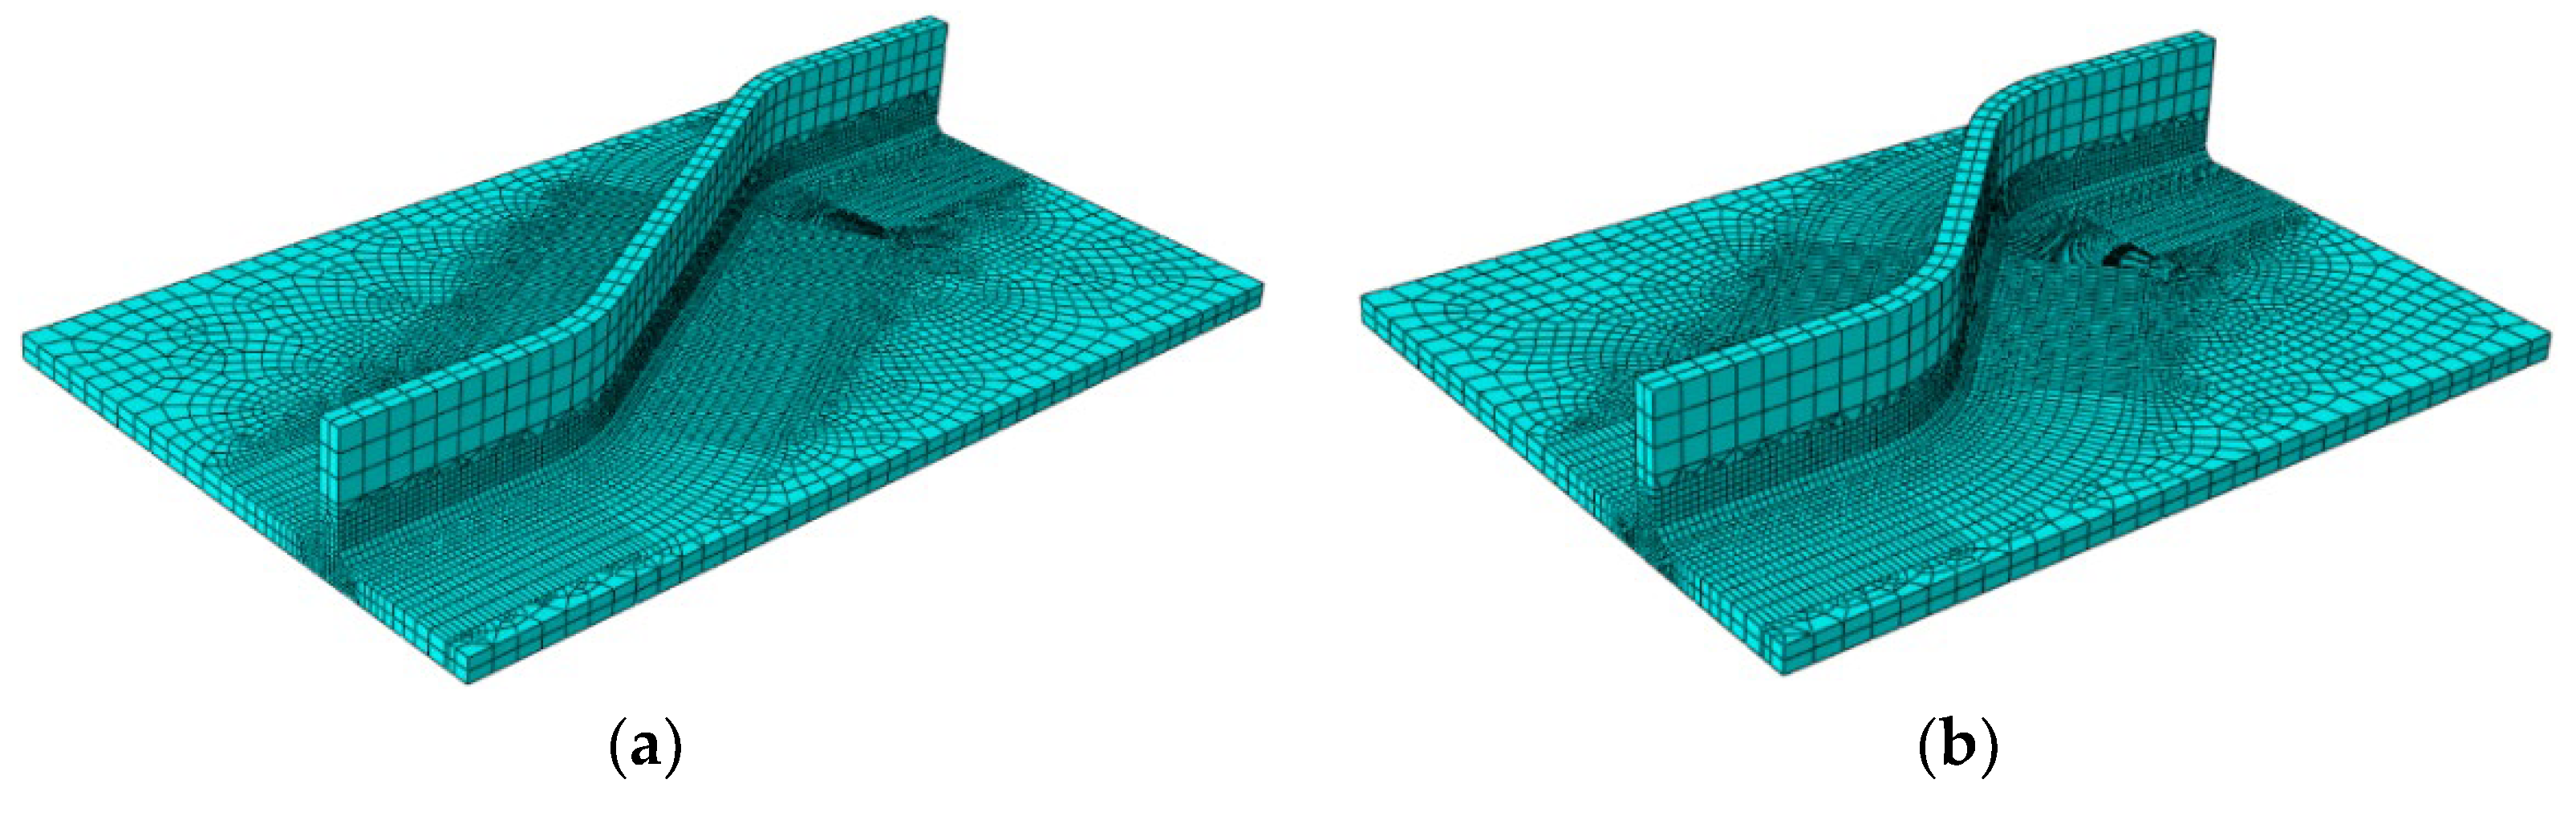
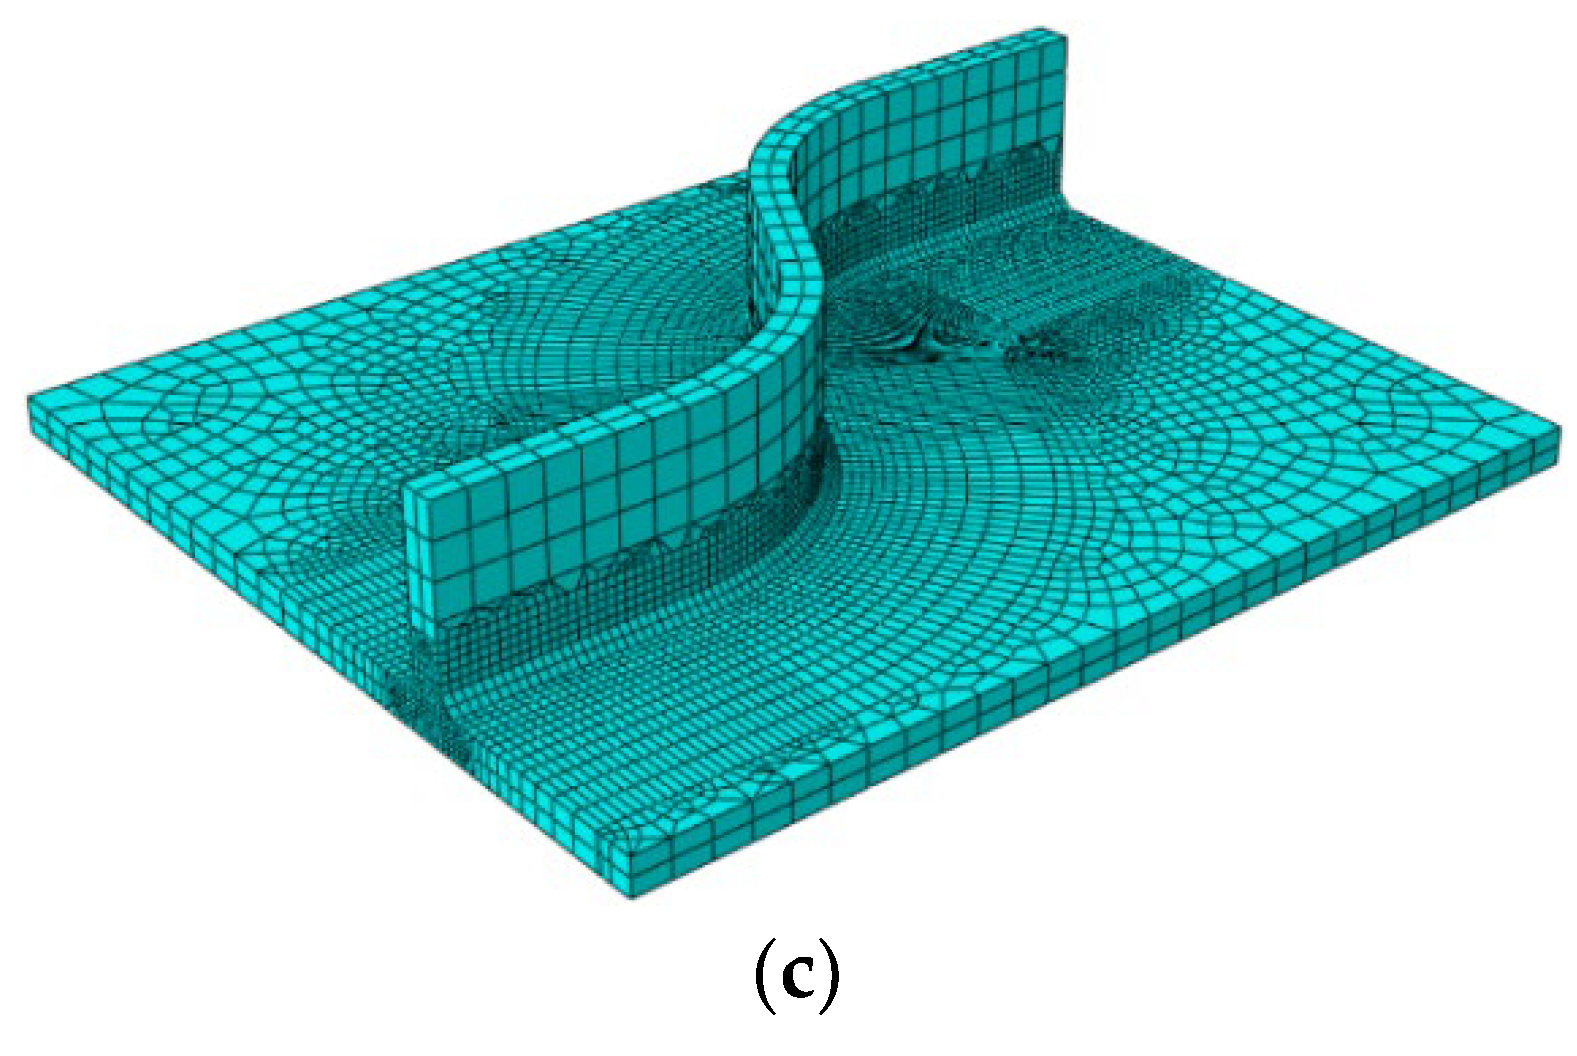
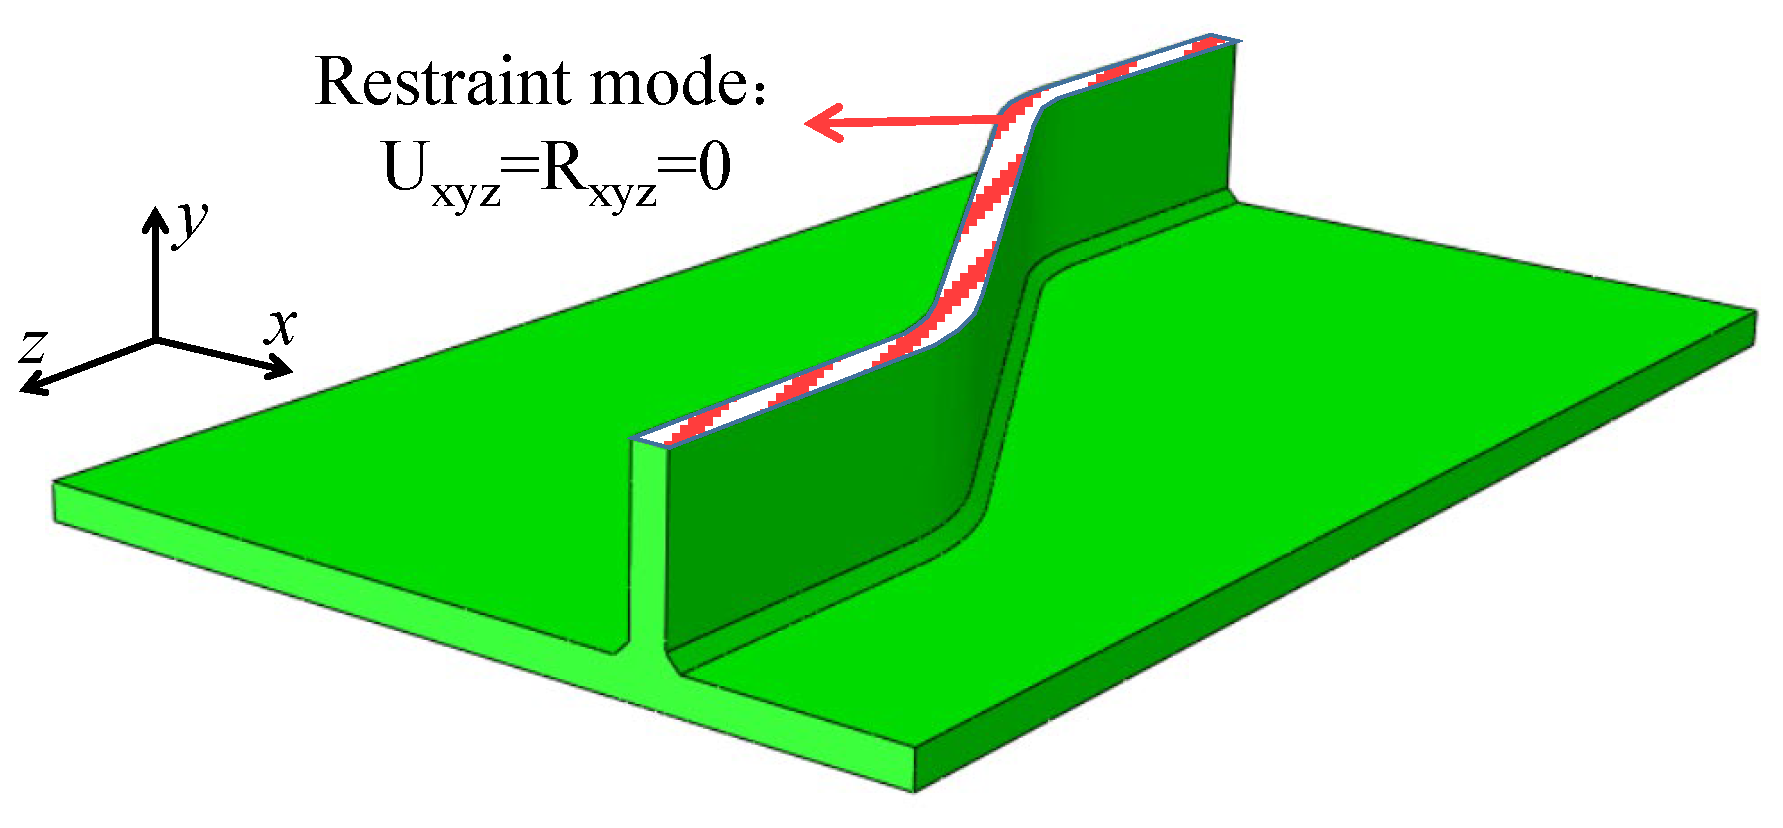
3.3. The FEM for CSWs

The numerical simulation of welding adopts the thermal structural coupling calculation method. The process first calculates the entire weldment from the beginning of the application of the mobile heat source until the weldment cools to the ambient temperature (20 °C) without major differences in the temperature field change process. Because the weld foot size is less than 8 mm, the single side weld of CSWs is welded with one pass. During the welding process, the electrode and the pin shall contact at an angle of 45 degrees. The material was defined using its density, linear expansion coefficient, specific heat capacity, thermal conductivity, Poisson’s ratio and Young’s modulus. The C3D8 eight-node solid element was adopted to simulate the materials. Then, the heat transfer analysis method was selected to simulate the welding process.
The weldment size was established according to Figure 2. Indeed, using a small size global seed will result in accurate simulation; however, it will seriously affect the computational efficiency and cost. In order to ensure the calculation accuracy, this paper establishes four different grid sizes of the flat plate welding model and obtains the longitudinal residual stress results of each model, as shown in Figure 4. It can be seen that when the grid size is 10 mm, the stress distribution near the weld has a large deviation, and when the grid size is reduced to 5 mm, 2.5 mm, and 1 mm, the stress distribution is completely consistent and the maximum stress resulting in good agreement with the data.
In summary, in this study, the mesh size was set to 2.5 mm near the weld, 10 mm away from the weld, and at least two transition zones were divided into other areas to achieve the transition of the mesh size from the transverse and longitudinal directions. The smallest element in such a region was 0.9 mm × 1.0 mm and the number of elements is 29224. The C3D8 element, defined by eight nodes having three degrees of freedom at each node, was used for 3-D modeling the corrugated web. The mesh division models of weld parts with 30°, 45°, and 60° ripple angles are given in Figure 5a–c, respectively. It is worth noting that in order to implement the element birth and death technology with high efficiency, the weld mesh needs to be divided separately. The mesh number with certain regularity along the welding path is obtained by using hexahedral sweep division.
Calculating the temperature field is only a heat transfer process and does not produce rigid displacement at the spatial location. The process does not require setting displacement boundary conditions, while the calculation of the stress field must consider the impact of the deformation of the weldment on the results of the stress field and must give the weldment a displacement boundary condition, while not seriously hindering the development process of residual stresses in the weld at the details of attention, and finally impose thorough consolidated boundary conditions on the steel web away from the weld area, as shown in Figure 6.

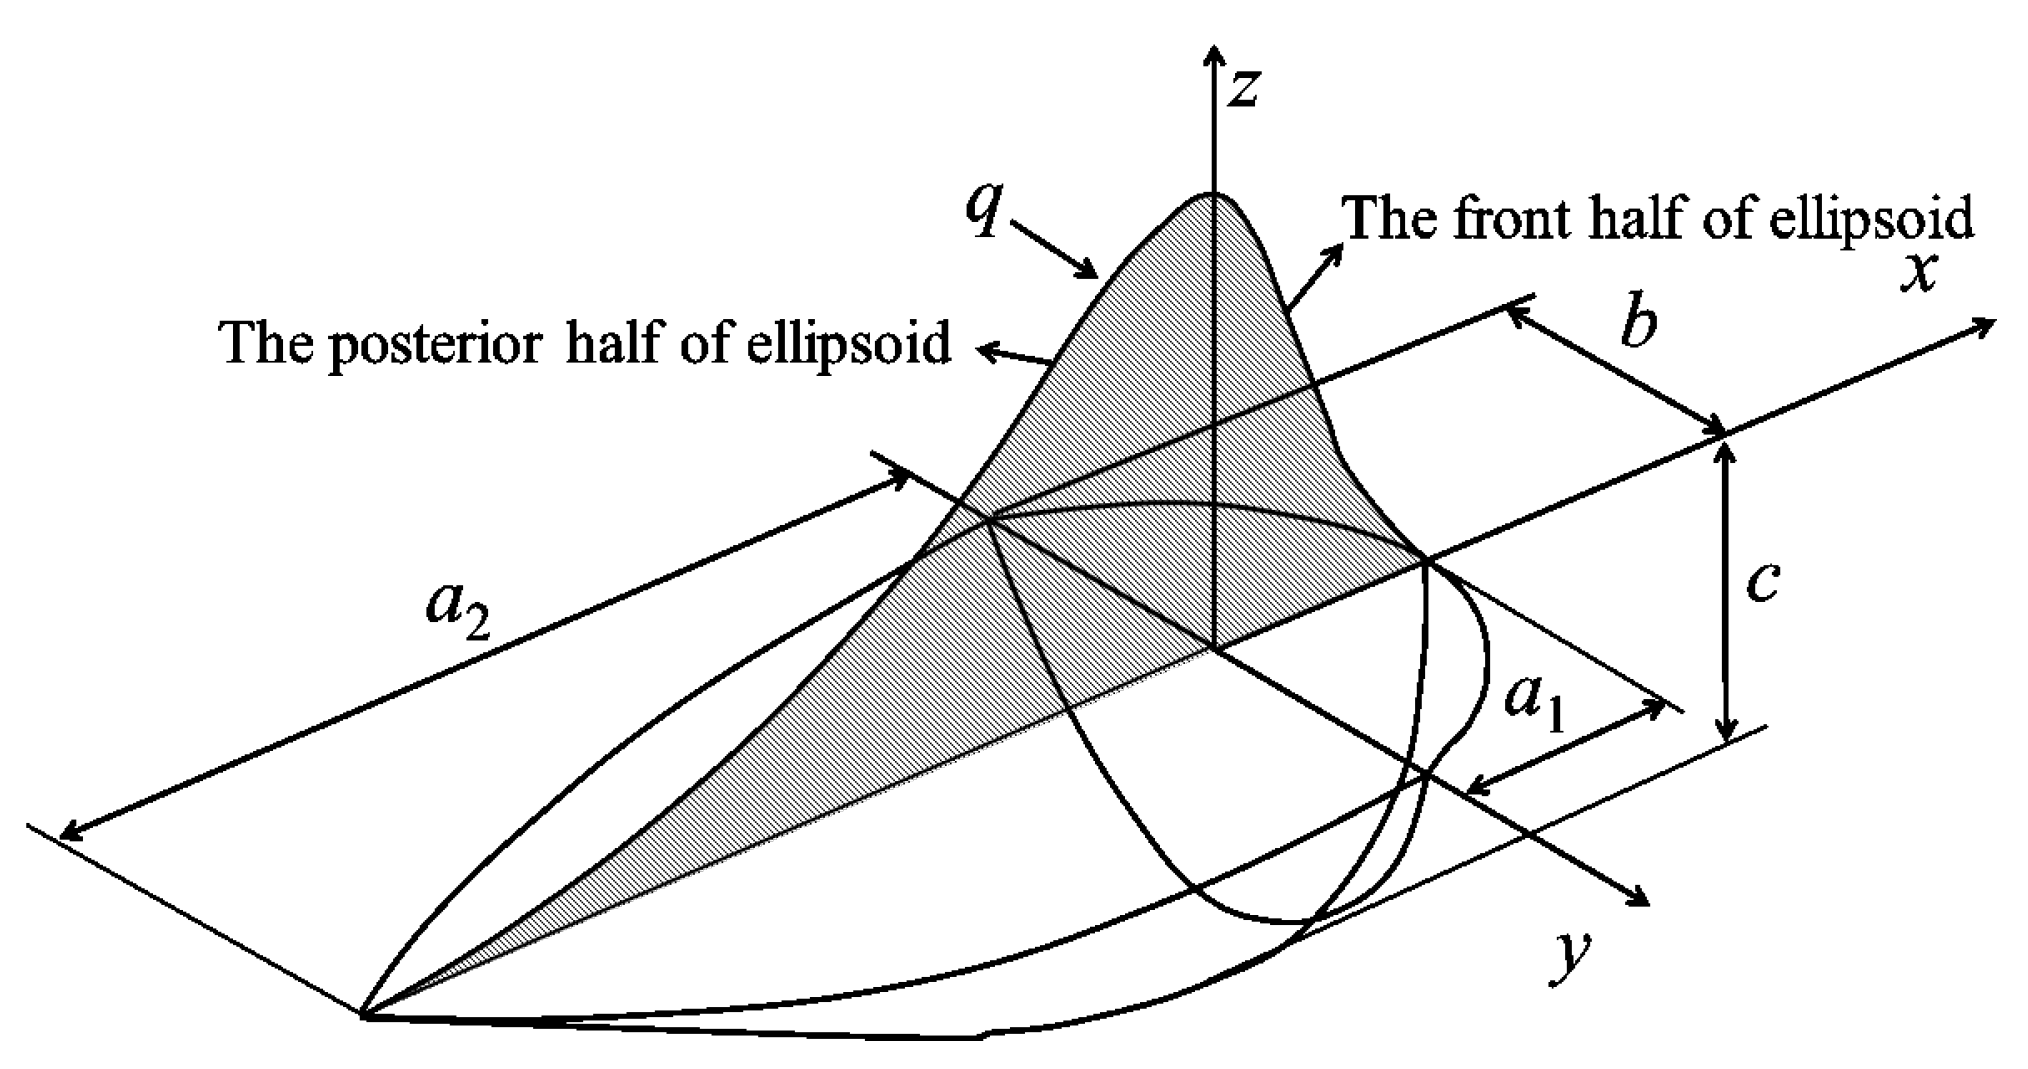
3.4. Welding Heat Source Modeling

The welding heat source parameters directly affect the temperature field changes and distribution of the entire weldment. Accordingly, this study selects the double-ellipsoidal heat model with the parameter shown in Figure 7 to simulate the welding heat source [35]. The front and posterior half of ellipsoid expression can be shown as follows:
q x , y , z = 6 3 f 1 η U I a 1 b c π π exp 3 x 2 a 1 2 + y 2 b 2 + z 2 c 2
q x , y , z = 6 3 f 2 η U I a 2 b c π π exp 3 x 2 a 2 2 + y 2 b 2 + z 2 c 2
where the U and I denote the welding voltage and current, respectively, η denotes heat source efficiency, f1 and f2 denote energy classification function, respectively, and a1, a2, b, and c are the ellipsoidal shape parameters.
The assumed shape parameters of the heat source were verified by comparing the shape of the simulated molten pool with the actual molten pool. The comparison parameters mainly refer to the width and depth of the molten pool. In this study, the initial heat source parameters were set to simulate the temperature field in ABAQUS. The boundary between simulation results and the actual molten pool is compared. In order to calibrate the model, the initial heat source parameters were adjusted, and the above steps were repeated until the simulation results were consistent with the actual molten pool boundary. The calibration approach is shown in Figure 8, and the optimization model of heat source parameters is as follows:
min E = ( W S W M ) 2 + ( D S D M ) 2
where the WS and WS are the width of the simulation results and experiment welding pool, respectively, and DS and DM are the depth of the simulation results and experiment welding pool, respectively.
Figure 9 compares the simulation and experiment welding pool in reference [36]. Table 2 lists the comparison of width and depth of welding pool parameters between test data and FEA data. It shows that the simulated molten pool parameters are in good agreement with the experimental parameters. Moreover, Table 3 lists the final parameters of welding heat sources.

4. Welding Temperature Field of CSWs

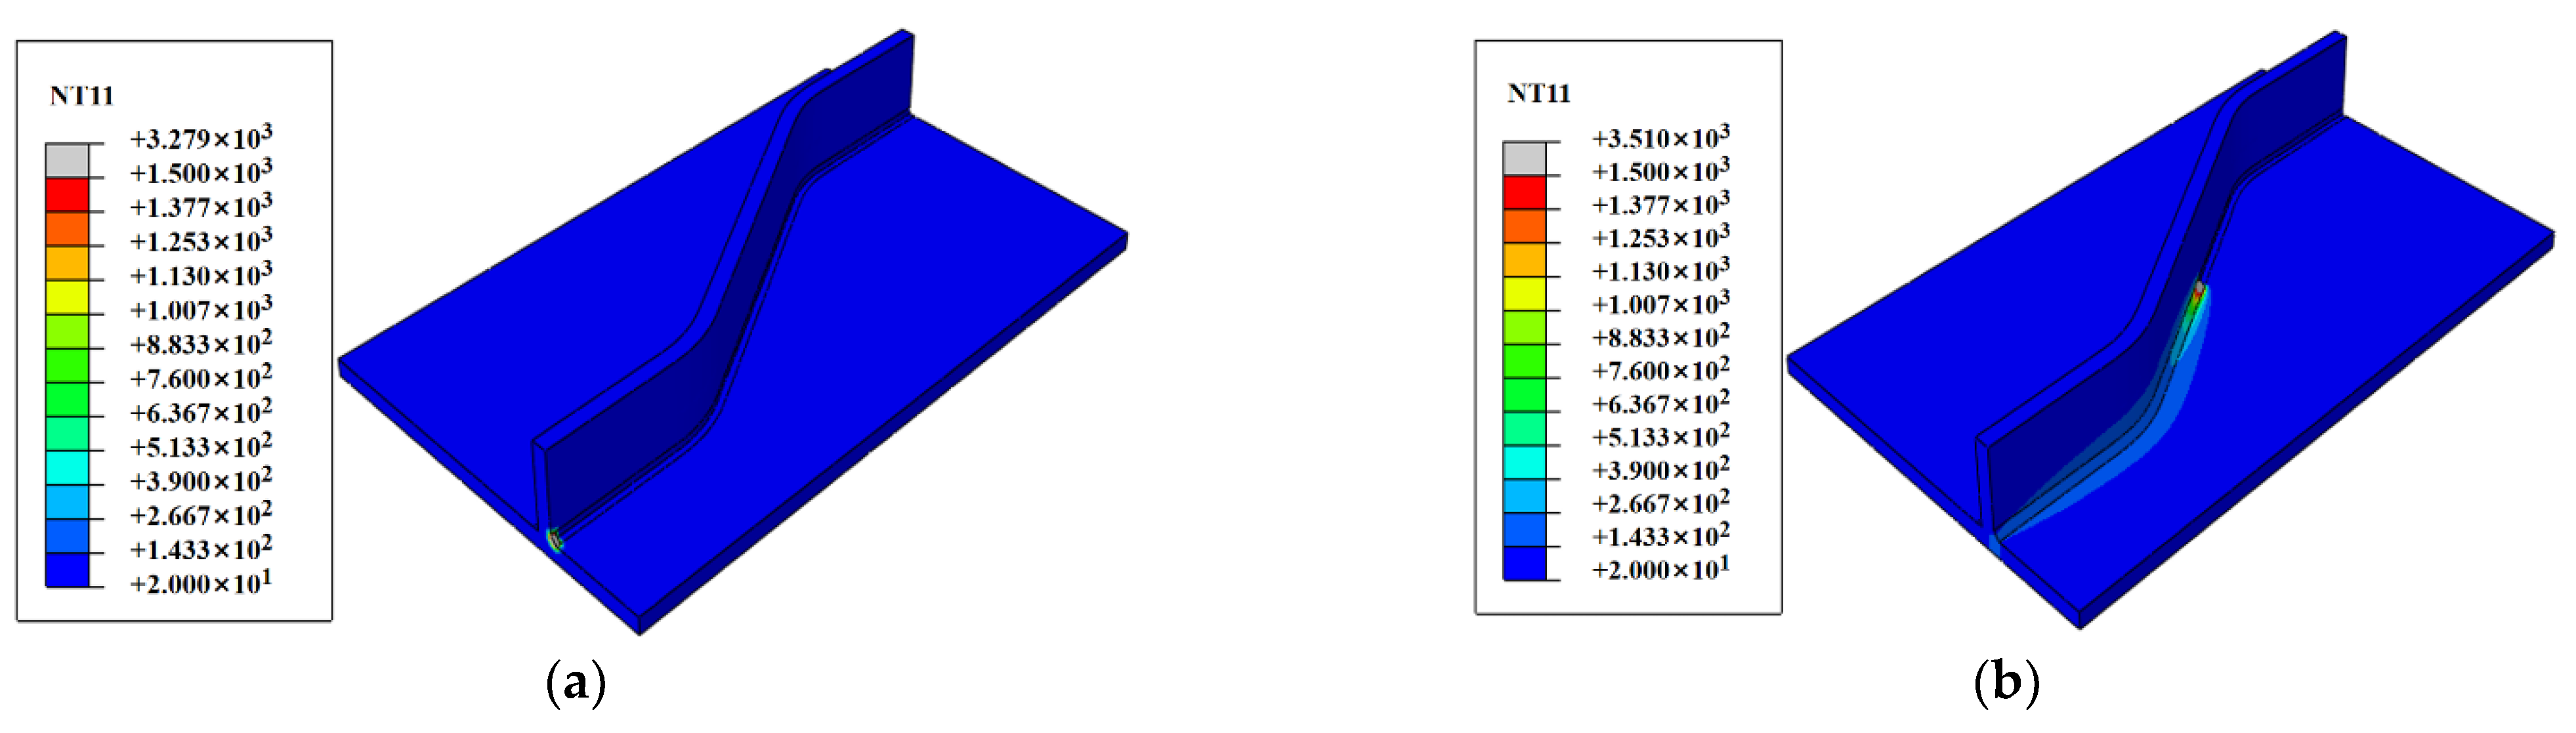
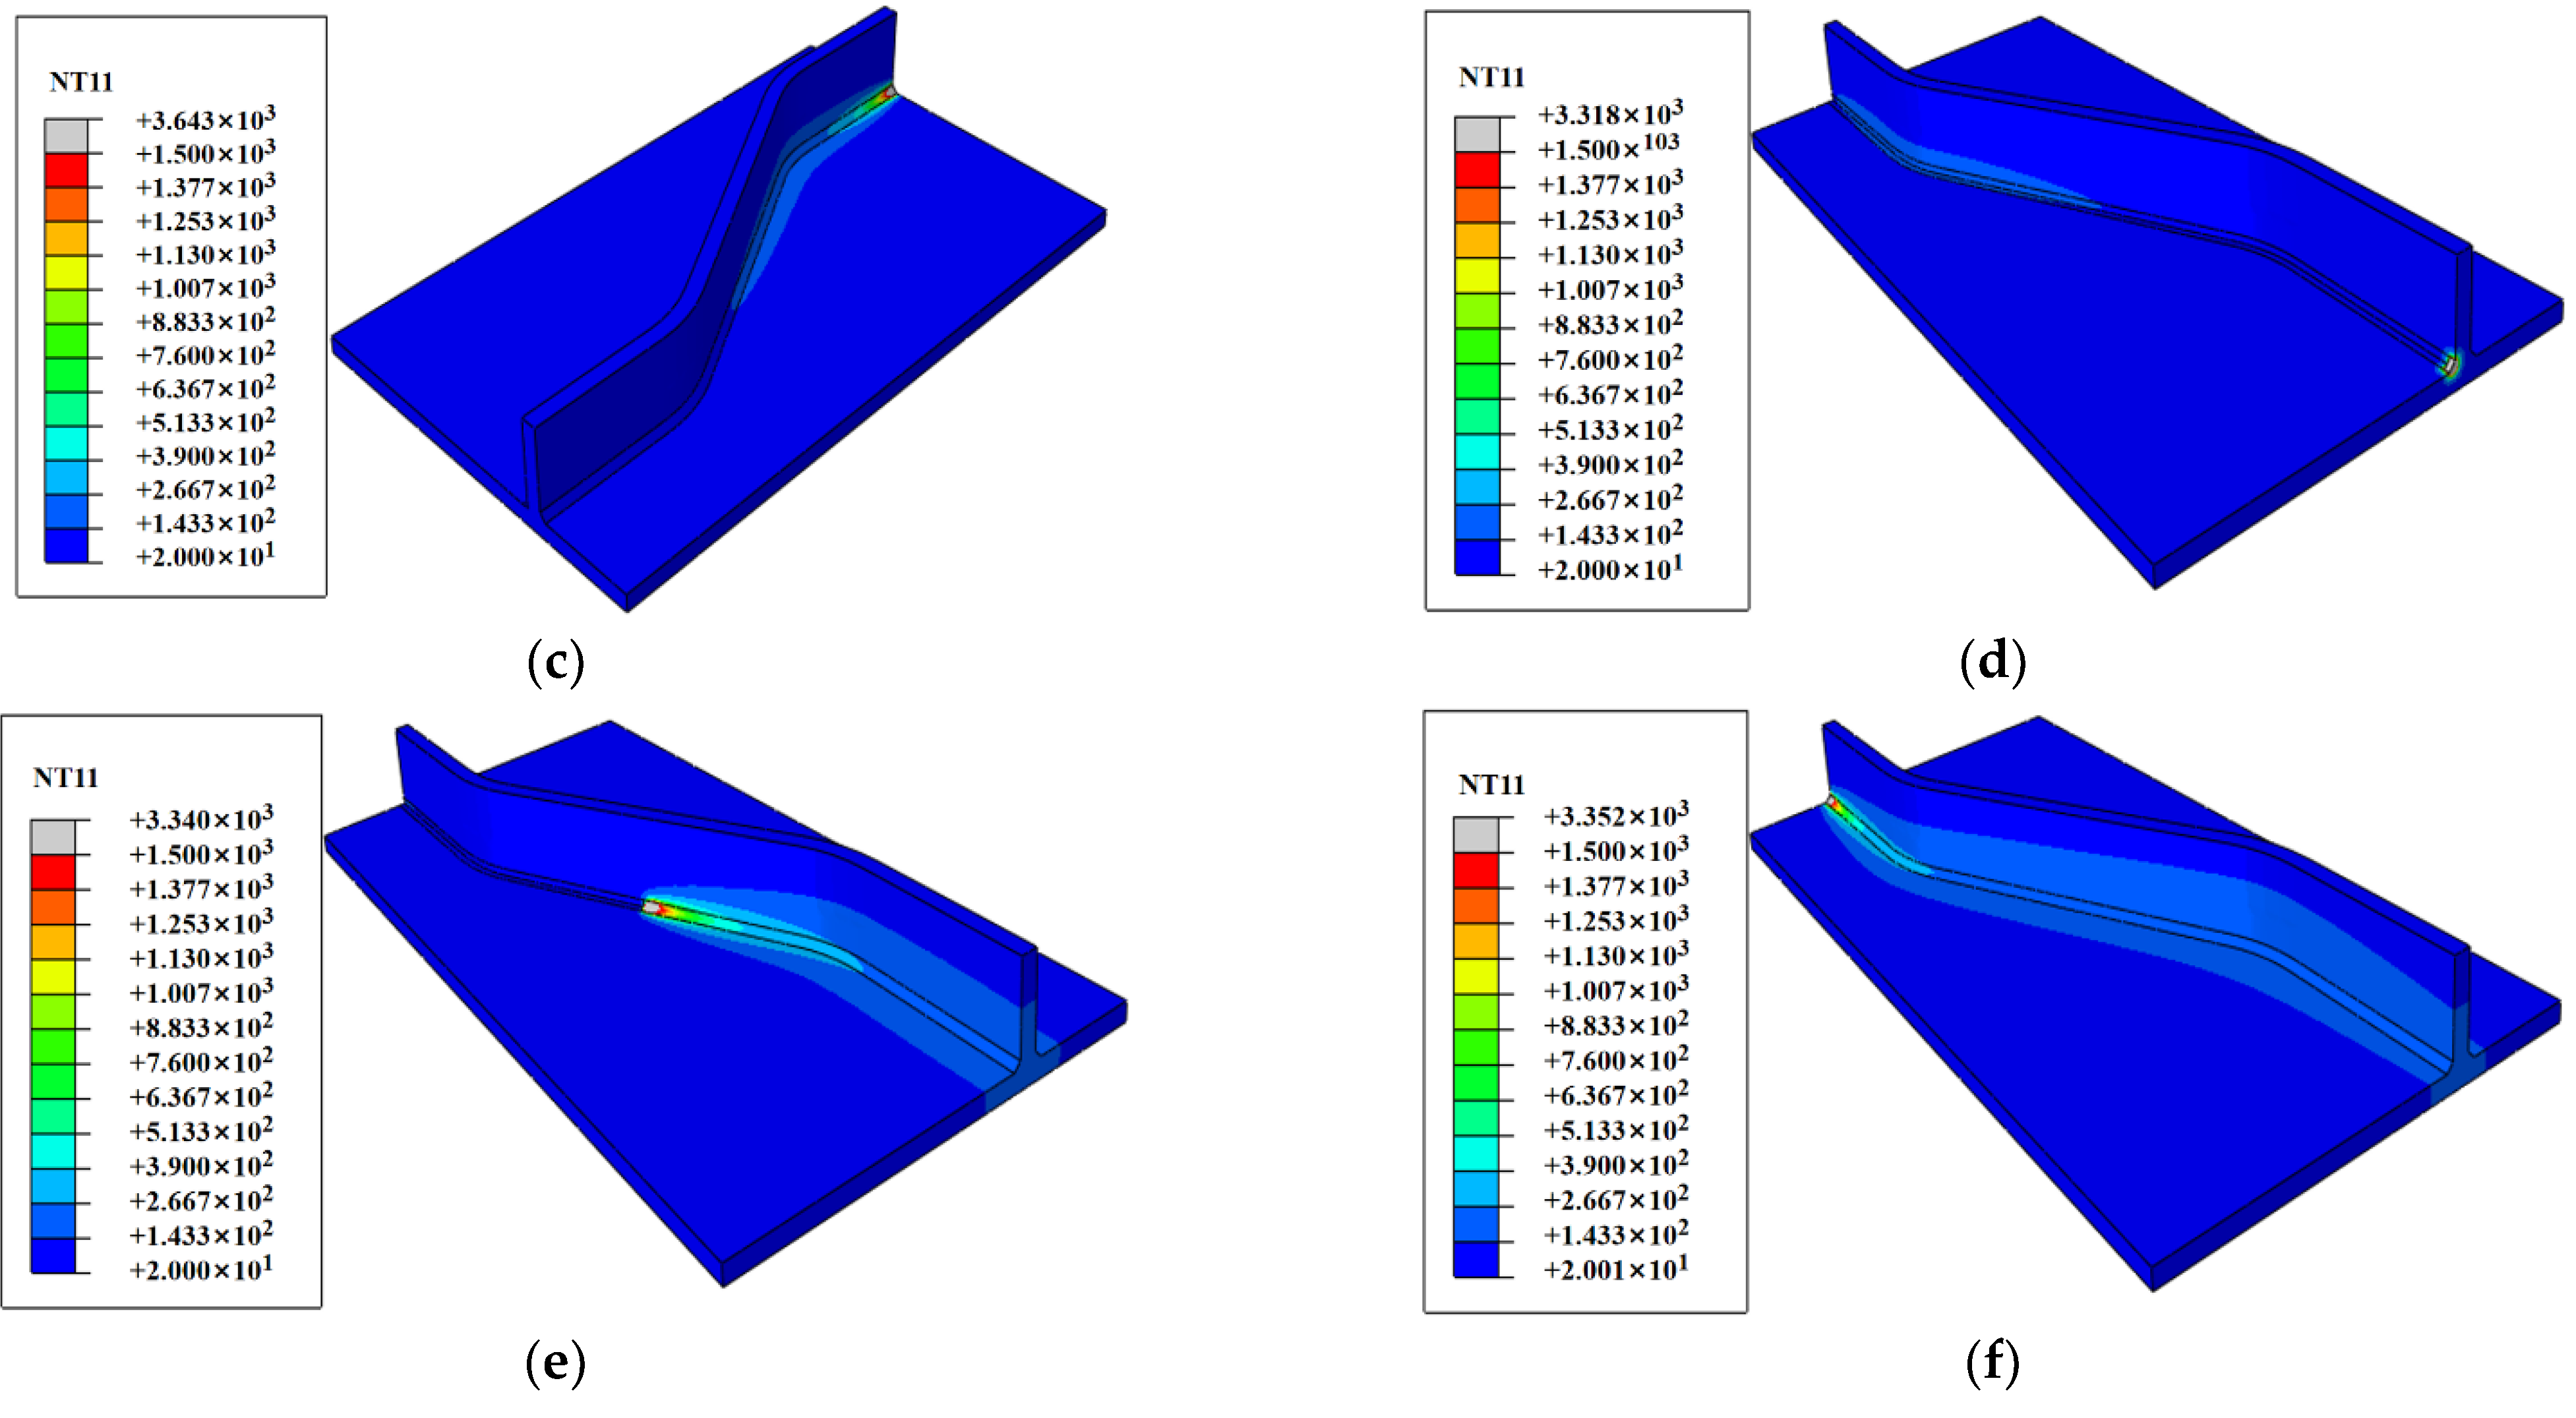
4.1. Variation of Temperature Field Cloud in the Welding Process

Figure 10 shows the time course of the temperature field cloud diagram during the welding phase of the weldment and the entire welding process for 346 s. It can be seen that the distribution of the temperature field on a double-sided welding weldment with a 30° corrugated angle depends on the location of the moving heat source, with the temperature in the area where the heat source arrives rising rapidly to exceed the melting point temperature of the steel (approximately 1500 °C), gradually decreasing in the high-temperature area as the heat source gradually moves away, and then rising again when the second weld passes over the area due to the difference in the location of the heat source center.
Figure 11 shows the time course of the temperature field cloud diagram during the cooling phase of the weldment and the entire cooling process for 3000 s. It can be observed that the temperature of the entire weldment gradually decreases when the weldment is completed and eventually decreases to approximately 26–29 °C after 3000 s, which can be considered as a gradual cooling of the weldment temperature to the room temperature.

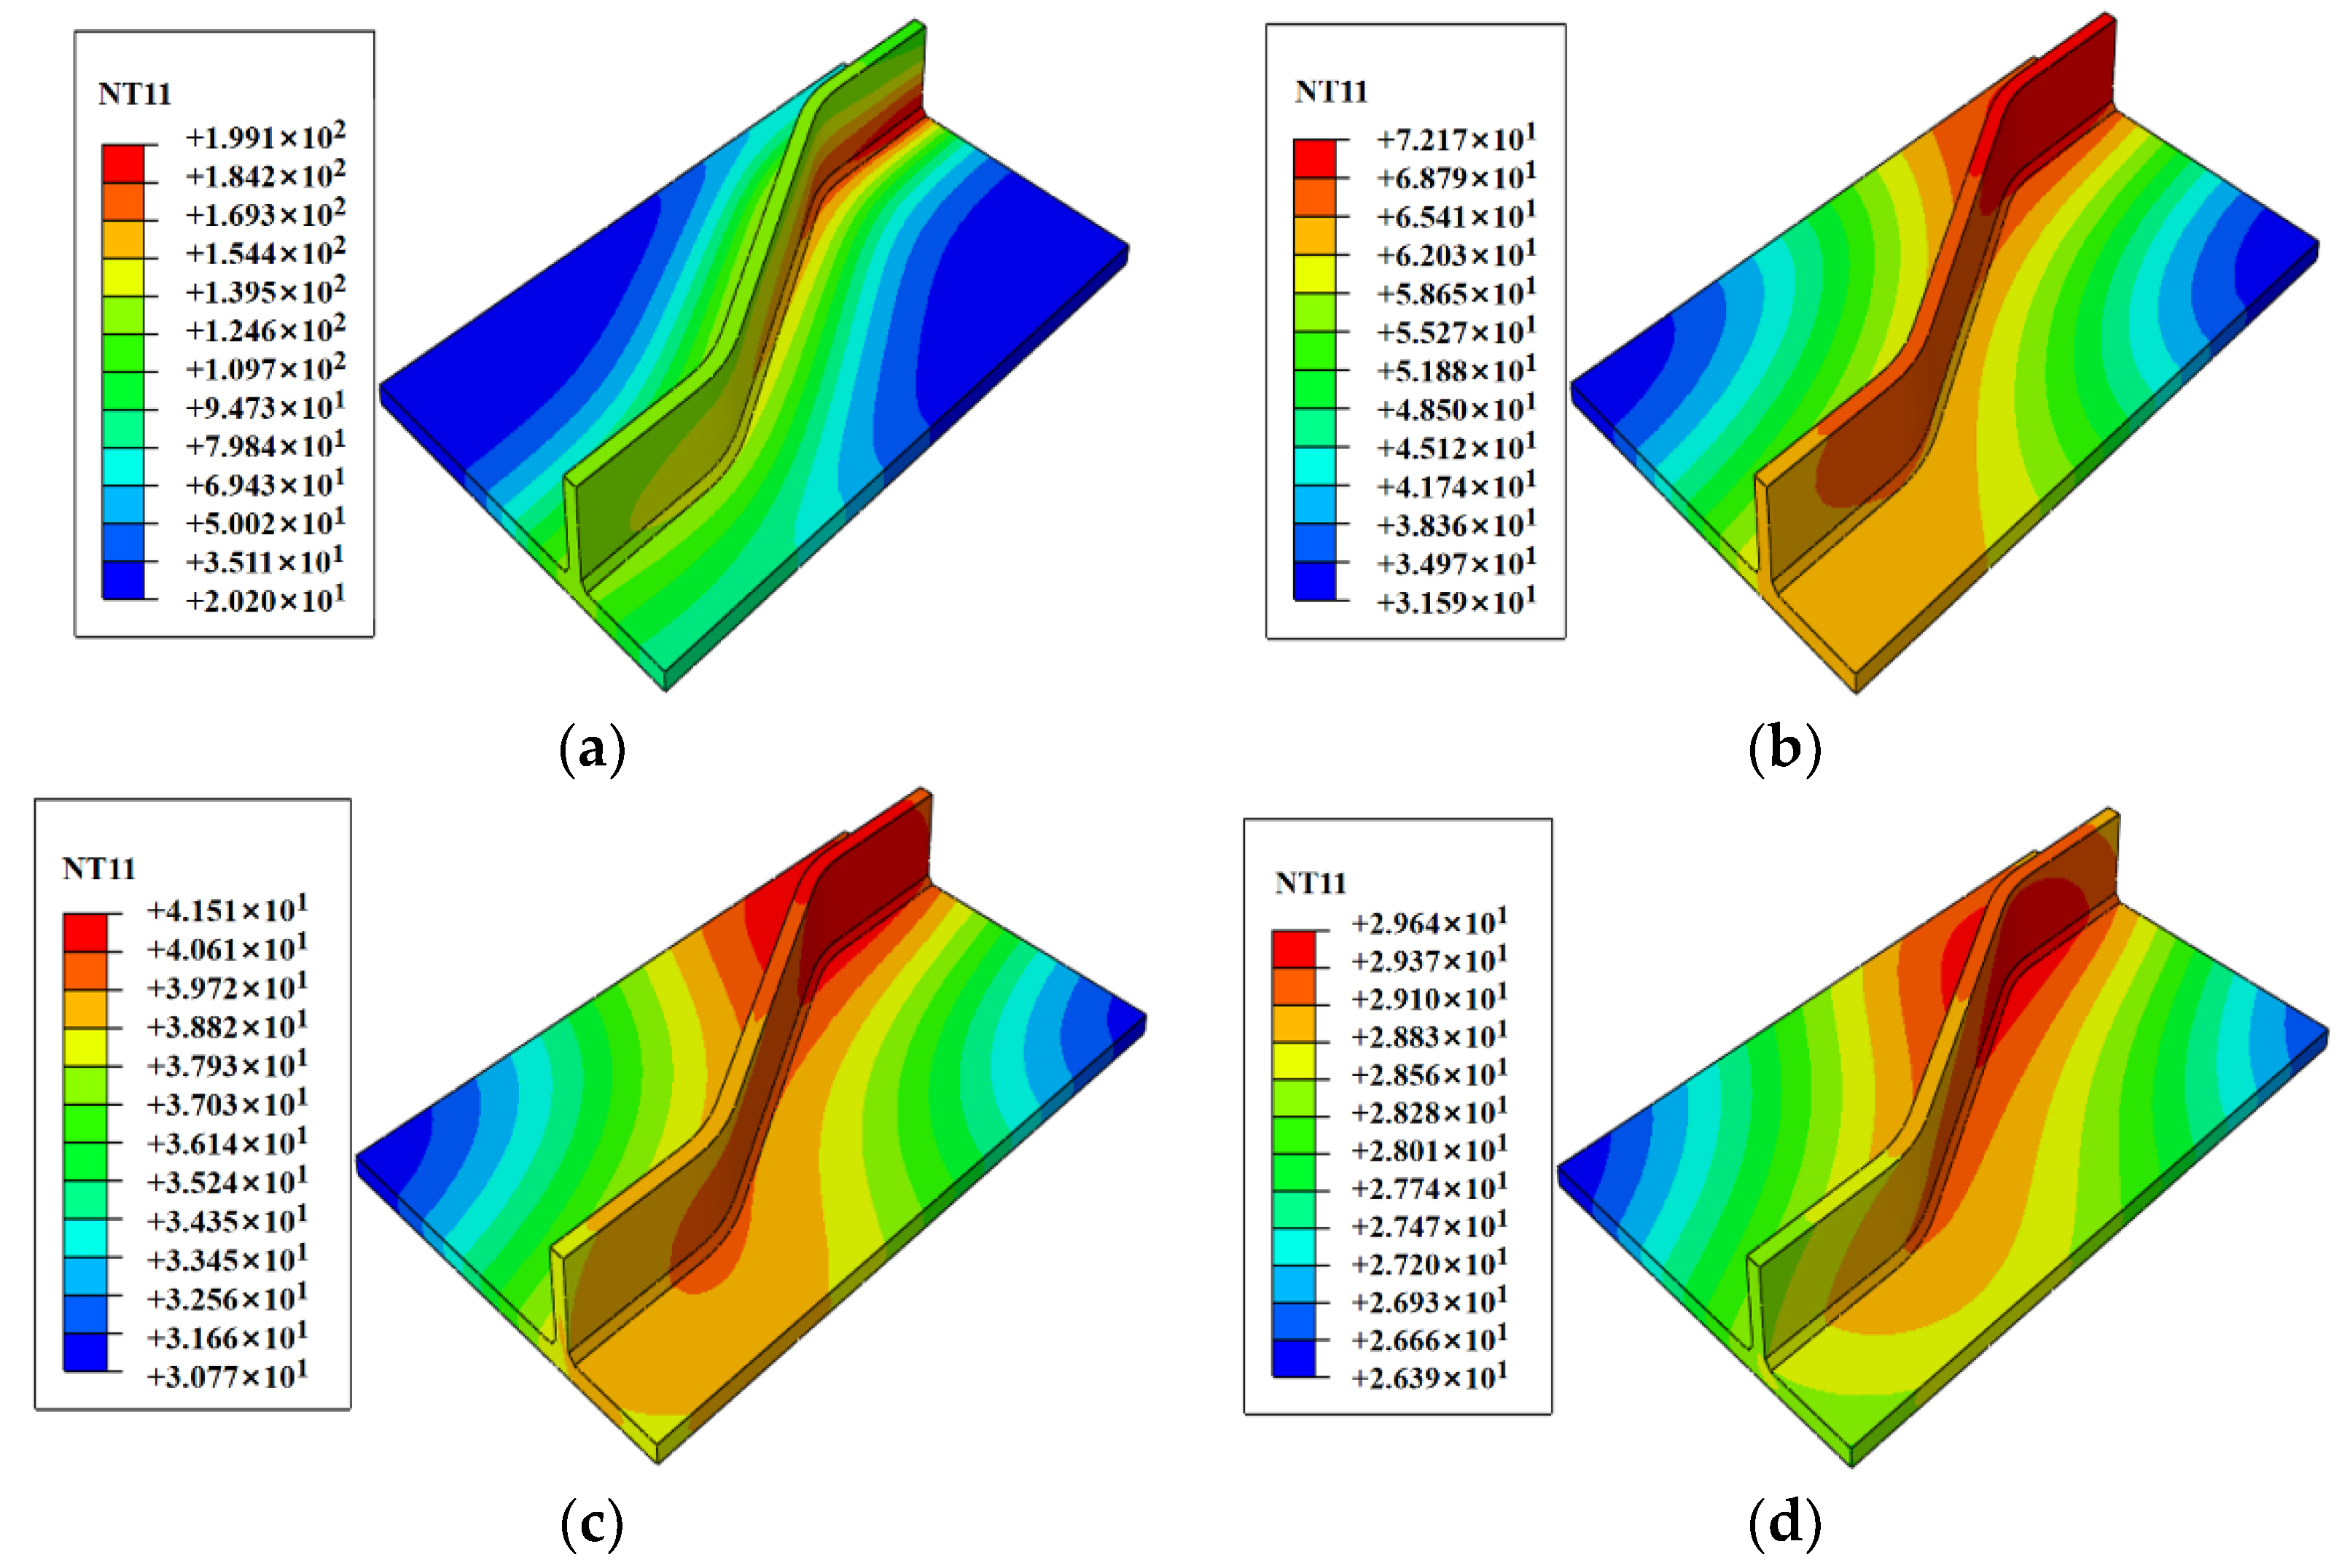
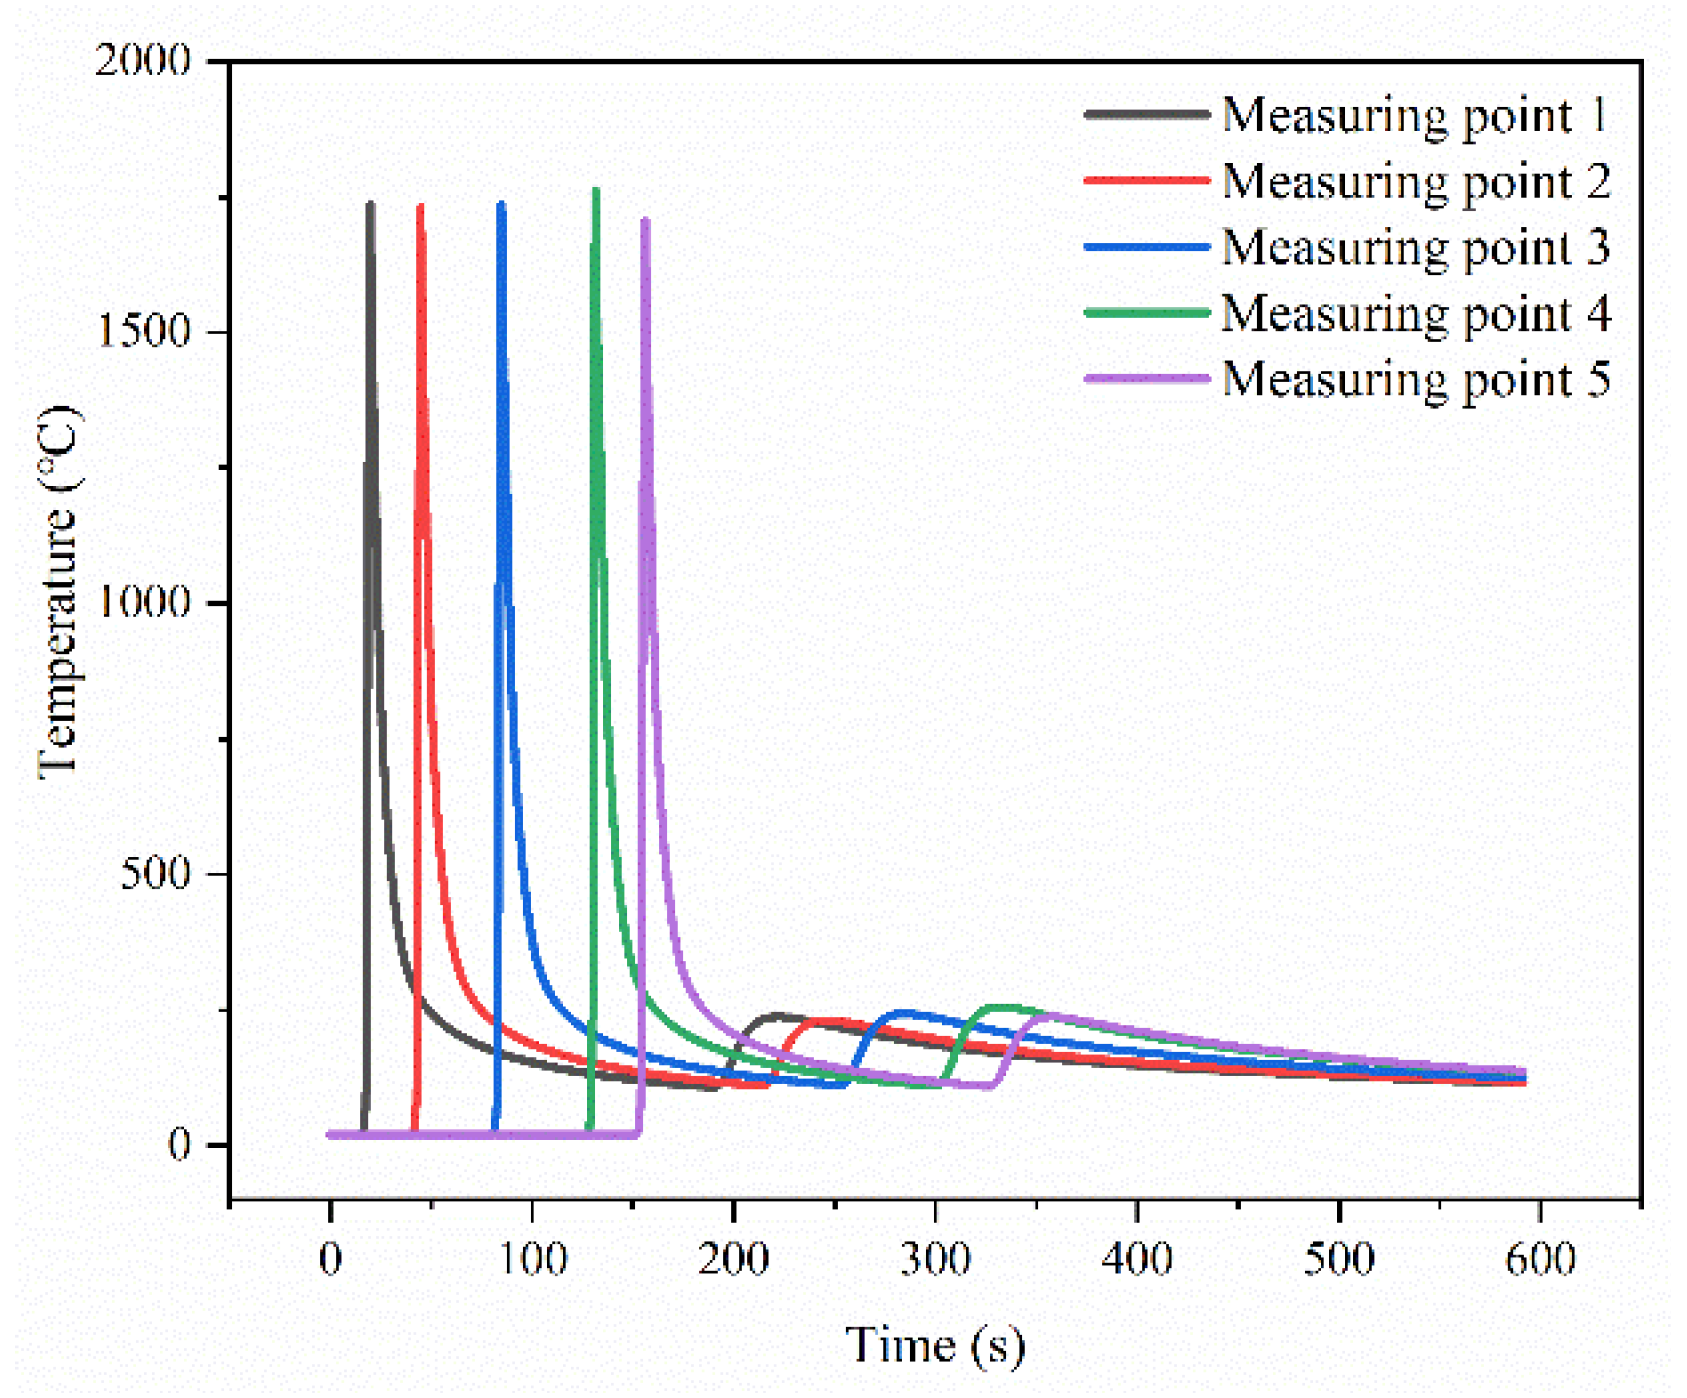
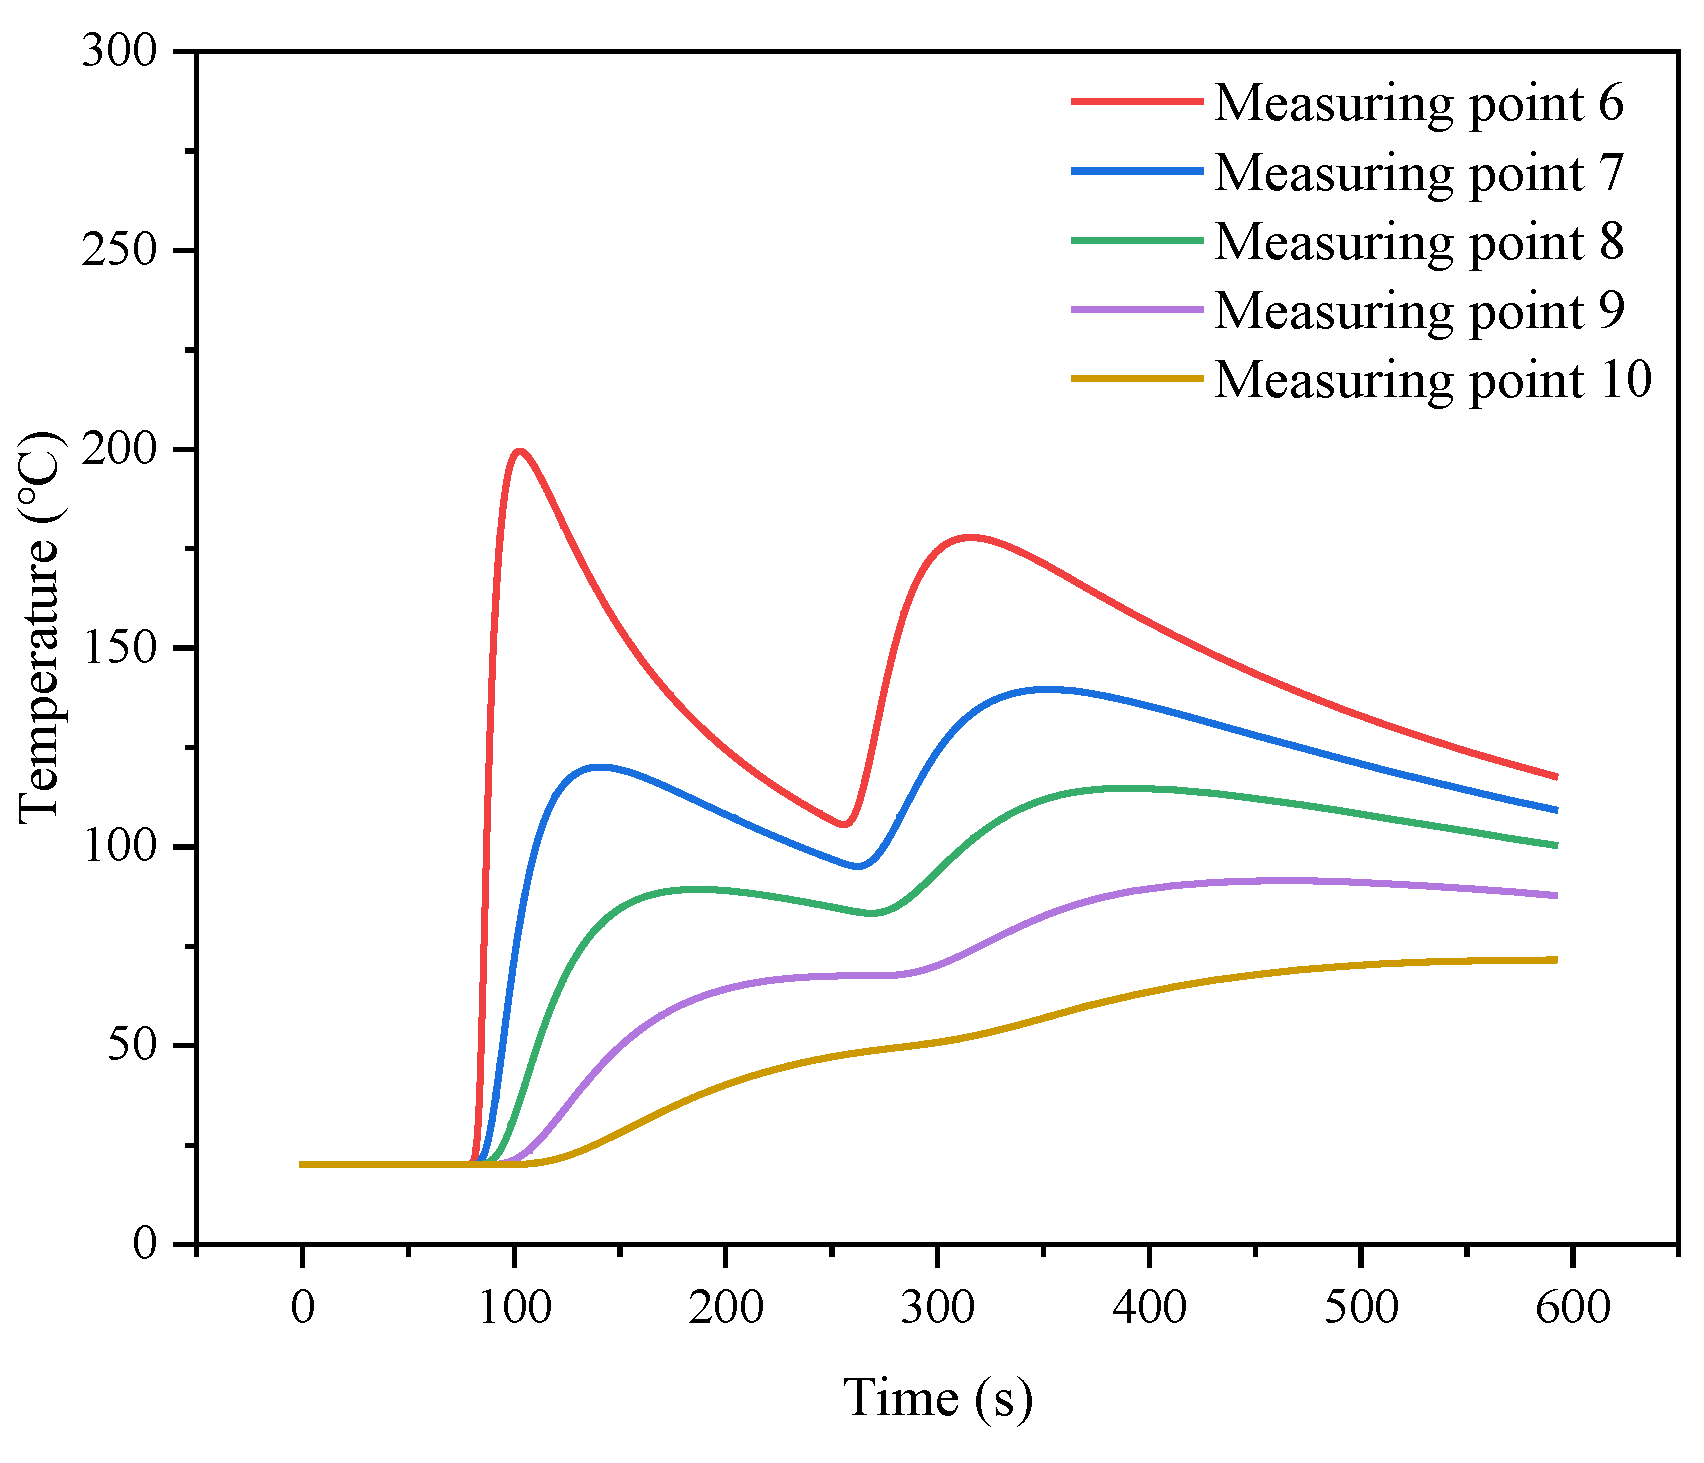
4.2. Time-Varying Analysis of Temperature Field

Figure 12 shows the first welding path with measurement point 1 to point 5 in path 1, which includes the center of the straight edge, the center of the corner area, and the center of the oblique straight edge. In order to study the temperature field course changes away from the weld region, Figure 12 shows the measurement from points 6 to 10 in path 2. Figure 13 shows that the temperature of each measurement point in path 1 changes with the movement of the heat source. When the heat source moves near the measurement point, the temperature of the measurement point rises sharply to approximately 1700 °C. Furthermore, the temperature shows a rising trend, with the heat source in the second weld being close to the measurement point. Figure 14 shows the temperature–time history curve of the measurement points in path 2. It can be seen that the temperature peak decreases as the measuring point moves away from the weld.

5. Result

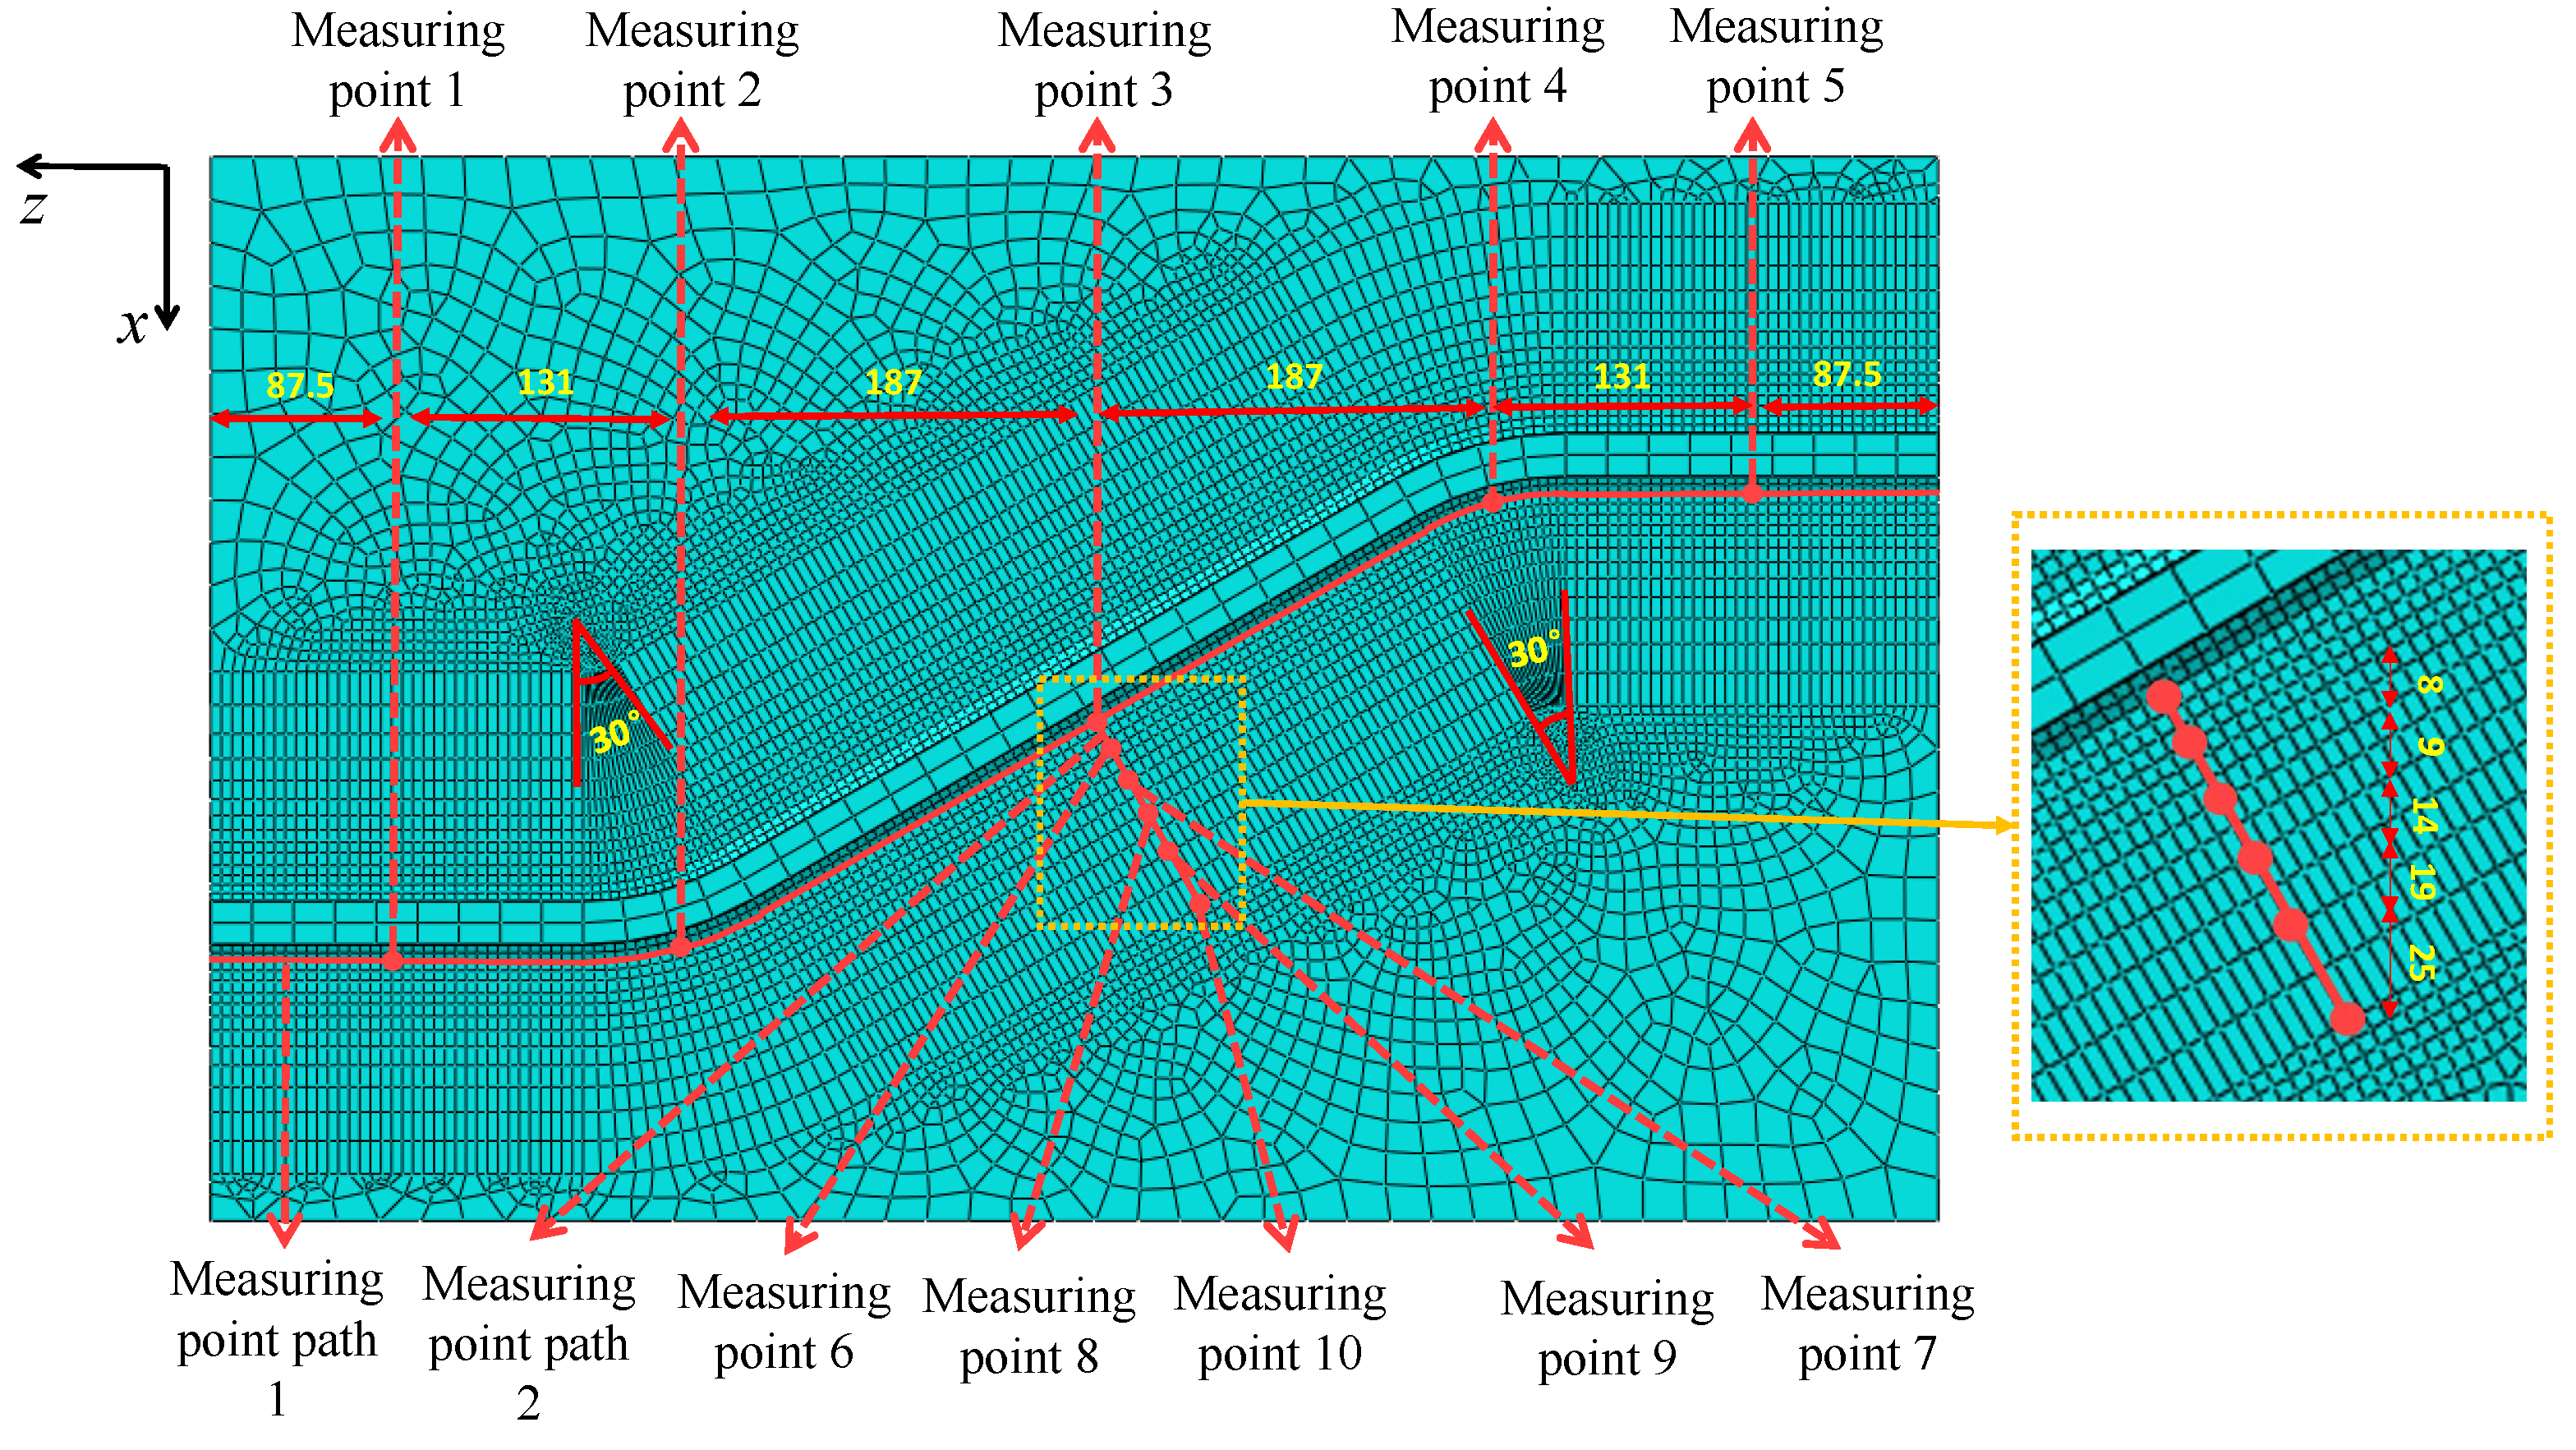
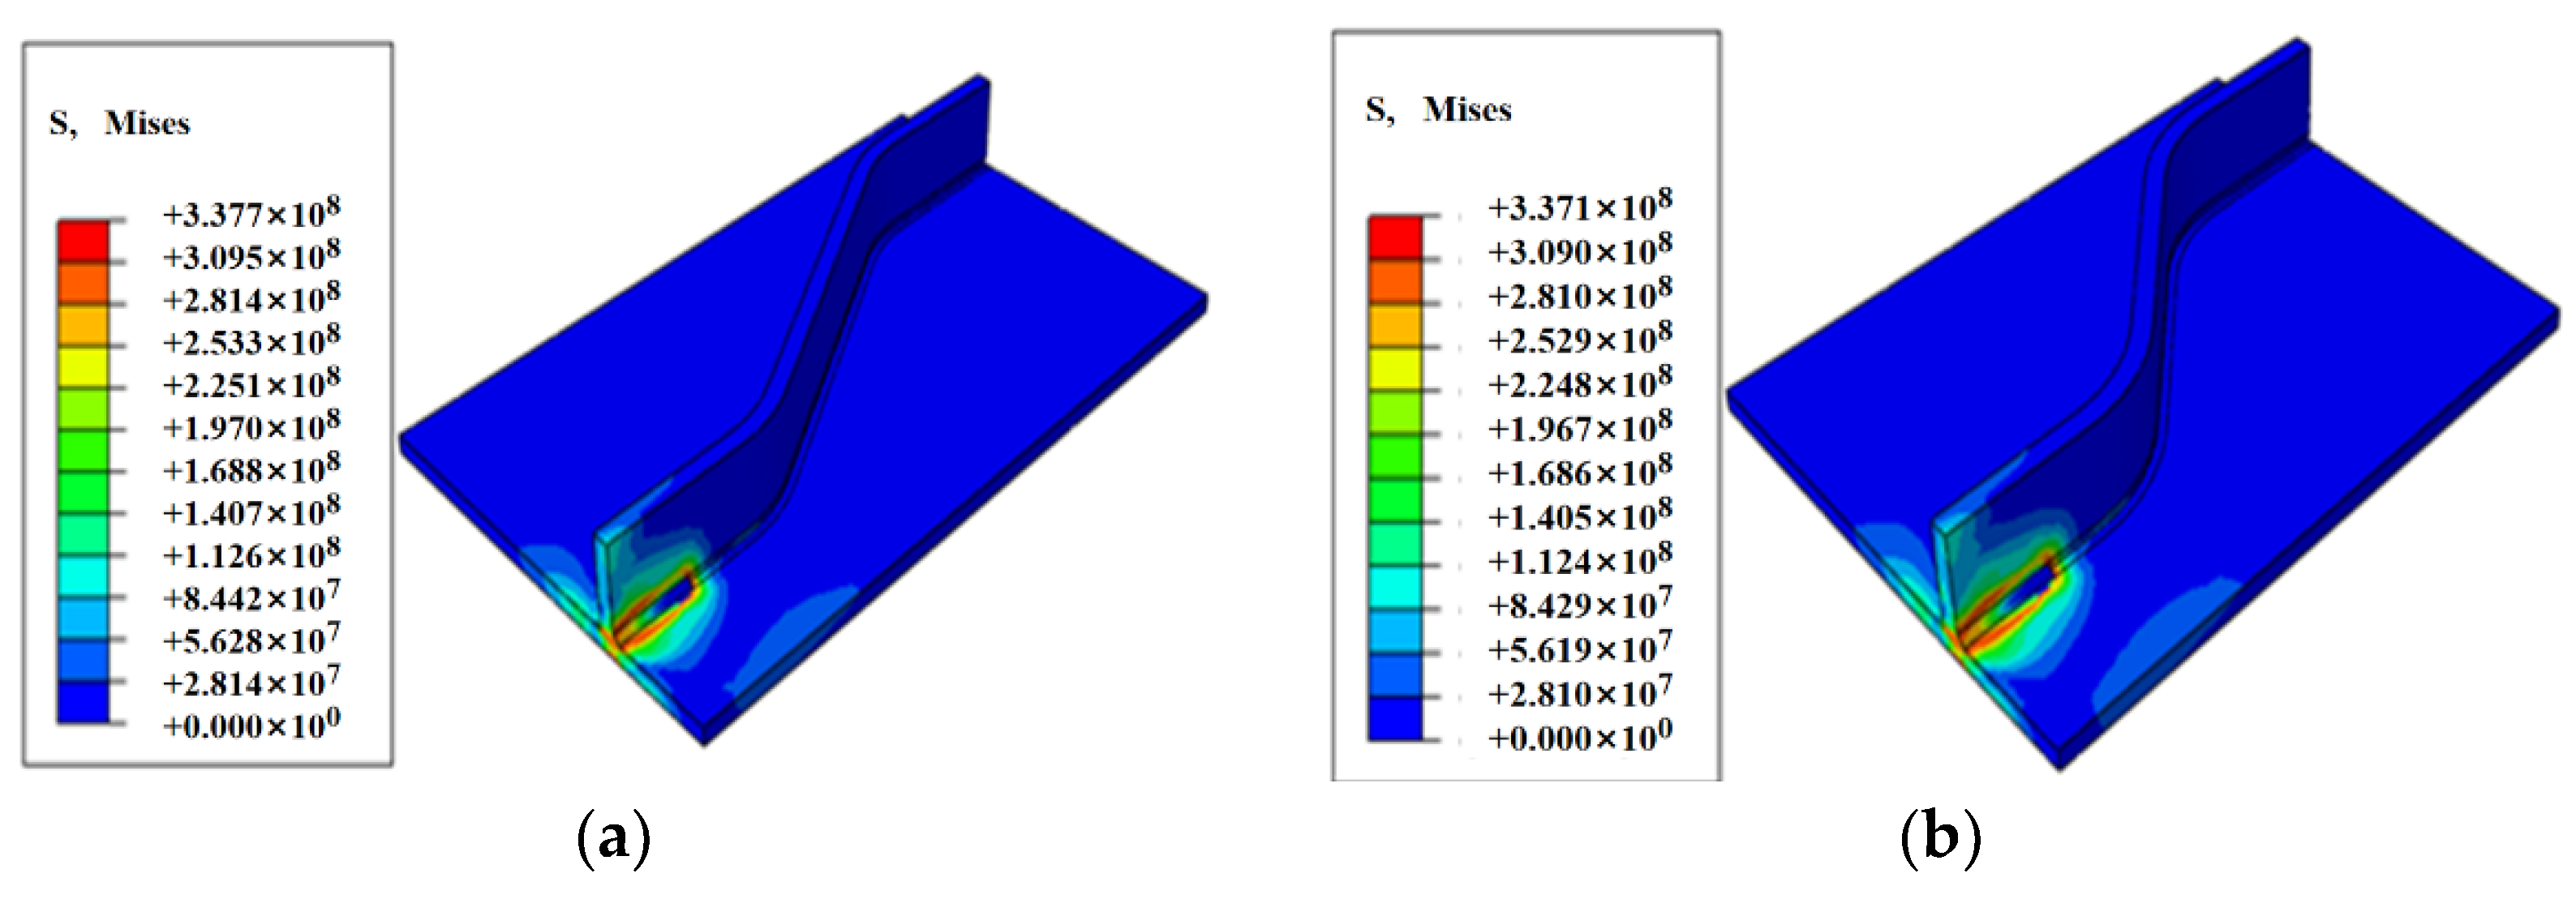
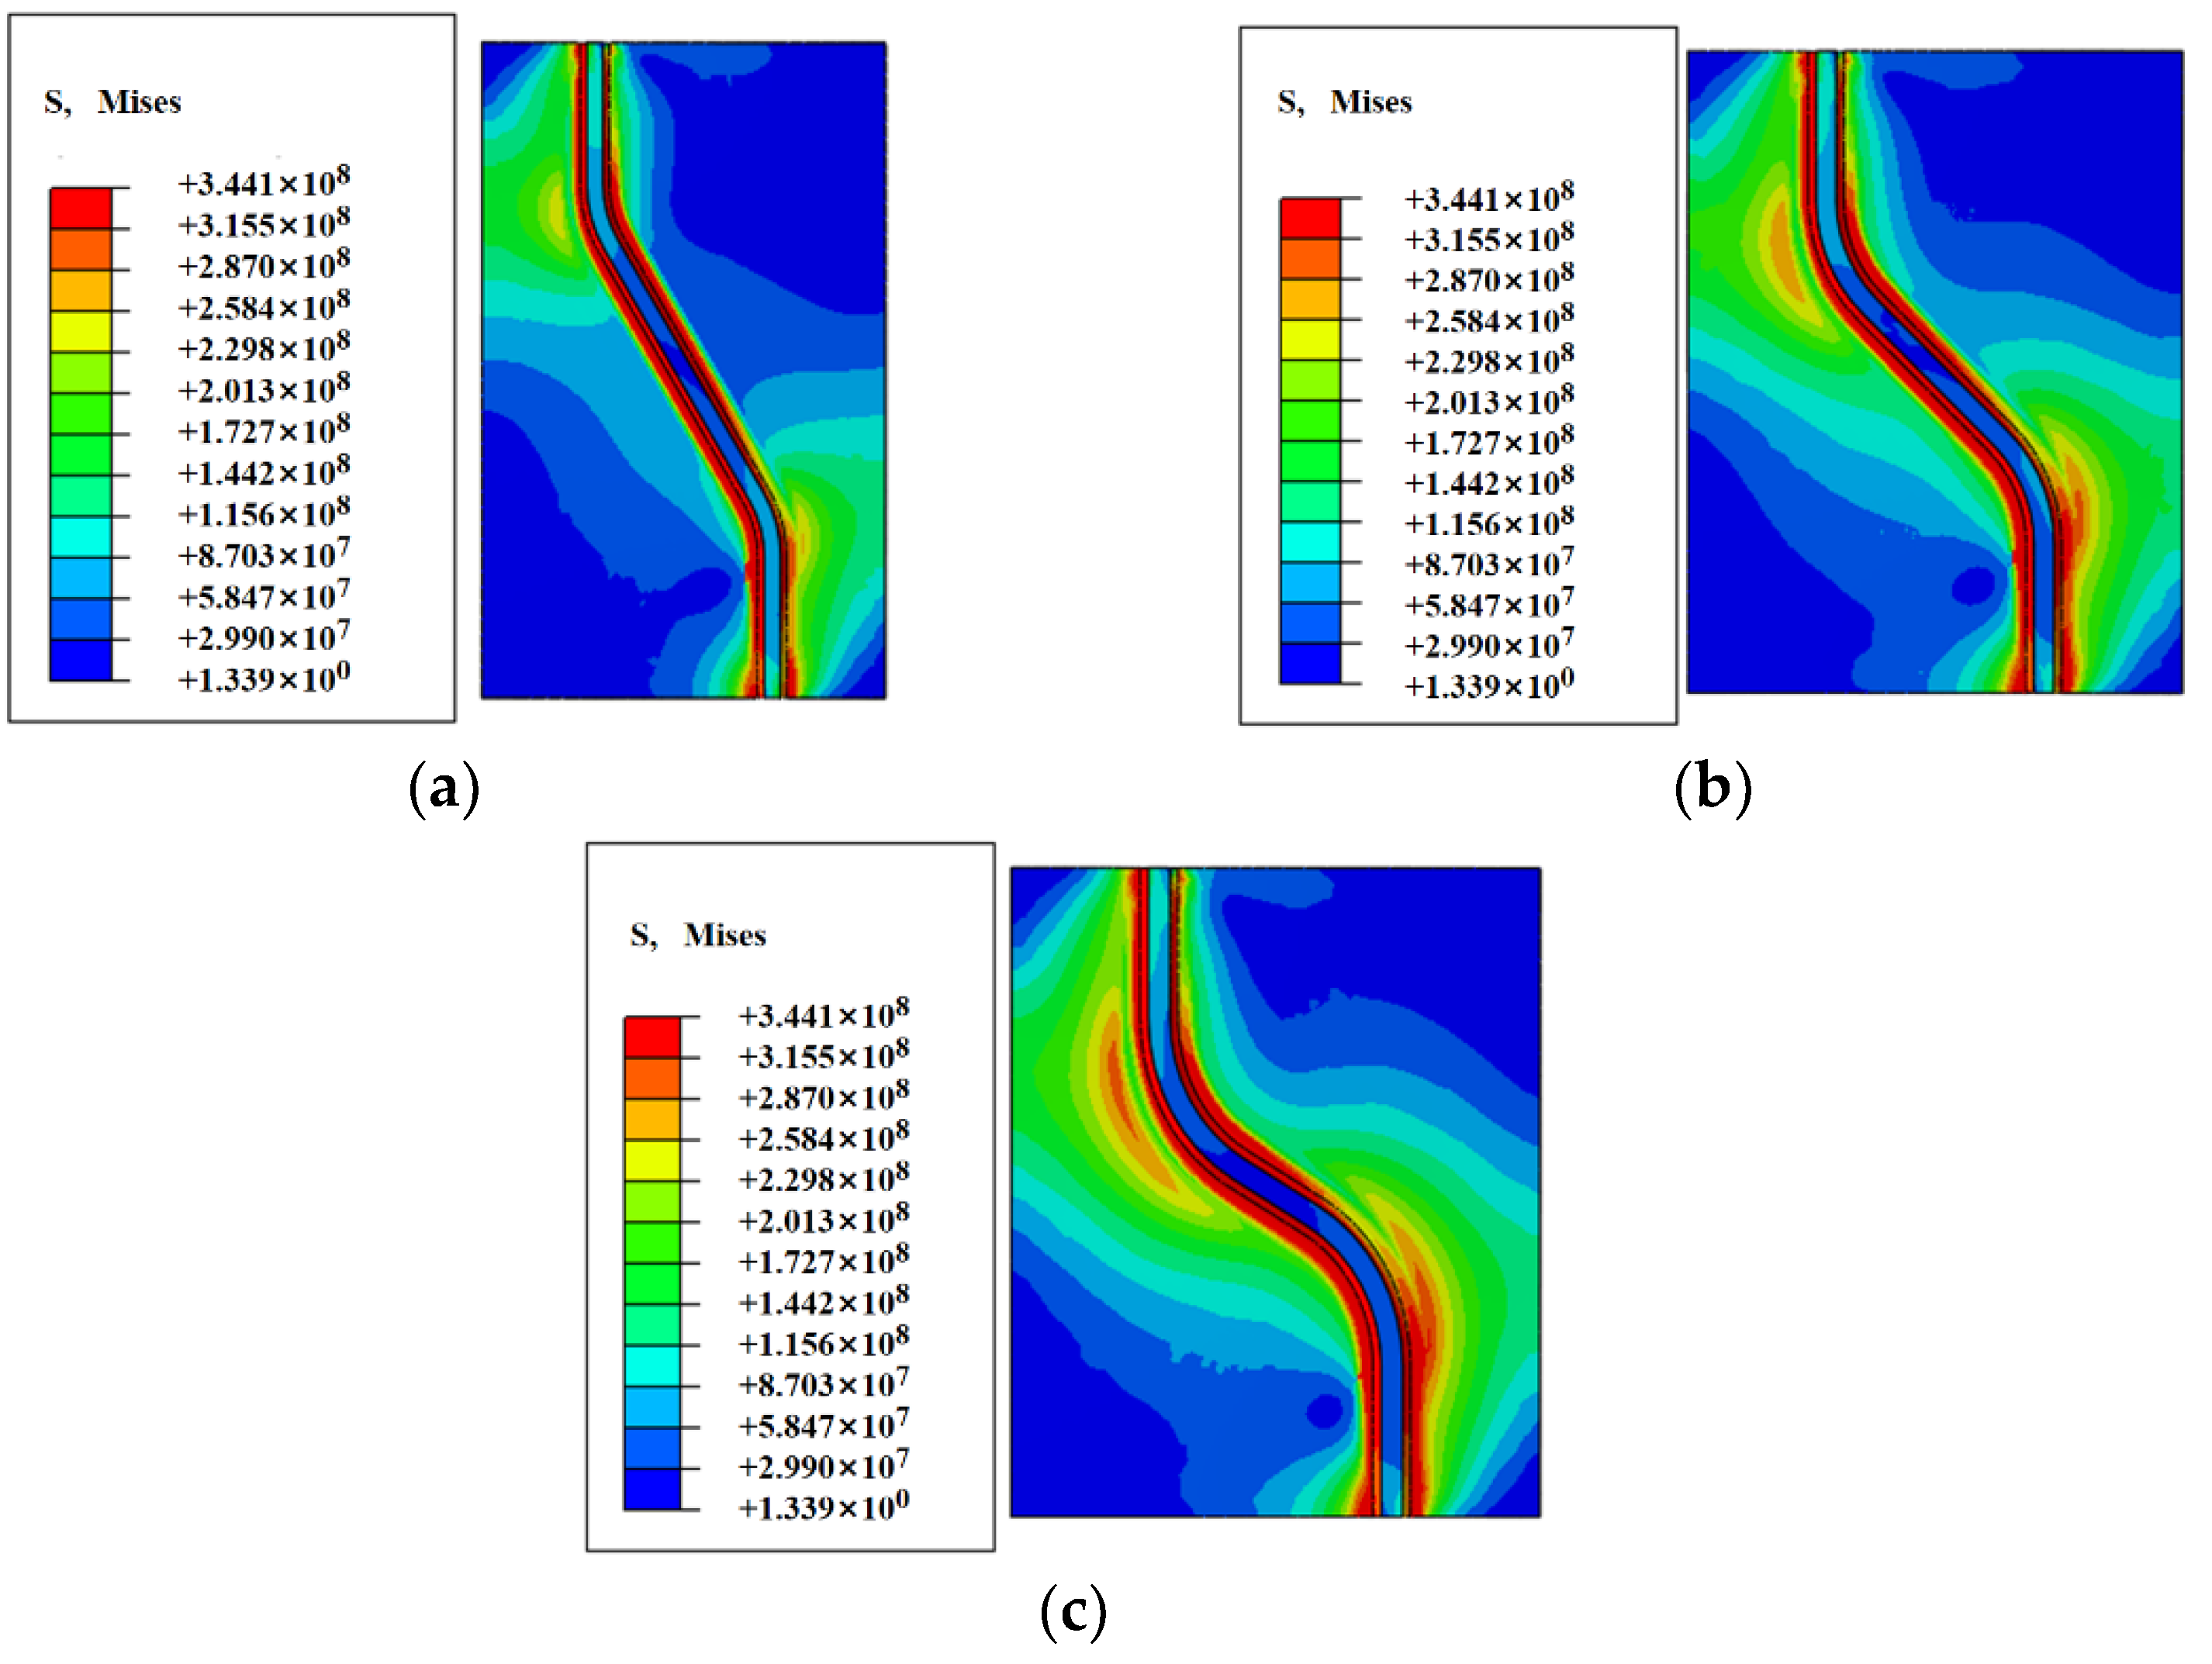
5.1. Variation of Welding Stress Field Cloud

The welding stress–strain relations can be expressed as follows [21]:
d σ = D e p d ε C th d T
D e p = D e + D p
where [Dep] is the total stiffness matrix, [De] is the elastic stiffness matrix, [Dp] is the plastic stiffness matrix and [Cth] is the thermal stiffness. T is the temperature of CSWs.
Figure 15 shows the welding Von Mises stress cloud during the welding process for CSWs with fold angles of 30°, 45°, and 60°. It can be seen that the stress distribution during the welding process of the three models is the same. In addition, with the movement of the heat source welding, residual stress changes sharply, and the location of the maximum stress is mainly distributed in the weld toe area near the heat source. The maximum Von Mises stress is approximately 337 MPa, while the stress in the center of the heat source tends to be 0 MPa.
Figure 16 shows the Von Mises stress cloud after cooling for CSWs with fold angles of 30°, 45°, and 60°. It can be observed that the stress distribution after the cooling completion of the three models is the same. There is welding residual stress concentration in the corner. There is welding residual stress concentration in the corner, which becomes more significant with the increase of wave bend angle. The maximum Von Mises stress is approximately 344 MPa, which is close to the yield strength of Q345 steel.

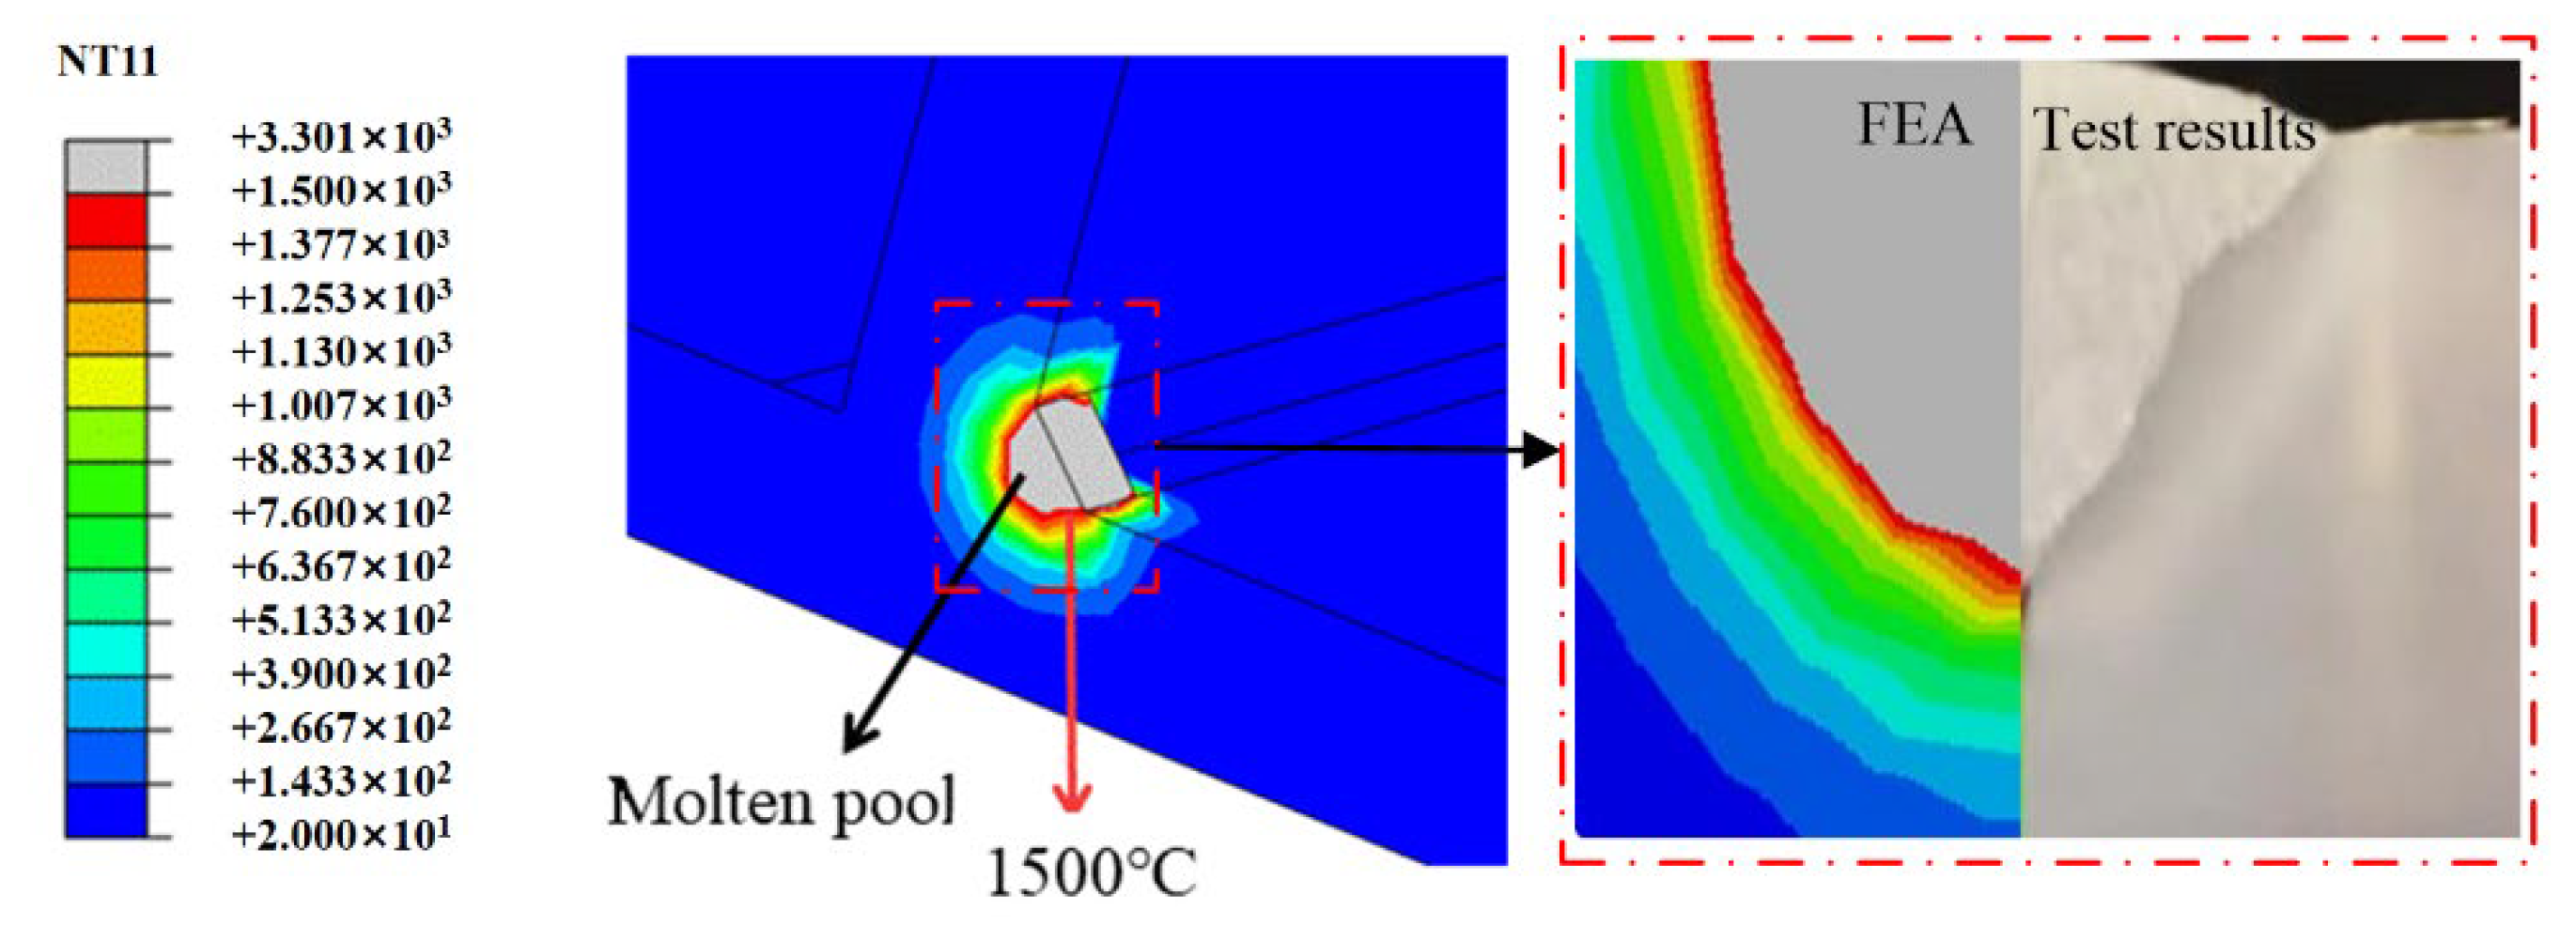
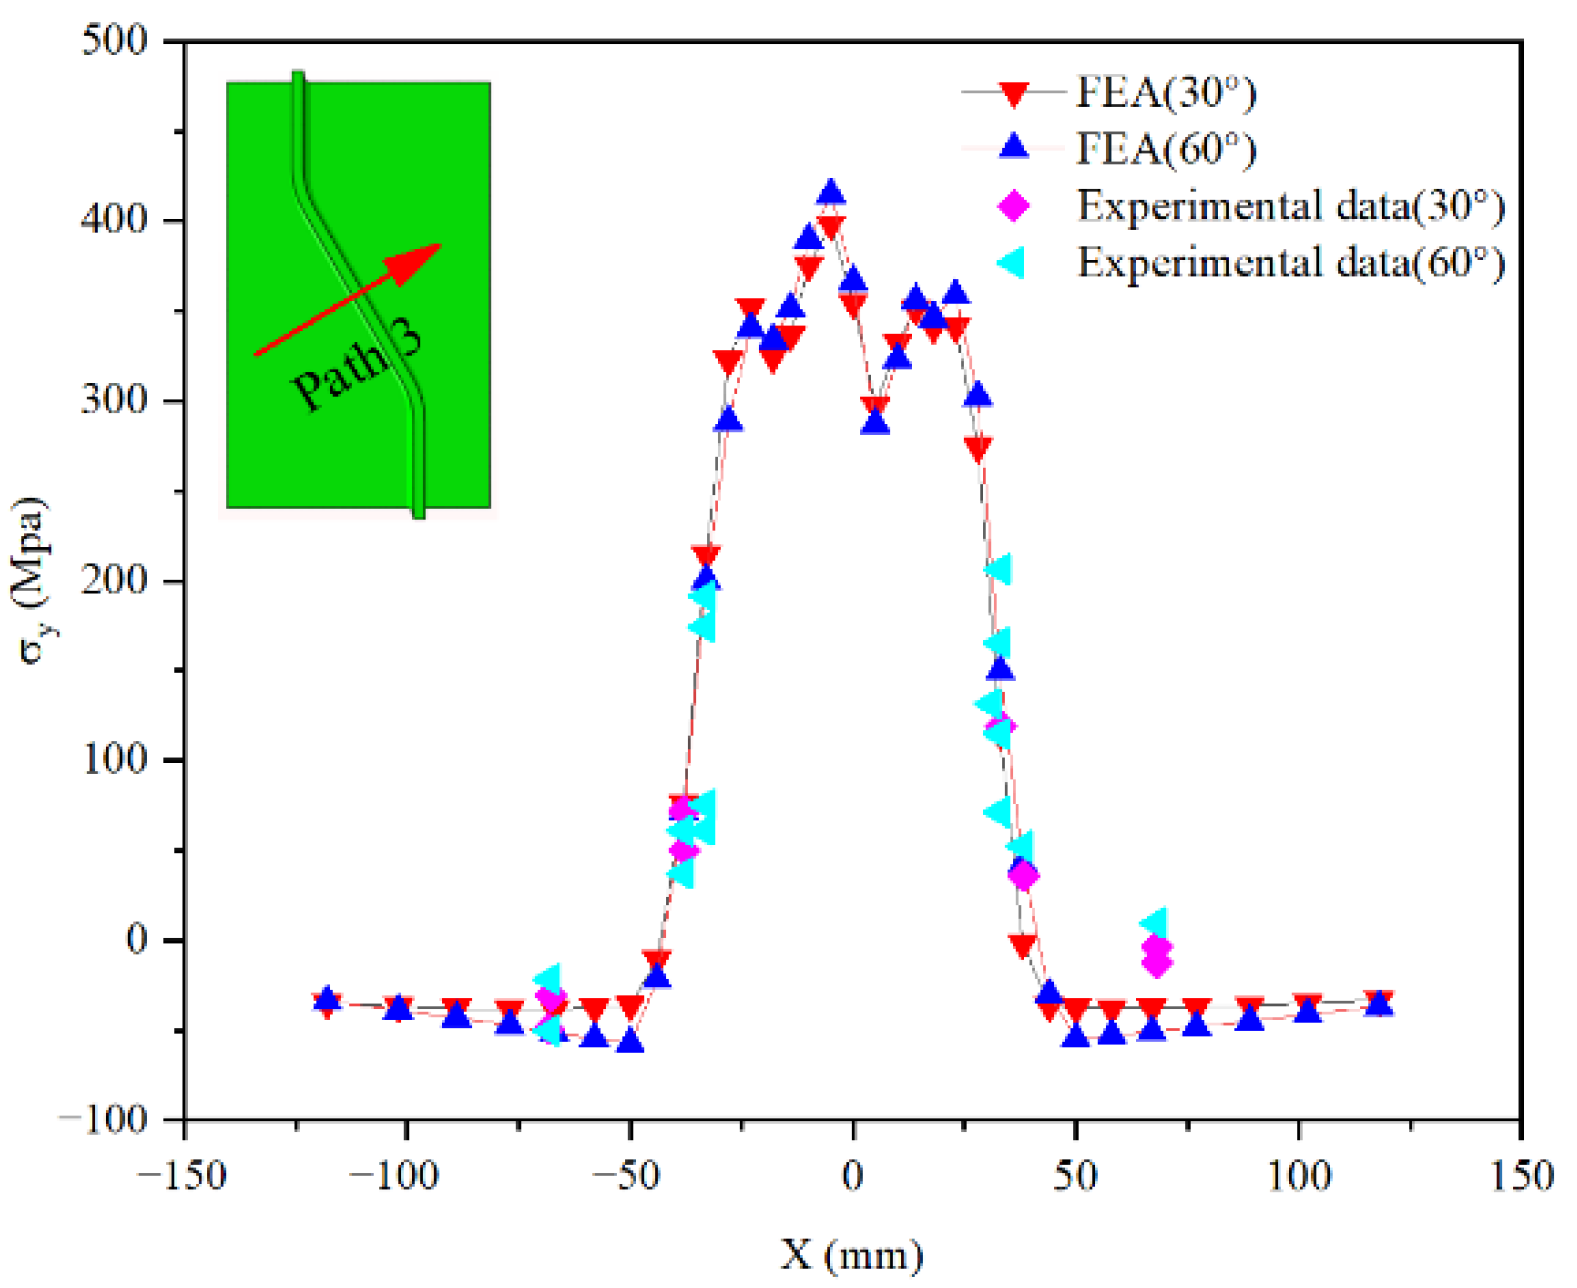
5.2. Experimental Verification

In order to verify the accuracy of the numerical welding simulation, the experimental data in the literature [26] was used. The parameters of CSWs components tested were “θc = 30° and Rt = 75 mm” and “θc = 60° and Rt = 150 mm”, respectively. The welding process was performed by semi-automatic gas metal arc welding (GMAW) method with CO2 protection. Each group was tested in triplicate. Figure 17 shows the layout of the residual stress and strain test of welded members. Figure 18 compares the test data and the simulated result of CSWs welding’s residual stress with bend angles of 30° and 60° in the X direction. It can be seen that the finite element simulation results agree with the experimental data. Moreover, it shows that the finite element analysis method and parameter setting of the thermocouple proposed in this paper are effective.

6. Discussion

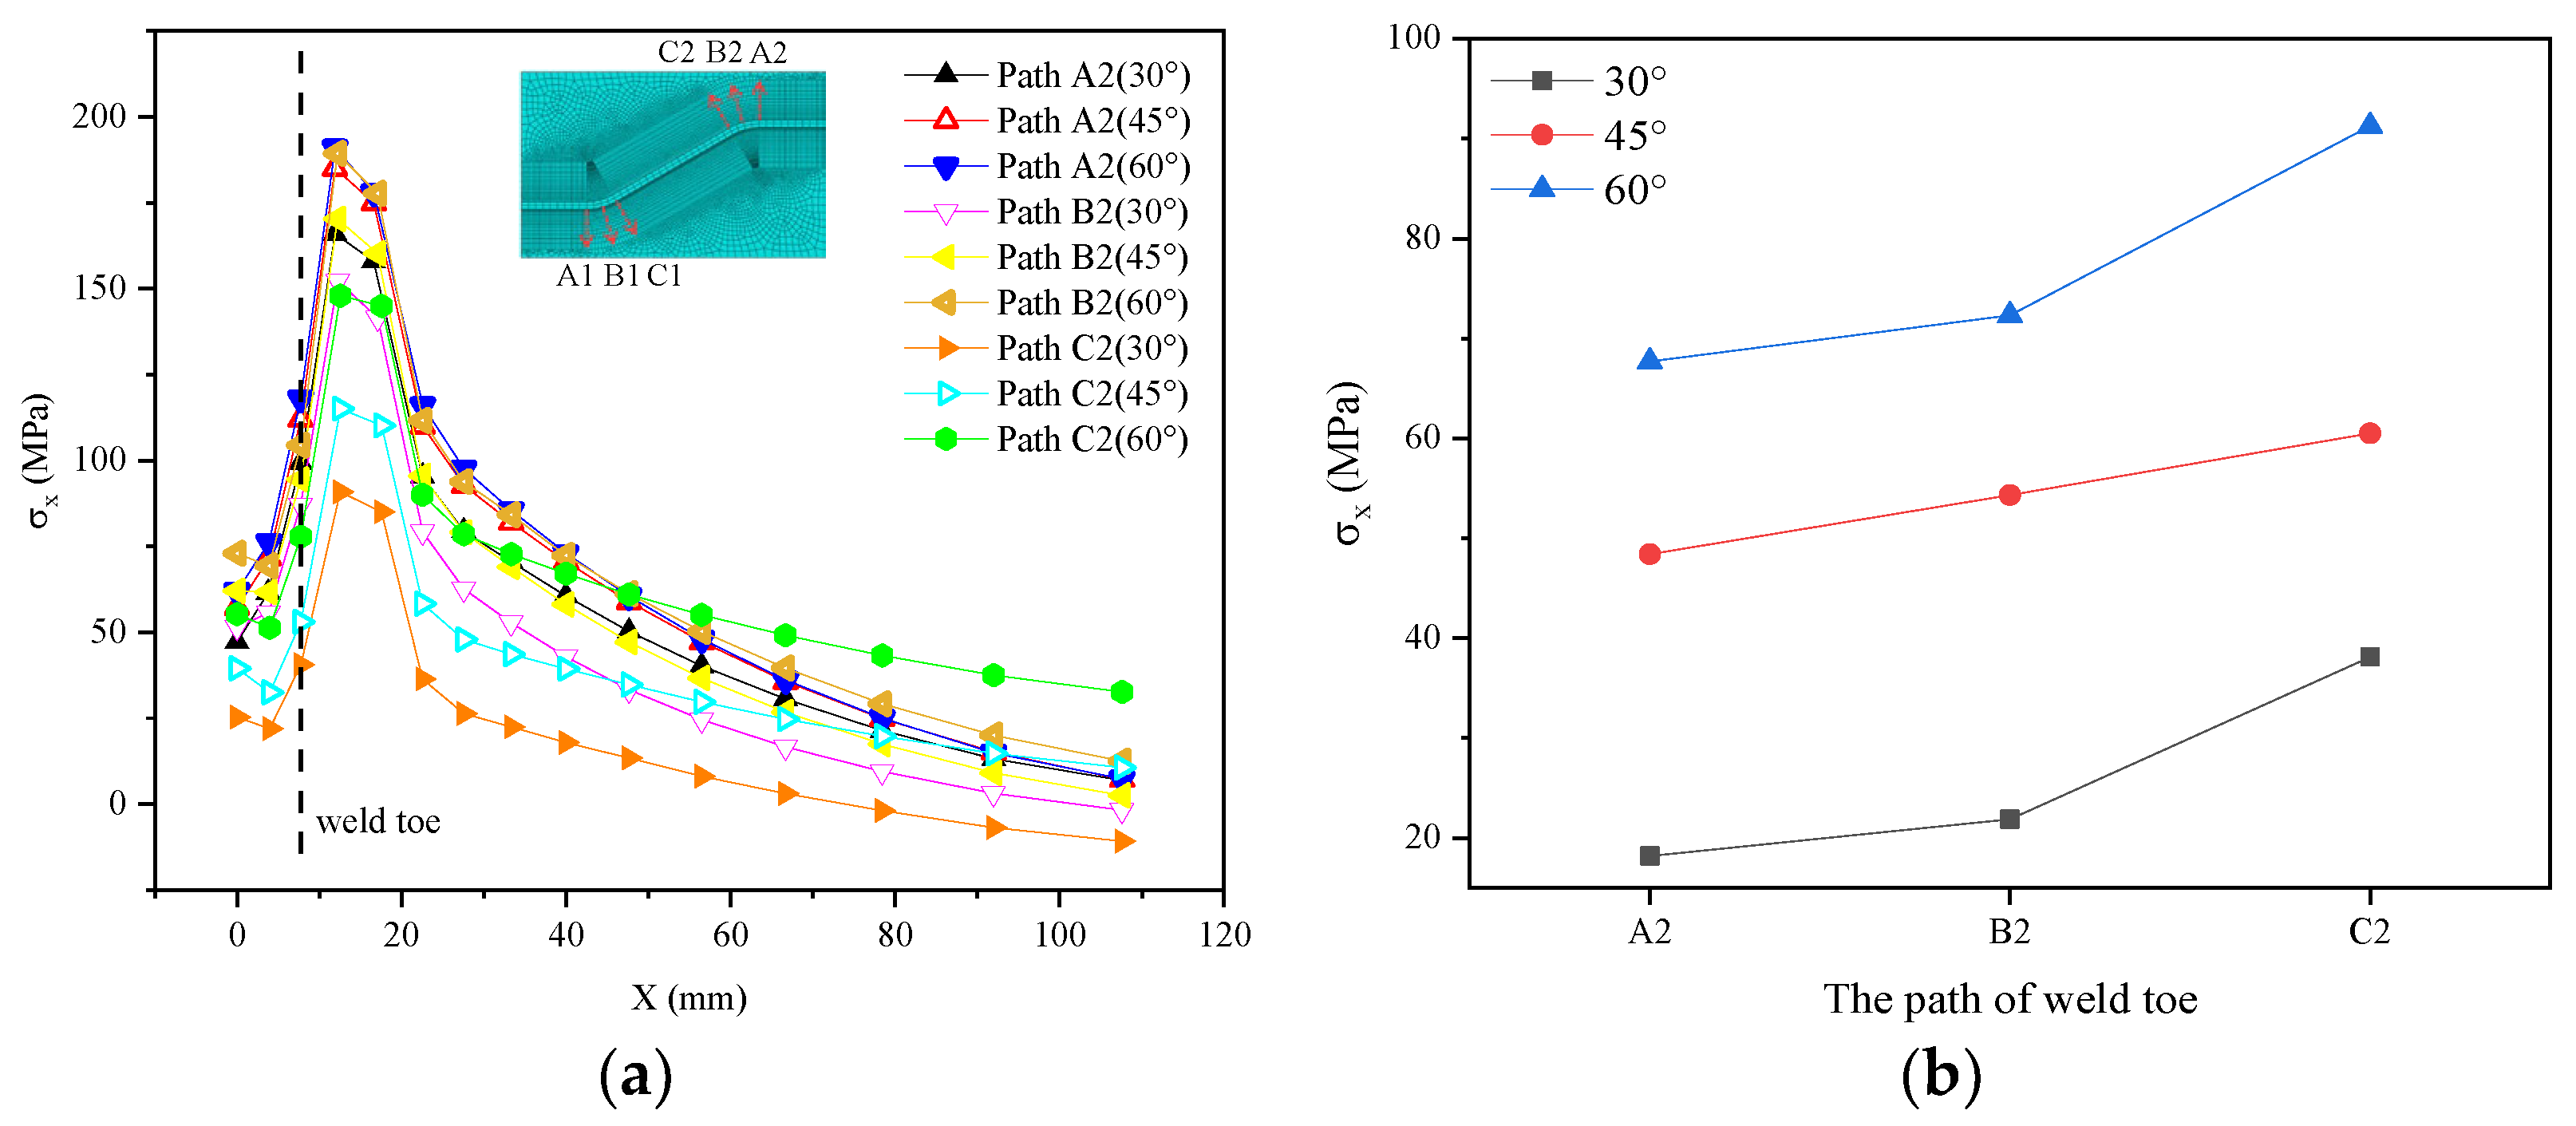
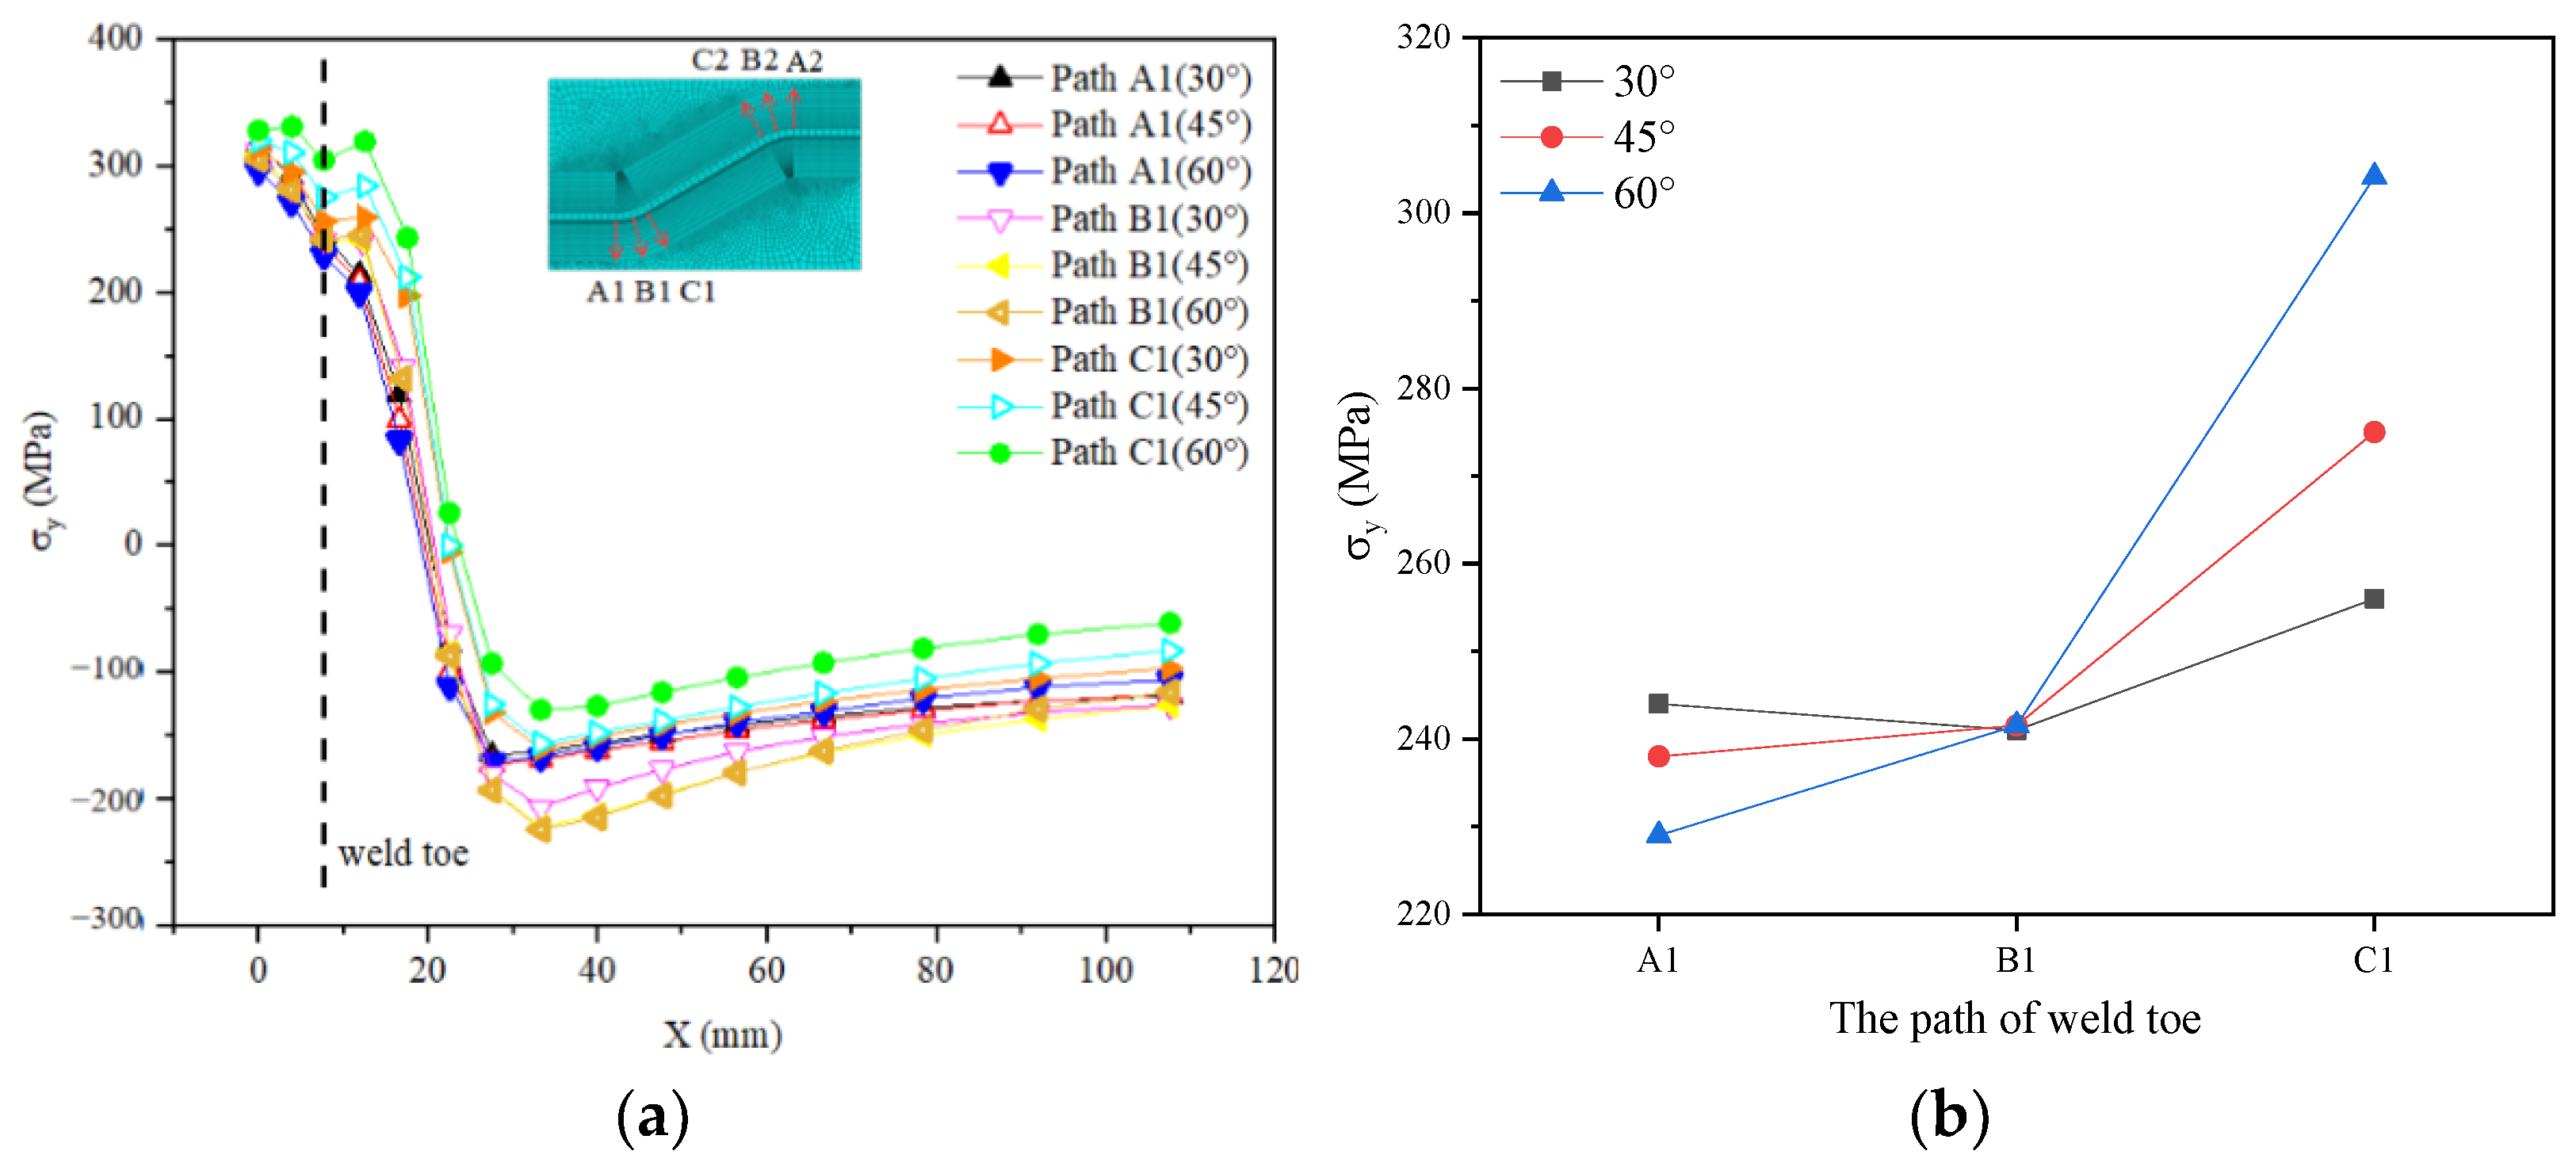
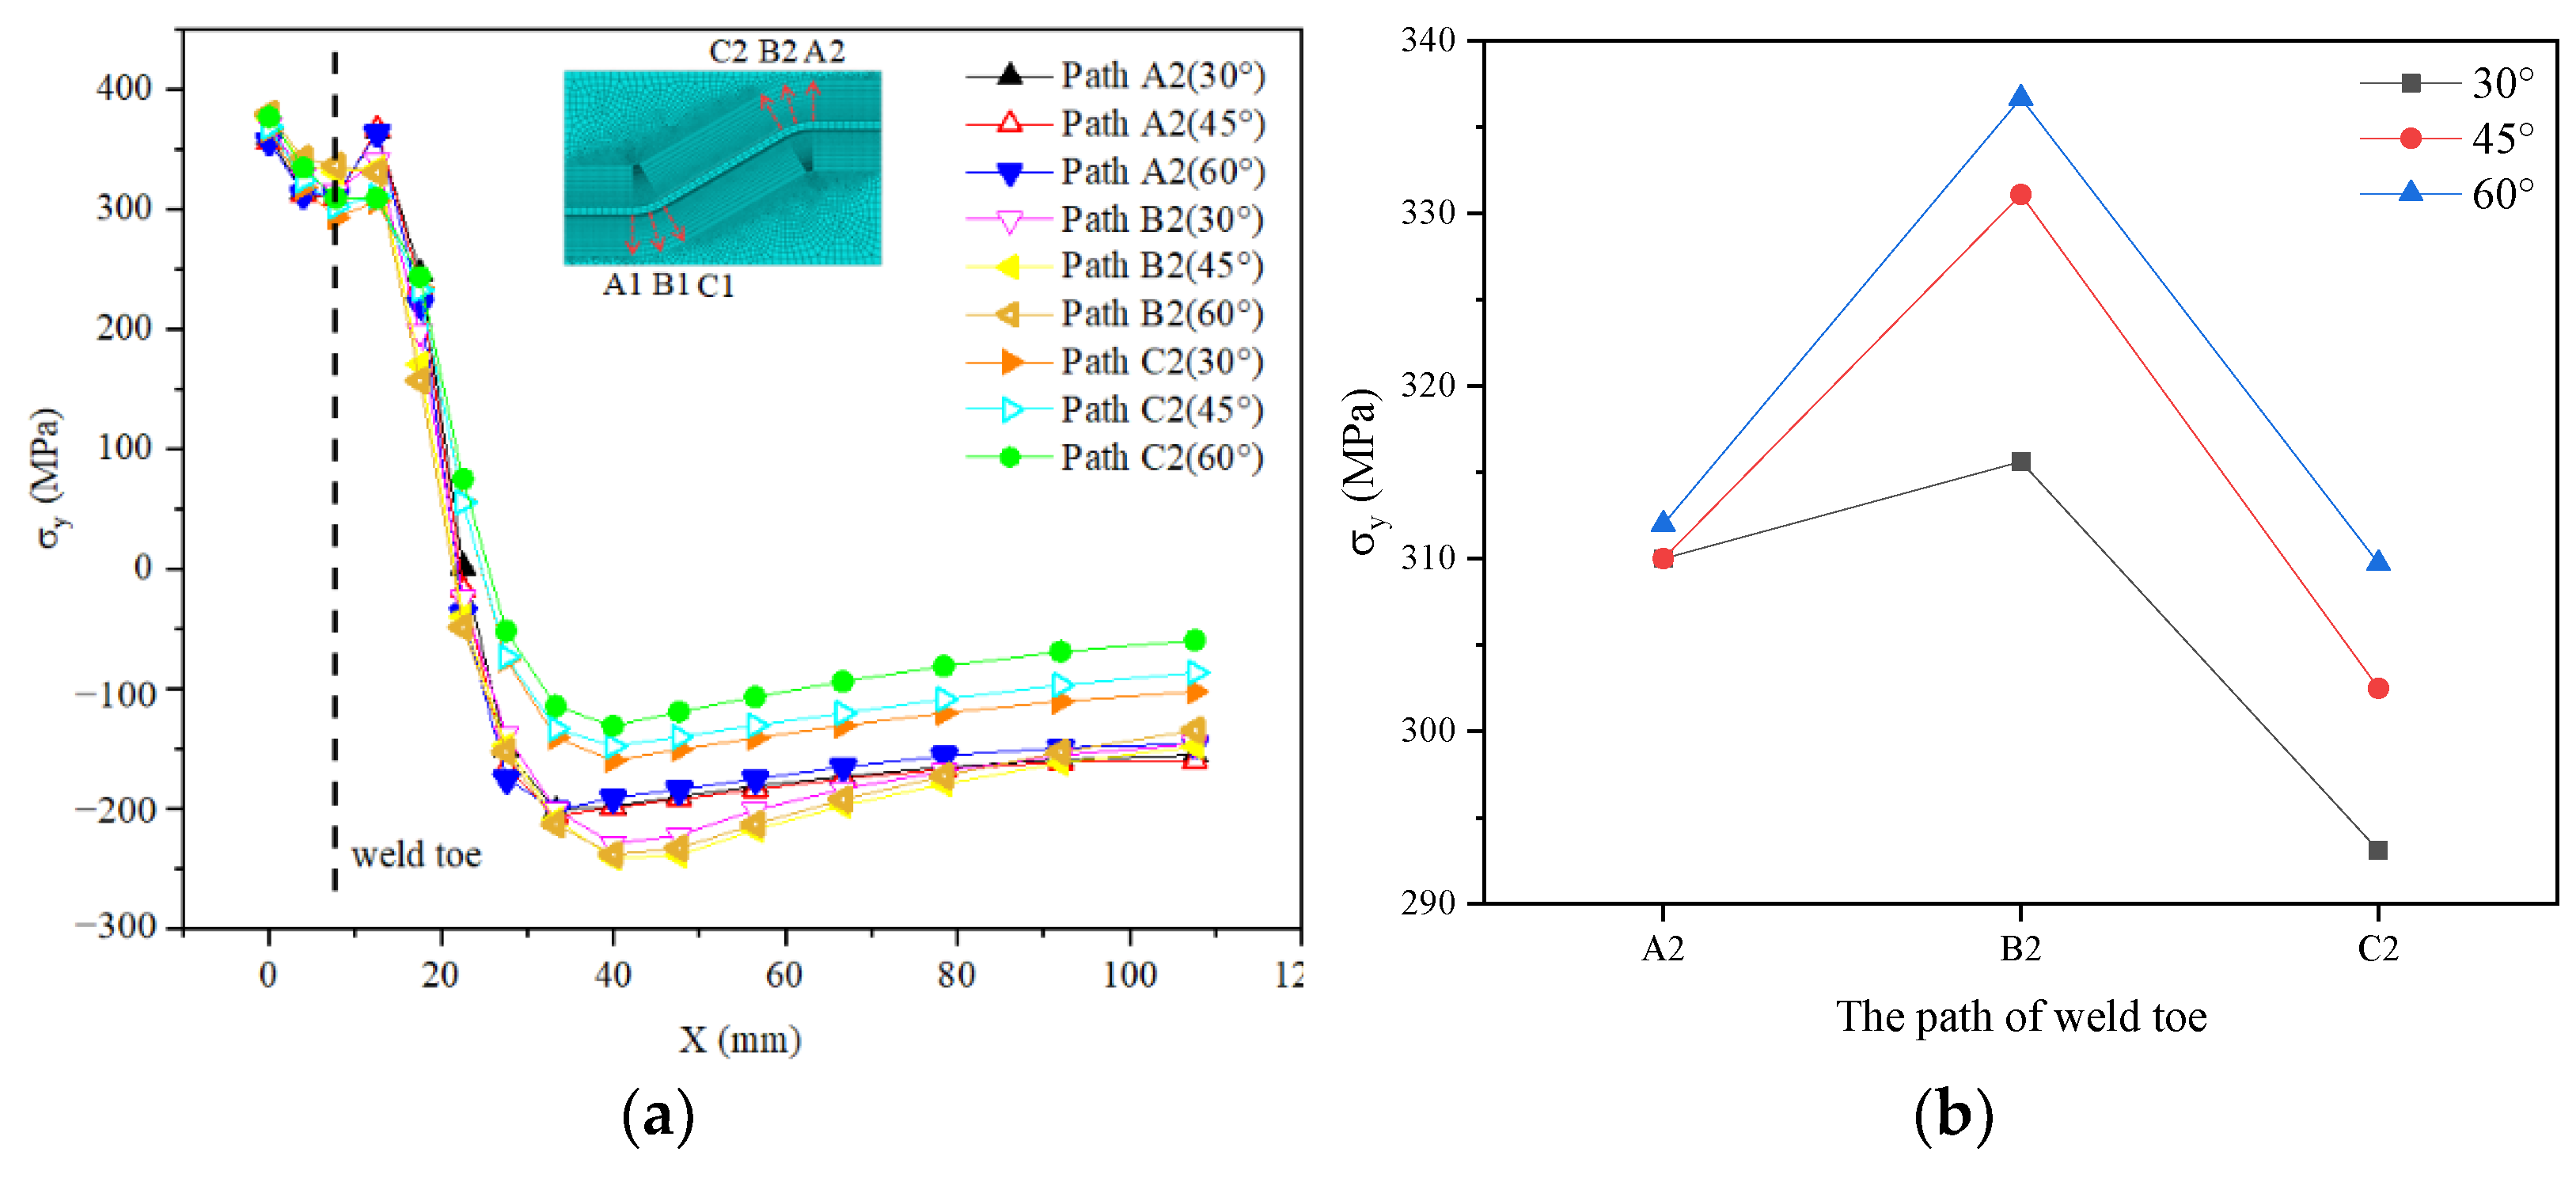
6.1. Influence of Bending Angles

In order to clarify the influence of bending angle on welding residual stress, the distribution characteristics of welding’s residual stress at the corner, six paths, A1, B1, C1, A2, B2, and C2, residual stresses perpendicular to the starting point, the middle point, and the endpoint of the front and back corners were extracted, respectively. Figure 19 and Figure 20 show the welding residual stress distribution of σx for CSWs with fold angles of 30°, 45°and 60°.
It can be seen that the distribution pattern of residual stresses in the outside of the corner is the same for the three types of bending angle weldments. The residual stresses of σx in the outer area of the front corners are mainly tensile. Between 0 mm and 5 mm, the residual stresses show a decreasing trend, while between 5 mm and 20 mm, the residual stresses show a sharp increase and reach a peak value of approximately 20 mm. After that, the residual stress gradually decreases as it moves away from the weld area. The residual stresses in paths A1, B1, and C1 all increase with the bending angle. It can be seen in Figure 20 that the distribution characteristics of residual stress in the front and rear corner areas are similar, and the peak point of residual stress in the rear corner area is approximately 10 mm.
Figure 21 and Figure 22 show the welding residual stress distribution of σy for CSWs in paths A2, B2, and C2 with fold angles of 30°, 45°, and 60°, respectively. It can be seen that the shapes of welding residual stress distribution of σy are similar to the downward sloping “L”. The residual stresses σy for the range from 0 mm to 31 mm in the x direction show a rapidly decreasing trend. The peak stress location is mainly concentrated near the weld root and weld toe of the weld. Then, the welding’s residual stress of σy shows a slow upward trend. The residual stress σy of weld toe in paths A2, B2, and C2 increases with the corrugated angle.

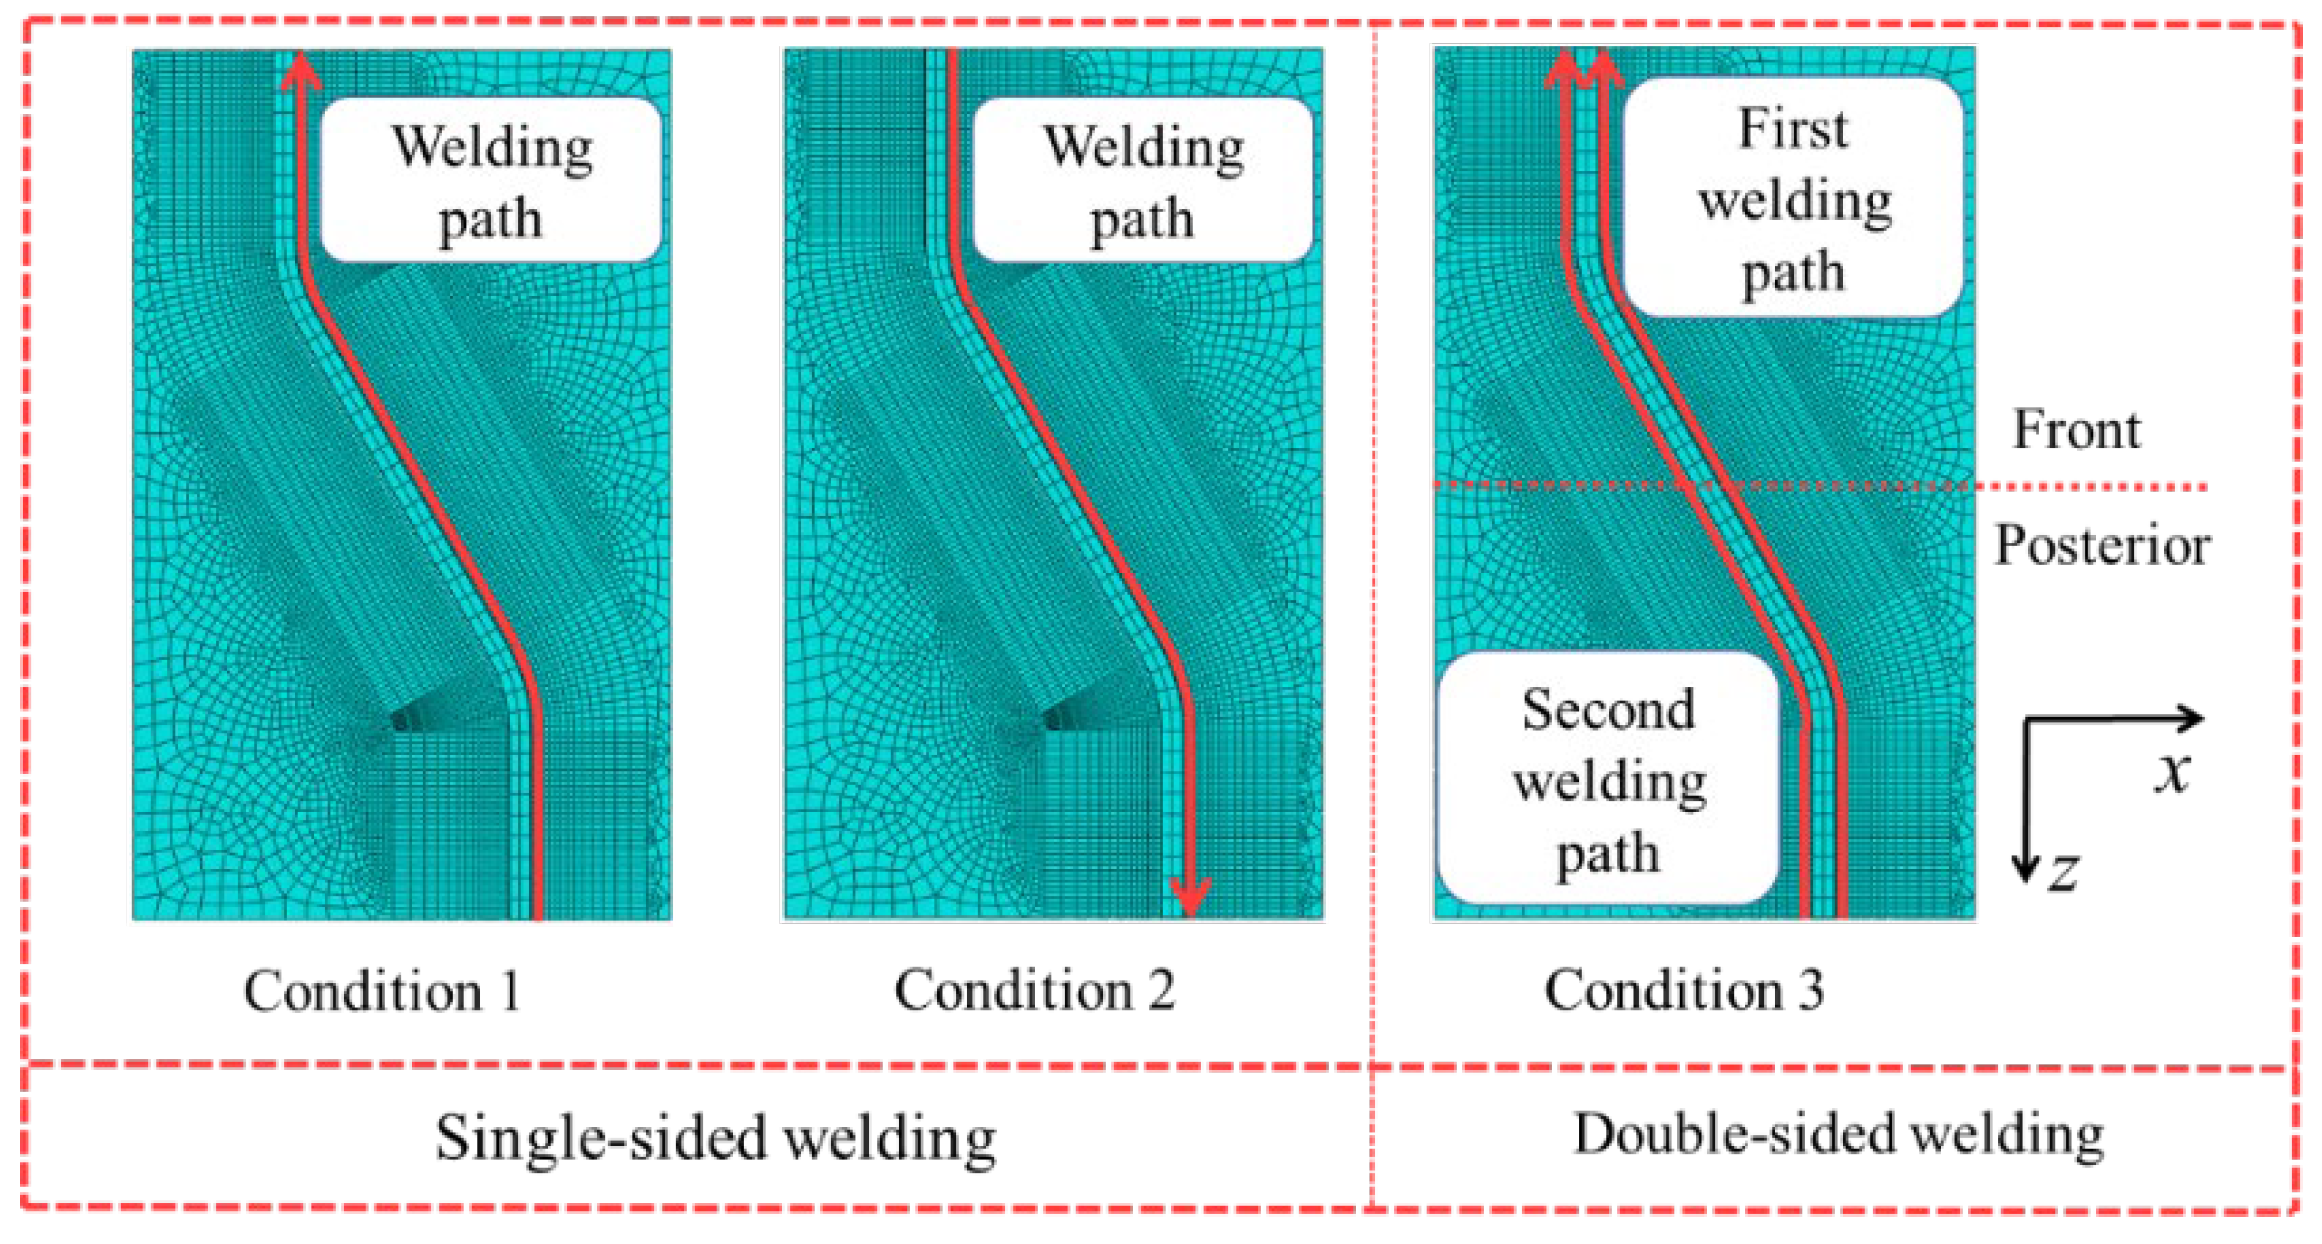
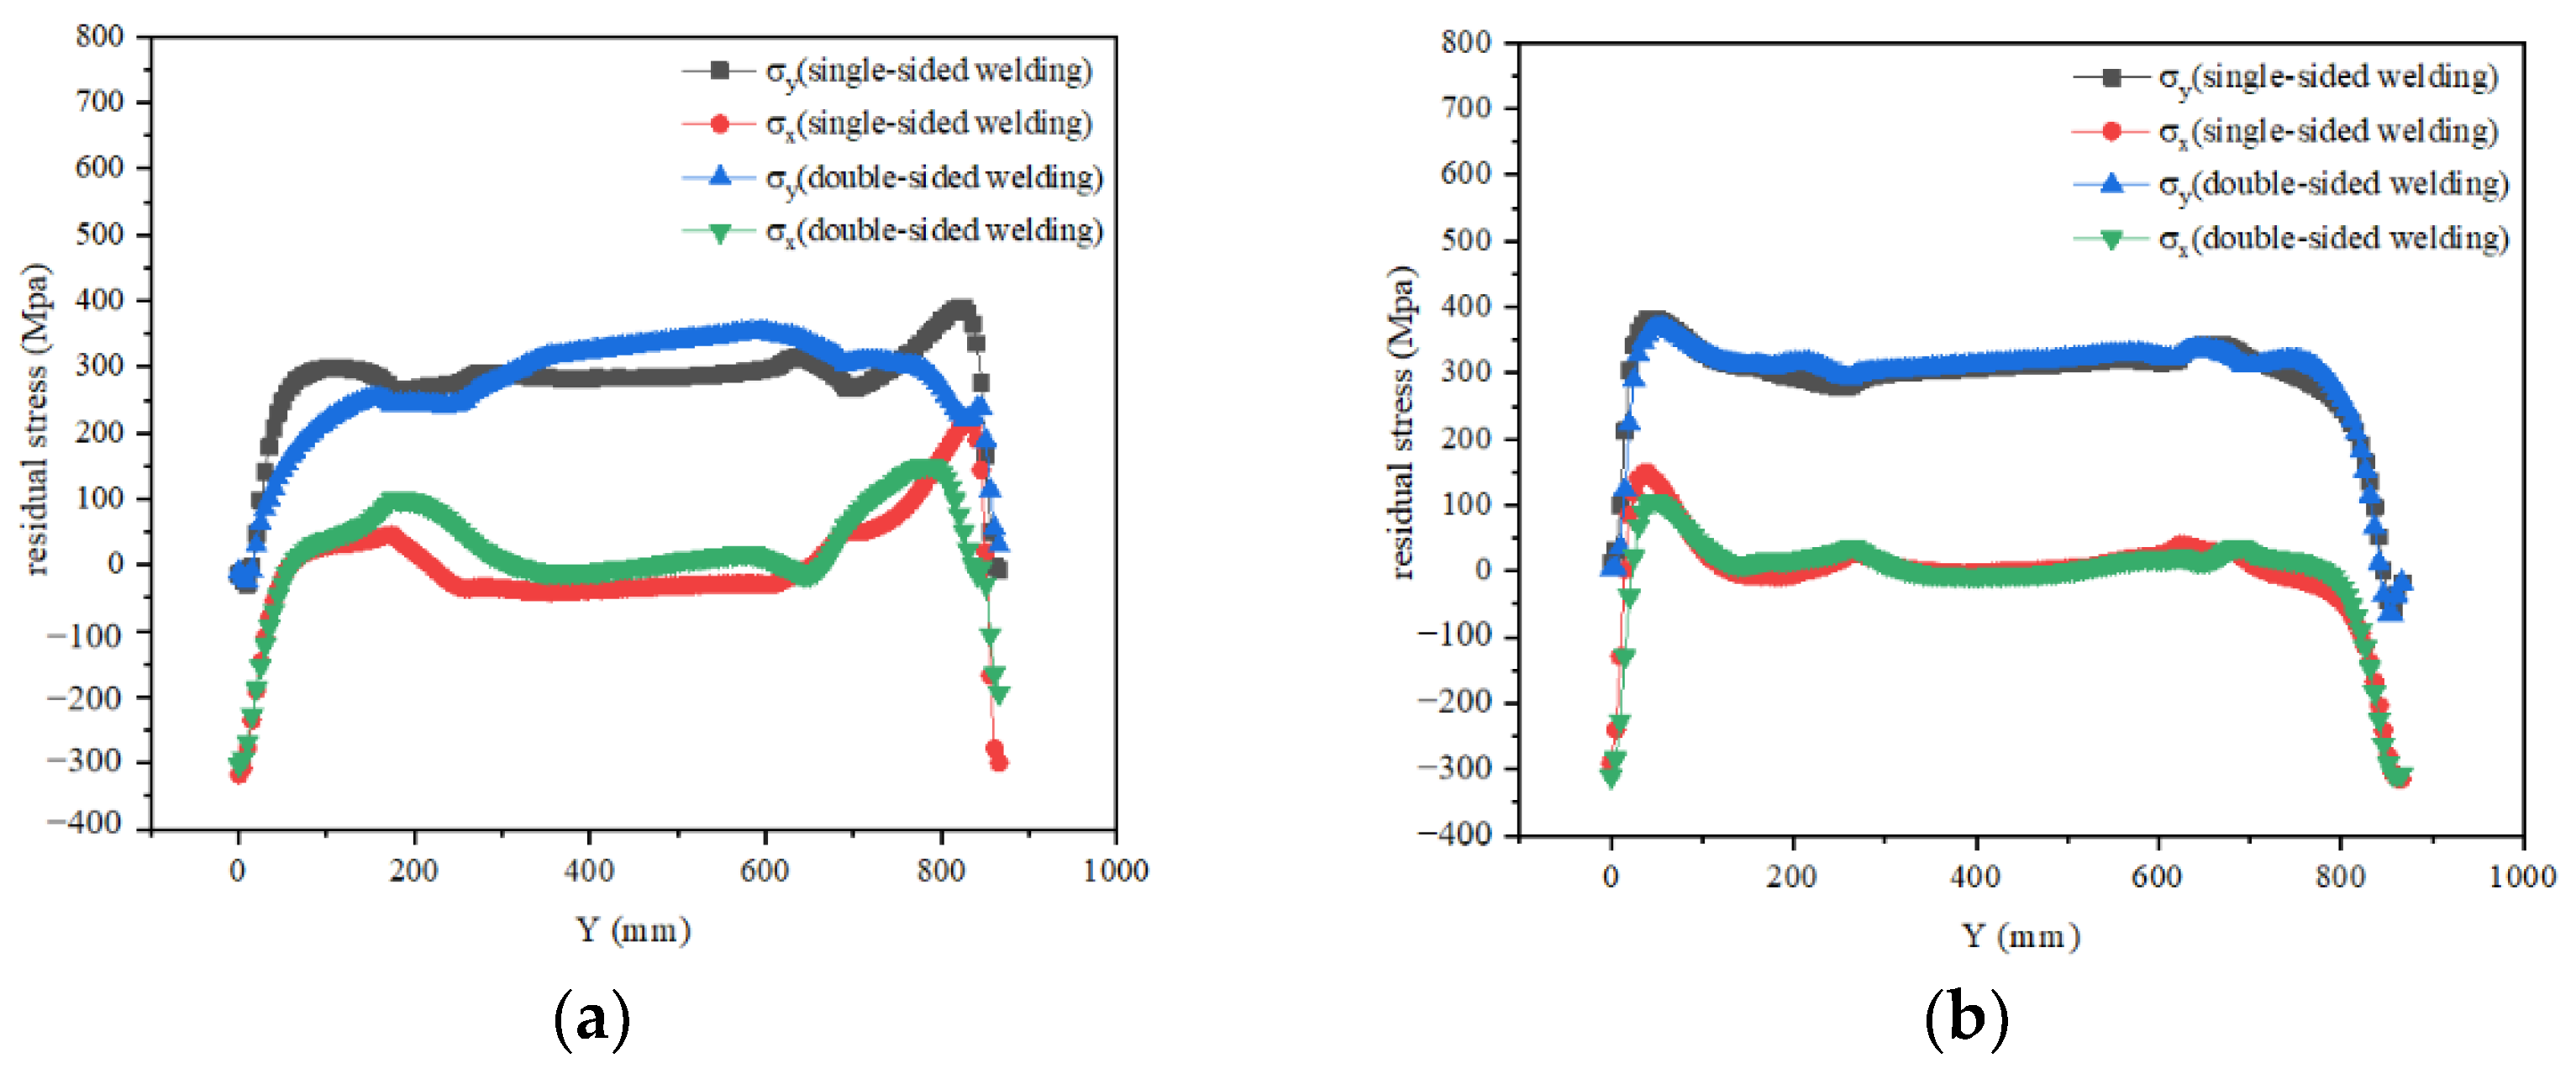
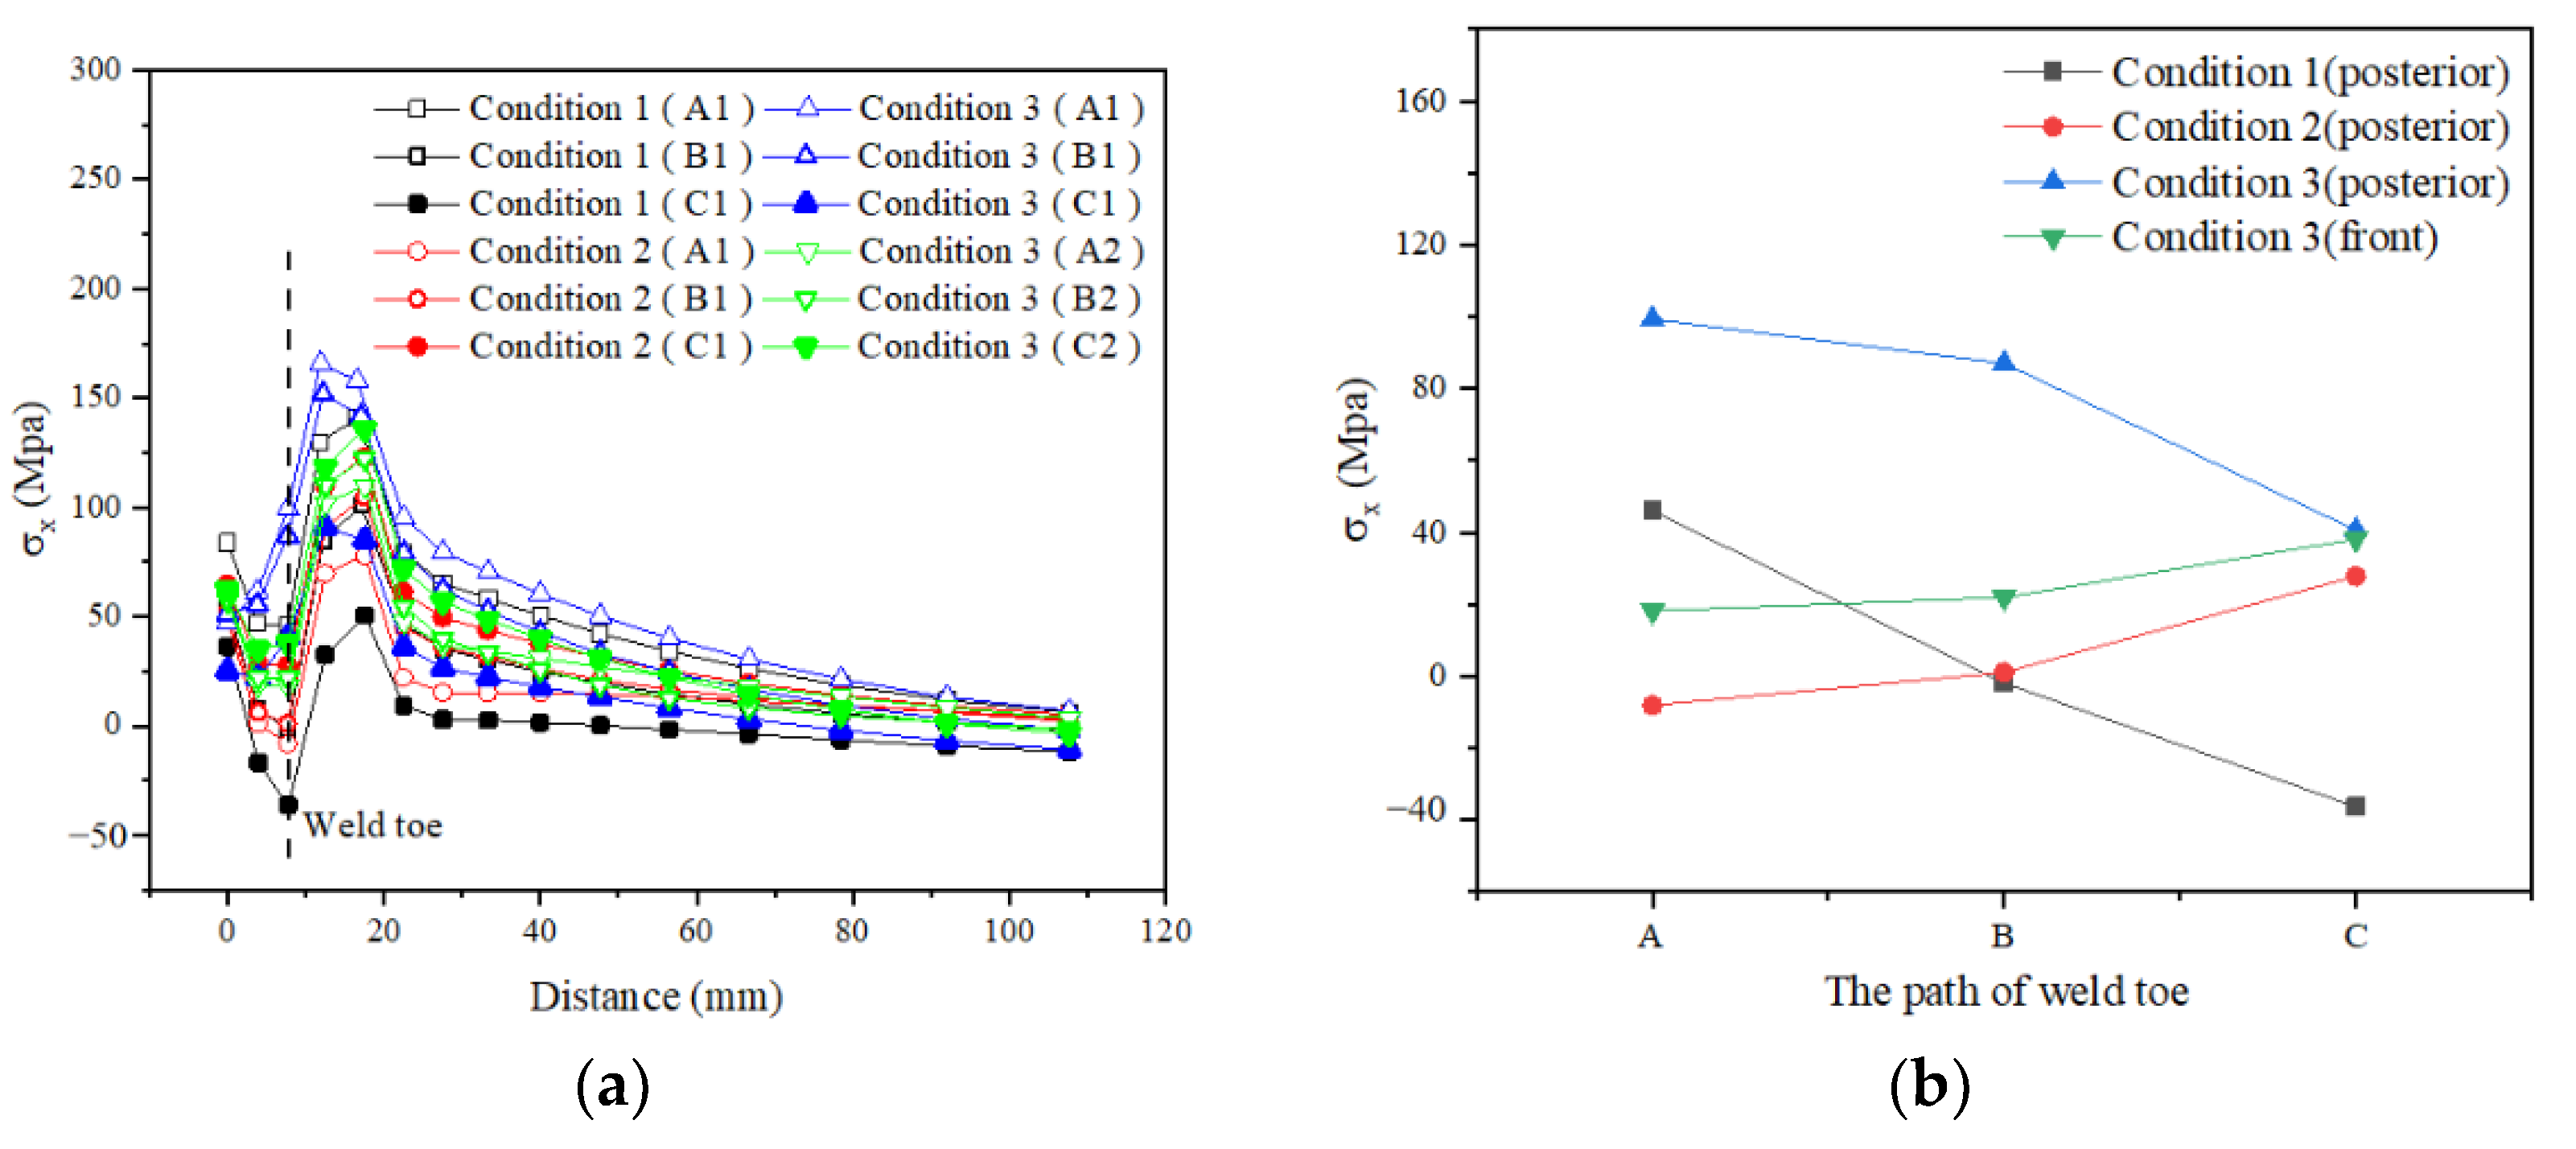
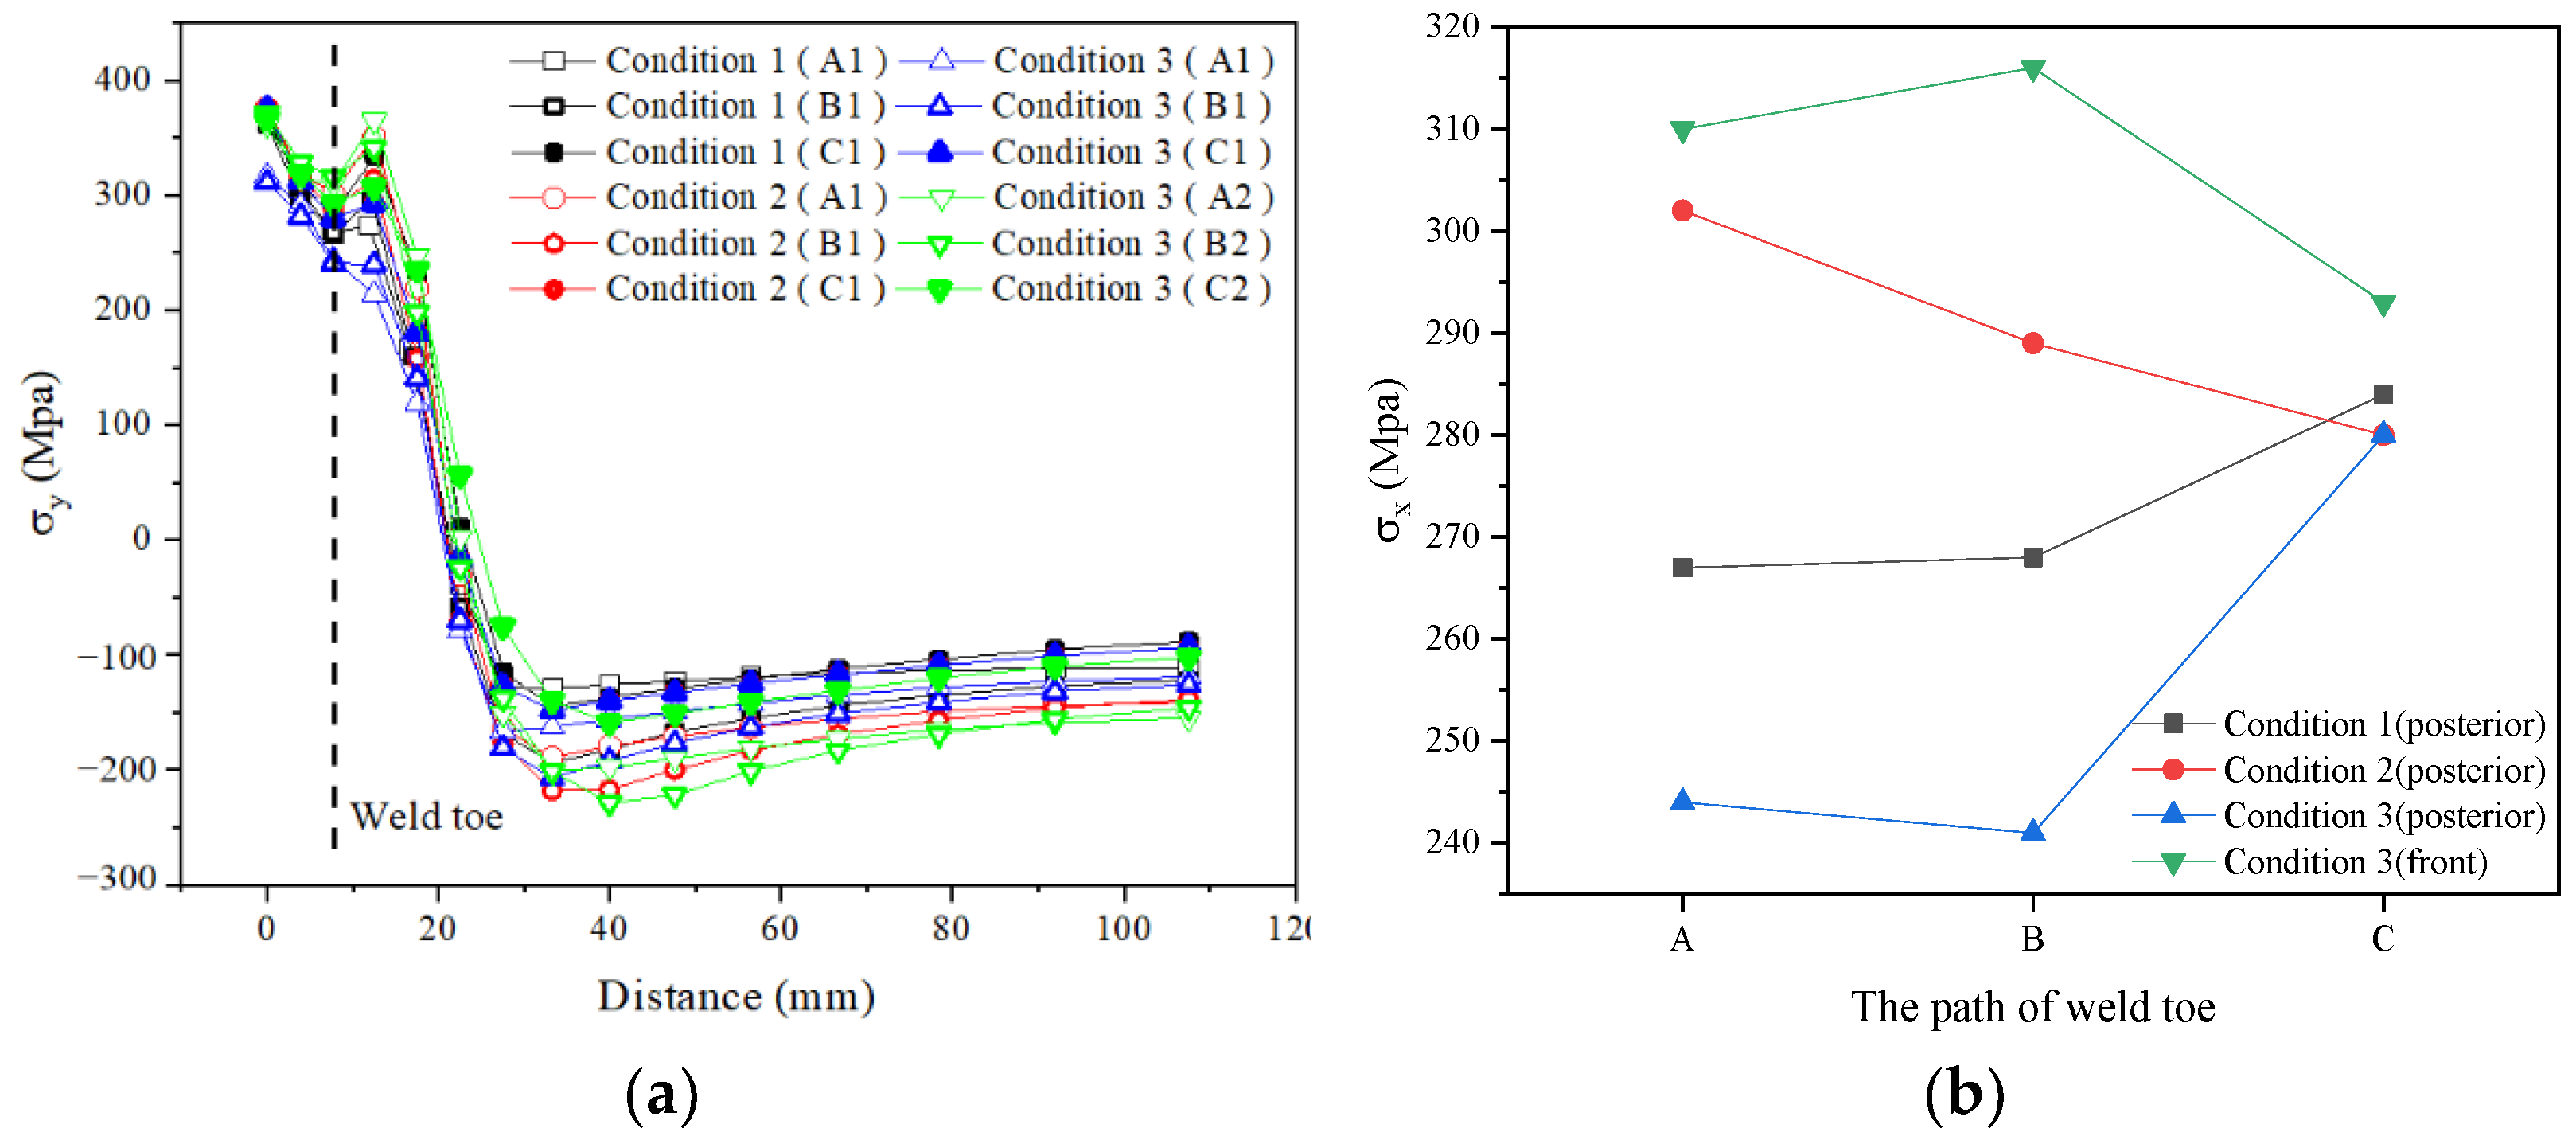
6.2. Influence of Welding Path

To study the impact of different welding processes on the residual stress of welding, three types of welding path conditions, two single-sided welding paths and a double-sided welding path, are established in Figure 23. Figure 24a shows the difference in residual stress distribution on single-sided welding of conditions 1 and 2. It indicates that the second weld near the welding’s residual stress has a greater impact. Therefore, it can be assumed that the second weld (the last weld) plays a critical role in residual stress distribution. The reason for this is that the heating process of the second weld affects temperature, which allows the redistribution of the peak residual stress location in the weld. Figure 24b shows the stress distribution in the y direction of the CSWs weldment with conditions 2 and 3. It can be seen that the distribution of welding residual stresses and longitudinal welding residual stresses of the single-sided weldment in path 2 is completely consistent with that of the double-sided weldment. However, there are certain differences in stress values, which indicates that the welding process of the first weld on the second weld near the welding residual stress distribution has a low impact.
Figure 25 shows that different welding paths greatly influence the residual stress of the welding toe. The residual stress of σx in welding paths A1 and B1 is 38 MPa and 23 MPa higher than in welding condition 1, respectively. The residual stress of the double-sided weldment at the root of paths A1, B1, and C1 is 54, 51, and 54 MPa lower than that of the single-sided weldment, respectively. The residual stress of the double-sided weldment at the toe of paths A1, B1, and C1 is 23, 27, and 28 MPa lower than that of the single-sided weldment, respectively. This means that the longitudinal residual stress of the weld in the rear corner area can be reduced to a great extent by using the double-sided welding welds loaded under condition 3.
As can be seen from Figure 26, the peak point of transverse residual stress under all loading conditions is located near the weld, and the transverse residual stress gradually decreases as it moves away from the weld. Different welding conditions greatly influence the residual stress of welding toe. The residual stress of the two-sided weldment at the toe of paths A1, B1, and C1 is 53, 89, and 76 MPa higher than on the single-sided weldment, respectively. The two-sided weldment under the condition of three loadings can greatly increase the transverse residual stress of the weld in the rear corner area.

7. Conclusions

This paper combines the element birth and death technology and thermal-mechanical sequentially coupled method to discuss the impact of different bending angles and welding processes on the residual stress distribution of CSWs. The numerical simulation results are compared with the molten pool parameters and residual stress test values, respectively, and the effectiveness of the numerical analysis method is verified. On the basis of the aforementioned statements, the following conclusions are drawn:
(1)
The weld equivalent residual stress reaches a maximum value of 344 MPa near the weld, which is close to the yield strength of Q345 steel. Hence, the effect of weld residual stress should be considered when performing fatigue analysis of corrugated steel web girder bridge welding details;
(2)
The wave angle has no effect on the distribution characteristics of residual stress in CSWs welding. With the increase of the wave angle, the transverse and longitudinal residual stress of the welding toe in the bend area show an increasing trend. The longitudinal residual stress level of the welding toe on one side is lower than on the single side;
(3)
Different welding sequences can affect the residual stress in the weld toe of the folded corner weld of single-sided weldments. Furthermore, selecting a proper welding sequence can reduce the longitudinal residual stress by 20 to 40 MPa. The double-sided weldment with the loading mode of condition 3 can greatly reduce the residual stress of the weld root and weld toe in the posterior folded corner area, but it increases the residual stress of the weld toe in the front folded corner.

Author Contributions

Conceptualization, X.X.; data curation, writing—original draft preparation, H.Z.; methodology, software, validation, W.M.; formal analysis, L.L.; investigation, Y.L. and F.C.; writing—review and editing, visualization, Z.O.; funding acquisition, H.Z. All authors have read and agreed to the published version of the manuscript.

Funding

Natural Science Foundation of Hunan Province China (Grant No. 2020JJ5143). Natural Science Foundation of Hunan Education Department (20B182).

Institutional Review Board Statement

Not applicable.

Informed Consent Statement

Not applicable.

Data Availability Statement

Not applicable.

Acknowledgments

We acknowledge support from the School of Civil Engineering, Hunan University of Technology and JSTI Group Co., Ltd.

Conflicts of Interest

The authors declare no conflict of interest.

References

  1. Yi, J.; Gil, H.; Youm, K.; Lee, H. Interactive shear buckling behavior of trapezoidally corrugated steel webs. Eng. Struct. 2008, 30, 1659–1666. [Google Scholar] [CrossRef]
  2. Wang, D.; Wang, L.; Tang, C. Mechanical characteristic analysis of corrugated steel webs using asynchronous construction technology. KSCE J. Civ. Eng. 2021, 25, 185–196. [Google Scholar] [CrossRef]
  3. Chen, Y.; Dong, J.; Tong, Z.; Jiang, R.; Yue, Y. Flexural behavior of composite box girders with corrugated steel webs and trusses. Eng. Struct. 2020, 209, 110275. [Google Scholar] [CrossRef]
  4. Sepe, R.; Wiebesiek, J.; Sonsino, C.M. Numerical and experimental validation of residual stresses of laser-welded joints and their influence on the fatigue behavior. Fatigue Fract. Eng. Mater. Struct. 2020, 43, 1126–1141. [Google Scholar] [CrossRef]
  5. Deng, Y.; Ju, H.; Zhai, W.; Li, A.; Ding, Y. Correlation model of deflection, vehicle load, and temperature for in-service bridge using deep learning and structural health monitoring. Struct. Control. Health Monit. 2022, e3113. [Google Scholar] [CrossRef]
  6. Beghini, M.; Bertini, L.; Raffaelli, P. Numerical analysis of plasticity effect in the hole-drilling residual stress measurement. J. Test. Eval. 1994, 22, 522–529. [Google Scholar]
  7. Beghini, M.; Bertini, L. Recent advances in the hole drilling method for residual stress measurement. J. Mater. Eng. Perform. 1998, 7, 163–172. [Google Scholar] [CrossRef]
  8. Lei, S.; Huang, J.H.; Chen, H. Measurement of residual stress on TiN/Ti bilayer thin films using average X-ray strain combined with laser curvature and nanoindentation methods. Mater. Chem. Phys. 2017, 199, 185–192. [Google Scholar] [CrossRef]
  9. Cherepetskaya, E.B.; Karabutov, A.A.; Mironova, E.; Podymova, N.B.; Zharinov, A.N. Contact laser-ultrasonic evaluation of residual stress. Appl. Mech. Mater. 2016, 843, 118–124. [Google Scholar] [CrossRef]
  10. Sepe, R.; Greco, A.; De Luca, A.; Caputo, F.; Berto, F. Influence of thermo-mechanical material properties on the structural response of a welded butt-joint by FEM simulation and experimental tests. Forces Mech. 2021, 4, 100018. [Google Scholar] [CrossRef]
  11. Majidi, H.R.; Torabi, A.R.; Zabihi, M.; Razavi, S.M.; Berto, F. Energy-based ductile failure predictions in cracked friction-stir welded joints. Eng. Fail. Anal. 2019, 102, 327–337. [Google Scholar] [CrossRef]
  12. Bhatti, A.A.; Barsoum, Z.; Murakawa, H.; Barsoum, I. Influence of thermo-mechanical material properties of different steel grades on welding residual stresses and angular distortion. Mater. Des. 2015, 65, 878–889. [Google Scholar] [CrossRef]
  13. Asadi, P.; Alimohammadi, S.; Kohantorabi, O.; Fazli, A.; Akbari, M. Effects of material type, preheating and weld pass number on residual stress of welded steel pipes by multi-pass TIG welding (C-Mn, SUS304, SUS316). Therm. Sci. Eng. Prog. 2020, 16, 100462. [Google Scholar] [CrossRef]
  14. Lin, J.; Ma, N.; Liu, X.; Lei, Y. Modification of residual stress distribution in welded joint of titanium alloy with multi electron beam heating. J. Mater. Process. Technol. 2020, 278, 116504. [Google Scholar] [CrossRef]
  15. Kik, T. Heat source models in numerical simulations of laser welding. Materials 2020, 13, 2653. [Google Scholar] [CrossRef]
  16. Ferro, P.; Berto, F. Quantification of the influence of residual stresses on fatigue strength of al-alloy welded joints by means of the local strain energy density approach. Strength Mater. 2016, 48, 426–436. [Google Scholar] [CrossRef]
  17. Chiocca, A.; Frendo, F.; Bertini, L. Evaluation of residual stresses in a pipe-toplate welded joint by means of uncoupled ther-mal-structural simulation and experimental tests. Int. J. Mech. Sci. 2021, 199, 106401. [Google Scholar] [CrossRef]
  18. Zhu, J.; Khurshid, M.; Barsoum, Z. Accuracy of computational welding mechanics methods for estimation of angular distortion and residual stresses. Weld. World 2019, 63, 1391–1405. [Google Scholar] [CrossRef] [Green Version]
  19. Ak, A.; Ard, B. Effects of welding parameters and welding sequence on residual stress and distortion in Al6061-T6 aluminum alloy for T-shaped welded joint. Trans. Nonferrous Met. Soc. China 2020, 30, 76–89. [Google Scholar]
  20. Sepe, R.; Giannella, V.; Greco, A.; De Luca, A. Fem simulation and experimental tests on the smaw welding of a dissimilar t-joint. Metals 2021, 11, 1016. [Google Scholar] [CrossRef]
  21. Sepe, R.; De Luca, A.; Greco, A.; Armentani, E. Numerical evaluation of temperature fields and residual stresses in butt weld joints and comparison with experimental measurements. Fatigue Fract. Eng. Mater. Struct. 2021, 44, 182–198. [Google Scholar] [CrossRef]
  22. Sepe, R.; Armentani, E.; Lamanna, G.; Caputo, F. Evaluation by FEM of the influence of the preheating and post-heating treatments on residual stresses in welding. Key Eng. Mater. 2015, 627, 93–96. [Google Scholar] [CrossRef]
  23. Armentani, E.; Esposito, R.; Sepe, R. The influence of thermal properties and preheating on residual stresses in welding. Int. J. Comput. Mater. Sci. Surf. Eng. 2007, 1, 146–162. [Google Scholar] [CrossRef]
  24. Jie, Y.; Zhang, J.-m.; Cao, S.-f.; Guo, P.-c. Effect of welding sequence on residual stress and deformation of 6061-T6 aluminium alloy automobile component. Trans. Nonferrous Met. Soc. China 2019, 29, 287–295. [Google Scholar]
  25. Sattari-Far, I.; Javadi, Y. Influence of welding sequence on welding distortions in pipes. Int. J. Press. Ves-Sels Pip. 2008, 85, 265–274. [Google Scholar] [CrossRef]
  26. Wang, Z.Y.; Zhang, T.; Li, X. Experimental and numerical study of residual stress distribution of corrugated web I-beams. J. Constr. Steel Res. 2020, 166, 105926. [Google Scholar] [CrossRef]
  27. Kubo, M.; Watanabe, K. Residual stress measurement of corrugated steel web sections. J. Jpn. Soc. Civl. Eng. 2017, 73, 248–258. (In Japanese) [Google Scholar]
  28. Kollár, D.; Kövesdi, B. Welding simulation of corrugated web girders-Part 1: Effect of manufacturing on residual stresses and imperfections. Thin-Walled Struct. 2020, 146, 106107. [Google Scholar] [CrossRef]
  29. Kollár, D.; Kövesdi, B. Welding simulation of corrugated web girders-Part 2: Effect of manufacturing on shear buckling re-sistance. Thin-Walled Struct. 2019, 141, 477–488. [Google Scholar] [CrossRef]
  30. Zhang, W.; Jiang, W.; Zhao, X.; Tu, S.T. Fatigue life of a dissimilar welded joint considering the weld residual stress: Experimental and finite element simulation. Int. J. Fatigue 2018, 109, 182–190. [Google Scholar] [CrossRef]
  31. Wang, F.F.; Wang, B. Current research progress in non-classical Fourier heat conduction. In Proceedings of the 2013 International Conference on Materials Engineering and Mechanical Automation(MEMA 2013), Beijing, China, 25–26 October 2013; pp. 196–205. [Google Scholar]
  32. Khoei, A.R.; Azami, A.R. A single cone-cap plasticity with an isotropic hardening rule for powder materials. Int. J. Mech. Sci. 2005, 47, 94–109. [Google Scholar] [CrossRef]
  33. Zhang, H.; Liu, Y.; Deng, Y. Temperature gradient modeling of a steel box-girder suspension bridge using Copulas probabilistic method and field monitoring. Adv. Struct. Eng. 2021, 24, 947–961. [Google Scholar] [CrossRef]
  34. Zhang, H.; Li, L.; Ma, W.; Luo, Y.; Li, Z.; Kuai, H. Effects of welding residual stresses on fatigue reliability assessment of a PC beam bridge with corrugated steel webs under dynamic vehicle loading. Structures 2022, 45, 1561–1572. [Google Scholar] [CrossRef]
  35. Goldak, J.; Chakravarti, A.; Bibby, M. A new finite element model for welding heat sources. Metall. Trans. B 1984, 15, 299–305. [Google Scholar] [CrossRef]
  36. Zhang, H.W.; Gui, L.J.; Fan, Z.J. Research and verification of welding heat source parameters optimization model. J. Tsinghua Univ. (Sci. Technol.) 2022, 52, 367–373. (In Chinese) [Google Scholar]
Figure 1. Diagram of the isotropic hardening rule.
Metals 12 01831 g001
Figure 2. Finite element model of corrugated steel web–chord plate weldment (unit: mm).
Metals 12 01831 g002
Figure 3. The thermophysical material parameters of Q345 steel [34].
Metals 12 01831 g003
Figure 4. The stress results of models with different mesh sizes.
Metals 12 01831 g004
Figure 5. Meshing and boundary conditions model of CSWs. (a) Corrugated angle 30°; (b) Corrugated angle 45°; (c) Corrugated angle 60°.
Metals 12 01831 g005aMetals 12 01831 g005b
Figure 6. Diagram of welding boundary conditions.
Metals 12 01831 g006
Figure 7. Double-ellipsoidal heat source model.
Metals 12 01831 g007
Figure 8. The flow chart of heat source optimization.
Metals 12 01831 g008
Figure 9. Welded pool model diagram (°C).
Metals 12 01831 g009
Figure 10. Time course of temperature field cloud image in welding stage (unit: °C); (a) Temperature field at 1 s; (b) Temperature field at 86 s; (c) Temperature field at 172 s; (d) Temperature field at 174 s; (e) Temperature field at 260 s; (f) Temperature field at 346 s.
Metals 12 01831 g010aMetals 12 01831 g010b
Figure 11. Time course of temperature field cloud image in the cooling stage (unit: °C); (a) Temperature field at 100 s; (b) Temperature field at 1000 s; (c) Temperature field at 2000 s; (d) Temperature field at 3000 s.
Metals 12 01831 g011
Figure 12. Layout diagram of temperature measuring points for weldments.
Metals 12 01831 g012
Figure 13. Temperature history curve of path 1.
Metals 12 01831 g013
Figure 14. Temperature history curve of path 2.
Metals 12 01831 g014
Figure 15. Stress field contour plot in welding stage (Unit: Pa); (a) Stress field at 20 s (30°); (b) Stress field at 20 s (45°); (c) Stress field at 20 s (60°).
Metals 12 01831 g015aMetals 12 01831 g015b
Figure 16. Stress field contour plot after cooling (Unit: Pa); (a) Stress field (30°); (b) Stress field (45°); (c) Stress field (60°).
Metals 12 01831 g016
Figure 17. The layout of specimen strain sensor Figure 17 [26].
Metals 12 01831 g017
Figure 18. Comparison of CSWs experiment and simulation data.
Metals 12 01831 g018
Figure 19. Residual stress distribution of transverse path posterior weldment. (a) Along the path direction; (b) Position of weld toe.
Metals 12 01831 g019
Figure 20. Residual stress distribution of transverse path front weldment. (a) Along the path direction; (b) Position of weld toe.
Metals 12 01831 g020
Figure 21. Residual stress distribution of longitudinal path posterior weldment. (a) Along the path direction; (b) Position of weld toe.
Metals 12 01831 g021
Figure 22. Residual stress distribution of longitudinal path front weldment. (a) Along the path direction; (b) Position of weld toe.
Metals 12 01831 g022
Figure 23. Welding condition diagram.
Metals 12 01831 g023
Figure 24. Residual stress distribution in the y direction. (a) Path1; (b) Path2.
Metals 12 01831 g024
Figure 25. Residual stress distribution of σx in different welding conditions. (a) Along the path direction; (b) Position of weld toe.
Metals 12 01831 g025
Figure 26. Residual stress distribution of σy in different welding conditions. (a) Along the path direction; (b) Position of weld toe.
Metals 12 01831 g026
Table 1. Chemical composition (wt. %) of Q345 medium carbon steel.
MaterialsCSiMnCrNiCuTi
Q3450.20.51.50.30.50.30.2
Table 2. Comparison of welding pool parameters.
Width of Welding Pool (Unit: mm)Depth of Welding Pool (Unit: mm)
Test data6.5 [36]8.0 [36]
FEA data6.27.5
Table 3. Welding heat source parameter.
Welding Current (A)38Shape Parameter a1 (mm)2
Welding Voltage (V)360Shape Parameter a2 (mm)3
Heat source efficiency0.8Shape parameter b (mm)8
Energy classification f11Shape parameter c (mm)8
Energy classification f21Heat source moving rate (mm/s)5
Publisher’s Note: MDPI stays neutral with regard to jurisdictional claims in published maps and institutional affiliations.

