Article

Prediction of Thermal Distortion during Steel Solidification

Department of Mechanical Engineering, Colorado School of Mines, 1610 Illinois Street, Golden, CO 80401, USA
*
Author to whom correspondence should be addressed.
Metals 2022, 12(11), 1807; https://doi.org/10.3390/met12111807
Submission received: 22 September 2022 / Revised: 16 October 2022 / Accepted: 17 October 2022 / Published: 25 October 2022
(This article belongs to the Special Issue Numerical Simulation of Solidification Processes)

Abstract

:
Thermal distortion during the initial stages of solidification is an important cause of surface quality problems in cast products. In this work, a finite element model including non-linear temperature-, phase-, and carbon-content-dependent elastic–viscoplastic constitutive equations is applied to study the effect of steel grade and interfacial heat flux on thermal distortion of a solidifying steel droplet. Due to thermal contraction, the bottom surface of the droplet bends away from the chill plate and a gap forms. It is shown that, regardless of the nature of the heat flux, the gap forms and grows the most very early during solidification (~0.1 s) and remains almost unchanged afterward. Increasing the heat flux decreases the time for evolution of the gap and increases its depth. When the carbon content is less than 0.10%C, the gap depth is very sensitive to the heat flux, but for higher carbon contents, this sensitivity is much weaker. The highest gap depths are predicted in ultra-low carbon (0.003%C) and peritectic steels (0.12%C), and agree both qualitatively and quantitatively with the experimental measurements. Thus, the current thermal-mechanical model, including its phase-dependent properties, captures the mechanism responsible for nonuniform solidification, depression sensitivity and surface defects affecting these steels.

1. Introduction

Continuous casting technology is the primary method of producing semi-finished steel products, and over 96% of the world’s steel is made using this process [1]. One of the most important features of continuously cast strands is their surface quality, which is mainly controlled by initial solidification at the meniscus [2,3,4]. In this region, the solidifying shell is subjected to complicated thermal and mechanical loading conditions [5] which may lead to formation of surface defects such as depressions [6], oscillation marks [7,8], and cracks [9,10].
Understanding the root causes of surface defect formation is the main key to control the strand surface quality [11,12]. It is well known that steel grade is the most critical parameter that affects depression severity [4,11,13,14]. Ultra-low carbon steels (<0.005%C) suffer from poor surface quality [5], and steels which undergo the peritectic transformation (~0.09 < %C <~0.17) and experience “peritectic behavior” [15] exhibit the deepest surface depressions, with a peak in severity typically observed around 0.10%C [16,17], depending on the other alloying elements [15]. Surface depressions during steel solidification are responsible for many other surface defects [18,19,20,21] and often have been attributed to the shrinkage associated with the δ-ferrite to austenite solid-state phase transformation [22].
During continuous casting, initial solidification at the meniscus is influenced by many complicated transient phenomena such as mold oscillation [21], slag infiltration [23], movement of the slag rim [24], turbulent fluid flow [25], liquid surface level drops [26], liquid overflow of the shell tip [27], and surface tension effects [28], in addition to the high local heat flux and thermal distortion [11]. These all cause transient changes to the meniscus shape and affect the final shape of the surface of the solidified shell including surface depressions [5]. Thus, it is almost impossible to isolate the effect of thermal deformation due to phase transformation on the final surface shape. To this end, laboratory experimental methods have been developed to characterize the surface shape variations with steel grade during initial solidification, such as the “dip test” [29] in which a copper chill block is immersed into a liquid steel bath for a short time. Visualizing and measuring the roughness of the thin steel shell that solidifies onto the plate provides an indication of the susceptibility of the steel grade to surface depressions during casting. Another simple experiment, the “droplet test”, was proposed by Dong and coworkers [30,31,32] in which a small liquid steel droplet is placed on a chill plate and the free deformation of the bottom of this droplet is measured. In spite of its differences with the actual production method, the effect of steel grade on the surface shape was found to match with experience in commercial continuous casters. Thus, the effect of thermal distortion on solidifying shell shape under a sharp temperature gradient can be isolated and studied using the droplet test.
Previously, the droplet test was used to investigate the effect of carbon content on free deformation during steel droplet solidification [31]. Small liquid steel droplets of 4–8 g were levitated and dropped 35 mm onto a water-cooled chill plate made of either graphite for slow cooling, or copper for fast cooling. After solidification and cooling to room temperature, the bottom surface of the droplets took a parabolically-curved shape, indicating that a gap formed between the bottom surface and the chill plate. The bottom surface of each solidified droplet was fitted to a parabola and the curvature was characterized with a single fitting parameter, Nd:
gap = NdR2
where R is the horizontal distance from the center of the droplet bottom surface. The curvature of the bottom surface was measured for different grades and droplet sizes [31,32]. It was found that the bottom surface curvature is controlled by the composition, with two peaks: at near pure iron (carbon content is almost zero) and at around 0.12%C. Positive curvature (gap increasing with R) was observed in all small droplets with < 0.6%C. In addition to steel grade, the heat transfer rate between the solidifying droplet and chill plate has a great effect on thermal distortion. The measured curvatures of the droplet bottom surface solidified onto a copper chill plate are much larger than those on a graphite chill plate, especially with peritectic steels [31,32]. This is because the average heat transfer coefficient at the steel shell/graphite chill plate interface is about one third of that at the steel/copper interface [31].
Several computational models of thermal-mechanical behavior of steel during initial solidification have been developed in previous works [26,33,34,35,36,37,38,39,40,41,42,43,44]. Analytical solutions of thermal stress during solidification have predicted air gap formation during the casting process, including the effects of mold taper and superheat, but these simple models neglect the effects of alloy solidification range, solid-state phase transformations, plasticity and creep [35,36,39]. Advanced computational models based on numerical methods such as the finite element method, are able to include these effects with realistic temperature-dependent thermal and mechanical properties. Several such models have investigated gap formation during steel continuous casting in the mold [26,41,42,43,45,46,47,48,49,50,51,52], and many of them have shown that shell shrinkage is greatest towards the mold corners, which generates large gaps between the shell and mold there [42,43,45,46,47]. These gaps become filled with mold flux, [40,47] leading to lower heat transfer [40], hot spots [41] and longitudinal depressions [45,47] on the shell surface in the off-corner regions of the strand. Shell shrinkage in the mold was found to decrease with increasing casting speed, owing to the decreased time in the mold, leading to a hotter, thinner shell, [42] so less taper is required to compensate for the shrinkage [53].
Other such thermal-mechanical finite-element models have been applied to investigate sudden liquid level drops during the continuous casting process on thermal distortion of the shell during initial solidification and surface depression formation [26,33]. These models showed that shell tip distortion increases with increasing level drop and is largest for ultra-low carbon and peritectic steels [26,33].
Parkman et al. [34] simulated thermal distortion of solidifying steel droplets with an elastic-viscoplastic finite element model including the effect of phase transformation strains. Simulations showed that the gap forms and reaches its maximum depth at very early stages of solidification (within 0.1 s). Based on temperature measurements during the droplet test [31], the heat transfer coefficient dropped suddenly from 17.8 to 5.0 kW/m2K. The transition was postulated to occur when the solid layer gained sufficient strength to support the ferrostatic pressure and bend away from the chill plate [30,31]. Suddenly dropping the heat transfer coefficient in the simulation from 20 to 5 kW/m2K after 0.05 s was found to increase the droplet surface curvature (gap depth) [31]. Increasing the heat transfer coefficient or decreasing the transition time both increased the gap depth [31]. Similar to the experimental work in [31], their model investigation of the effect of carbon content on gap depth revealed two peaks at nearly pure iron (0.003%C) and 0.12%C (peritectic steel) [34]. However, despite predicting the gap depth trend with carbon content very accurately, the magnitude of the simulated gap depths (surface curvatures) [34] was much higher than measured [31].
The solid state δ→γ phase transformation has been established to be the main cause of surface depressions and the associated surface quality problems in continuously cast steel products. However, no previous fundamental model appears to be able to quantitatively predict the steel surface shape under the heat transfer conditions of continuous casting. Accurate prediction of the severity of surface depressions for a specific steel grade under real conditions would enable appropriate action(s) to be taken at the caster to improve surface quality. The aim of this work is to study the effects of steel grade (carbon content) and heat flux conditions on shrinkage and thermal distortion of a solidifying steel droplet. The same conditions as in the experimental droplet test [31] are used for the simulations, and predictions of the curvature of the bottom surface of the droplet are validated with the measurements. Furthermore, the effect on this behavior is investigated to reveal new insights into thermal distortion during initial solidification.

2. Model Description

The computational model used in this work to model initial thermal-mechanical behavior of steel during initial solidification, including the simulation domain, heat transfer model, stress model, and solution details are described in this section.

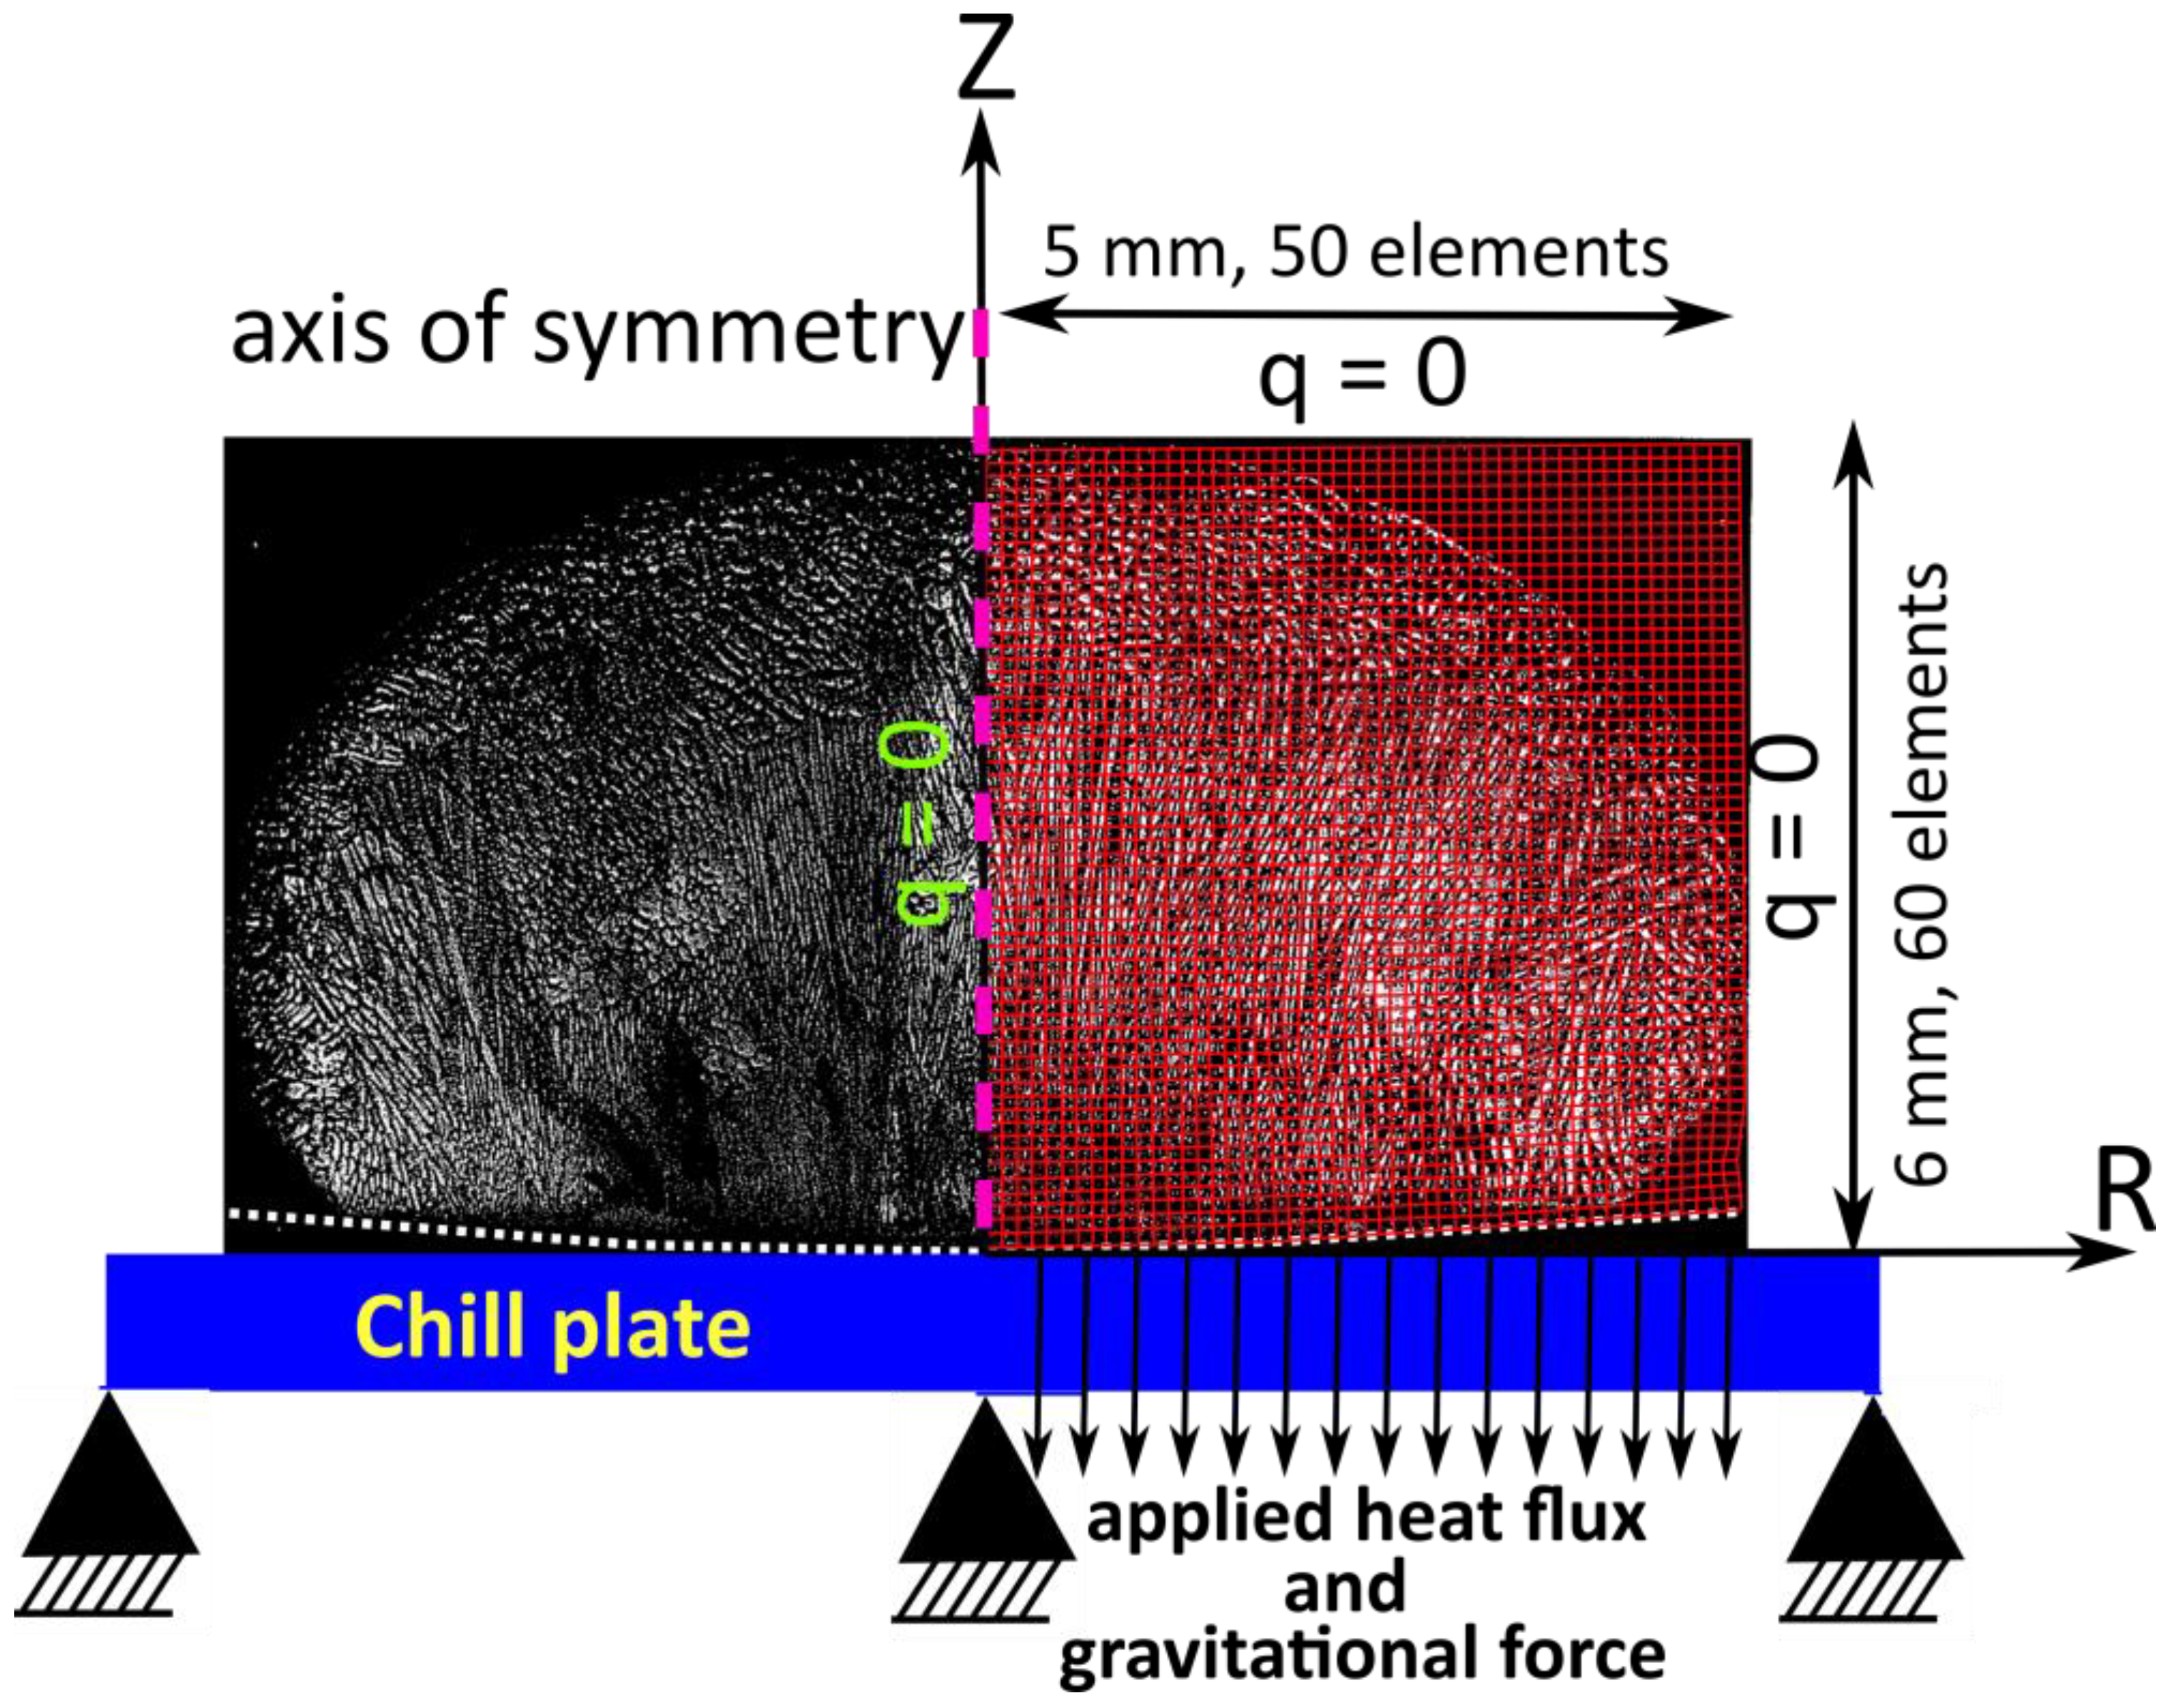
2.1. Model Domain and Boundary Conditions

Thermal distortion of a steel droplet is simulated with a cylindrical domain for the conditions of the experimental droplet test [31]. In the experimental study, 4 g steel samples of 10 mm-diameter steel rod with different carbon contents were re-melted in a levitation coil and dropped on the surface of a chill plate which was 35 mm below the coil. To investigate the effect of heat flux on surface distortion, two different chill plates, (copper chill (cc) and a graphite chill (gc)) were used [31]. In the current study, a two-dimensional axisymmetric finite-element model is used to simulate the thermal-mechanical behavior of the solidifying droplet. A micrograph of a typical solidified droplet is shown in Figure 1, together with the simulation domain and its finite-element mesh in red, deformed (at 1:1 scale) to show the final distorted shape. The cylindrical domain has 5 mm radius and 6 mm height which weighs 4 g, considering the steel density of 7.8 kg/m3. The effect of droplet size and shape is explored in the last section. Heat flux is applied uniformly on the bottom surface and the other surfaces are insulated. There is no mechanical constraint on the domain surfaces, so they can deform freely.
Thus, the surfaces are stress free, except for a surface traction equivalent to the gravitational body force, ρgh, applied on the bottom surface. This effectively pushes the thin solidifying steel shell towards the chill plate, according to the liquid pressure above it. Applying this pressure at the bottom avoids convergence problems associated with loading the weak liquid, while having negligible effect on the results.

2.2. Heat Transfer Model and Applied Heat Flux

The two-dimensional transient heat conduction equation is solved for the temperature field of the solidifying droplet in cylindrical coordinates:
ρ H t = · k T
In this equation, ρ is temperature-dependent mass density, (kg/m3) H is temperature-dependent specific enthalpy (J/kgK) which includes the latent heats of phase transformations, t is time (s), k is isotropic temperature-dependent thermal conductivity, (W/mK) and T is temperature (°C).
Heat flux is applied on the bottom surface in Figure 1, and the other three surfaces are insulated. The initial temperature of the domain for each steel grade is set to be 10 °C above the liquidus temperature (i.e., constant superheat) to facilitate fair comparison of steels with different carbon contents.
As a curve fit of measurements on typical slab casters, [44] instantaneous heat flux during continuous casting can be represented as a function of time by q ˙ s t a n d a r d = 6.36   t + 1.032 (MW/m2). This standard heat flux (SHF =   q ˙ s t a n d a r d ) and high heat flux (HHF = 2 q ˙ s t a n d a r d ) conditions were used in this work to investigate the effect of heat flux during continuous casting on thermal distortion. More realistically, the droplet usually experiences a transition in heat flux (THF), where the heat transfer coefficient ( h ) in the heat convection equation ( q ˙ = h Δ T ) drops (e.g., from 17.8 to 5.0 kW/m2K at 0.06 s) at the solid shell/chill plate interface, once the solid shell starts to deform [32]. This sudden decrease of heat transfer coefficient is due to the formation of an air gap at the shell/plate interface between the solidifying steel shell and the chill plate. In order to compare the simulation results of this work with the measurements in [31], the instantaneous heat flux for the validation cases was set to suddenly drop from 3.2 q ˙ s t a n d a r d to q ˙ s t a n d a r d at t = 0.06 s, which approximates the time when the solid shell starts to bend away from the chill plate. This THF case was chosen to match exactly with the conditions of 17.8 to 5.0 kW/m2K at t = 0.06 s reported in the experimental paper [31].

2.3. Stress Model

During solidification, strains are in the order of only a few percent, so it is reasonable to adopt the small strain assumption. The mechanical behavior of the solidifying steel droplet is governed by the quasi-static momentum balance equation:
· σ _ ¯ + b = 0
where σ _ ¯ is the second-order Cauchy stress tensor, and b is an applied body force which is equal to zero in this work [43,44].
The total strain rate is divided into elastic ( ε ˙ e l ), inelastic ( ε ˙ i e ), thermal ( ε ˙ t h ), and fluid strain ( ε ˙ f l ) components.
ε ˙ = ε ˙ e l + ε ˙ i e + ε ˙ t h + ε ˙ f l
where inelastic strain includes the effects of time-independent plasticity and creep. The fluid strain is the inelastic strain generated while the steel is liquid. Fluid strain represents a measure of liquid feeding to accommodate thermal shrinkage of the solidifying shell. Stress and strain are related by phase-dependent unified constitutive equations. The liquid phase is considered as a perfectly-plastic material with elastic modulus of 1 GPa, Poisson’s ratio ν = 0.3 and σyield = 10 kPa. The δ-ferrite phase is modeled with the Zhu modified power law [44], and the austenite phase uses model III from Kozlowski [54]. Further details on the formulation of this thermal-mechanical finite-element model are given elsewhere [43,44].

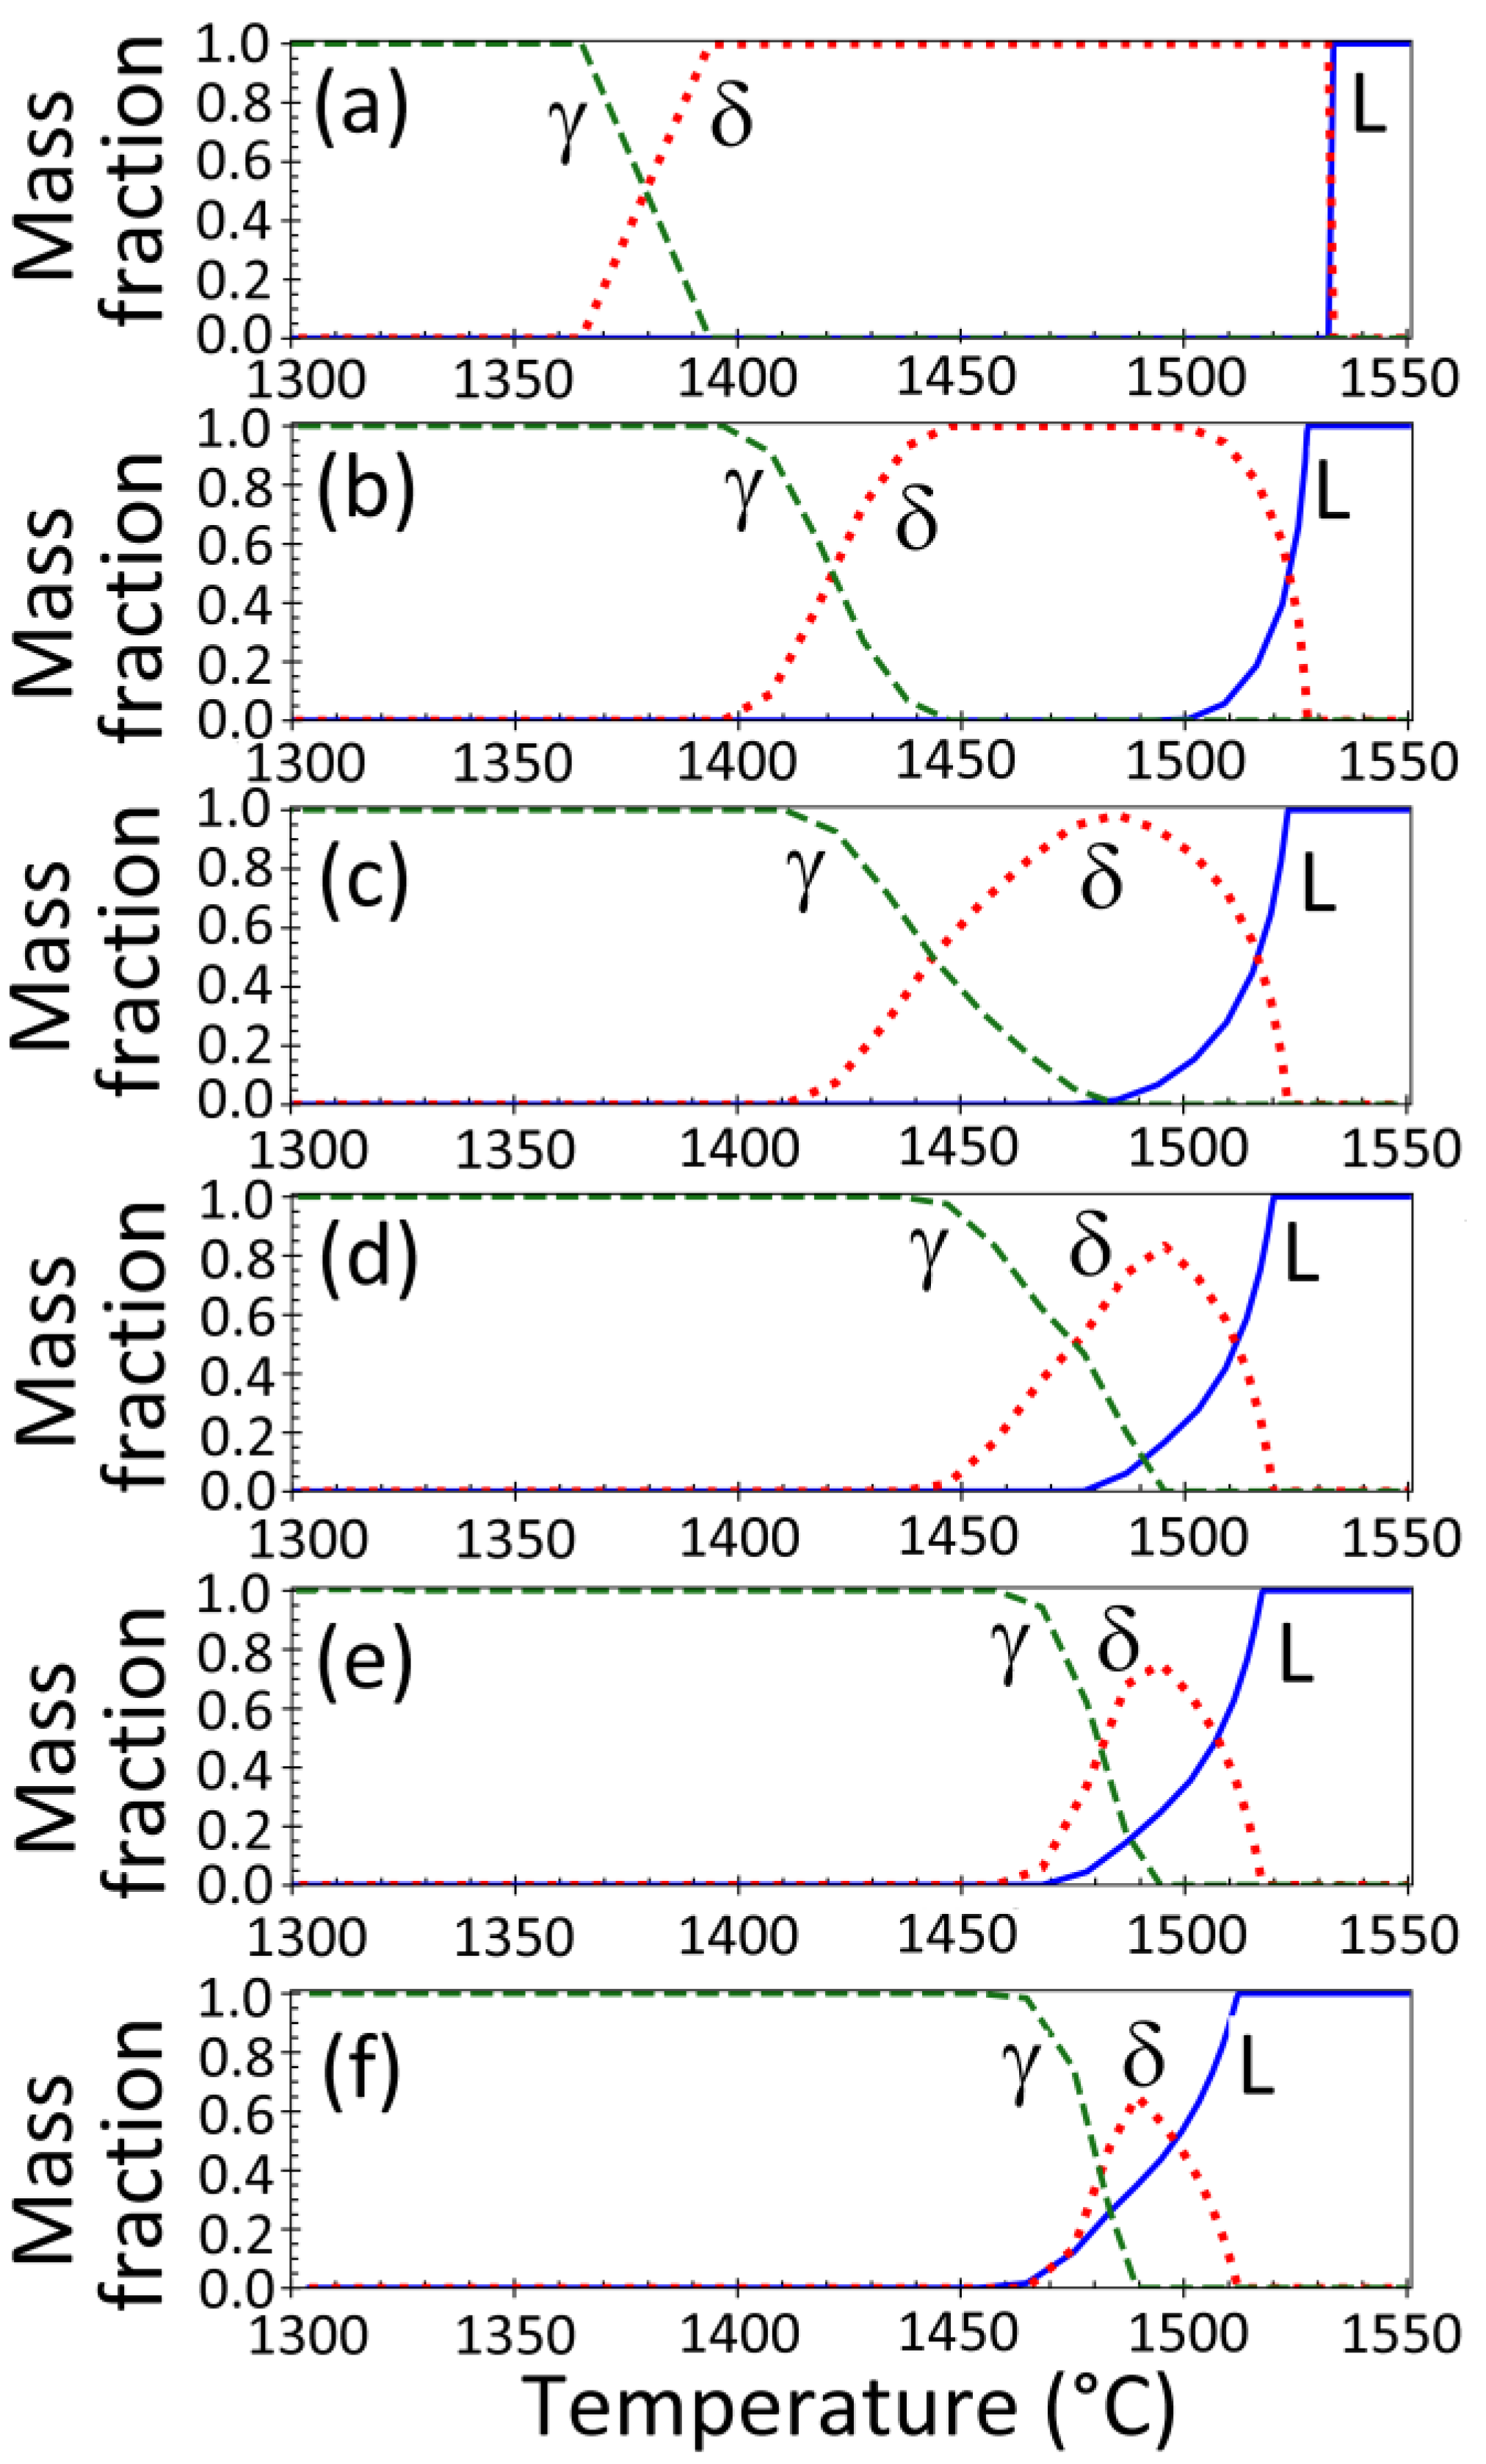
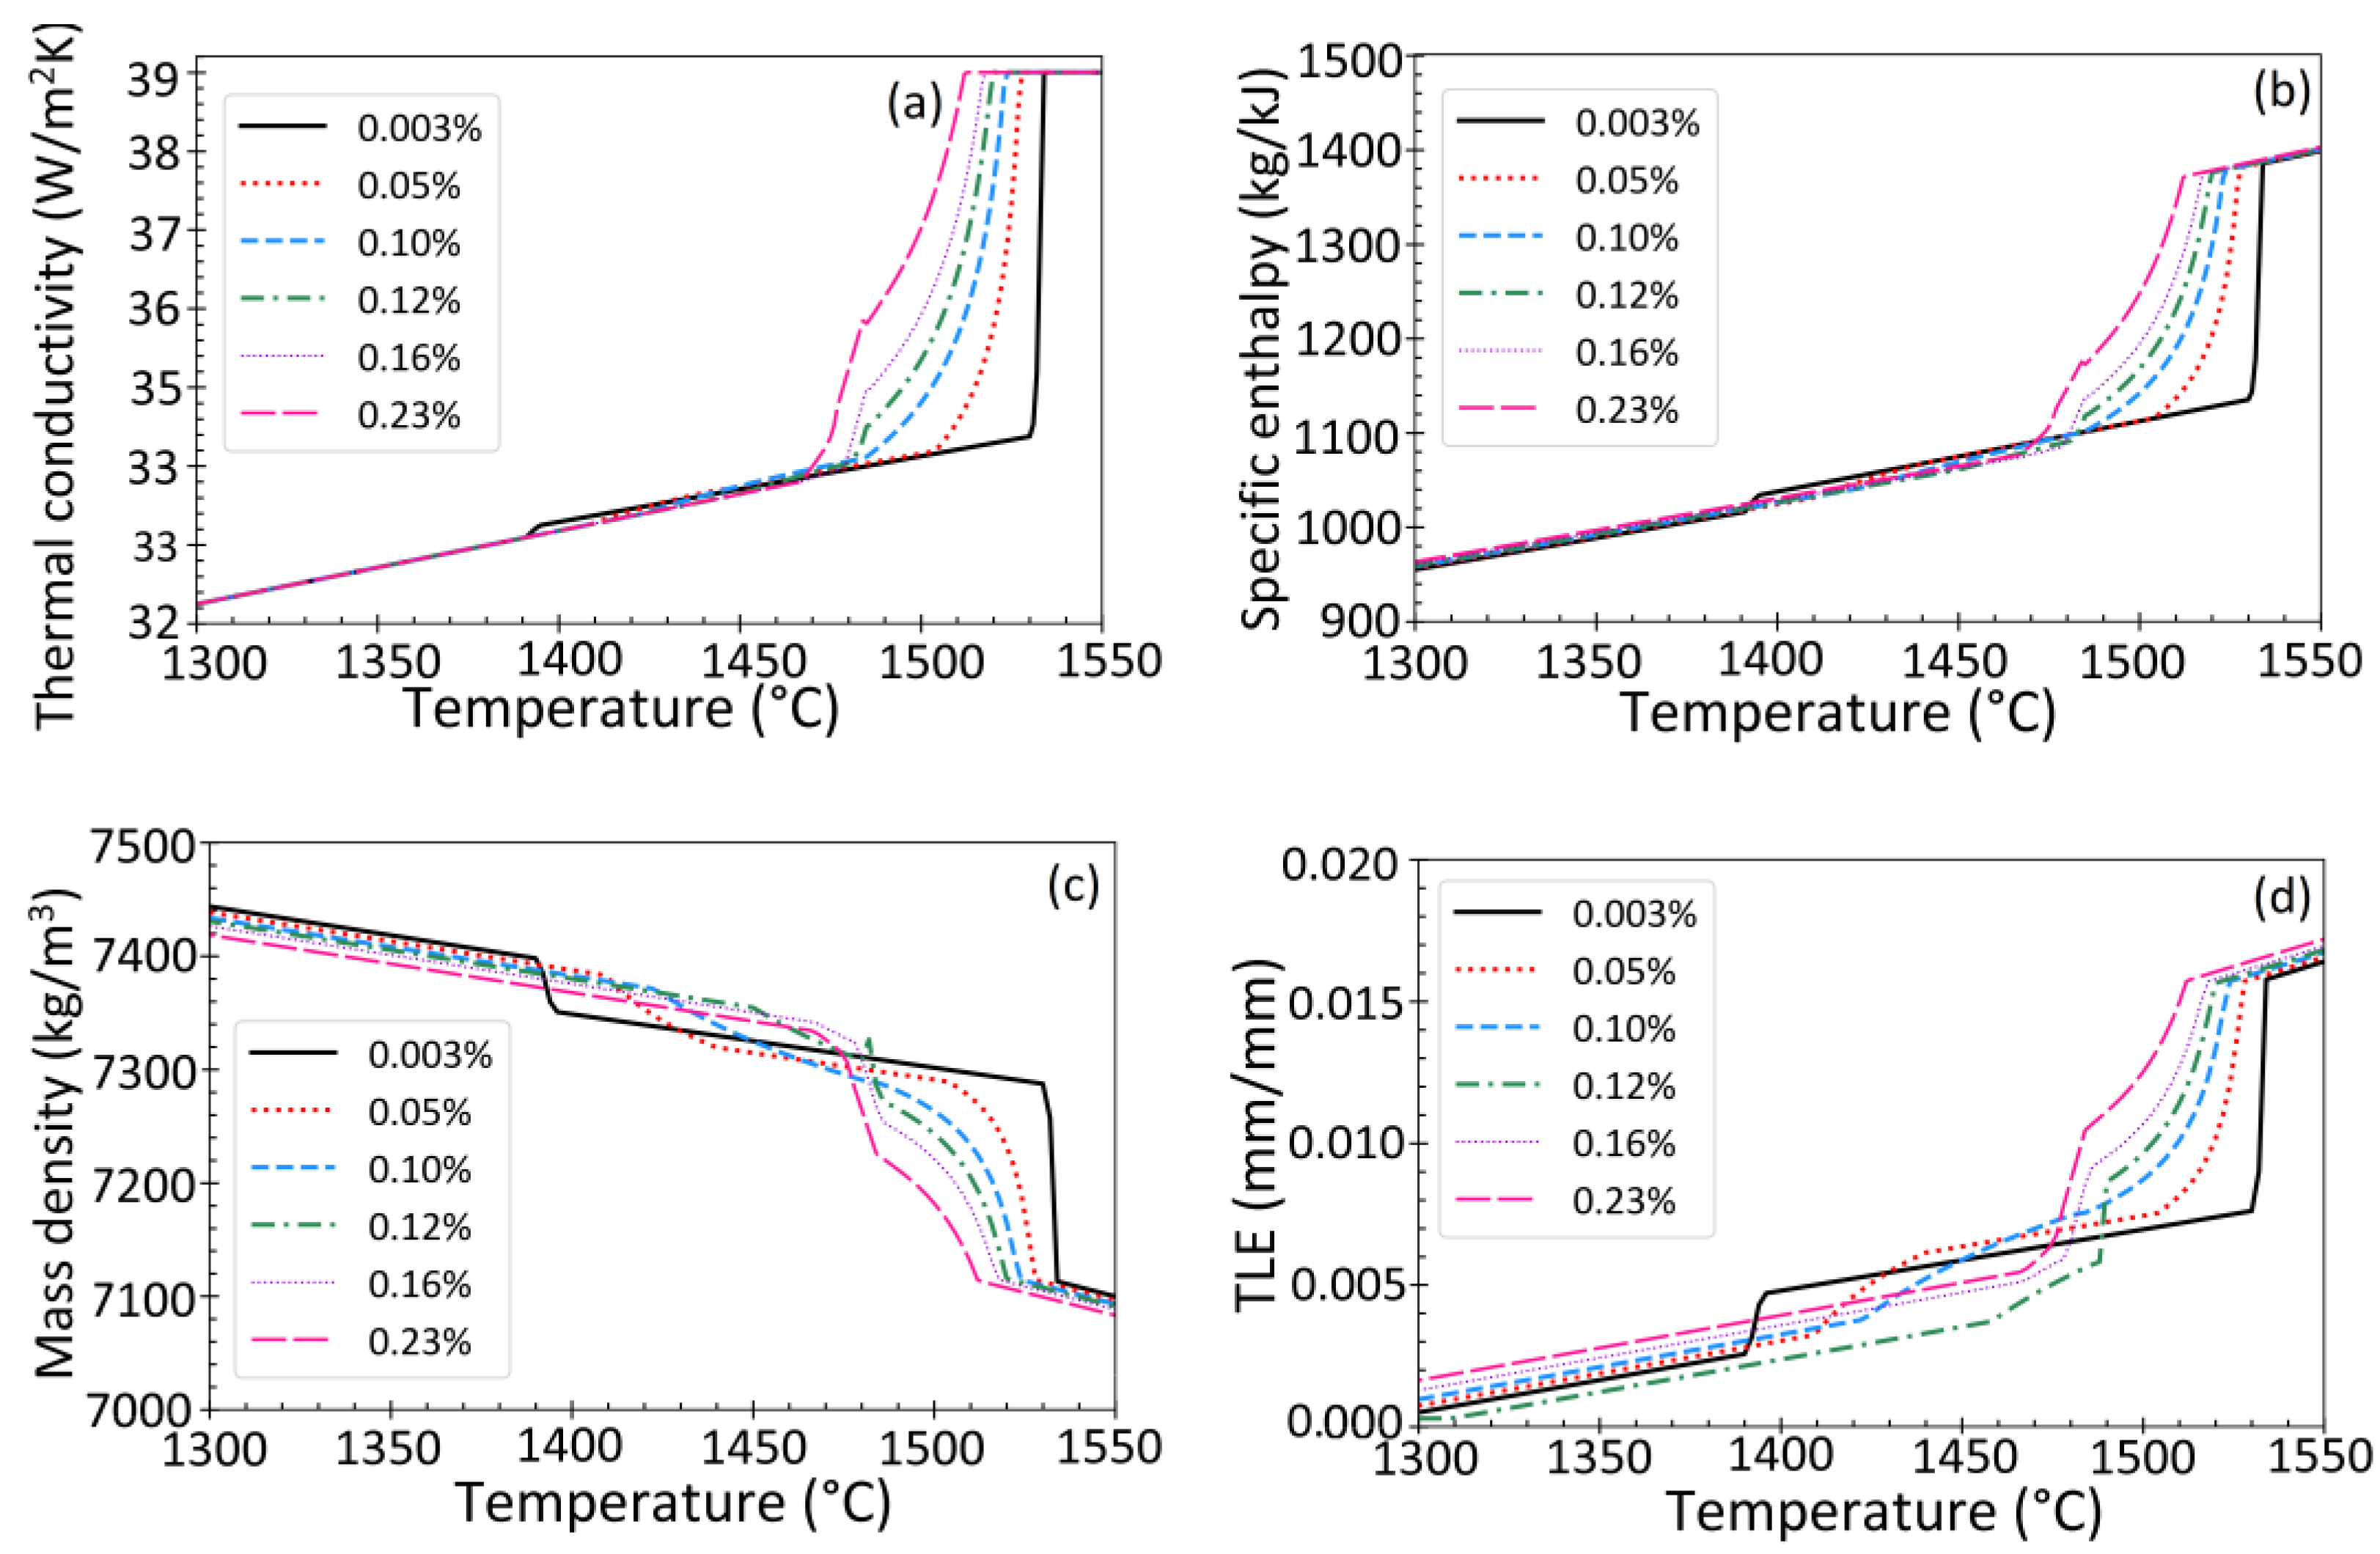
2.4. Phase Fractions and Thermal Properties

In this work, six steel grades with different carbon weight percent of 0.003%, 0.05%, 0.10%, 0.12%, 0.16% and 0.23%, were examined. The mass fractions of liquid, δ-ferrite, and austenite (γ) for each steel are calculated as a function of temperature and steel composition, using the lever rule, as plotted in Figure 2. The phase diagram used in this work is a pseudo-binary phase diagram which is constructed based on 15 points in temperature-composition space that changes with alloying elements [43]. A rule for multicomponent ternary systems is applied in the non-equilibrium three-phase region [44]. In this model, complete mixing of solute elements in the liquid phase and local equilibrium at liquid-δ, liquid-γ and δ-γ interfaces is assumed to calculate phase fractions. Thus, non-equilibrium thermal undercooling effects are neglected.
Temperature dependent properties include thermal conductivity, enthalpy, mass density and thermal linear expansion, as shown in Figure 3, and are calculated using the method presented by Li and Thomas [43]. In mixed phase regions, specific heat, thermal linear expansion, and enthalpy are calculated using a weighted average (mixture rule) based on the mass fraction of the phases present at that temperature [43]. The thermal linear expansion (TLE) function for each phase is obtained from measurements of the solid-phase mass density [44,55] and liquid density [56]. Further details on the TLE calculation can be found elsewhere [44].

2.5. Numerical Details

ABAQUS/Standard (implicit) [57] was used to solve the governing equations in two steps: the heat transfer analysis followed by the mechanical analysis. The ABAQUS user subroutine DFLUX [58] was used to apply the heat flux boundary condition. The calculated temperature field at each time step is an input to the mechanical analysis to calculate the thermal strain. Four-node axisymmetric convection/diffusion quadrilateral elements (DCCAX4) and 4-node hybrid, bilinear axisymmetric quadrilateral, constant pressure elements (CAX4H) were used for the thermal and stress analyses, respectively. The time step size varied from 0.0001 to 1 s, and was controlled to keep the maximum temperature change per time step within 50 K.

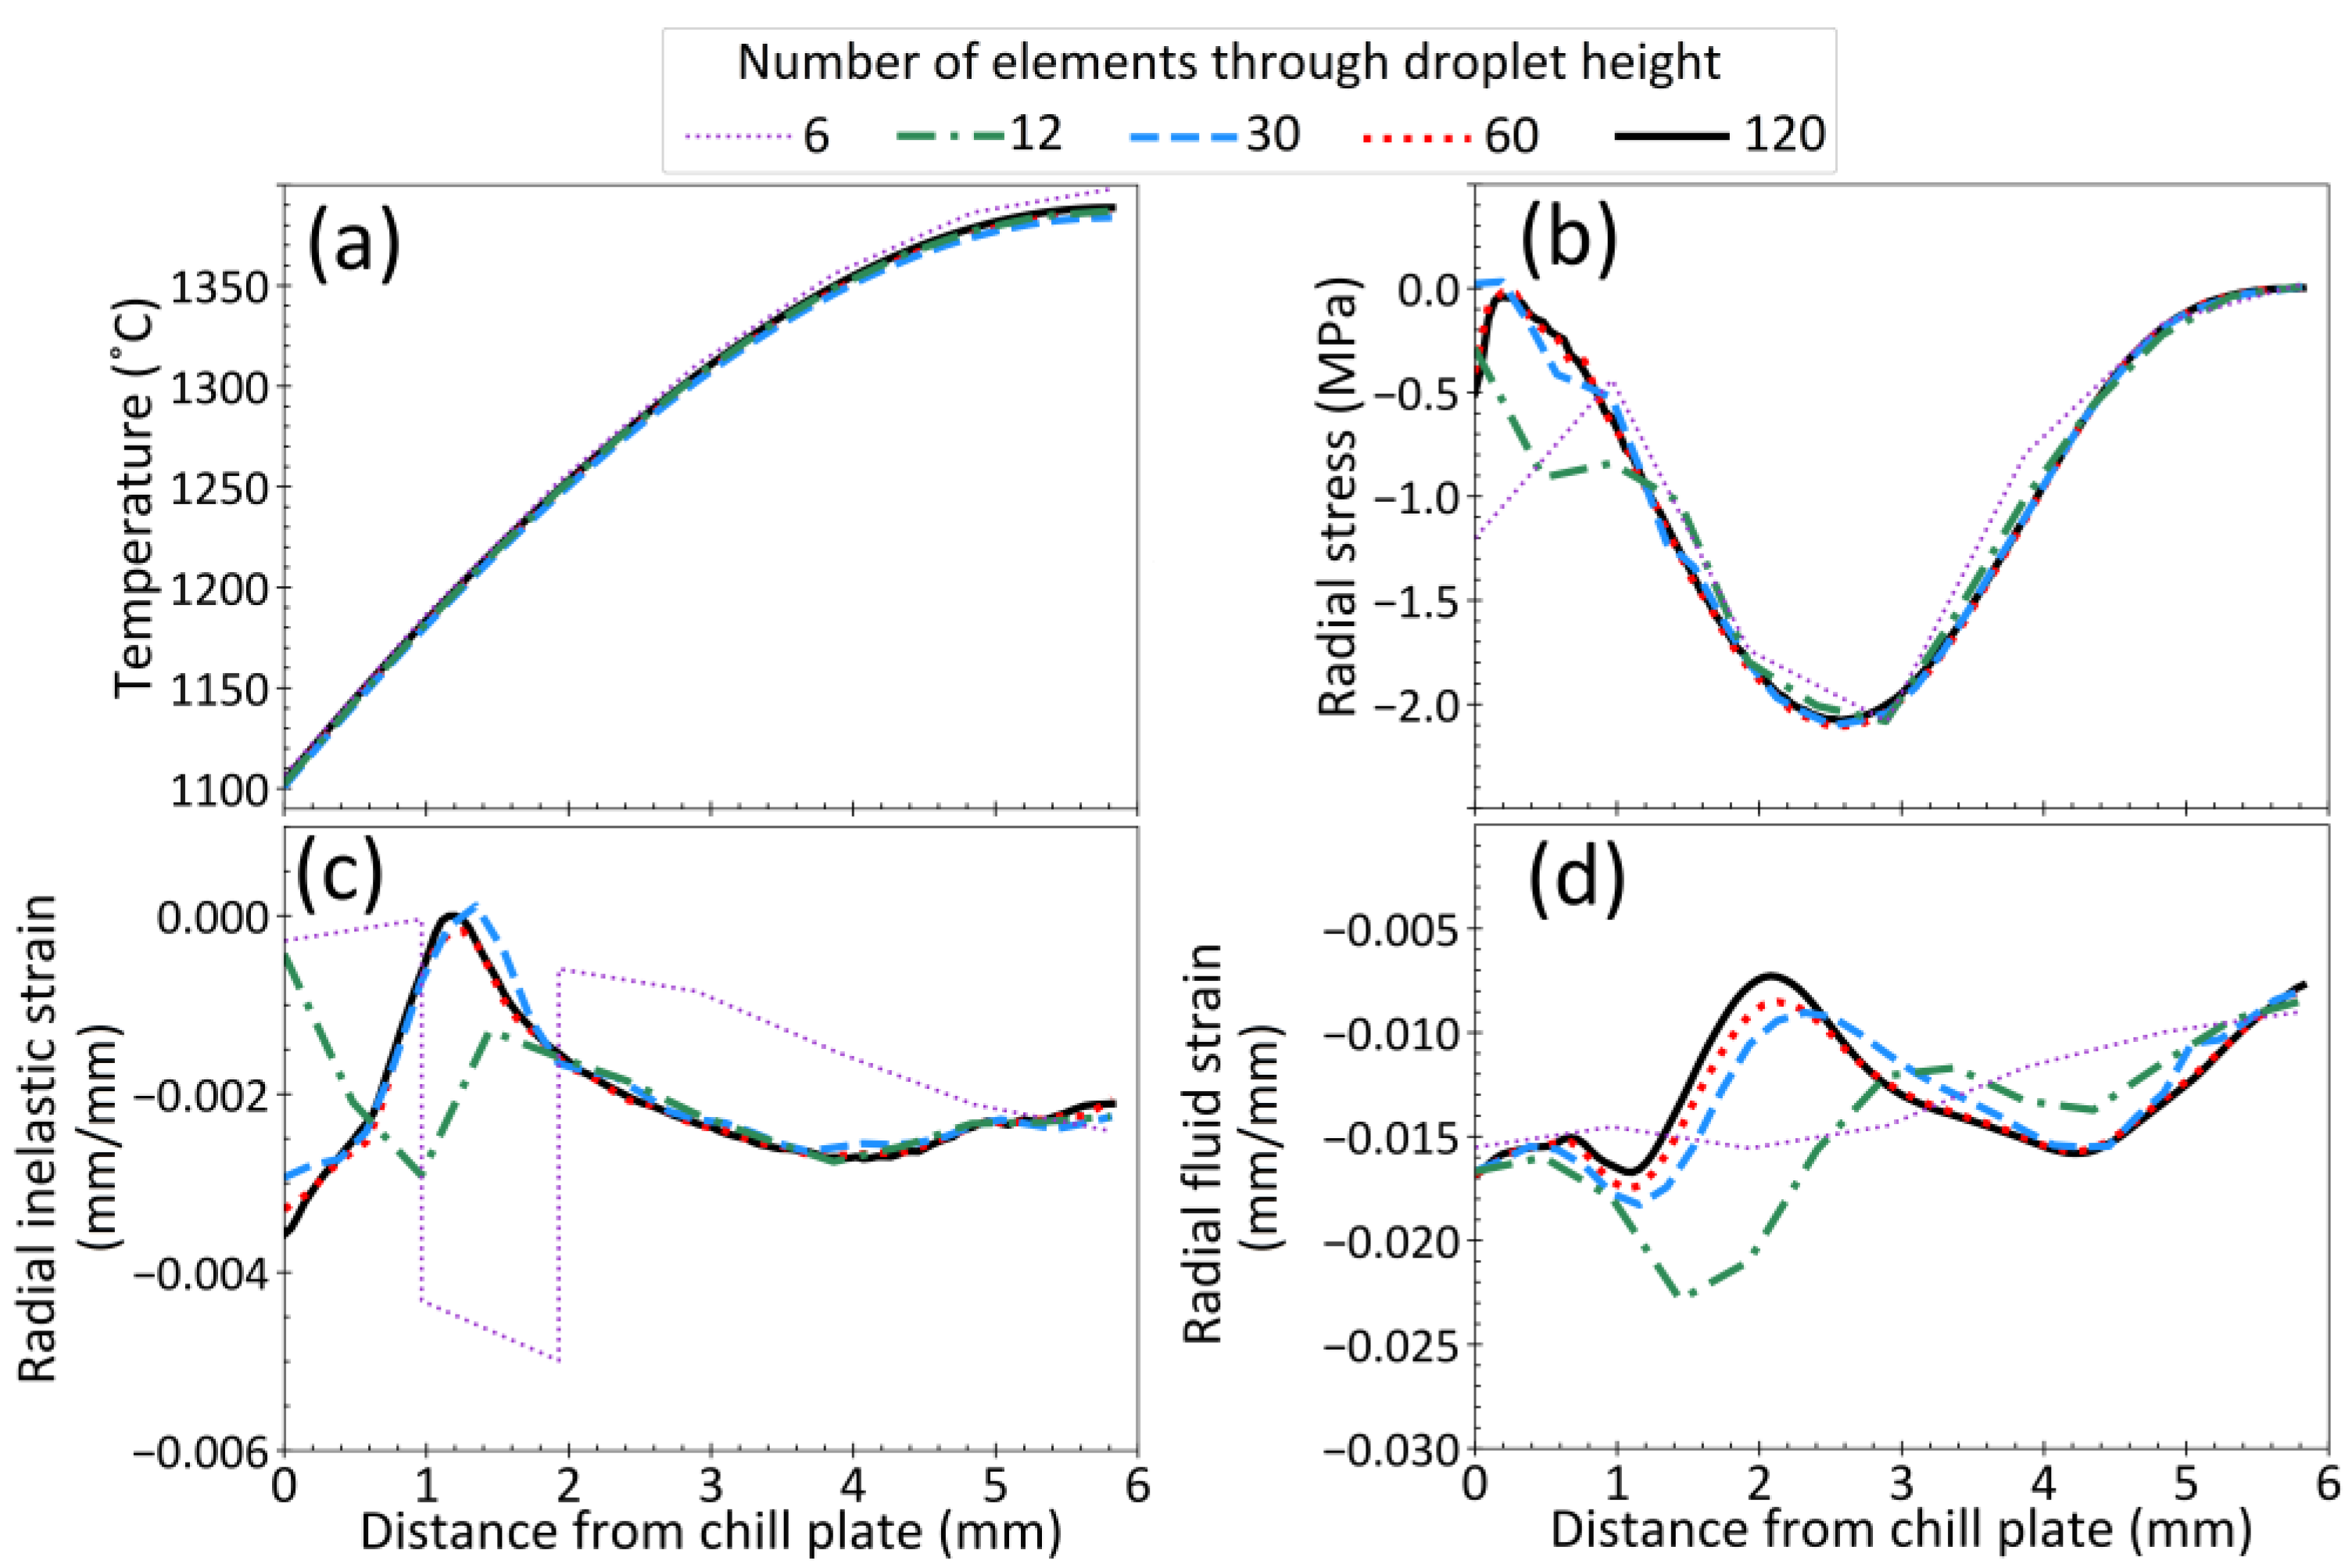
2.6. Mesh Resolution study and Model Verification

The finite element mesh, shown in Figure 1, consists of 50 × 60 elements, with a constant element size of 0.1 mm. This mesh refinement was chosen based on a convergence study conducted for temperature, stress and distortion results for low-carbon steel. In this study, LC steel (0.05%C) with standard heat flux was simulated with different element sizes, (1, 0.5, 0.2, 0.1, and 0.05 mm), keeping the element aspect ratio (in radial r and height z directions) fixed at 1 (square elements). Figure 4 shows results at the centerline symmetry axis for the five different mesh refinement cases after 5 s of solidification with the SHF cooling condition. Although larger elements (1, 0.5, and 0.2 mm) can accurately reproduce the temperature history, shown in Figure 4a, a much more refined mesh is needed to resolve the stress and strain behavior, shown in Figure 4b–d. The inelastic strain results, shown in Figure 4c, are the least accurate, especially near the chill surface. Only meshes with 0.2-mm elements or smaller (60 and 120 elements through droplet height) predict the strain profile accurately. Results for these meshes with 0.1 mm and 0.2 mm elements all match everywhere within 1%. Thus, the 50 × 60 element mesh, with 0.1 mm elements, was chosen for the rest of this work. The model was also verified with the well-known analytical solution for thermal stress during unconstrained plate solidification by Boley and Weiner [59], as documented elsewhere [44].

3. Results

Carbon content and cooling conditions are investigated here as the main factors that influence thermal distortion during steel solidification. The effects of these parameters on temperature distribution, stress distribution and gap formation during solidification of the steel droplet are discussed in the next sections.

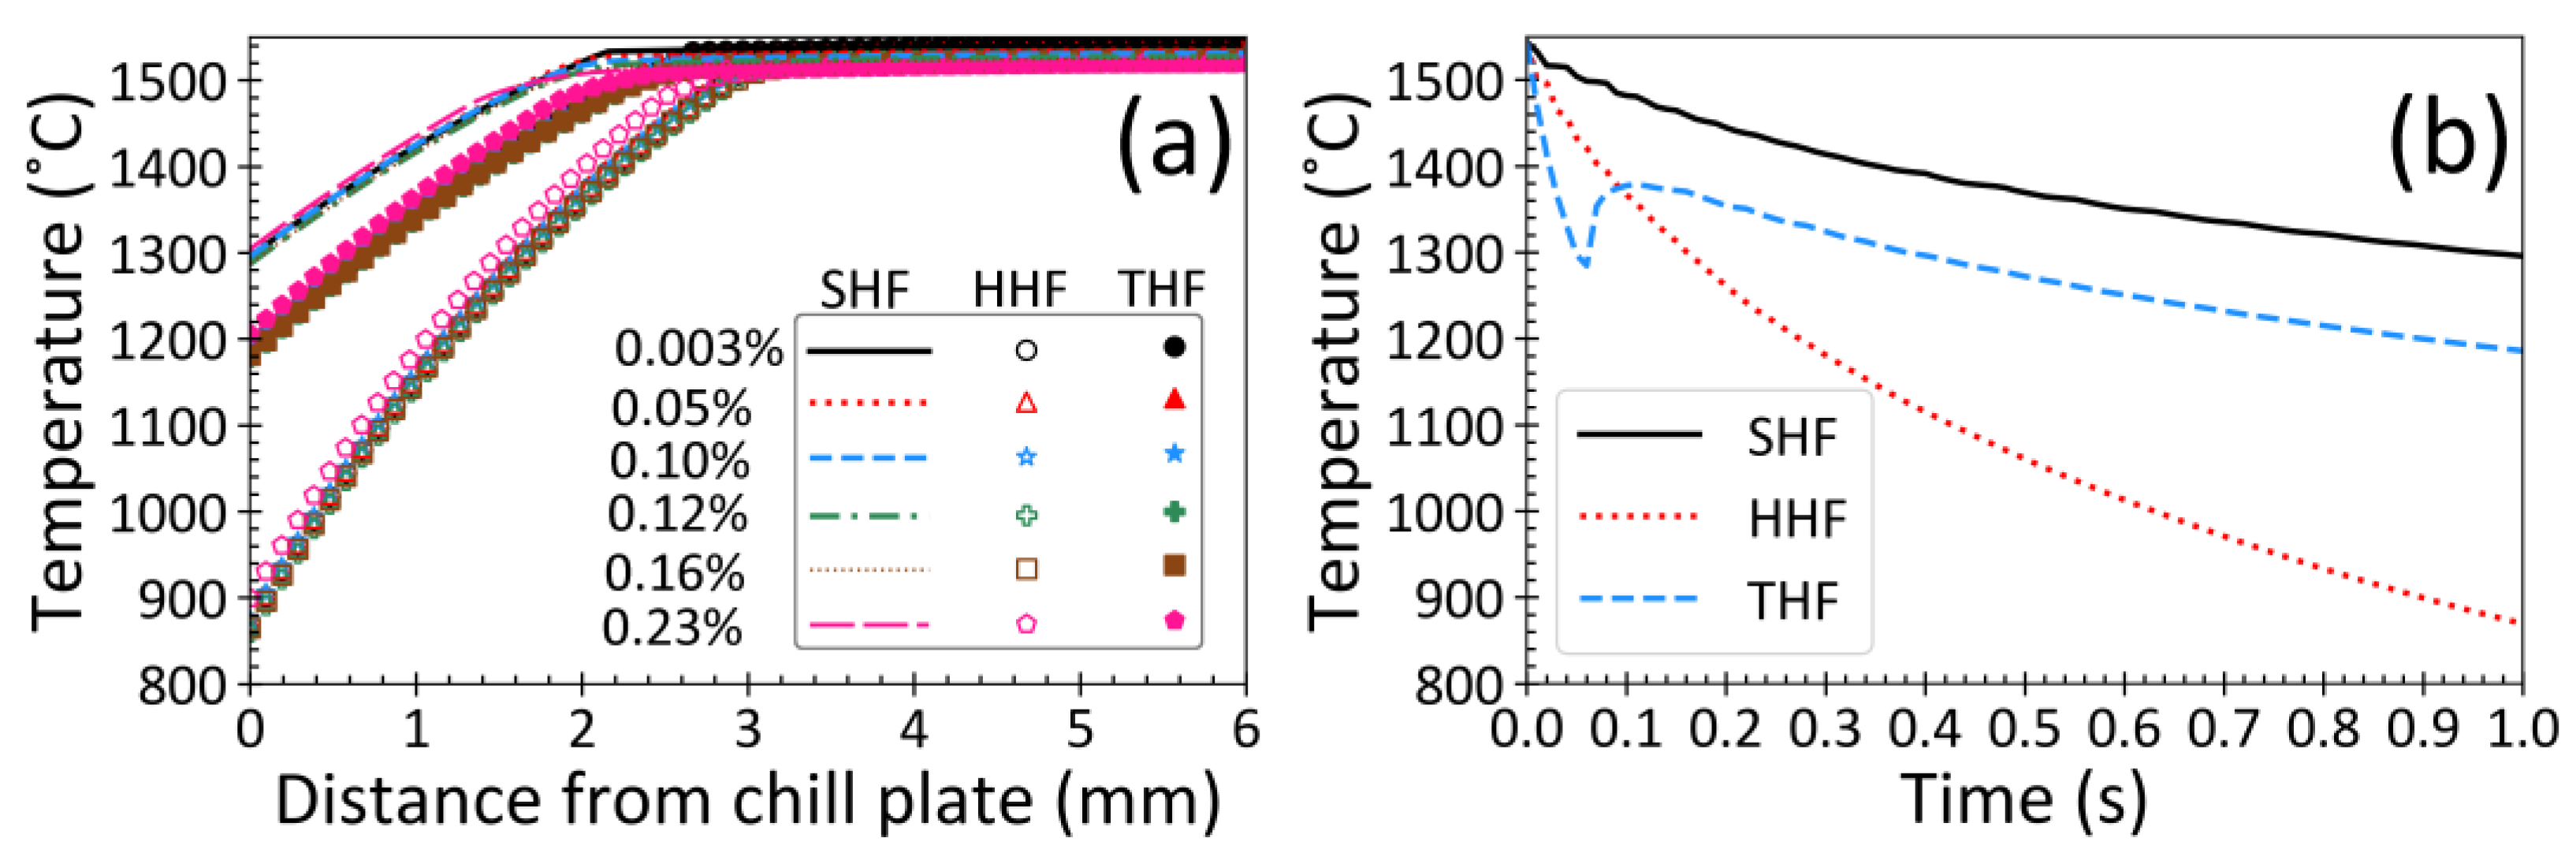
3.1. Temperature Distribution

Figure 5a shows temperature profiles through the droplet height after 1 s of solidification for different carbon contents and heat fluxes. For a given heat flux profile, it can be seen that the temperature profile through the droplet for all the examined cases is almost the same with temperatures within ~15 °C. This demonstrates how steel grade has little direct effect on properties and heat transfer, for the same gap profile. Also, it is evident that the temperature gradient with HHF is much steeper than SHF and THF after the transition to lower heat flux. At very early times ( 0.06 s), the temperature gradient with THF is steeper.
Figure 5b shows temperature evolution of the bottom surface for different heat flux profiles, choosing 0.003%C steel as representative. With SHF and HHF, the surface temperature decreases continuously with time, while with THF, the bottom surface temperature increases by 94 °C after the drop in the heat flux. This reheating of the bottom surface takes place because the heat from inside the droplet is conducted to the surface faster than it can be removed. This demonstrates that such recoalescence behavior can be explained solely by the droplet surface lifting up from the chill plate, and does not require nonequilibrium undercooling during solidification (which is neglected in the current model).
Table 1 presents phase transformation temperatures for the 6 investigated alloys, in addition to the time when the bottom surface reaches the solidus and δ→γ transformation temperatures, the droplet solidification time when the top surface reaches the solidus temperature, and the incubation time (introduced in Section 3.5). It takes 18 s, 8 s and 17 s for the bottom surface to reach 300 °C (final state at end of simulation) for the SHF, HHF and THF cases. With THF, the sudden drop in heat flux which accompanies gap formation results in surface reheating, thermal expansion of the surface layer, and a very large increase in the gap depth for all steel grades.
The average heat transfer coefficient can be extracted from these results, based on the bottom surface temperature in Figure 5b and choosing a chill plate temperature, such as 200 °C. From the instantaneous heat flux, q ˙   = hΔT, the average heat transfer coefficient, h, in the first 1 s is calculated to be 4.4 kW/m2 °C for SHF and 11.4 kW/m2 °C for HHF. With THF, h drops from 16.8 to 4.7 kW/m2 °C after the first 0.06 s, which is very similar to the experimental measurements for pure iron [31].

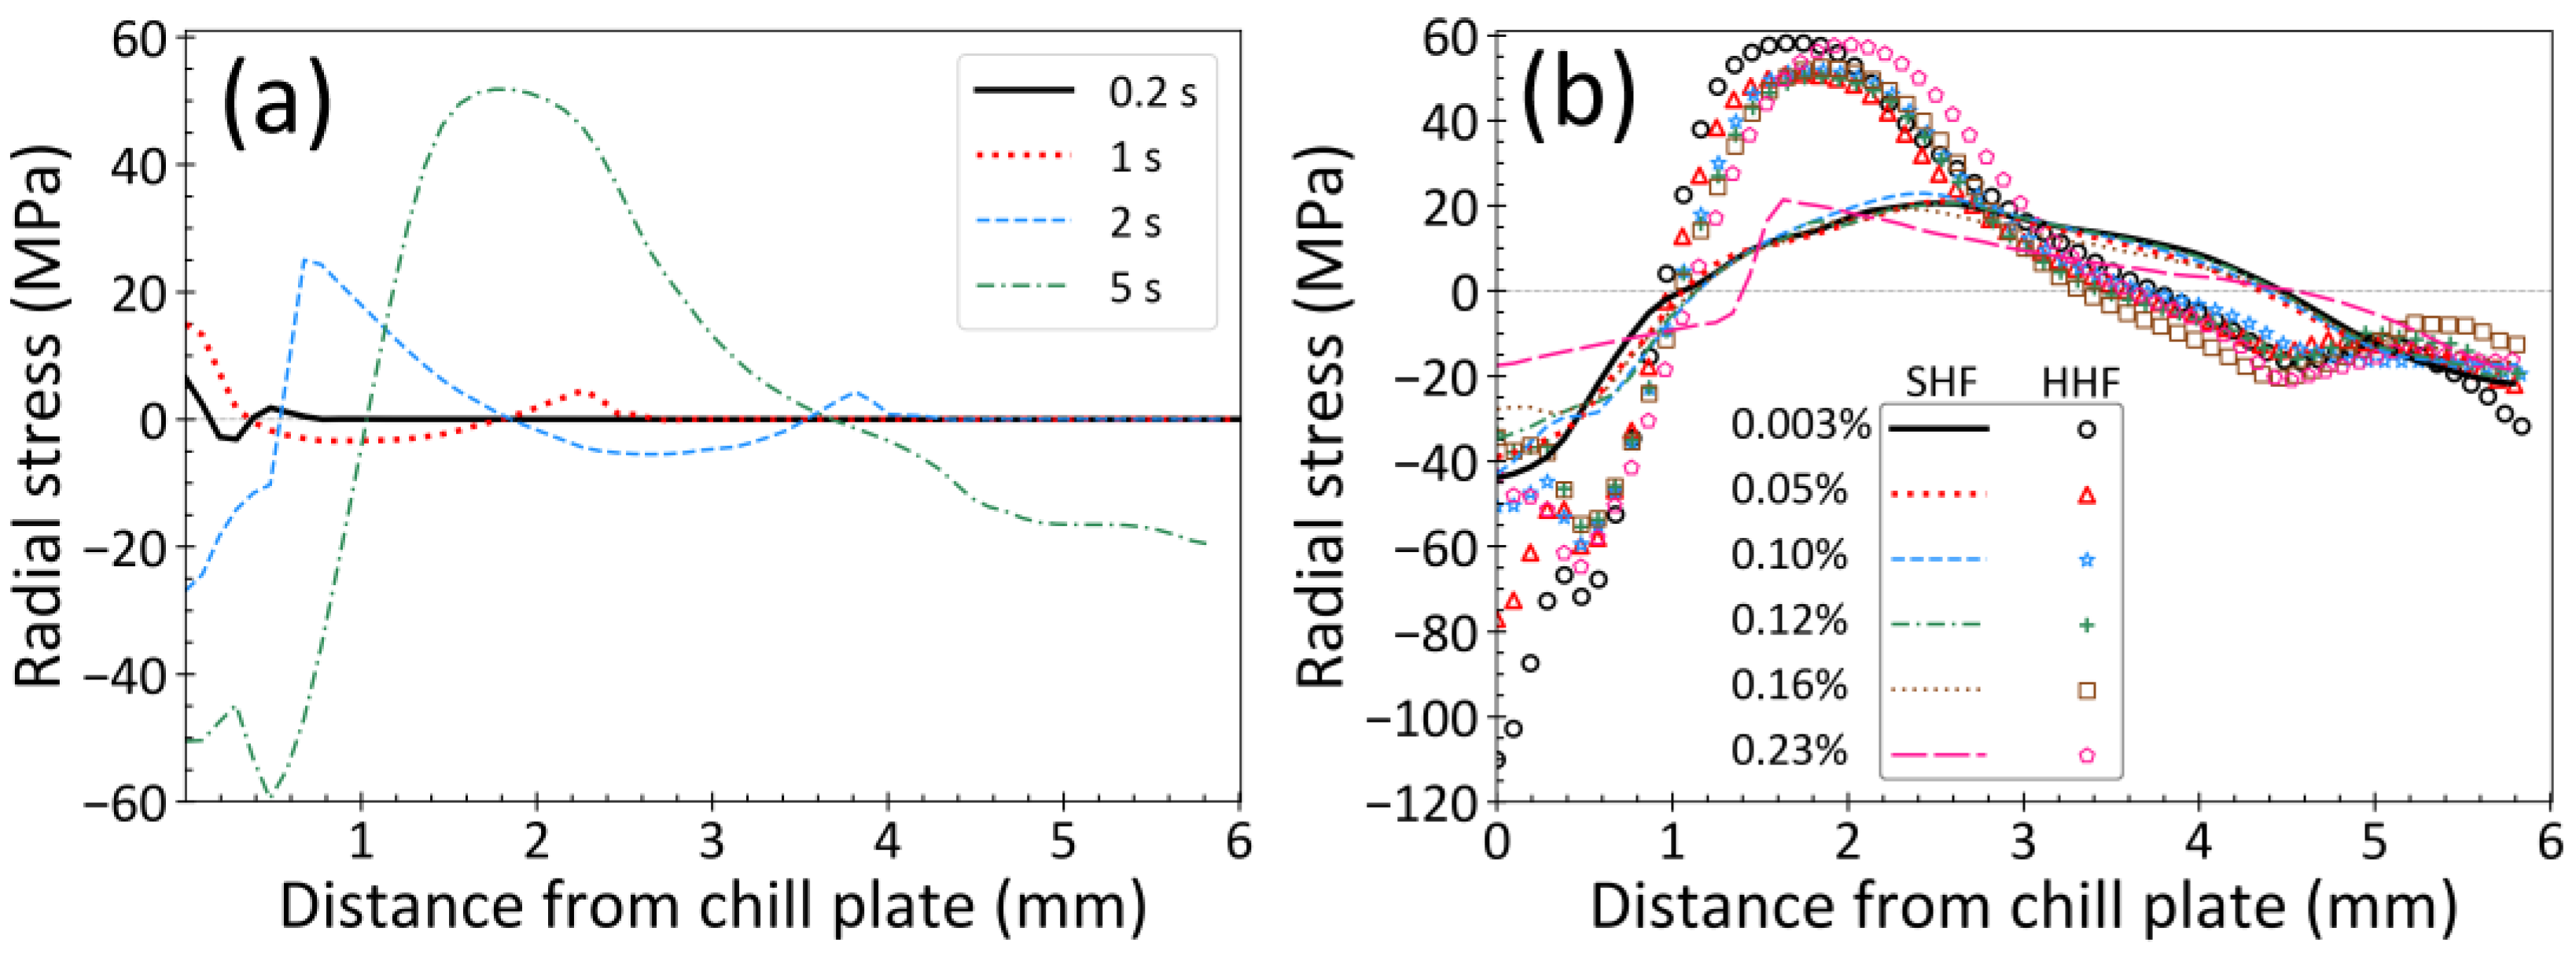
3.2. Stress Distribution

Radial stress profiles through the droplet height at different times are presented in Figure 6a for the 0.10%C steel and HHF cooling conditions. After 1 s of solidification, slight tension is generated along the droplet surface due the cooling shrinkage, and the interior is under slight compression. This may increase the risk of surface crack formation and this issue is more severe in peritectic steels.
With further cooling to 2 s, the stress profile reverses to compression along the bottom surface and tension in the interior. This reversal to the classic solidification stress profile is due to the most recently solidified steel towards the interior cooling and shrinking faster than the surface, as explained in previous work [44]. This stress profile naturally produces thermal distortion and gap formation that exhibits positive curvature of the droplet bottom surface.
At the end of solidification, at ~5 s for HHF, both the top and bottom surface layers are under compression with a balancing tension in the central part of the droplet. The average stress through the cross section must always equal zero, as the droplet exterior is unconstrained. Further cooling increases the stresses, but causes little further thermal distortion and gap depth increase, owing to the tension at the top surface being similar to that at the bottom.
Figure 6b compares the final stress state after the bottom surface temperature reaches 300 °C for the different steel grades for both SHF and HHF conditions (i.e., 18 s for SHF and 8 s for HHF). The HHF case generates the maximum compression at the bottom surface, that is 50% more than that of the SHF case. Furthermore, the maximum tension in the interior with HHF is almost 150% greater than with SHF. These results show that increasing heat flux increases stress gradients in the droplet.

3.3. Strain Distribution

Figure 7 shows the final radial strain distribution through the droplet height at centerline symmetry axis when the bottom surface is 300 °C with SHF cooling condition. With no external load except gravity, the strains are all very small and thermal strain dominates the mechanical behavior. This strain is entirely shrinkage (negative), and increases towards the droplet bottom surface to a maximum of 2.4%. The strain needed to accommodate fluid flow is also very important and reaches almost 1% as liquid is pushed out of and into the domain. Initially, the radial fluid flow is positive, as radial shrinkage from solidification decreases the cross-sectional area of the droplet and squeezes liquid upward. Later, the radial fluid flow becomes negative, as cooling and general shrinkage of the droplet draws liquid back down into the middle of the domain. This fluid flow is responsible for macrosegregation, which is obviously tiny in a droplet with such small strains. The mismatch between thermal strains causes inelastic strains, which although they are tensile, are also small, <0.2%, so cracks, even hot tears, will not happen. The mismatch also causes elastic strains, which are very small, but critical, because they are directly responsible for the stresses. Creep lessens the elastic strains with time, but time is short, which partly explains why inelastic strains are small. Elastic and inelastic strains are also small because the shell can bend to accommodate them, rather than building up strain and stress which occurs in larger castings which have more constraints.

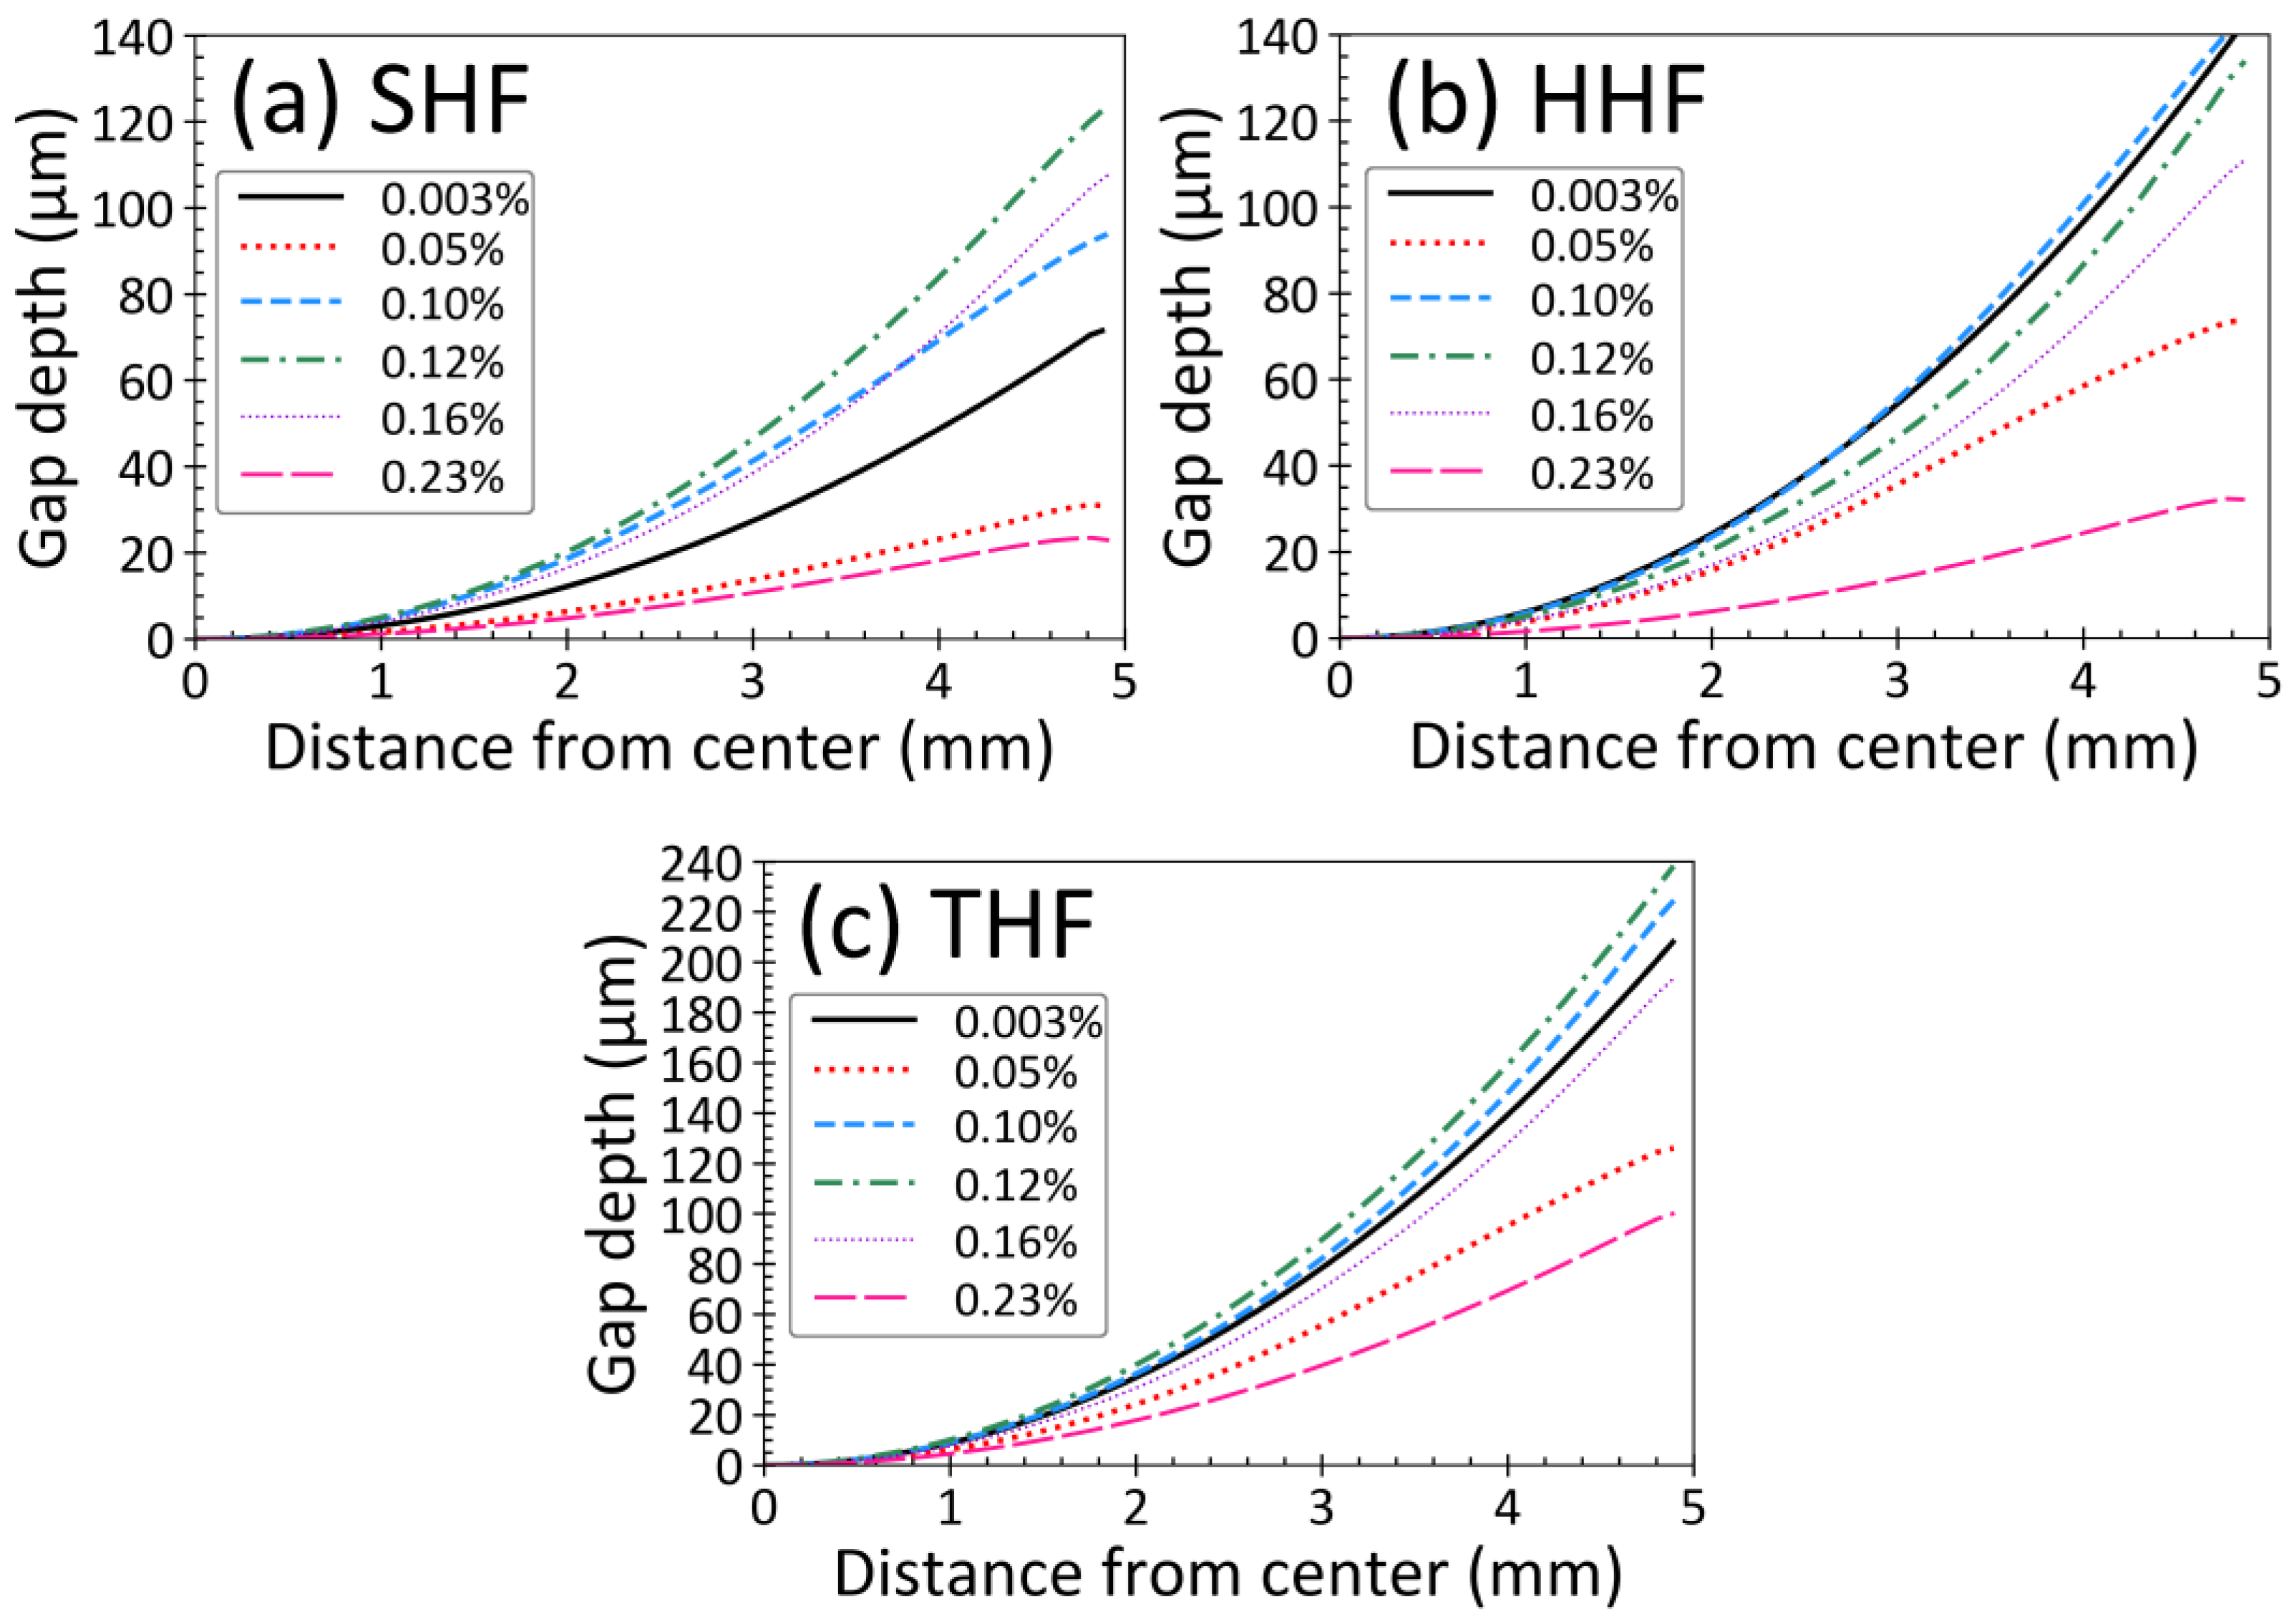
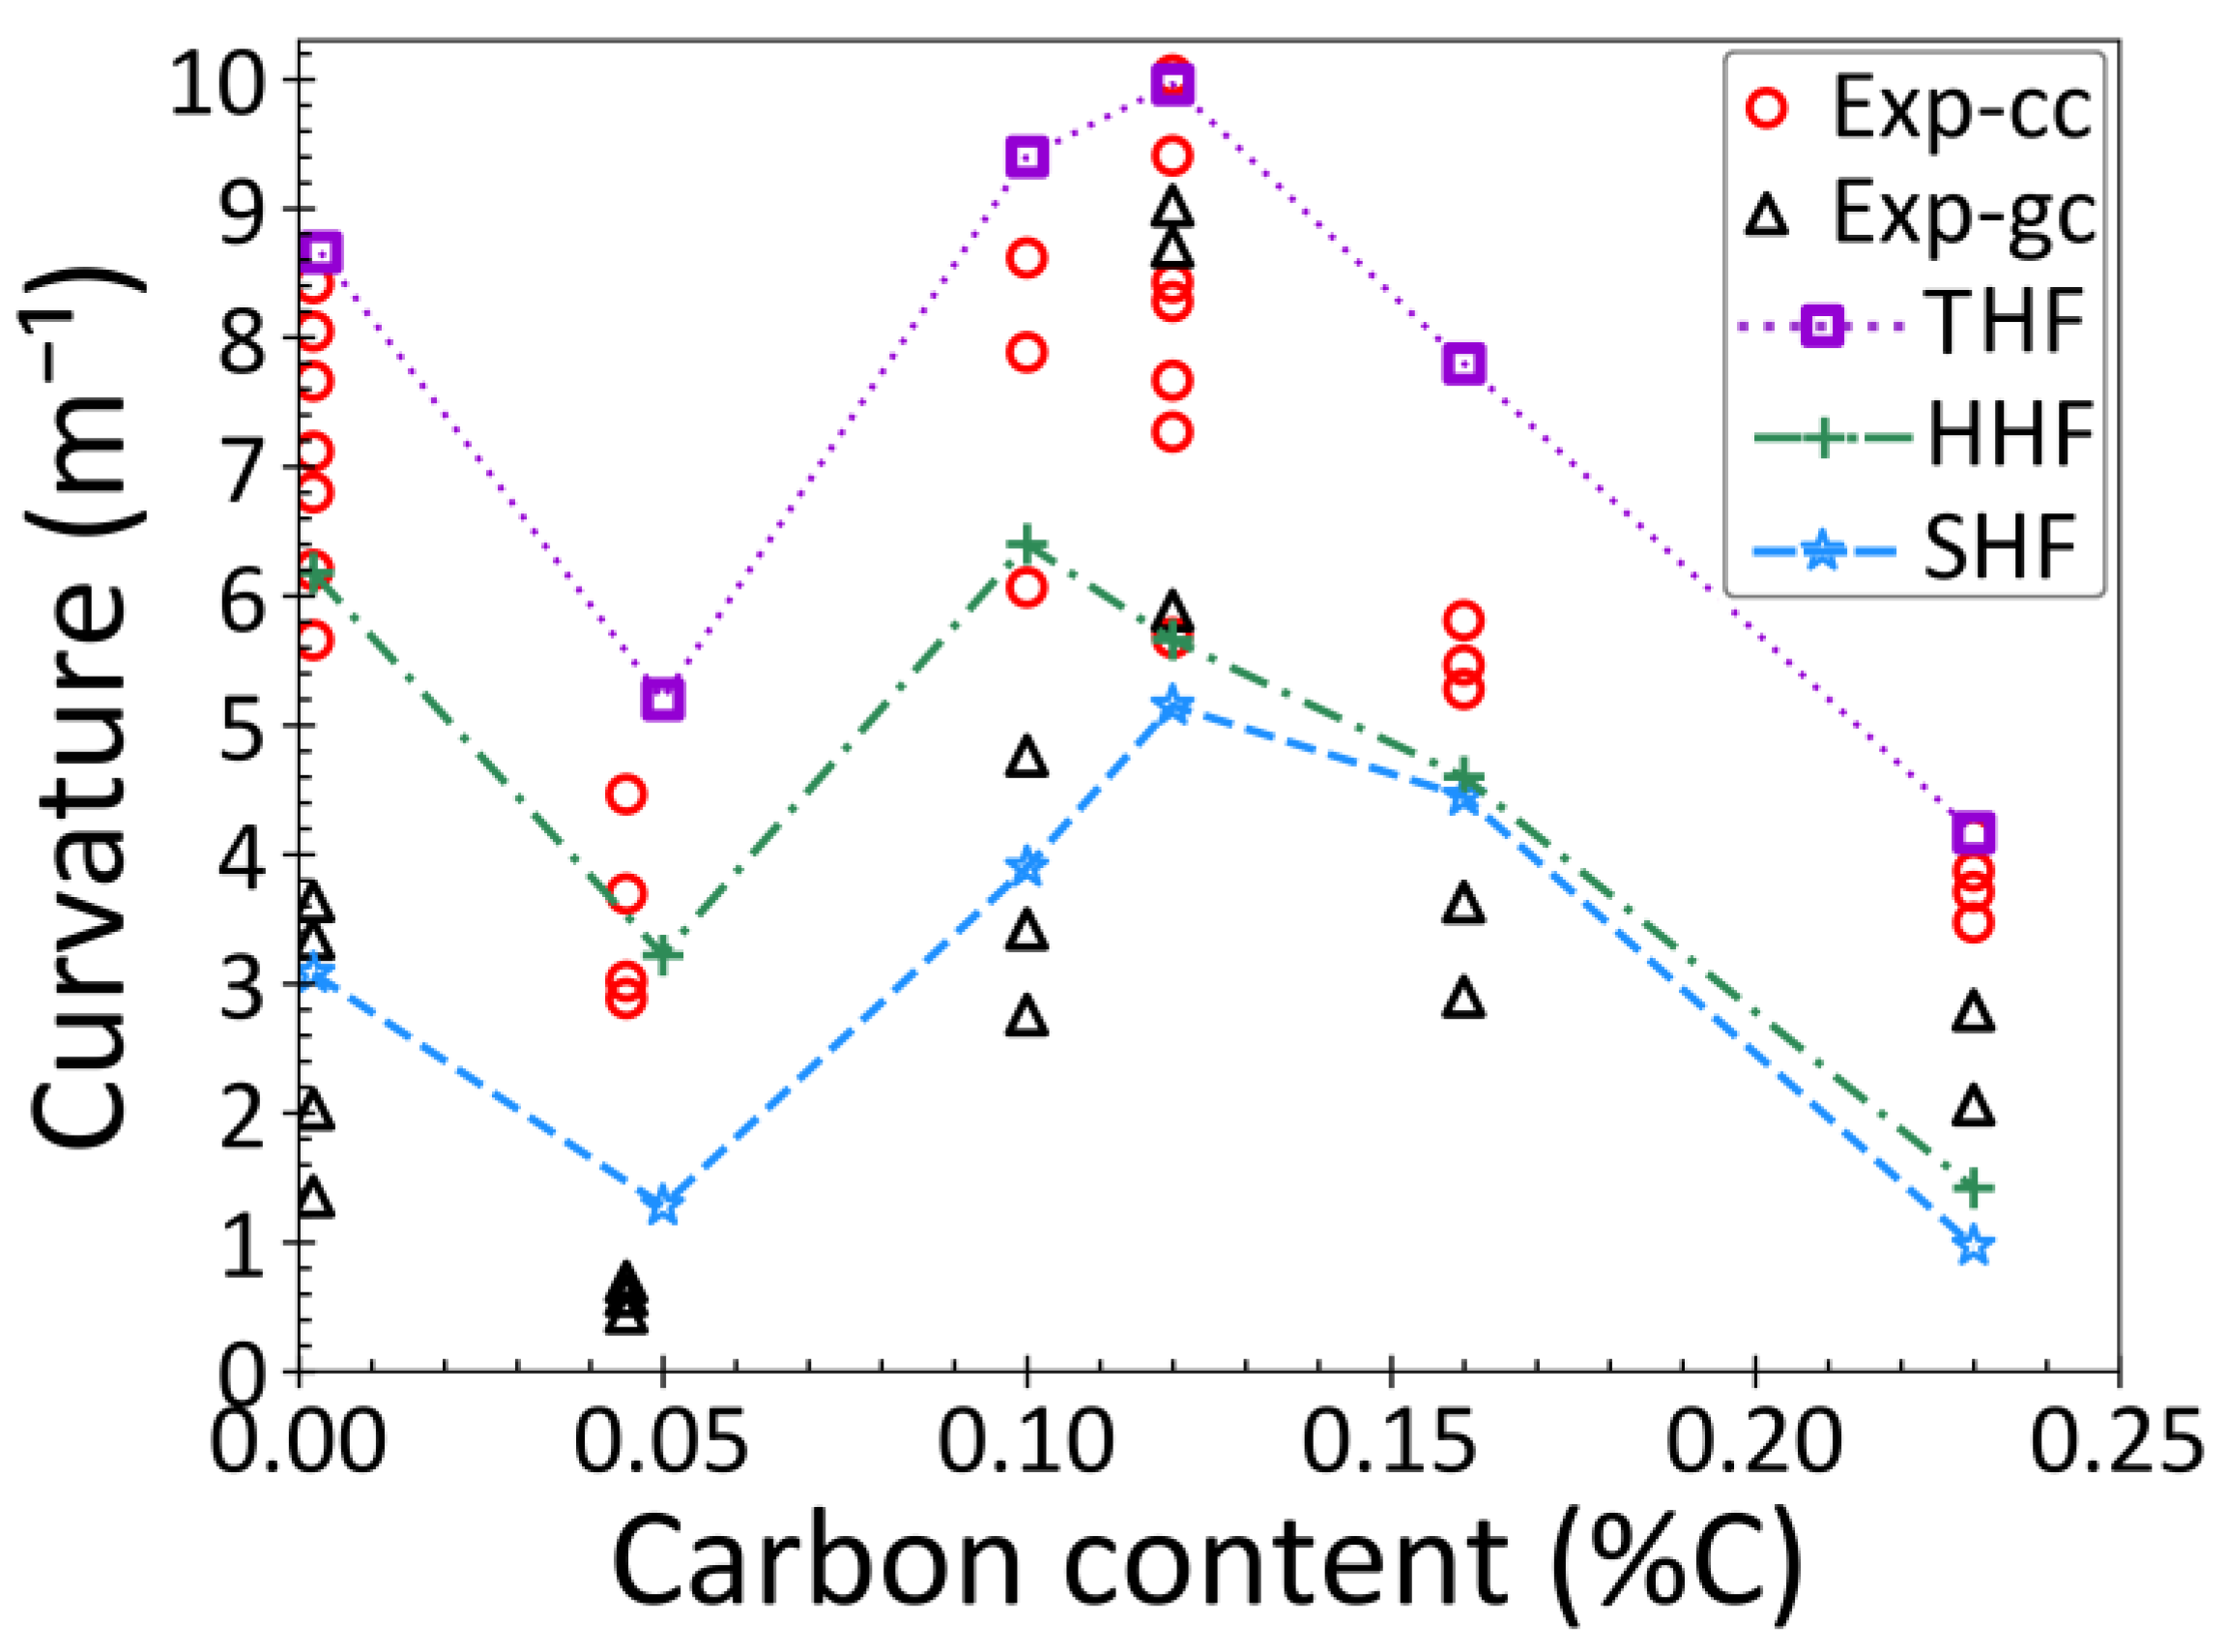
3.4. Thermal Distortion and Model Validation

Figure 8 shows the gap depth profiles of the solidified droplet for the six steels investigated for the three different heat flux conditions. The shape of the bottom surface in all cases is a parabola with different positive curvatures. The gap depth is largest in the peritectic steels, especially those containing 0.10%C and 0.12%C, with 0.16%C almost as deep. The ultra-low carbon steel (0.003%C) also experiences a very deep gap, especially with HHF.
The low-carbon steels (0.05%C) and high-carbon steels, 0.23%C, consistently have shallow gaps. This trend of gap depth change with carbon content agrees with the experimental measurements [11,18].
Figure 9 compares the simulated curvatures of the bottom surface, (Nd in Equation (1) fitted from the results in Figure 8 in this work), with the droplet test measurements on the copper and graphite chill plates [31]. The simulated results with THF, which correspond closely with the experimental heat flux conditions on the copper chill plate (Exp-cc), match very well with the measurements, both qualitatively and quantitatively. In addition, the model predictions at lower cooling rate, SHF, match reasonably well with the experimental measurements on the graphite chill plate (Exp-gc). Of greatest significance, the model accurately captures the complicated trend with steel grade, where thermal distortion of the droplet bottom surface is greatest for peritectic and ultra-low carbon steels.
It should be noted that the experiments were repeated several times for each steel grade, and the measured curvatures exhibit significant variations, most likely due to variability in the heat flux conditions. Nevertheless, the agreement demonstrates that the current computational model captures the phenomena that govern thermal distortion during initial solidification, and that determine the shape of the final surface during steel casting.

3.5. Effect of Heat Flux Condition

Figure 9 contains many results showing the effect of heat flux profile on the thermal distortion results. The gap depths are all significantly higher with THF, where the heat flux drops from 3.2 q ˙ s t a n d a r d to q ˙ s t a n d a r d at t = 0.06 s. This shows that the high initial heat flux has a great effect in generating thermal distortion, even though it lasts for only a very short time. The SHF and HHF cases with constant heat flux generate much lower gap depths, even though the HHF heat fluxes and cooling rates greatly exceed those of THF for all times after 0.06 s. This shows that regardless of steel grade and heat flux, the air gap forms and grows mainly during the very early stage of solidification. Thus, the final gap depth is very sensitive to the initial heat flux, while the later heat flux has little effect.
Figure 10 shows the evolution of the gap depth for the two most depression-sensitive steels, 0.003%C and 0.12%C, with different heat flux conditions. For all cases, the gap develops in three distinct stages. At the start of solidification, the gap depth remains at zero for a time period called “incubation time” in this paper. During this first stage, the steel shell is too weak to support even the small ferrostatic pressure from the liquid above it, so stays flat against the chill plate. The incubation time depends greatly on both steel grade and heat transfer coefficient, as shown in Table 1, and greatly affects the final gap depth. After this incubation time, the shell has strengthened enough to overcome gravity and lift off of the plate. The gap grows very rapidly for a short time during this second stage: “growth”. Finally, there is a long third “steady-state” stage, when the gap remains relatively constant.
By increasing the heat flux from SHF to HHF, Figure 9 shows that the gap depths (and corresponding curvatures) of steels with the lowest carbon contents, 0.003%C, 0.05%C and 0.10%C, increase significantly: by 100%, 140% and 100%, respectively. In contrast, the gap depths increase only slightly (12%, 5%, and 18%) for the other three grades, which have higher carbon content. Thus, there appears to be a general decrease in sensitivity to the higher heat flux with increasing C content, causing the jump in gap depth to decrease with increasing C content.
The higher sensitivity to heat flux in steels with carbon content less than 0.1%C stems from the different phase transformation sequence in these steels, compared with higher carbon steels. As can be seen in Figure 2a–c steels with 0.1%C solidify completely as δ-ferrite before transforming to austenite. In these steels, by increasing heat flux from SHF to HHF, the δ-ferrite becomes thick enough to overcome ferrostatic pressure sooner, which in turn decreases the incubation time and increases the gap depth considerably. On the other hand, in steels with higher carbon content, the liquid partly transforms to δ-ferrite and then the remaining liquid solidifies as δ-ferrite and austenite via the peritectic reaction. The incubation time always occurs after the start of the δ→γ phase transformation, as shown in Table 1, except for 0.003%C steel, where this transformation is delayed. Increasing heat flux from SHF to HHF causes this transformation to occur sooner, as observed in Figure 10 for 0.12%C steel. With THF, the incubation time occurs even sooner after the δ-γ transformation starts, especially for peritectic or partly-peritectic steels.
Further increasing the initial heat flux from HHF to THF causes the final gap depth to increase by about 100% for all grades. This is due to the large decrease in incubation time in all cases, caused by the high initial heat flux of THF.

3.6. Effect of Steel Composition

Depression sensitivity varies greatly with steel grade, as indicated by the final surface shape (curvature), shown in Figure 9. Figure 10 shows that, for the ultra-low carbon steel (0.003%C) with SHF, the incubation time is relatively long, 0.4 s, at which time the gap depth increases to 38 μm over 0.1 s. This long incubation time is due to the weakness of the pure delta-ferrite initial shell, which is also very hot and thin due to the low heat flux, so it cannot overcome gravity during this long initial stage of solidification. The gap only starts to grow when austenite starts to form, after the surface has cooled to just below 1390 °C. With HHF, the solidified δ layer thickness increases faster, enabling the shell surface to cool and gain strength sooner, so the incubation time is only 0.05 s. This leads to an initial gap depth of 90 μm, which is more than twice as deep as with SHF. Further increasing the initial heat flux from HHF to THF further decreases the incubation time to only 0.01 s, which doubles the initial gap depth again. This steel has a very short solidification temperature range compared with all other steels. Thus, this steel can solidify more solid, for the same heat transfer and time, which enables the solid shell to become thicker and stronger, even though it is composed of soft delta-ferrite. Thus, this steel has the second highest gap depths and sensitivity to surface depressions of all steel grades investigated.
For 0.12%C steel with SHF, the incubation time is only 0.26 s and the gap quickly grows to an initial depth of 81μm. This incubation time is shorter than that for ultra-low carbon and is due to the formation of the strong austenite phase very quickly after the start of solidification. For this steel, δ-ferrite is only stable for a 20 °C range, and quickly transforms to austenite via the peritectic reaction and subsequent peritectic transformation. Austenite is almost one order of magnitude stronger than δ-ferrite at the same temperature [60]. Thus, the solidified layer of 0.12%C steel quickly transforms to austenite, is strong enough to overcome ferrostatic pressure, and forms a gap very soon after the start of solidification. With HHF conditions, the incubation time is only 0.07 s for steel with 0.12%C steel. After this incubation time, the gap depth suddenly increases to 91μm. Increasing heat flux from SHF to HHF has little effect on gap depth because the incubation time to strong austenite formation is short in both cases. Further increasing initial heat flux to THF conditions, the incubation time decreases to only 0.03 s and the gap depth increases to the largest final depth of 190 μm. As mentioned earlier, surface depressions during steel solidification are attributed to the shrinkage associated with the solid-state δ→γ phase transformation. In 0.12%C steel this transformation coincides with a sudden drop in TLE (from 0.008 to 0.006) at 1490 °C (see Figure 3). Because the new phase is the strong γ-phase (almost 10 times stronger than δ-ferrite), the transformed austenite layer can overcome ferrostatic pressure even when it is very thin, (after only 0.03 s), which aggravates the sudden TLE drop and deepens the gap. As a result, this peritectic steel experiences the most severe gaps and sensitivity to surface depressions.
Figure 11 shows the evolution of the gap depth for all six investigated steels with THF, which has the highest initial heat flux. The peritectic steel, (0.12%C) transforms to austenite the fastest, so has the largest drop in TLE immediately below the solidus temperature, very short incubation time (0.03 s), and consequently exhibits the deepest gap. For low-carbon (0.05%C), and high-carbon (0.23%C) steels, there is a greater temperature from the solidus to the start of transformation to austenite (see Figure 3d and Table 1). This delay in the shrinkage (TLE drop), causes the shells of these steels to remain weak for a longer incubation time (0.06 s). The longer incubation time causes smaller temperature gradients across the thin initial shell, leading to the smallest final gaps, and the least propensity towards surface depressions. The partly-peritectic steels (0.10%C and 0.16 %C) quickly transform to austenite, so have incubation times of only ~0.04 s, and thus these steels develop gaps almost as deep as the fully-peritectic steel of 0.12%C steel.
These results show that the gap increases when the δ→γ transformation occurs sooner, (closer to the solidus temperature) and experiences the associated large drop in TLE when the shell is thinner. Ultra-low carbon steel has the shortest incubation time of 0.01 s and its gap depth is close to that of 0.12%C steel.
It should be noted that with THF, for all grades, heat flux drops at 0.06 s and the gap depth forms at either this time or earlier, (see incubation times in Table 1). With HHF conditions, heat flux is constant throughout solidification and cooling, but the gap still forms at roughly this time. With HHF, the droplet solidifies much sooner than with THF, but the gap depth is deeper with THF. These results confirm that the gap depth is controlled by heat flux during the very early stage of solidification, and usually starts soon after the start of the δ→γ phase transformation. Shorter incubation times produce deeper gaps. After that, changes in gap depth are very small, regardless of the heat flux.

3.7. Effect of Droplet Size/Shape and Discussion

Finally, the effect of droplet size and shape was investigated for three different simulation domains. Figure 1 shows the 2D cylindrical simulation domain of 5 mm width and 6 mm height, used in this study to approximate the droplet shape. To investigate the importance of this approximation on the shape evolution, two more domains were simulated. Domain 2 has height decreased by half to 3 mm (same 5 mm width) and Domain 3 has width decreased by half to 2.5 mm width (same 6 mm height).
The final shape of the bottom surface and the incubation times are shown in Figure 12 for these three domains with Fe-0.10% C steel with different cooling conditions. The bottom surface profiles differ by less than 10% for a given cooling condition. Domain 2 has the largest bottom curvature, due to the smaller head of liquid metal causing less ferrostatic pressure from gravity to restrain the shrinkage. Domain 3 has the smallest curvature. Figure 12b shows that the incubation times are the same for all domains with HHF and THF conditions and differ by only ~10% with SHF.
These results show that the size and shape of the droplet and its simulation domain have only a minor effect on the findings presented in this work. This confirms that the cylindrical approximation of the droplet shape is reasonable. The good agreement of the current model (see Figure 9) also shows that other phenomena/parameters neglected in the model, such as the contact angle between the liquid droplet and the chill surface, surface tension, and fluid flow inside the droplet, are all negligible. The only influence of these phenomena on the droplet thermal distortion mechanism is their tiny effect on the ferrostatic pressure acting on the initial solidifying shell, which can be neglected.
Furthermore, the success of the current model, with its simple treatment of the mold wall and heat transfer coefficients adopted from other research, suggests that initial solidification behavior may be generalized to other processes. Thus, these results suggest that the behaviors presented and explained in this work regarding the depths, trends and mechanisms of the formation of surface depressions during initial solidification should be similar in real commercial steel-casting processes, such as the continuous casting of steel.

4. Conclusions

The effects of steel carbon content and heat flux on the distortion of a steel droplet during solidification were investigated using a thermo-elasto-viscoplastic finite element model. Following the droplet test [31] as a benchmark experiment, the same chemical composition, geometry, and heat flux conditions were simulated to validate the model predictions of curvature of the bottom surface of the droplet with the measurements. The main findings are:
  • The thermo-mechanical model captures the phenomena which govern gap formation during the initial stages of steel droplet solidification both qualitatively and quantitatively.
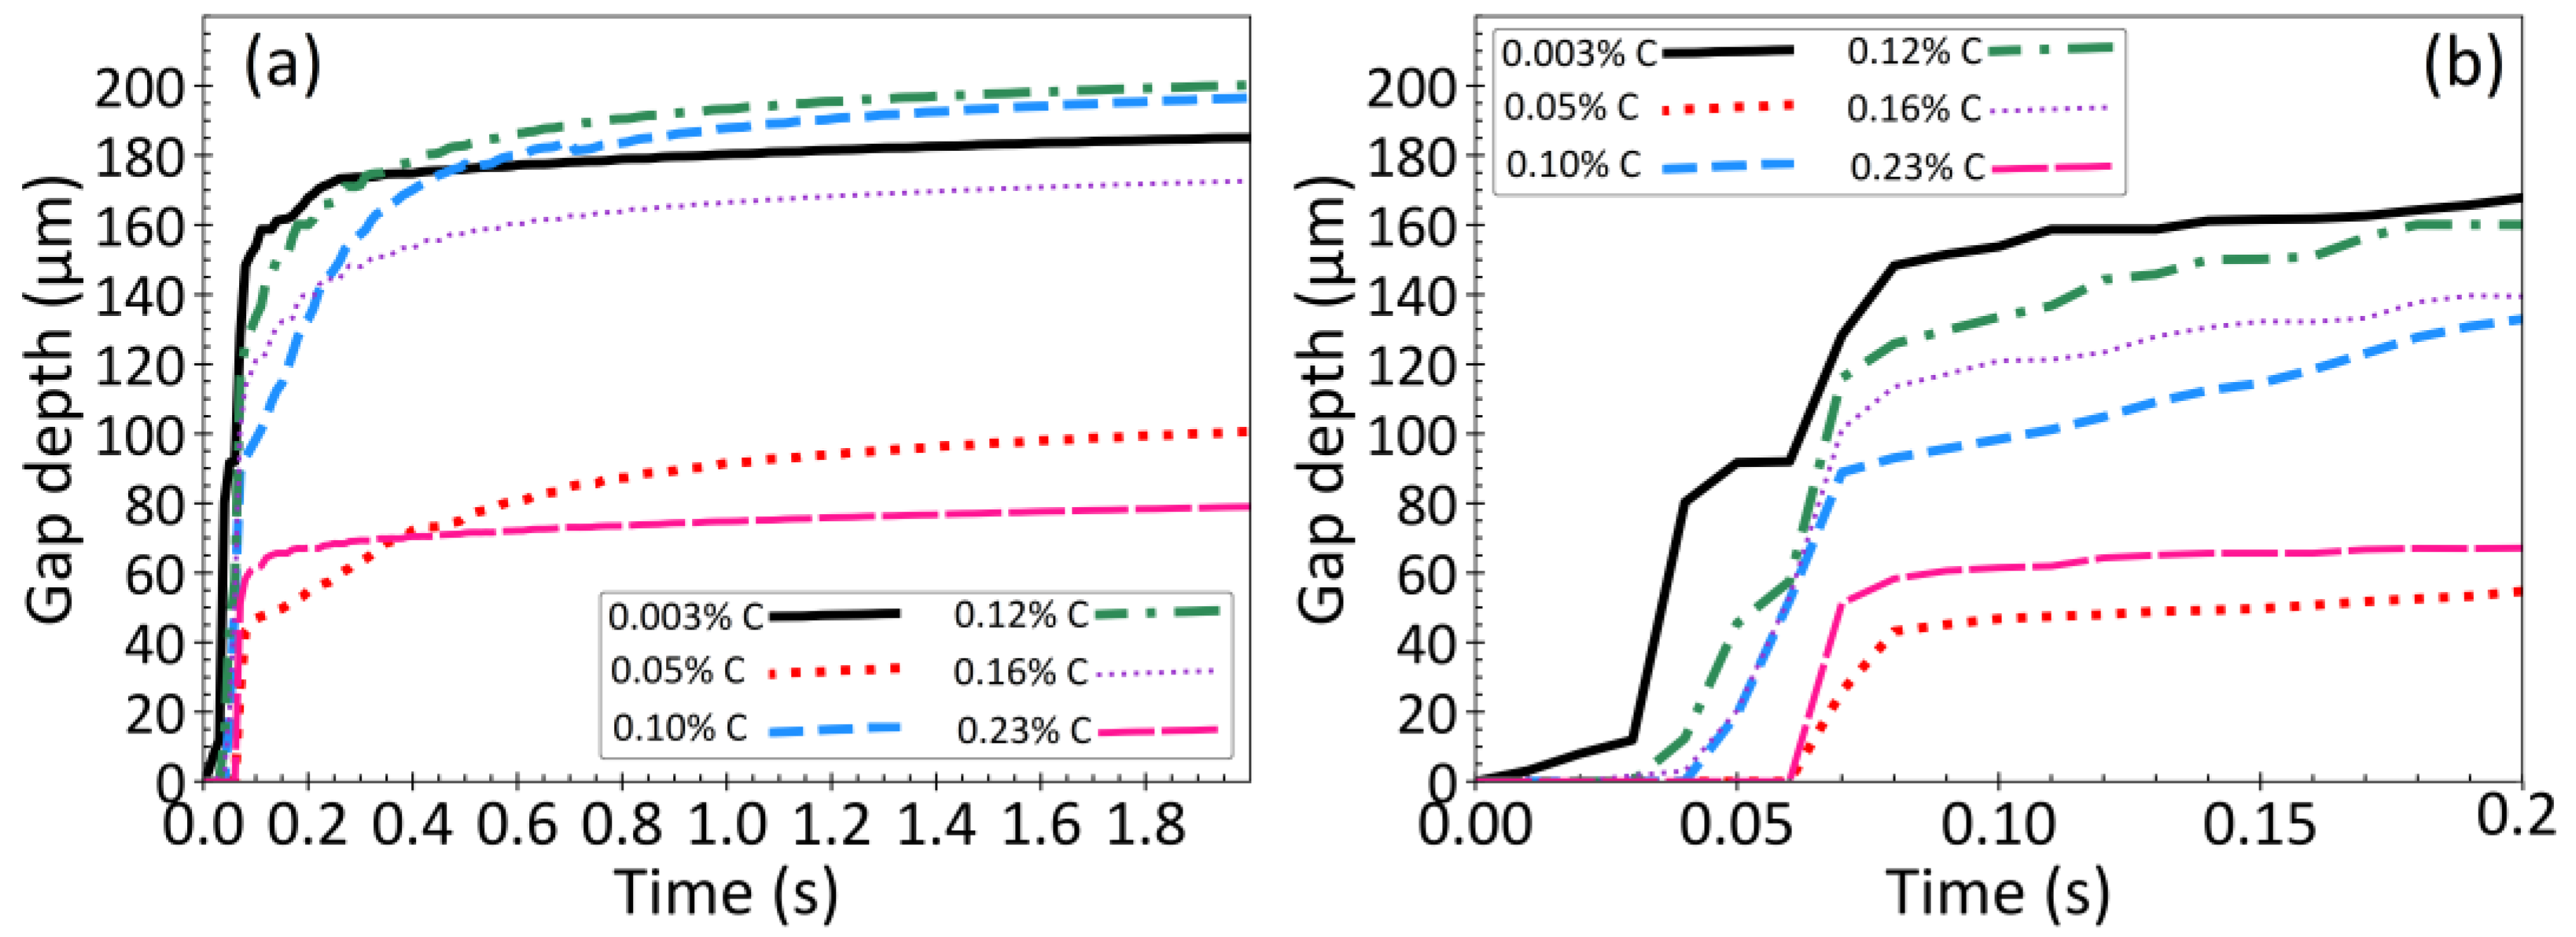
  • Carbon content is the main factor that controls thermal distortion and bottom surface shape during steel solidification. The highest distortion, as indicated by the curvature of bottom surface of the droplet, is found in ultra-low carbon and peritectic steel grades.
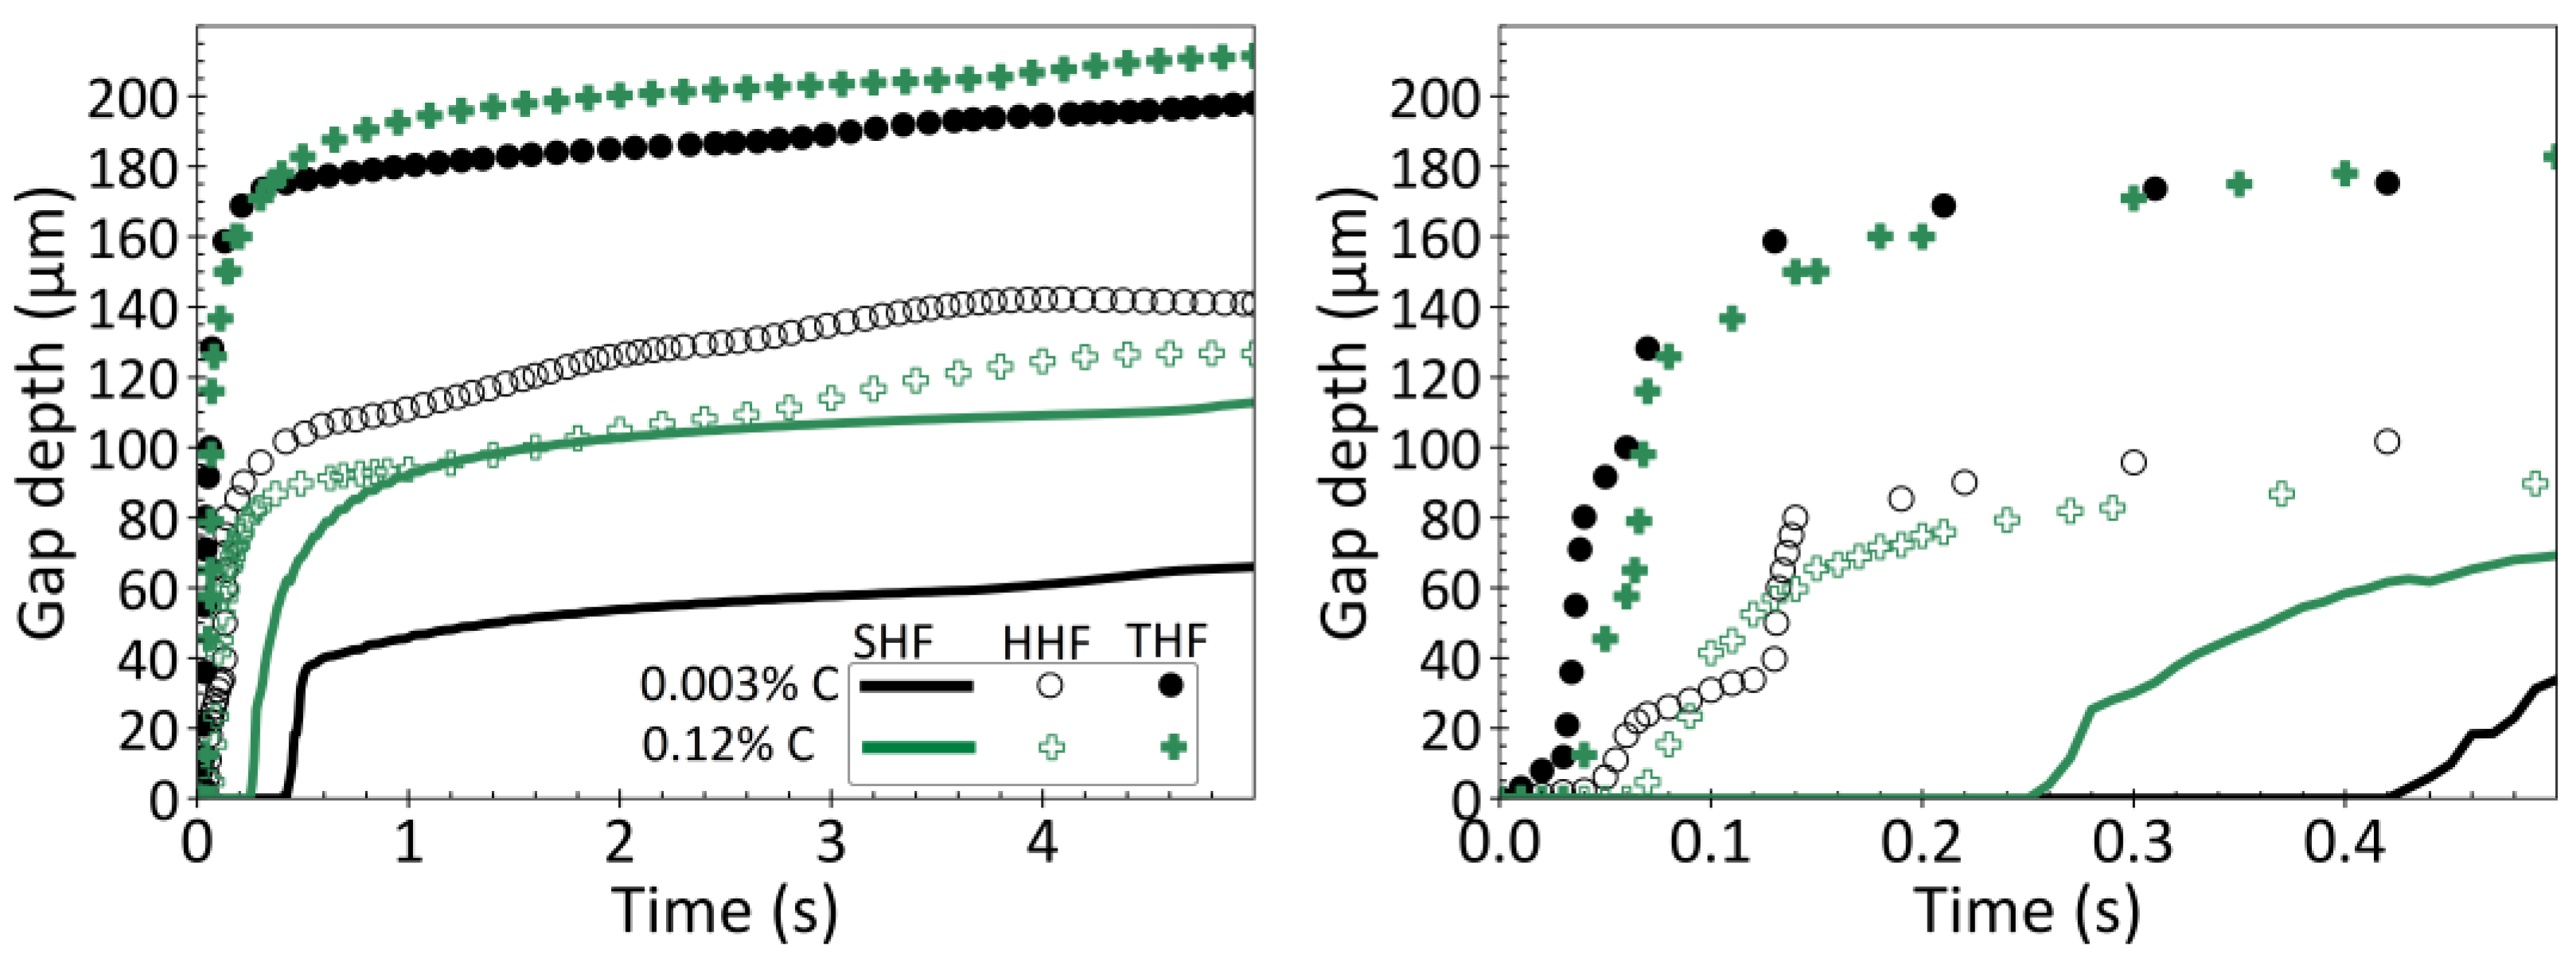
  • Heat flux also plays an important role in controlling thermal distortion during solidification. Increasing heat flux during the initial stages of solidification causes the gap depth (curvature of solidified droplet surface) to increase. This effect is most evident in ultralow carbon steels, and decreases with increasing carbon content, if the heat flux does not suddenly change.
  • A sudden drop in heat flux typically accompanies gap formation, and is called the incubation time. This causes surface reheating, thermal expansion of the surface layer, and a very large increase in the gap depth, for all steel grades.
  • Shorter incubation times lead to deeper gaps, owing to the higher temperature gradient across the thinner shell when the thermal distortion occurs.
  • For every steel grade and heat flux condition investigated, the gap forms very early during solidification, within 0.06 s for fast cooling and within 0.4 s for slow cooling, and remains relatively constant after that. The heat flux rate at later times, after the first 1 s, has little effect on the final thermally-distorted shape.
  • The incubation time for gap formation is usually near or after the start of the δ→γ phase transformation, which is controlled by the steel grade and initial heat flux. Thus, the gap forms sooner with faster initial cooling rates, and in peritectic steels.
  • The gap depth is greatly affected by the δ→γ phase transformation. In peritectic steel grades, this transformation occurs very soon after a thin solid shell has formed, which leads to deep gaps, implying deep surface depressions in cast products.
  • Increasing the cooling rate and temperature gradient during initial solidification increases the severity of δ→γ phase transformation, and results in a deeper gap.
  • The findings of this fundamental model and gap formation mechanism have important implications for the formation of surface depressions and related defects in commercial steel continuous casting processes.
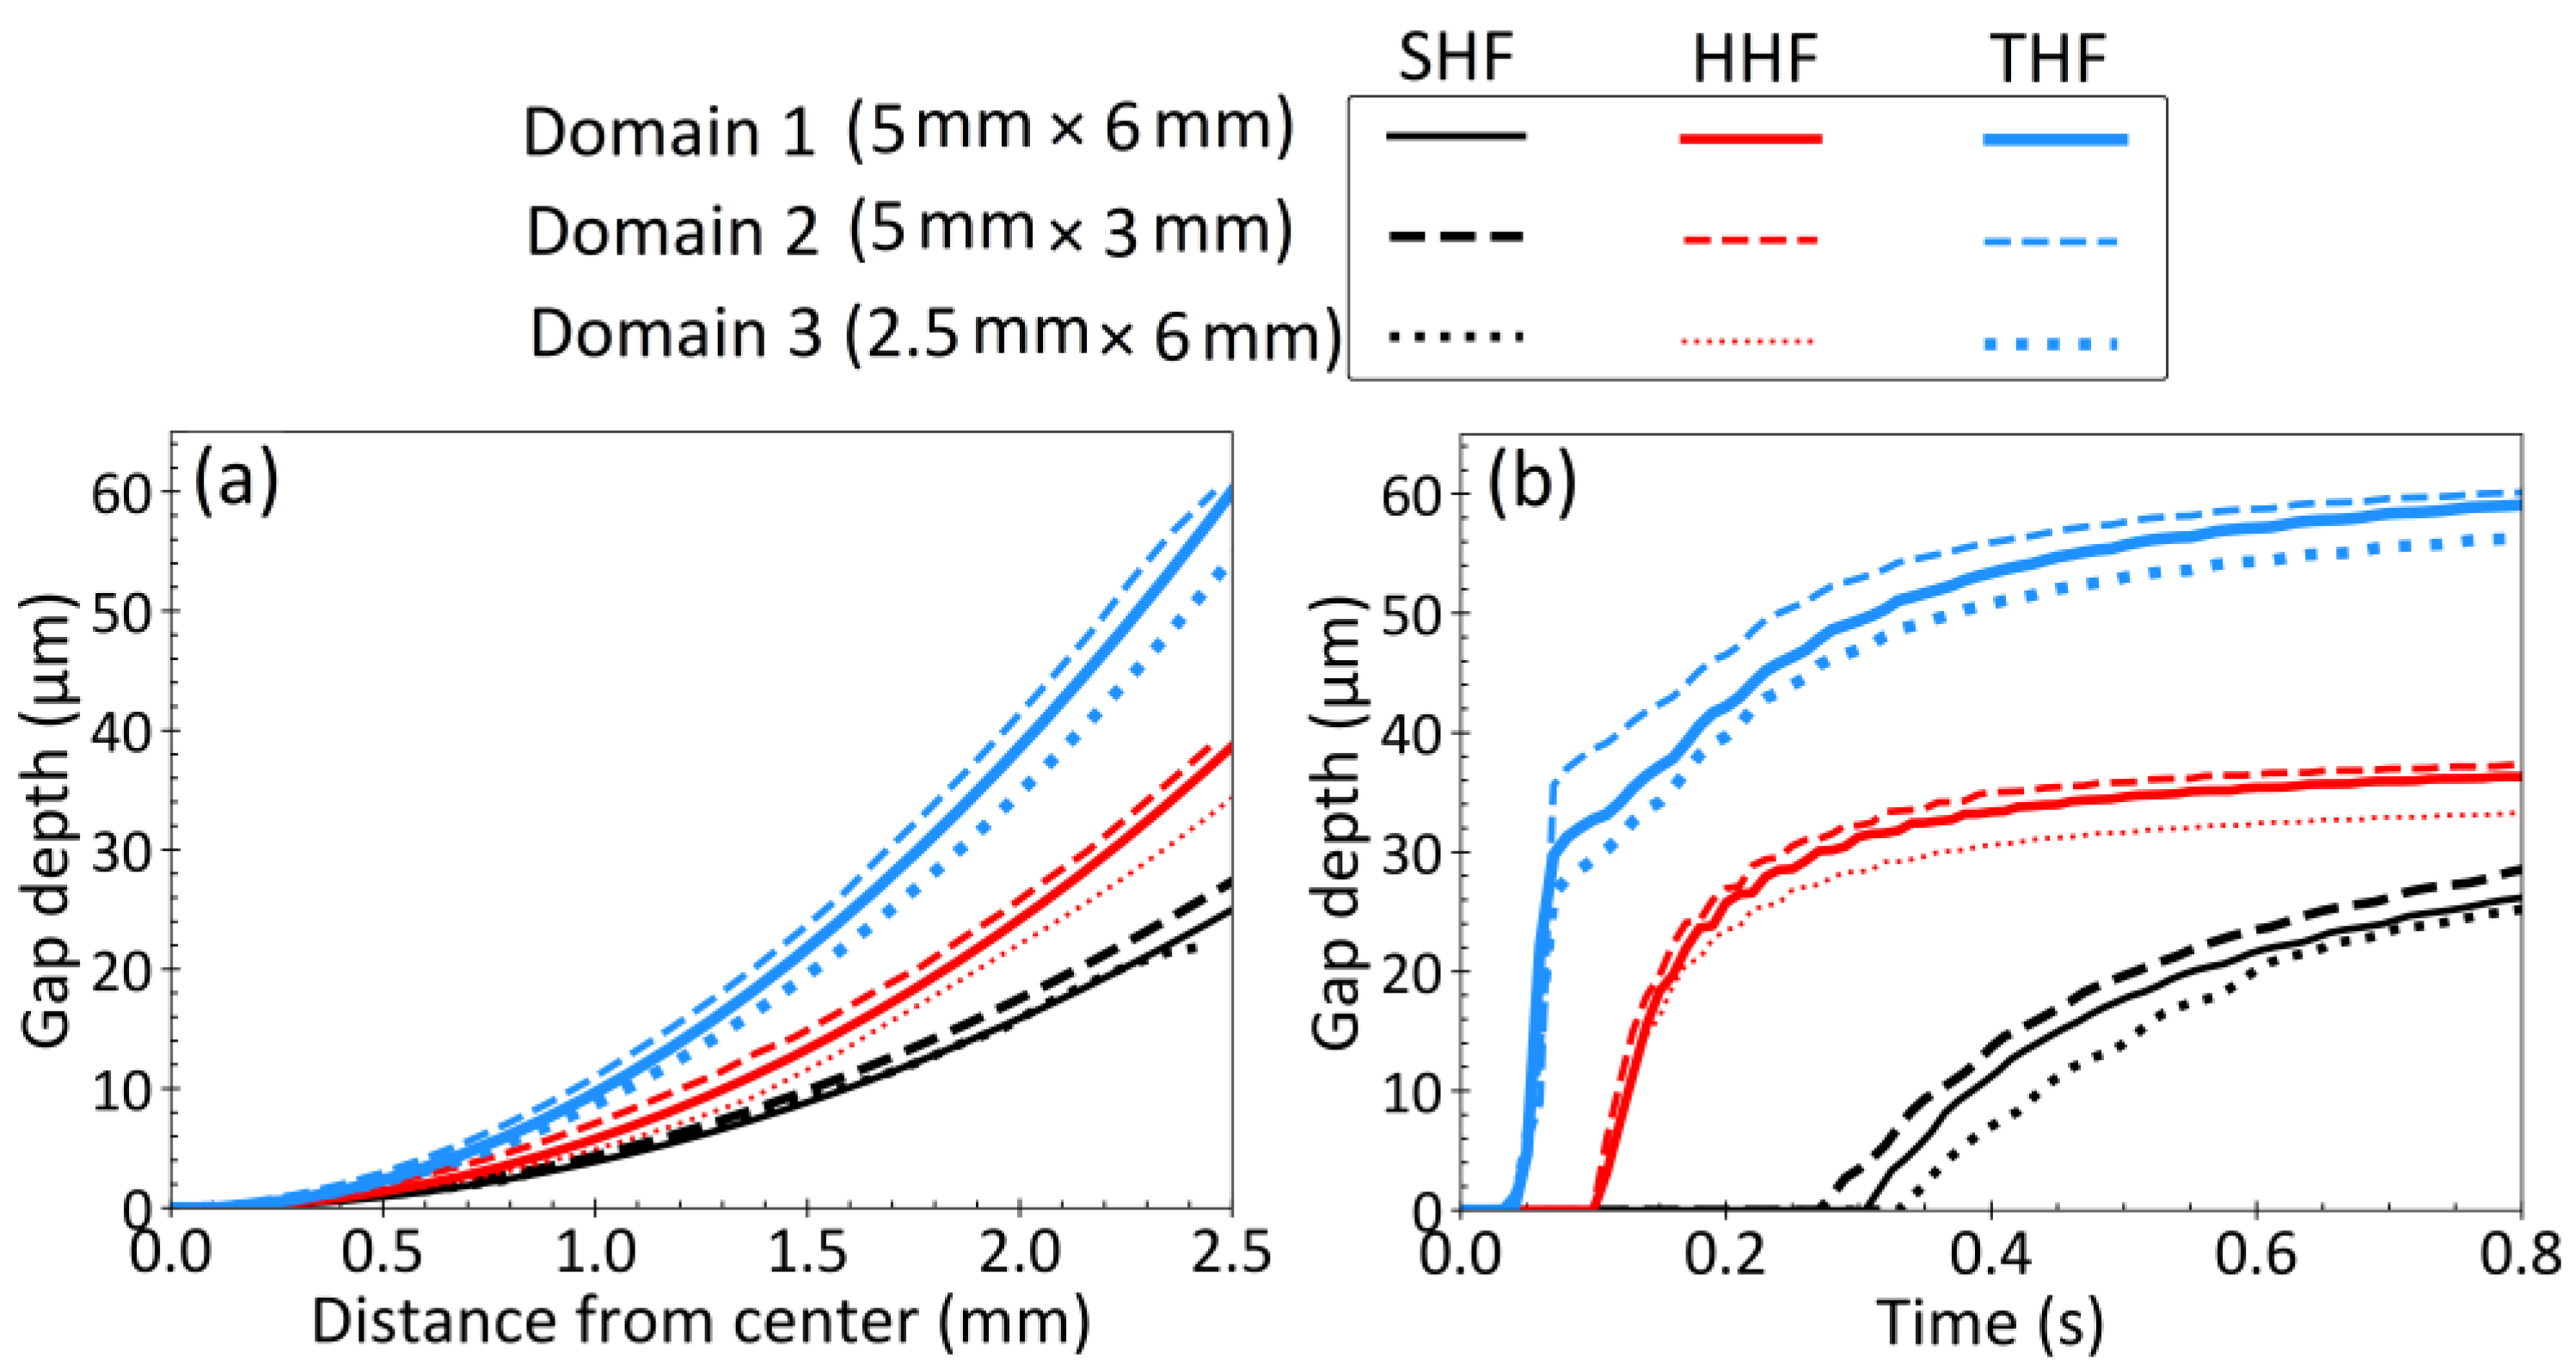
  • Large changes in droplet/domain shape/size have only a minor effect on the thermal-mechanical behavior and final curvature of bottom surface. Thus, the above findings are expected to be similar in commercial steel casting processes.

Author Contributions

G.A.: Conceptualization, methodology, software, formal analysis, writing—original draft. B.G.T.: supervision, conceptualization, methodology, formal analysis, Writing—review & editing, funding acquisition. M.A.Z.: Supervision, conceptualization, methodology, formal analysis, writing—review & editing, funding acquisition. All authors have read and agreed to the published version of the manuscript.

Funding

This research received no external funding.

Data Availability Statement

Raw data will be provided upon request from the corresponding author.

Acknowledgments

The authors wish to thank the contributing companies of the Continuous Casting Center at the Colorado School of Mines for funding that enabled this research.

Conflicts of Interest

The authors declare no conflict of interest.

References

  1. Thomas, B.G. Review on modeling and simulation of continuous casting. Steel Res. Int. 2018, 89, 1700312. [Google Scholar] [CrossRef]
  2. Brimacombe, J.K.; Sorimachi, K. Crack formation in the continuous casting of steel. Metall. Mater. Trans. B 1977, 8, 489–505. [Google Scholar] [CrossRef]
  3. Lyu, P.; Wang, W.; Zhang, H. Mold Simulator Study on the Initial Solidification of Molten Steel Near the Corner of Continuous Casting Mold. Metall. Mater. Trans. B 2017, 48, 247–259. [Google Scholar] [CrossRef]
  4. Wolf, M.; Kurz, W. The effect of carbon content on solidification of steel in the continuous casting mold. Metall. Mater. Trans. B 1981, 12, 85–93. [Google Scholar] [CrossRef]
  5. Sengupta, J.; Thomas, B.G.; Shin, H.J.; Lee, G.G.; Kim, S.H. A new mechanism of hook formation during continuous casting of ultra-low-carbon steel slabs. Metall. Mater. Trans. A 2006, 37, 1597–1611. [Google Scholar] [CrossRef] [Green Version]
  6. Grill, A.; Sorimachi, K.; Brimacombe, J.K. Heat flow, gap formation and break-outs in the continuous casting of steel slabs. Metall. Trans. B 1976, 7, 177–189. [Google Scholar] [CrossRef]
  7. Badri, A.; Natarajan, T.T.; Snyder, C.C.; Powers, K.D.; Mannion, F.J.; Byrne, M.; Cramb, A.W. A mold simulator for continuous casting of steel: Part II. The formation of oscillation marks during the continuous casting of low carbon steel. Metall. Mater. Trans. B 2005, 36, 373–383. [Google Scholar] [CrossRef]
  8. Schwerdtfeger, K.; Sha, H. Depth of oscillation marks forming in continuous casting of steel. Metall. Trans. B 2000, 31, 813–826. [Google Scholar] [CrossRef]
  9. Kim, K.; Han, H.N.; Yeo, T.; Lee, Y.; Oh, K.H.; Lee, D.N. Analysis of surface and internal cracks in continuously cast beam blank. Ironmak. Steelmak. 1997, 24, 249–256. [Google Scholar]
  10. Maehara, Y.; Yasumoto, K.; Tomono, H.; Nagamichi, T.; Ohmori, Y. Surface cracking mechanism of continuously cast low carbon low alloy steel slabs. Mater. Sci. Technol. 1990, 6, 793–806. [Google Scholar] [CrossRef]
  11. Singh, S.N.; Blazek, K.E. Heat transfer and skin formation in a continuous-casting mold as a function of steel carbon content. JOM 1974, 26, 17–27. [Google Scholar] [CrossRef]
  12. Konishi, J.; Militzer, M.; Samarasekera, I.V.; Brimacombe, J.K. Modeling the formation of longitudinal facial cracks during continuous casting of hypoperitectic steel. Metall. Mater. Trans. B 2002, 33, 413–423. [Google Scholar] [CrossRef]
  13. Clyne, T.W.; Wolf, M.; Kurz, W. The effect of melt composition on solidification cracking of steel, with particular reference to continuous casting. Metall. Trans. B 1982, 13, 259–266. [Google Scholar] [CrossRef]
  14. Kim, K.H.; Han, S.; Yeo, T.J.; Oh, K.H.; Lee, D.N. Effect of carbon and sulfur in continuously cast strand on longitudinal surface cracks. ISIJ Int. 1996, 36, 284–289. [Google Scholar] [CrossRef] [Green Version]
  15. Azizi, G.; Thomas, B.G.; Asle Zaeem, M. Review of Peritectic Solidification Mechanisms and Effects in Steel Casting. Metall. Mater. Trans. B 2020, 51, 1875–1903. [Google Scholar] [CrossRef]
  16. Won, Y.M.; Yeo, T.J.; Seol, D.J.; Oh, K.H. A new criterion for internal crack formation in continuously cast steels. Metall. Mater. Trans. B 2000, 31, 779–794. [Google Scholar] [CrossRef]
  17. Xia, G.; Bernhard, C.; Ilie, S.; Fuerst, C. A study about the influence of carbon content in the steel on the casting behavior. Steel Res. Int. 2011, 82, 230–236. [Google Scholar] [CrossRef]
  18. Suzuki, M.; Yu, C.H.; Sato, H.; Tsui, Y.; Shibata, H.; Emi, T. Origin of heat transfer anomaly and solidifying shell deformation of peritectic steels in continuous casting. ISIJ Int. 1996, 36, S171–S174. [Google Scholar] [CrossRef] [Green Version]
  19. Bernhard, C.; Xia, G. Influence of alloying elements on the thermal contraction of peritectic steels during initial solidification. Ironmak. Steelmak. 2006, 33, 52–56. [Google Scholar] [CrossRef]
  20. Bernhard, C.; Reiter, J.; Presslinger, H. A model for predicting the austenite grain size at the surface of continuously-cast slabs. Metall. Mater. Trans. B 2008, 39, 885–895. [Google Scholar] [CrossRef]
  21. Badri, A.; Natarajan, T.T.; Snyder, C.C.; Powers, K.D.; Mannion, F.J.; Cramb, A.W. A mold simulator for the continuous casting of steel: Part I. The development of a simulator. Metall. Mater. Trans. B 2005, 36, 355–371. [Google Scholar] [CrossRef]
  22. Zhu, L.G.; Kumar, R.V. Shrinkage of carbon steel by thermal contraction and phase transformation during solidification. Ironmak. Steelmak. 2007, 34, 71–75. [Google Scholar] [CrossRef]
  23. Ramirez-Lopez, P.E.; Lee, P.D.; Mills, K.C. Explicit modelling of slag infiltration and shell formation during mould oscillation in continuous casting. ISIJ Int. 2010, 50, 425–434. [Google Scholar] [CrossRef] [Green Version]
  24. Perrot, C.; Pontoire, N.J.; Marchionni, C.; Ridolfi, M.R.; Sancho, L.F. Several slag rims and lubrication behaviours in slab casting. Metall. Res. Technol. 2005, 102, 887–896. [Google Scholar] [CrossRef]
  25. Thomas, B.G.; Najjar, F.M. Finite element modelling of turbulent fluid flow and heat transfer in continuous casting. Appl. Math. Model. 1991, 15, 226–243. [Google Scholar] [CrossRef]
  26. Sengupta, J.; Ojeda, C.; Thomas, B.G. Thermal-mechanical behaviour during initial solidification in continuous casting: Steel grade effects. Int. J. Cast Met. Res. 2009, 22, 8–14. [Google Scholar] [CrossRef]
  27. Harada, S.; Tanaka, S.; Misumi, H.; Mizoguchi, S.; Horiguchi, H. A formation mechanism of transverse cracks on CC slab surface. ISIJ Int. 1990, 30, 310–316. [Google Scholar] [CrossRef]
  28. Mukai, K.; Zeze, M. Motion of fine particles under interfacial tension gradient in relation to continuous casting process. Steel Res. Int. 2003, 74, 131–138. [Google Scholar] [CrossRef]
  29. Balogun, D.; Roman, M.; Gerald, R.E.; Huang, J.; Bartlett, L.; O’Malley, R. Shell Measurements and Mold Thermal Mapping Approach to Characterize Steel Shell Formation in Peritectic Grade Steels. Steel Res. Int. 2022, 93, 2100455. [Google Scholar] [CrossRef]
  30. Dong, S.; Niyama, E.; Anzai, K.; Matsumoto, N. Free deformation of the initial solid layer of some non-ferrous alloys. Tets Hagané 1993, 79, 1060–1066. [Google Scholar]
  31. Dong, S.; Niyama, E.; Anzai, K. Free deformation of initial solid shell of Fe-C alloys. ISIJ Int. 1995, 35, 730–736. [Google Scholar] [CrossRef]
  32. Dong, S. Free Deformation of the Initial Solid Layer of Alloys. Ph.D. Thesis, Tohoku University, Sendai, Japan, 1995. [Google Scholar]
  33. Thomas, B.G.; Zhu, H. Thermal Distortion of solidifying shell near meniscus in continuous casting of steel. In Proceedings of the JIM/TMS Solidification Science and Processing Conference, Honolulu, HI, USA, 13–15 December 1995; pp. 197–208. [Google Scholar]
  34. Thomas, B.G.; Parkman, J.T. Simulation of thermal distortion of a steel droplet solidifying on a copper chill. In Proceedings of the TMS Annual Meeting, San Antonio, TX, USA, 15–19 February 1998. [Google Scholar]
  35. Vynnycky, M. On the onset of air-gap formation in vertical continuous casting with superheat. Int. J. Mech. Sci. 2013, 73, 69–76. [Google Scholar] [CrossRef]
  36. Florio, B.J.; Vynnycky, M.; Mitchell, S.L.; O’Brien, S. Mould-taper asymptotics and air gap formation in continuous casting. Appl. Math. Comput. 2015, 268, 1122–1139. [Google Scholar] [CrossRef]
  37. Niu, Z.; Cai, Z.; Zhu, M. Dynamic distributions of mold flux and air gap in slab continuous casting mold. ISIJ Int. 2019, 59, 283–292. [Google Scholar] [CrossRef] [Green Version]
  38. Wang, T.M.; Cai, S.W.; Xu, J.; Du, Y.Y.; Zhu, J.; Xu, J.J.; Li, T.J. Continuous casting mould for square steel billet optimised by solidification shrinkage simulation. Ironmak. Steelmak. 2010, 37, 341–346. [Google Scholar] [CrossRef]
  39. Florio, B.J.; Vynnycky, M.; Mitchell, S.L.; O’Brien, S. On the interactive effects of mould taper and superheat on air gaps in continuous casting. Acta Mech. 2017, 228, 233–254. [Google Scholar] [CrossRef]
  40. Cai, Z.Z.; Zhu, M.Y. Simulation of air gap formation in slab continuous casting mould. Ironmak. Steelmak. 2014, 41, 435–446. [Google Scholar] [CrossRef]
  41. Cai, Z.; Zhu, M. Simulation of Heat Transfer in SLAB Continuous Casting Mold and New Formation Mechanism of Shell Hot Spots; Springer: Cham, Switzerland, 2016. [Google Scholar]
  42. Hostos, J.C.A.; Cabrera, E.S.P.; Bencomo, A.D. Stress Analysis of a Continuous Casting Process, on the Basis of the Element-Free Galerkin Formulation. Steel Res. Int. 2017, 88, 1600019. [Google Scholar] [CrossRef]
  43. Li, C.; Thomas, B.G. Thermomechanical finite-element model of shell behavior in continuous casting of steel. Metall. Mater. Trans. B 2004, 35, 1151–1172. [Google Scholar] [CrossRef]
  44. Zappulla, M.L.; Hibbeler, L.C.; Thomas, B.G. Effect of Grade on Thermal–Mechanical Behavior of Steel During Initial Solidification. Metall. Mater. Trans. A 2017, 48, 3777–3793. [Google Scholar] [CrossRef]
  45. Park, J.K.; Thomas, B.G.; Samarasekera, I.V. Analysis of thermomechanical behaviour in billet casting with different mould corner radii. Ironmak. Steelmak. 2002, 29, 359–375. [Google Scholar] [CrossRef]
  46. Thomas, B.G.; Moitra, A.; McDavid, R. Simulation of longitudinal off-corner depressions in continuously cast steel slabs. Iron Steelmak. 1996, 23, 57–70. [Google Scholar]
  47. Niu, Z.; Cai, Z.; Zhu, M. Formation Mechanism of a Wide-Face Longitudinal Off-Corner Depression during Thick Slab Continuous Casting. Metall. Mater. Trans. B 2021, 52, 2737–2752. [Google Scholar] [CrossRef]
  48. Risso, J.M.; Huespe, A.E.; Cardona, A. Thermal stress evaluation in the steel continuous casting process. Int. J. Numer. Methods Eng. 2006, 65, 1355–1377. [Google Scholar] [CrossRef]
  49. Kristiansson, J.O. Thermal stresses in the early stage of solidification of steel. J. Therm. Stress. 1982, 5, 315–330. [Google Scholar] [CrossRef]
  50. Zuo, X.J.; Lin, R.G.; Wang, N.; Yang, J.; Meng, X.N.; Zhu, M.Y. Formation of Initial Defects at Meniscus in Oscillating Mold. Steel Res. Int. 2016, 87, 413–423. [Google Scholar] [CrossRef]
  51. Hebi, Y.; Man, Y.; Huiying, Z.; Dacheng, F. 3D stress model with friction in and of mould for round billet continuous casting. ISIJ Int. 2006, 46, 546–552. [Google Scholar] [CrossRef] [Green Version]
  52. Cai, Z.Z.; Zhu, M.Y. Thermo-mechanical behavior of peritectic steel solidifying in slab continuous casting mold and a new mold taper design. ISIJ Int. 2013, 53, 1818–1827. [Google Scholar] [CrossRef] [Green Version]
  53. Thomas, B.G.; Ojeda, C. Ideal taper prediction for slab casting. In Proceedings of the ISSTech Steelmaking Conference, Indianapolis, IN, USA, 27–30 April 2003. [Google Scholar]
  54. Kozlowski, P.F.; Thomas, B.G.; Azzi, J.A.; Wang, H. Simple constitutive equations for steel at high temperature. Metall. Mater. Trans. A 1992, 23, 903. [Google Scholar] [CrossRef]
  55. Jablonka, A.; Harste, K.; Schwerdtfeger, K. Thermomechanical properties of iron and iron-carbon alloys: Density and thermal contraction. Steel Res. 1991, 62, 24–33. [Google Scholar] [CrossRef]
  56. Jimbo, I.; Cramb, A.W. The density of liquid iron-carbon alloys. Metall. Trans. B 1993, 24, 5–10. [Google Scholar] [CrossRef]
  57. DS SIMULIA Corp. ABAQUS: ABAQUS 6.13 Theory Manual; DS SIMULIA Corp.: Providence, RI, USA, 2013. [Google Scholar]
  58. DS SIMULIA Corp. ABAQUS: ABAQUS 6.13 Subroutine Manual; DS SIMULIA Corp.: Providence, RI, USA, 2013. [Google Scholar]
  59. Weiner, J.H.; Boley, B.A. Elasto-plastic thermal stresses in a solidifying body. J. Mech. Phys. Solids 1963, 11, 145–154. [Google Scholar] [CrossRef]
  60. Wray, P.J. Tensile failure behavior of plain carbon steels at elevated temperatures. Metall. Trans. A 1984, 15, 2059–2073. [Google Scholar] [CrossRef]
Figure 1. Cross section of the droplet showing the deformed simulation domain after solidification (red mesh) superimposed on the real solidified droplet.
Metals 12 01807 g001
Figure 2. Phase fractions for six different examined steel grades: (a) Fe-0.003%C; (b) Fe-0.05%C; (c) Fe-0.10%C; (d) Fe-0.12%C; (e) Fe-0.16%C, and (f) Fe-0.23%C.
Metals 12 01807 g002
Figure 3. Temperature-dependent properties of six steel grades investigated: (a) thermal conductivity; (b) specific enthalpy; (c) mass density, and (d) thermal linear expansion.
Metals 12 01807 g003
Figure 4. Mesh convergence study results through droplet height at centerline symmetry axis for low-carbon steel (0.05%C) at 5 s with SHF: (a) Temperature; (b) Radial-stress; (c) Radial inelastic strain; (d) Radial fluid strain.
Metals 12 01807 g004
Figure 5. (a) Temperature profile through the droplet height calculated at centerline symmetry axis after 1 s of solidification for six steel grades and different heat fluxes, and (b) Evolution of bottom surface temperature with time for steel with 0.003%C and different heat fluxes.
Metals 12 01807 g005
Figure 6. Radial stress profiles through the droplet height calculated at centerline symmetry axis. (a) Evolution with time for 0.10%C steel with HHF, and (b) Final profiles for six examined steels and different heat fluxes.
Metals 12 01807 g006
Figure 7. Final radial strain profile through droplet height calculated at centerline symmetry axis with SHF for 0.10%C steel.
Metals 12 01807 g007
Figure 8. Gap depth profiles for six steel grades investigated and different heat fluxes at time when bottom surface temperature is 300 °C: (a) SHF; (b) HHF; and (c) THF.
Metals 12 01807 g008
Figure 9. Comparison of predicted (lines) and measured (symbols: Exp-cc and Exp-gc) curvature of the bottom surface of the solidified droplets for six steel grades investigated with different heat flux profiles.
Metals 12 01807 g009
Figure 10. Gap depth evolution with time, comparing steels with 0.003%C and 0.12%C at different heat fluxes.
Metals 12 01807 g010
Figure 11. Gap depth evolution with time, with THF, for the six investigated steel grades, (a) for short times 0–2 s; (b) for very short times 0–0.2 s.
Metals 12 01807 g011
Figure 12. Effect of droplet domain shape and heat flux on gap depth for 0.10%C steel; (a) Final gap depth profiles; (b) Gap depth evolution at early times.
Metals 12 01807 g012
Table 1. Phase transition temperatures and times when droplet surfaces reach these temperatures for six investigated steels at different cooling conditions.
Carbon Content (wt%)Liquidus Temp. (°C)Solidus Temp. (°C)δ→γ Transformation Start Temp. (°C)Heat Flux CaseTime Bottom Surface Reaches Solidus Temp. (s)Time Bottom Surface Reaches δ→γ Temp.(s)Incubation Time (s)Time Top Surface Reaches Solidus Temp. (s)
0.003%C153215321393SHF0.010.380.404.3
HHF<0.010.080.052.4
THF<0.010.020.013.2
0.05%C152815001445SHF0.050.190.524.7
HHF0.010.040.152.7
THF<0.010.020.063.3
0.10%C152514801481SHF0.090.090.304.8
HHF0.020.020.102.7
THF0.010.010.043.6
0.12%C152114791494SHF0.080.050.264.8
HHF0.020.010.072.7
THF0.01<0.010.033.7
0.16%C151914701494SHF0.090.040.284.8
HHF0.030.010.082.8
THF0.01<0.010.043.8
0.23%C151414631491SHF0.120.030.575.8
HHF0.030.010.212.9
THF0.01<0.010.063.8
Publisher’s Note: MDPI stays neutral with regard to jurisdictional claims in published maps and institutional affiliations.

