
Tensile and Fracture Behavior of Bi-Containing Alloy Sintered on SAE 1010 Steel Sheet

Abstract
:1. Introduction
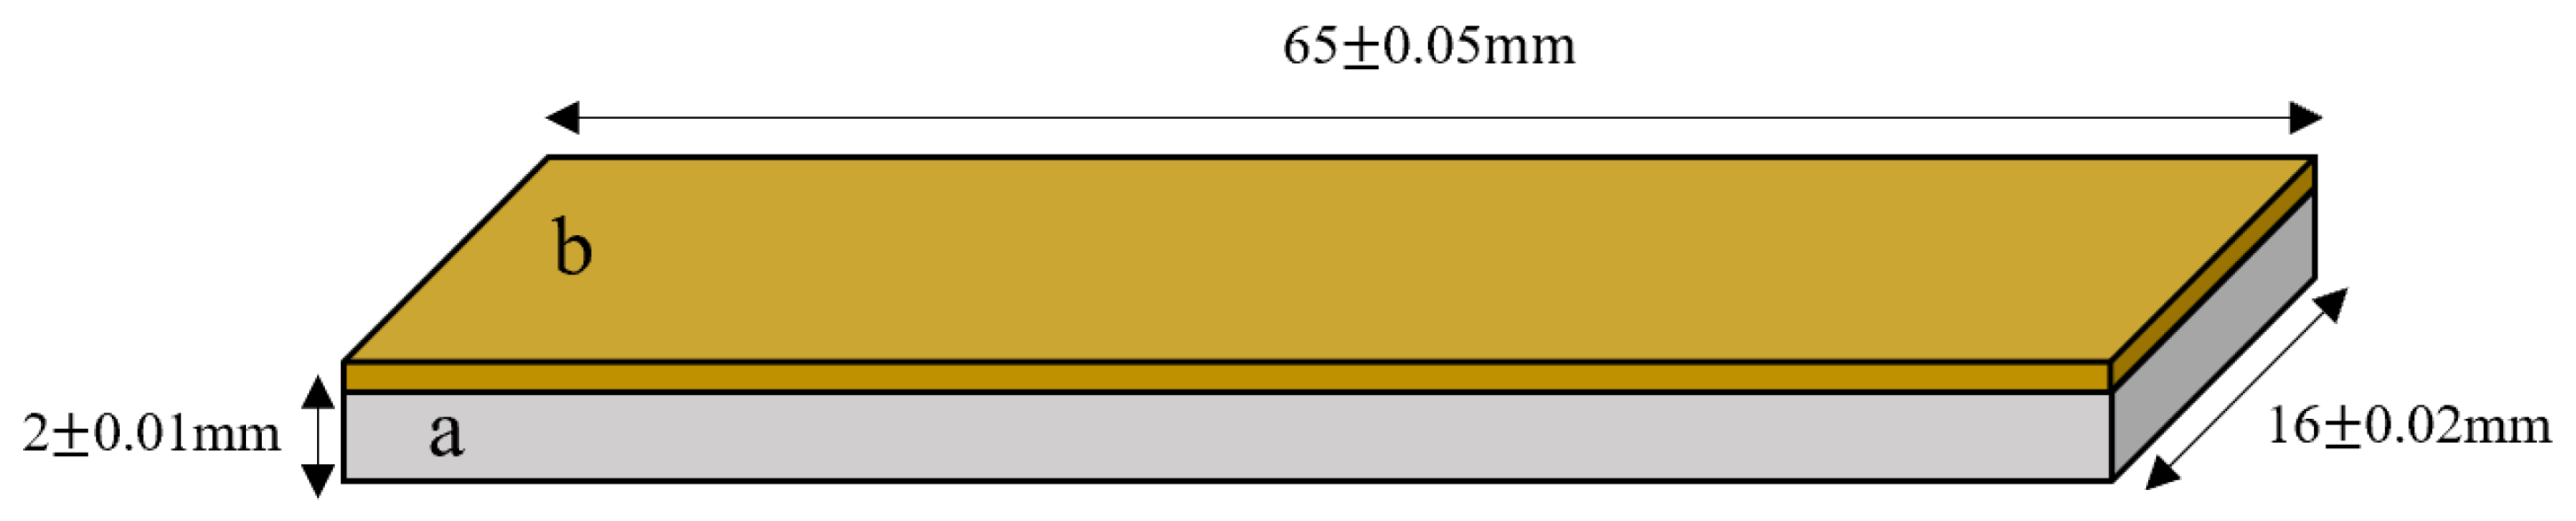
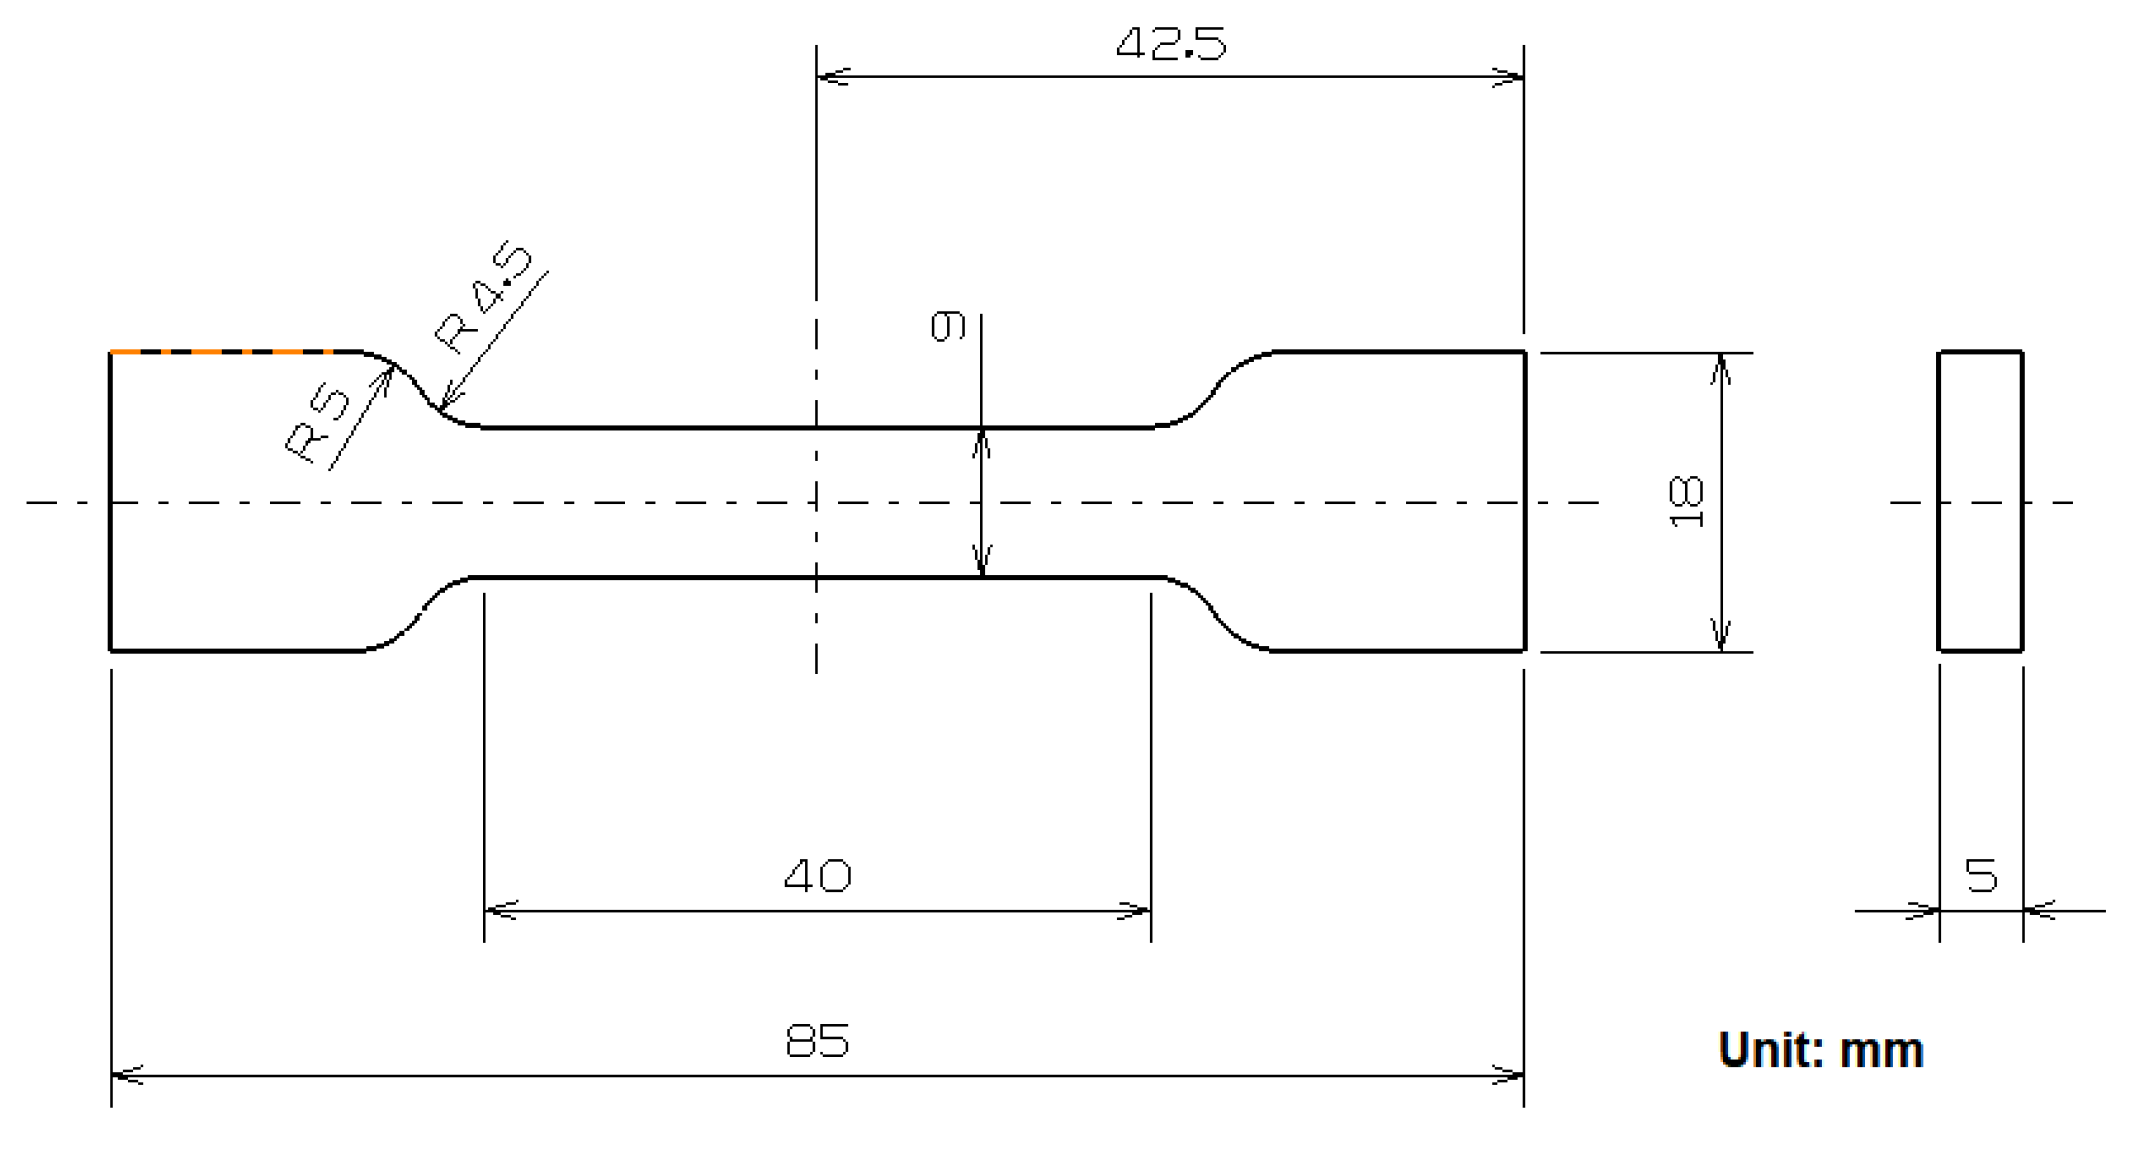
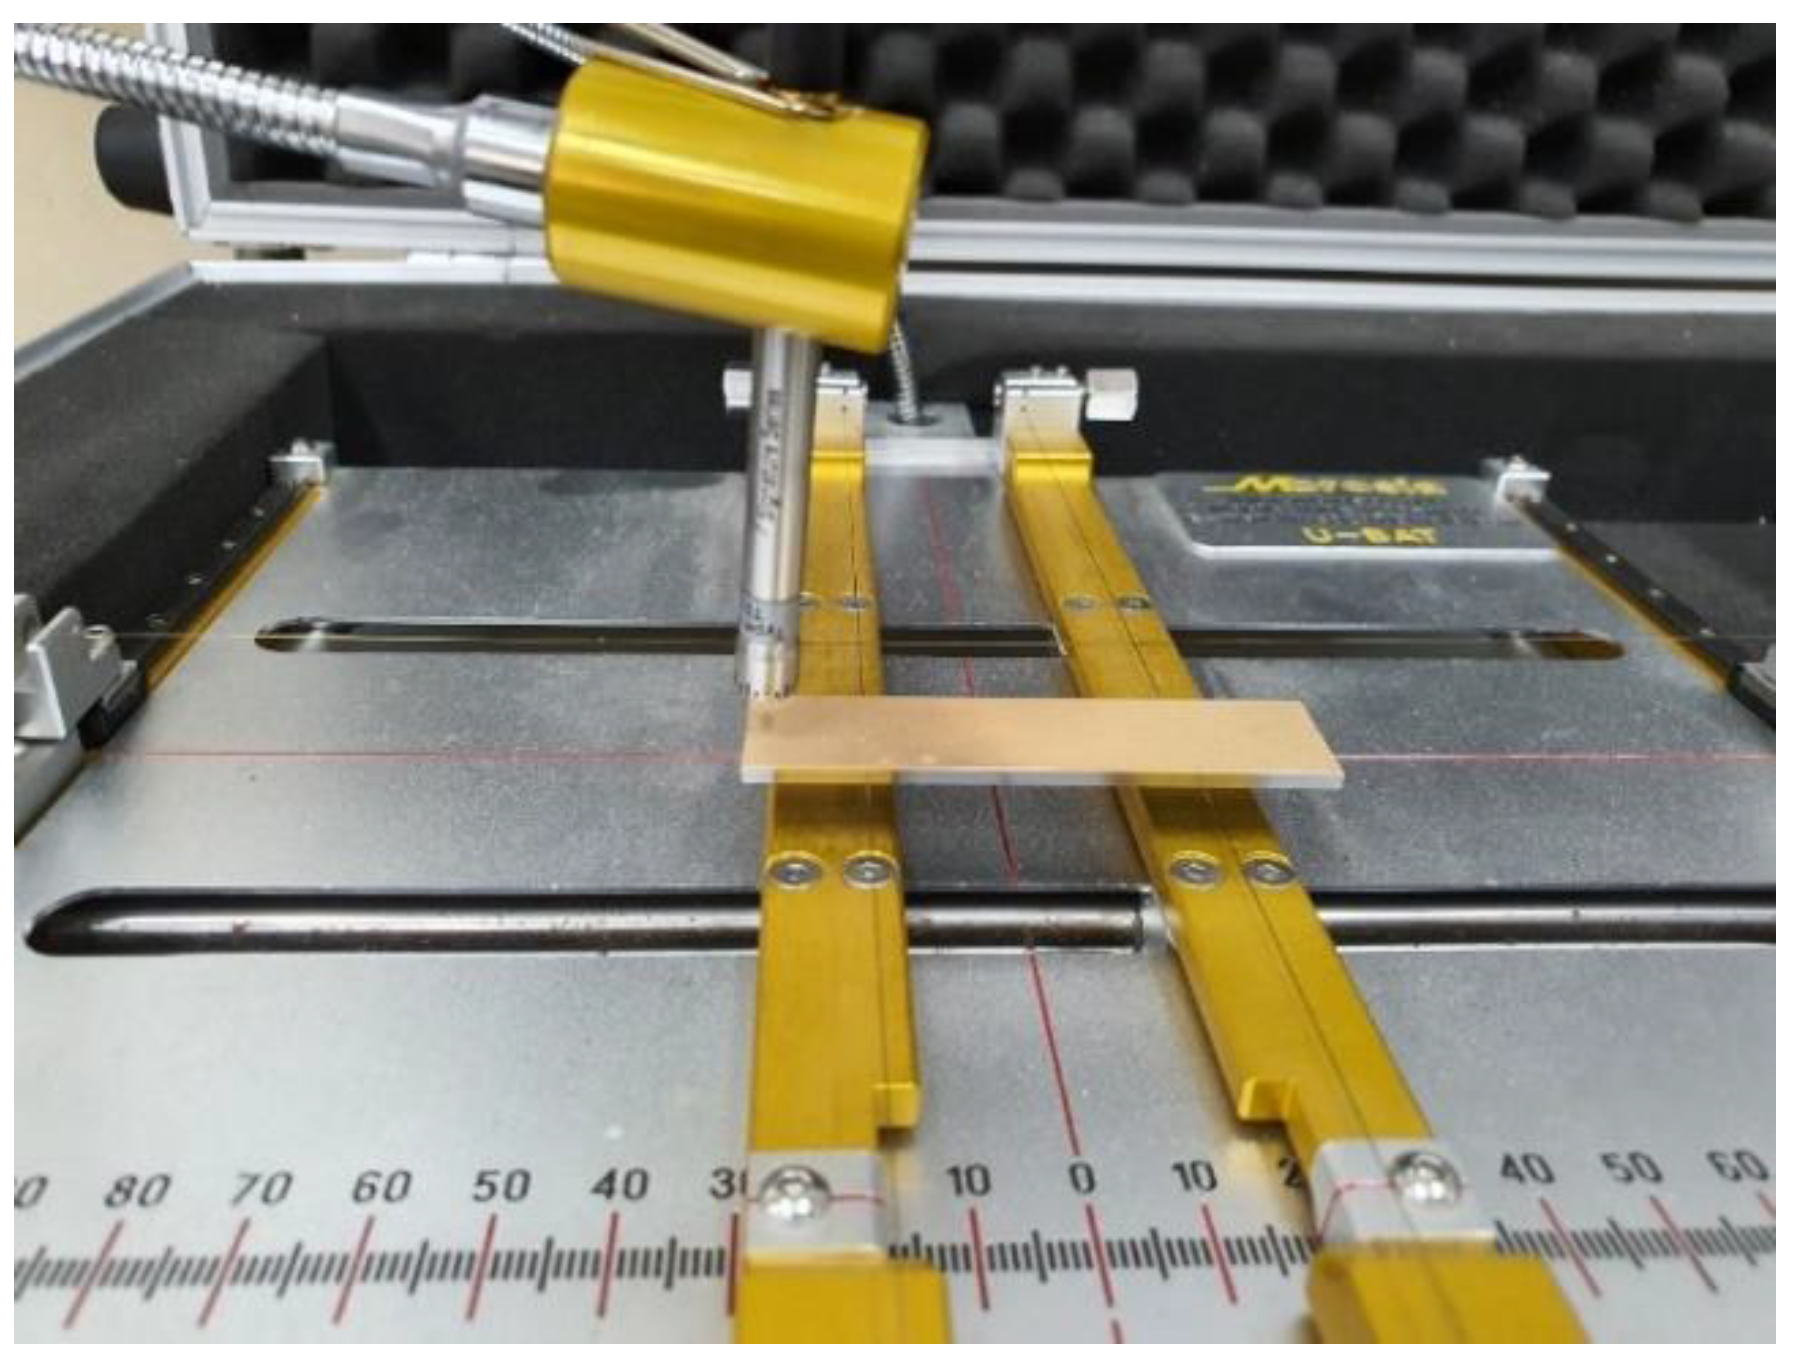
2. Materials and Methods
3. Results
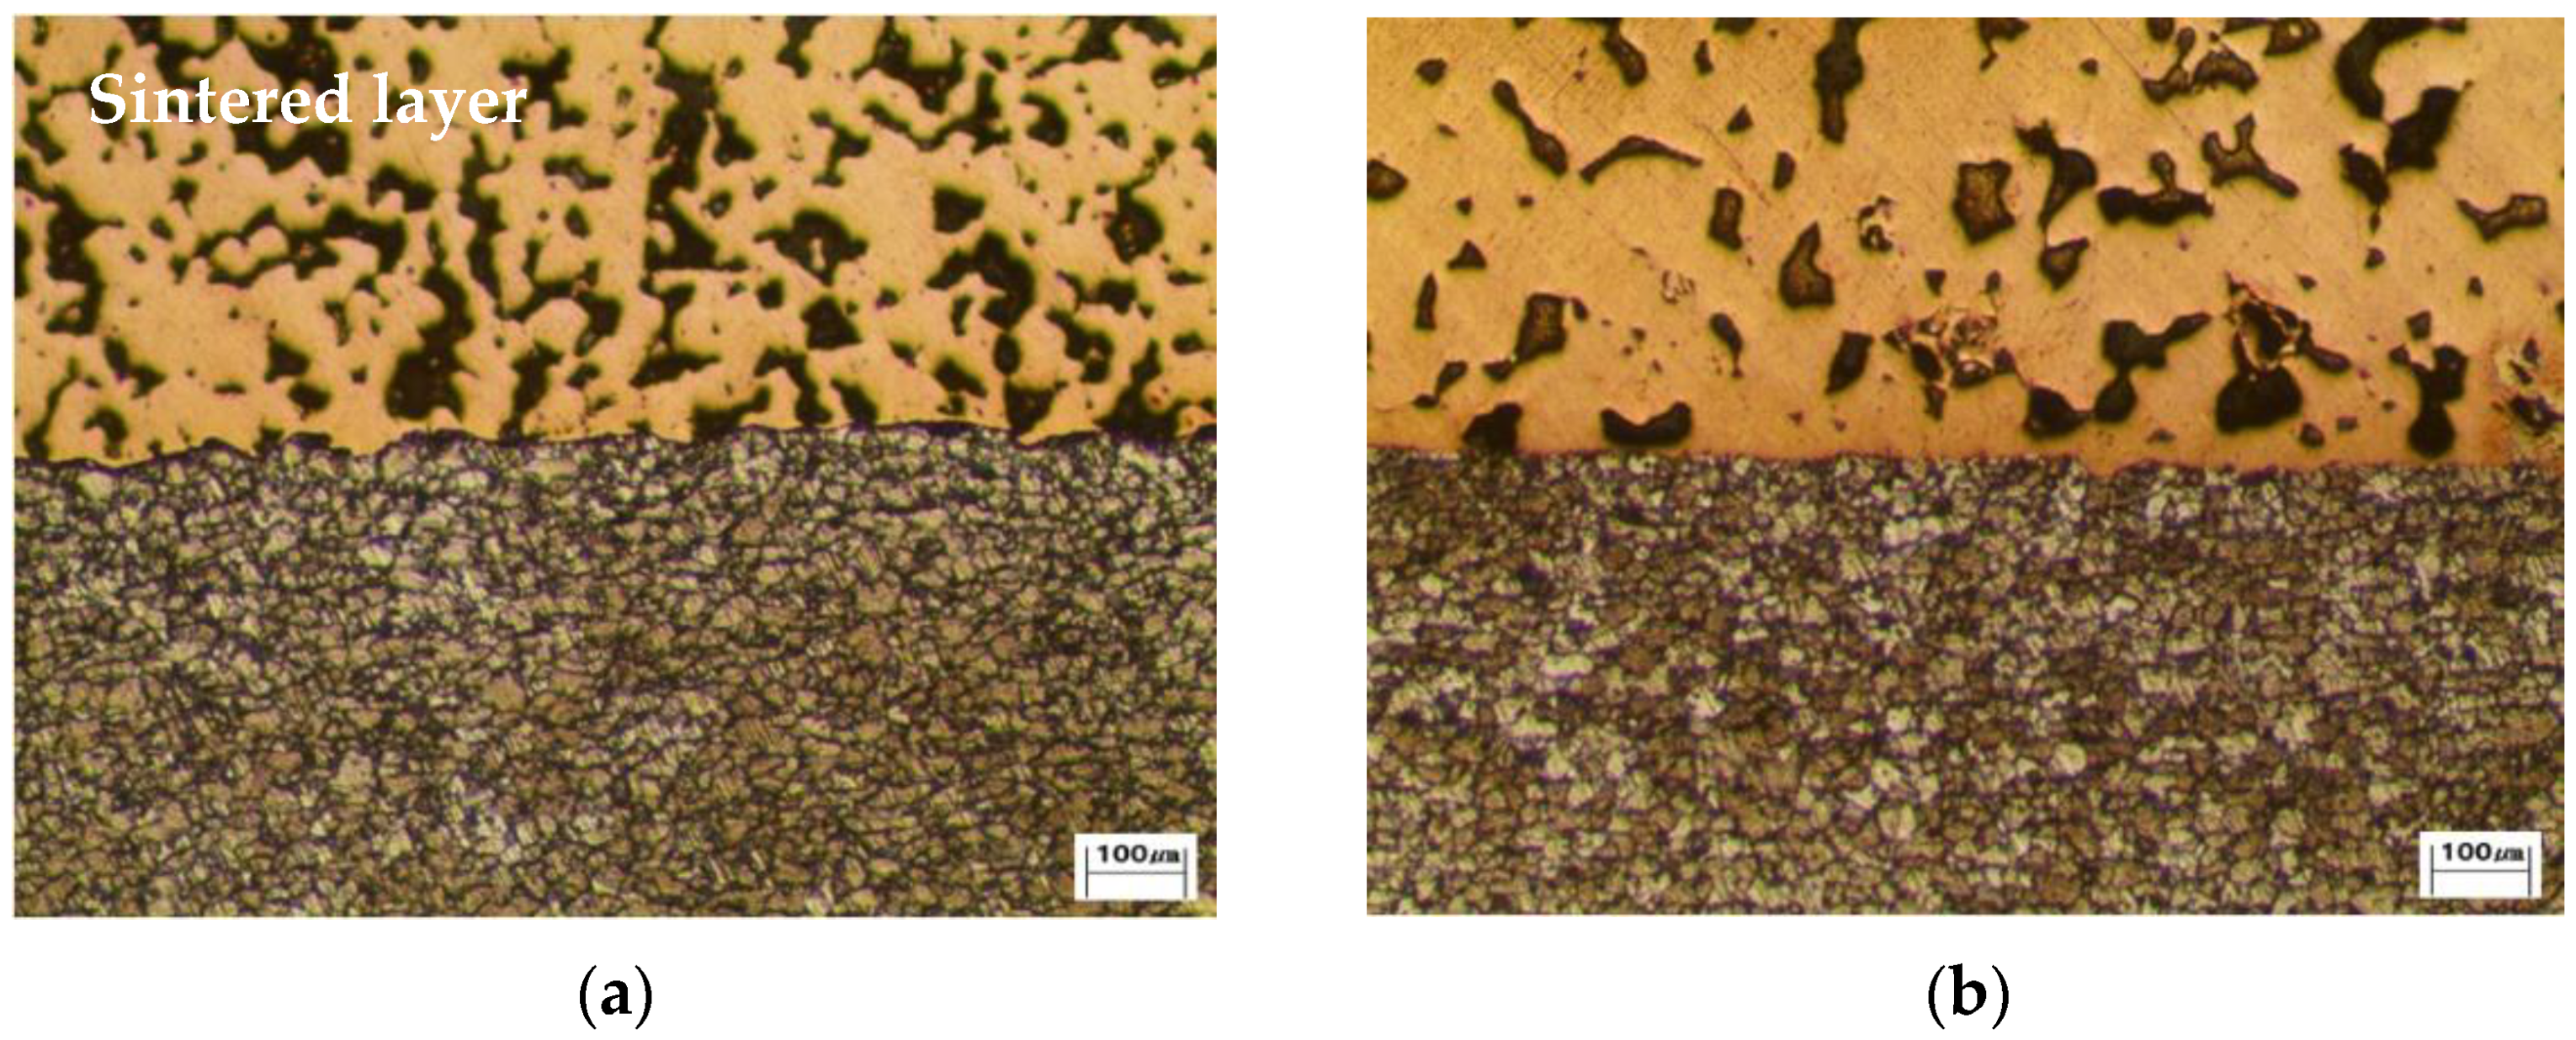
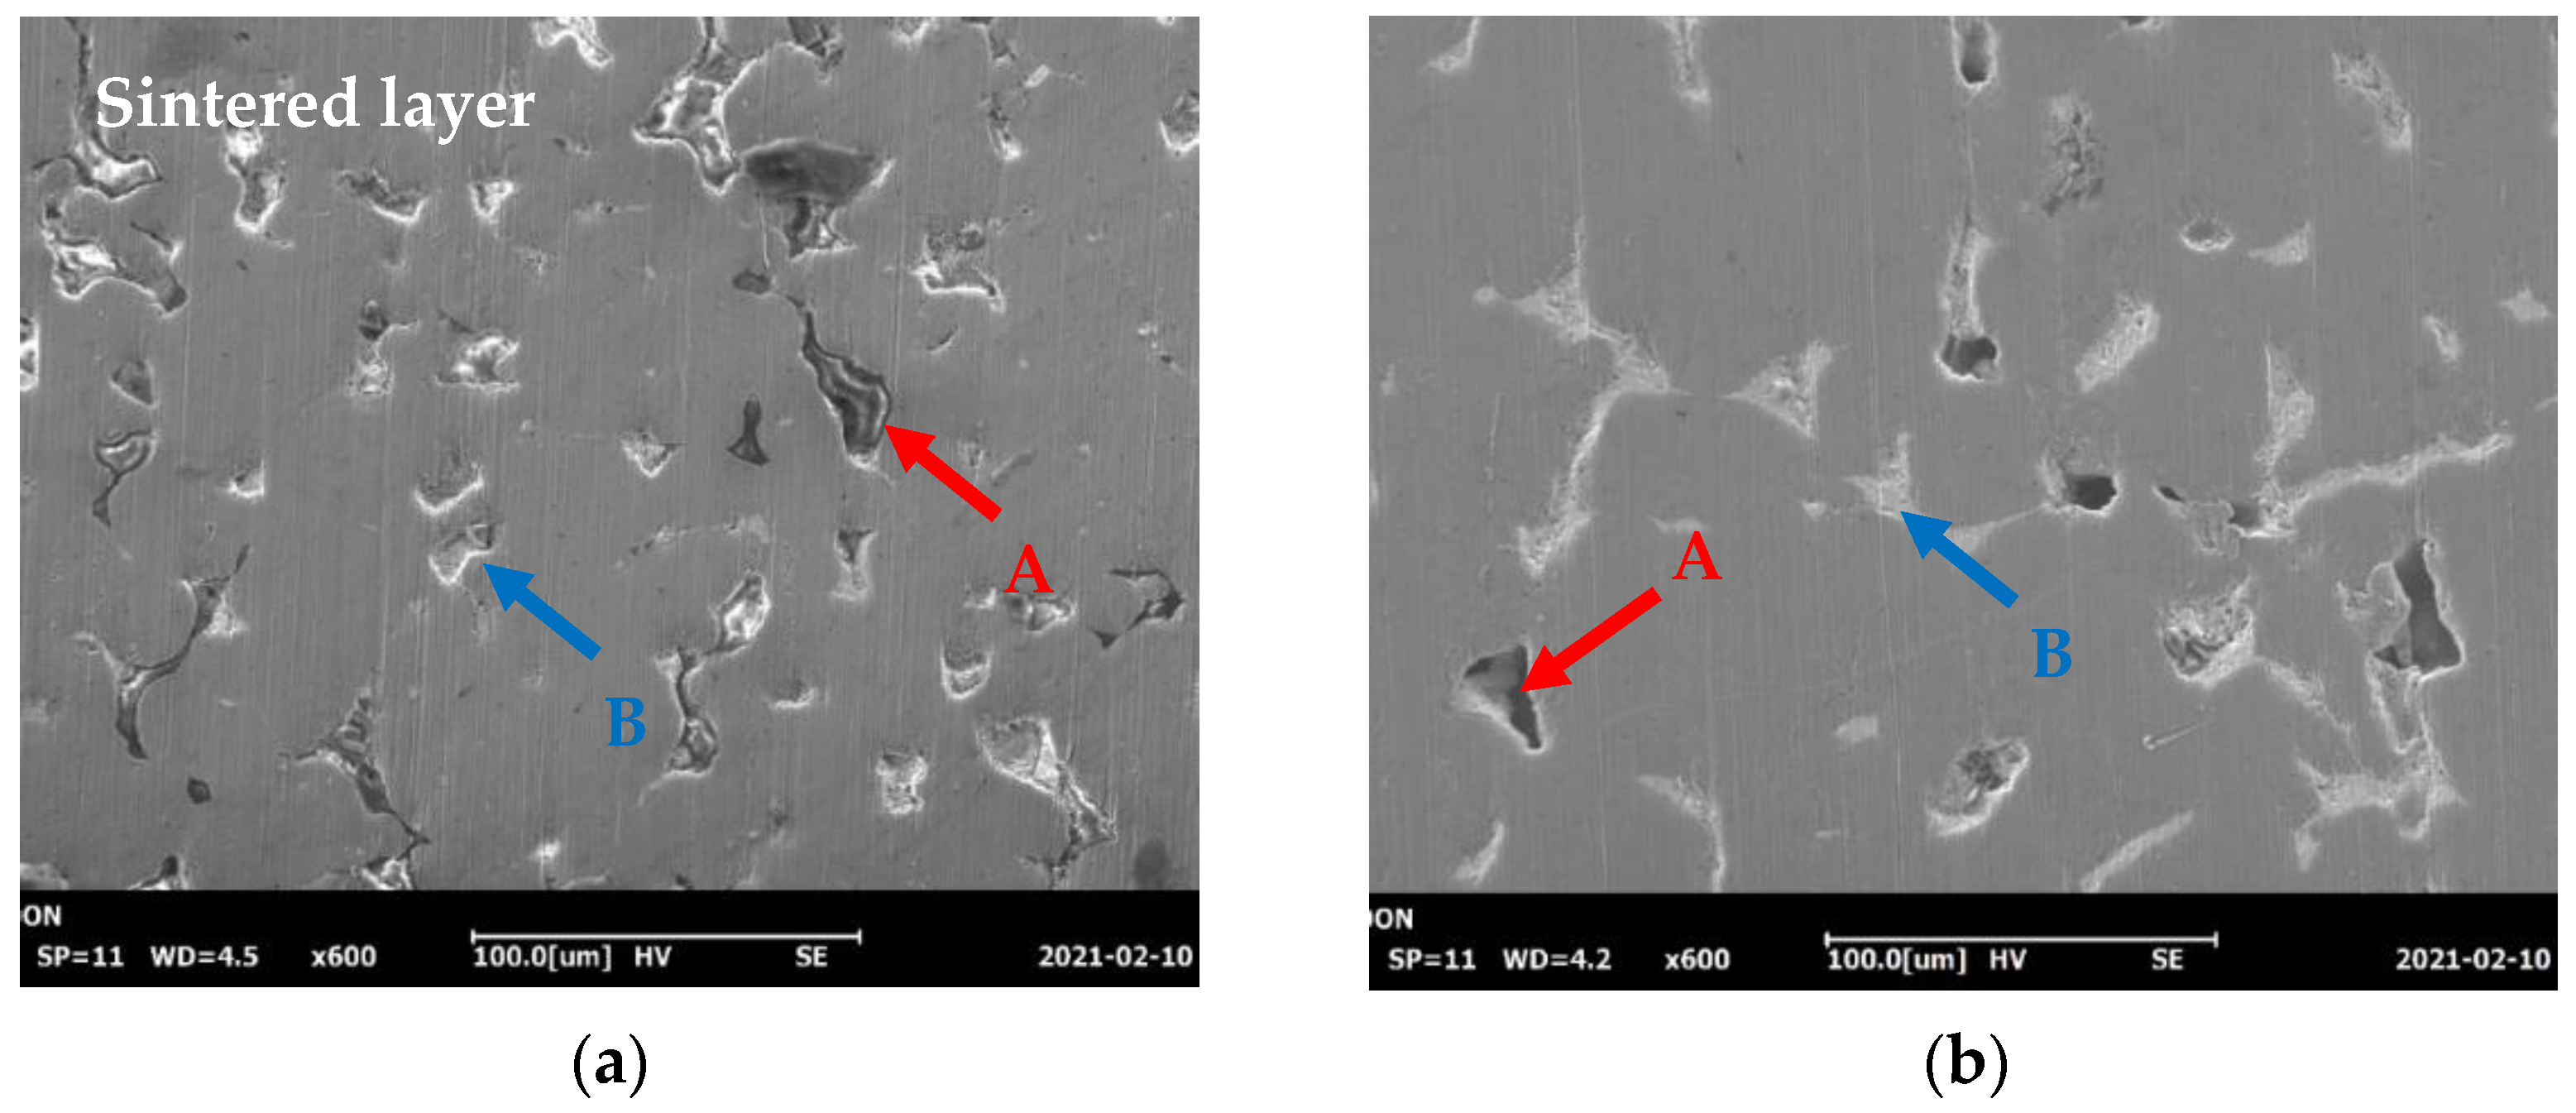
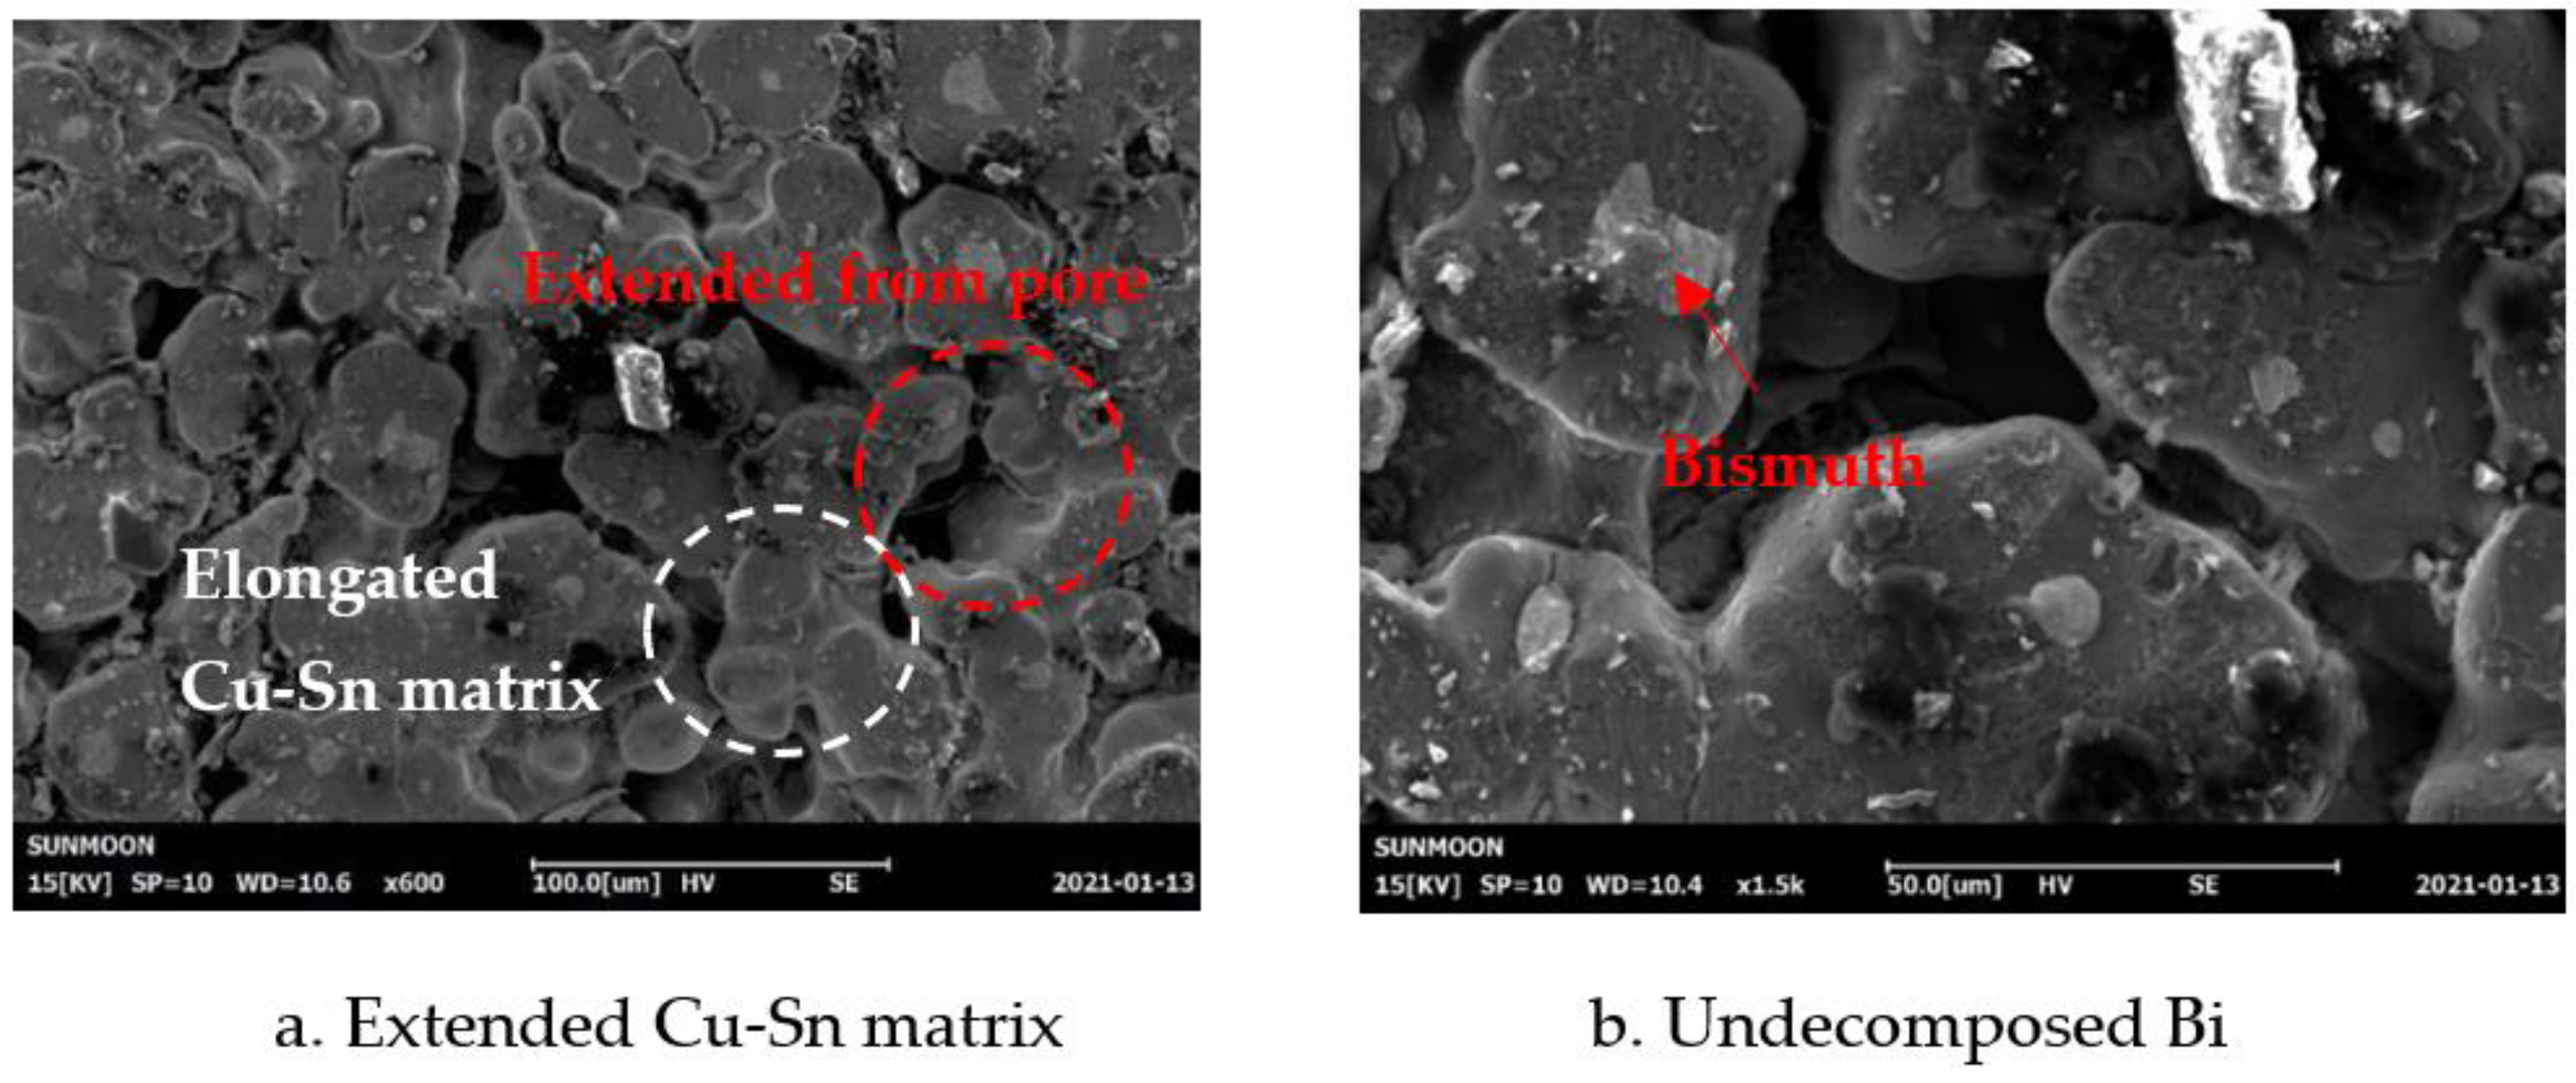
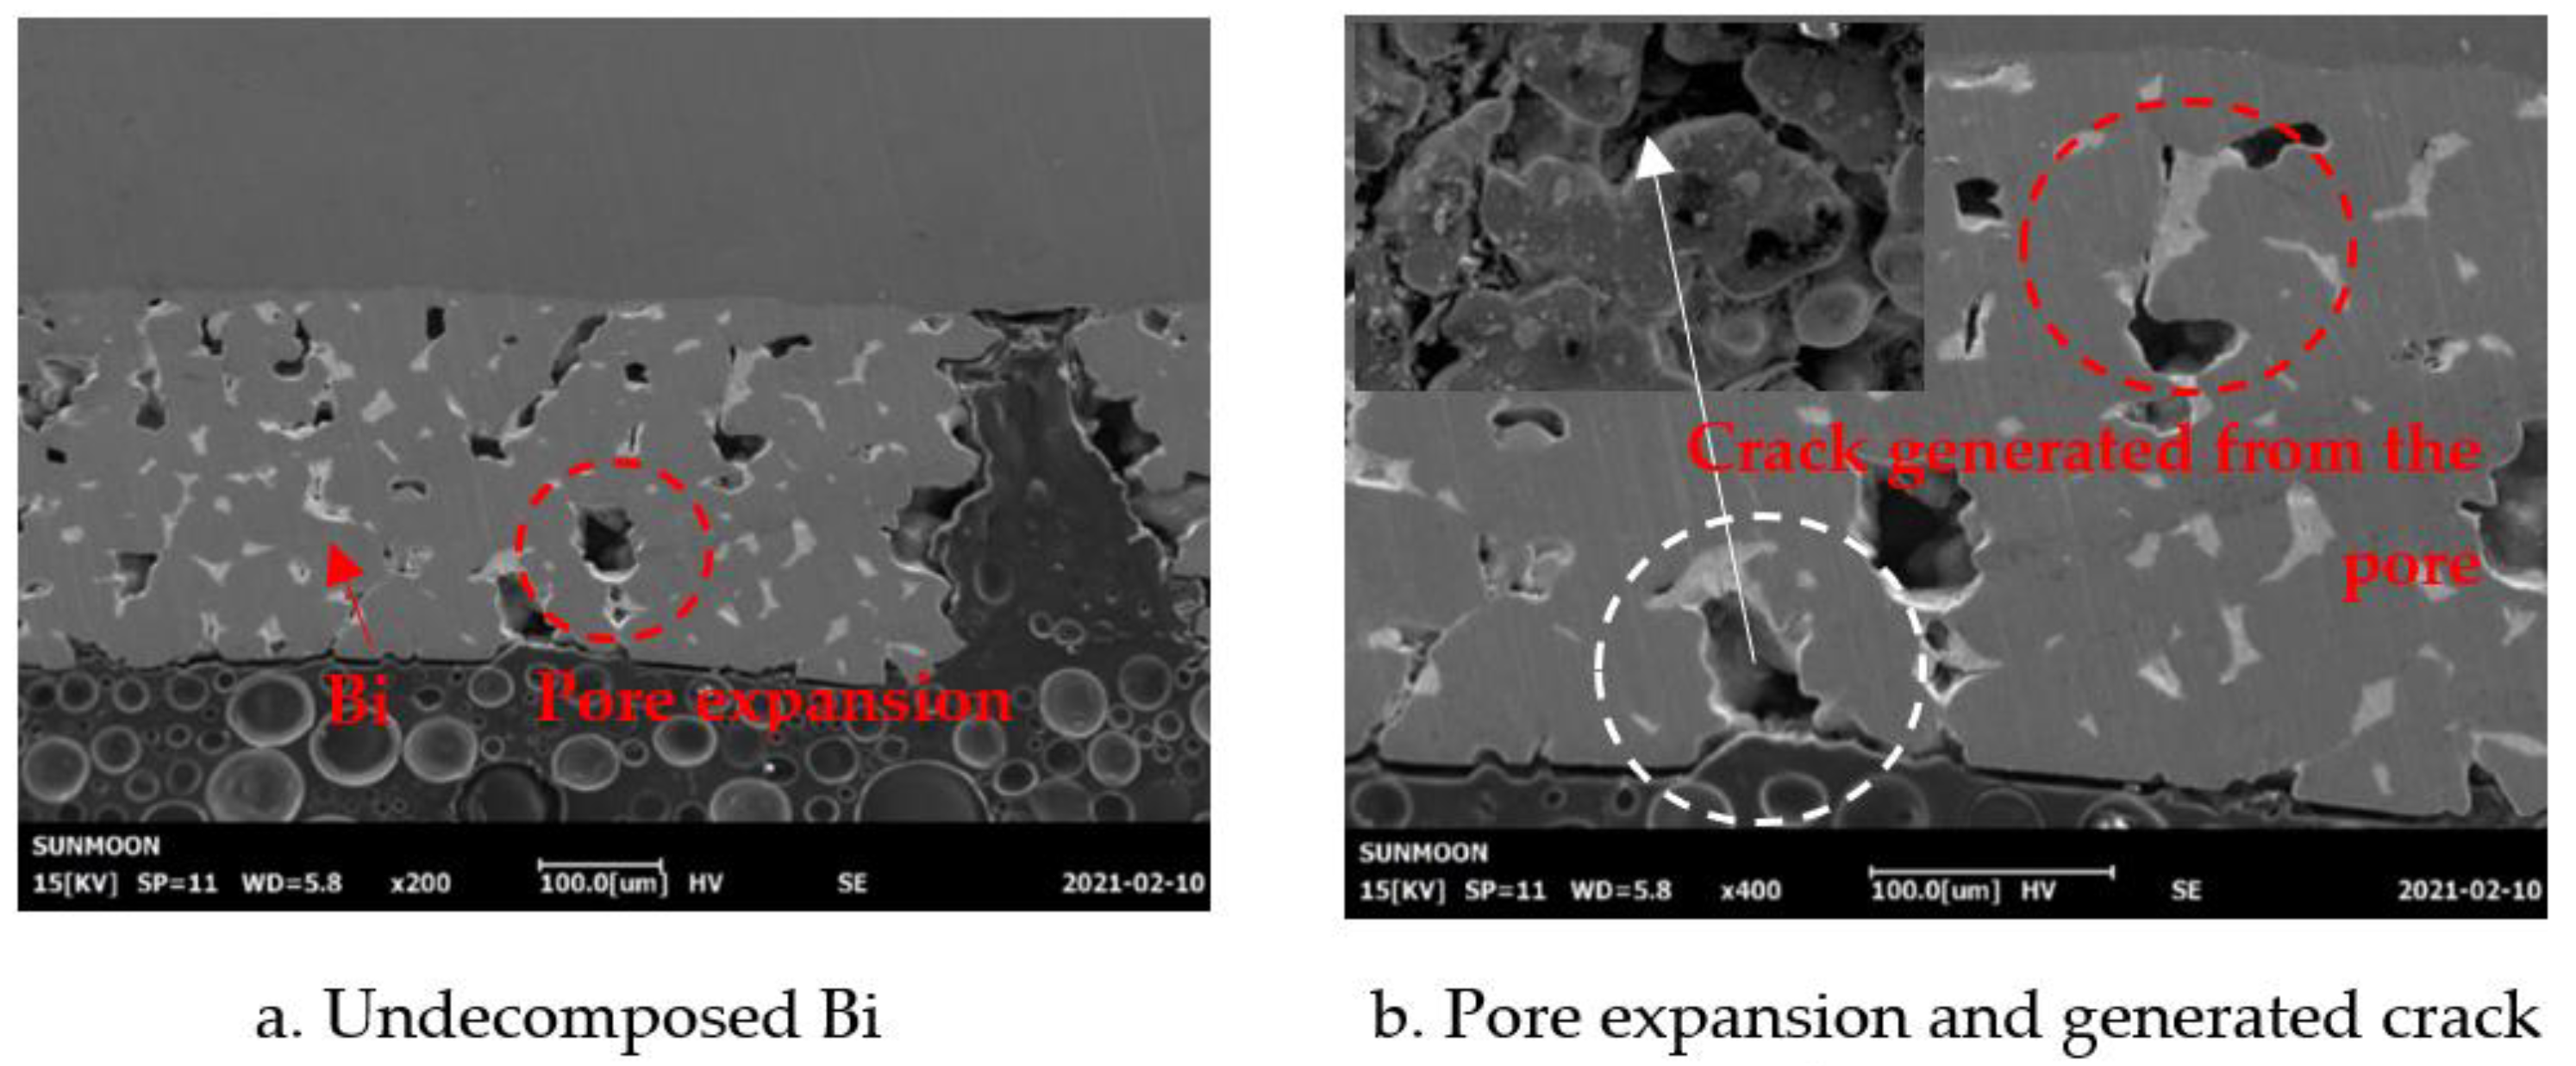
3.1. Microstructure
Cross-Sectional OM and Top Surface SEM Images
3.2. Dynamic Young’s Modulus
3.3. Tension Test Results
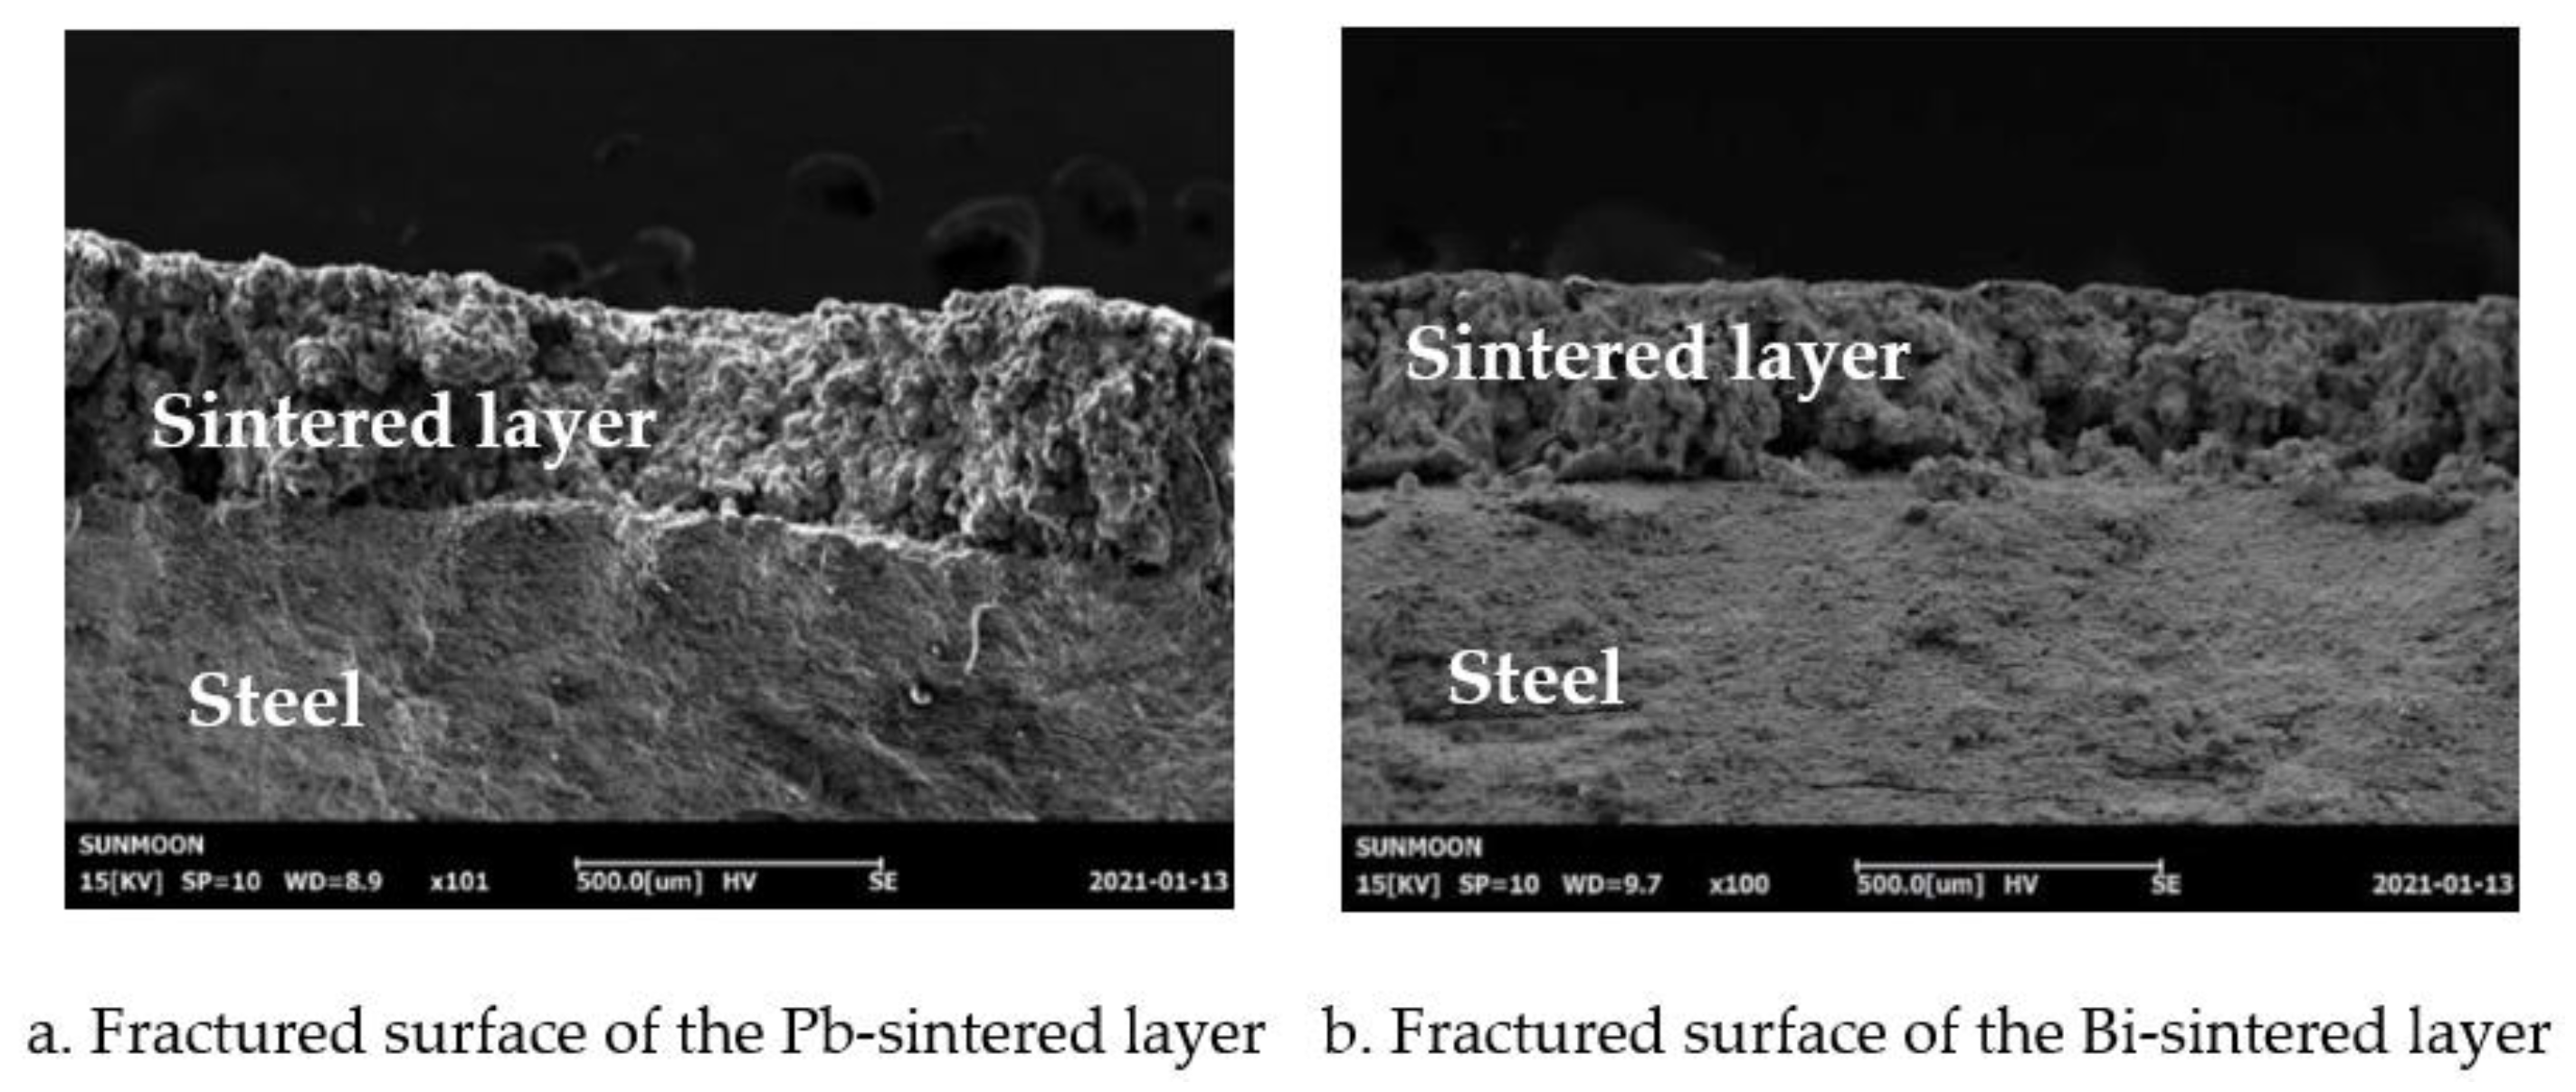
3.3.1. Sintered Surface
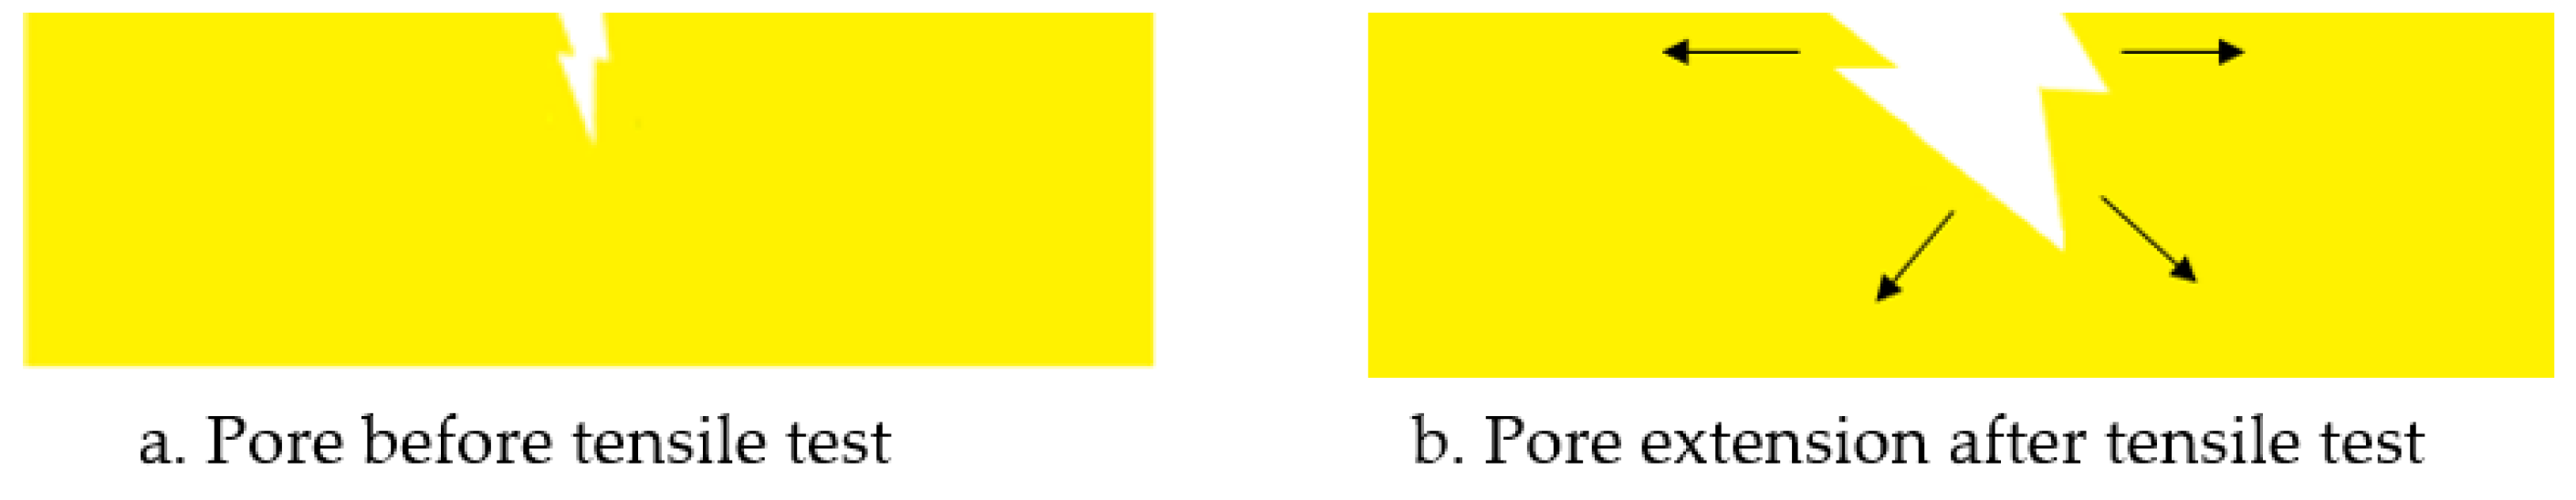
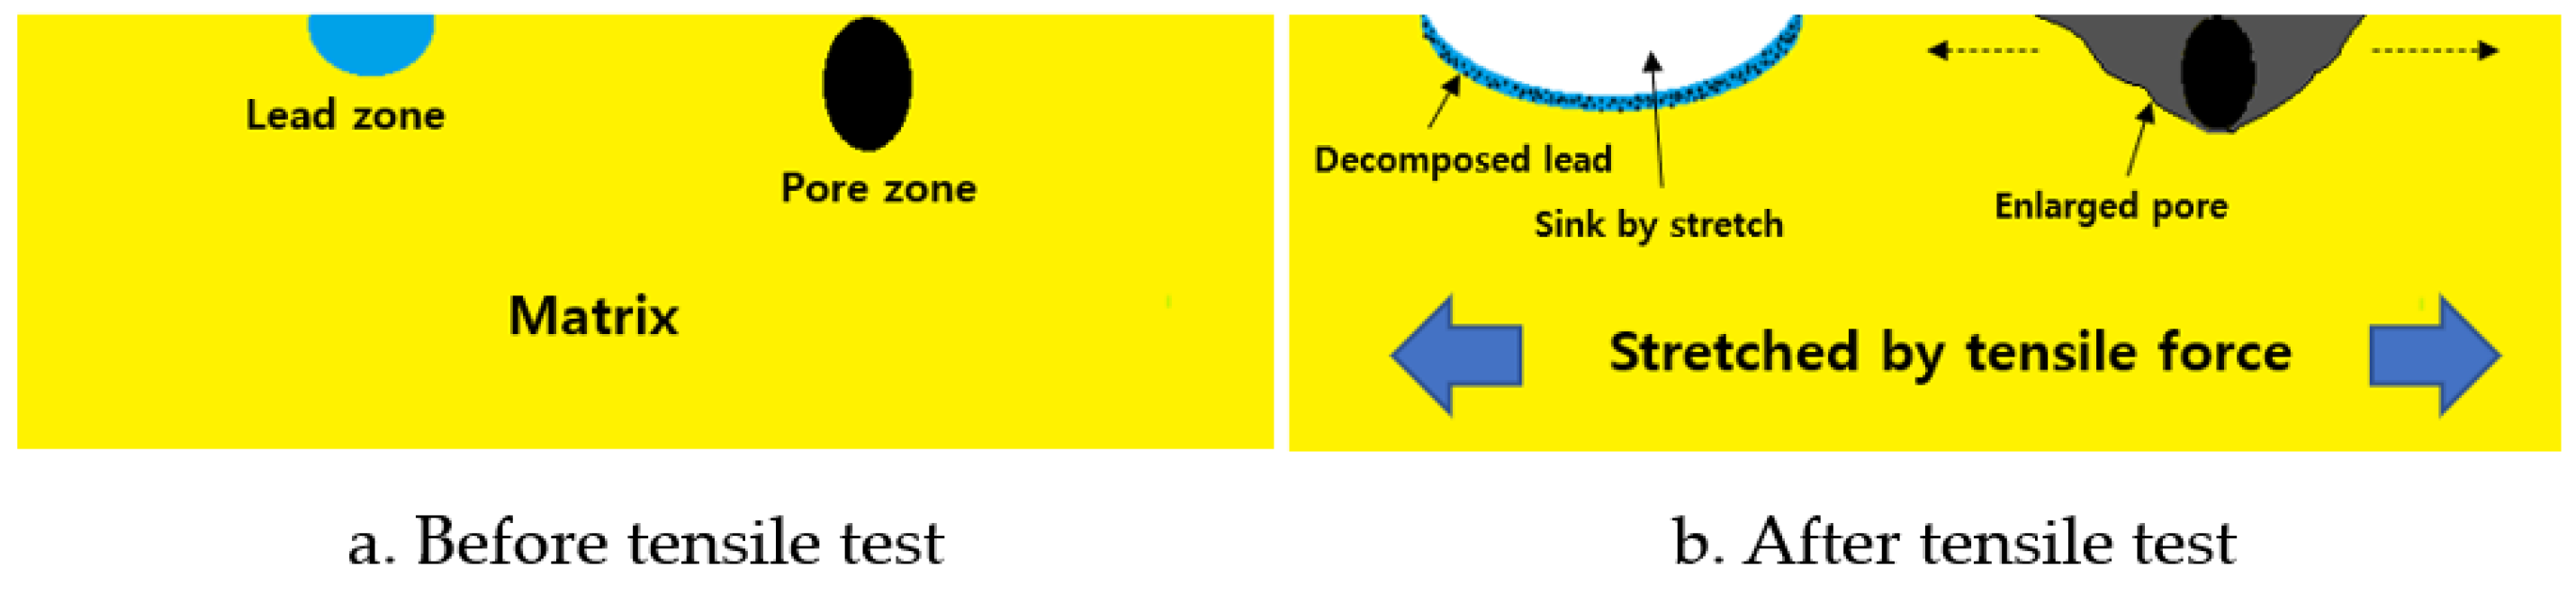
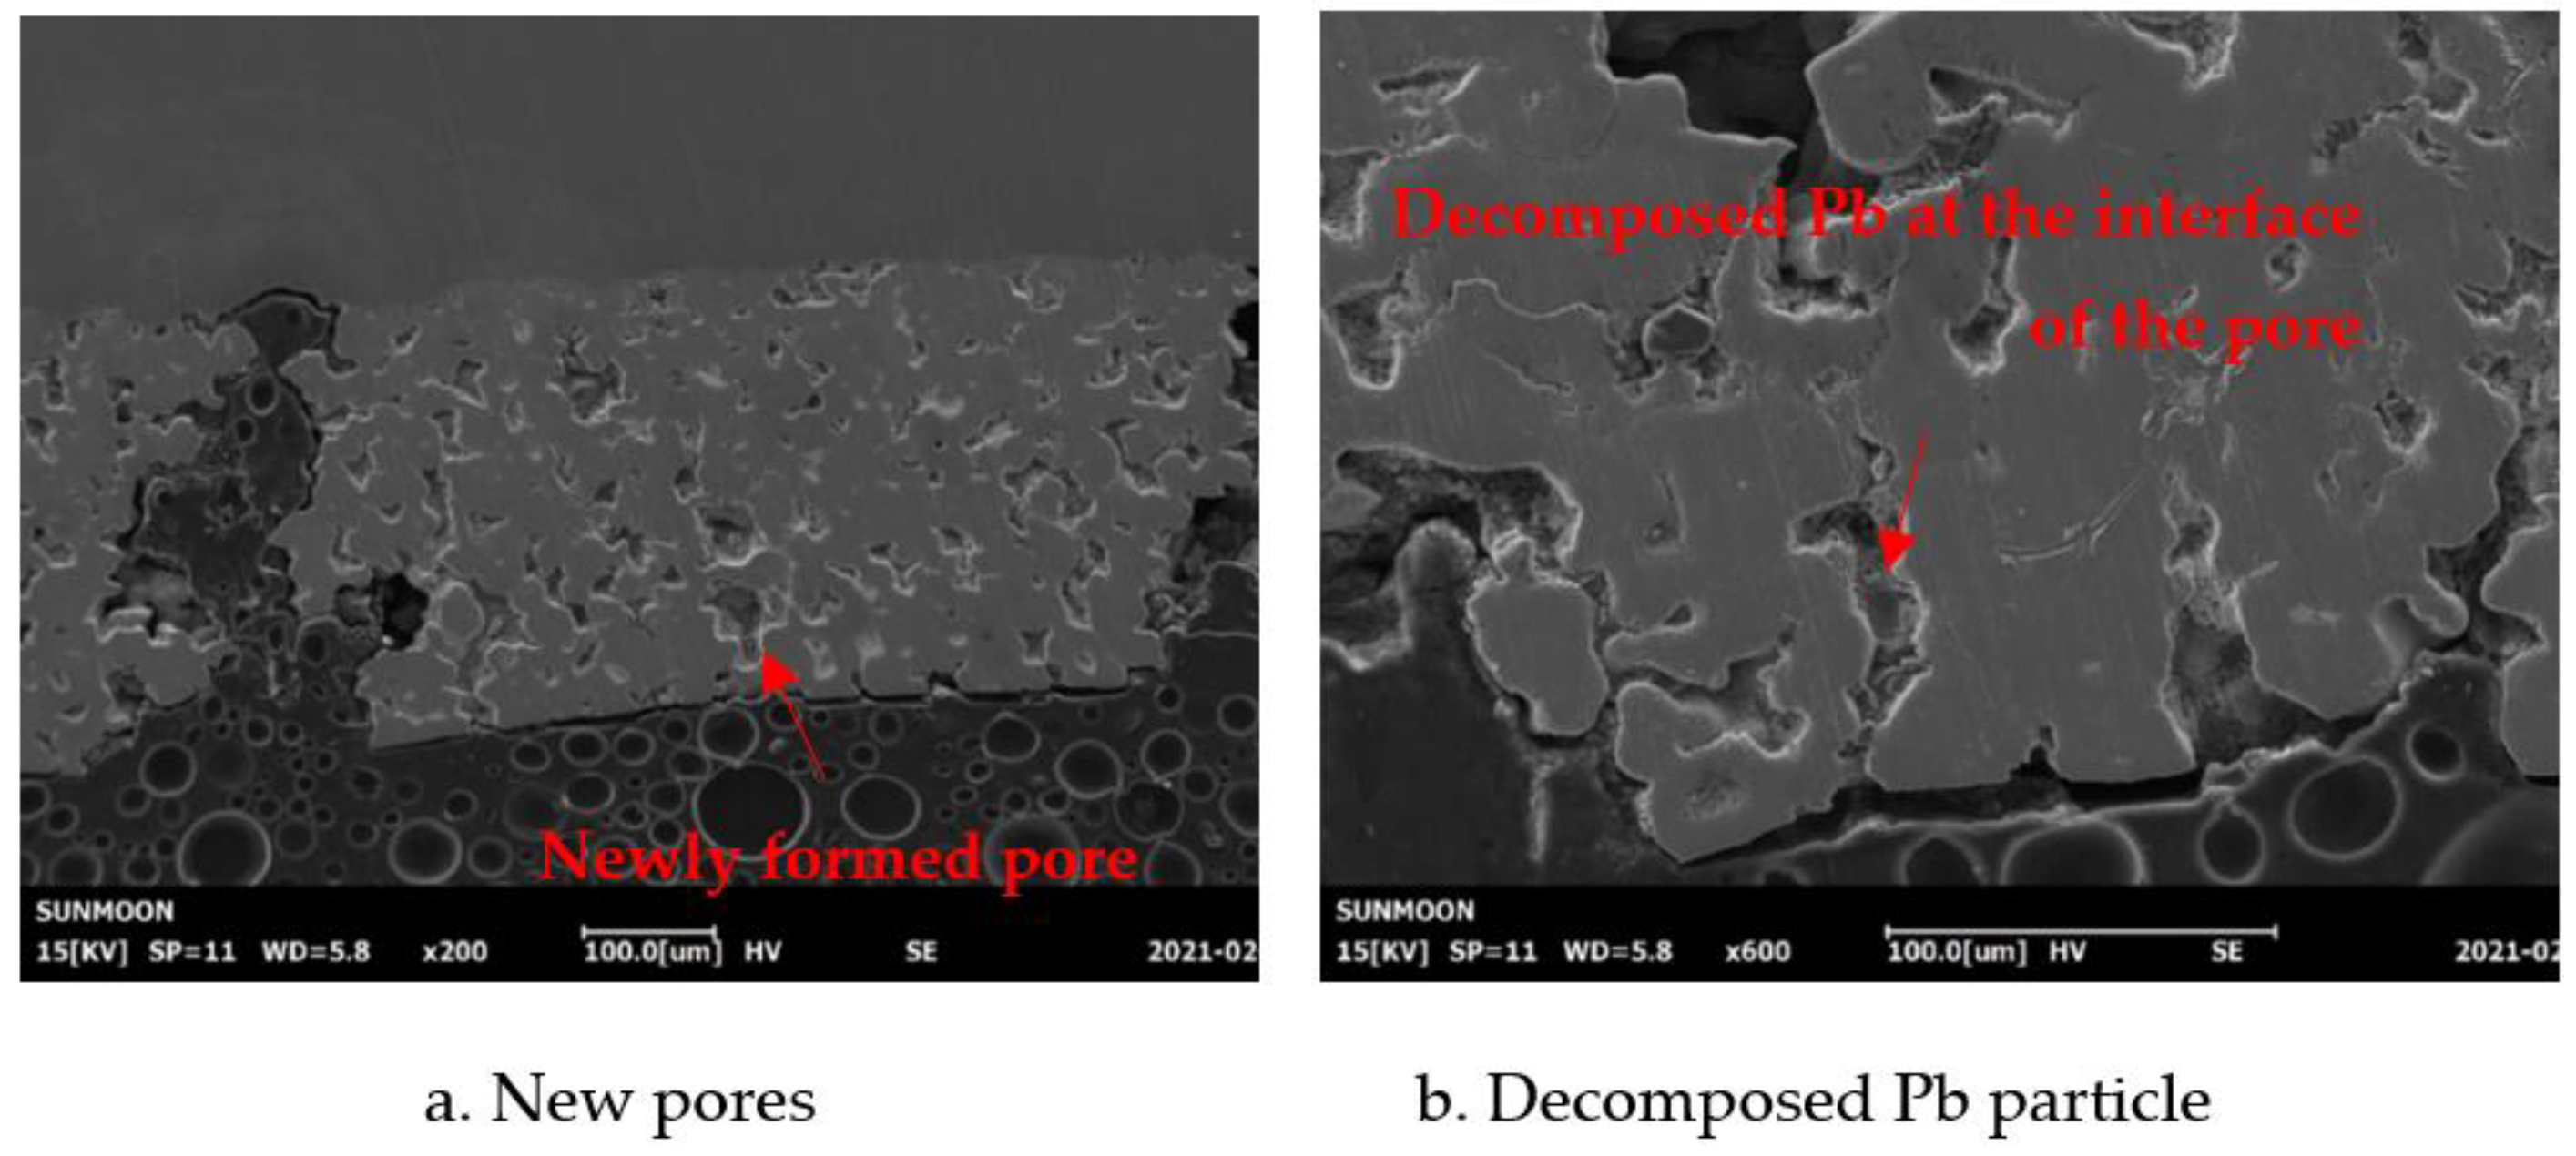
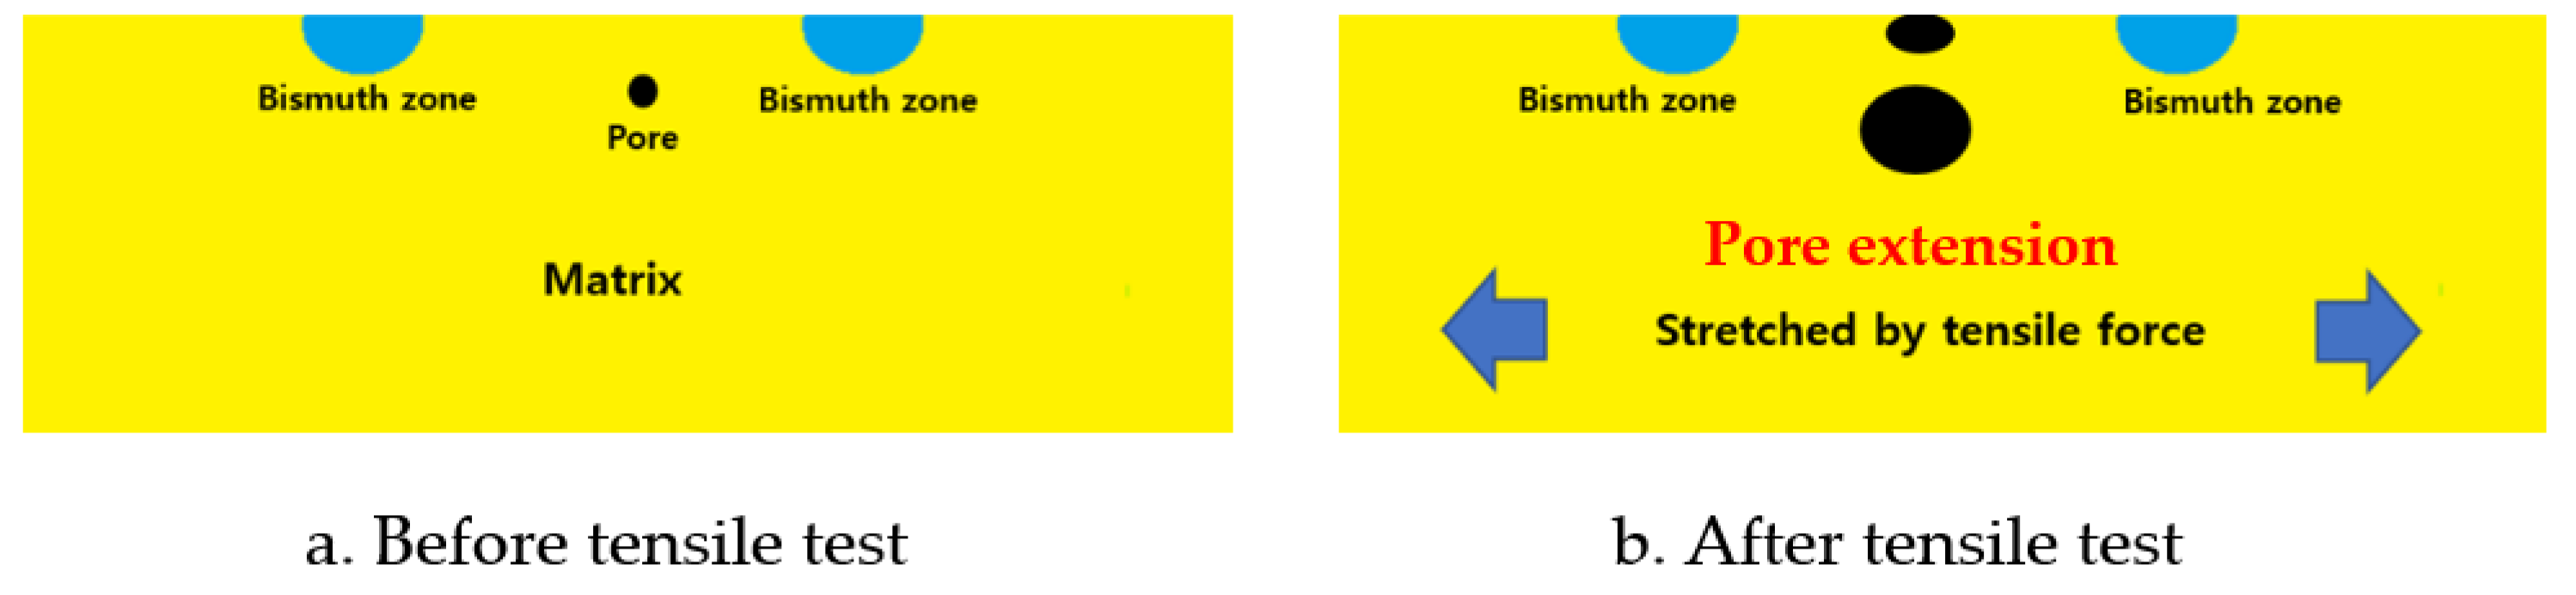
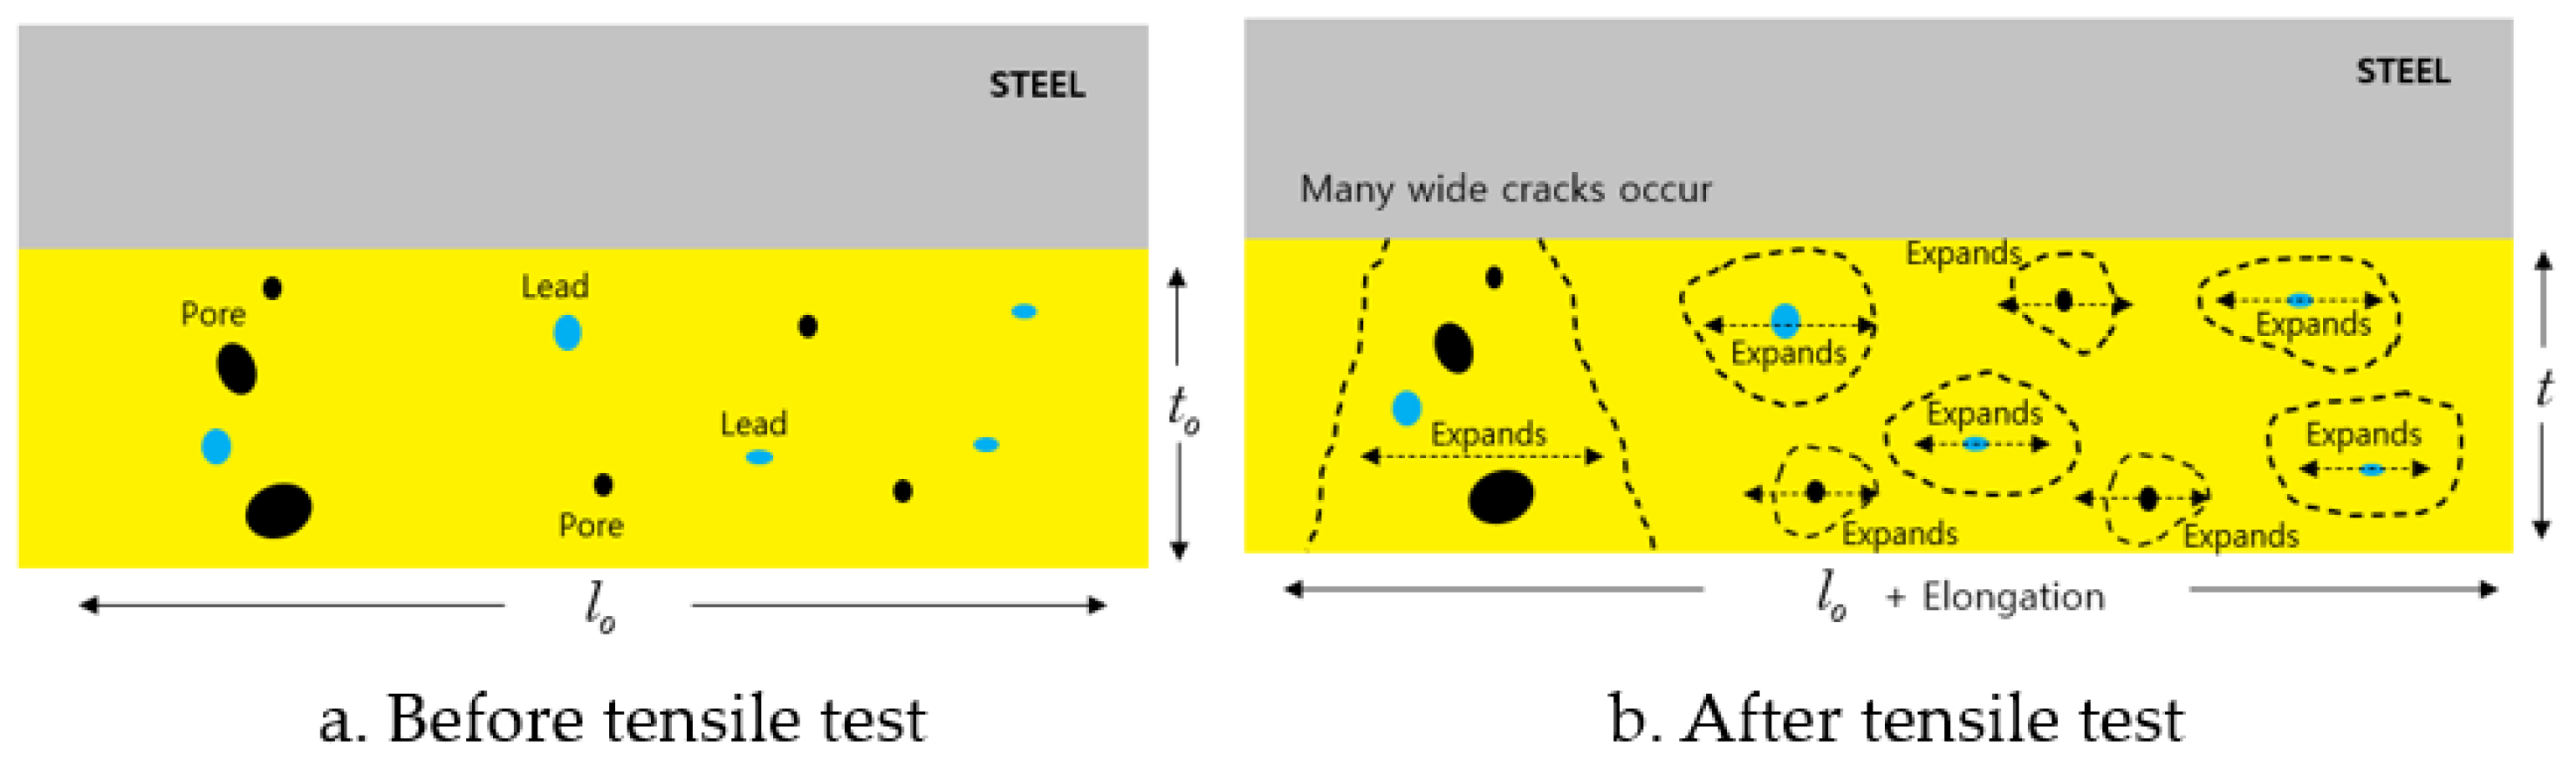
3.3.2. Pore Behavior
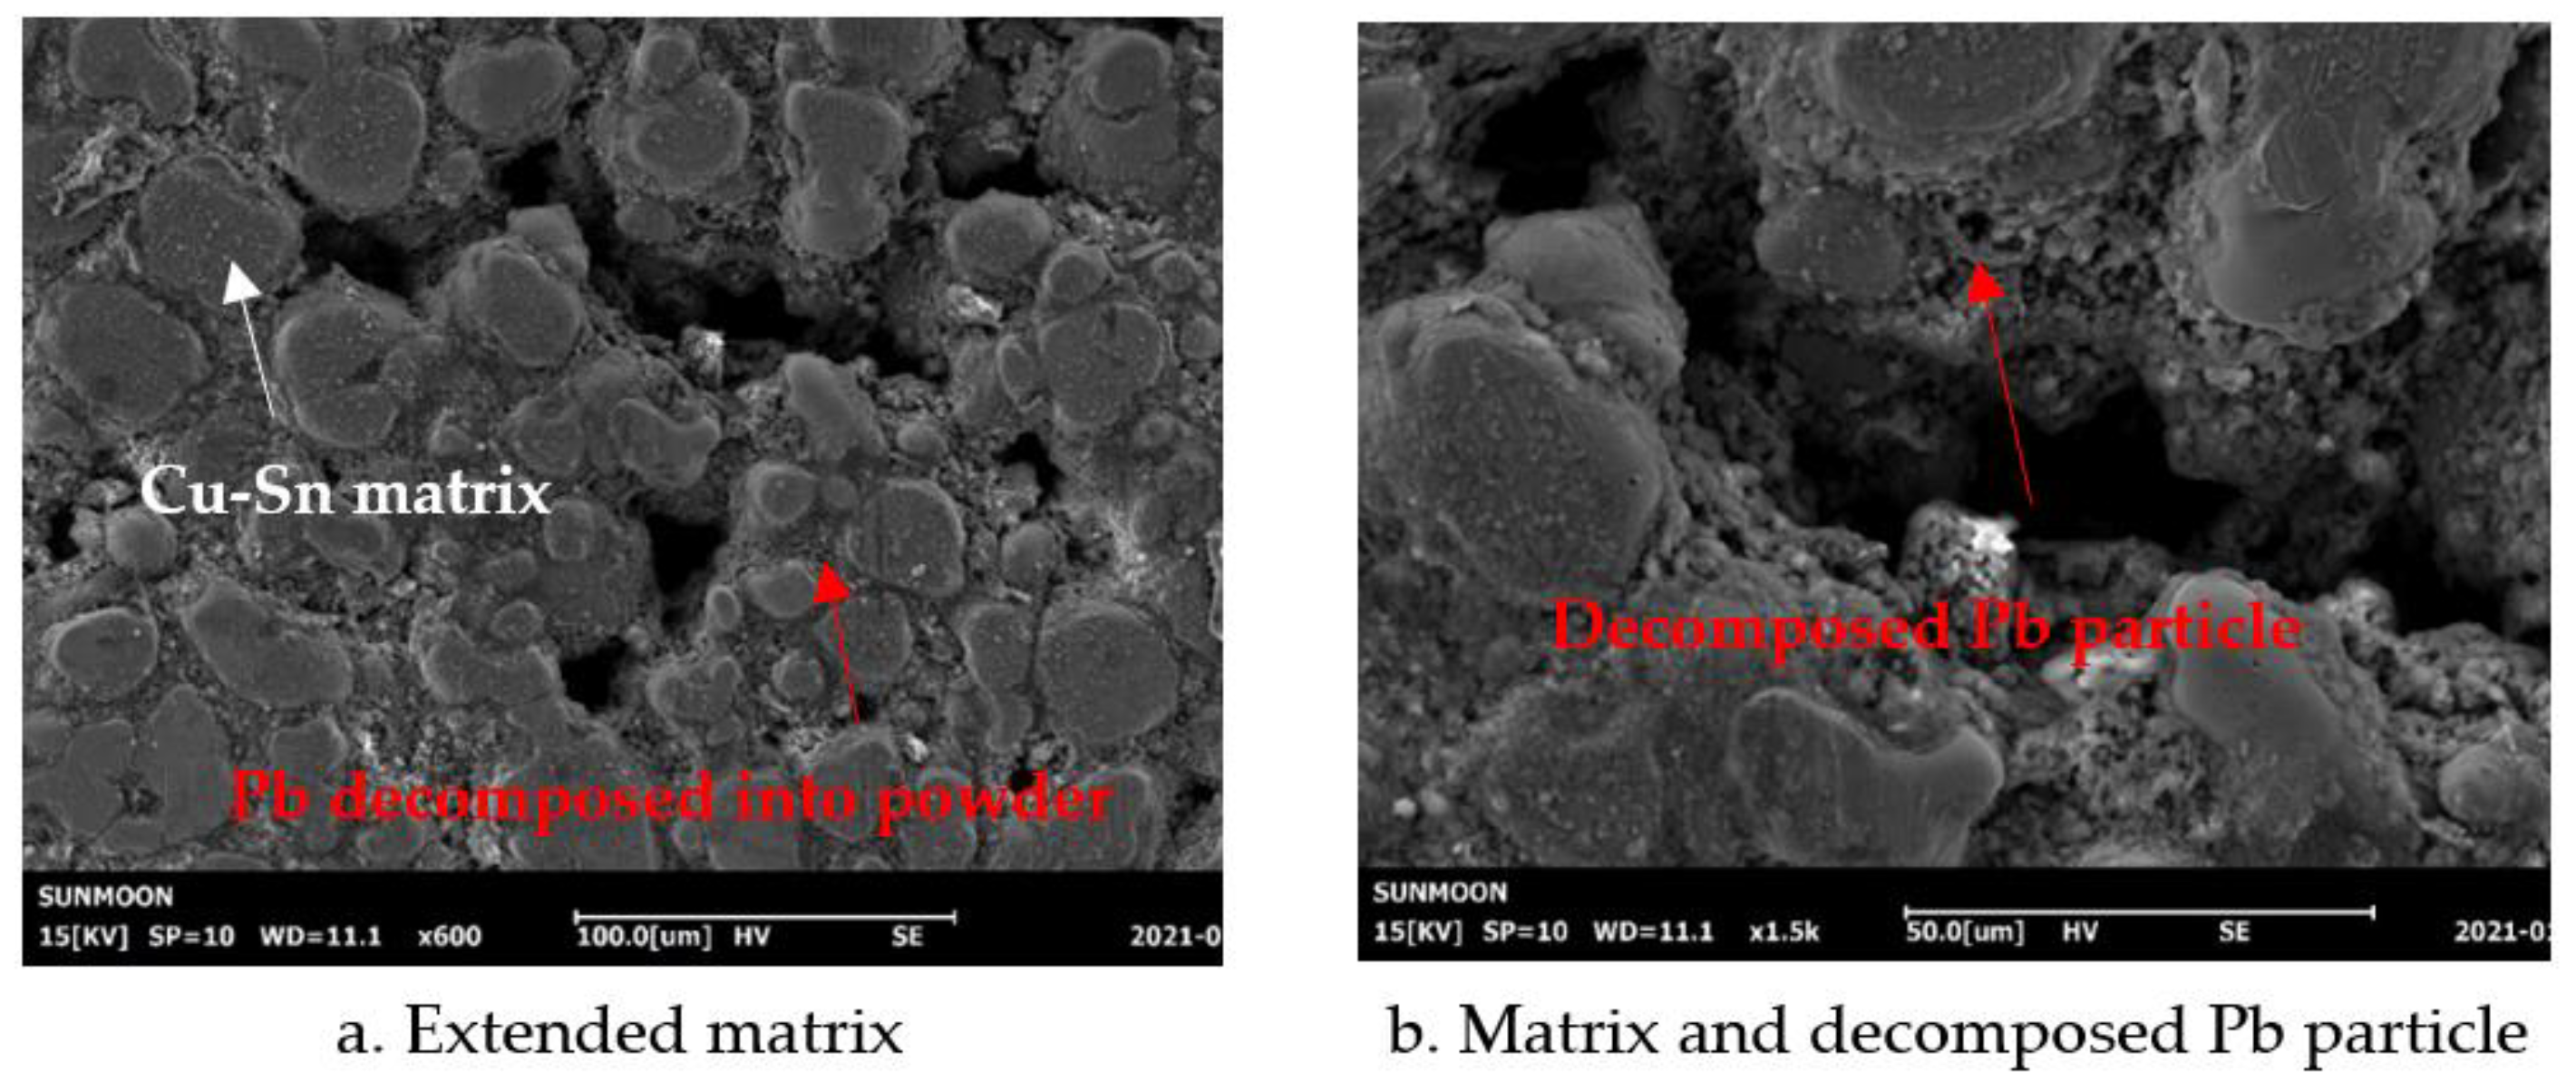
3.4. Alloy Behavior
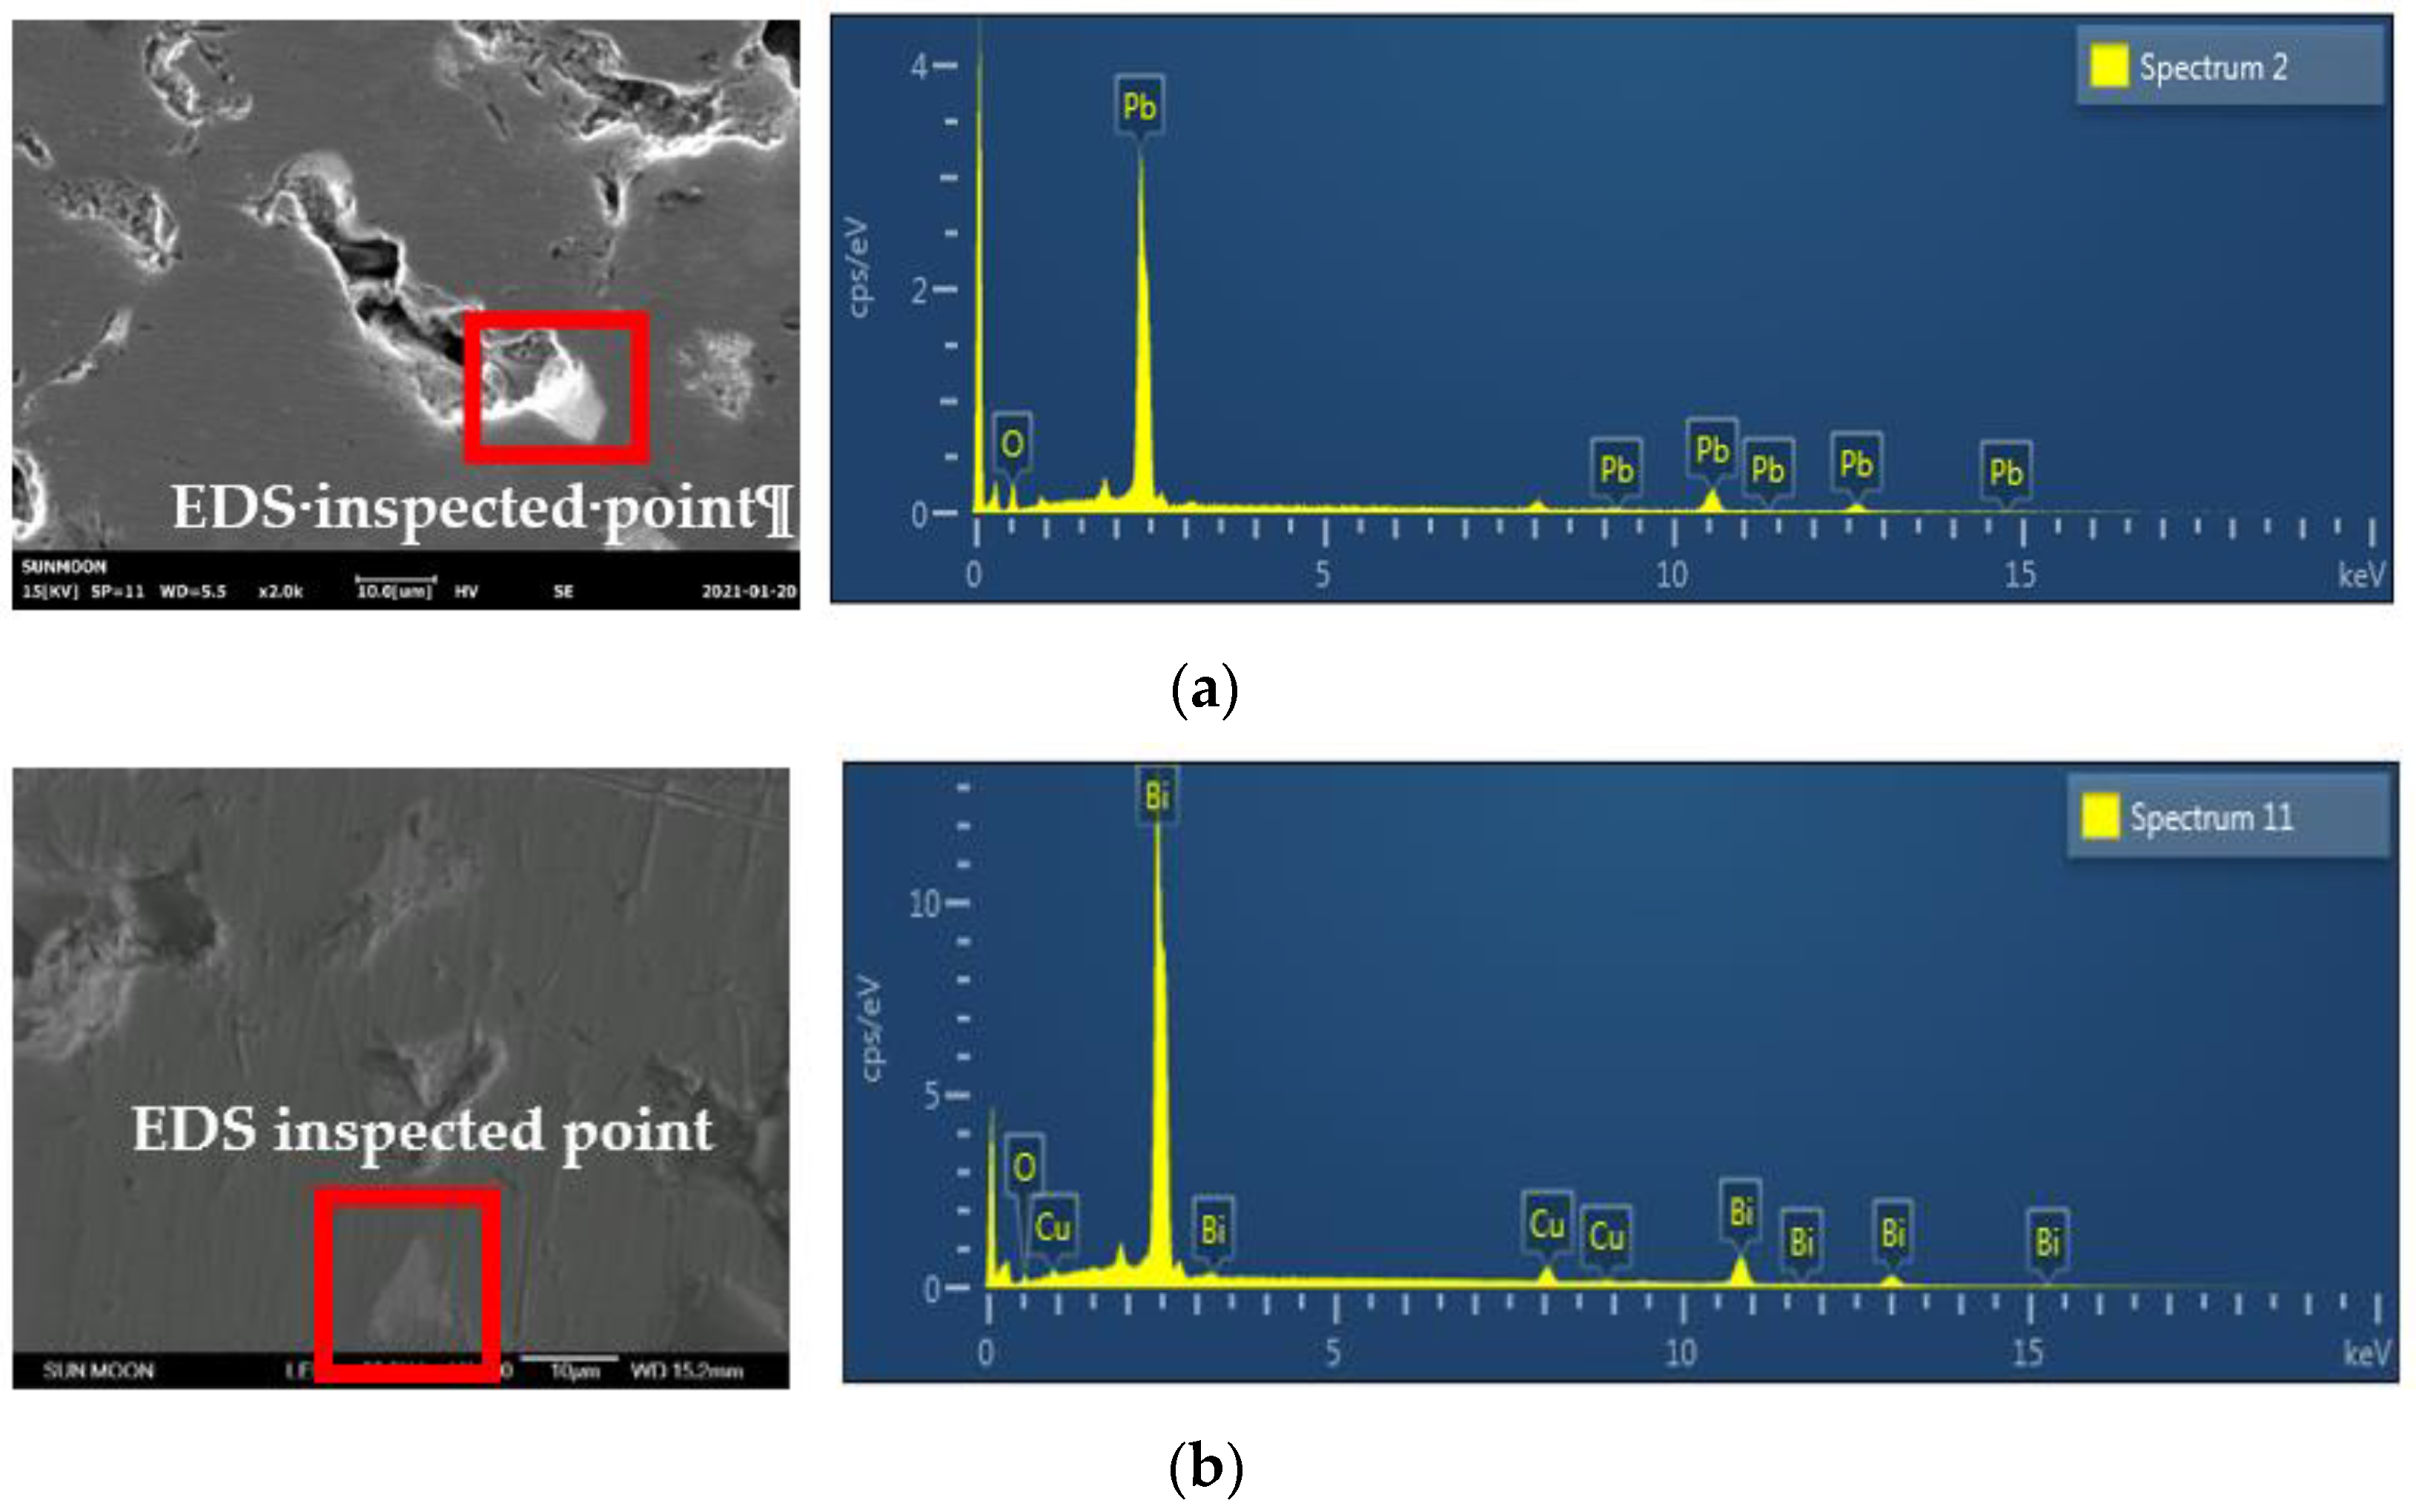
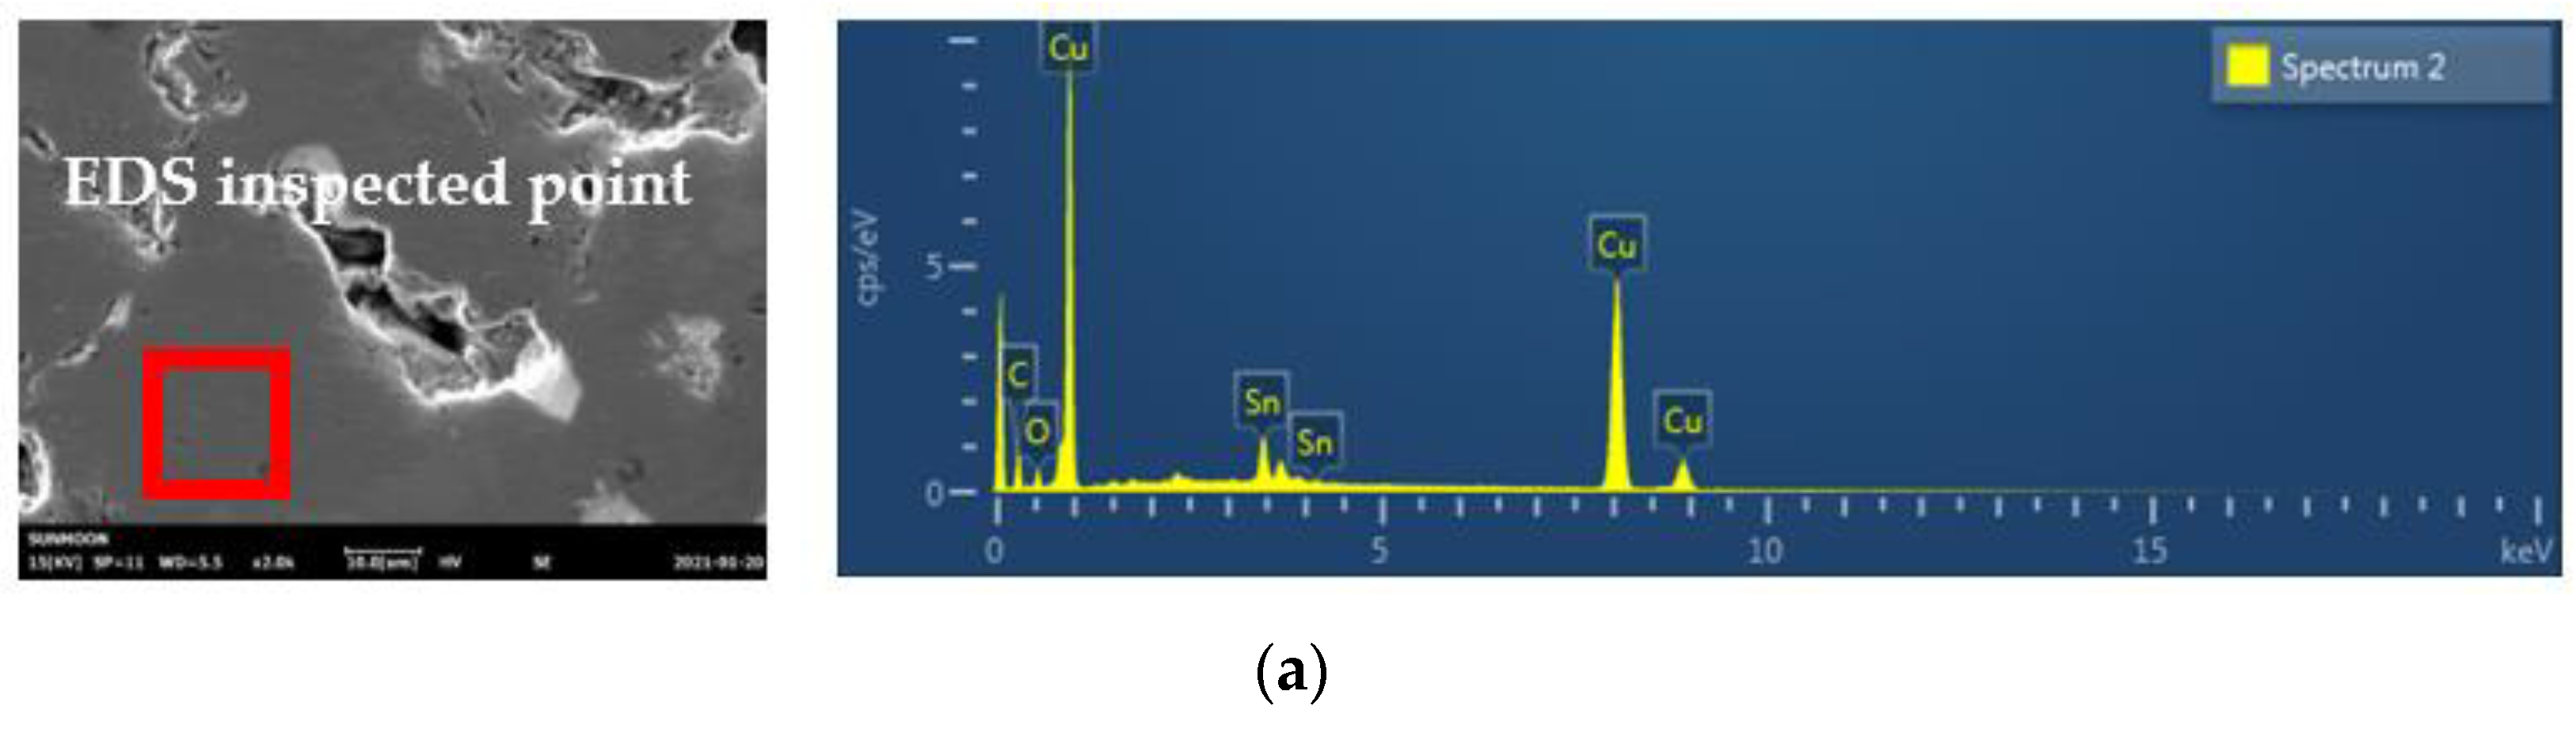
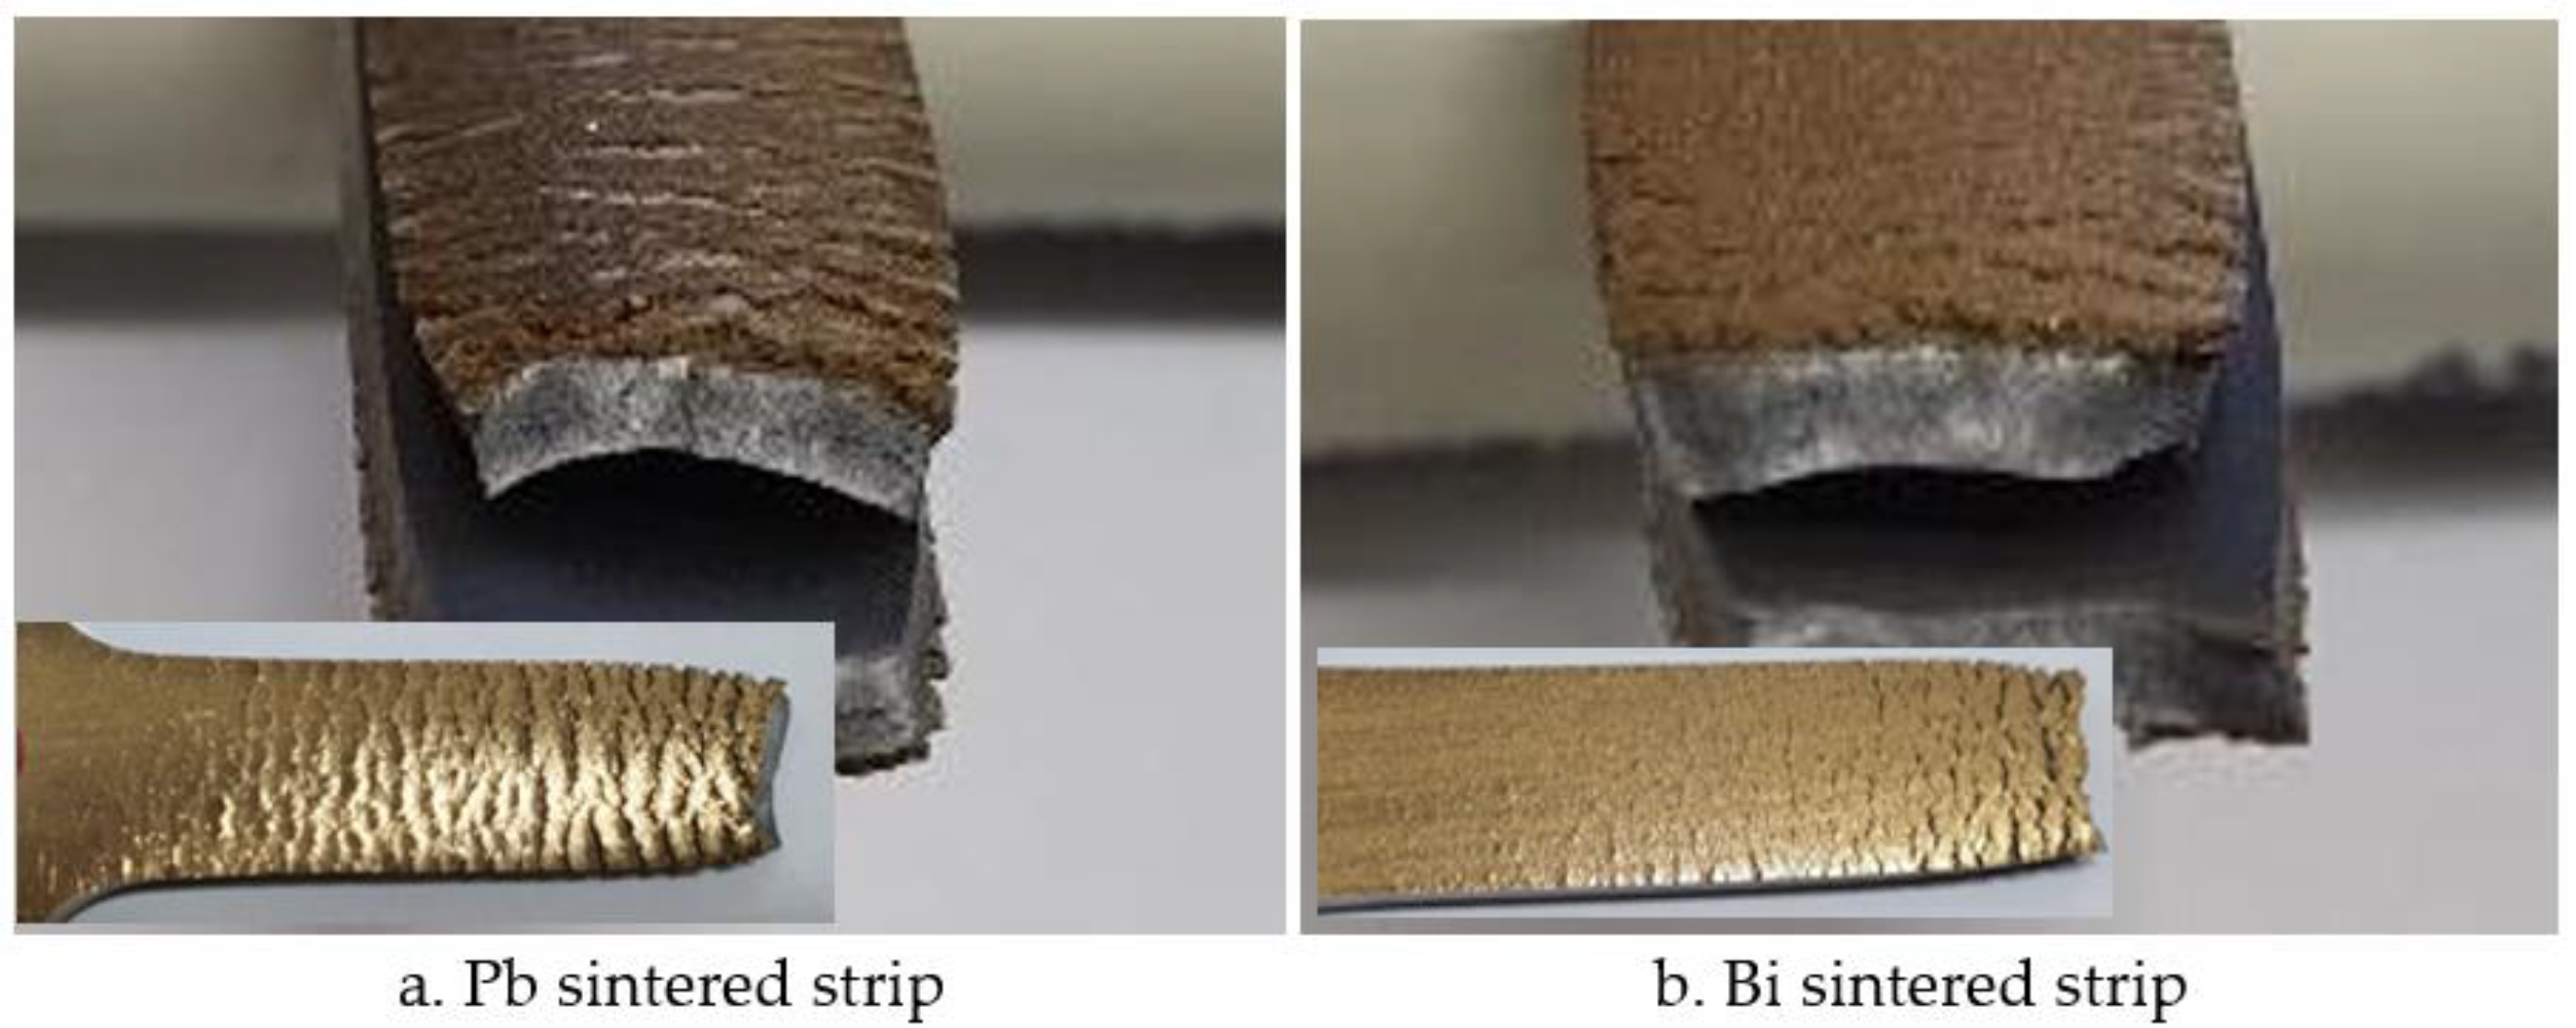
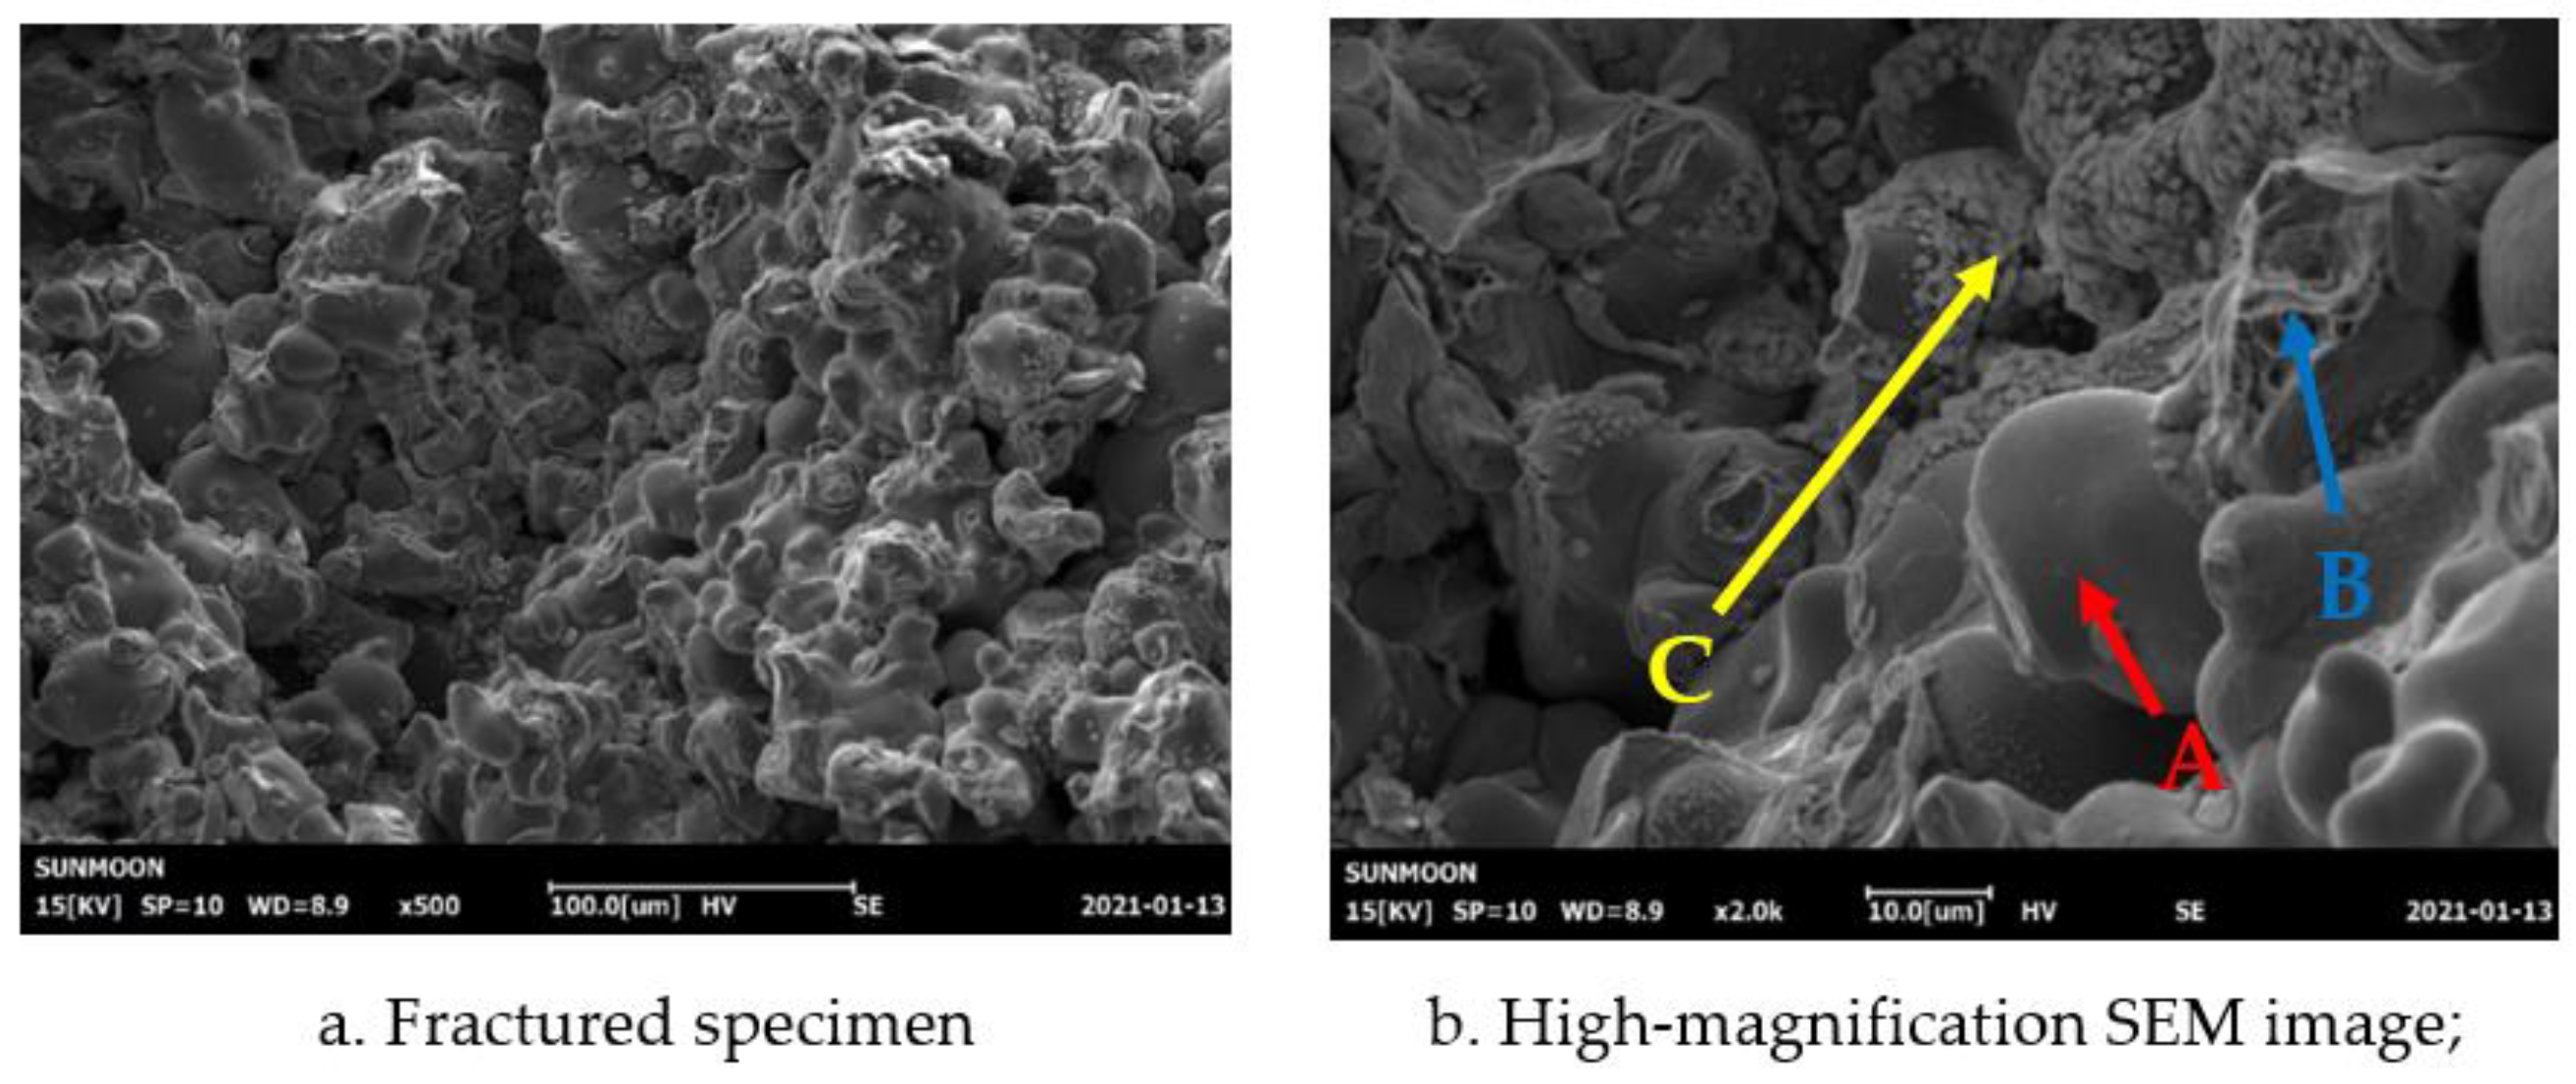
3.4.1. Pb Sintered Layer
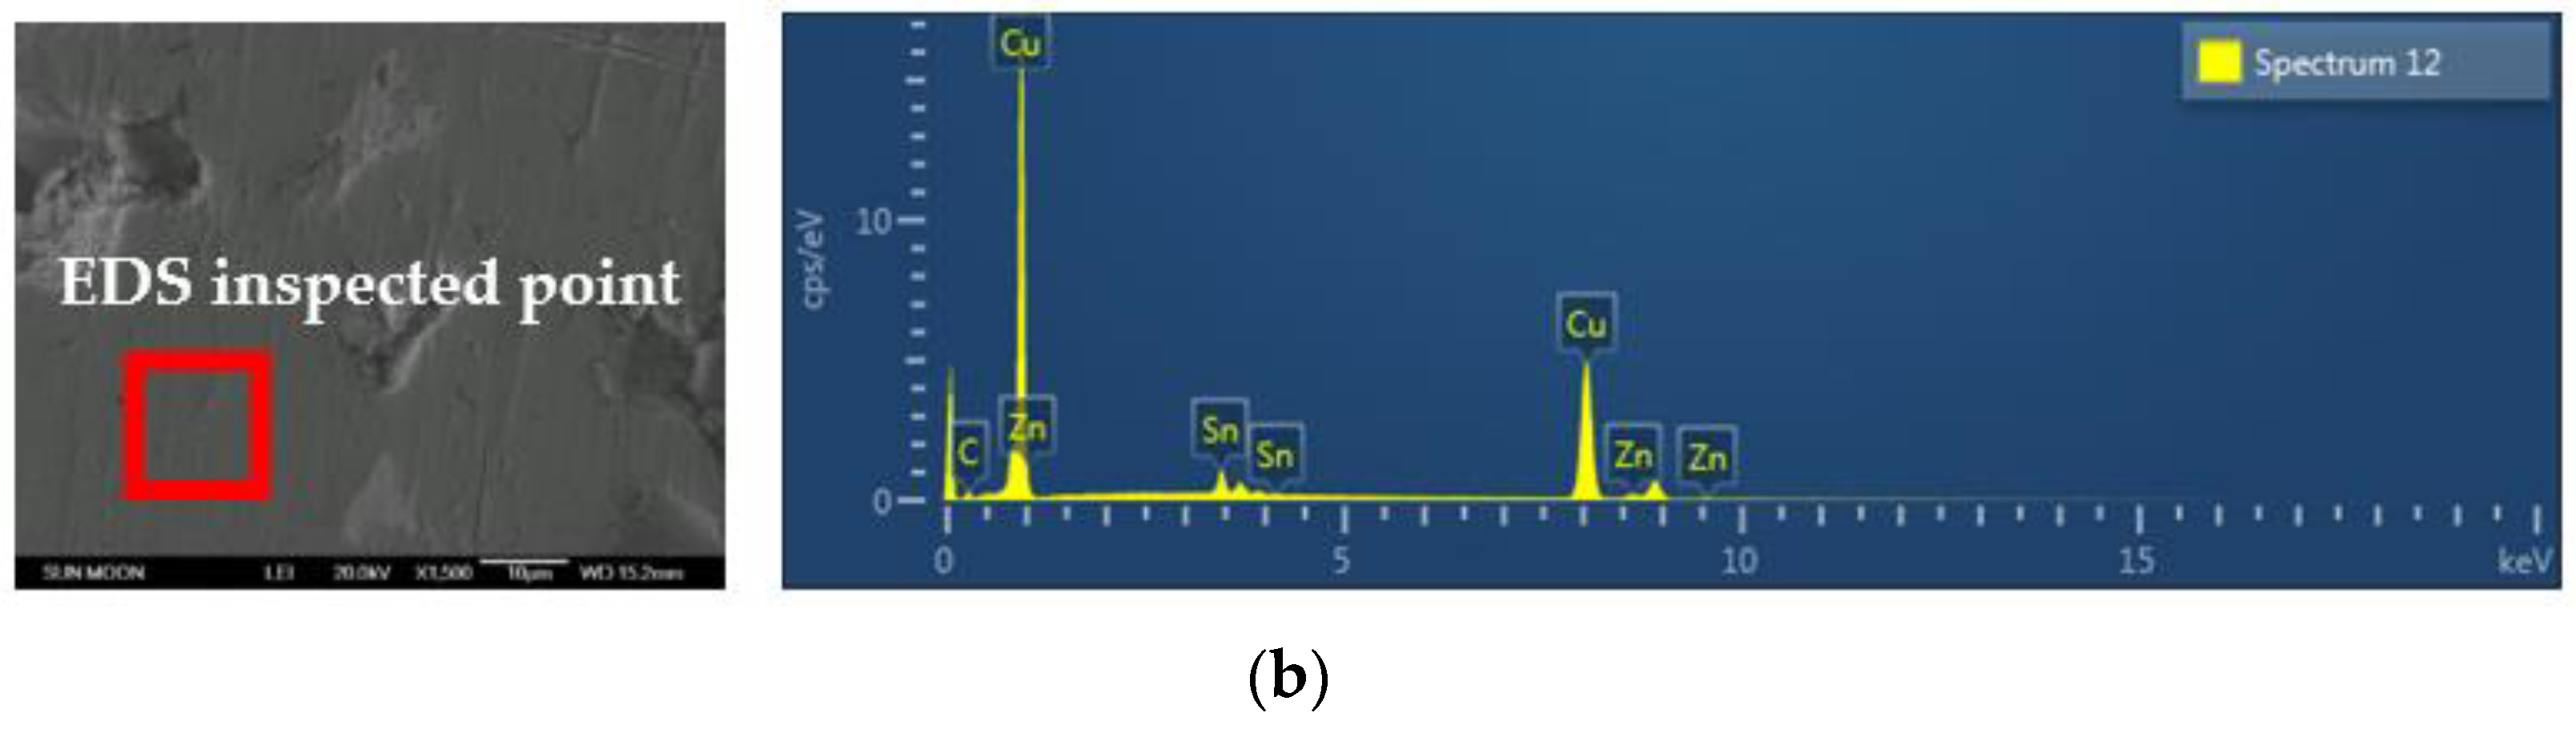
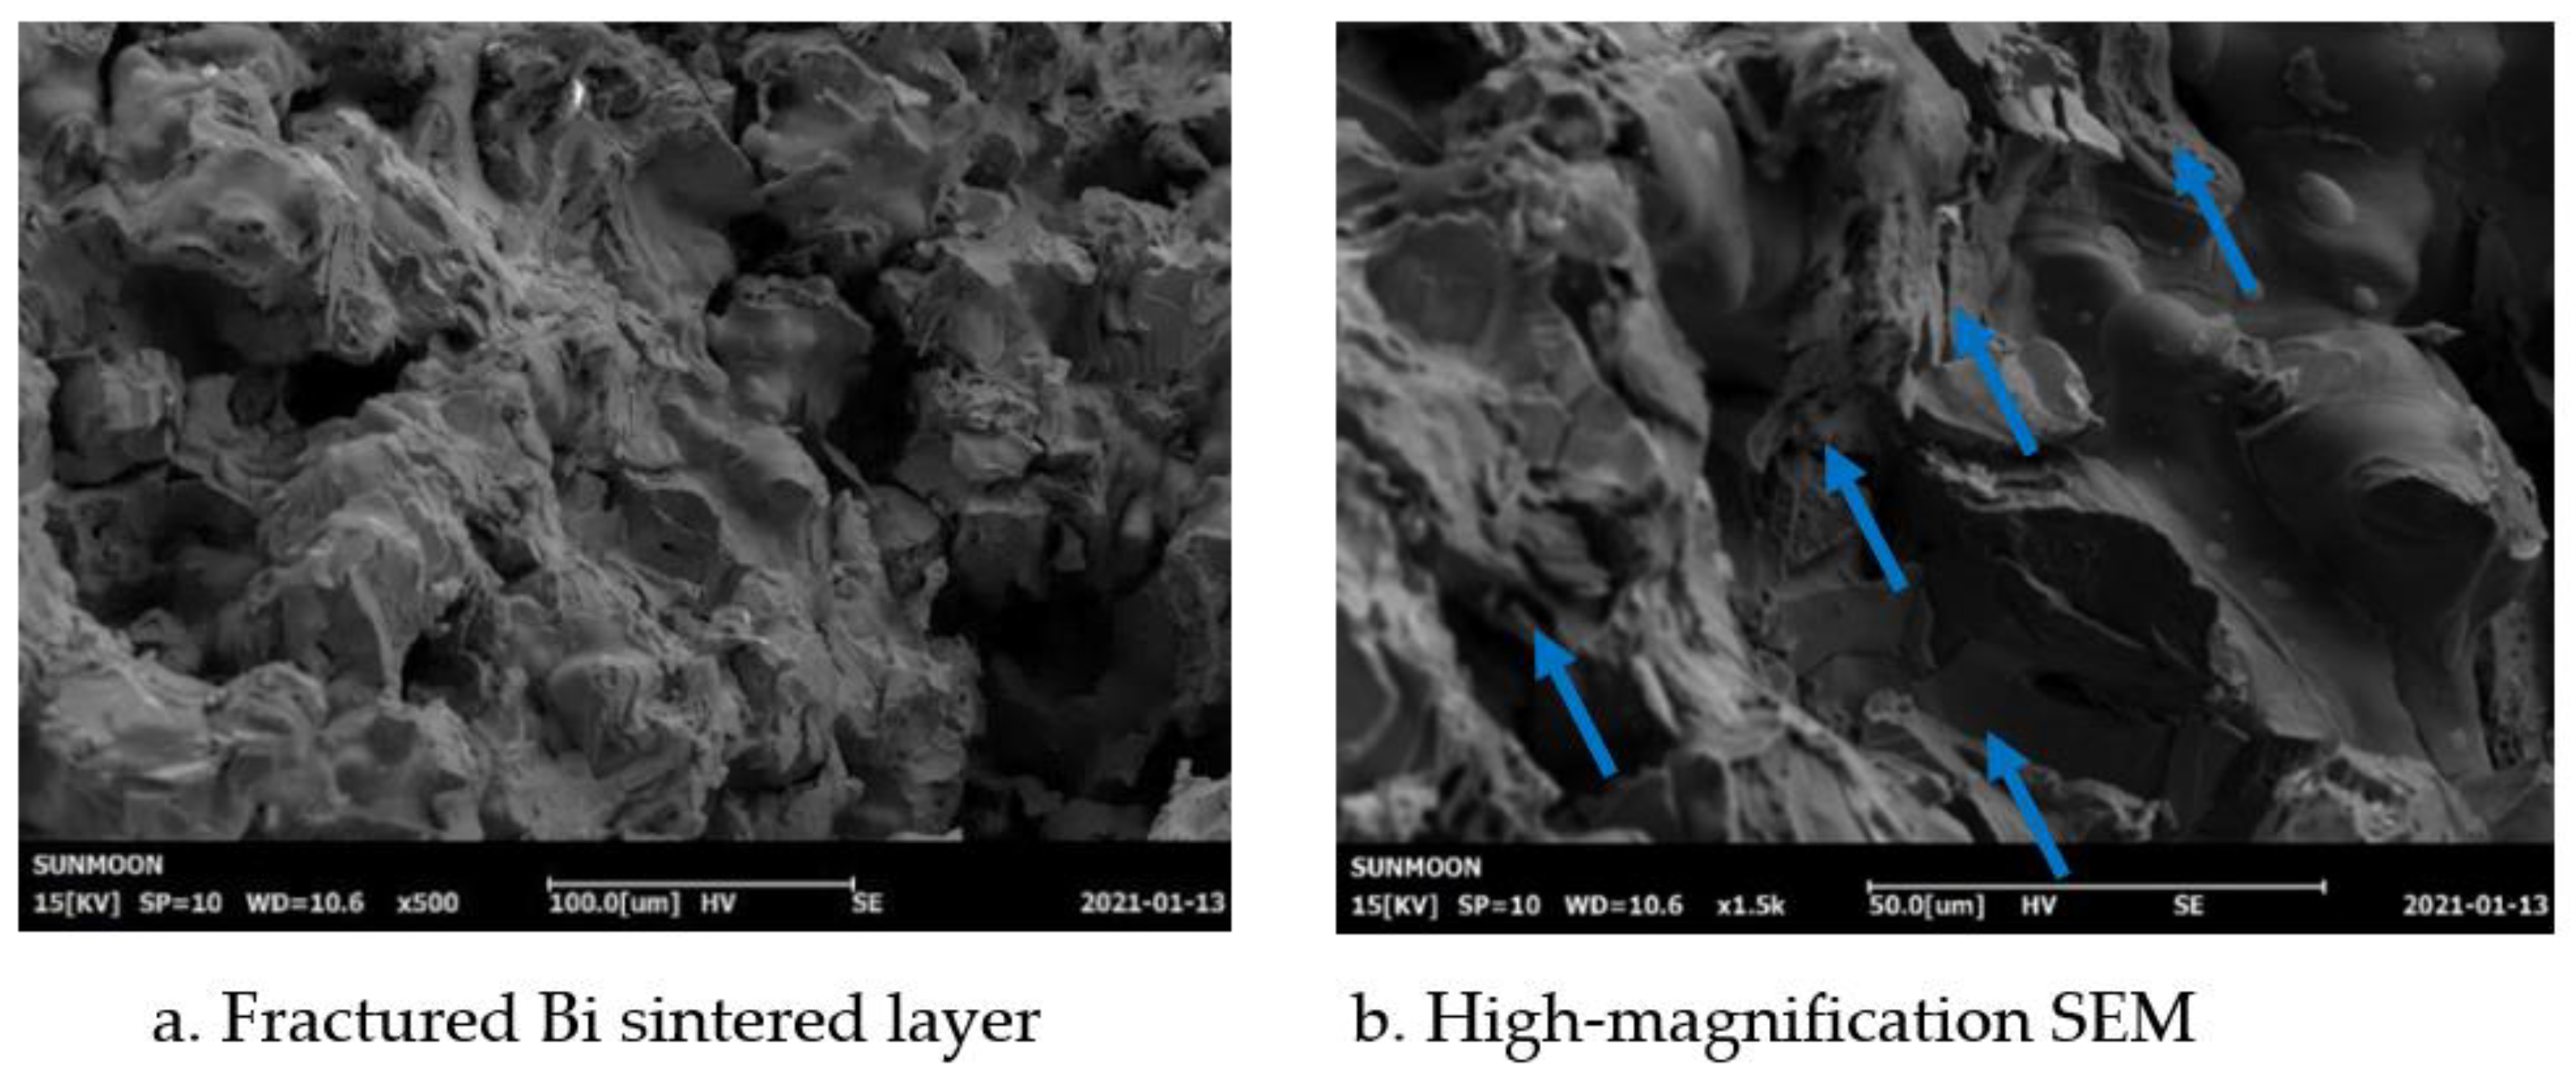
3.4.2. Bi-Sintered Layer
3.4.3. Tension Fracture Surface
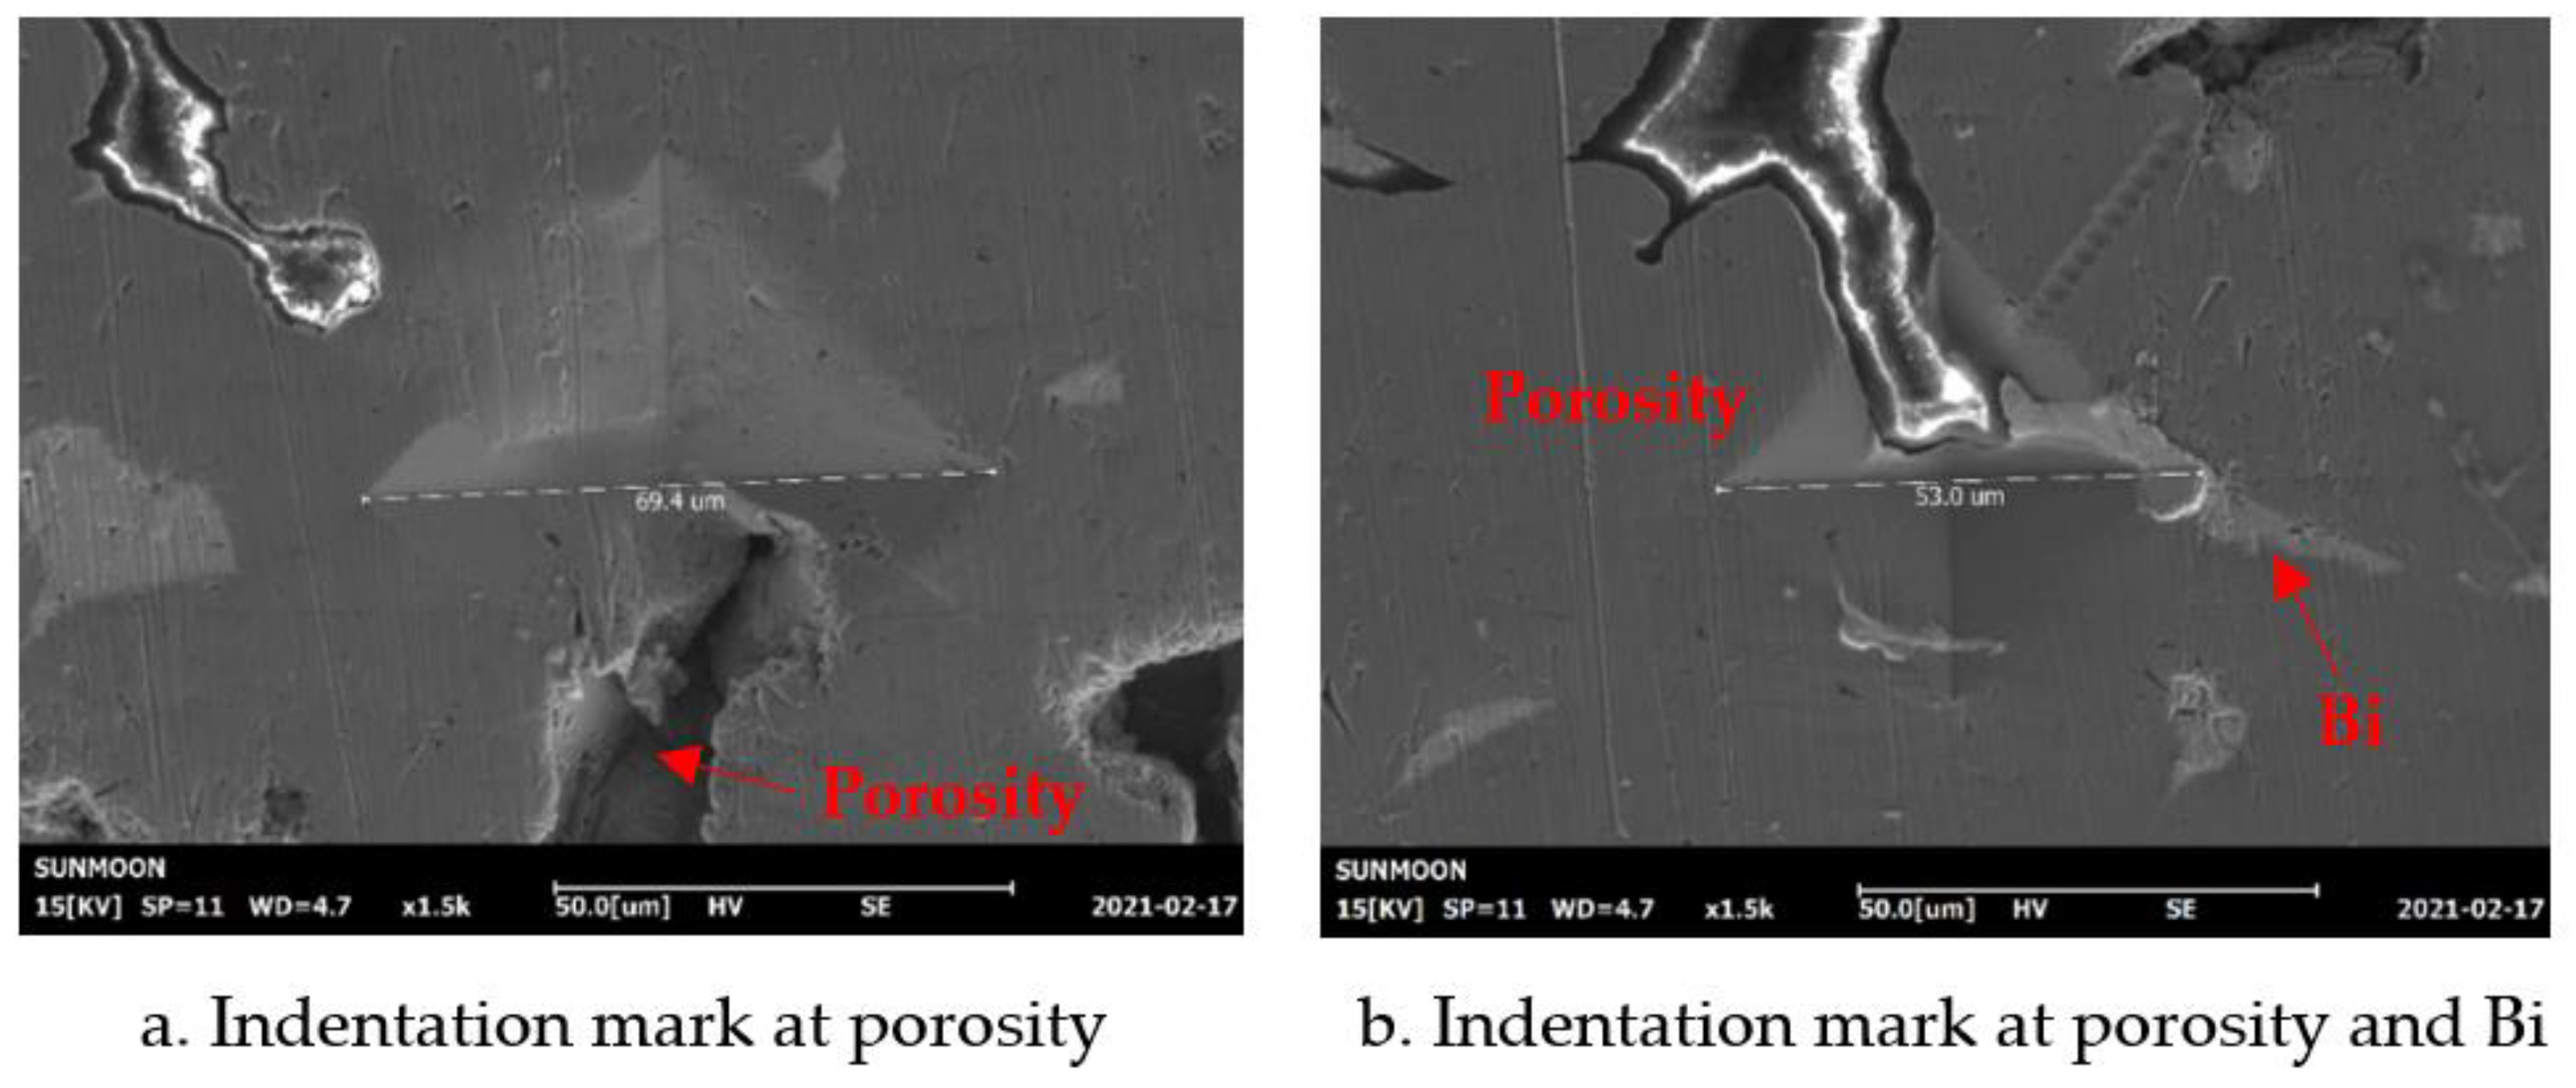
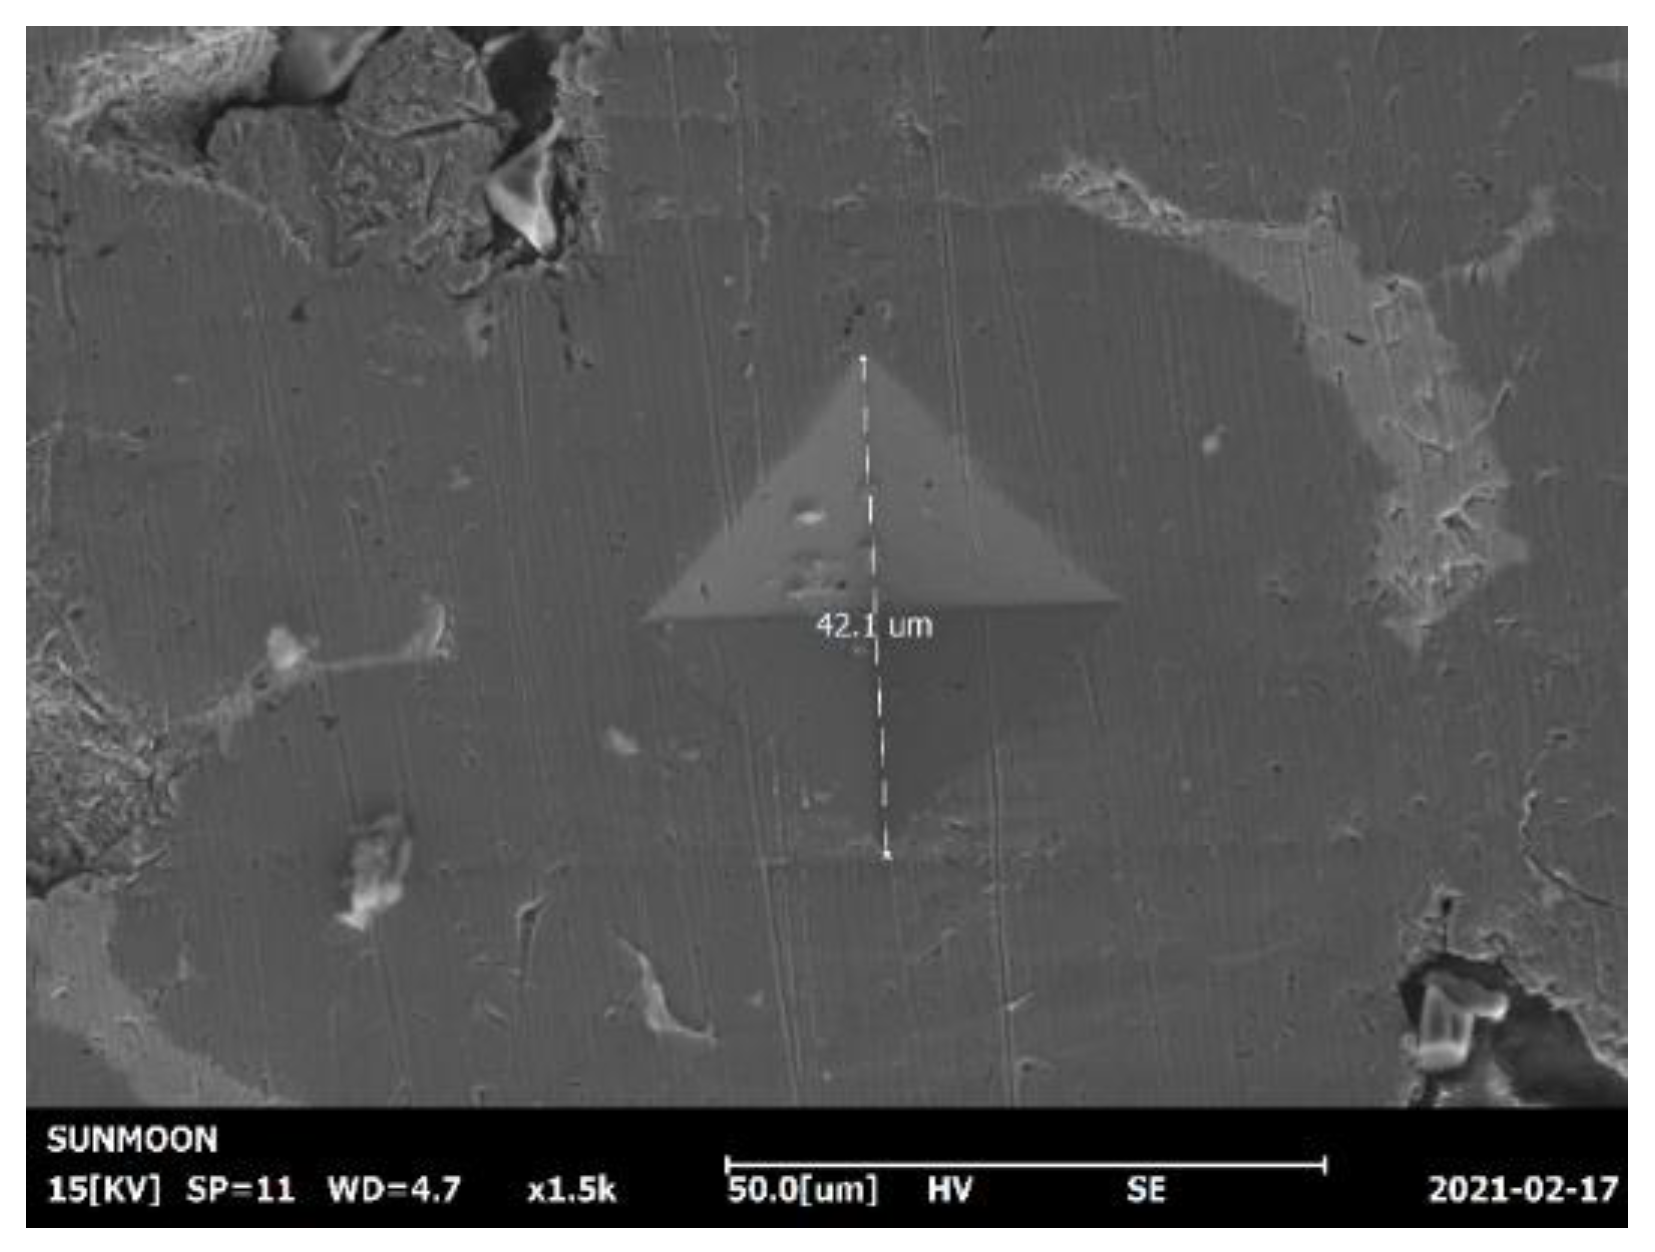
3.4.4. Hardness of the Pb-Sintered Layer
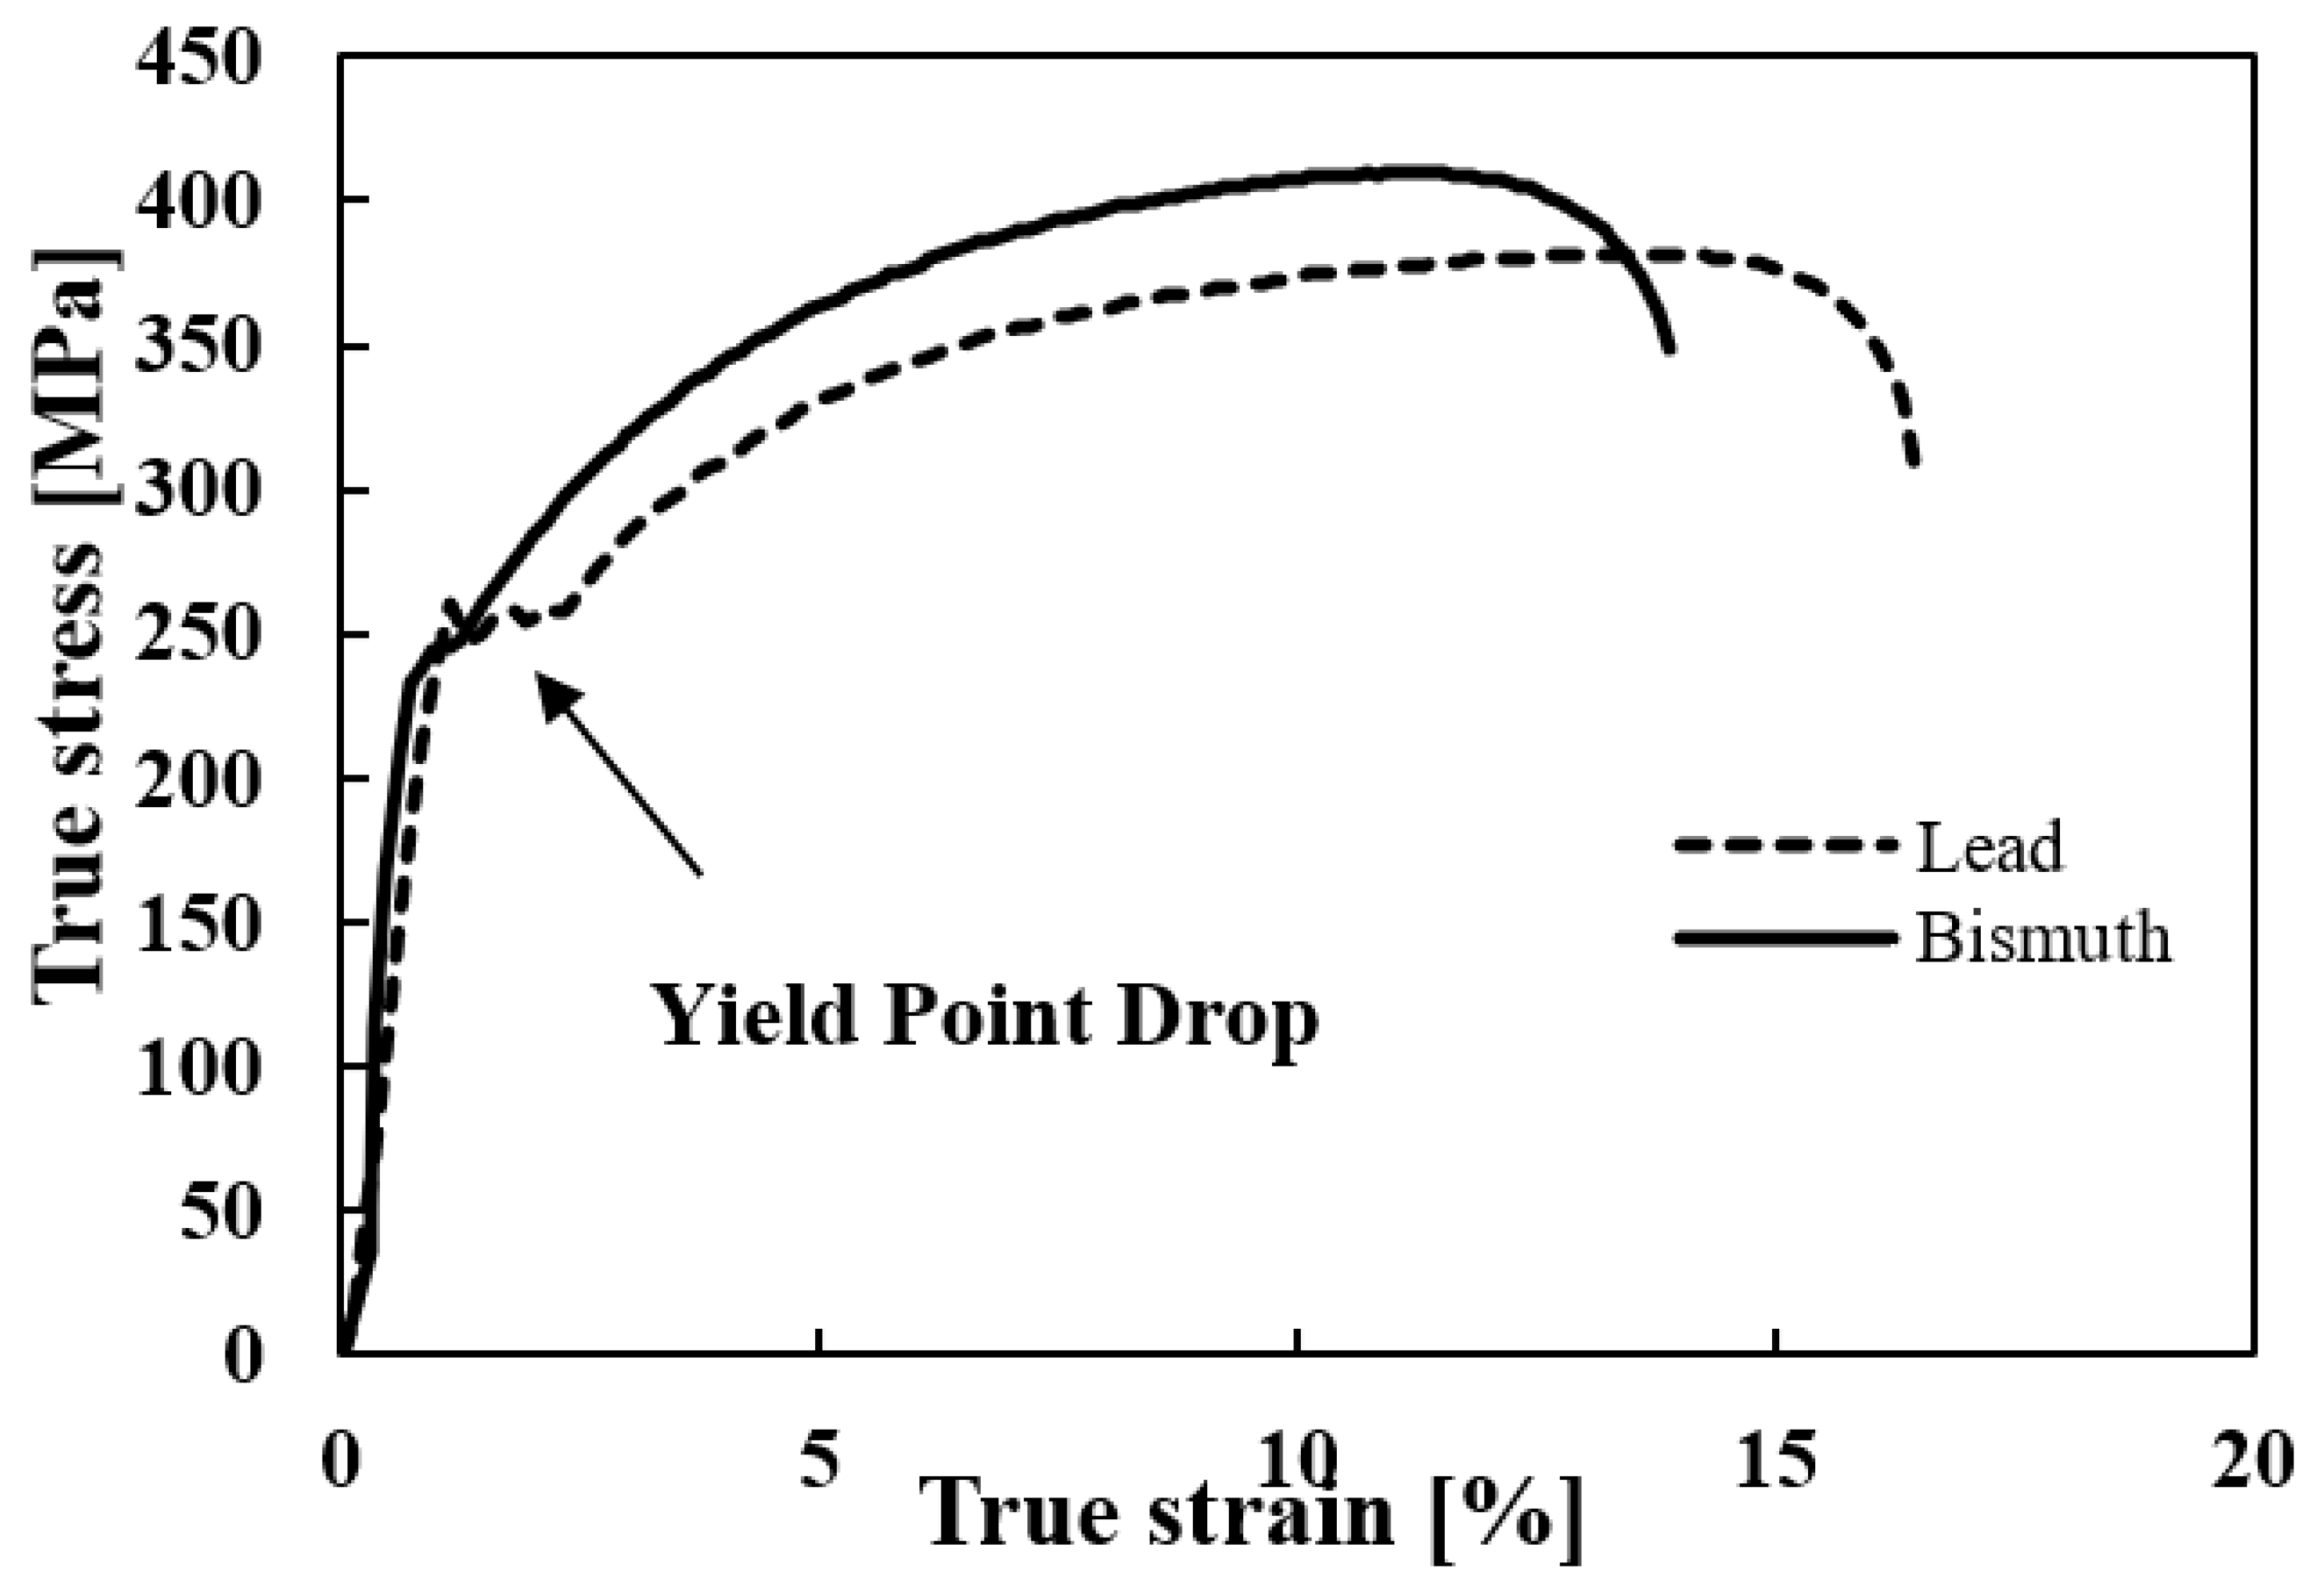
3.4.5. Stress–Strain Curve
4. Conclusions
Author Contributions
Funding
Data Availability Statement
Conflicts of Interest
References
- Waterman, N.A.; Ashy, M.F. The Material Selector; Chapman & Hall: London, UK, 1997; p. 1. [Google Scholar]
- Xiao, J.; Qin, W.; Xu, S. Interference and thickness design of bushing of connecting rod small end for Anti-loosing. Eng. Fail. Anal. 2021, 127, 105556. [Google Scholar] [CrossRef]
- Totten, G.E. Friction, Lubrication, and Wear Technology. In ASM Handbook; ASM International: Novelty, OH, USA, 2017; p. 18. [Google Scholar]
- Davis, J.R. Copper and Copper Alloys-Properties of Cast Copper Alloys. In ASM Specialty Handbook; ASM International: Novelty, OH, USA, 2001; p. 7. [Google Scholar]
- Lee, P.W.; Trudel, Y.; Lacocca, R.; German, R.; Ferguson, B.; Eisen, W.; Moyer, K.; Madan, D.; Sanderow, H. Powder Metal Technologies and Applications-Copper Powder Metallurgy Alloys and Composites. In ASM Handbook; ASM International: Novelty, OH, USA, 1998; p. 7. [Google Scholar]
- Prasad, B.K. Sliding wear behavior of bronzes under varying material composition, microstructure and test conditions. Wear 2004, 257, 110–123. [Google Scholar] [CrossRef]
- Gebretsadik, D.W.; Hardell, J.; Prakash, B. Friction and wear characteristics of different Pb-free bearing materials in mixed and boundary lubrication regimes. Wear 2015, 340–341, 63–72. [Google Scholar] [CrossRef] [Green Version]
- Wollmann, T.; Nitschke, S.; Klauke, T.; Behnisch, T.; Ebert, C.; Füßel, R.; Modler, N.; Gude, M. Investigating the friction, wear and damage behaviour of plain bearing bushes of the variable stator vane system. Tribol. Int. 2022, 165, 107280. [Google Scholar] [CrossRef]
- Aravind, T.V.; Arul, S. Effect of deep cryogenic treatment on C93700 bearing bush material used in submersible pumps. Mater. Today Proc. 2021, 46, 4685–4690. [Google Scholar] [CrossRef]
- Rodichev, A.; Novikov, A.; Gorin, A.; Tokmakova, M. Analysis of the wear resistance of a hard anti-friction coating, applied to a plain bearing, under the conditions of boundary friction. Transp. Res. Procedia 2021, 57, 573–580. [Google Scholar] [CrossRef]
- Equey, S.; Houriet, A.; Mischler, S. Wear and frictional mechanisms of copper-based bearing alloys. Wear 2011, 273, 9–16. [Google Scholar] [CrossRef]
- Kim, C.K. SEM/EDX Analysis on the Composition and Surface Defect in a Pin Bushing Bearing for an Automotive Engine. J. KSTLE 2007, 23, 195–200. [Google Scholar]
- Yadav, S.; Kumar, A.; Biswas, K. Wear behavior of high entropy alloys containing soft dispersoids (Pb, Bi). Mater. Chem. Phys. 2018, 210, 222–232. [Google Scholar] [CrossRef]
- Kuhn, H.-A.; Koch, R.; Knab, M. Thermal stability of lead-free wrought Cu-base alloys for automotive bushings. World Metall. ERZMETALL 2007, 60, 199–207. [Google Scholar]
- Weber, K.; Pucher, K. Neuer Pb-freier Kupferwerkstoff für Gleitlageranwendungen in Verbrennungsmotoren und Getrieben. Metall 2009, 63, 564–567. [Google Scholar]
- Pucher, K.; Weber, K.; Huk, V.; Kuhm, H.-A. Entwicklung Pb-Freier Lagerwerkstoffe Für Hochbelastete Monometall-Gleitlager; Tribologie-Fachtagung: Gottingen, Germany, 2009. [Google Scholar]
- Zoghipour, N.; Tascioglu, E.; Atay, G.; Kaynak, Y. Machining-induced surface integrity of holes drilled in lead-free brass alloy. Preced. CIRP 2020, 87, 148–152. [Google Scholar] [CrossRef]
- Zoghipour, N.; Atay, G.; Kaynak, Y. Modeling and optimization of drilling operation of lead-free brass alloys considering various cutting tool geometries and copper content. Procedia CIRP 2021, 102, 246–251. [Google Scholar] [CrossRef]
- Liu, C.; Yin, Y.; Li, C.; Xu, M.; Li, R.; Chen, Q. Properties of lead-free copper matrix composites prepared through in situ Ni-coated FeS surface modification and mechanical alloying. J. Alloy. Compd. 2021, 881, 160580. [Google Scholar] [CrossRef]
- Vikas, R.D.; Anurag, K.; Atharva, K. Failure analysis of Taper-Lock bush used in aggregate batcher plant for construction applications. Eng. Fail. Anal. 2021, 130, 105753. [Google Scholar]
- Amanov, A.; Cho, I.S.; Kim, D.E. Effectiveness of high-frequency ultrasonic peening treatment on the tribological characteristics of Cu-based sintered materials on steel substrate. Mater. Des. 2013, 45, 118–124. [Google Scholar] [CrossRef]
- Amanov, A.; Pyun, Y.S.; Sasaki, S. Effect of ultrasonic nanocrystalline surface modification (UNSM) technique on the tribological behavior of sintered Cu-based alloy. Tribol. Int. 2014, 72, 187–197. [Google Scholar] [CrossRef]
- Oksanen, V.T.; Lehtovaara, A.J.; Kallio, M.H. Load capacity of lubricated bismuth bronze bimetal bearing under elliptical sliding motion. Wear 2017, 388–889, 72–80. [Google Scholar] [CrossRef]
- Wang, Z.M.; Yang, Q.; Sun, Z.P.; Zhang, B.R.; Zhao, W.; Rao, W.F. The effect of Bi amd Pb on the soft phase in Al82Sn15Si2.2Cu0.8 sliding bearing alloy. Mater. Charact. 2020, 170, 110684. [Google Scholar] [CrossRef]
- Lee, C.S.; Kim, H.J.; Amanov, A.; Choo, J.H.; Kim, Y.P.; Cho, I.S. Investigation on very high cycle fatigue of PA66-GF30 GFRP based on fiber orientation. Compos. Sci. Technol. 2019, 180, 94–100. [Google Scholar] [CrossRef]
- Chirikov, V.A.; Dimitrov, D.M.; Boyadjiev, Y.S. Determination of the Dynamic Young’s Modulus and Poisson’s Ration Based on Higher Frequencies of Beam Transverse Vibration. Procedia Manuf. 2020, 46, 87–94. [Google Scholar] [CrossRef]
- Wang, Z. A new dynamic testing method for elastic, shear modulus and Poisson’s ration of concrete. Constr. Build. Mater. 2015, 100, 129–135. [Google Scholar] [CrossRef]
- Amanov, A. Microstructural evolution and mechanical properties of Cu-based alloy by post-sintering ultrasonic nanocrystal surface modification. Mater. Lett. 2022, 308, 131124. [Google Scholar] [CrossRef]


| Pb Sintered Layer | Bi Sintered Layer | |
|---|---|---|
| Matrix | 91.61 | 94.32 |
| Porosity | 6.08 | 1.35 |
| Alloy | 2.31 | 4.32 |
| Pb | Bi | O | Cu | |
|---|---|---|---|---|
| Pb-sintered layer | 89.87 | Not detected | 10.13 | Not detected |
| Bi-sintered layer | Not detected | 93.70 | 2.78 | 3.52 |
| Cu | Sn | O | Others | |
|---|---|---|---|---|
| Pb-sintered layer | 73.86 | 7.10 | 1.50 | Balanced: C |
| Bi-sintered layer | 85.97 | 9.77 | 1.60 | Balanced: Zn (2.67) |
| Density (g/cm3) | Edy (GPa) | Gdy (GPa) | Poisson’s Ratio | |
|---|---|---|---|---|
| Pb sintered layer | 7.761 | 138.97 | 56.67 | 0.226 |
| Bi sintered layer | 8.101 | 163.55 | 62.23 | 0.314 |
| Ratio (Pb/Bi) | 4.3% (Bi is high) | 17.6% (Bi is high) | 9.8% (Bi is high) | 38% (Bi is high) |
| Yield Strength (MPa) | Ultimate Tensile Strength (MPa) | Elongation (%) | Toughness (J/mm3) | |
|---|---|---|---|---|
| Pb sintered layer | 268 | 365 | 14.1 | 106.5 |
| Bi sintered layer | 251 | 397 | 16.5 | 132.9 |
Publisher’s Note: MDPI stays neutral with regard to jurisdictional claims in published maps and institutional affiliations. |
© 2022 by the authors. Licensee MDPI, Basel, Switzerland. This article is an open access article distributed under the terms and conditions of the Creative Commons Attribution (CC BY) license (https://creativecommons.org/licenses/by/4.0/).
Share and Cite
Song, S.-H.; Lee, C.-S.; Lim, T.-H.; Amanov, A.; Cho, I.-S. Tensile and Fracture Behavior of Bi-Containing Alloy Sintered on SAE 1010 Steel Sheet. Metals 2022, 12, 1806. https://doi.org/10.3390/met12111806
Song S-H, Lee C-S, Lim T-H, Amanov A, Cho I-S. Tensile and Fracture Behavior of Bi-Containing Alloy Sintered on SAE 1010 Steel Sheet. Metals. 2022; 12(11):1806. https://doi.org/10.3390/met12111806
Chicago/Turabian StyleSong, Seung-Hyon, Chang-Soon Lee, Tae-Hwan Lim, Auezhan Amanov, and In-Sik Cho. 2022. "Tensile and Fracture Behavior of Bi-Containing Alloy Sintered on SAE 1010 Steel Sheet" Metals 12, no. 11: 1806. https://doi.org/10.3390/met12111806