
Evaluation of 20 Elements in Soils and Sediments by ED-XRF of Monochromatic Excitation
by
Yan Xing
1,2,
Haihan Zhang
3,
Zhen Yang
1,
Wei Song
4,
Wenqi Long
2,5,
Ruirui Zhu
2,5,
Ruixue Chang
4 and
Linlin Zhang
1,6,* 1
Shaanxi Environmental Monitoring Center, Xi’an 710054, China
2
State Environmental Protection Key Laboratory of Monitoring for Heavy Metal Pollutants, Changsha 410014, China
3
Shaanxi Key Laboratory of Environmental Engineering, Xi’an University of Architecture and Technology, Xi’an 710055, China
4
Suzhou Jia Pu Technology Co., Ltd., Suzhou 215000, China
5
Hunan Ecology and Environment Monitoring Center, Changsha 410014, China
6
China National Environmental Monitoring Centre, Beijing 100012, China
*
Author to whom correspondence should be addressed.
Metals 2022, 12(11), 1798; https://doi.org/10.3390/met12111798
Submission received: 31 August 2022
/
Revised: 11 October 2022
/
Accepted: 18 October 2022
/
Published: 24 October 2022
(This article belongs to the Topic Green Low-Carbon Technology for Metalliferous Minerals)
Abstract
:There is an urgent need for the accurate analysis of heavy metal contamination in the field of ecology and environmental sciences, especially in the case of trace heavy metals, such as cadmium. Using doubly curved crystals (DCC) to achieve the monochromatic X-ray excitation of the sample to be measured and a silicon drift detector (SDD) to collect the fluorescence of the sample elements, combined with an algorithm analysis of the fundamental parameters (FP), the monochromatic energy-dispersive X-ray fluorescence (MED-XRF) system significantly improved the detection limits of the target elements. The detection limits, precision, and accuracy of the MED-XRF acquisition for 20 elements, including cadmium, lead, and arsenic, were evaluated and compared with the Determination of Inorganic Elements in Soil and Sediment Wavelength-Dispersive X-ray Fluorescence Spectrometry report and tested on the actual samples. The test results showed that the detection limit of the inorganic elements in soil and sediment determined by MED-XRF was mostly better than the industry standard, especially the detection limit of Cd, which was 0.04 mg/kg. The accuracy and correctness fully met the requirements for daily laboratory testing and, as a quality control tool, the actual sample testing and laboratory ICP-MS results were consistent. The research conducted in this project constituted a useful attempt to expand and improve the analytical methods for inorganic elements in soil and sediment, showing that MED-XRF is superior to conventional ED-XRF and WD-XRF and is the current new method of analysis for a low content of Cd in soil. MED-XRF offers a very important contribution to research on soil census, conservation, the rational use of agricultural land, and soil restoration and improvement, and provides strong support for field testing.
1. Introduction
In June 2021, a report on the global assessment of soil pollution noted that increasing soil contamination and widespread waste are threatening the future of global food production and human and environmental health, and that immediate global action is needed to address this challenge [1]. Soil contamination threatens the food we eat, the water we drink, and the air we breathe [2]. Globally, the most common trace metal contaminants are arsenic, lead, and mercury. Localized pollution caused by other trace metals, such as cadmium and chromium, can also pose a serious health risk. Therefore, we urgently need a fast and accurate analytical tool that can be used to assess the risk of contamination. ICP-MS and atomic absorption, which are high-precision analytical tools, are limited to laboratory analysis and require a great deal of time to ablate samples. X-ray fluorescence spectrometry is currently the most appropriate method used to provide accurate quantitative results for most elements of interest in a single rapid measurement in this field [3,4]. The method is suitable for all types of solid, liquid, slurry, and powder samples [5,6,7] and can be used to quantify and qualify primary, secondary, and trace elements in the sample simultaneously [8]. X-ray fluorescence analysis has been widely used, especially in the fields of soil investigation, soil remediation, emergency management, agriculture, and geology [9,10,11,12,13,14]. In December 2015, China published the Determination of Inorganic Elements in Soil and Sediment Wavelength-Dispersive X-ray Fluorescence Spectrometry (HJ 780-2015) report [15], and the analysis of inorganic elements in soil and sediments by wavelength-dispersive X-ray fluorescence spectrometry (WD-XRF) became an analytical foundation in the ecological and environmental monitoring industry. WD-XRF has a better resolution in the light element segment than in the heavy element segment, and when the soil sample is excited by primary X-rays, X-ray fluorescence enters the detector through the instrument’s collimator and spectrometer, which is the key component of WD-XRF, and the characteristic wavelengths and intensities of the elements are obtained by detector [16]. This is because of the changing angle of motion, which is necessary to achieve a wavelength-by-wavelength scan of the element’s characteristic wavelength spectral lines. Therefore, WD-XRF places high demands on the movement of the optical path unit components, the control of the X-ray tube cooling system, system vibration resistance, and power supply and cannot be applied to field emergency sites and in situ precision measurements. Energy-dispersive X-ray fluorescence spectroscopy (ED-XRF) is based on high-performance SDD detectors, which acquire secondary X-rays directly after the sample is excited. This is the X-ray fluorescence signal of the sample element. The instrument achieves the discrimination of the photon energy, determines the specific element based on the location of the characteristic energy, and determines the magnitude of the elemental content based on the number of photons. ED-XRF differs from WD-XRF in that it does not use a crystal or an accessory mechanism designed for spectroscopic purposes. As a result, ED-XRF can be very compact in terms of the spatial layout of the light source, sample, and detector, eliminating the need for the precision movement of the spectroscopic crystal, avoiding intensity losses due to crystal diffraction, and enabling the use of low-power X-ray tubes, even without the need for high-power, high-voltage generators and special cooling systems, thus saving resources and simplifying the design. In addition, ED-XRF has a better overall resolution in the heavy element segment than in the light element segment, and the toxic and hazardous heavy metals of great concern in soil and solid waste are mostly on the heavy side. Thus, ED-XRF is well suited to the elemental analysis of soil and solid waste [17], which creates more possibilities for the use of XRF in multi-scene testing applications [18,19,20].
In recent years, the ED-XRF technology has developed rapidly, and the instrument hardware integration technology and software algorithms have been developed and optimized. The equipment is portable and lightweight [21], has a low power consumption, and enables the simultaneous analysis of multiple key elements, and the daily operation and maintenance costs are extremely low. In particular, the monochromatic X-ray DCC and high-performance SDD detector coupling significantly reduces the background of the spectrum, improves the signal-to-noise ratio and the detection limit, and thus achieves high-definition X-ray fluorescence (HDXRF) analysis [22,23], therefore, some also refer to MED-XRF as HDXRF. MED-XRF has radically improved the detection performance of cadmium and other key heavy metal trace elements, which was not achieved in WD-XRF [24]. The detection limit, precision, and accuracy based this new technology can even reach the level of laboratory atomic spectroscopy and mass spectrometry. For example, the detection limit of cadmium using MED-XRF reaches several tens of micrograms per kilogram.
In the context of the current comprehensive soil census [25], MED-XRF, with its advantages of compactness and portability, low power, rapid and accurate analysis of multiple elements at the same time, and capacity for in situ or ex situ testing, will certainly have broader applications in the field of elemental composition analysis, especially in research on soil environmental quality protection. At the same time, its sample preparation process is simpler than that of WD-XRF, which has the obvious advantages of reducing the labor intensity of analytical operators and can also be used as a quality control tool, which has a positive significance for the promotion of other instrumental analytical methods. MED-XRF analytical methods were initially applied in the field of soils and solid waste, but there is a lack of systematic evaluation. Therefore, there is a need for a comprehensive evaluation of the applicability, reliability, and detection limits of the MED-XRF analytical method in the field of soils.
2. Materials and Methods
2.1. Instruments
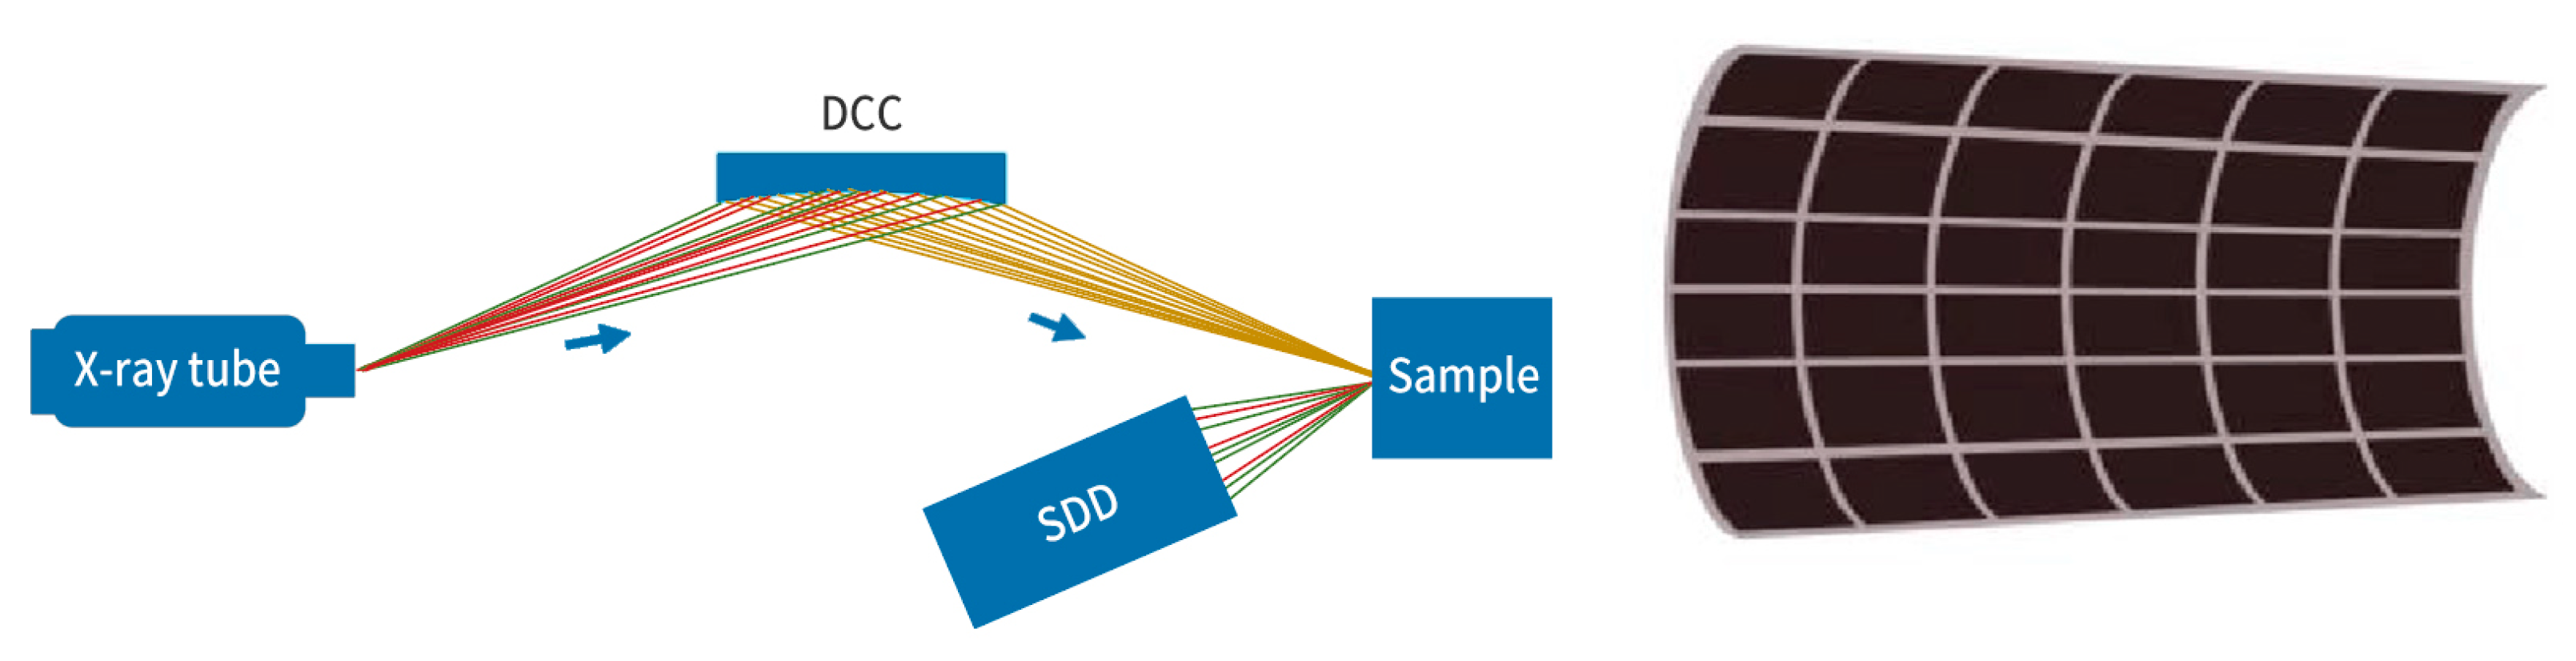
HDXRF E-max500 is a portable instrument based on MED-XRF (Suzhou Jia Pu Technology Co., Ltd., Suzhou, China). The instrument is equipped with a high-performance FastSDD detector and a resolution higher than 123 eV FWHM @ 5.9 keV, with no vacuum and cooling system required for the instrument. The optical path and DCC crystal are shown in Figure 1.
The HDXRF E-max500 instrument parameters are as follows: the voltage is 50 KV, the current is 0.8 mA, and the time parameter for the analysis of a sample is selected as 600 s.
We used an ICP-MS X Series 2 (Thermo Fisher, Waltham, MA, USA) scientific instrument for the wet analysis of the actual samples.
2.2. Test Samples
The certified reference materials (CRMs) contain the following samples: GSS-1a, GSS-2a, GSS-8a, GSS-24, GSS-34, GSS-39, GSS-40, GSS-50, GSS-60, GSS-63, GSD-19, GSD-26, GSD-27, GSD-29, GSD-30, GSD-32, and GSD-13. These standard samples of soil and sediment were developed by the Institute of Geophysical and Geochemical Exploration of the Chinese Academy of Geological Sciences. The actual samples, S1-S62, consisted mainly of samples collected from regionally representative soil and sediment samples and parallel comparison samples received from previous national soil network monitoring exercises, proficiency testing, and technical competition assessments. None of the above samples of the national CRMs used for test validation were involved in the calibration of the instruments for the quantitative analysis.
During the sample analysis, the analytical spectra of the target elements may be affected by the analytical spectra of other elements in the matrix. The FP algorithm calculations were corrected for overlapping interferences based on several standards. Appendix A, Table A1, shows the analytical spectral lines and spectral line overlap interferences.
2.3. Sample Preparation
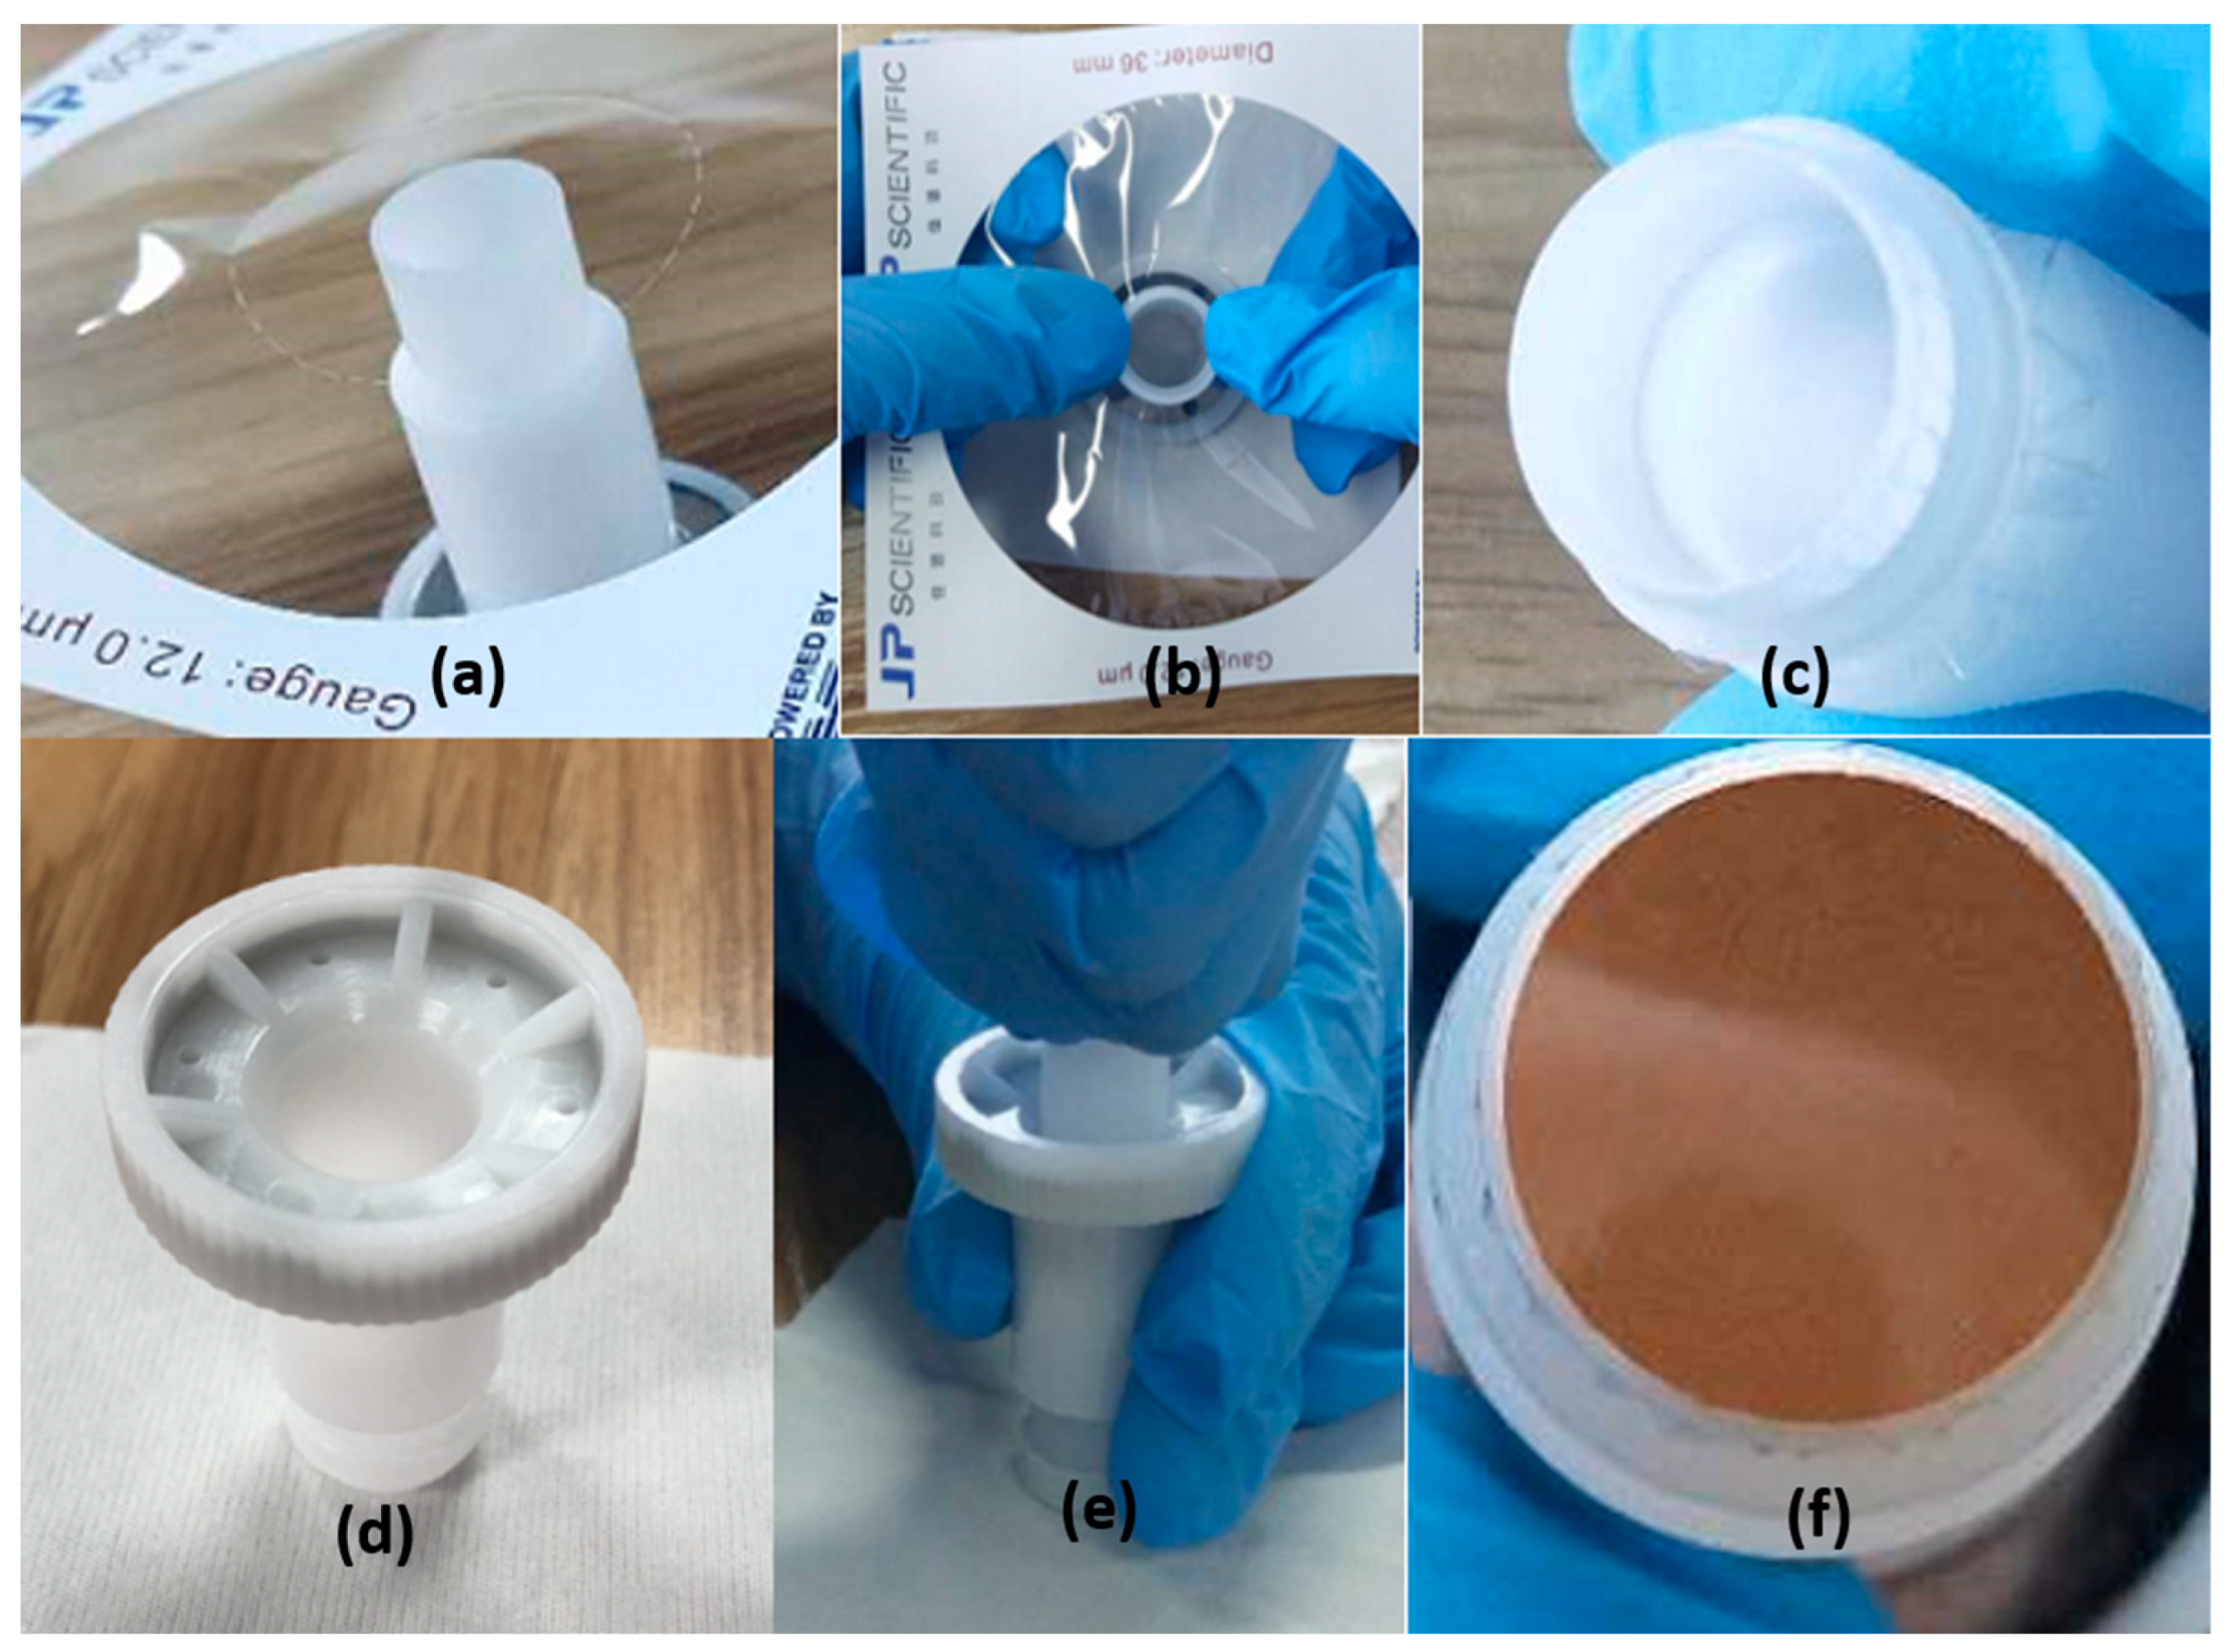
The HDXRF E-max500 samples were prepared using the powder compaction method. In this method, a polypropylene film is placed at the port of the sample cup (Figure 2a) and held in place with a snap ring (Figure 2b). The surface of the film is flat and wrinkle-free (Figure 2c). A sample of approximately 1 g is placed in the sample cup (Figure 2d), and the column rod is pressed, closed, and compacted (Figure 2e) [26]. A flat, dense soil plane is used as the test plane (Figure 2f).
3. Results
3.1. The Limit of Detection
The limit of detection (LOD) is one of the important parameters of the instrumental analysis method. There are two methods for calculating the LOD of XRF. One is the peak background counting method [27,28], and the other is the repeated determination method. The photon count of the detector is the only factor affecting the peak background counting. For example, in the wavelength-dispersive X-ray fluorescence of HJ 780-2015, the peak background method is used. The repeated determination method [29] is a direct statistical calculation based on the measurement results. The repeated assay method is more intuitive in determining the detection limit of the instrument and is convenient for immediate field validation. In this paper, the limit of detection was determined using the repeated assay method. According to the actual state of the samples, the GSD13 sample, which met the basic requirements for the limit of detection measurement, had a small concentration value. The samples with low levels of the target elements were measured repeatedly, and the limits of detection were calculated using the standard deviation of the measured data and compared with the limit of detection in the “Determination of inorganic elements in soils and sediments by wavelength dispersive X-ray fluorescence spectrometry” (HJ 780-2015) report, shown in Table 1, despite the fact that they use different methods of evaluating the calculation of the limit of detection.
The limits of detection for the 20 elements in the soil and sediment ranged from 0.04–22.8 mg/kg for MED-XRF. Compared to HJ 780-2015, MED-XRF has a better detection capability for inorganic elements in soil and sediment, with the exception of elements V and Cr, for which the detection limits were higher than those required by HJ 780-2015. The MED-XRF also has significant advantages over HJ 780-2015 in regard to the key elements of interest, Cd and Pb, with detection limits of 0.04 mg/kg for Cd and 0.4 mg/kg for Pb.
The most stringent risk screening values or minimum evaluation criteria limits in the current and relevant soil and sediment quality standards are shown in Table 1, which are As 20 mg/kg, Cr 80 mg/kg, Cu 35 mg/kg, Ni 40 mg/kg, Pb 50 mg/kg, V 165 mg/kg, Zn 150 mg/kg, and Cd 0.3 mg/kg. As can be seen from Table 1, all the MED-XRF detection limits met the requirements of the quality standards, such as GB 15618-2018, GB 36600-2018, GB 18668-2002, HJ/T 332-2006, and HJ/T 333-2006, and fully met the requirements for the corresponding element detection for the soil pollution risk analysis.
Although the limits of detection of MED-XRF elements V and Cr, which were 7.7 mg/kg and 5 mg/kg, were higher than those of HJ 780-2015, being 4 mg/kg and 3 mg/kg, they were both far below the most stringent requirements of the current, relevant environmental quality standards. Furthermore, the results of the study on the environmental background values of soil elements [35] showed that the 95% confidence range values for Chinese soils were 34.8–168 mg/kg for element V and 19.3–150 mg/kg for element Cr, and the limits of detection using MED-XRF for both elements V and Cr were less than the background values for Chinese soils. Therefore, MED-XRF is suitable for soil background investigations. For the 61 inorganic pollutants whose measurement is required by the national soil environment monitoring network, MED-XRF can simultaneously measure 7 conventional items, except for Hg, and 11 out of 53 non-conventional items, which is comparable to HJ 780-2015. MED-XRF’s shortcoming is that it cannot directly and accurately test the content of light element oxides in HJ 780-2015, such as Na2O and MgO, but the above-mentioned oxides are not the focus of soil environmental quality monitoring and soil pollution prevention work.
3.2. The Precision
The unit precision characterizes the closeness between multiple measurements of the same homogeneous sample under specified test conditions. The experimental design involves six replicate measurements of the CRMs, and these data are the basis for the evaluation. The precision is mainly expressed in terms of the relative standard deviation or relative deviation, with smaller values indicating more concentrated data and a better precision. Sixteen national certified standards, including GSS-1a, were used for the precision study. The relevant requirements of the “Technical Specification for Soil Environmental Monitoring” (HJ/T 166-2004) [36] were used as the basis for the precision evaluation (see Appendix A Table A2), and the evaluation results are shown in Table 2. The elements for which the technical specification did not specify the relative standard deviations were also included in the statistics as a reference.
The technical specifications for the soil environmental monitoring of HJ/T 166-2004 provide the range of relative standard deviations allowed for different content zones. Based on the statistical data in Table 2, the calculation and determination are performed using the sample name for the standard selection of each element content zone, and then the statistical values of the measured samples are judged to be in accordance with the requirements of the specification for the relative standard deviation. As can be seen from the data in the table, the relative standard deviations of As, Cu, Cr, Ni, Pb, Zn, and Cd in the soil samples were all within the range for the requirements of HJ/T 166-2004 and met their precision requirements, and they were significantly better than the requirements of HJ/T 166-2004. The relative standard deviations of V, Cr, Cd, and Ce in the table are slightly worse than the overall average, mainly due to their low absolute content, which can lead to large relative deviations with small absolute deviations, especially for Cd. Meanwhile V, Cr, and Ce are affected by the scattering of the sample matrix due to their low X-fluorescence energy, and the signal-to-noise ratio, at low concentrations, is slightly affected. The elements As, Cu, Cr, Ni, Pb, Zn, and Cd, for which there are clear requirements, are used as references, and the relative standard deviations of the other elements fully satisfy the requirements for soil environmental monitoring.
3.3. Correctness
The correctness is the closeness of the measured value to the true value. The smaller absolute value of the error between the measured and the true value is, the higher the degree of correctness is. On the other hand, the linearity of the relationship between the two values shows a strong correlation with the overall correctness of the data when the coefficient of determination approaches 1. The correctness of the experimental test is examined using the series of CRMs.
The Ministry of Ecology and the Environment’s “Technical Provisions on Quality Assurance and Quality Control for the Detailed Investigation of the Soil Contamination Status of Agricultural Land” uses segmental limits to specify the allowable relative error values for common heavy metals (see Appendix A Table A3). The data on the standard substances, such as GSS-1a, were statistically examined for correctness, and the average value of the repeated measurements was obtained relative error to the certified value (see Table 3). Based on the statistical data in Table 3, the standard selection for each elemental content zone was carried out using the sample name as the identifier, and then the statistical values in Table 3 were judged to be within the required relative error range, according to the standard requirements for the relative error. The results are positive and meet the needs of practical applications (see Appendix A Table A4).
From the results of the correctness analysis, we can see that the majority of the results for As, Cu, Cr, Ni, Pb, Zn, and Cd for each sample were within the required range. As (3.0 mg/kg, 3.5 mg/kg) for GSD-19 and GSD-29, Pb (12 mg/kg) for GSD-29, and Cu (11 mg/kg) and As (2 mg/kg) for GSD-1, are too low, resulting in small absolute deviations but very large relative errors, which can easily lead to out-of-range results. The relative error is very large, and the results are out of range. Therefore, the number of repeated measurements can be increased for low-concentration samples to avoid the introduction of large chance errors.
The correctness of the experimental measurements was examined in terms of the data as a whole, using the identified values of the soil and sediment specimens as independent variable and the detection values as dependent variable, and the fitted curve equations of the two values are shown in Table 4.
From the above fitted equations and coefficient of determination values, we can see that the contents of As, Cu, Cr, Ni, Pb, Zn, and Cd, according to the technical provisions of the soil element survey, are all strongly correlated with the standard values, and the coefficients of determination R² are above 0.98 for each element. This shows that the MED-XRF is fully capable of the accurate quantitative analysis of heavy metals in soils, and researchers can use this new system for routine laboratory testing and field investigations. This is particularly relevant for the detection of trace Cd in soils, which is a common concern. In addition to Ti, V, Mn, Ga, Br, Rb, Sr, Zr, Nb, Mo, Sb, and Th, the detection of these elements is also satisfactory and is of great importance for soil investigations.
3.4. Results of the Actual Sample Testing
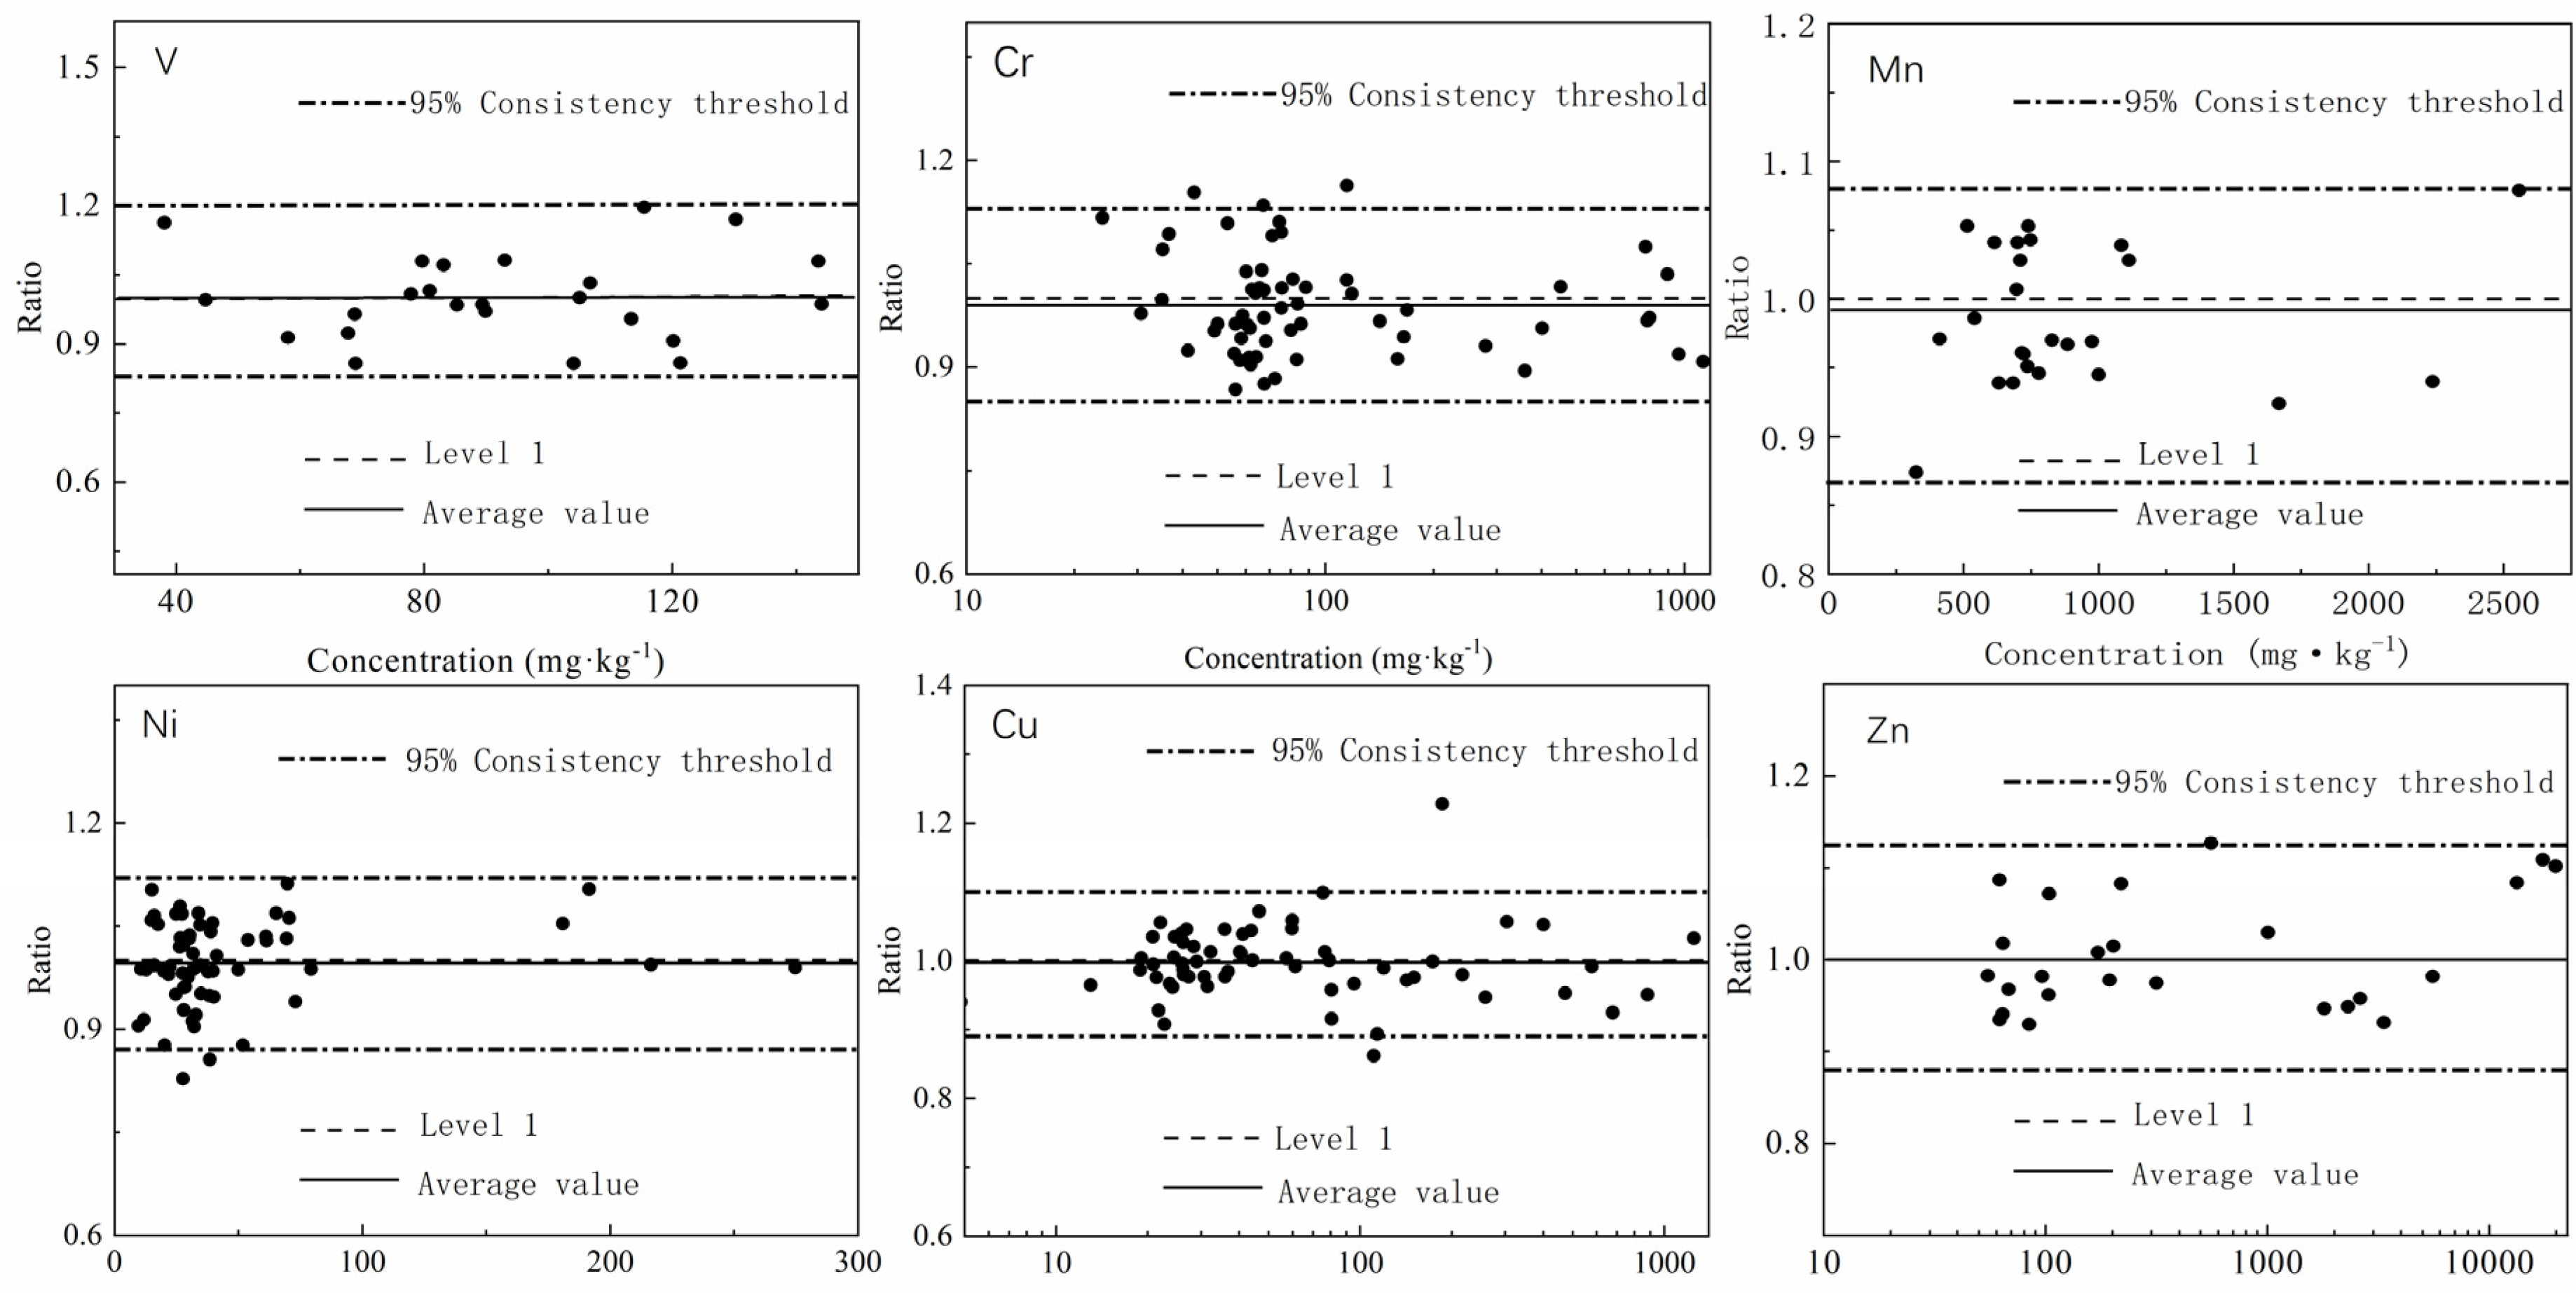
In order to examine the testing of the actual soil and sediment samples, a total of 62 samples were collected for the MED-XRF testing. These samples were from cultivated layers or geological environments in representative areas of the country, and some came from previous technical tests. Focusing on the analysis of the V, Cr, Mn, Ni, Cu, Zn, As, Mo, Cd, Sb, and Pb elements, the test results were compared with those of the ICP-MS analysis to evaluate their consistency using the Bland–Altman method [37].
The concentration ranges of the elements in the samples were measured, and the ratios of the results of the two assay methods for the samples were calculated using the Anderson–Darling test [38,39]. The results are shown in Table 5.
The concentration range basically covers the range of the common investigation objects. At the 5% significance level [40], V, Ni, Cu, Mo, Sb, and Pb show a normal distribution, and the others show a non-normal distribution, but their Anderson–Darling test parameters tend to be close to the critical parameters and can be approximated as a normal distribution.
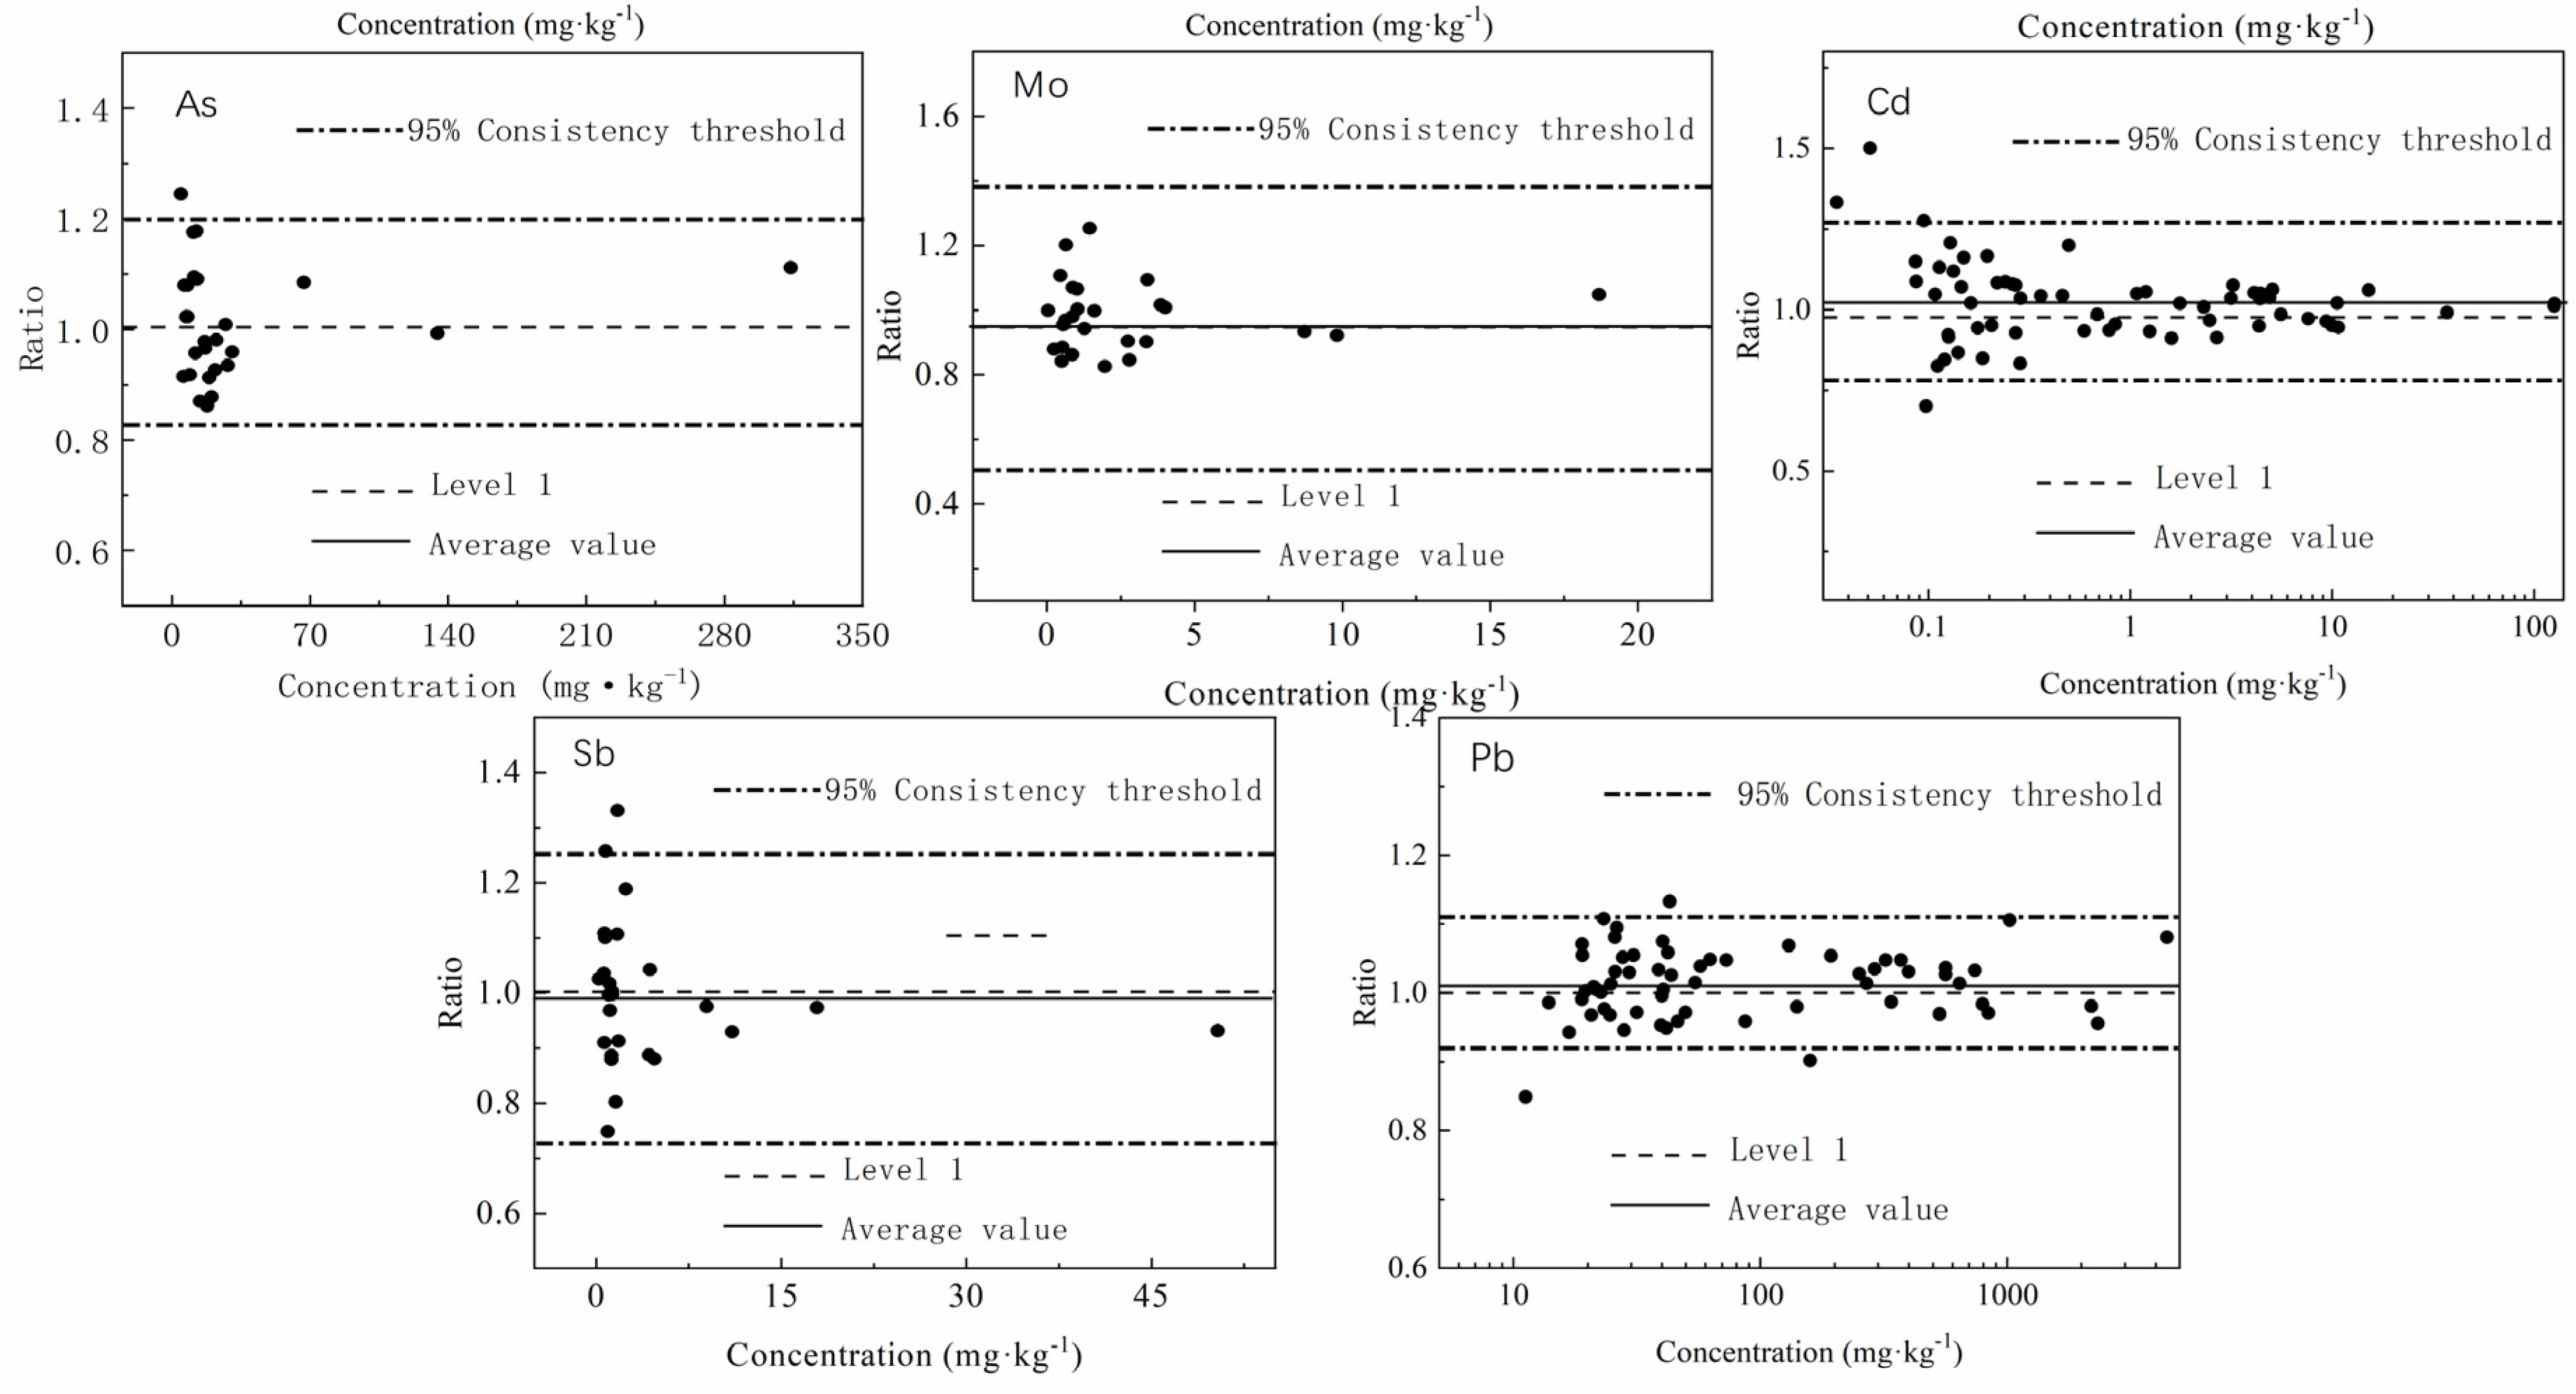
A consistency limit of ±1.96 times the standard deviation at the 95% confidence level was observed. Bland–Altman plots were plotted with the elemental content as the horizontal coordinate and the method ratio as the vertical coordinate, focusing on 11 elements: V, Cr, Mn, Ni, Cu, Zn, As, Mo, Cd, Sb, and Pb, as shown in Figure 3.
In Figure 3, the upper and lower boundary lines are both 95% limits of agreement, the middle solid line indicates the mean of the ratio series of the test results, and the horizontal dashed line indicates the ideal value of 1. The proximity of the mean line to the horizontal line 1 indicates the overall degree of consistency of the method. In Figure 3, the vast majority of the sample points are within the limits of agreement. Few sample points fall outside the boundary. The differences in the measurement results were within acceptable limits, and the two measurement methods were in good agreement.
As can be seen from the overall data, the test results are within the required range, not only for routine content testing but also for small numbers of abnormal, extreme samples, indicating that the MED-XRF can achieve accurate measurements of Cr, Ni, Cu, Cd, Pb, etc., for each sample, and that it is a powerful analytical tool for soil investigation. The results are an important reference for laboratory quality control and emergency field application analysis.
3.5. Quality Control
Before measuring the sample, the measuring instrument should be drift-calibrated by CRM. The physical and chemical properties of the soil samples used for drift calibration are stable over time and can be calibrated using high-quality fractional standards.
Based on the above experimental studies, when testing each batch of samples, we obtained the relative error between the measured value and the CRM shown in Appendix A, Table A5, and when measuring parallel samples, we obtained the relative deviation of the results shown in Appendix A, Table A6.
4. Discussion
From the above experimental test results, it is clear that the improved detection limits of MED-XRF, especially regarding Cd, can meet the requirements for agricultural land and other soil surveys. The limit for Cd is 0.3 mg/kg, as defined in the Agricultural Soil Environmental Quality Standard GB15618-2018 (in Chinese). The detection limit of MED-XRF is many times better than this limit value. Thus, the concentration range for the limit can be measured accurately to obtain the desired results. The detection limits for other elements, such as Cr, Ni, Cu, Zn, As, and Pb, are also significantly better than the requirements defined in the standard documents. The obvious advantage is that it is possible to use this method not only in the direct analysis of soil elements, but also in applications related to it, such as farm monitoring, fertilizer application, and geological surveys. For construction site and other site surveys, it is even more adequate for use, as the technically required values are far greater than the limits for agricultural soils, with the exception of agricultural soils. Although the method of calculating the LOD differs between MED-XRF and WD-XRF, the LOD data are indicative of the technical sophistication of MED-XRF. The LODs for the repeated measurement method are, in practice, more indicative of the performance of the instrument in truly measuring low-concentration samples, and the method is more intuitive and well understood and accepted by operators.
The results of the precision tests were judged according to the technical specification for soil environmental monitoring, HJ/T 166-2004, and the standard deviation data for the As, Cu, Cr, Ni, Pb, Zn, and Cd elements met the requirements and were within certain quality control requirements. With the exception of mercury, which is a key element of interest in soil monitoring and census analysis, the competent analysis of these elements shows that MED-XRF is perfectly suited for analysis in the soil field.
In the evaluation of the correctness of the measurements, the comparative data of the results obtained using the two methods for the 62 actual samples showed that the samples were, to some extent, realistically distributed, and that the data were overwhelmingly within the desired control range at the 95% confidence level. These samples have different concentration levels of different elements and can ensure the diversity and complexity of the actual soil. When validating the impacts of matrix differences and inter-elemental absorption and enhancement effects on this new analytical testing technique, the samples are very accurate. The data results show that MED-XRF is a reliable tool for the elemental concentration analysis of soil and sediment samples.
The reason for the excellent results obtained with the MED-XRF technology system is that the DCC crystal purifies the multi-color X-rays to obtain monochrome X-rays [41]; that is, to allow the elemental excitation of the sample to be measured, the DCC essentially focuses the X-rays to form a monochromatic X-ray radiation, and this radiation acts on the sample [42], which significantly reduces the background information and highlights the elemental information. Thus, it makes the subsequent FP software analysis more accurate, thereby obtaining accurate information on the true contents of the elements. Soil and geode surveys focus on the physical and chemical properties of the samples. Therefore, the technical advantages of MED-XRF’s accurate analysis of elements enable it to play an important role in soil surveys, which can provide strong technical support for the identification of soil types and distribution patterns. This can help researchers to clearly understand the current status of soil resources and change trend; obtain real and accurate basic data on the soil quality, properties, and utilization; improve the level of soil resource protection and utilization; and optimize the structure of agricultural production.
5. Conclusions
The study of the soil and sediment standards based on the MED-XRF technology shows that this method has an ideal detection capability for the inorganic elements in soil and sediment and meets the requirements for multiple element detection for soil pollution risk analyses, and that the limits of detection for most of the target elements are better than those required by the HJ 780-2015 method. The limits of detection of Ni, Cu, Zn, and As are much better than those required by WD-XRF. The Cd and Pb have outstanding advantages, with the Cd of limit of detection reaching 0.04 mg/kg. The accuracy is fully compliant with the technical regulations for soil fining, and the data fully demonstrate that the contents of Cd, As, Pb, Cr, Cu, Ni, and Zn all correlate closely with the standard values, with a coefficient of determination R² above 0.98 for each element, and a better detection for the Ti, V, Mn, Ga, Br, Rb, Sr, Zr, Nb, Mo, Sb, and Th elements. The results of the actual samples tested for the elements of focus, Cr, Ni, Cu, Cd, and Pb, were in agreement with the laboratory ICP-MS results. The experiments show that MED-XRF can be fully used for routine laboratory testing, field site investigation screening, and testing of analytical quality control tools, which are important for soil environmental protection research.
6. Prospect
The MED-XRF analysis system, which is designed to be compact and portable, with a low power consumption, fast analysis speed, high sensitivity and accuracy, and good detection limits, is easy to operate and use. This new analysis method does not require complex sample preparation, and it is a green analysis technology. Therefore, it will greatly improve the analysis efficiency. This technical method has great potential for application in the fields of environmental protection, agricultural safety, food safety, food and drug supervision, petrochemicals, new energy, etc.
Author Contributions
Conceptualization, Y.X., H.Z. and Z.Y.; methodology, W.S. and R.C.; software, R.C.; validation, Y.X., H.Z., W.L. and R.Z.; formal analysis, Y.X., W.S. and R.C.; investigation, H.Z., Z.Y. and L.Z.; resources, L.Z.; data curation, Y.X., H.Z. and L.Z.; writing—original draft preparation, Y.X. and W.S.; writing—review and editing, Y.X. and L.Z.; visualization, H.Z. and W.S.; supervision, W.L., R.Z. and L.Z.; project administration, Y.X. and L.Z.; funding acquisition, W.L. All authors have read and agreed to the published version of the manuscript.
Funding
This research was funded by the Open Funding of the State Environmental Protection Key Laboratory of Monitoring for Heavy Metal Pollutants (grant No. SKLMHM202202).
Institutional Review Board Statement
Not applicable.
Informed Consent Statement
Not applicable.
Data Availability Statement
Not applicable.
Conflicts of Interest
The authors declare no conflict of interest.
Appendix A

Table A1.
Matrix calibration and spectral line interference.
| No. | Elements Analyzed | Analyzed Spectral Lines | Elements Involved in Matrix Correction | Spectral Lines Overlapping, Interfering Element Lines |
|---|---|---|---|---|
| 1 | Ti | Kα | Ba-Lα | |
| 2 | V | Kα | Ti-Kβ, Ba-Lβ | |
| 3 | Cr | Kα | V-Kβ | |
| 4 | Mn | Kα | Cr-Kβ | |
| 5 | Ni | Kα | Ca, Fe | Co-Kβ |
| 6 | Cu | Kα | Ca, Fe | Ni-Kβ |
| 7 | Zn | Kα | ||
| 8 | Ga | Kα | ||
| 9 | As | Kα | Pb-Lα | |
| 10 | Br | Kα | As-Kβ, Pb-Lβ | |
| 11 | Rb | Kα | Ca, Fe | Br-Kβ |
| 12 | Sr | Kα | ||
| 13 | Zr | Kα | Ca, Fe | Sr-Kβ |
| 14 | Nb | Kα | Y-Kβ | |
| 15 | Mo | Kα | ||
| 16 | Cd | Kα | ||
| 17 | Sb | Kα | Ca, Fe | Br-Kβ |
| 18 | Ce | Kα | ||
| 19 | Pb | Lβ | Ca, Fe | |
| 20 | Th | Lα | Pb-Lβ, Bi-Lβ |
Table A2.
Allowable range of precision as defined by the Technical Specification for Soil Environmental Monitoring.
Table A2.
Allowable range of precision as defined by the Technical Specification for Soil Environmental Monitoring.
| Elements | Content Range/(mg/kg) | Relative Std/% | Content Range/(mg/kg) | Relative Std/% | Content Range/(mg/kg) | Relative Std/% |
|---|---|---|---|---|---|---|
| As | <10 | ±20 | 10~20 | ±15 | >20 | ±15 |
| Cu | <20 | ±20 | 20~30 | ±15 | >30 | ±15 |
| Cr | <50 | ±25 | 50~90 | ±20 | >90 | ±15 |
| Ni | <20 | ±30 | 20~30 | ±25 | >30 | ±20 |
| Pb | <20 | ±30 | 20~40 | ±25 | >40 | ±20 |
| Zn | <50 | ±25 | 50~90 | ±20 | >90 | ±15 |
| Cd | <0.1 | ±35 | 0.1~0.4 | ±30 | >0.4 | ±25 |
Table A3.
Allowable range of test correctness as defined by The Soil Contamination of Agricultural Land Detailed Investigation of Quality Assurance and Quality Control Technology regulations.
Table A3.
Allowable range of test correctness as defined by The Soil Contamination of Agricultural Land Detailed Investigation of Quality Assurance and Quality Control Technology regulations.
| Elements | Content Range/(mg/kg) | Relative Error/(%) | Content Range/(mg/kg) | Relative Error/(%) | Content Range/(mg/kg) | Relative Error/(%) |
|---|---|---|---|---|---|---|
| As | <10 | ±30 | 10~20 | ±20 | >20 | ±15 |
| Cu | <20 | ±25 | 20~30 | ±20 | >30 | ±15 |
| Cr | <50 | ±25 | 50~90 | ±20 | >90 | ±15 |
| Ni | <20 | ±25 | 20~30 | ±20 | >30 | ±15 |
| Pb | <20 | ±30 | 20~40 | ±25 | >40 | ±20 |
| Zn | <50 | ±25 | 50~90 | ±20 | >90 | ±15 |
| Cd | <0.1 | ±40 | 0.1~0.4 | ±35 | >0.4 | ±30 |
Table A4.
Determination of the correctness by the MED-XRF test.
| Elements | Cr | Ni | Cu | Zn | As | Cd | Pb |
|---|---|---|---|---|---|---|---|
| GSS-1a | 1 | 1 | 1 | 1 | 1 | 1 | 1 |
| GSS-2a | 0 | 1 | 1 | 1 | 1 | 1 | 1 |
| GSS-8a | 1 | 1 | 1 | 1 | 1 | 1 | 1 |
| GSS-24 | 1 | 1 | 1 | 1 | 1 | 1 | 1 |
| GSS-34 | 1 | 1 | 1 | 1 | 1 | 1 | 1 |
| GSS-39 | 1 | 1 | 1 | 1 | 1 | 1 | 1 |
| GSS-40 | 1 | 1 | 1 | 1 | 1 | 1 | 1 |
| GSS-50 | 1 | 1 | 1 | 1 | 1 | 1 | 1 |
| GSS-60 | 1 | 1 | 1 | 1 | 1 | 1 | 1 |
| GSS-63 | 1 | 1 | 1 | 1 | 1 | 1 | 1 |
| GSD-19 | 1 | 1 | 1 | 1 | 0 | 1 | 1 |
| GSD-26 | 0 | 1 | 1 | 1 | 1 | 1 | 1 |
| GSD-27 | 1 | 1 | 1 | 1 | 1 | 1 | 1 |
| GSD-29 | 1 | 1 | 1 | 1 | 0 | 1 | 0 |
| GSD-30 | 1 | 1 | 1 | 1 | 1 | 1 | 1 |
| GSD-32 | 0 | 1 | 1 | 1 | 1 | 1 | 1 |
| GSD-13 | 1 | 1 | 0 | 1 | 0 | 1 | 1 |
Note: 1 means in range, 0 means out of range.
Table A5.
The correctness of the CRM.
| Concentration Range | Correctness |
|---|---|
| <4 × LOD | ≤0.12 |
| ≥4 × LOD | ≤0.10 |
| 1~5% | ≤0.07 |
| >5% | ≤0.05 |
Note: Ci is the single measurement value and Cs is the standard value for the GBW standard sample.
Table A6.
Permissible relative deviations for parallel double samples.
| Concentration Range (mg/kg) | Permissible Relative Deviations (%) |
|---|---|
| >100 | ±5 |
| 10~100 | ±10 |
| 1.0~10 | ±20 |
| 0.1~1.0 | ±25 |
References
- Bussian, B.M.; Eugenio, N.R.; Wilson, S.C. Available online: http://www.fao.org/3/cb4894en/online/cb4894en.html (accessed on 17 October 2022).
- Cao, J.; Xie, C.-Y.; Hou, Z.-R. Transport patterns and numerical simulation of heavy metal pollutants in soils of lead-zinc ore mines. J. Mt. Sci. 2021, 18, 2345–2356. [Google Scholar] [CrossRef]
- Menne, J.; Holzheid, A.; Heilmann, C. Multi-Scale Measurements of Neolithic Ceramics—A Methodological Comparison of Portable Energy-Dispersive XRF, Wavelength-Dispersive XRF, and Microcomputer Tomography. Minerals 2020, 10, 931. [Google Scholar] [CrossRef]
- Tavares, T.R.; Nunes, L.C.; Alves, E.E.N.; de Almeida, E.; Maldaner, L.F.; Krug, F.J.; de Carvalho, H.W.P.; Molin, J.P. Simplifying Sample Preparation for Soil Fertility Analysis by X-ray Fluorescence Spectrometry. Sensors 2019, 19, 5066. [Google Scholar] [CrossRef] [Green Version]
- Tsuji, K.; Nakano, K.; Takahashi, Y.; Hayashi, K.; Ro, C.-U. X-ray spectrometry. Anal. Chem. 2010, 82, 4950–4987. [Google Scholar] [CrossRef]
- Burnett, B.J.; Lawrence, N.J.; Abourahma, J.N.; Walker, E.B. Rapid Analysis of Copper Ore in Pre-Smelter Head Flow Slurry by Portable X-ray Fluorescence. Appl. Spectrosc. 2016, 70, 826–828. [Google Scholar] [CrossRef]
- Akiko, H. X-ray Fluorescence Spectrometry. Biochem. Biophys. Res. Commun. 2021, 37, 1–2. [Google Scholar]
- Rowe, H.; Hughes, N.; Robinson, K. The quantification and application of handheld energy-dispersive X-ray fluorescence (ED-XRF) in mudrock chemostratigraphy and geochemistry. Chem. Geol. 2012, 324–325, 122–131. [Google Scholar] [CrossRef]
- Hossain, M.S.; Ahmed, M.K.; Liyana, E.; Hossain, M.S.; Jolly, Y.N.; Kabir, M.J.; Akter, S.; Rahman, M.S. A Case Study on Metal Contamination in Water and Sediment near a Coal Thermal Power Plant on the Eastern Coast of Bangladesh. Environments 2021, 8, 108. [Google Scholar] [CrossRef]
- Yao, M.; Wang, D.; Zhao, M. Element Analysis Based on Energy-Dispersive X-ray Fluorescence. Adv. Mater. Sci. Eng. 2015, 2015, 290593. [Google Scholar] [CrossRef] [Green Version]
- Feng, X.; Zhang, H.; Yu, P. X-ray fluorescence application in food, feed, and agricultural science: A critical review. Crit. Rev. Food Sci. Nutr. 2021, 61, 2340–2350. [Google Scholar] [CrossRef]
- Weindorf, D.C.; Bakr, N.; Zhu, Y.; Mcwhirt, A.; Ping, C.L.; Michaelson, G.; Nelson, G.; Shook, K.; Nuss, S. Influence of Ice on Soil Elemental Characterization via Portable X-ray Fluorescence Spectrometry. Pedosphere 2014, 24, 1–12. [Google Scholar] [CrossRef]
- Xia, N.; Zhang, Q.; Yao, D.; Li, G. Geochemical analysis of marine sediments using fused glass disc by X-ray fluorescence spectrometry. Chin. J. Oceanol. Limnol. 2008, 26, 475–479. [Google Scholar] [CrossRef]
- Weindorf, D.C.; Zhu, Y.; Chakraborty, S.; Bakr, N.; Huang, B. Use of portable X-ray fluorescence spectrometry for environmental quality assessment of peri-urban agriculture. Environ. Monit. Assess. 2012, 184, 217–227. [Google Scholar] [CrossRef]
- Ministry of Environmental Protection of the People’s Republic of China. Soil and Sediment-Determination of Inorganic Element—Wavelength Dispersive X-ray Fluorescence Spectrometry: HJ 780—2015; China Environment Science Press: Beijing, China, 2016. [Google Scholar]
- Zhao, W.-Z.; Lu, B.; Yu, J.-B.; Zhang, B.-B.; Zhang, Y. Determination of sulfur in Soils and Stream Sediments by Wavelength Dispersive X-ray Fluorescence Spectrometry. Microchem. J. 2020, 156, 104840. [Google Scholar] [CrossRef]
- Ravansari, R.; Wilson, S.C.; Tighe, M. Portable X-ray fluorescence for environmental assessment of soils: Not just a point and shoot method. Environ. Int. 2020, 134, 105250. [Google Scholar] [CrossRef] [PubMed]
- Wang, S.F.; Han, P.; Wang, J.H.; Lu, A.X.; Li, F. Application of X-ray fluorescence spectrometry on the detection of heavy metals in soil. J. Food Saf. Qual. 2016, 11, 4394–4400. [Google Scholar]
- Gałuszka, A.; Migaszewski, Z.M.; Namieśnik, J. Moving your laboratories to the field—Advantages and limitations of the use of field portable instruments in environmental sample analysis. Environ. Res. 2015, 140, 593–603. [Google Scholar] [CrossRef]
- Kenna, T.C.; Nitsche, F.O.; Herron, M.M.; Mailloux, B.J.; Peteet, D.; Sritrairat, S.; Sands, E.; Baumgarten, J. Evaluation and calibration of a Field Portable X-ray Fluorescence spectrometer for quantitative analysis of siliciclastic soils and sediments. J. Anal. At. Spectrom. 2011, 26, 395–405. [Google Scholar] [CrossRef]
- Hu, W.; Huang, B.; Weindorf, D.C.; Chen, Y. Metals Analysis of Agricultural Soils via Portable X-ray Fluorescence Spectrometry. Bull. Environ. Contam. Toxicol. 2014, 92, 420–426. [Google Scholar] [CrossRef]
- Gibson, W.M.; Chen, Z.W.; Li, D. High-Definition X-ray Fluorescence: Applications. X-ray Opt. Instrum. 2008, 2008, 709692. [Google Scholar] [CrossRef] [Green Version]
- Chen, Z.W.; Gibson, W.M.; Huang, H.P. High definition X-ray fluorescence: Principles and techniques. X-ray Opt. Instrum. 2008, 2008, 318171. [Google Scholar] [CrossRef] [Green Version]
- Chen, Z.W.; Song, S.; Dunphy, J. Direct measurement of trace metals in crude oils and related upstream stocks using high definition X-ray fluorescence (hdxrf). Am. Chem. Soc. Div. Fuel Chem. Prepr. 2012, 57, 696. [Google Scholar]
- Teixeira, R.B.; Godinho, S.; Alvarenga, S.E.; Guilherme, G. Portable X-ray fluorescence (pXRF) applications in tropical Soil Science. Ciência Agrotecnologia 2017, 41, 245–254. [Google Scholar]
- Gao, Z.F.; Tian, B.L.; Cheng, Z.W.; Song, W.; Wang, J.J.; Hou, C.Q. A High Consistency XRF Powder Analysis Sample Cup Device. ZL 2020 2 0195905.X, 13 October 2020. (In Chinese). [Google Scholar]
- Yin, H.M.; Du, Z.Y.; Li, Y.W.; Li, G.H. Determination of heavy metal elements in soil and sediment by energy dispersive X-ray fluorescence spectrometer with simplified matrix effect correction model. Yejin Fenxi/Metall. Anal. 2018, 38, 1–10. [Google Scholar]
- Bao, S.X. Formulae for the Calculation of Detection Limits for X-ray Fluorescence Spectrometry. Spectrosc. Spectr. Anal. 1992, 12, 93–96. [Google Scholar]
- Ministry of Ecology and Environment. Technical Guidelines for the Development of Environmental Monitoring Analytical Method Standards: HJ 168-2020; China Environmental Science Press: Beijing, China, 2020. [Google Scholar]
- Ministry of Ecology and Environment, State Administration for Market Regulation. Soil Environmental Quality Risk Control Standard for Soil Contamination of Agricultural Land: GB 15618—2018; Standards Press of China: Beijing, China, 2019. [Google Scholar]
- Ministry of Ecology and Environment, State Administration for Market Regulation. Soil Environmental Quality Risk Control Standard for Soil Contamination of Development Land: GB 36600—2018; Standards Press of China: Beijing, China, 2019. [Google Scholar]
- State Environmental Protection Administration of the People’s Republic of China. Environmental Quality Evaluation Standards for Farmland of Edible Agricultural Products: HJ/T 332—2006; China Environment Science Press: Beijing, China, 2007. [Google Scholar]
- General Administration of Quality Supervision, Inspection and Quarantine of the People’s Republic of China. Marine Sediment Quality: GB 18668—2002; Standards Press of China: Beijing, China, 2004. [Google Scholar]
- State Environmental Protection Administration of the People’s Republic of China. Environmental Quality Evaluation Standard for Farmland of Greenhouse Vegetables Production: HJ/T 333—2006; China Environment Science Press: Beijing, China, 2007. [Google Scholar]
- Wei, F.; Zheng, C.J.; Chen, J.S.; Wu, Y.Y. Study on the background contents on 61 elements of soils in China. Environ. Sci. 1991, 12, 12–19. [Google Scholar]
- China General Environmental Monitoring Station. Technical Specification for Soil Environmental Monitoring: HJ/T 166—2004; China Environmental Press: Beijing, China, 2004. (In Chinese) [Google Scholar]
- Myles, P.S.; Cui, J. Using the Bland-Altman method to measure agreement with repeated measures. Br. J. Anaesth. 2007, 99, 309–311. [Google Scholar] [CrossRef]
- Li, Y.W.; Ren, L.J.; Yan, Y. Yin, H.M. Study on detection of outliers in inter-laboratory collaboration experimental data for validation of analysis method standard. Environ. Monit. China 2017, 33, 167–175. [Google Scholar]
- Evaluation of Measurement Uncertainty in the Chemical Testing Field—Applying Quality Control and Method Validation Data: RB/T 141—2018; Standards Press of China: Beijing, China, 2018.
- Nelson, L.S. The Anderson-Darling test for normality. J. Qual. Technol. 1998, 30, 298–299. [Google Scholar] [CrossRef]
- Sahoo, S.K. Doubly Curved Crystal Optics for Monochromatic and Diffraction Enhanced X-ray Imaging. Ph.D. Thesis, State University of New York at Albany, Ann Arbor, MI, USA, 2009. [Google Scholar]
- Bingolbali, A. Curved Crystal X-ray Optics for Monochromatic Analysis and Imaging. Ph.D. Thesis, State University of New York at Albany, Ann Arbor, MI, USA, 2008. [Google Scholar]
Figure 1.
Optical schematic diagram of MED-XRF and DCC for monochromatization and focusing of the X-ray.
Figure 1.
Optical schematic diagram of MED-XRF and DCC for monochromatization and focusing of the X-ray.

Figure 2.
Sample preparation illustration.(a–c) install polypropylene film, (d–f) load sample.

Figure 3.
B-A diagrams of V, Cr, Mn, Ni, Cu, Zn, As, Mo, Cd, Sb and Pb.


Table 1.
The limit of detection of MED-XRF.
| Elements | Certified Value/(mg/kg) | Average/(mg/kg) | Std./(mg/kg) | MED-XRF LOD./(mg/kg) | HJ 780-2015 LOD./(mg/kg) | Evaluation Results | The Max. Relevant Environmental Quality/(mg/kg) | NSEM Network Monitoring |
|---|---|---|---|---|---|---|---|---|
| Ti | 1370 ± 120 | 1437 | 6.6 | 21 | 50 | 1 | / | Yes |
| V | 19 ± 3 | 15.8 | 2.5 | 7.7 | 4 | −1 | 165 | Yes |
| Cr | 10.7 ± 1.7 | 8.45 | 1.6 | 5 | 3 | −1 | 80 | Yes |
| Mn | 218 ± 31 | 238 | 0.9 | 2.8 | 10 | 1 | / | Yes |
| Ni | 3.7 ± 1 | 3.7 | 0.18 | 0.6 | 1.5 | 1 | 40 | Yes |
| Cu | 11 ± 2 | 9.6 | 0.27 | 0.8 | 1.2 | 1 | 35 | Yes |
| Zn | 18 ± 2 | 20.1 | 0.12 | 0.4 | 2 | 1 | 150 | Yes |
| Ga | 11.1 ± 0.9 | 10.1 | 0.23 | 0.7 | 2 | 1 | / | Yes |
| As | 2 ± 0.2 | 1.68 | 0.12 | 0.4 | 2 | 1 | 20 | Yes |
| Br | 0.5 | 0.56 | 0.05 | 0.2 | 1 | 1 | / | Yes |
| Rb | 70 ± 6 | 67.4 | 0.07 | 0.3 | 2 | 1 | / | Yes |
| Sr | 87 ± 4 | 84.6 | 0.11 | 0.4 | 2 | 1 | / | Yes |
| Zr | 187 ± 14 | 176 | 0.12 | 0.4 | 2 | 1 | / | Yes |
| Nb | 9 ± 1.1 | 9.2 | 0.04 | 0.1 | 2 | 1 | / | No |
| Mo | 0.44 | 0.19 | 0.03 | 0.1 | / | 1 | / | Yes |
| Cd | 0.045 | 0.05 | 0.01 | 0.04 | / | 1 | 0.3 | Yes |
| Sb | 0.19 ± 0.06 | 0.18 | 0.03 | 0.1 | / | 1 | / | Yes |
| Ce | 42 ± 4 | 32.84 | 7.26 | 22.8 | 24.1 | 1 | / | Yes |
| Pb | 13.5 ± 2.3 | 13.7 | 0.11 | 0.4 | 2 | 1 | 50 | Yes |
| Th | 5.4 ± 0.6 | 4.7 | 0.05 | 0.2 | 2.1 | 1 | / | Yes |
Note: (1) for the comparative evaluation of the limits of detection, 1 indicates that MED-XRF is better than HJ 780-2015, and −1 indicates that HJ 780-2015 is better than MED-XRF, but these are two different methods of calculating detection limits. (2) The max. relevant environmental quality is based on the provisions of the standards documents [30,31,32,33,34].
Table 2.
The precision of the MED-XRF test.
| Relative Std./(%) | Ti | V | Cr | Mn | Ni | Cu | Zn | Ga | As | Br | Rb | Sr | Zr | Nb | Mo | Cd | Sb | Ce | Pb | Th |
|---|---|---|---|---|---|---|---|---|---|---|---|---|---|---|---|---|---|---|---|---|
| GSS-1a | 0.3 | 21 | 11 | 7.2 | 7.7 | 1.3 | 3.5 | 6.8 | 7.3 | 20 | 5.4 | 2.6 | 1.2 | 7.5 | 7.2 | 3.6 | 2.4 | 21.5 | 3.4 | 7.8 |
| GSS-2a | 0.3 | 10 | 11 | 3.6 | 7.2 | 5.9 | 2.7 | 3.3 | 9.4 | 3.9 | 2.4 | 3.2 | 8.3 | 7 | 10 | 0.4 | 0.9 | 13.9 | 18 | 8.6 |
| GSS-8a | 0.6 | 16 | 7.7 | 1.9 | 2.4 | 4.8 | 6.9 | 3.7 | 2.3 | 3.7 | 3.3 | 3.1 | 4.6 | 12.5 | 3.6 | 19.9 | 1.2 | 17.3 | 8.8 | 6.1 |
| GSS-24 | 0.3 | 3.5 | 5.6 | 0.1 | 8.2 | 15.1 | 7.7 | 10.3 | 4.2 | 0 | 2.8 | 9.9 | 4.4 | 1.5 | 3 | 25.6 | 1.1 | 14.7 | 2.9 | 4.9 |
| GSS-34 | 0.3 | 0 | 6.9 | 4.6 | 6.1 | 4.4 | 2 | 3.1 | 2.2 | 7.6 | 1.4 | 0.2 | 5.1 | 1.7 | 2 | 22.2 | 1.1 | 20.2 | 8.7 | 14 |
| GSS-39 | 0.2 | 11 | 13 | 7.6 | 10.1 | 8.9 | 3.1 | 6.3 | 10.8 | 0.4 | 2.8 | 4.4 | 2.7 | 8.8 | 8.5 | 11.5 | 1.1 | 18.8 | 9.9 | 2.1 |
| GSS-40 | 0.4 | 6.5 | 7.4 | 5.1 | 7.8 | 5.7 | 1.7 | 5.2 | 3 | 1.2 | 2.2 | 2.2 | 2.3 | 6.6 | 6.2 | 8.4 | 1.2 | 11.3 | 8.3 | 5.7 |
| GSS-50 | 0.3 | 18.7 | 9.3 | 0.6 | 6.7 | 6 | 0.3 | 6.8 | 11.7 | 1.9 | 3.2 | 2.8 | 2.6 | 0.8 | 0.4 | 7 | 0.4 | 22.4 | 0.1 | 12 |
| GSS-60 | 0.2 | 18.8 | 15.7 | 2.3 | 6 | 7.6 | 2.4 | 2.3 | 3 | 9.2 | 0.6 | 0.4 | 10 | 5 | 4.4 | 10.2 | 1.8 | 16.5 | 5.4 | 13 |
| GSS-63 | 0.1 | 1.7 | 6 | 1.3 | 2.4 | 2.7 | 0.3 | 2.5 | 9.8 | 12.9 | 0.8 | 0.3 | 4 | 2.8 | 7.9 | 6.1 | 1.2 | 18.3 | 2.1 | 3 |
| GSD-19 | 0.3 | 4.5 | 2.1 | 2.2 | 7.2 | 10.3 | 3.7 | 8 | 6.4 | 2.2 | 0.3 | 1.8 | 15 | 2.6 | 7.1 | 12.5 | 0.2 | 17.3 | 3.8 | 7.9 |
| GSD-26 | 2.1 | 4 | 16.2 | 0.3 | 1.5 | 9.1 | 1.3 | 2.1 | 5.4 | 22.1 | 1.8 | 2.5 | 5.7 | 0.4 | 4.1 | 19.2 | 2.5 | 19.7 | 3.4 | 9.3 |
| GSD-27 | 0.3 | 9.1 | 4.1 | 2 | 5.4 | 3.5 | 3.8 | 8.8 | 8.9 | 13.7 | 2 | 2.5 | 1.1 | 4.2 | 1.3 | 3.8 | 1 | 17.8 | 4.3 | 17 |
| GSD-29 | 0.1 | 5 | 2.9 | 11.9 | 1.9 | 4.1 | 0.1 | 0.3 | 7.1 | 7.2 | 6.6 | 3 | 2 | 1.7 | 1.7 | 16.1 | 0.2 | 22.6 | 19 | 24 |
| GSD-30 | 0.4 | 5.7 | 13.3 | 3.2 | 5.6 | 2.7 | 2.8 | 6.8 | 9.5 | 3.6 | 1.8 | 4.7 | 2.9 | 1.3 | 6.3 | 1 | 1.9 | 22.3 | 6.6 | 4.2 |
| GSD-32 | 2.6 | 2.6 | 13.2 | 4.2 | 2 | 4.3 | 0 | 5.3 | 7.9 | 8.1 | 2.7 | 10.8 | 4.9 | 2.6 | 3.9 | 1.9 | 1.2 | 14.6 | 7.2 | 6.4 |
| Acceptable? | — | — | Yes | — | Yes | Yes | Yes | — | Yes | — | — | — | — | — | — | Yes | Yes | — | Yes | — |
Table 3.
The relative errors of the MED-XRF.
| Relative Error/(%) | Cr | Ni | Cu | Zn | As | Cd | Pb |
|---|---|---|---|---|---|---|---|
| GSS-1a | 4.8 | 9.0 | 0.5 | 3.5 | 8.1 | 3.7 | 3.8 |
| GSS-2a | 30 | 7.0 | 6.4 | 2.7 | 10 | 16 | 21 |
| GSS-8a | 4.5 | 2.9 | 2.4 | 7.3 | 2.6 | 3.5 | 8.0 |
| GSS-24 | 4.0 | 8.8 | 16 | 7.4 | 3.6 | 21 | 2.3 |
| GSS-34 | 3.6 | 4.9 | 6.8 | 2.0 | 2.1 | 31 | 8.6 |
| GSS-39 | 14 | 8.9 | 8.2 | 3.0 | 12 | 15 | 9.5 |
| GSS-40 | 3.6 | 8.5 | 5.2 | 1.4 | 3.5 | 12 | 8.0 |
| GSS-50 | 11 | 6.9 | 8.6 | 0.3 | 20 | 3.7 | 0.4 |
| GSS-60 | 17 | 9.0 | 6.2 | 2.8 | 3.7 | 1.4 | 4.9 |
| GSS-63 | 6.6 | 4.0 | 3.6 | 0.3 | 8.3 | 11 | 2.2 |
| GSD-19 | 2.4 | 6.6 | 11 | 3.3 | 53 | 15 | 3.6 |
| GSD-26 | 32 | 3.4 | 12 | 0.2 | 4.6 | 1.9 | 3.8 |
| GSD-27 | 1.1 | 1.1 | 3.7 | 3.6 | 9.7 | 7.3 | 4.0 |
| GSD-29 | 2.7 | 1.9 | 3.7 | 0.5 | 75 | 11 | 30 |
| GSD-30 | 12 | 6.5 | 4.8 | 3.0 | 9.1 | 0.3 | 6.5 |
| GSD-32 | 33 | 2.7 | 5.5 | 1.1 | 7.4 | 2.1 | 6.7 |
| GSD-13 | 8.0 | 7.8 | 19 | 8.6 | 26 | 10 | 0.0 |
Table 4.
Fitting equation of elements.
| No. | Elements | Slope | Intercept | R² |
|---|---|---|---|---|
| 1 | Ti | 0.815 | 0.06 | 0.9983 |
| 2 | V | 0.894 | 5.82 | 0.9821 |
| 3 | Cr | 0.964 | 2.74 | 0.9963 |
| 4 | Mn | 0.969 | 19.35 | 0.9746 |
| 5 | Ni | 0.778 | 4.09 | 0.9984 |
| 6 | Cu | 1.084 | −5.54 | 0.9965 |
| 7 | Zn | 1.2 | −15.11 | 0.9971 |
| 8 | Ga | 0.937 | 1.42 | 0.8982 |
| 9 | As | 1.107 | 0.57 | 0.9898 |
| 10 | Br | 0.959 | 0.44 | 0.9986 |
| 11 | Rb | 1.048 | −5.77 | 0.8761 |
| 12 | Sr | 0.95 | 6.39 | 0.9919 |
| 13 | Zr | 0.98 | 16.4 | 0.8757 |
| 14 | Nb | 0.86 | 1.76 | 0.9905 |
| 15 | Mo | 0.935 | 0.04 | 0.9969 |
| 16 | Cd | 0.947 | 0.02 | 0.9977 |
| 17 | Sb | 1.265 | −0.27 | 0.9699 |
| 18 | Ce | 1.22 | −19.52 | 0.7198 |
| 19 | Pb | 1.102 | −3.09 | 0.9996 |
| 20 | Th | 0.995 | 0.25 | 0.9745 |
Table 5.
The elemental concentration ranges and Anderson–Darling tests.
| Elements | Min./(mg/kg) | Max./(mg/kg) | Significance Level | Test Statistic | Critical Value | Distribution |
|---|---|---|---|---|---|---|
| V | 35.2 | 147 | 5% | 0.35 | 0.73 | 0 |
| Cr | 22.6 | 1180 | 5% | 0.87 | 0.74 | 1 |
| Mn | 346 | 2557 | 5% | 0.82 | 0.73 | 1 |
| Ni | 10.1 | 276 | 5% | 0.55 | 0.74 | 0 |
| Cu | 5 | 1230 | 5% | 0.73 | 0.74 | 0 |
| Zn | 55.2 | 30,100 | 5% | 1.07 | 0.73 | 1 |
| As | 4.1 | 297 | 5% | 1.07 | 0.73 | 1 |
| Mo | 0.07 | 18.23 | 5% | 0.33 | 0.73 | 0 |
| Cd | 0.03 | 125 | 5% | 1.02 | 0.74 | 1 |
| Sb | 0.21 | 52.1 | 5% | 0.44 | 0.73 | 0 |
| Pb | 12.1 | 4260 | 5% | 0.29 | 0.74 | 0 |
Note: 0 indicates a normal distribution and 1 a non-normal distribution.
Publisher’s Note: MDPI stays neutral with regard to jurisdictional claims in published maps and institutional affiliations. |
© 2022 by the authors. Licensee MDPI, Basel, Switzerland. This article is an open access article distributed under the terms and conditions of the Creative Commons Attribution (CC BY) license (https://creativecommons.org/licenses/by/4.0/).
Share and Cite
MDPI and ACS Style
Xing, Y.; Zhang, H.; Yang, Z.; Song, W.; Long, W.; Zhu, R.; Chang, R.; Zhang, L. Evaluation of 20 Elements in Soils and Sediments by ED-XRF of Monochromatic Excitation. Metals 2022, 12, 1798. https://doi.org/10.3390/met12111798
AMA Style
Xing Y, Zhang H, Yang Z, Song W, Long W, Zhu R, Chang R, Zhang L. Evaluation of 20 Elements in Soils and Sediments by ED-XRF of Monochromatic Excitation. Metals. 2022; 12(11):1798. https://doi.org/10.3390/met12111798
Chicago/Turabian StyleXing, Yan, Haihan Zhang, Zhen Yang, Wei Song, Wenqi Long, Ruirui Zhu, Ruixue Chang, and Linlin Zhang. 2022. "Evaluation of 20 Elements in Soils and Sediments by ED-XRF of Monochromatic Excitation" Metals 12, no. 11: 1798. https://doi.org/10.3390/met12111798
Note that from the first issue of 2016, this journal uses article numbers instead of page numbers. See further details here.