Article

Multi-Objective Optimization of Selective Laser Melting Processes for Minimizing Energy Consumption and Maximizing Product Tensile Strength

1
School of Construction Machinery, Chang’an University, Xi’an 710061, China
2
Marine Design & Research Institute of China, Shanghai 200011, China
3
School for Chang’an Dublin International College of Transportation, Chang’an University, Xi’an 710061, China
4
Dongfang Turbine Co., Ltd., Deyang 618000, China
5
Zhejiang Province’s Key Laboratory of 3D Printing Process and Equipment, School of Mechanical Engineering, Zhejiang University, Hangzhou 310058, China
*
Authors to whom correspondence should be addressed.
Metals 2022, 12(11), 1782; https://doi.org/10.3390/met12111782
Submission received: 19 July 2022 / Revised: 12 September 2022 / Accepted: 19 October 2022 / Published: 23 October 2022

Abstract

:
As a sustainable manufacturing technology, selective laser melting (SLM) is a typical additive manufacturing (AM) method with high flexibility and material efficiency. However, SLM is intrinsically energy-intensive than conventional machining processes. By contrast, part quality, especially the tensile strength, is critical for applying SLM technology. Therefore, this study aims to minimize the process energy consumption and maximize the part tensile strength by optimizing three essential process parameters, namely laser power, scan speed, and overlap rate. First, single track and single layer experiments are applied to determine the constraints of process parameters. Then, analytical and statistical models are used to calculate energy consumption and part tensile strength. Finally, the process parameters to achieve compromised optimal solutions are located using the nondominated sorting genetic algorithm II (NSGA-II). A case study of a waveguide part manufactured via the SLM process is employed to demonstrate the effectiveness of the proposed approach. Results showed that both energy consumption and part tensile strength could be improved moderately using the proposed method. This study can potentially guide the process parameter selection for new material AM processes and improve the AM product quality.

1. Introduction

With increasing concerns about industry environmental issues, manufacturing is now underway for a transition toward sustainability [1,2]. Additive manufacturing (AM), which builds parts layer-by-layer, is considered an environmentally benign technology owing to its improved material efficiency and elimination of cutting tools, molds, dies, and cutting fluids than conventional machining processes [3]. However, these benefits come with speculation about the electrical energy consumption of the AM processes. The AM processes are intrinsically energy-intensive because their electrical energy intensity is 1–2 orders of magnitude higher than conventional machining processes [4]. The increasing electrical energy use due to the rapidly growing application of AM technology has exerted large economic and environmental pressures on manufacturing enterprises and society. Therefore, reducing AM processes’ energy consumption is necessary to save costs and become more environmentally friendly.
As the first step for energy reduction, much research has been conducted on the energy consumption modeling of AM processes, such as selective laser sintering (SLS) [5], binder jetting (BJ) [6], and stereo lithography appearance (SLA) processes [7]. Based on the developed models, the energy consumption of the AM process was reduced by optimizing process parameters [8], part orientation [9], and product design-relevant features [10]. Optimizing energy consumption only makes sense if the product quality requirement is satisfied. Fortunately, ensuring product quality while reducing energy consumption is possible [11]. Examples are the minimization of energy consumption considering the geometric accuracy for the fused filament fabrication (FFF) process [8] and the optimization of energy consumption and surface quality for selective laser sintering (SLS) [12] and SLA processes [7]. However, studies on multi-objective optimization of energy consumption and tensile strength remain scant [13,14,15].
As a burgeoning AM technology, the selective laser melting (SLM) process is increasingly being used by industries to produce lightweight and complex structured parts. The tensile strength of a SLMed part has utmost importance because withstanding tensile loads without failure is essential [16]. Many parts are assembled in products that work in harsh environments for aerospace and military applications. High tensile strength is required for the parts to withstand various loads, such as inertia loads, self-weight loads, wind loads, as well as snow and ice loads. Therefore, maximizing the tensile strength of a SLMed part is essential. As the demand for SLMed parts increases, the energy consumption of the SLM process increases substantially. However, few studies are currently optimizing the SLM process to reduce process energy consumption and increase part tensile strength simultaneously.
Some studies have been conducted to model the tensile strength of AM parts. These tensile strength models focus on the fused deposition modeling (FDM) and SLA methods, including the metamodel for partially filled FFF fabricated parts [17], the mathematical model for the SLA fabricated part [18], and the theoretical model for the FDM part [19], among others [20,21,22]. To optimize tensile strength, many studies have focused on the FDM process [23]. These studies include identifying the optimized process parameters that lead to the maximal tensile strength [24], deposition orientation optimization [25], and establishing a differential evolution that optimizes the model to achieve good tensile strength [26], to name a few [27,28]. For other AM processes, optimizing processing parameters to maximize the tensile strength for microwave sintering of Ti6Al4V [29] and selective electron beam melting (SEBM) of stainless steel 316L parts were investigated [30]. However, the modeling and optimization of the tensile strength of SLM processed parts are still lacking.
Although some research has been conducted on optimizing either processing energy consumption or part tensile strength for AM processes as a hot spot of the current studies, a lack of combined optimization for AM persists, especially for SLM. A pioneer work on this topic was conducted to minimize total sintering energy, form errors, and maximize part strength for metal powder-based additive manufacturing processes [31].
The energy consumption of the auxiliary system, such as the heating and cooling system, which accounts for an essential part of total energy consumption, is considered in some energy model studies. However, these studies still have some shortcomings. The prediction and optimization model of fabrication process energy consumption and SLM manufactured parts tensile strength should be studied further to improve the accuracy and effectiveness. We develop a theoretical model of energy consumption and model the tensile strength based on response surface methodology (RSM). Then, we optimized the two objectives using NSGA II and provided the constraints based on single track and single layer quality requirements.
There are some relative SLM studies. The tensile strength prediction model has been established by gradient descent with momentum (GDM) backpropagation [32]. The tensile strength and energy consumption prediction models of the SLM 316L steel part were built together by the ensemble of metamodels (EM) method [33]. Some studies also calculated the energy consumption of the SLM process with an approximate equation [34,35]. Compared to these studies, this research has some differences and improvements.
First, the problem is novel. This paper conducted a detailed study focusing on the specific problem of optimizing the energy consumption and tensile strength of the fabricated AlSi10Mg. In contrast, other studies focus on surface quality optimization [32] or 316L stainless steel materials instead of AlSi10Mg [33].
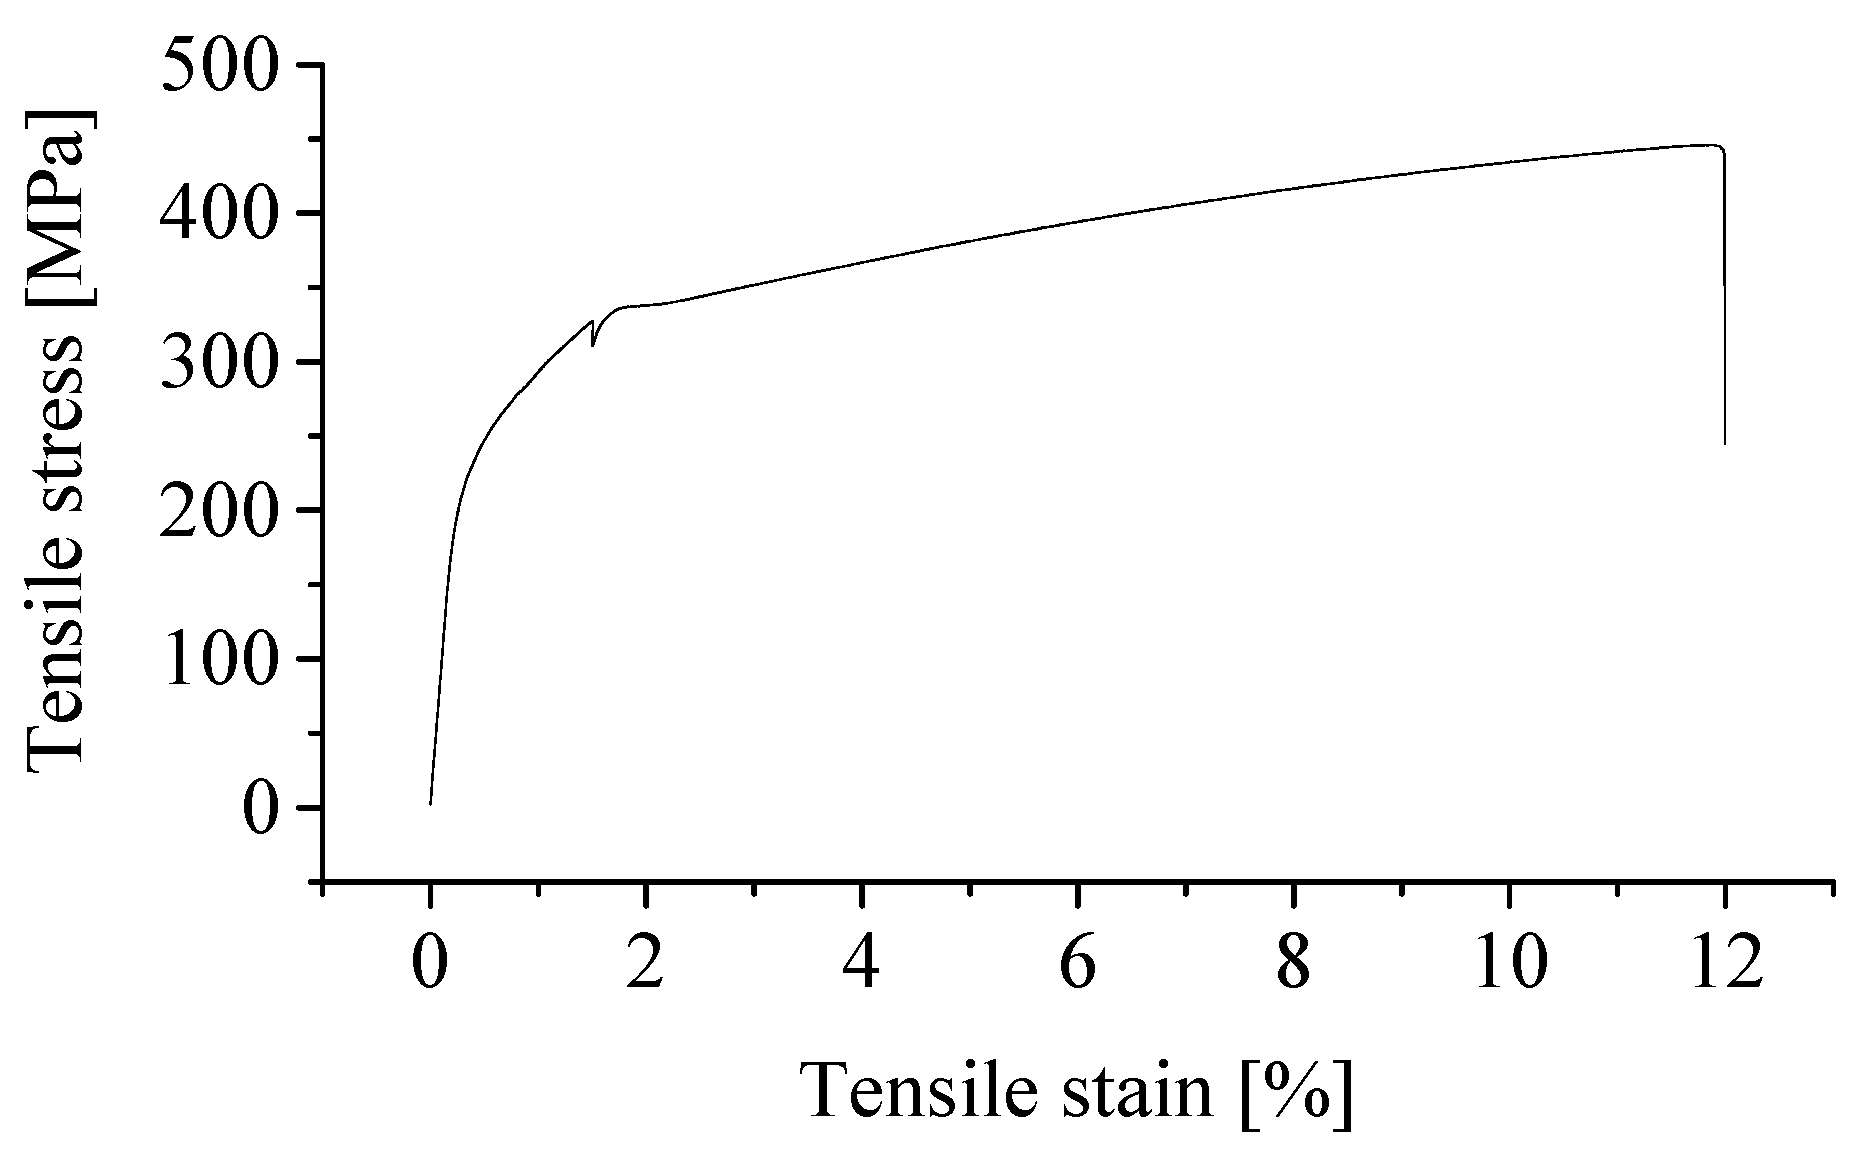
Second, the models are novel. The SLM process’s energy consumption is modeled by combined using theoretical and experimental studies. The single-track width and tensile strength prediction model were built by the RSM method. Track width increases with the increase of laser power and the decrease of scan speed. The second-order polynomial model has a high accuracy for predicting tensile strength.
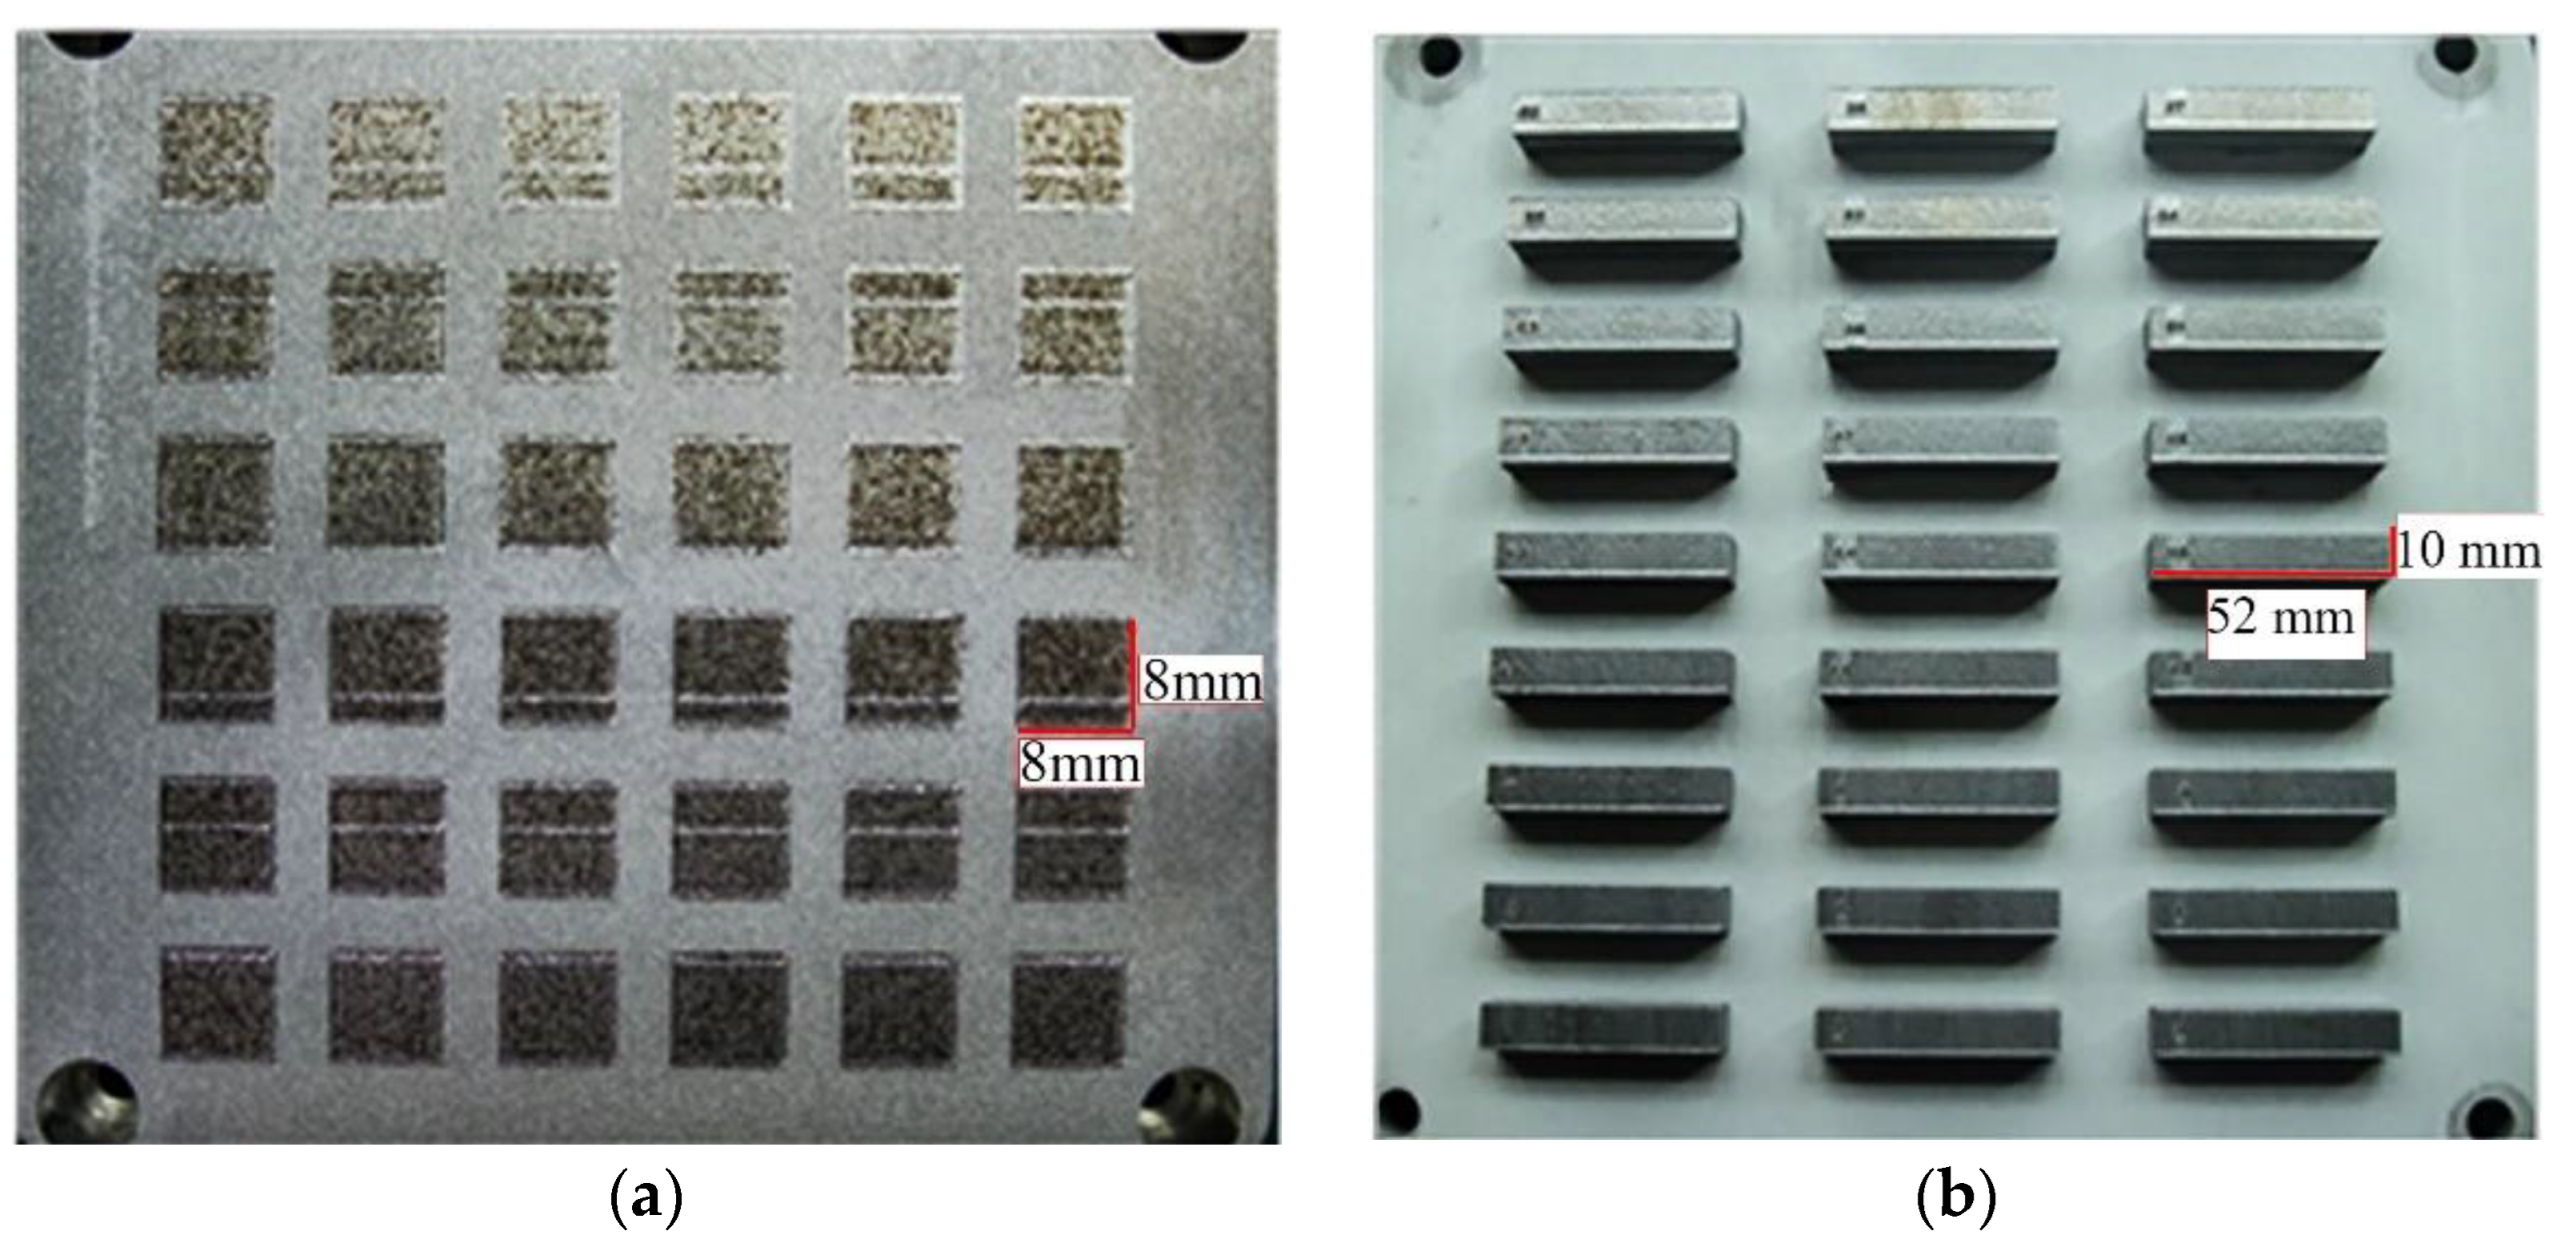
Third, the determination of the boundaries of the process parameters is novel. Single track and single layer experiments determine the process parameters’ constraints for optimization. In contrast, the constraints of the process parameters in other research are determined based on experience [32,33]. The variations of the actual manufacturing could lead to the inconsistency between the actual boundaries of process parameters and those obtained from experience. Therefore, the experimental methods used in this paper could be better.
The process–structure–property (PSP) relationships and optimization are potent methods to optimize the process parameters to enhance the material properties. However, the PSP relationships are mechanism technologies based on complicated mechanism models with many unknown parameters. It is difficult to use the PSP relationships. Furthermore, the PSP relationships sometimes cannot match the real situation and obtain the correct conclusion. The optimization model in this study based on many experiments could reflect the real situation. The proposed optimization technique in this study is preferred over the PSP relationships.
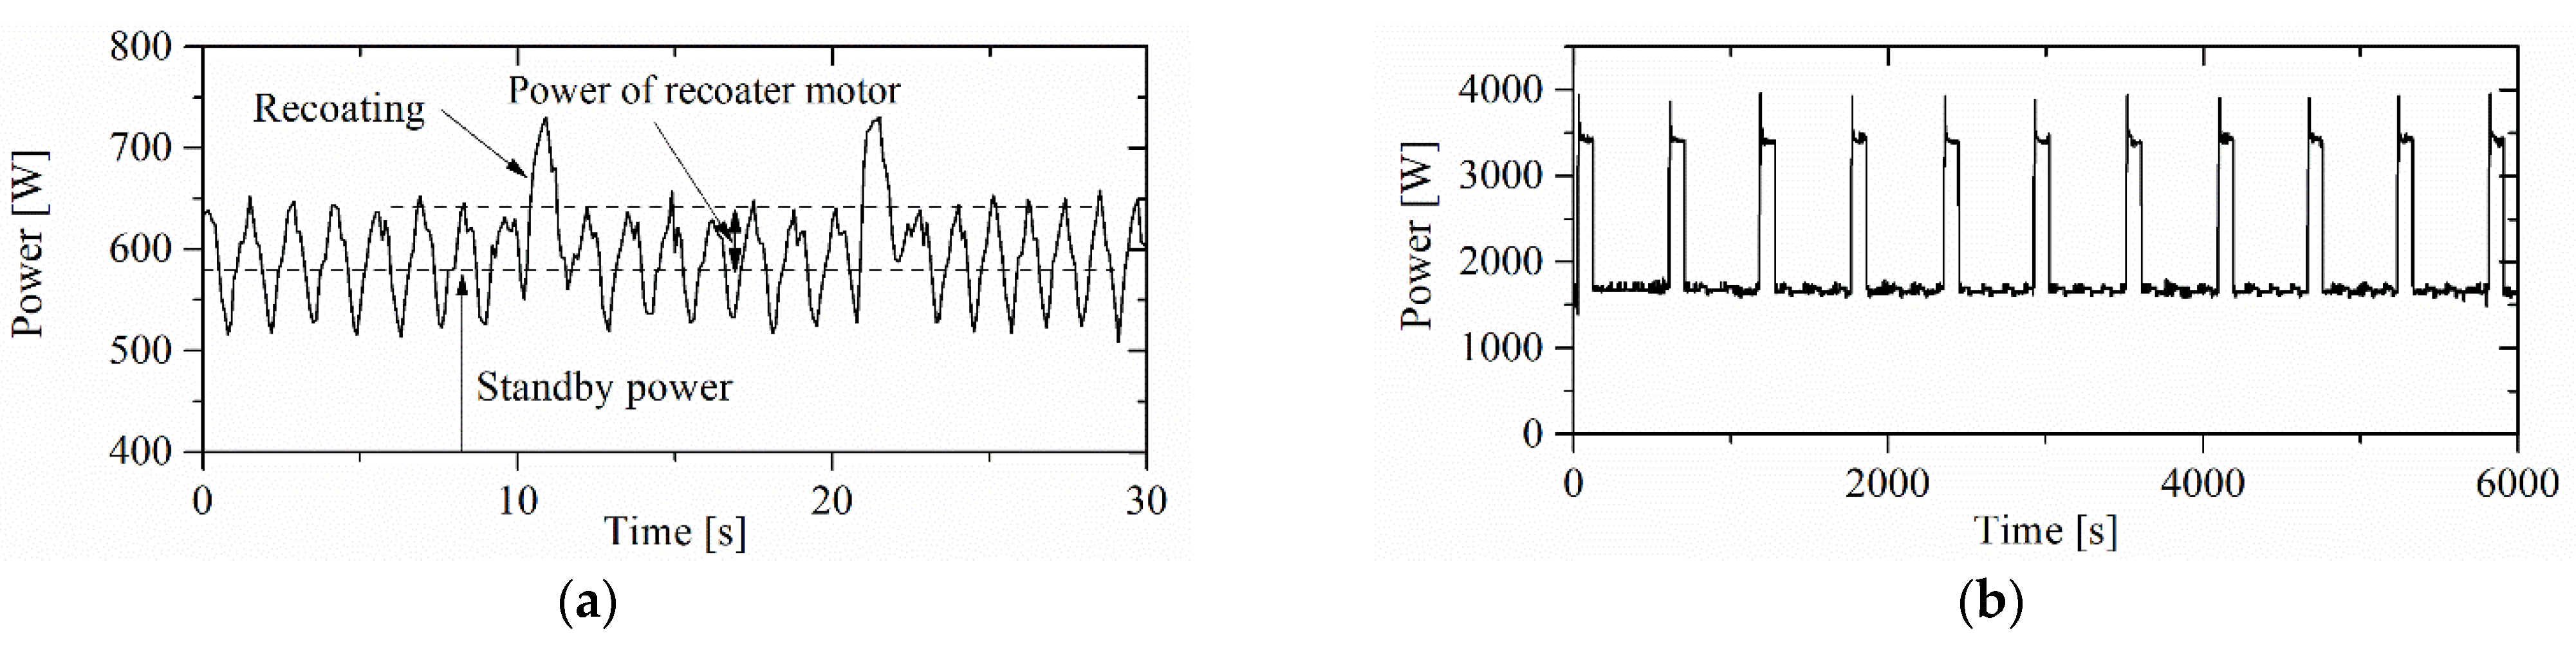
Therefore, this paper presents a detailed methodology to minimize energy consumption and maximize product tensile strength by optimizing process parameters. The AlSi10Mg aluminum alloy was used in the experiment to improve the applicability of research conclusions. The input process parameters optimized in this research are laser power, scan speed, and overlap rate. Meanwhile, the energy consumption for part fabrication during recoating and laser exposure processes is considered.
The rest of the paper is organized into three sections. 
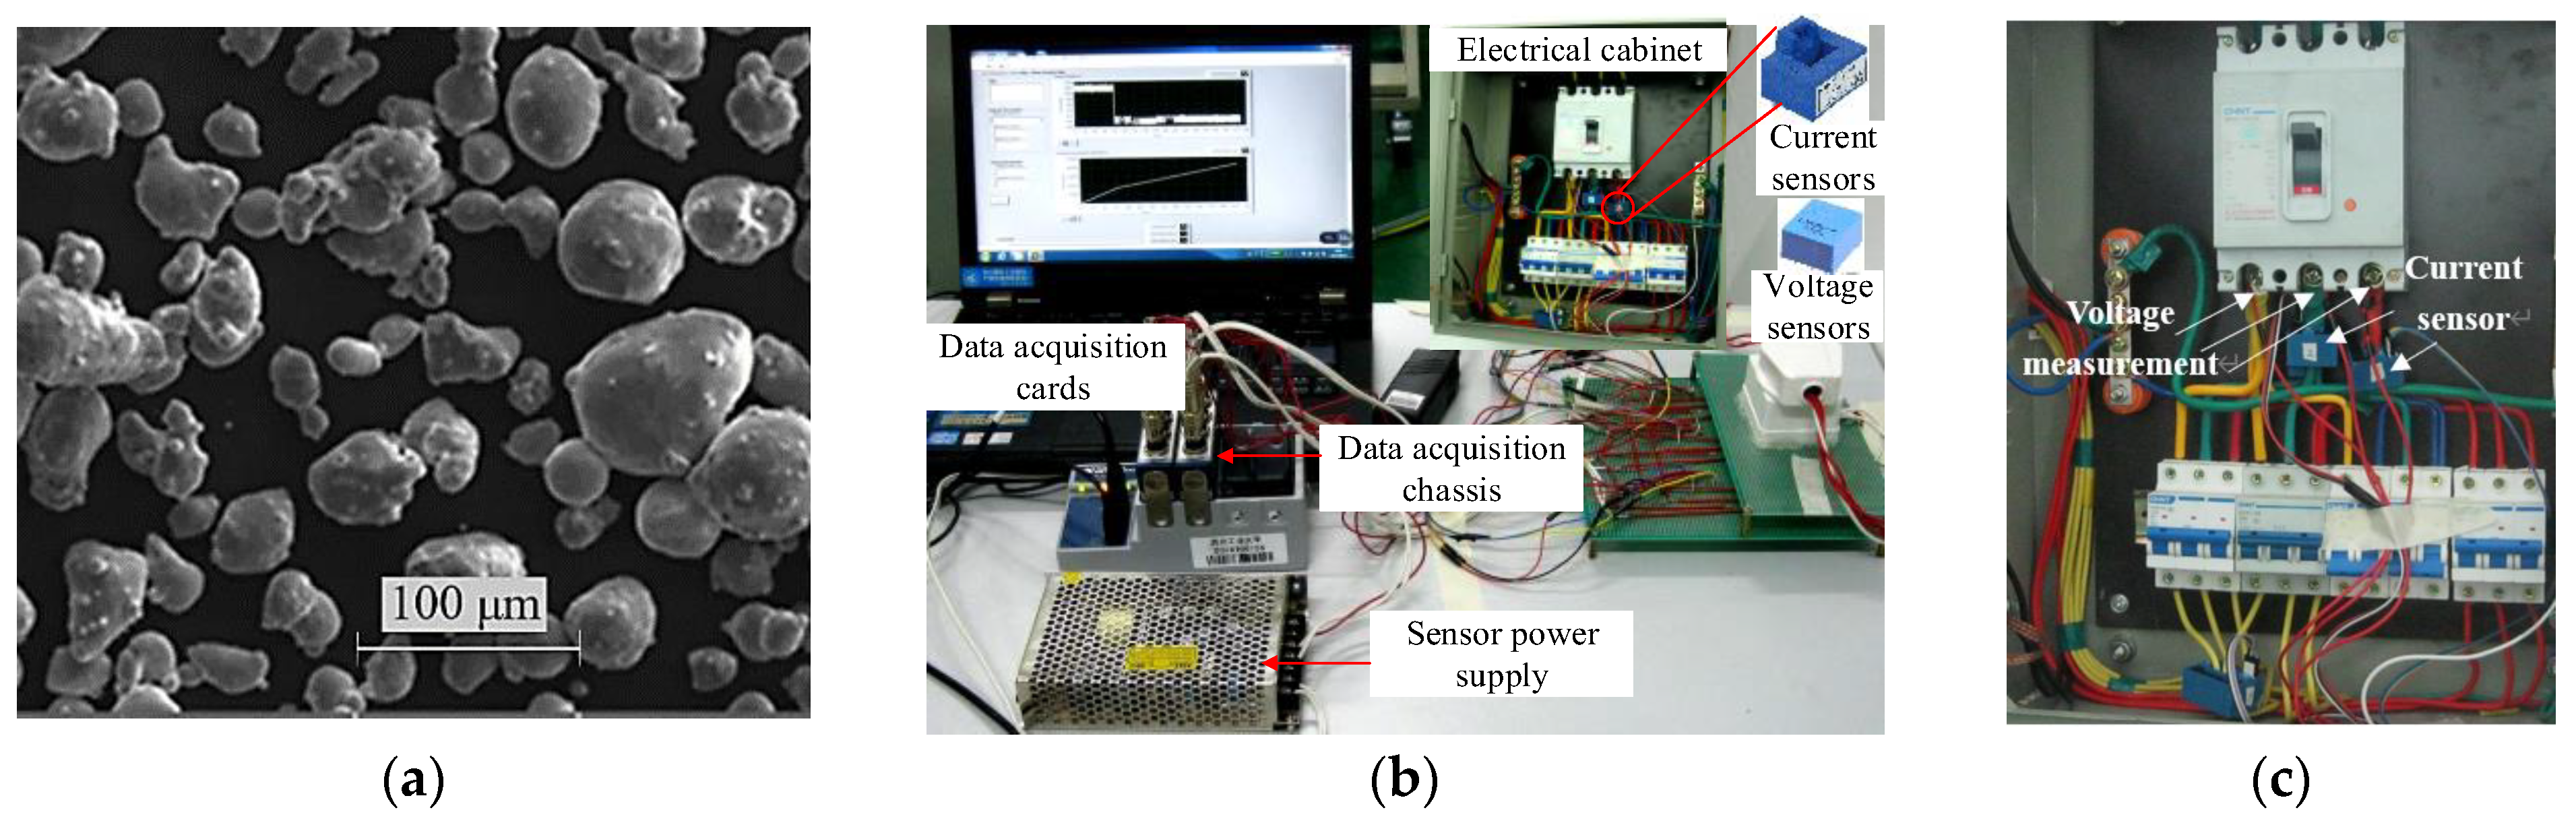
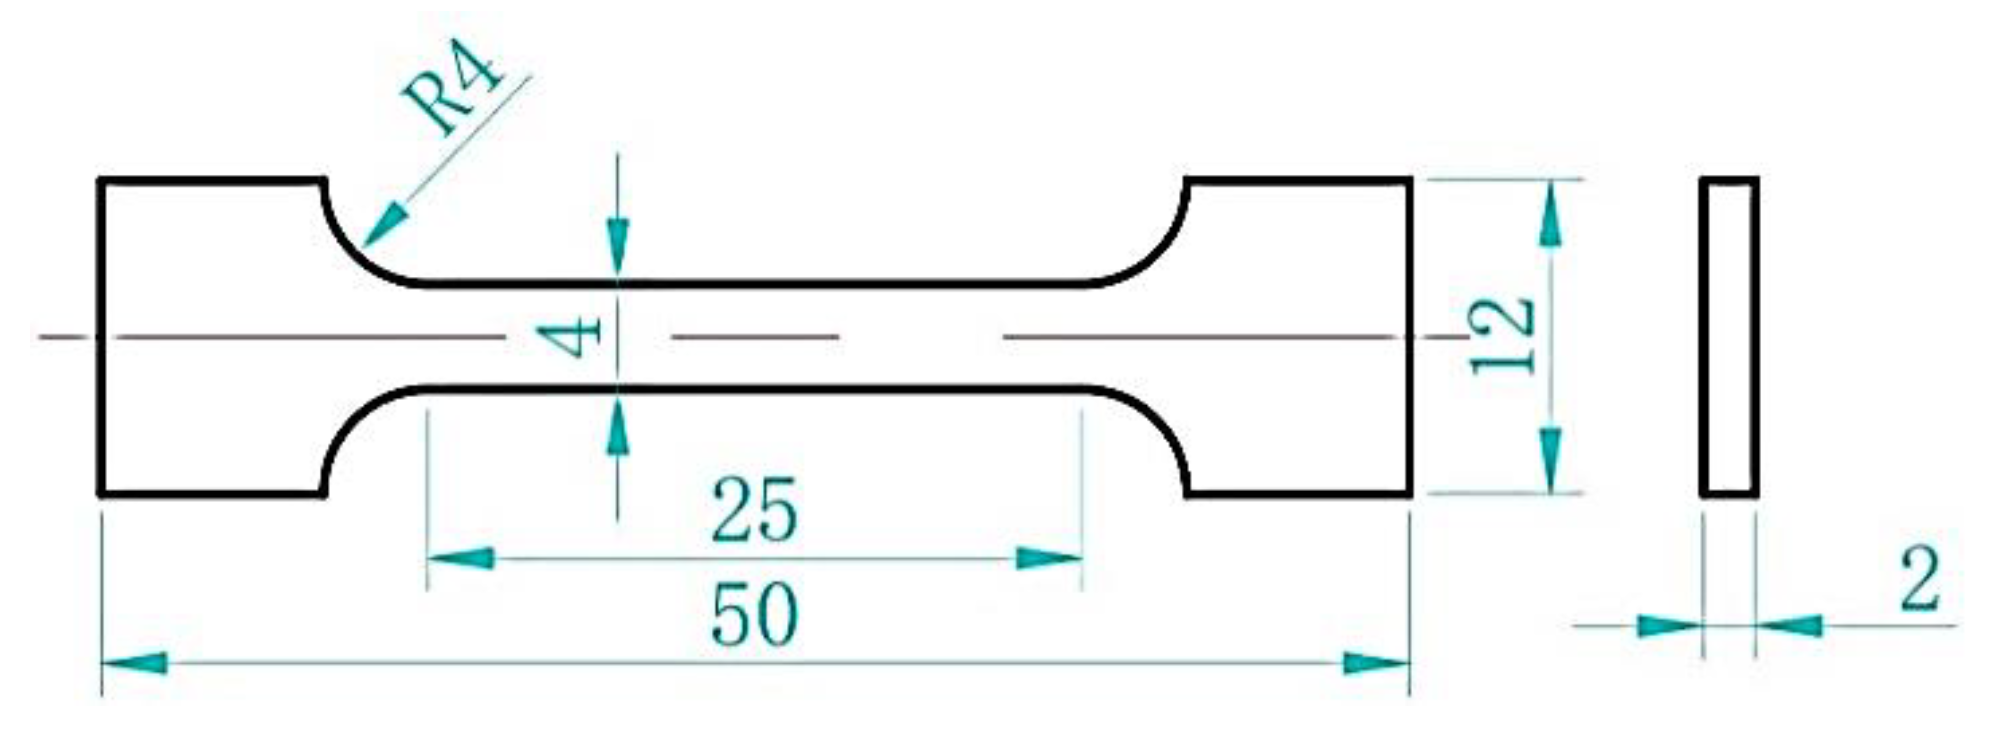
Section 2 shows the material properties, presents the experimental setup and design, and describes the methodology developed in this paper to minimize energy consumption and maximize the product tensile strength, including the experimental procedure, theory model, and optimization. Section 3 presents the general results, identification of constraints, model acquisition, and discussion of the optimization result. Finally, Section 4 discusses the conclusions and future research directions.

2. Materials and Methods

The material properties and the process methods are the foundation of SLM production. The target material is the widely used AlSi10Mg alloy. The methodology proposed to study the SLM process includes the following parts: the experiment setup, experimental procedure, theory model and optimization.

2.1. Material and Experimental Setup

Aluminum alloys have been widely used in industrial applications, particularly in aerospace and automotive industries, due to their excellent mechanical and electrical properties [36,37]. For the SLM process, AlSi10Mg is the most commonly-used Al alloy due to its lower coefficient of thermal expansion, which could eliminate the solidification and liquation cracking of the fabricated parts [38]. Therefore, in this study, we select AlSi10Mg as the material. A gas-atomized AlSi10Mg powder supplied by SLM Solutions (Lübeck, Germany) with an average particle diameter of 35 μm was used in this experiment. A Tescan (Brno, Czech Republic) VEGA 3 LMU Scanning Electron Microscope (SEM) was used to analyze the particle size of the starting powders, as shown in Figure 1a. The powder has near-spherical particles and consists of a large number of small particles. The small particles may lead to the high energy absorption of the laser beam due to the increased specific surface area of the material [39]. Table 1 shows the chemical compositions of the AlSi10Mg alloy. The powder was dried in drying ovens at 373 K before it was used to fabricate the samples.
Experiments were performed on an SLM 280HL facility by SLM Solutions(Lübeck, Germany). The machine is equipped with two 400 W fiber lasers made by IPG Photonics (Oxford, MA, USA) operating with a beam focus diameter of 80 μm. The process chamber provides a closed environment filled with argon gas. The oxygen level is decreased below 0.1% to prevent the oxidization of the metal powder. The operational temperature of the substrate was fixed at 423 K to reduce the manufactured parts’ thermal stress due to uneven temperature distribution.
To measure the energy consumption during the SLM process, self-developed power data acquisition equipment with three LEM (Meyrin, Switzerland) LV25-P voltage sensors and three HAS 50-S current sensors were used to capture the energy consumption during the SLM process. Figure 1b,c graphically present the energy data acquisition equipment. The power consumption of the auxiliary system is the difference between the energy consumption of the whole system and the SLM machine. The auxiliary system and the SLM machine (except the recoater system and laser system) always work together. Thus, they can be regarded as a basic system. The energy consumption of this basic system is called the basic power P B . The power consumption of auxiliary systems is contained in the basic power. Here, the basic power P B refers to the power consumed by these components, including computer and screen, control unit, light, heater, cooling system, and gas circulation system. The energy data acquisition equipment measures P B in Figure 1b.
For quality testing of the samples, an optical inverted metallurgical microscope (GX51, Olympus, Tokyo, Japan) with a built-in front camera port was employed to observe the surface morphology of the samples of single tracks and single layers at the magnification of 100. The tensile tests were performed on the electromechanical universal testing machine made by Instron (Norwood, MA, USA).

2.2. Experimental Procedure

2.2.1. Acquiring the Power Data

An experimental procedure is designed to acquire the power data of the SLM machine. First, the machine was started up to be in idle mode, and the recoater motor was controlled to move back and forth. Then, the power demand of the recoater motor was measured. Second, the machine was commanded to keep operational readiness, and basic power was measured. Third, laser power consumption was measured with a laser operating with different output power levels (0–400 W).

2.2.2. Producing SLM Samples

The SLM process parameters of laser power, scan speed, and overlap rate were selected as variables in this research. The layer thickness of 30 μm was fixed. These variables will be discussed further in the following sections. Single tracks and single layers were first scanned to determine the constraints of the process parameters for AlSi10Mg. Then, tensile samples were produced to test the tensile strength of the parts. A full factorial experimental design was employed.
Single tracks were scanned on 3A21 aluminum substrates by SLM at the laser power of 300–400 W and a scan speed of 300–1050 mm/s. The parameters were varied every 20 W and 150 mm/s, with levels of process parameters as shown in Table 2. A total of 36 groups of experiments were conducted. The length of the scan line was 10 mm for all experiments. The processing condition for each sample made in a single layer was repeated at least thrice. The width of a single track was measured thrice, and the average value was used for each processing condition.
Single layers were processed with four levels of overlap rates (0.20, 0.25, 0.30, and 0.35), three levels of laser powers (320 W, 360 W, 400 W), and scan speeds (600 mm/s, 750 mm/s, 900 mm/s), as shown in Table 3. The single layer size was designed to be 8 mm × 8 mm, and the observations of the single layer were repeated thrice for each processing condition. Figure 2a illustrates the sample of the single layer experiment.
Multiple layer samples were fabricated with laser powers (320 W, 360 W, 400 W), scan speed (600 mm/s, 750 mm/s, 900 mm/s) and overlap rate (0.25, 0.30, 0.35). A checkerboard linear scanning strategy was chosen during the fabrication of test specimens. The linear scanning direction rotates at 67° for the next processing powder layer [40]. Processing conditions for the multiple layers were selected because the tracks in the single layer are well-connected. For each combination of parameters, one cuboid sample with a dimension of 10 mm × 52 mm × 14.5 mm was produced, as shown in Figure 2b. A total of 27 cuboid samples were manufactured to make tensile examples. Electrical discharge machining (EDM) cut the samples from the substrate. Each cuboid bulk part was further cut into three samples for tensile strength testing, as shown in Figure 3. The width and length of the narrow sample section were 4 mm and 25 mm. The tensile sample’s thickness and total length were 2 mm and 50 mm. The tensile standard was designed according to GB/T228.1-2010. Measurements were conducted thrice for each processing condition, and the average tensile strength values were reported.
Finally, the case study has been done. A waveguide part used in the radar industry was produced by the SLM method. It is used for transmitting electromagnetic waves while it bears wind loads, inertia loads, self-weight loads, as well as snow and ice loads due to the harsh working environment of the radar. Therefore, tensile strength, which determines the ability of a part to resist plastic deformation, is the essential quality requirement. The waveguide part has a height of about 77.2 mm.

2.3. Theory Model and Optimization

2.3.1. Constraints of Process Parameters

The SLM method is a complex manufacturing technology with many parameters. Considering too many parameters enlarges the numerical model and workload and easily loses focus of the study. Therefore, the optimization study should consider only the main SLM parameters.
In SLM, laser power, scanning speed, hatch spacing, and layer thickness are the typical process parameters adjusted to optimize the process [41]. The layer thickness was chosen to balance achieving acceptable resolution and allowing for good powder flowability [42]. It was a sensitive parameter generally obtained by experience. Therefore, the layer thickness of 30 μm was fixed according to the machine manufacturer’s recommendations. During the SLM process, the metal powders come a part by the diffusion of the adjacent lines’ overlap. The overlap rate is the foundation parameter, especially for the strength of the SLMed part. Therefore, it is necessary to determine the overlap rate at the first step of the SLM process. Furthermore, the overlap rate is closely related to surface roughness, porosity, and mechanical properties. Generally, a higher overlap rate results in better surface roughness, lower porosity, and better mechanical properties. This study calculated hatch spacing based on measured single track width values and the overlap rate. So, we can adjust the overlap rate by adjusting the hatch distance in the SLM system. Therefore, the process parameters of laser power, scan speed, and overlap rate were selected as variables. Furthermore, the research focused on the constant wave laser (a continuous wave laser). The laser frequency and pulse energy were not considered, because they are only conducted in the case of pulsed laser [43].
Many types of metallic components, including ferrous, nickel, titanium, and lightweight alloys, could be produced using SLM technology. The process parameters vary considerably due to the different properties of metal powders [44]. Quality requirements, such as the continuous single track, must be met for a component fabricated using SLM technology. Consequently, the upper and lower limits of the process parameters can be determined through the morphology observation of the samples manufactured by the SLM process. First, the samples with a single track are produced and observed to identify the proper laser powers and scanning speeds which are used to fabricate continuous and consistent single tracks. Second, the samples with a single layer are manufactured and observed to determine the suitable overlap rate to make a sound interconnection of neighboring tracks. Then, the constraints of the process parameters can be expressed as follows:
{ P L 0   m i n P L 0 P L 0   m a x v m i n v v m a x   o m i n o o m a x ,
where P L 0 is laser power (W), v is scanning speed (mm/s), and o is the overlap rate. The subscripts min and max refer to the lower and upper limits of the corresponding process parameters. This study considers the layer thickness a constant value (30 μm).

2.3.2. Modelling of Energy Consumption

The SLM process for part fabrication includes three steps: recoating, laser exposure, and lowering the build platform. First, the recoater deposits an even metal powder coating on the substrate where the part is produced. Second, the laser beam selectively scans the powder and melts the material tracing the layer geometry. Third, the build platform is lowered by the prespecified layer thickness as a final step. These three steps are repeated until the last layer is scanned. The energy spent to lower the platform can be ignored because the distance to move and the associated time is very short. Accordingly, the energy consumption E during the part fabrication process includes two parts, which are expressed as
E = E R + E L ,
where E R and E L are the energy consumed by the SLM machine during recoating and laser exposure processes, respectively. The recoating energy consumption E R can be expressed as the product of recoating power consumption and recoating time.
E R = ( P R + P B ) t R ,
where P R is the power consumption of recoater motor, P B is the basic power, and t R is the time consumed during the recoating process. During the fabrication process, many components of the SLM machine are run to maintain the operational readiness of the machine. The basic power P B refers to the power consumed by these components. The recoating time t R can be expressed as
t R = N t r ,
where N is the number of slices of the part to be fabricated, and t r is the time required to recoat a new powder layer. The energy consumed during the laser exposure process E L is calculated as
E L = ( P L + P B ) t L ,
where P L is the power consumption of laser, which can be further estimated as a linear function of laser output power consumption. t L is the time consumption for laser exposure.
P L = P L 1 + P L 0 / η ,
where P L 1 is the constant power consumption of the laser, P L o is the output power of the laser, and η is the energy conversion efficiency of the laser. The time consumption for laser exposure t L can be calculated as
t L = i = 1 N S i v D / 1000 = 1000 i = 1 N S i Δ y v D Δ y = 1000 V v D Δ y ,
where N is the number of the layers for producing the part, i is the i-th layer, V is the volume of the part to be fabricated (mm3), v is the scanning speed (mm/s), D is the hatch distance (μm), and Δ y is the layer thickness (mm), and S i . is the area of the i layer (mm2). The hatch distance D is calculated as
D = W ( 1 O ) ,
where W is the width of the single track (μm) and O is the overlap rate. Usually, the supporting structures and core area of the parts are built with different combinations of parameters. For instance, high scanning speed and large layer thickness could be used to build the supporting structure because the supports have no strict limitations concerning quality. Meanwhile, the core area of the parts could be built with smaller process parameters to ensure the part’s density and strength. The total energy consumed during the laser exposure process equals the sum of the energy consumed for fabricating supports and parts.

2.3.3. Modeling of Single Track Width and Tensile Strength

Predicting the fabricated parts’ track width and tensile strength is difficult when using physical models. To deal with the above problems, RSM, which is widely used in engineering based on experiments and statistical analysis, is employed. RSM uses experimental data to explore the relationships between explanatory and response variables [45]. This method can express the response variables by a second-order polynomial equation, as shown in Equation (9)
Y = b 0 + b i x i + b i i x i 2 + b i j x i x j ,
where Y is a response variable, x i represents the explanatory variables, i and j are the i-th and j-th, b 0 is a constant term, b i is a coefficient of the linear variable, b i i is a coefficient of quadratic variable, and b i j is a coefficient of interaction variables x i and x j .
In this study, the data of the RSM were collected from whole factorial experiments. The second-order model is fitted with observed data through regression analysis to obtain the mathematical expressions of single track width and tensile strength.

2.3.4. Objective Functions and Solving Algorithm of the Optimization Model

The objectives considered are the tensile strength of the manufactured part and the total energy required for the SLM process. The decision variables are the laser power, scanning speed, and overlap rate. Thus, the multi-objective optimization problem can be summarized as follows:
min F ( E ,   T ) = [ E ( P L 0 , v , o ) , T ( P L 0 , v , o ) ] ,   subject   to   { P L 0   m i n P L 0 P L 0   m a x v m i n v v m a x   o m i n o o m a x  
where E ( P L 0 , v , o ) and T ( P L 0 , v , o ) are functions of energy consumption and tensile strength, respectively, and min F ( E ,   T ) is the vector objective function.
The NSGA-II is selected to solve the multi-objective optimization problems owing to its wide use in engineering. NSGA-II is an extension version of NSGA [46]. Figure 4 shows the flow chart of NSGA-II. At the beginning of the algorithm, an initial population P 0 of size N is randomly generated. All the individuals of P 0 are sorted using the non-dominant sorting and crowding distance sorting procedures. For each individual, the non-domination ranks and crowding distance are assessed. An individual X dominates individual Y if X is not worse than Y in all objectives and strictly better than Y in at least one objective. The individuals that are not dominated by any other individuals in the objective space constitute the non-dominated set at the first level (Pareto front with rank 1). The individuals that are dominated only by individuals with non-domination rank 1 form the Pareto front 2 and so on [47]. The crowding distance of an individual is the sum of the distance between the individual and its left and right neighbors for each objective function, which is calculated as [48]
d I j = m = 1 M f m I j + 1 m f m I j 1 m f m m a x f m m i n ,
where d I j is the crowding distance of j-th individual, I j is the current population, M is the number of objectives, f m is the m-th objective function, j 1 and j + 1 are the left and right neighbors of the j-th individual, and max and min are the maximum and minimum values of the objective function of the current population. The crowding distances of extreme solutions are assigned to infinity [49]. The individual with the lower rank is selected from two individuals with differing non-domination ranks. If the two individuals belong to the same rank, the one with a larger value in the crowding distance is selected [46].
Crossover is used to generate offspring from parents. Simulated binary crossover is used, and the arithmetic crossover function is given as
O 1 = 0.5 ( 1 + γ ) P 1 + 0.5 ( 1 γ ) P 2 ,
O 2 = 0.5 ( 1 γ ) P 1 + 0.5 ( 1 + γ ) P 2 ,
where P 1 is parent 1, P 2 is parent 2, O 1 is offspring 1, O 2 is offspring 2, and γ is a crossover coefficient and calculated as
γ = { ( 2 u ) 1 η c + 1 ,   i f   u 0.5 ( 1 2 2 u ) 1 η c + 1 ,   e l s e ,
where u is a random number between 0 and 1, η c is the distribution index for crossover and suggested to be 20 [46].
A mutation is used to maintain the diversity of individuals from one generation to the following [47]. The polynomial mutation is given as
O = { O + ( 2 r ) 1 η m + 1 1 ,   i f   r 0.5 O + 1 ( 2 2 r ) 1 η m + 1 ,   e l s e ,
where O is the offspring, r is a random number between 0 and 1, and η m is the distribution index for mutation and is suggested to be 20 [46].

3. Results and Discussion

3.1. General Results

All the process parameters were set as designed. With different SLM process parameters of laser power, scan speed, and overlap rate, 36 single layer samples and 27 cuboid samples (multiple layers) of experiments were conducted, as shown in Figure 5. Energy consumption was also obtained. Then, the surface of the samples was tested by the microscope.
The tensile samples were cut from the SLMed cuboid bulk part. Then the samples were tested to obtain the tensile strength. When laser power, the scan speed, and the overlap rate are 360 W, 900 mm/s, and 0.35, respectively, the tensile curve of the sample is shown in Figure 6. The tensile strength of this sample is 446.7 MPa.
The waveguide part is fabricated on the SLM 280HL facility (SLM Solutions, Lübeck, Germany), as shown in Figure 7. The powder layer thickness is 30 μm, and the parts were cut into 2573 slices. One laser is used to melt the metal powder during the fabrication process. This research is limited to parameter optimization for manufacturing core parts. The volume of the support structure was not considered because it is automated generated by the software and has no relationship with the tensile strength of the part. The support structure will be removed after the part fabrication has been finished. The process parameters to fabricate supports are taken according to the worker’s experience: laser power of 350 W, scan speed of 1000 mm/s, and hatch distance of 0.18 mm.

3.2. Identification of Constraints

Figure 8 presents the surface morphologies of single tracks. The surface of a single track is unstable at a scan speed below 600 mm/s or above 900 mm/s. At a low scan speed, excessive energy is absorbed by the materials due to the long interaction time between the laser beam and the powder. This scenario could lead to an extremely high temperature of molten pool and single tracks with an unstable surface [39]. By contrast, at a higher scan speed (1100 m/s), materials cannot absorb sufficient energy to melt the particles and initiate a balling effect, leading to unstable and irregular tracks. At a laser power of 300 W, the tracks exhibit an uneven surface consisting of disconnected balls.
Within the ranges of laser power between 300 and 400 W and scan speed between 600 and 900 mm/s when good consolidation of single tracks is observed, the widths of stable single tracks were measured, ranging from 102.9 to 155.2 μm (see Table 4). The track width increases with the increase of laser power and the decrease of scan speed. With the data of track widths, hatch distances were calculated using Equation (8).
Figure 9 presents the processing images of single layers fabricated with four levels of overlap rates (0.20, 0.25, 0.30, and 0.35). The laser power is 320 W, and the scan speed is 750 mm/s. The neighbor tracks fail to achieve a sound interconnection with an overlap rate of 0.20 because the hatch distance is large. When the overlap rate increases to 0.30 and 0.35, the tracks are regularly and well connected to form the dense and smooth surface of a single layer. As a result, the overlap rates ranging from 0.25 to 0.35 are selected. From the above analysis, the constraints are:
subject   to   { 320 P L 0 400 600 v 900       0.25 o 0.35   ,

3.3. Model Acquisition

Figure 10 shows the measured basic power and recoater motor power. The power fluctuates due to the intermittent running of the heater and water-cooling unit. Thus, the average values of P R = 52.1 W and P B = 1981.7 W represents the recoater motor power and basic power, respectively. The average values of P R and P B   are both arithmetic mean. The average value of P R is the average power consumption of recoater motor in the time of 11 s to recoat one layer, as shown in Figure 10a. The average values of P B   is the average of the basic power from 0 s to 6000 s, shown in Figure 10b. The power consumption of a single laser is measured, and its power model is obtained via regression analysis, as shown in Figure 11.
With the time of 11 s to recoat one layer, the recoating time is calculated to be 28,303 s. According to Equations (7) and (8), the time of laser exposure for manufacturing supports is 1214 s, and laser exposure time for manufacturing core parts is expressed as:
t L = 19,954,000   v Δ y W ( 1 o ) ,
According to Equation (9), the model of track width W is obtained based on the experimental data in Table 3, as shown in Equation (18).
W = 111.5 + 0.528 P L 0 0.2041 v 0.000471 P L 0 2 + 0.000065 v 2 + 0.000027 P L 0 v   ( R 2 = 0.996 ) ,
By substituting the obtained power and time models into Equations (2)–(5), the total energy consumption can be expressed as:
E = 57,554,151 + ( 2.52 P L 0 + 2110.86 ) 19,954,000   v Δ y W ( 1 o ) ,
For the modeling of tensile strength T, 18 sets of experimental data were selected randomly from the L27 orthogonal array as the input values, as listed in Table 5. The second-order polynomial model developed by regression analysis is as:
T = 864 0.93 P L 0 0.051 v 1401 o + 0.00116 P L 0 2 0.000059 v 2 + 654 o 2 0.000487 P L 0 v + 1.02 P L 0 o + 0.943 v o
Table 6 summarizes variance (ANOVA) results for the tensile strength model. The R-squared value exceeds 0.92, which indicates that the regression fits the original data well, and the empirical model can explain more than 92% of the variance of the measured data. The F-values exceed 10.3, implying a significant correlation between the tensile strength and the process parameters. The small p-value (only 0.00156) means the obtained model is statistically significant. Using the obtained model, the tensile strength values were predicted and compared with the experimental data that have not been used for modeling, as shown in Table 7 with 9 validation experiments. Overall, the derived model achieves over 95.4% accuracy in predicting the tensile strength. Hence, it can be used as an effective model for predicting tensile strength.

3.4. Optimization Result

The optimization model is based on the former model as objective functions. Thus, the predicted data of the optimization model are effective without requiring additional experimental validation. The multi-objective optimization problem is solved by the NSGA-II algorithm in MATLAB 2016b software (Natick, MA, USA). Referring to similar studies [50,51], the algorithm is implemented with an initial population size of 100, maximum evolution generation of 300, crossover rate of 0.8, and mutation rate of 1/n, where n is the number of decision variables. Figure 12 shows the obtained Pareto fronts by NSGA-II for the parameter optimization problem. The optimization model is a method to find the best parameters. Thus, it can be validated by comparing the result of SLM based on the optimization and general parameters. To demonstrate the effectiveness of NSGA-II in solving the problem, we use four scenarios to conduct comparison studies. Scenario 1 (S1) represents the optimal results of the two-objective optimization problem shown above. Single-objective optimization problems of minimizing energy consumption (Scenario 2 [S2]) or maximizing tensile strength (Scenario 3 [S3]) are designed. In Scenario 4 (S4), the process parameters are determined by the experience of the workers, which have not been optimized. In S1 and S2, the problems are solved by a genetic algorithm in MATLAB software. Table 8 presents the comparison results.
According to Table 8, the values of laser power and scan speed obtained in S2 are highest to minimize energy consumption. Increasing laser power and scan speed could shorten the laser exposure time, reducing energy consumption. By contrast, the values of laser power and scan speed obtained in S3 are the lowest to maximize the tensile strength, which might be due to the relatively large energy input per unit length (laser power divided by scan speed) caused by the decrease in scan speed. The process parameters obtained by NSGA-II in S1 achieve a tradeoff of energy consumption and tensile strength, leading to better tensile strength performance than those in S2 and less energy consumption than those in S3. The tensile strength of S1-No.2 could be improved by 6.6%, while the energy consumption only increases by 3.4% more than those of S2. The energy consumption of S1-No.2 could be saved by 4.5%, while the tensile strength only decreases by 2.7% more than those of S3. For comparison between S4 and S1, the tensile strength of S1-No.3 could be improved by 2.6% with the same energy consumption (87.7 MJ). With the same tensile strength (440.0 MPa), the energy consumption of S1-No.2 can be reduced by 3.4%. The improvement is insignificant, which could be due to the manufacturer’s carefully designed parameters. Additionally, the process window has been narrowed in the determination of constraints. In practice, this method can be used for new types of material in determining the optimal parameters to improve the quality and sustainability performance of the SLM process.

4. Conclusions

Part quality and process energy consumption are critical for applying AM technologies in the industry, and they are both closely related to process parameters. This article proposes an analysis model of process energy consumption and a statistical model of part tensile strength. Experiments were conducted to obtain the mathematical model of both objectives. The multi-objective optimization of process energy consumption and product tensile strength was solved by NSGA-II. Based on the theoretical and experimental investigation, some conclusions can be drawn:
  • The constraints of the process parameters of fabricating the parts using the SLM process are 320 W ≤ laser power ≤ 400 W, 600 mm/s ≤ scan speed ≤ 900 mm/s, and 0.25 ≤ overlap rate ≤ 0.35.
  • Track width increases with the increase of laser power and the decrease of scan speed. The second-order polynomial model could achieve an accuracy of over 95.4% for predicting tensile strength.
  • The energy consumption and tensile strength could be simultaneously optimized. Hence, 2.6% of tensile strength could be improved and 3.4% of energy consumption could be saved.
The proposed method could minimize the process energy and maximize the part tensile strength of an AM process by optimizing the process parameters. This method is beneficial for identifying the process parameters of new material because it can determine the constraints of process parameters from a single track and single layer experiments. Further research will be conducted to extend this work to optimize energy consumption and other quality performances, such as dimensional accuracy and surface roughness.

Author Contributions

Conceptualization, C.Z., T.P. and J.L.; data curation, C.Z. and X.C.; formal analysis, C.Z. and X.C.; funding acquisition, C.Z.; investigation, C.Z., X.C., H.W. and T.P.; project administration, J.L.; resources, J.Z.; software, J.Z. and Y.W.; supervision, T.P. and J.L.; validation, Y.W.; visualization, Y.W.; writing—original draft, C.Z. and J.L.; writing—review & editing, H.W. and T.P. All authors have read and agreed to the published version of the manuscript.

Funding

This research was funded by the Natural Science Foundation of Shaanxi Province, China: 2021JQ-278; the Project of Insight Action, China: 1A0A9FC6; Fundamental Research Funds for the Central Universities, CHD: 300102250304; Xi’an Qin Chuangyuan’s Innovation-Driven Platform Construction Special Project: 21ZCZZHXJS-QCY6-0013.

Data Availability Statement

The data that support the findings of this study are available from the corresponding author upon reasonable request.

Conflicts of Interest

The authors declare no conflict of interest. The funders had no role in the design of the study; in the collection, analyses, or interpretation of data; in the writing of the manuscript; or in the decision to publish the results.

References

  1. Sun, W.; Xu, X.; Lv, Z.; Mao, H.; Wu, J. Environmental impact assessment of wastewater discharge with multi-pollutants from iron and steel industry. J. Environ. Manag. 2019, 245, 210–215. [Google Scholar] [CrossRef]
  2. Sun, W.; Zhou, Y.; Lv, J.; Wu, J. Assessment of multi-air emissions: Case of particulate matter (dust), SO2, NO and CO2 from iron and steel industry of China. J. Clean. Prod. 2019, 232, 350–358. [Google Scholar] [CrossRef]
  3. Peng, T.; Kellens, K.; Tang, R.; Chen, C.; Chen, G. Sustainability of additive manufacturing: An overview on its energy demand and environmental impact. Addit. Manuf. 2018, 21, 694–704. [Google Scholar] [CrossRef]
  4. Gutowski, T.; Jiang, S.; Cooper, D.; Corman, G.; Hausmann, M.; Manson, J.-A.; Schudeleit, T.; Wegener, K.; Sabelle, M.; Ramos-Grez, J.; et al. Note on the Rate and Energy Efficiency Limits for Additive Manufacturing: Rate and Energy Efficiency Limits for AM. J. Ind. Ecol. 2017, 21, S69–S79. [Google Scholar] [CrossRef]
  5. Telenko, C.; Seepersad, C.C. A comparison of the energy efficiency of selective laser sintering and injection molding of nylon parts. Rapid Prototyp. J. 2012, 18, 472–481. [Google Scholar] [CrossRef]
  6. Xu, X.; Meteyer, S.; Perry, N.; Zhao, Y.F. Energy consumption model of Binder-jetting additive manufacturing processes. Int. J. Prod. Res. 2015, 53, 7005–7015. [Google Scholar] [CrossRef]
  7. Yang, Y.; Li, L.; Pan, Y.; Sun, Z. Energy Consumption Modeling of Stereolithography-Based Additive Manufacturing Toward Environmental Sustainability. J. Ind. Ecol. 2017, 21, S168–S178. [Google Scholar] [CrossRef] [Green Version]
  8. Tian, W.; Ma, J.; Alizadeh, M. Energy consumption optimization with geometric accuracy consideration for fused filament fabrication processes. Int. J. Adv. Manuf. Technol. 2019, 103, 3223–3233. [Google Scholar] [CrossRef]
  9. Paul, R.; Anand, S. Process energy analysis and optimization in selective laser sintering. J. Manuf. Syst. 2012, 31, 429–437. [Google Scholar] [CrossRef]
  10. Qin, J.; Liu, Y.; Grosvenor, R.; Lacan, F.; Jiang, Z. Deep learning-driven particle swarm optimisation for additive manufacturing energy optimisation. J. Clean. Prod. 2019, 245, 118702. [Google Scholar] [CrossRef]
  11. Liu, Z.; Jiang, Q.; Ning, F.; Kim, H.; Cong, W.; Xu, C.; Zhang, H.-C. Investigation of Energy Requirements and Environmental Performance for Additive Manufacturing Processes. Sustainability 2018, 10, 3606. [Google Scholar] [CrossRef] [Green Version]
  12. Strano, G.; Hao, L.; Everson, R.M.; Evans, K.E. Multi-objective optimization of selective laser sintering processes for surface quality and energy saving. Proc. Inst. Mech. Eng. Part B J. Eng. Manuf. 2011, 225, 1673–1682. [Google Scholar] [CrossRef]
  13. Li, J.; Cao, L.; Hu, J.; Sheng, M.; Zhou, Q.; Jin, P. A Prediction Approach of SLM Based on the Ensemble of Metamodels Considering Material Efficiency, Energy Consumption, and Tensile Strength. J. Intell. Manuf. 2022, 33, 687–702. [Google Scholar] [CrossRef]
  14. Camposeco-Negrete, C. Optimization of printing parameters in fused deposition modeling for improving part quality and process sustainability. Int. J. Adv. Manuf. Technol. 2020, 108, 2131–2147. [Google Scholar] [CrossRef]
  15. Enemuoh, E.; Duginski, S.; Feyen, C.; Menta, V. Effect of Process Parameters on Energy Consumption, Physical, and Mechanical Properties of Fused Deposition Modeling. Polymers 2021, 13, 2406. [Google Scholar] [CrossRef]
  16. Khorasani, A.M.; Gibson, I.; Awan, U.S.; Ghaderi, A. The effect of SLM process parameters on density, hardness, tensile strength and surface quality of Ti-6Al-4V. Addit. Manuf. 2019, 25, 176–186. [Google Scholar] [CrossRef]
  17. Mahmood, S.; Qureshi, A.; Goh, K.L.; Talamona, D. Tensile strength of partially filled FFF printed parts: Meta modelling. Rapid Prototyp. J. 2017, 23, 524–533. [Google Scholar] [CrossRef]
  18. Yang, Y.; Li, L.; Zhao, J. Mechanical property modeling of photosensitive liquid resin in stereolithography additive manufacturing: Bridging degree of cure with tensile strength and hardness. Mater. Des. 2019, 162, 418–428. [Google Scholar] [CrossRef]
  19. Zhao, Y.; Chen, Y.; Zhou, Y. Novel Mechanical Models of Tensile Strength and Elastic Property of FDM AM PLA Materials: Experimental and Theoretical Analyses. Mater. Des. 2019, 181, 108089. [Google Scholar] [CrossRef]
  20. Li, H.; Wang, T.; Joshi, S.; Yu, Z. The quantitative analysis of tensile strength of additively manufactured continuous carbon fiber reinforced polylactic acid (PLA). Rapid Prototyp. J. 2019, 25, 1624–1636. [Google Scholar] [CrossRef]
  21. Soni, A.; Kumar, S.; Singh, B. Prediction of tensile strength of 3D printed part using response surface methodology. J. Braz. Soc. Mech. Sci. Eng. 2018, 40, 566. [Google Scholar] [CrossRef]
  22. Zhang, J.; Wang, P.; Gao, R.X. Deep learning-based tensile strength prediction in fused deposition modeling. Comput. Ind. 2019, 107, 11–21. [Google Scholar] [CrossRef]
  23. Gordelier, T.J.; Thies, P.R.; Turner, L.; Johanning, L. Optimising the FDM additive manufacturing process to achieve maximum tensile strength: A state-of-the-art review. Rapid Prototyp. J. 2019, 25, 953–971. [Google Scholar] [CrossRef]
  24. Peko, I.; Krolo, J.; Bagavac, P.; Đurić, S.; Basic, A.; Kostić, N. Modeling and Optimization of Tensile Strength of ABS Parts Manufactured by the Fused Deposition Modeling Process. In Proceedings of the International Conference on Mechanical Technologies and Structural Materials, Split, Croatia, 22 September 2017. [Google Scholar]
  25. Lovo, J.F.P.; Fortulan, C.A.; Da Silva, M.M. Optimal deposition orientation in fused deposition modeling for maximizing the strength of three-dimensional printed truss-like structures. Proc. Inst. Mech. Eng. Part B J. Eng. Manuf. 2019, 233, 1206–1215. [Google Scholar] [CrossRef]
  26. Rayegani, F.; Onwubolu, G.C. Fused deposition modelling (FDM) process parameter prediction and optimization using group method for data handling (GMDH) and differential evolution (DE). Int. J. Adv. Manuf. Technol. 2014, 73, 509–519. [Google Scholar] [CrossRef]
  27. Santhakumar, J.; Iqbal, M.; Prakash, M. Investigation on the Effect of Tensile Strength on Fdm Build Parts Us-ing Taguchi-Grey Relational Based Multi-Response Optimization. Int. J. Mech. Eng. Technol. 2017, 8, 53–60. [Google Scholar]
  28. Torres, J.; Cole, M.; Owji, A.; DeMastry, Z.; Gordon, A.P. An approach for mechanical property optimization of fused deposition modeling with polylactic acid via design of experiments. Rapid Prototyp. J. 2016, 22, 387–404. [Google Scholar] [CrossRef]
  29. Singh, D.; Rana, A.; Sharma, P.; Pandey, P.M.; Kalyanasundaram, D. Microwave Sintering of Ti6Al4V: Optimization of Processing Parameters for Maximal Tensile Strength and Minimal Pore Size. Metals 2018, 8, 1086. [Google Scholar] [CrossRef] [Green Version]
  30. Wang, C.; Tan, X.; Liu, E.; Tor, S.B. Process parameter optimization and mechanical properties for additively manufactured stainless steel 316L parts by selective electron beam melting. Mater. Des. 2018, 147, 157–166. [Google Scholar] [CrossRef]
  31. Paul, R.; Anand, S. A combined energy and error optimization method for metal powder based additive manufacturing processes. Rapid Prototyp. J. 2015, 21, 301–312. [Google Scholar] [CrossRef]
  32. Oyesola, M.; Mpofu, K.; Mathe, N.; Fatoba, S.; Hoosain, S.; Daniyan, I. Optimization of selective laser melting process parameters for surface quality performance of the fabricated Ti6Al4V. Int. J. Adv. Manuf. Technol. 2021, 114, 1585–1599. [Google Scholar] [CrossRef]
  33. Li, J.; Hu, J.; Cao, L.; Wang, S.; Liu, H.; Zhou, Q. Multi-objective process parameters optimization of SLM using the ensemble of metamodels. J. Manuf. Process. 2021, 68, 198–209. [Google Scholar] [CrossRef]
  34. Majeed, A.; Ahmed, A.; Lv, J.; Peng, T.; Muzamil, M. A State-of-the-Art Review on Energy Consumption and Quality Characteristics in Metal Additive Manufacturing Processes. J Braz. Soc. Mech. Sci. Eng. 2020, 42, 249. [Google Scholar] [CrossRef]
  35. Peng, T.; Lv, J.; Majeed, A.; Liang, X. An experimental investigation on energy-effective additive manufacturing of aluminum parts via process parameter selection. J. Clean. Prod. 2021, 279, 123609. [Google Scholar] [CrossRef]
  36. Zhang, J.; Song, B.; Wei, Q.; Bourell, D.; Shi, Y. A review of selective laser melting of aluminum alloys: Processing, microstructure, property and developing trends. J. Mater. Sci. Technol. 2019, 35, 270–284. [Google Scholar] [CrossRef]
  37. Garavaglia, M.; Demir, A.G.; Zarini, S.; Victor, B.M.; Previtali, B. Process development and coaxial sensing in fiber laser welding of 5754 Al-alloy. J. Laser Appl. 2019, 31, 022419. [Google Scholar] [CrossRef]
  38. Maamoun, A.H.; Xue, Y.F.; Elbestawi, M.A.; Veldhuis, S.C. The Effect of Selective Laser Melting Process Parameters on the Microstructure and Mechanical Properties of Al6061 and AlSi10Mg Alloys. Materials 2019, 12, 12. [Google Scholar] [CrossRef] [PubMed] [Green Version]
  39. Pei, W.; Wei, Z.; Zhen, C.; Jun, D.; Yuyang, H.; Junfeng, L.; Yatong, Z. The AlSi10Mg Samples Produced by Selective Laser Melting: Single Track, Densification, Microstructure and Mechanical Behavior. Appl. Surf. Sci. 2017, 408, 38–50. [Google Scholar] [CrossRef]
  40. Wang, L.-Z.; Wang, S.; Wu, J.-J. Experimental investigation on densification behavior and surface roughness of AlSi10Mg powders produced by selective laser melting. Opt. Laser Technol. 2017, 96, 88–96. [Google Scholar] [CrossRef]
  41. Yap, C.Y.; Chua, C.K.; Dong, Z.L.; Liu, Z.H.; Zhang, D.Q.; Loh, L.E.; Sing, S.L. Review of selective laser melting: Materials and applications. Appl. Phys. Rev. 2015, 2, 041101. [Google Scholar] [CrossRef]
  42. Chalker, P.R.; Clare, A.; Davies, S.; Sutcliffe, C.J.; Tsopanos, S. Selective Laser Melting of High Aspect Ratio 3D Nickel—Titanium Structures for MEMS Applications. MRS Online Proc. Libr. 2006, 890, 302. [Google Scholar] [CrossRef]
  43. Papazoglou, E.L.; Karkalos, N.E.; Karmiris-Obratański, P.; Markopoulos, A.P. On the Modeling and Simulation of SLM and SLS for Metal and Polymer Powders: A Review. Arch. Comput. Methods Eng. 2021, 29, 941–973. [Google Scholar] [CrossRef]
  44. DebRoy, T.; Wei, H.L.; Zuback, J.S.; Mukherjee, T.; Elmer, J.W.; Milewski, J.O.; Beese, A.M.; Wilson-Heid, A.; De, A.; Zhang, W. Additive manufacturing of metallic components–Process, structure and properties. Prog. Mater. Sci. 2018, 92, 112–224. [Google Scholar] [CrossRef]
  45. Peng, S.; Li, T.; Zhao, J.; Lv, S.; Tan, G.Z.; Dong, M.; Zhang, H. Towards energy and material efficient laser cladding process: Modeling and optimization using a hybrid TS-GEP algorithm and the NSGA-II. J. Clean. Prod. 2019, 227, 58–69. [Google Scholar] [CrossRef]
  46. Deb, K.; Pratap, A.; Agarwal, S.; Meyarivan, T. A fast and elitist multiobjective genetic algorithm: NSGA-II. IEEE Trans. Evol. Comput. 2002, 6, 182–197. [Google Scholar] [CrossRef] [Green Version]
  47. Palaparthi, A.; Riede, T.; Titze, I.R. Combining Multiobjective Optimization and Cluster Analysis to Study Vocal Fold Functional Morphology. IEEE Trans. Biomed. Eng. 2014, 61, 2199–2208. [Google Scholar] [CrossRef] [Green Version]
  48. Fallah-Mehdipour, E.; Bozorg-Haddad, O.; Tabari, M.M.R.; Mariño, M.A. Extraction of decision alternatives in construction management projects: Application and adaptation of NSGA-II and MOPSO. Expert Syst. Appl. 2012, 39, 2794–2803. [Google Scholar] [CrossRef]
  49. Liu, Y.; Dong, H.; Lohse, N.; Petrovic, S.; Gindy, N. An investigation into minimising total energy consumption and total weighted tardiness in job shops. J. Clean. Prod. 2013, 65, 87–96. [Google Scholar] [CrossRef]
  50. Wang, Q.; Liu, F.; Wang, X. Multi-objective optimization of machining parameters considering energy consumption. Int. J. Adv. Manuf. Technol. 2013, 71, 1133–1142. [Google Scholar] [CrossRef]
  51. Yun, H.; Zou, B.; Wang, J.; Huang, C.; Li, S. Optimization of energy consumption in coating removal for recycling scrap coated cemented carbide tools using hybrid laser-waterjet. J. Clean. Prod. 2019, 229, 104–114. [Google Scholar] [CrossRef]
Figure 1. Experimental setup: (a) SEM images of the AlSi10Mg powder shape; (b) Energy data acquisition equipment; (c) Placement of the energy data acquisition equipment in the SLM machine.
Metals 12 01782 g001
Figure 2. The SLM samples (a) Single layer sample (8 mm × 8 mm); (b) Cuboid sample (10 mm × 52 mm × 14.5 mm).
Metals 12 01782 g002
Figure 3. Sample for tensile strength testing (Unit: mm).
Metals 12 01782 g003
Figure 4. Flow chart of NSGA-II algorithm.
Metals 12 01782 g004
Figure 5. Photograph of the samples manufactured by SLM process: (a) Single layer samples; (b) Cuboid samples (Multiple layers).
Metals 12 01782 g005
Figure 6. The tensile curve of the sample (laser power of 300 W, scan speed of 900 mm/s and overlap rate of 0.35).
Metals 12 01782 g006
Figure 7. The waveguide part: (a) Three-dimensional models; (b) Finished parts (part volume: 19,954 mm3, support structures volume: 6557 mm3). The values of part volume and support structures volume were obtained through the three-dimensional models in the CAD software.
Metals 12 01782 g007
Figure 8. Optical images of the surface morphologies of the single track samples with laser power ranging from 300–400 W and scan speed ranging from 300–1050 mm/s.
Metals 12 01782 g008
Figure 9. Surface morphologies of SLM-processed AlSi10Mg single layers. The process parameters are: laser power: 320 W, scan speed: 750 mm/s and overlap rate at: (a) 0.2; (b) 0.25; (c) 0.3; (d) 0.35.
Metals 12 01782 g009
Figure 10. The power profile of: (a) Recoater motor; (b) Basic components.
Metals 12 01782 g010
Figure 11. Power consumption of a single laser operating at various output power levels: (a) Power profile (output laser power: 200 W); (b) Power models.
Metals 12 01782 g011
Figure 12. Pareto front of a set of solutions for the SLM process.
Metals 12 01782 g012
Table 1. Chemical compositions of AlSi10Mg alloy powder (weight percent).
ElementsAlSiMgFeCuMnZnTiNiPbSn
wt.%Balance9.50.380.18<0.01<0.01<0.01<0.01<0.01<0.01<0.01
Table 2. Process parameters for the single-track experiments.
Levels123456
Laser power [W]300320340360380400
Scan speed [mm/s]3004506007509001050
Table 3. Process parameters for the single-layer experiments.
Levels1234
Laser power [W]320360400-
Scan speed [mm/s]600750900-
Overlap rate0.200.250.300.35
Table 4. Single track width for different combinations of scanning speed and laser power [µm].
Scan Speed [mm/s] Laser Power [W]
300.00320.00340.00360.00380.00400.00
600.00134.7136.5142.9148.0151.0155.2
750.00116.2124.1126.5130.6134.7139.5
900.00102.9109.0114.3118.6122.4125.4
Table 5. Data for modeling tensile strength of the multiple layer samples.
Test No.Laser Power [W]Scan Speed [mm/s]Overlap RateHatch Distance [μm]Tensile Strength [MPa]
13206000.25102.4455.0
23206000.3588.7443.3
33207500.2593.1448.3
43207500.3086.9443.3
53209000.3076.3446.7
63209000.3570.9450.0
73606000.30103.6436.7
83606000.3596.2441.7
93607500.3091.4441.7
103607500.3584.9445.0
113609000.2588.9420.0
123609000.3577.1446.7
134006000.30108.6445.0
144006000.35100.9438.3
154007500.25104.7430.0
164007500.3097.7431.7
174009000.2594.1416.7
184009000.3581.5438.3
Table 6. Results of ANOVA for the second order polynomial model of tensile strength.
FactorsDOF aSS bMS cF-ValueF(0.01, 9, 8)p-Value
Regression model91557.594173.06610.3545.9110.00156
Residual8133.72016.715---
Total171691.314----
S d = 4.088R2 = 0.921R2 Adjusted = 0.832
a DOF: degrees of freedom; b SS: sum of squares; c MS: mean squares; d S: standard error of the estimate.
Table 7. Predicted and experimental results of tensile strength.
Test No.Laser Power [W]Scan Speed [mm/s]Overlap RateHatch Distance [μm]Predicted [MPa]Measured [MPa]Accuracy a [%]
13206000.3095.5446.1431.796.7
23207500.3580.7448.4446.799.6
33209000.2581.8435.6420.096.3
43606000.25111446.4445.099.7
53607500.2598435.8416.795.4
63609000.3083431.4443.397.3
74006000.25116.4443.0438.398.9
84007500.3590.7440.2438.399.6
94009000.3087.8424.2430.098.6
a Accuracy = 1 − |Predicted value − Measured value|/Measured value × 100%.
Table 8. Comparisons of process parameters and optimized results for different scenarios of the SLM process.
ScenarioProcess ParametersPredicted Results
Laser Power [W]Scan Speed [mm/s]Overlap RateHatch Distance [μm]Energy Consumption [MJ]Tensile Strength [MPa]
S1-No.13439000.258683.2427.7
S1-No.23208300.258684.7440.8
S1-No.33206420.2510087.7451.7
S24009000.259581.9413.4
S33206000.2510488.7453.2
S43507300.319087.7440.0
Publisher’s Note: MDPI stays neutral with regard to jurisdictional claims in published maps and institutional affiliations.

