Article

Possibilities of Repairing Functional Surfaces of Molds for Injecting Al Alloys Using Manual GTAW Cladding

1
Department of Technology, Materials and Computer Supported Production, Faculty of Mechanical Engineering, Technical University of Košice, Mäsiarska 74, 04001 Košice, Slovakia
2
Institute of Materials Research, Slovak Academy of Sciences, Watsonova 47, 04001 Košice, Slovakia
3
Institute of Metallurgy, Faculty of Materials, Metallurgy and Recycling, Technical University of Košice, 04200 Košice, Slovakia
*
Author to whom correspondence should be addressed.
Metals 2022, 12(11), 1781; https://doi.org/10.3390/met12111781
Submission received: 23 September 2022 / Revised: 17 October 2022 / Accepted: 18 October 2022 / Published: 22 October 2022
(This article belongs to the Special Issue Renovation of Parts to Save Metals)

Abstract

:
The paper presents the results of research that is focused on the renovation of molds for high-pressure aluminum casting. An analysis of the worn molds was carried out after they were removed from the operator. The extent and mechanism of the wear were determined. GTAW (Gas tungsten arc welding) technology was chosen for the renovation of the shaped parts of the molds. The renovation layers were realized with four types of additional materials Cronitex RC 44, UTP A 73 G 3, UTP A 673 and Dievar® TIG. The quality of the coatings was assessed by destructive as well as non-destructive tests. The mixing of the build-up layers with the base material was determined on the basis of structural analyses. The hardness of the cladding was determined by a metallographic analysis of the cross crowns with the Vickers method. The resistance of the cladding was tested by a complete immersion in a melt of AlSi8Cu3 aluminum alloy which was maintained at a temperature of 680 ± 20 °C in a laboratory resistance furnace for 120 and 300 min. The tribological properties of the produced deposits were determined using the ball-on-disc dry method. Based on the experiments that were carried out, it is possible to recommend the additive material UTP A 73 G 3 for the restoration of the functional surfaces of molds for the injection of Al alloys as the patterns that were created by it have shown the best results in terms of their resistance to Al melt, which is the dominant degradation factor limiting the life of the molds.

1. Introduction

The issue of mold repair for aluminum die-casting is currently receiving a great deal of attention. The main reason for this is especially the economic aspect of it. The prices of new molds in complex shapes or dimensions range between tens and hundreds of thousands of Euros [1]. The current development of the prices of medium and high-alloy steel grades on the world markets are also a strong factor for the search for the possibility of restoring the functionality of damaged parts of injection molds. The service life of the molds is limited by the influence of a combination of tribodegradation factors, as well as by their operating conditions. The dissolution of steel surfaces in aluminum is primarily involved in the degradation of functional surface grades [2,3]. Despite the short-term contact period of solidifying the Al alloy with the mold material not exceeding 5 s, the damage that occurs to the surfaces by their dissolution in Al is the dominant degradation factor. The secondary lifespan of them is affected by the abrasive wear of the inlet ducts and the adhesive wear of the molds’ contact-splitting parts. Although these are the molds that are meant for the cold injection molding of Al alloys, the operating mold temperature is approximately 250 °C. The damage to the functional mold surfaces is most evident in the changes of the casting dimensions and tolerances or in changes in the casting surface morphology. The degradation of the molds occurs mainly in their shaped parts. The dissolution of steel in the Al alloy leads to disturbance of the surface integrity of the surface defects formation (surface pores), which are filled with a solidified Al alloy [4,5,6]. The Al alloy continues to adhere to the defect that is filled with Al in this way, which acts as a wedge on the defect by applying high filling pressures. The concentration of the internal stresses due to periodic stress results in crack initiation and propagation into the mold’s body [7,8]. In extreme cases, it can cause the destruction of the entire mold. For the restoration of the functional surfaces of the injection molds, currently, several arc or energy beam cladding methods can be used [9,10,11,12]. Depending on the extent of mold damage and the necessary amount of metal that is needed to restore the functional surfaces, it can be beneficial to apply arc methods such as GMAW (gas metal arc welding), MMAW (manual metal arc welding) and GTAW (Gas tungsten arc welding) [13,14,15,16,17,18]. Within the framework of the energy-beam methods it is convenient to apply laser cladding for the renewal of the functional surfaces [19,20,21]. The GMAW or MMAW methods are suitable for being applied for the restoration of the areas in which it is necessary to restore extensive parts and add a greater thicknesses of missing base mold material. These methods are suitable to be applied in case of the need for a greater amount of fill caterpillars. For smaller local repairs or repairs where one or two layers of cladding are needed, it is advisable to use the GTAW manual cladding method. By using this method (compared to former arc methods), it is possible to significantly reduce the amount of heat that is introduced into the area below the cladding, which is a frequent source of the problems in the renovation process [22,23,24,25,26,27,28,29].
The presented paper deals with the research into the quality of renovation layers formed by the GTAW technology while one is applying different types of additive materials. Compared to the conventional type of Dievar® TIG additive, three types of additives with different chemical compositions were used for cladding. Compared to the conventional cladding wire, the cladding wires with an increased content of Mn, Si and Mo, also with the addition of the carbide-forming element W as well as the stabilizing element Ti, were chosen. The research was conducted in order to verify the possibility of extending the service life of the injection mold functional surfaces, especially in the areas that are subjected to the most intense wear. As it was presented in the wear analysis, the limiting factor of the mold’s lifetime is the surface quality change of the functional surfaces due to their dissolution in the Al alloy. To determine the dissolution resistance of the cladding layers, a new methodology for testing the solubility of the cladding layers in Al was proposed.

2. Materials and Methods

The base material that was used in the experiment was chrome-molybdenum-silicon-vanadium steel Dievar (1.2343), (Böhler-Uddeholm, Vienna, Austria) with a hardness of 45 HRC, which is used for high-pressure casting molds. It has good thermal conductivity, high toughness and is hot-cracking-resistant. Its chemical composition is shown in Table 1. The mechanical properties that were defined by the manufacturer are given in Table 2.
Information on mold wear and surface morphology of the molded parts was obtained using a SEM EVO MA15 scanning electron microscope (Carl Zeiss Ltd., Birmingham, UK) with integrated EDX and WDX analytical methods (Oxford Instruments, Abingdon, UK). Renovation layers for functional surface restoration of the mold working parts for manufacturing of castings by high-pressure casting technology were made by manual arc cladding using the GTAW method. Four types of additive materials were used. Their diameter was Ø 1.0 mm and the length was 1000 mm. The chemical compositions of additive materials are defined in Table 3. Based on the chemical composition of the material of molds for Al alloy injection, the C and Cr content values were the guideline for the selection of the additive materials. The additive materials were selected based on the base material chemical composition. Commercially, the Dievar® TIG additive was applied for the restoration of functional surfaces. Due to the analysis of the tribodegradation mechanisms limiting the lifetime of molds, additive materials with approximately the same C and Cr content as Dievar® TIG wire were chosen for the experiment. The lower C content (0.25%) of the UTP A 73 G 3 wire was replaced with a higher content of Mn (0.7%) and carbide-forming Mo by up to 4% as well as Ti (0.6%). The higher Mo content gave the assumption of there being a higher degree of hardness and coating resistance to the abrasive wear of the mold’s moving parts. The Cronitex RC 44 additive had a higher proportion of carbide-forming W (0.4%) as well as V (0.8%) when it was compared to the conventional additive type, and it was chosen mainly because of the expected higher resistance to tribological factors. The last evaluated additive material type was a cladding wire with the designation UTP A 673. Its chemical composition differed from the conventional wire mainly by the Si content (1%) as well as by the addition of carbide W (1.3%). As it is known, Si has a significant influence on the intermetallic phase formation in the Al–Fe binary system. By increasing the Si content, changes in the morphology and dimensions of the individual phases were expected [30]. Therefore, there are only minimal differences between the wires for these elements. Cladding with the method GTAW was performed on the device Fronius TransTig 2200 Job (Fronius, Pettenbach, Austria). The test samples were made to be of the three-layered cladding type. In cladding processes, the aim is to create cladding layers with a chemical composition corresponding to the additive material that are used and thermodynamic effects during its transfer. The mixing of the cladding metal with underlying base material is mainly influenced by the cladding technology that is used and the cladding parameters. The intensity of mixing in arc cladding methods depends, e.g., on the length of the electric arc, cladding speed, the flow rate of protective atmospheres, etc. When creating more special or higher quality layers than those of the base material, the aim is to create cladding layers by performing as little mixing with the base material as possible so that the newly created layer exhibits the chemistry of the additional material that was used. Eliminating the effect of mixing is possible by applying multiple layers of cladding. The authors in [31,32,33,34] present that, depending on the cladding technology, the most intense mixing concentration was in the first cladding layer. This can be up to 50%. Contamination of the base material can occur up to the second layer depending on the cladding conditions and the additive that is used. The third cladding layer is made up of pure cladding metal only.
The cladding parameters are displayed in Table 4. A tungsten-cerium electrode, designated as WC 202.4 with an electrode grinding angle of 30° was used. The application of the additive material was performed manually. The protective gas that was used was argon (Ar 4.6-EN ISO 14175), which was fed to the cladding point through a ceramic nozzle with an internal diameter of Ø 9.5 mm at a gas consumption rate of 12 L·min−1. The mold renovation was carried out selectively and locally only on worn functional areas, as documented in Figure 1 and Figure 2, or the entire functional part of the void was renovated, whereby the entire area was removed by chip machining and the missing mold base material was supplemented with a multi-layered cladding. The cladding layers were processed by grinding to the prescribed roughness of Ra 3.2 µm.

2.1. Non-Destructive Cladding Layer Testing

A visual inspection of the surfaces was carried out on all of the test samples after the processing was performed to identify surface defects (voids, cracks, and hairline cracks) that were protruding onto the surface of the functional layer in accordance using EN 13018. The capillary test was carried out using the color indication method according to EN ISO 23277. It was carried out to detect the presence of surface defects. The classification procedure of cladding defects is covered by ISO 6520-1. The DIFFU-THERM kit was used, the contrasting substance was Sudan red in kerosene due to the good wettability of the surface. The surfaces were cleaned, stripped of excess indicator reagent, and CaCO3 developer in acetone was applied. Internal defects were determined by the EN ISO 17 640 ultrasonic method. To characterize the indications in the cladding, the reflection method was used using a VEO+ 32:64 by Sonatest, Wolverton, UK (UT Phased Array) ultrasonic instrument, the probes X1-PE-10M16E0.3P by Sonatest (Phased Array-10 MHz, 16 transducers) and T1-PE-5.0M32E0.8P by Sonatest (Phased Array-5 MHz, 32 transducers) were also used.

2.2. Destructive Cladding Layer Testing

Microscopic and macroscopic structural analysis of the cladding was carried out in accordance with EN ISO 17639. A Jeol JSM 7000F (Tokyo, Japan) scanning electron microscope was used for the structural analysis of the cladding layers. A SEM EVO MA15 scanning electron microscope (Carl Zeiss, Jena, Germany) with integrated EDX and WDX analytical units (Oxford Instruments, Abingdon, UK) was used for qualitative EDX microanalysis of the elemental distribution at the interface of the cladding and after exposure of the samples to AlSi8Cu3 melt (680 ± 20 °C). The hardness of the cladding was determined by a metallographic analysis of the cross crowns with the Vickers method according to EN ISO 6507-1; the Shimadzu HMV-2 microhardness tester (Shimadzu, Kyoto, Japan) was used for this. The quality of the cladding was evaluated under high-temperature corrosion conditions. The resistance of the cladding was tested by a complete immersion in a melt of AlSi8Cu3 aluminum alloy that was maintained at a temperature of 680 ± 20 °C in a laboratory resistance furnace for 120 and 300 min. The aluminum alloy melt was prepared from a portion of AlSi8Cu3 grade alloy blocks (DIN 226 A), which were embedded in ceramic crucibles and heated in a laboratory furnace to the melting temperature of the alloy. This is the casting temperature of the AlSi8Cu3 alloy when were die casting using the cold filling chamber machines. The samples were in an upright position during the tests. After the test, the samples were removed from the melt and left to cool freely in the air. Based on the analysis that was conducted of tribodegradation factors that were limiting the service life of functional surfaces of Al alloy injection molds, the primary tribodegradation factor is the mold surface dissolution in the Al alloy melt. As a consequence of this dissolution, changes in the castings surface quality as well as their shape and dimensions occurred, which is an unacceptable defect. In order to assess the resistance of surfaces to this type of damage, a methodology has been established for testing this resistance to the dissolution of steel in the Al alloy melt. This type of testing has not yet been used for cladding layers, and this is one of the main research contributions. The influence of alloying additives that were used in the additive material on the resulting resistance of the newly formed surfaces was investigated. Since the mold is in direct contact with the molten alloy for about 2 s and then, it is in direct contact for another 5 s with the solidified casting, which does not degrade its surfaces, the immersion time of the sample in the melt was determined to be 120 min, which corresponds to the mold contact with the liquid Al alloy after 3600 moldings took place. The critical number of moldings is 1000 from the point of view of “so-called” mold run-in, during which a significant concentration of internal stresses occurs, thereby requiring an annealing heat treatment. Neglecting this processing leads to a significant shortening of a mold’s lifetime. Since in the previous experiments that were carried out, no significant dissolution of Fe in the Al alloy and intermetallic phases formation occurred after the mold break-in time, the immersion time of 120 min was proposed experimentally. The 300 min surface contact time with the Al melt corresponds to a occurrence of 9000 moldings for the type of mold that was evaluated by us. The immersion time’s influence on the thickness of formed intermetallic phases was also investigated in the experiments.

2.3. Determination of Tribological Properties of Cladding Layers

The cladding layers were evaluated under adhesive wear and dry friction conditions. This tribological test was carried out to determine the tribological properties of the cladding for those parts of the mold that were not in contact with the melt. A Si3N4 ball with a diameter of ø 6 mm was used. Specific wear rates (W) were calculated in terms of volume loss (V) per distance (L) and applied load (Fp) values were calculated according to ISO 20808. The measurements were performed using a BRUKER UMT 3 universal tribometer at room temperature of 20 °C and humidity of 40% using the ball-on-disc dry method with translational movement of the ball over the sample surface on a 5 mm path. The speed of the movement of the ball was 0.1 m/s, the normal forces were 3, 5 and 10 N, the frequency of movement was 10 Hz on the 5 mm path, the time was 5000 s, and the resulting path was 500 m.

3. Results and Discussion

For all of the cladding layers, the hardness values were greater than the recommended final hardness values of the mold inserts, which occurred in the range of 400–500 HV. In the microstructure, no defects and the non-integrity of the cladding layers were observed by the light microscopy technique. It was necessary to temper all of the cladding layers to a hardness value that was between 400–500 HV. The zones with the release agent on the surface of the shaped parts, the contact between the moving core and the shaped part and the cracks on the surface in the area of the ejectors were inspected (Figure 3).
On the perpendicular cut through the surface that was in contact with the melt and was treated with the separating agent, there was an uneven layer of reaction products of the mold material, the aluminum alloy and the separating agent. The chemical contrast (COMPO) (Figure 4a,b) method was used to detect the presence of the layer. There was a locally intense plastic deformation in the area of the contact between the moving core and the mold part with disruption of the integrity of the mold’s body material (Figure 4c).
The non-destructive testing of the cladding confirmed their high quality. No surface or internal imperfections were observed. Figure 5 displays the structures of the cladding on the cross crowns. All of the documented structures were observed after the annealing heat treatment. In all of the crowns, the pattern of multilayered cladding and the deposition of individual caterpillars were clearly visible. The most distinctive drawing was exhibited by the overlying cladding layers. In the underlying layers, the texture was finer grained, which is due to the cross-annealing from the overlapping caterpillars. The metallographic analysis of the cross crowns did not reveal the presence of internal defects. For all of the cladding samples, the structures after the heat treatment were composed of sorbite, which is consistent with the results of the evaluation of the chemical composition of the cladding layers and also with the results of the hardness evaluation of the cross crowns. The heat input that was used and the cladding parameters as well as the cladding speed (v) were appropriately chosen as it is evident by the pattern of the cladding (width-to-depth ratio). The epitaxial growth of the columnar grains as well as the dihedral angle allowing the leaching of the impurities and the escape of gases from the weld bath are legible in the cladding layers. These metallurgical characteristics have a significant effect on the integrity of the cladding and its properties. In the solidification of the cladding metal, the grain growth can be planar, cellular or dendritic. In our case, dendritic grain growth was observed in, e.g., the claddings UTP A 673 and UTP A 73 G3, but mostly, cellular growth was observed. The area below cladding of the heat-affected zone (HAZ) base material (BM) Dievar was relatively narrow. The structure at the interface between the base layer and the blending with the base material was fine-grained sorbitic. Despite the carbide-forming addition agent (Cr, V, W and Mo), the presence of massive carbide precipitates was not observed in the cladding metal. The progression of the hardness of the cladding metal is displayed in Figure 6. The highest hardness value was achieved by the Cronitex RC 44 cladding, namely the 511 HV1 one. The other hardness values of the rest of the claddings were approximately the same.
The cladding cross crowns, after their exposure in the aluminum melt, are shown in Figure 7. It is possible to observe that due to the high temperatures and their contact with the melt, dilatation occurred especially in the case of the Dievar and UTP A 73 G cladding. It is possible to observe the formation of intermetallic phases in the strips. The Cronitex RC 44 type of cladding was not evaluated at this stage of experiment as the cladding layer separated from the base metal due to the occurrence of high-temperature corrosion.
The following figures display the spectral analyses of the transition regions between the individual cladding layers and the base material after their exposure in the Al melt. Subsequently, the EDX line analyses were performed.
Figure 8, Figure 9, Figure 10, Figure 11, Figure 12, Figure 13, Figure 14, Figure 15, Figure 16, Figure 17, Figure 18, Figure 19, Figure 20, Figure 21, Figure 22, Figure 23, Figure 24 and Figure 25 display the spectral, line and EDX element analyses of the individual cladding layers after their exposure in the aluminum alloy melt for between 120 and 300 min. Based on these analyses, it can be concluded that during the immersion of the cladding in the melt, the dissolution of the elements Fe, Al, Cr and Si in the cladding occurred. The intensity of the Fe dissolution increased with the increase in the immersion time. Due to dilatational changes, the separation of the cladding layers occurred in some parts of the Uddeholm Dievar® TIG-Weld and UTP A 73 G 3 claddings. The resistance of the Cronitex RC 44 cladding was not evaluated in the immersion test as the cladding layer separated after its immersion in the aluminum melt. Figure 8 shows the microstructure of the UTP A 673 cladding layer interface after 120 min of exposure in the Al alloy melt, with selected areas having been marked for a qualitative EDX elemental analysis. The interaction of the Al alloy melt with the UTP A 673 cladding layer surface resulted in the formation of Al–Fe–Si-based intermetallic phases (Figure 8). The EDX linear analysis of the intermetallic phases that were formed on the cladding surface detected the zones with relatively constant concentrations of iron, aluminum and chromium (Figure 9). The thickness of these zones was used as a criterion to evaluate the cladding layer dissolution in the aluminum alloy melt.
Based on the EDX line analysis and the qualitative EDX area elemental analysis in Figure 9 and Figure 10, respectively, it can be concluded that the thickness of the intermetallic phases with relatively constant concentrations of iron, aluminum and chromium on the test sample’s surface after 120 min exposure was 85 µm.
Figure 11 shows the microstructure of the UTP A 673 cladding layer interface after 300 min exposure in the aluminum alloy melt, with selected areas having been marked for the qualitative EDX elemental analysis. On the UTP A 673 cladding surface (Figure 11, Spectrum 23), an Al–Si-based inter-metallic phase was observed (Figure 11, Spectrum 24). Due to the EDX linear analysis of the inter-metallic phases that were present on the cladding surface, the zones with relatively constant concentrations of iron, aluminum and chromium were detected (Figure 12).
Based on the EDX line analysis and the qualitative EDX area elemental analysis in Figure 12 and Figure 13, respectively, it can be concluded that the thickness of the intermetallic phases with relatively constant concentrations of iron, aluminum and chromium on the test sample’s surface after 300 min exposure in the aluminum alloy melt was 150 µm.
Figure 14 shows the microstructure of the UTP A 73 G 3 cladding layer interface after 120 min of exposure in the aluminum alloy melt, with selected areas having been marked for the qualitative EDX elemental analysis. On the cladding surface (Figure 14, Spectrum 15), the Al–Si-based inter-metallic phases were observed (Figure 14, Spectrum 15). Due to the qualitative EDX micro-analysis, the area with relatively constant concentrations of iron and aluminum was detected (Figure 15).
Based on the EDX line analysis and qualitative EDX area elemental analysis in Figure 15 and Figure 16, respectively, it can be concluded that the thickness of the intermetallic phase on the test sample’s surface with UTP A 73 G 3 cladding after 120 min of exposure with relatively constant iron and aluminum concentrations was 10 µm.
Figure 17 shows the microstructure of the UTP A 73 G 3 cladding layer interface after 300 min exposure in the aluminum alloy melt, with selected areas having been marked for the qualitative EDX elemental analysis. On the UPT A 73 G 3 cladding surface (Figure 17, Spectrum 11) after 300 min of exposure in the aluminum alloy melt, the inter-metallic phases with different iron concentration were observed (Figure 17, Spectrum 12, 13, 14).
The qualitative EDX microanalysis identified a region of relatively constant iron and aluminum concentrations (Figure 18).
Based on the EDX line analysis and the qualitative EDX area elemental analysis in Figure 18 and Figure 19, respectively, it can be concluded that the thickness of the intermetallic phase on the test sample’s surface with UTP A 73 G 3 cladding after 300 min of exposure with relatively constant iron and aluminum concentrations was 37 µm.
Figure 20 shows the microstructure of the Dievar® TIG cladding layer interface after 120 min exposure in the aluminum alloy melt, with selected areas having been marked for the qualitative EDX elemental analysis. On the cladding surface (Figure 20, Spectrum 1) after 120 min of immersion in the aluminum alloy melt, a multi-layer strip of intermetallic phases that were based on Al–Fe (Figure 20, Spectrum 2, 3) was observed.
By the EDX linear analysis of intermetallic phases that were formed on the cladding surface, the zones of relatively constant iron and aluminum concentrations were detected (Figure 21).
Based on the EDX line analysis and the qualitative EDX area elemental analysis in Figure 21 and Figure 22, respectively, it can be concluded that the thickness of the intermetallic phase on the test sample’s surface with Dievar® TIG cladding after 120 min of exposure with relatively constant iron and aluminum concentrations was 125 µm.
Figure 23 shows the microstructure of the Dievar® TIG cladding layer interface after 300 min exposure in the aluminum alloy melt, with selected areas having been marked for the qualitative EDX elemental analysis. On the cladding surface (Figure 23, Spectrum 5) after 300 min of exposure in the aluminum alloy melt, a multi-layer strip of intermetallic phases that were based on Al–Fe (Figure 23, Spectrum 6, 7, 8, 9) was observed.
Based on the EDX line analysis and the qualitative EDX area elemental analysis in Figure 24 and Figure 25, respectively, it can be concluded that the thickness of the intermetallic phase on the test sample’s surface with Dievar® TIG cladding after 300 min of exposure with relatively constant iron and aluminum concentrations was 170 µm.
The results of conducted Fe solubility tests in molten Al alloy are in agreement with the authors’ study results [35,36,37,38,39,40]. The phase sizes are presented in the graph in Figure 26. The phases that were formed on the Dievar® TIG cladding after the 300 min exposure showed the largest thickness. The lowest thickness was achieved by the cladding with the additive material UTP A 73 G 3. The relative dissolution of the UTP 73 G 3 and UTP 673 cladding layers in the Al–Si melt was determined and it was normalized to the corrosion dissolution of the Dievar cladding (Figure 27).
The solubility of the UTP A 73 G 3 cladding metal in the Al alloy was the lowest due to the highest Mn concentration. Fe is highly soluble in molten Al, and it has a high tendency to react with other elements to form intermetallic compounds of various types [30]. The Mn presence in the cladding metal and its subsequent dissolution in the Al alloys suppresses the development of the long needle-like Fe-rich phases and promotes the formation of compact Fe phases [32]. The mechanical properties of the AlSi alloys are significantly influenced by the size, morphology and distribution of the Si particles as well as the Al grain size [41,42]. The critical Fe level depends on the Si concentration in the alloy.
The cladding selection was based on their durability in the aluminum alloy melt, and at the same time, their suitability for the renovation of the moving parts of the molds, which are not in contact with the aluminum alloy melt. The wear rate of Cronitex RC 44, UTP A 73 G 3, UTP A 73 G 3 and UTP A 673 cladding layers at normal loads of 5 and 10 N which were experimentally measured by the conduction of tribotests was lower than the wear rate of the Dievar® TIG cladding. The results of the ball-on-disc test are presented in Figure 28, Figure 29 and Figure 30. The wear volume of the sample and the specific wear rate in mm2/N were determined. The application potential of the cladding is on moving parts of the molds and cores where the adhesive wear is to be expected. Under the given loading conditions, the evaluated cladding achieved similar values to that of the coefficient of friction. The lowest wear rate was achieved by the cladding that was made with the additive material CRONITEX RC 44, but this cladding failed the immersion test. Therefore, the UTP A 73 G 3 cladding may be recommended for future practice.

4. Results

On the basis of the analyses that were carried out, the following conclusions can be reached:
-
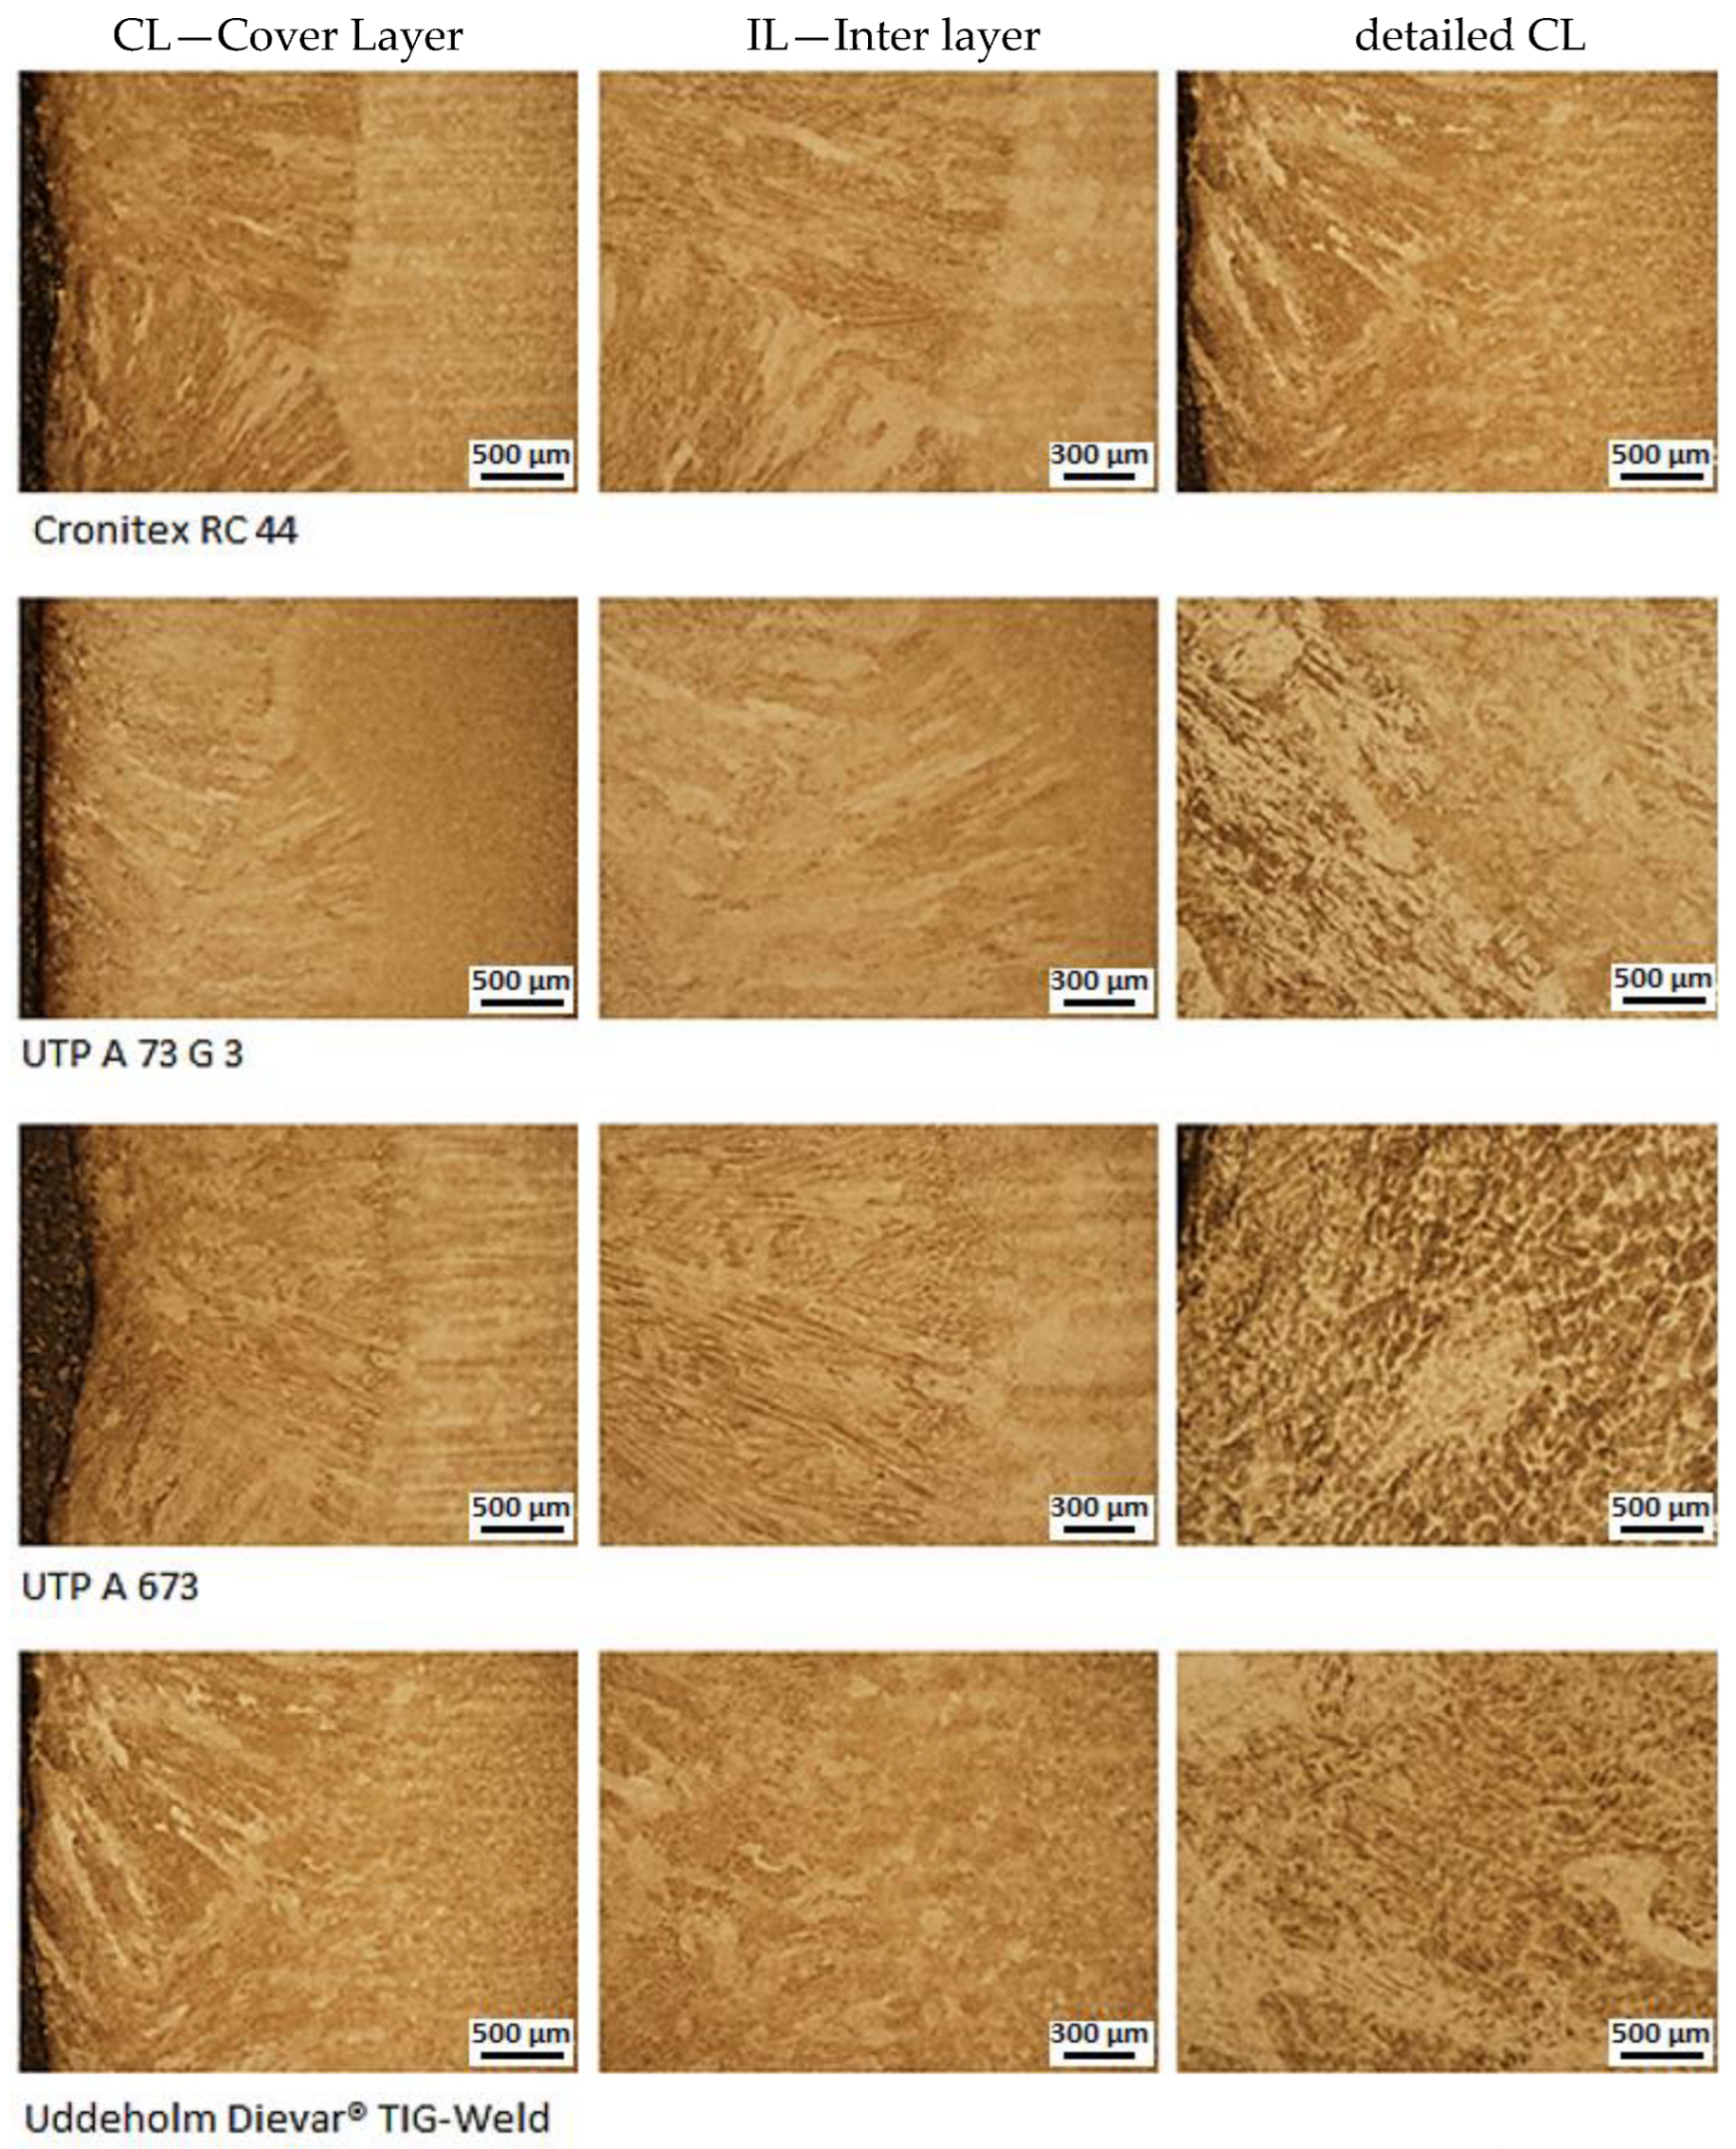
The metallographic analysis that was carried out by light microscopy on the cross crowns displayed the presence of a loose martensitic structure, i.e., a sorbitic structure, in the filler and also in the covering cladding layers for all of the types of additive materials. The as-prepared cladding layers have a characteristic columnar arrangement of the dendrites, with a well-defined dihedral angle, especially in the covering layers. In the fill and base layers, the legibility was slightly impaired because of intercalation of the superimposed caterpillars. The base material, which was made of annealed steel Dievar, had a structure consisting of sorbite. The presence of internal defects in the form of pores or cracks was not observed on the metallographically analyzed crowns.
-
Taking into account the same cladding parameters that were used, the wire diameters and also the execution of the cladding by one welder (which is often a major factor influencing the quality of the cladding in manual cladding), equally large heat-affected areas of the base material were observed on the macrostructures (HAZ were in the range of 1.0–1.1 mm).
-
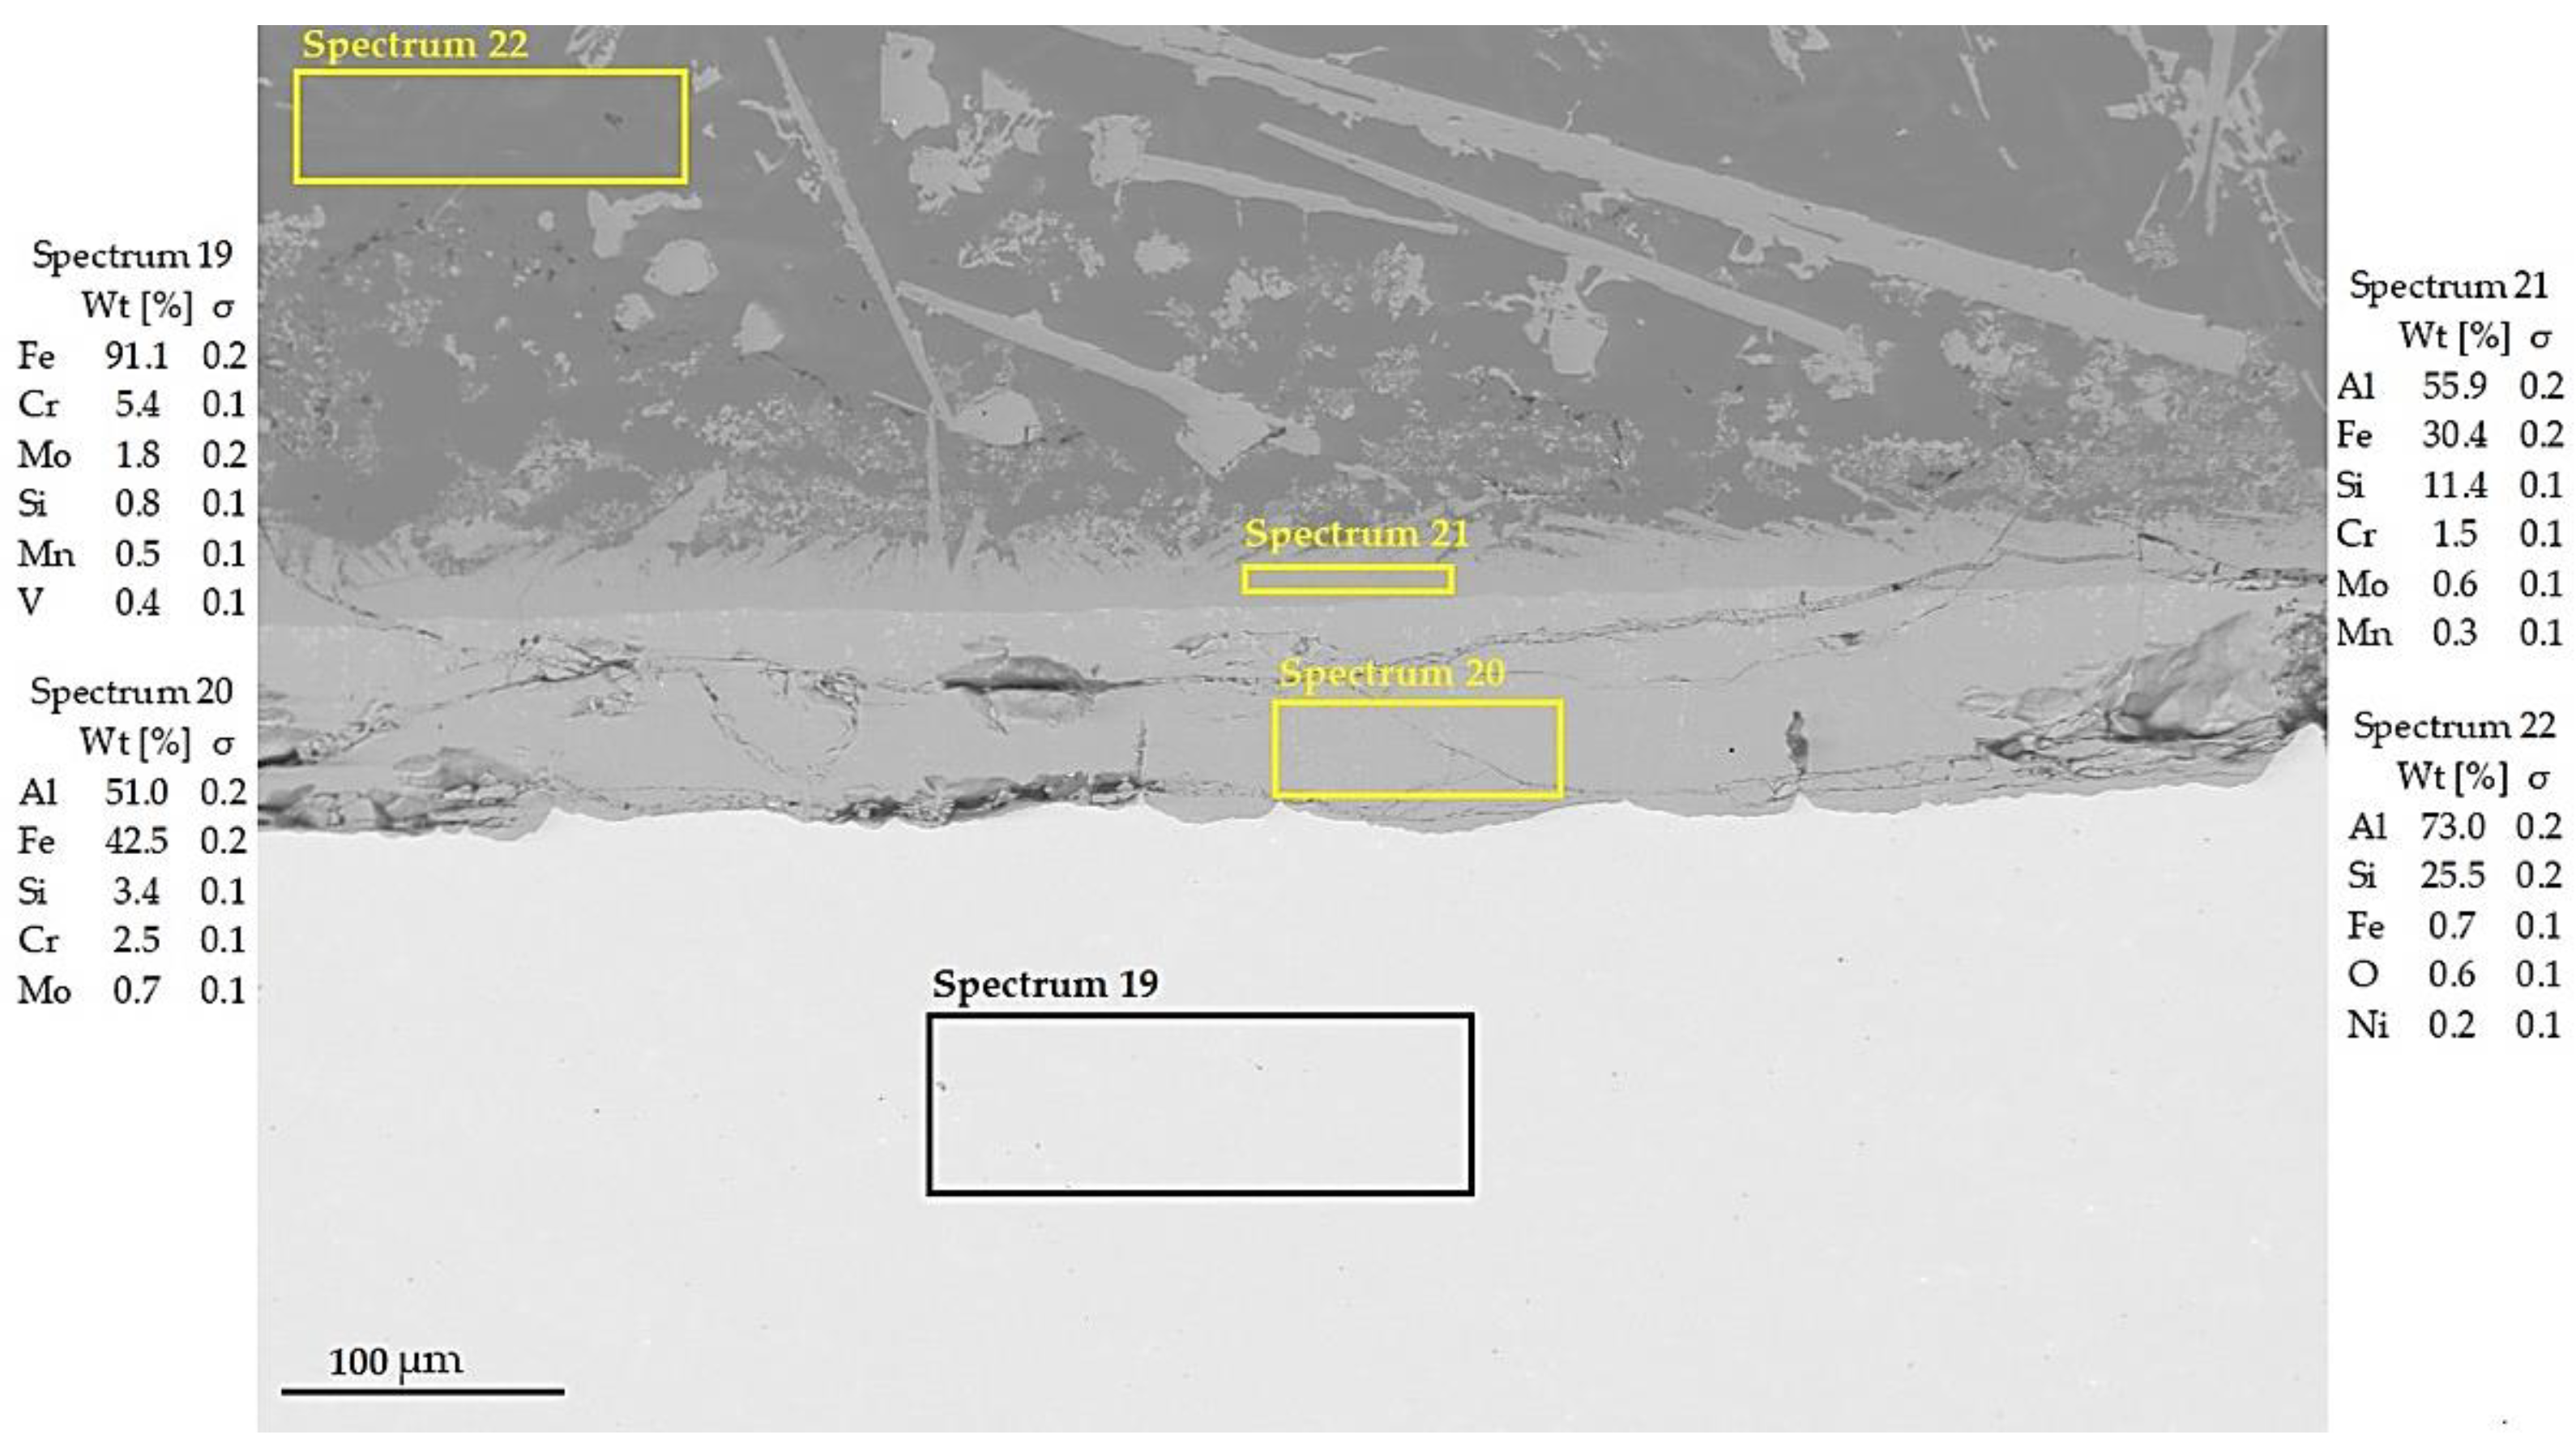
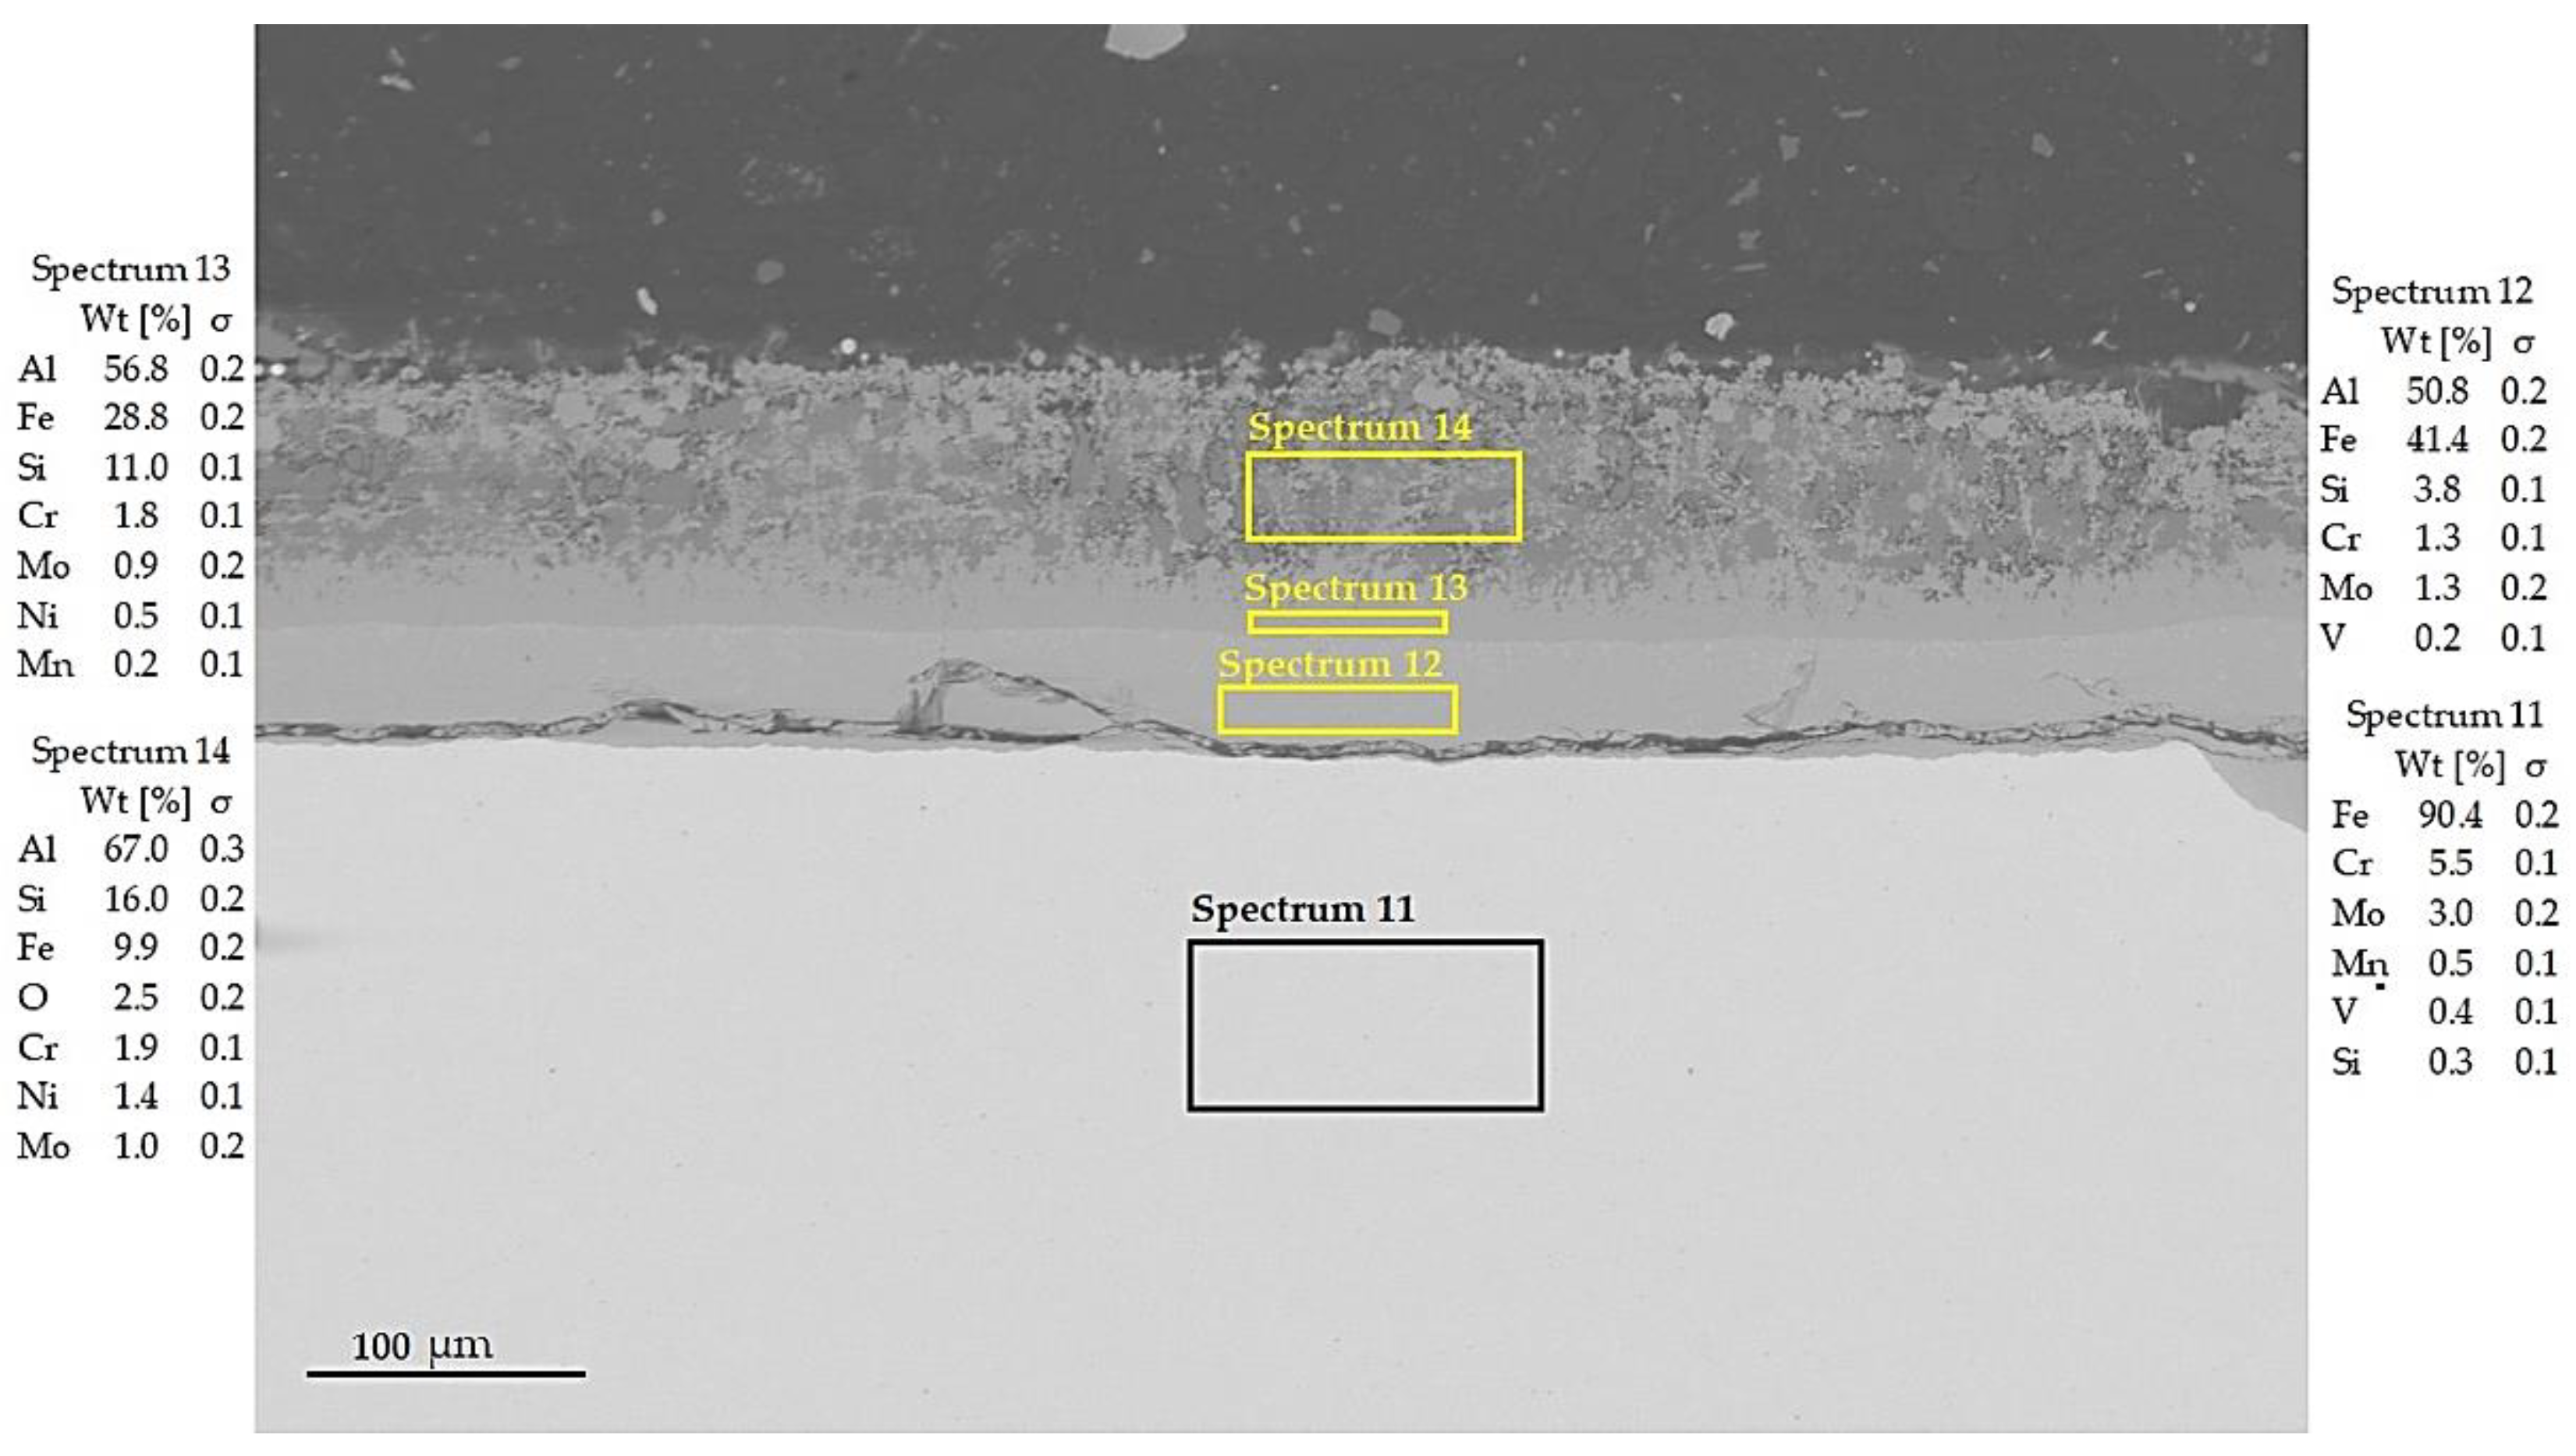
The influence of the chemical composition of the cladding was evaluated by the EDX and WDX analyses. These analyses did not show any changes in the chemical composition of the cladding or variations in the content of them due to, e.g., the burning of elements in an electric arc, etc. The chemical composition that was guaranteed by the wire manufacturers was confirmed by the analyses.
-
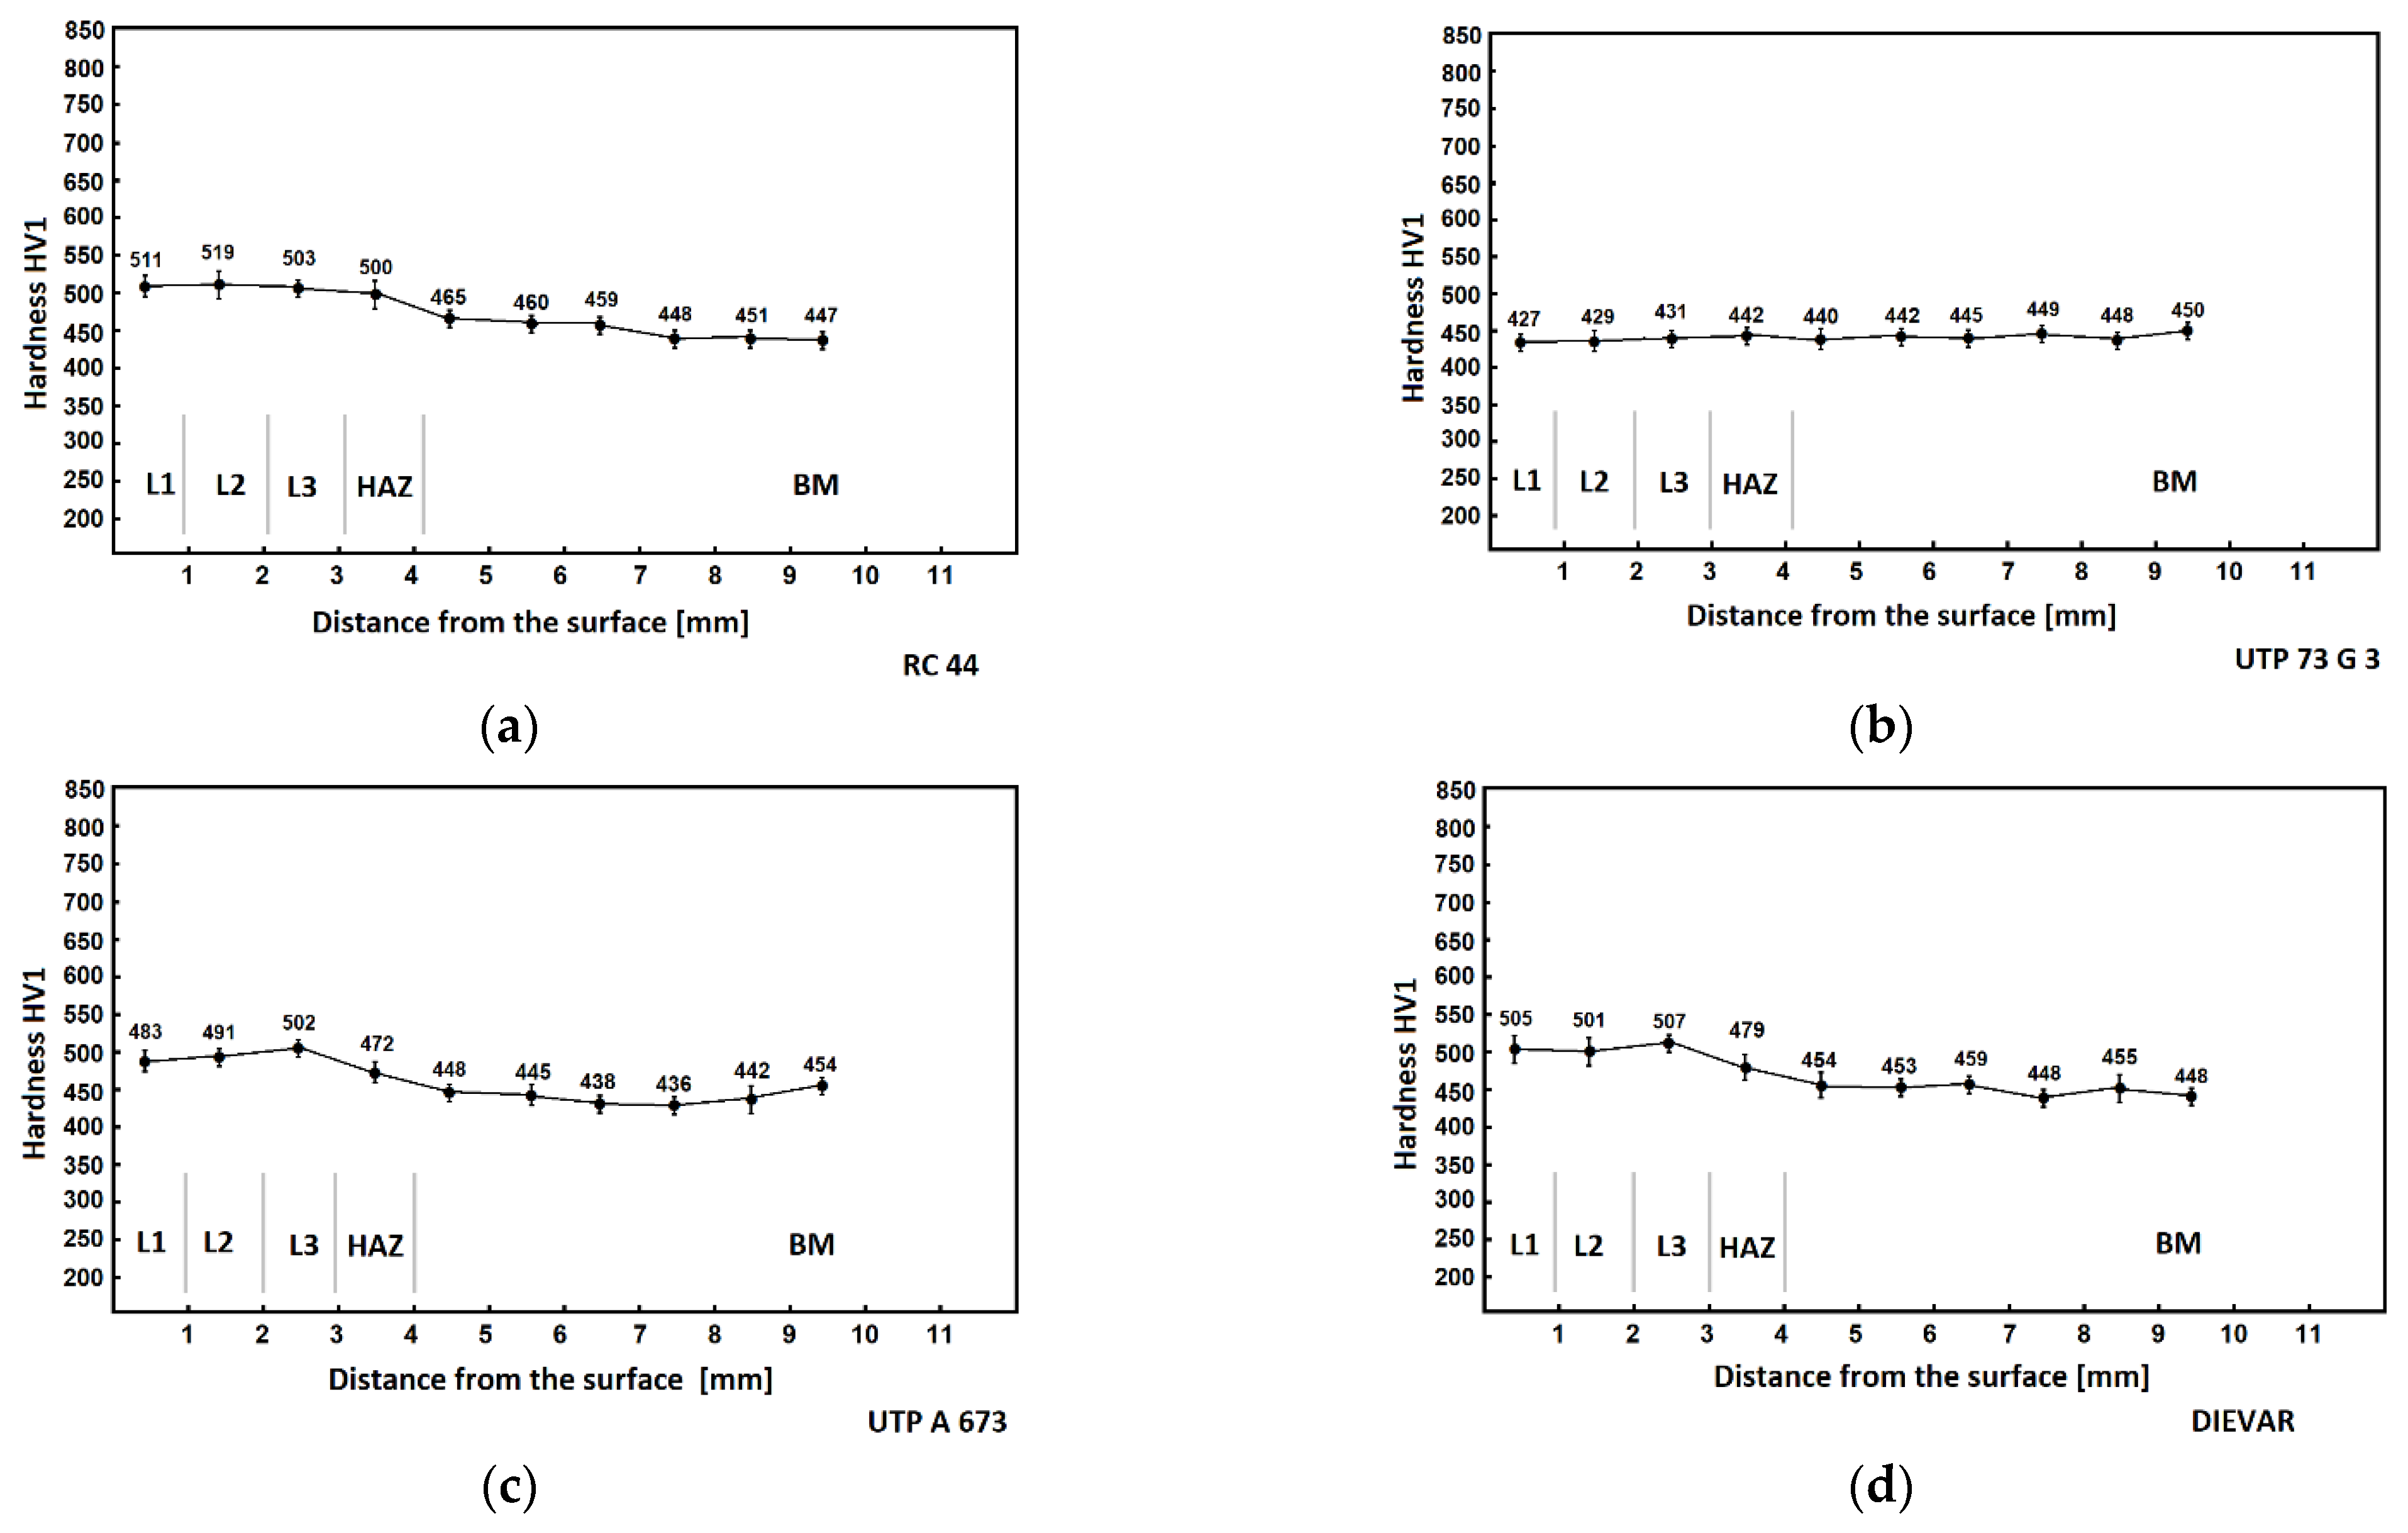
As part of the evaluation of the cladding layers’ mechanical properties, the progression of hardness which was measured in a line from the surface towards the base material was determined on the cross crowns. The functional surfaces of the injection molds which were made of the Dievar material have the required hardness in the range of 43–48 HRC, which is (423–489 HV). These values are necessary for the surfaces of the already heat-treated cladding that will form the functional surfaces of the molds. Among the evaluated additive materials, the hardness values of the cladding that was made with UTP A 73 G 3 exhibited the lowest values, namely 427 HV1. The lowest hardness values can be explained by the lowest C content in the 0.25% metal in the surfacing and in the absence of the carbide-forming additives of the elements W and V. Higher hardness values (483 HV1) were measured in the covering layer of the cladding that was made with the UTP A 673 wire. The hardness of the Dievar cladding layer metal was 505 HV1 and the greatest hardness of 511 HV1 was exhibited by the cladding that was made with the Cronitex RC 44 wire. The reason for the occurrence of the greatest hardness value was probably due to it having the highest C content (0.35%) and content of carbide-forming additives (Cr, W, V). The measured hardness values correspond to the chemical composition of the additives that were used, the heat treatment of the test samples and the observed structures.
-
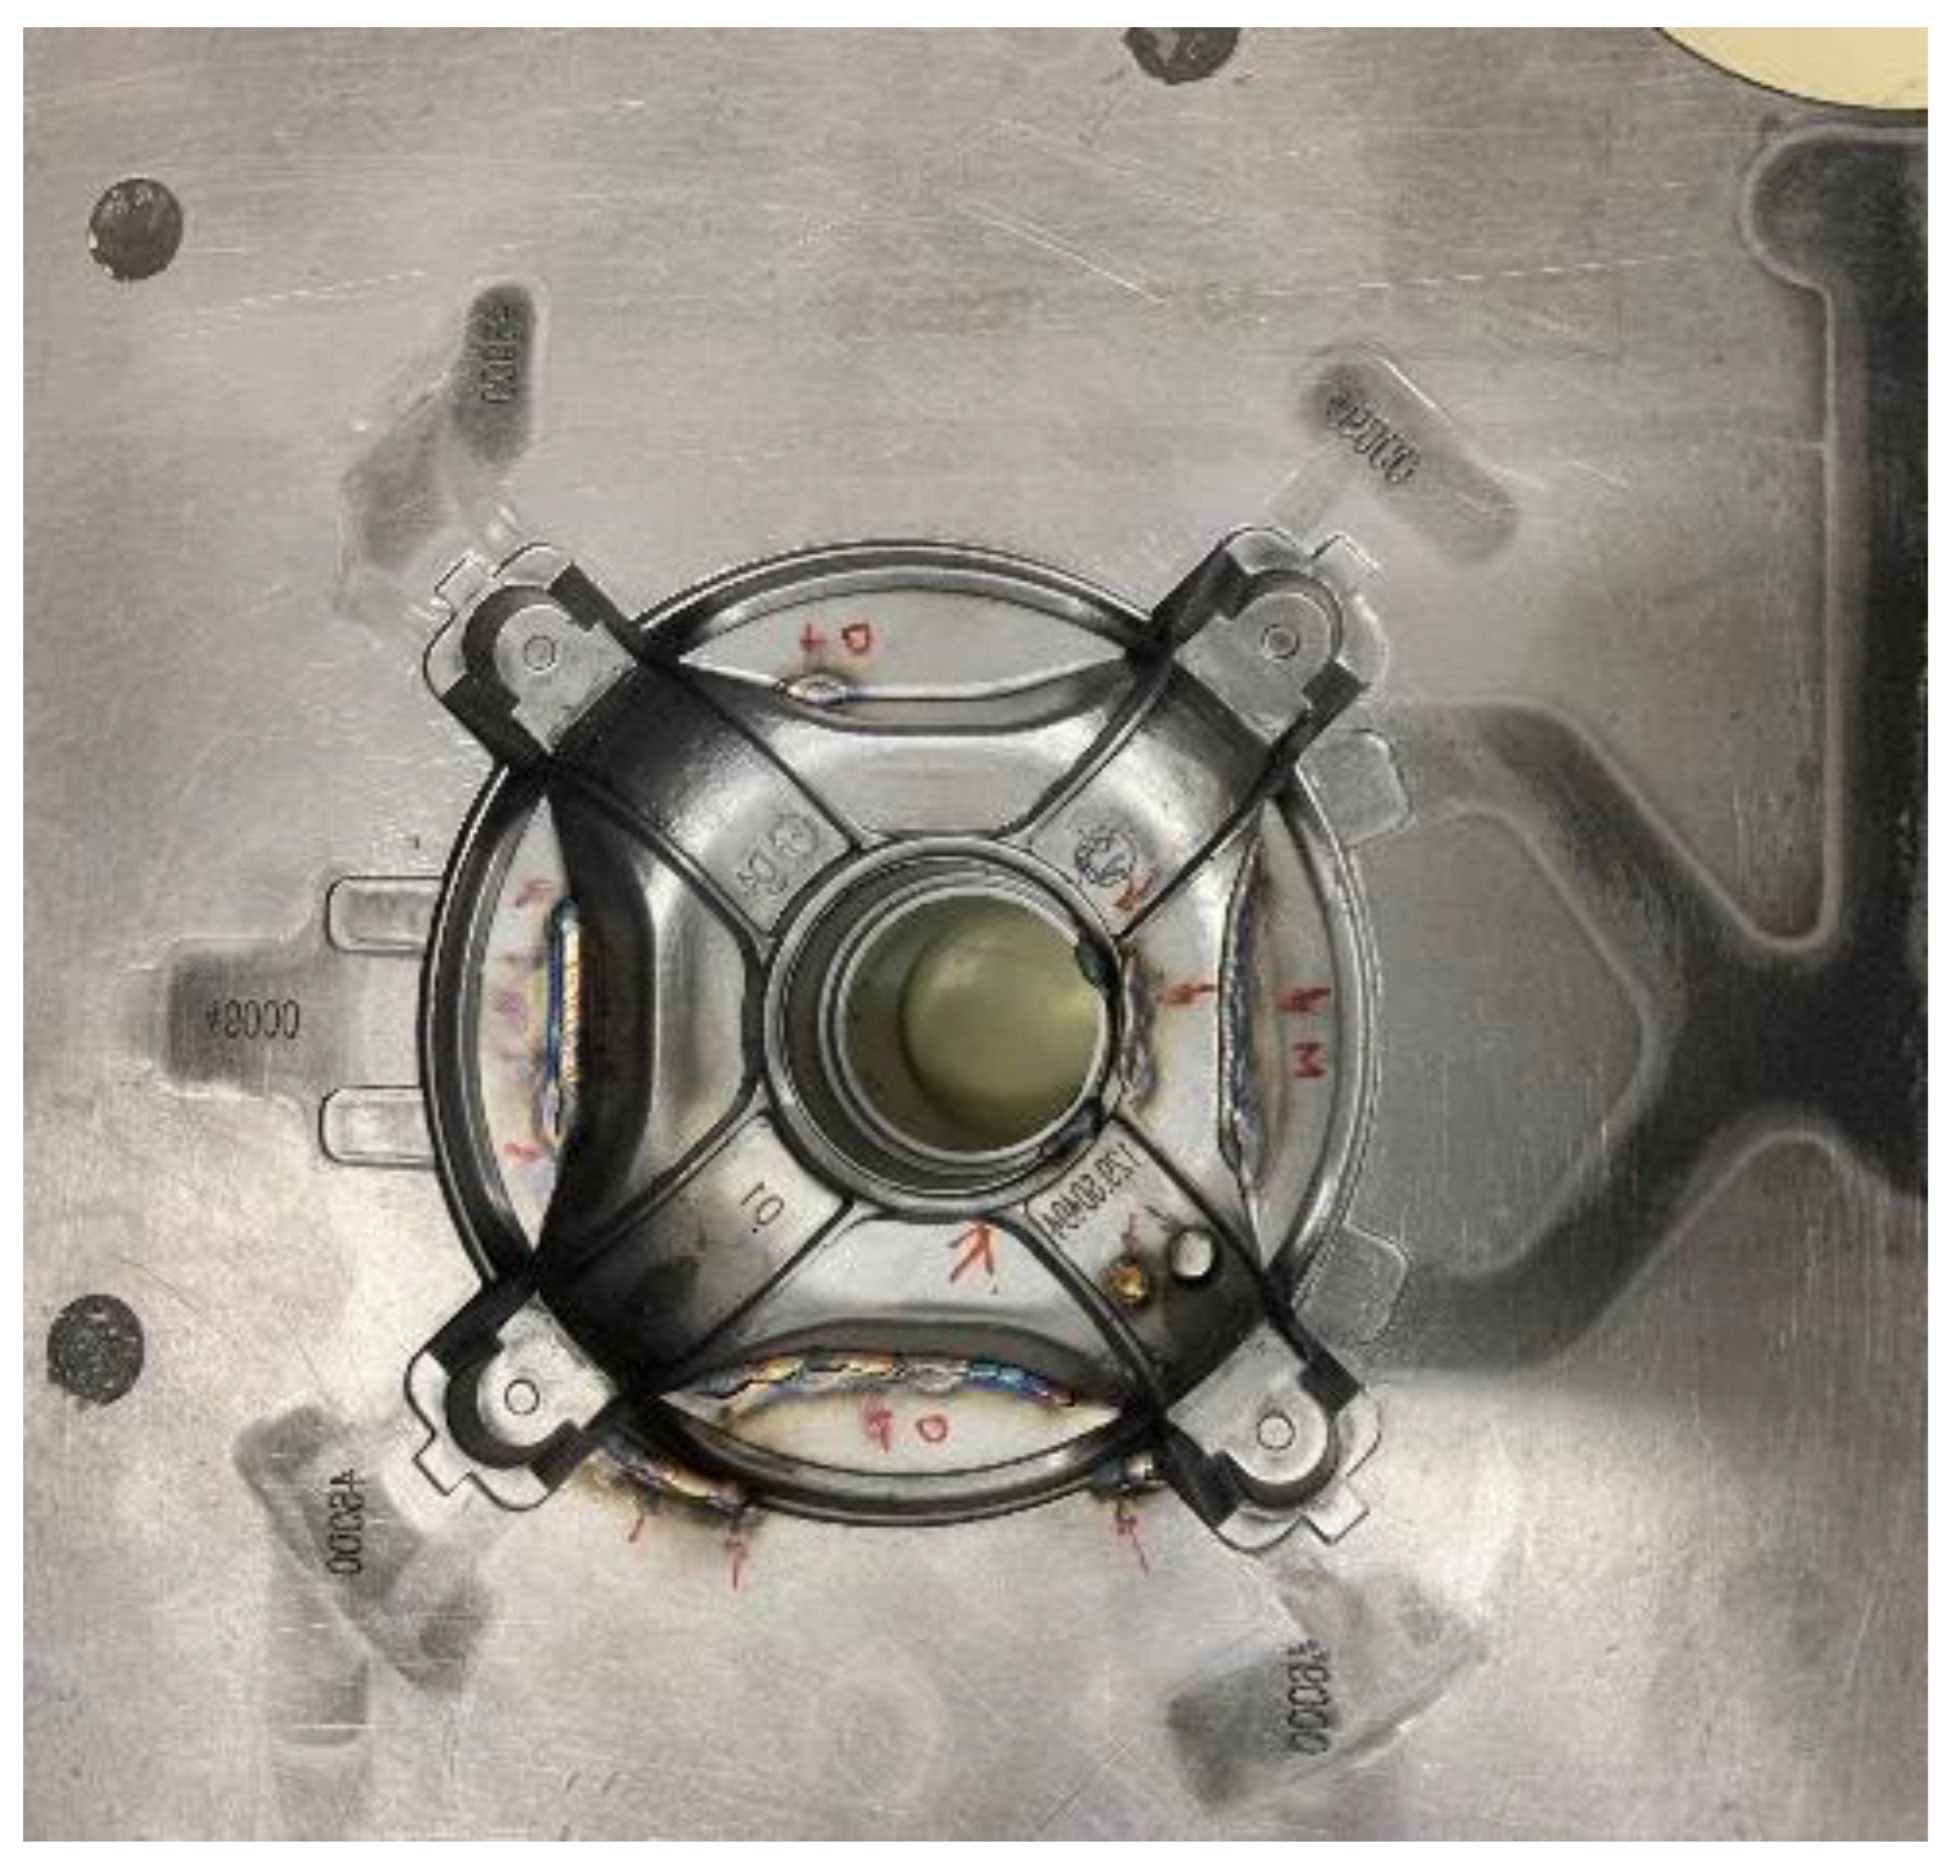
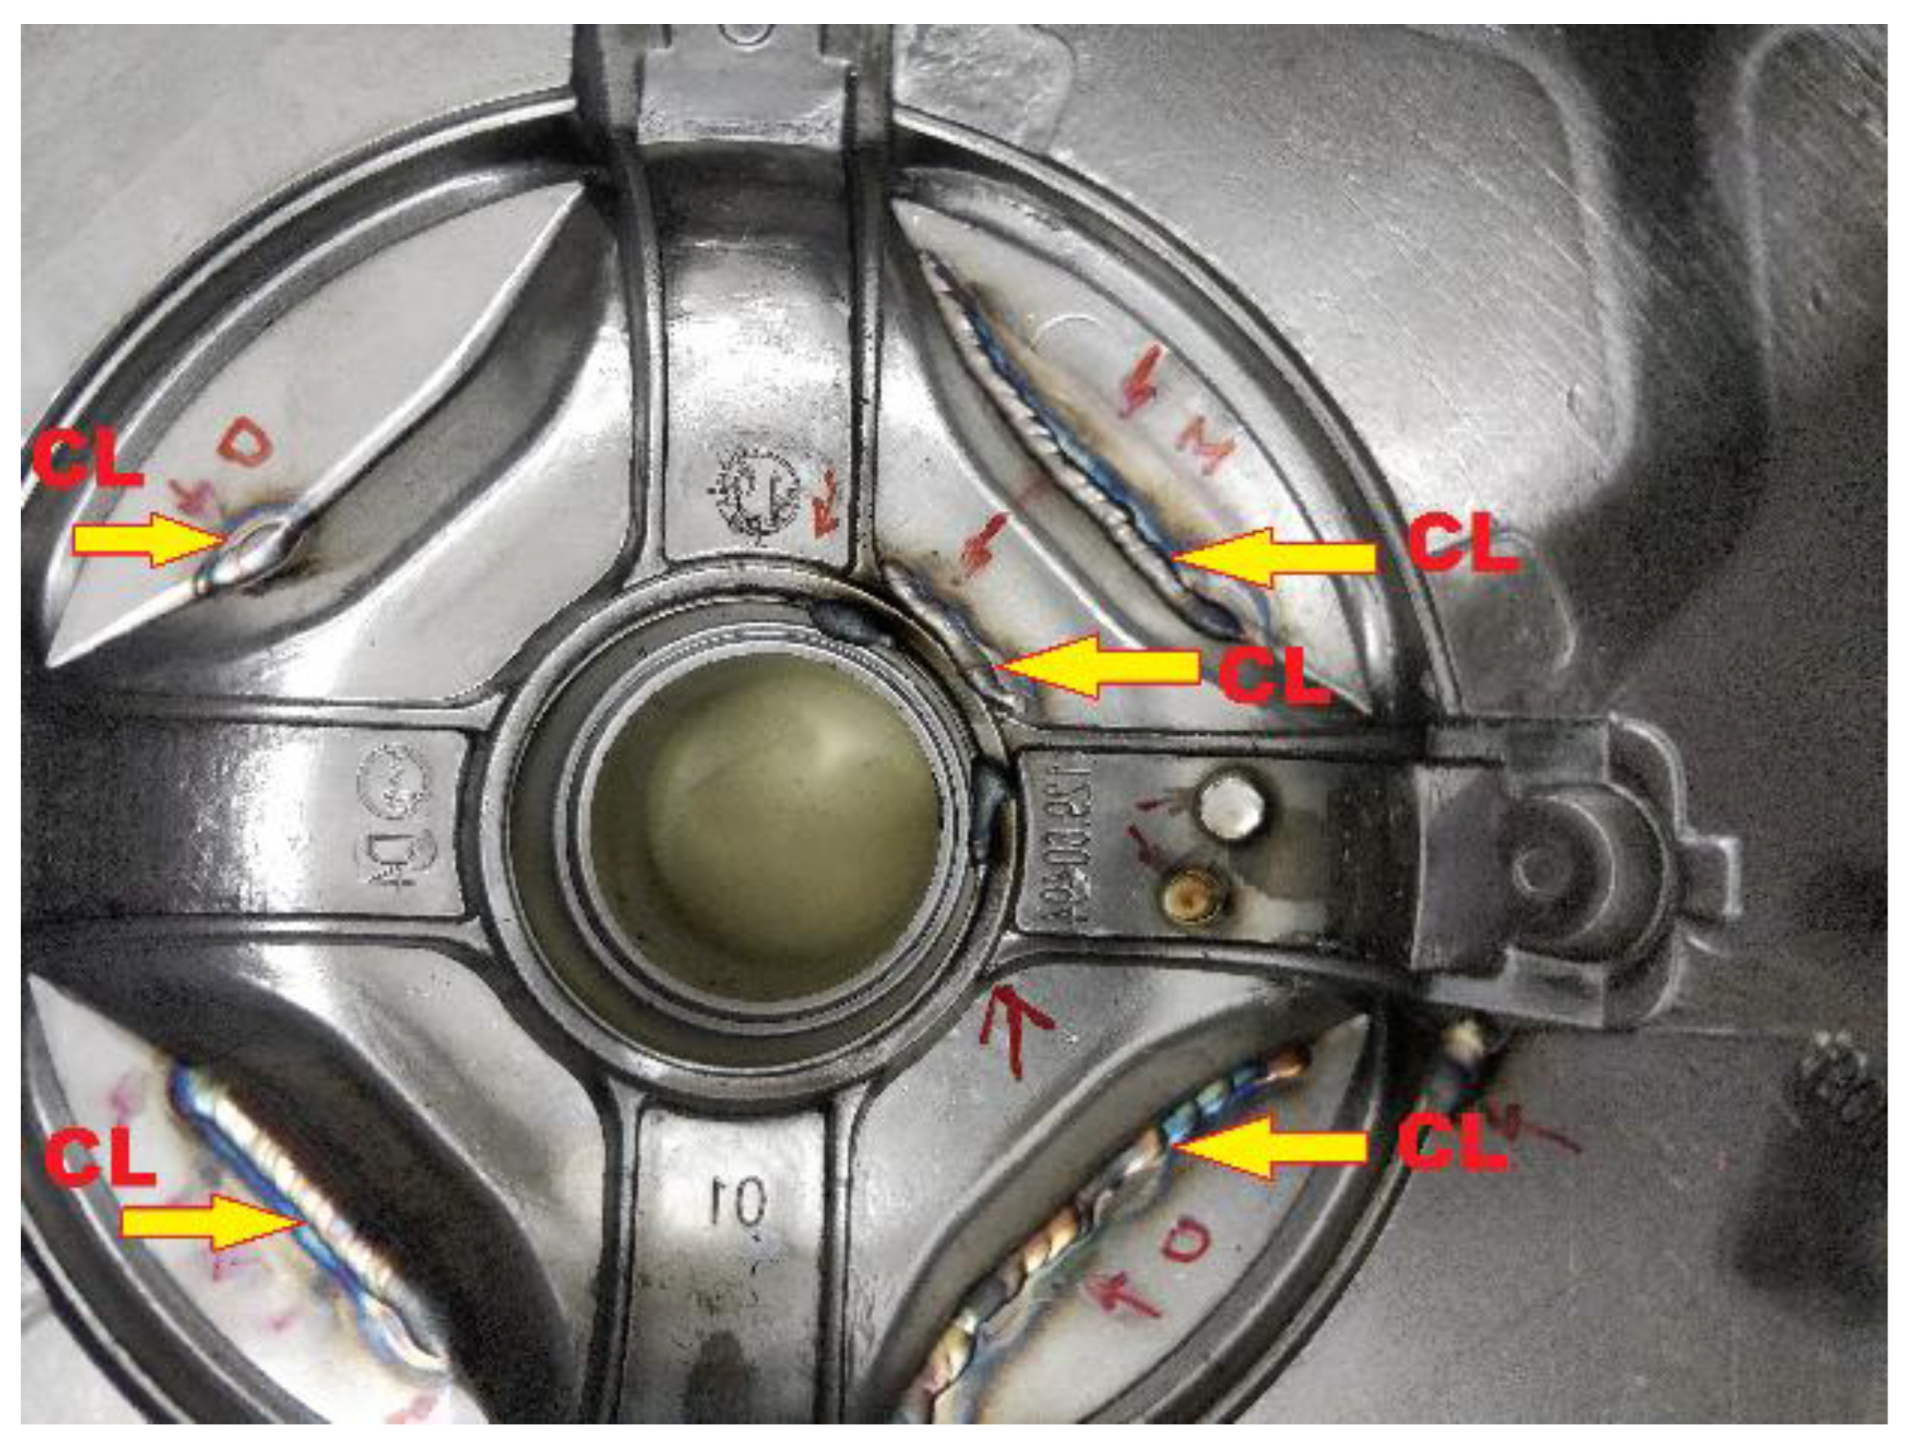
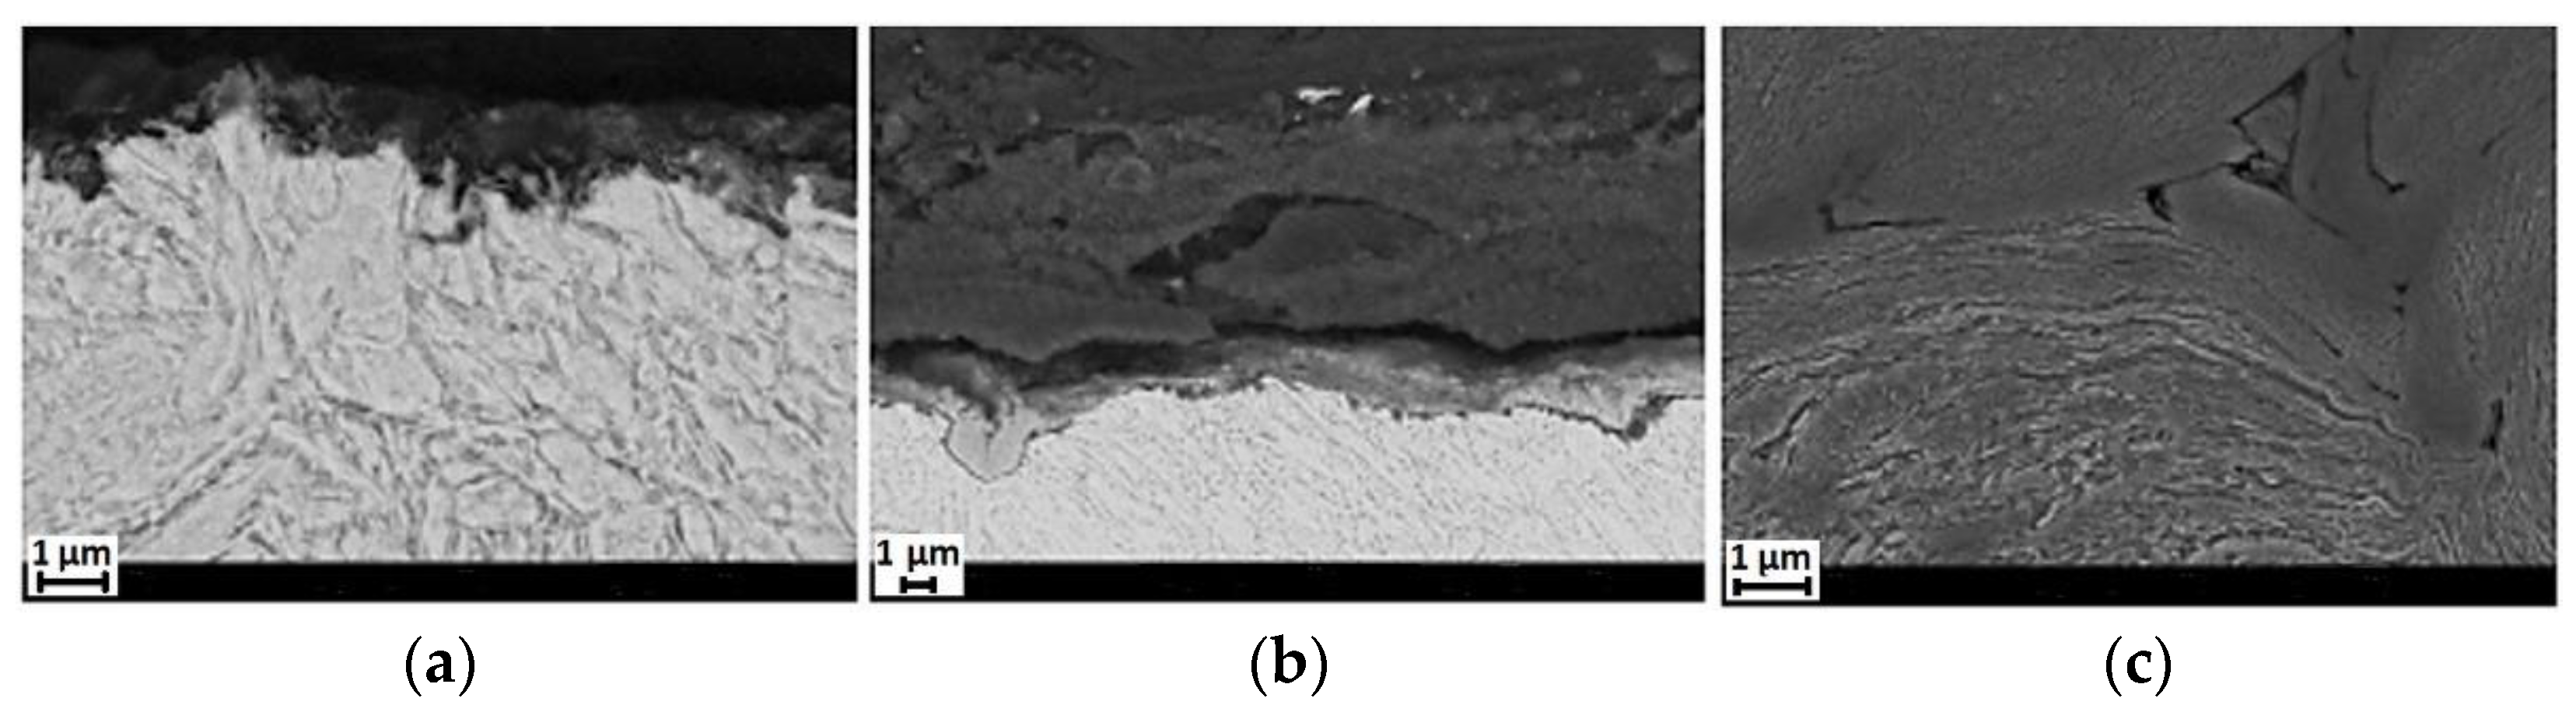
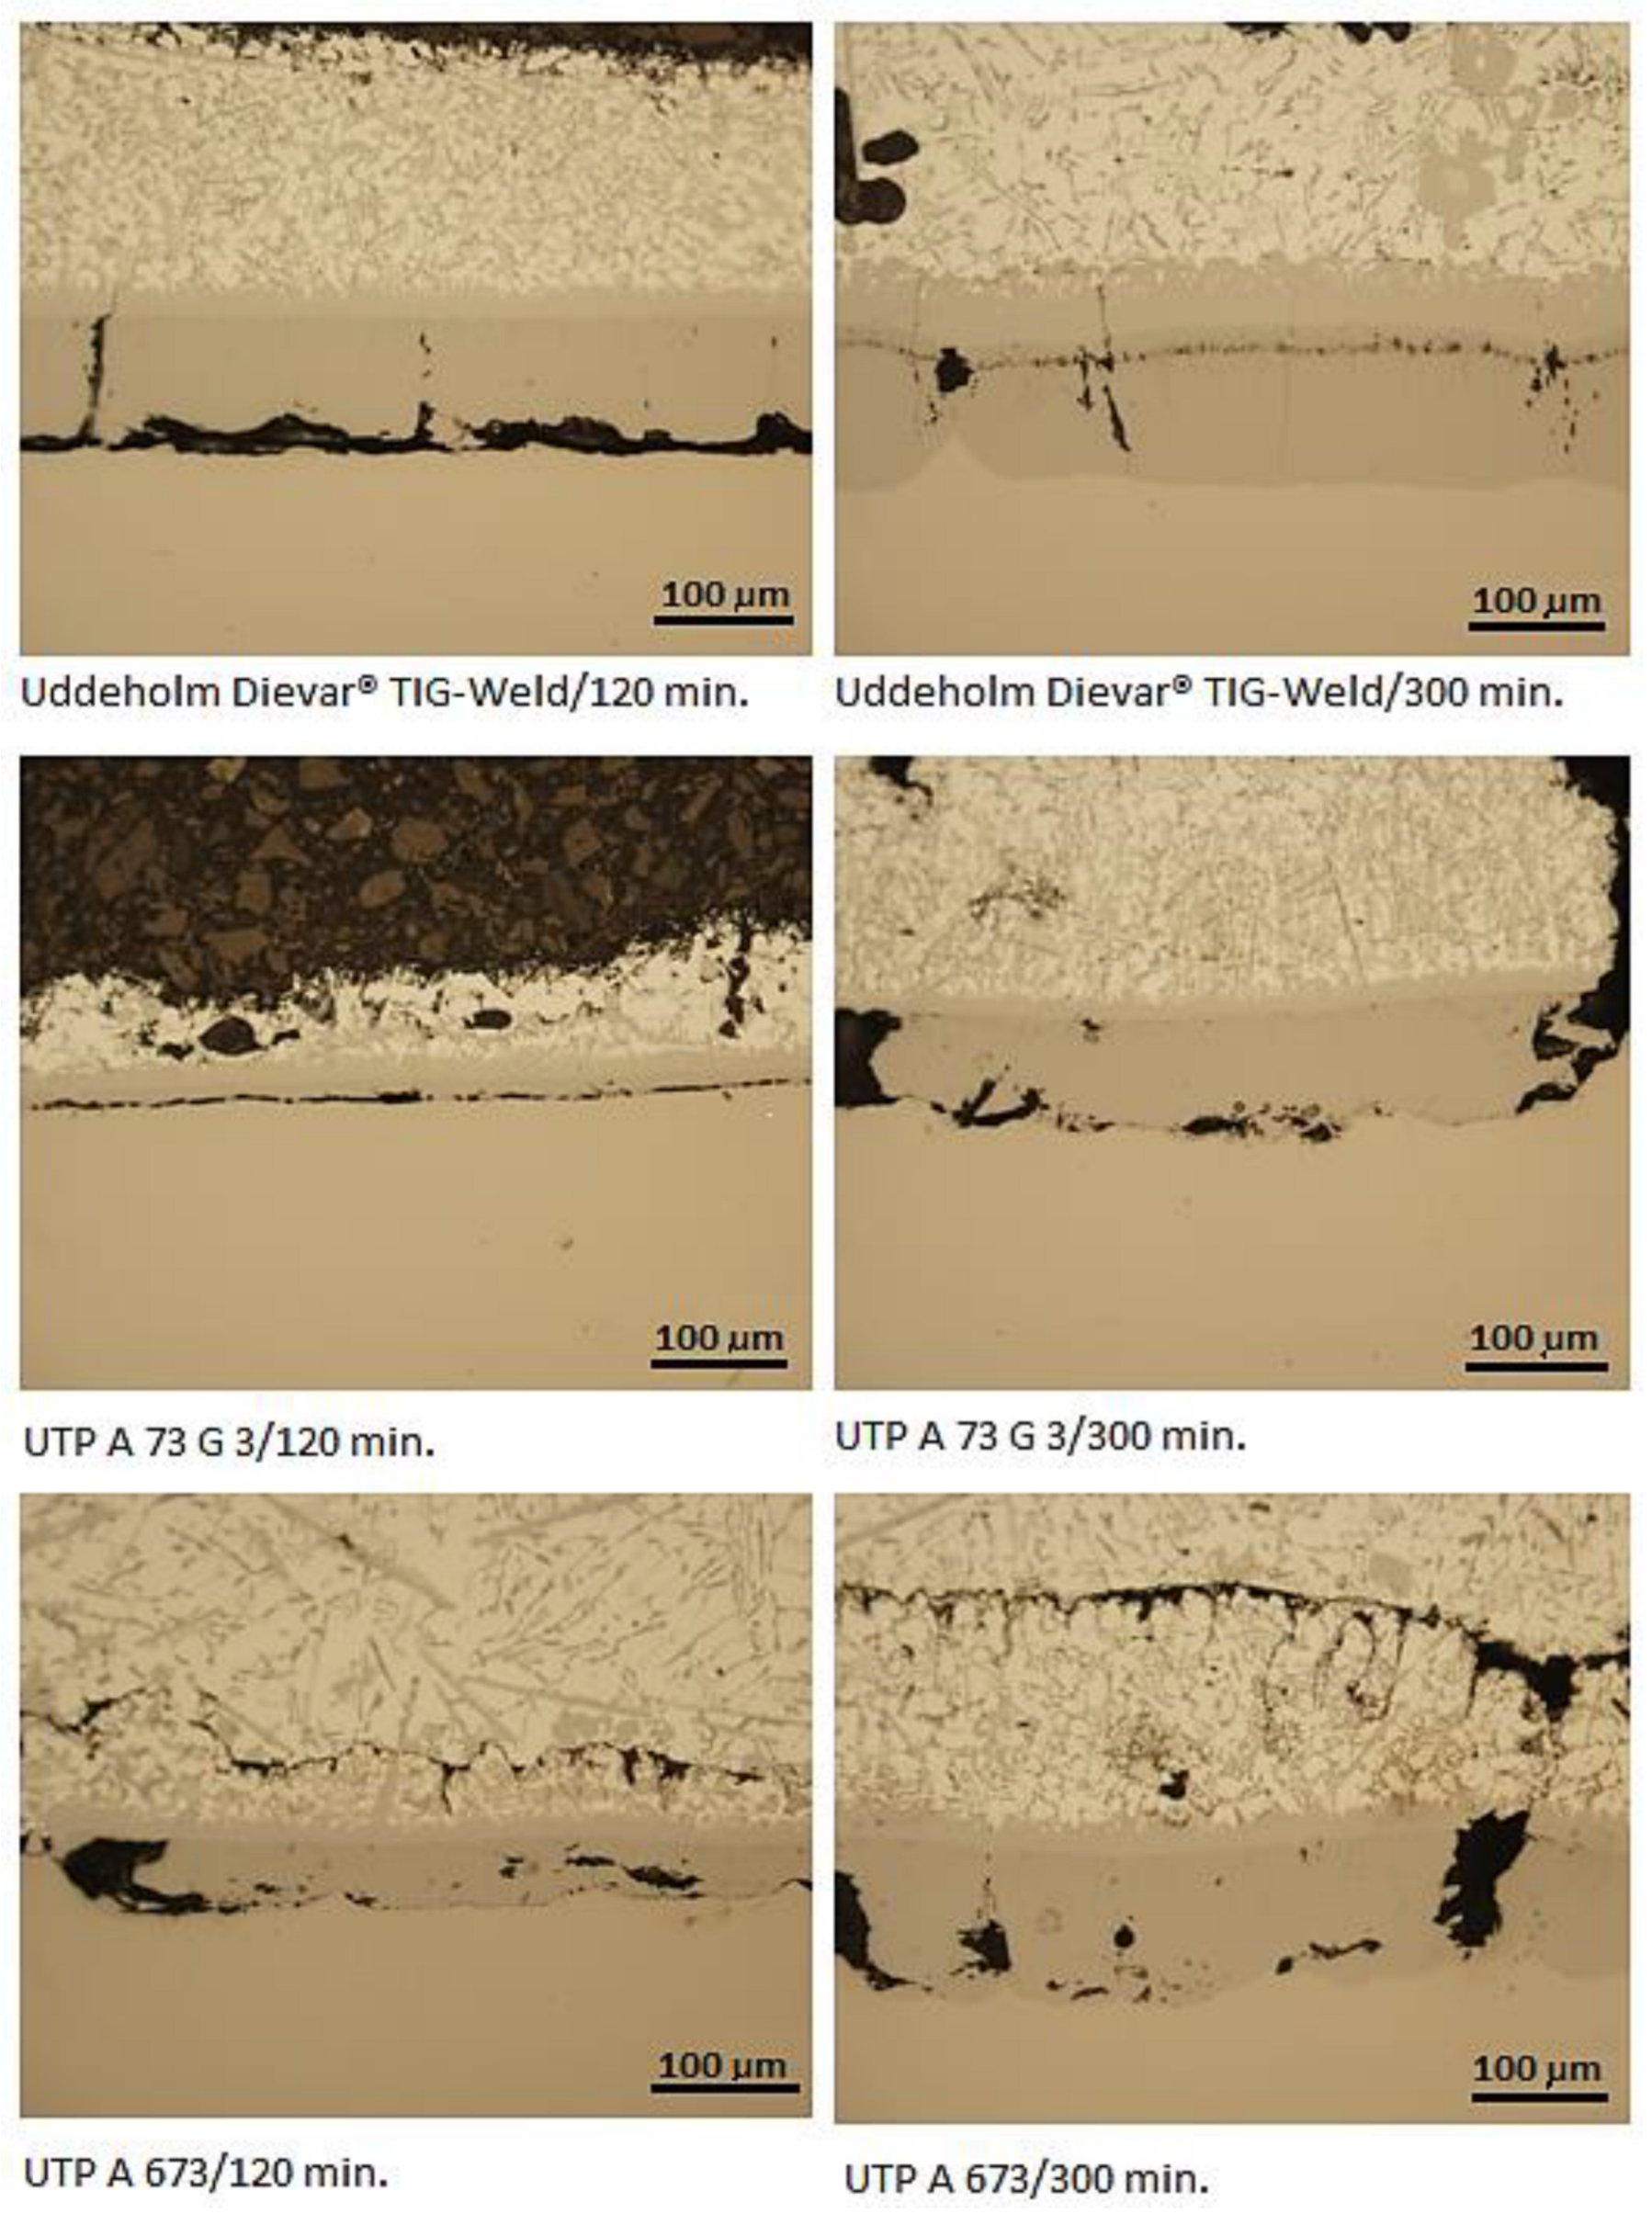
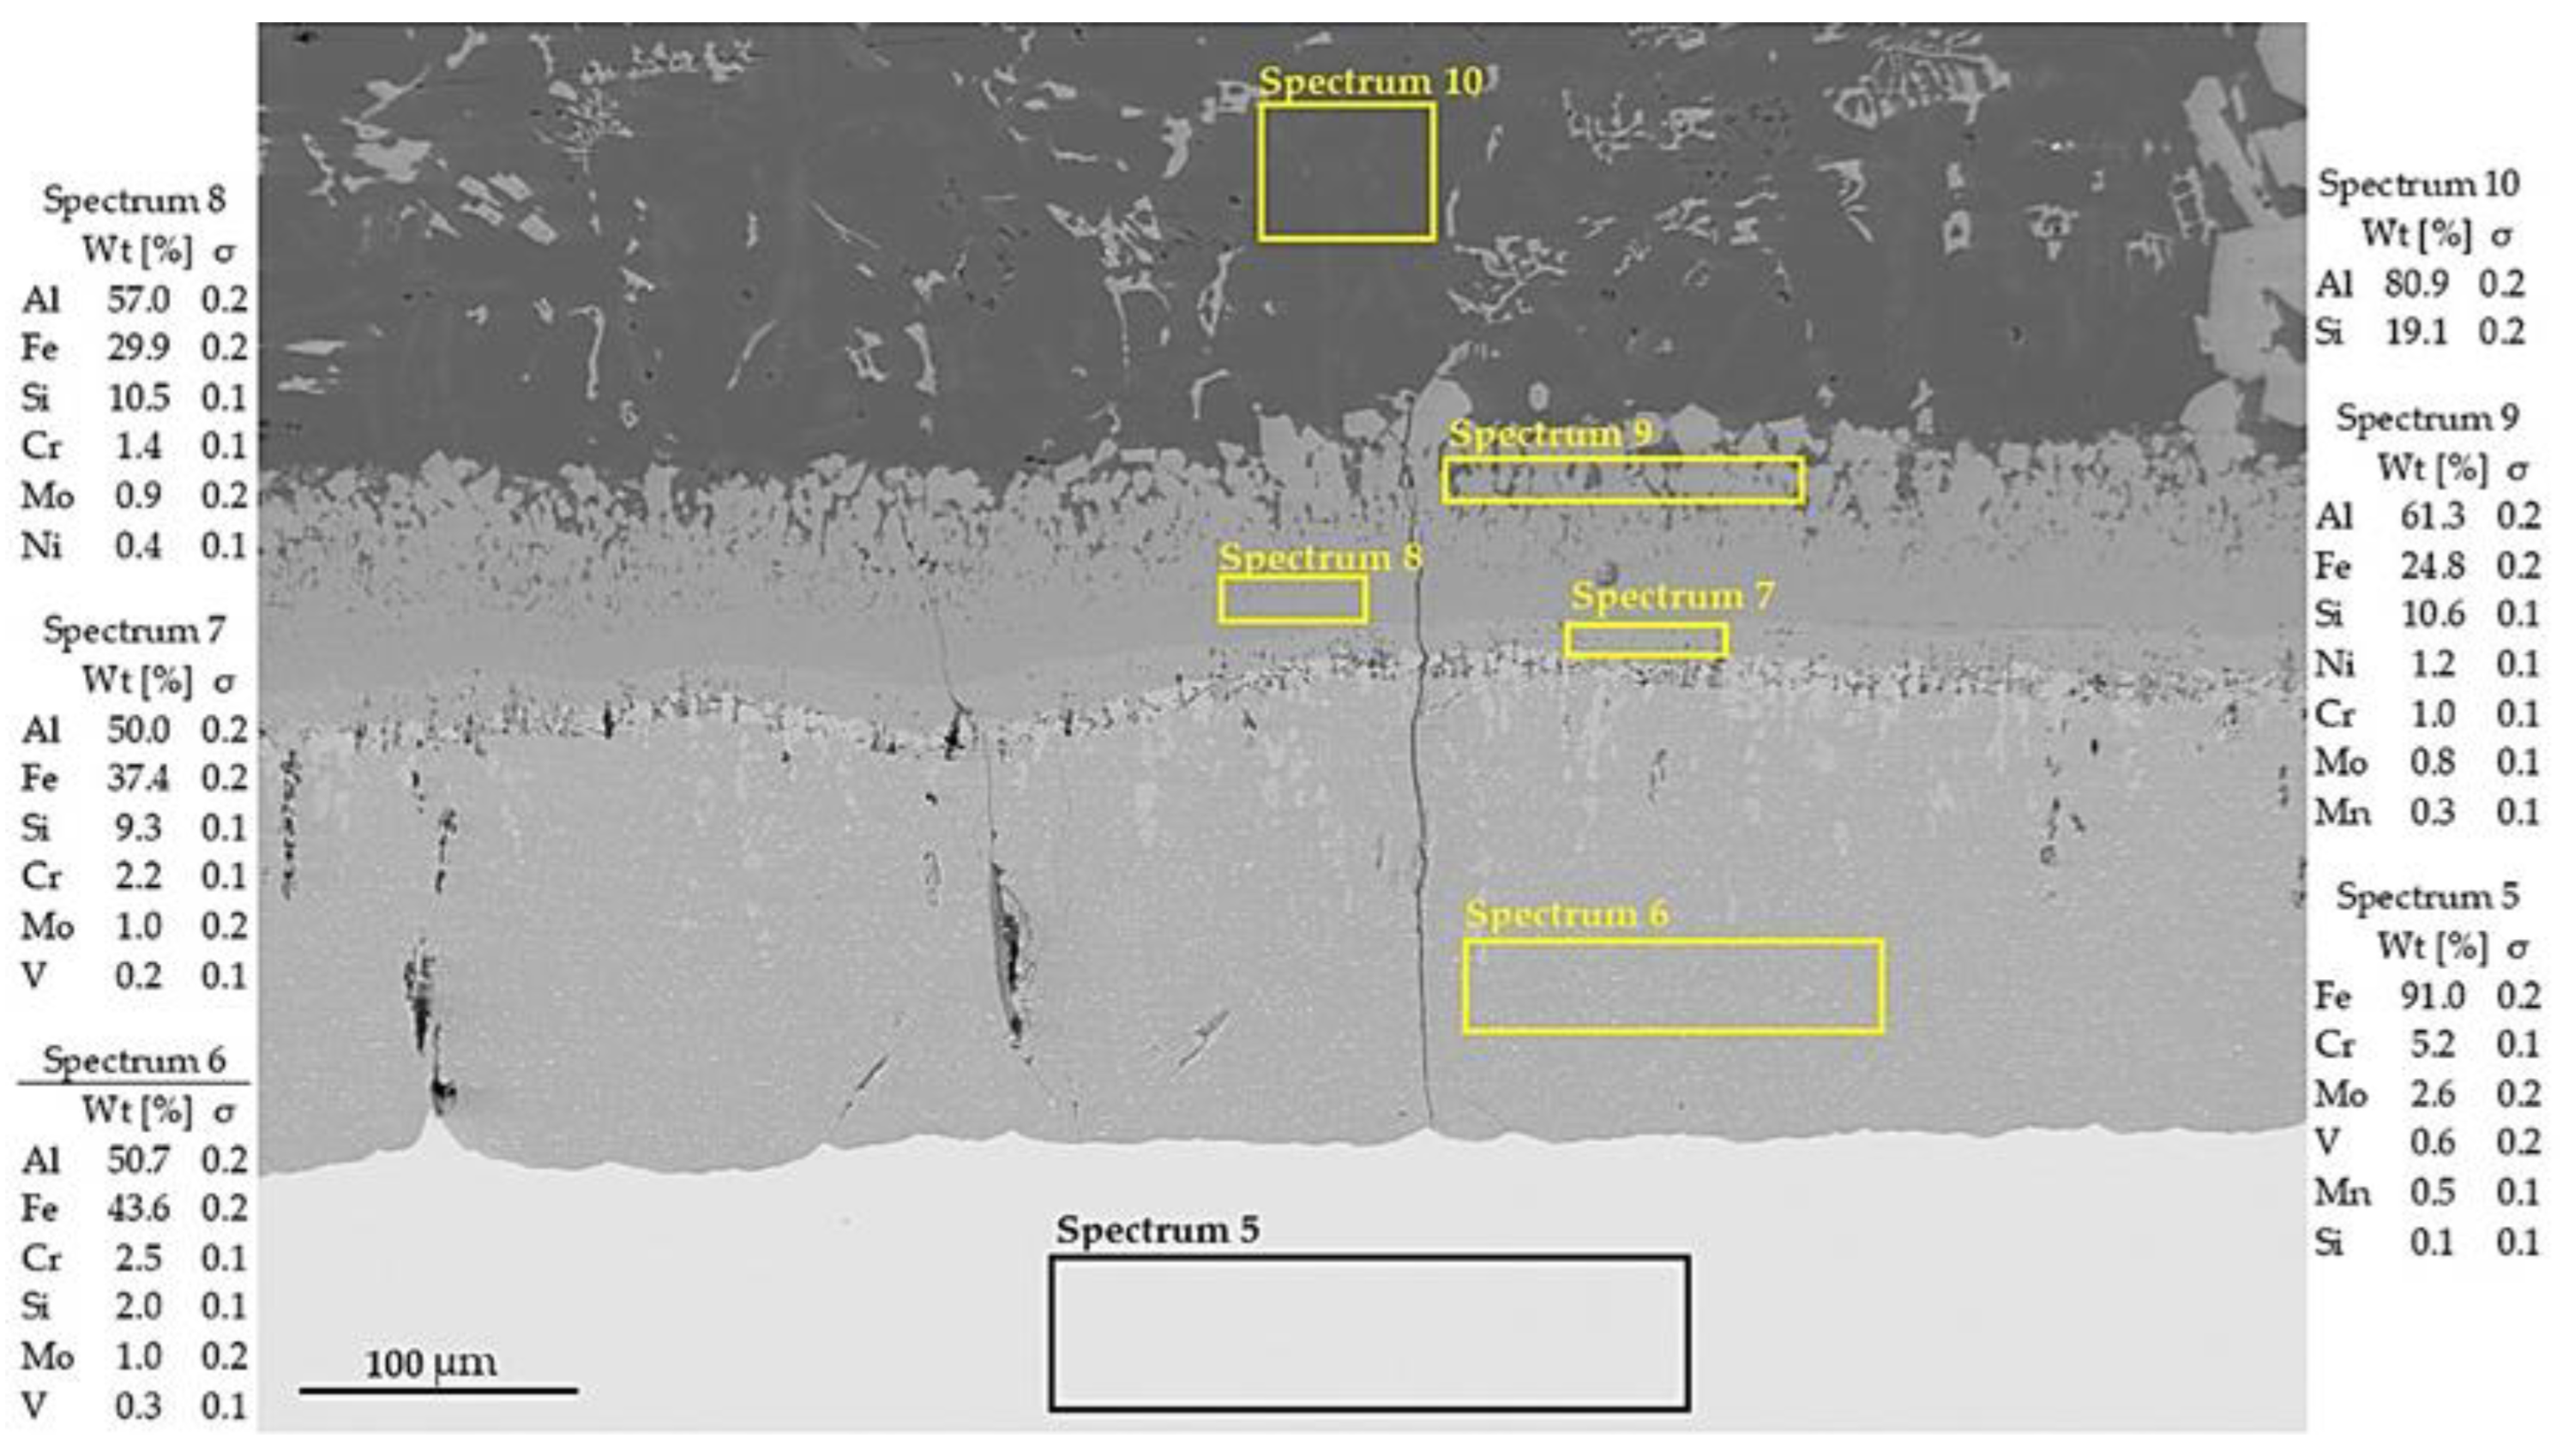
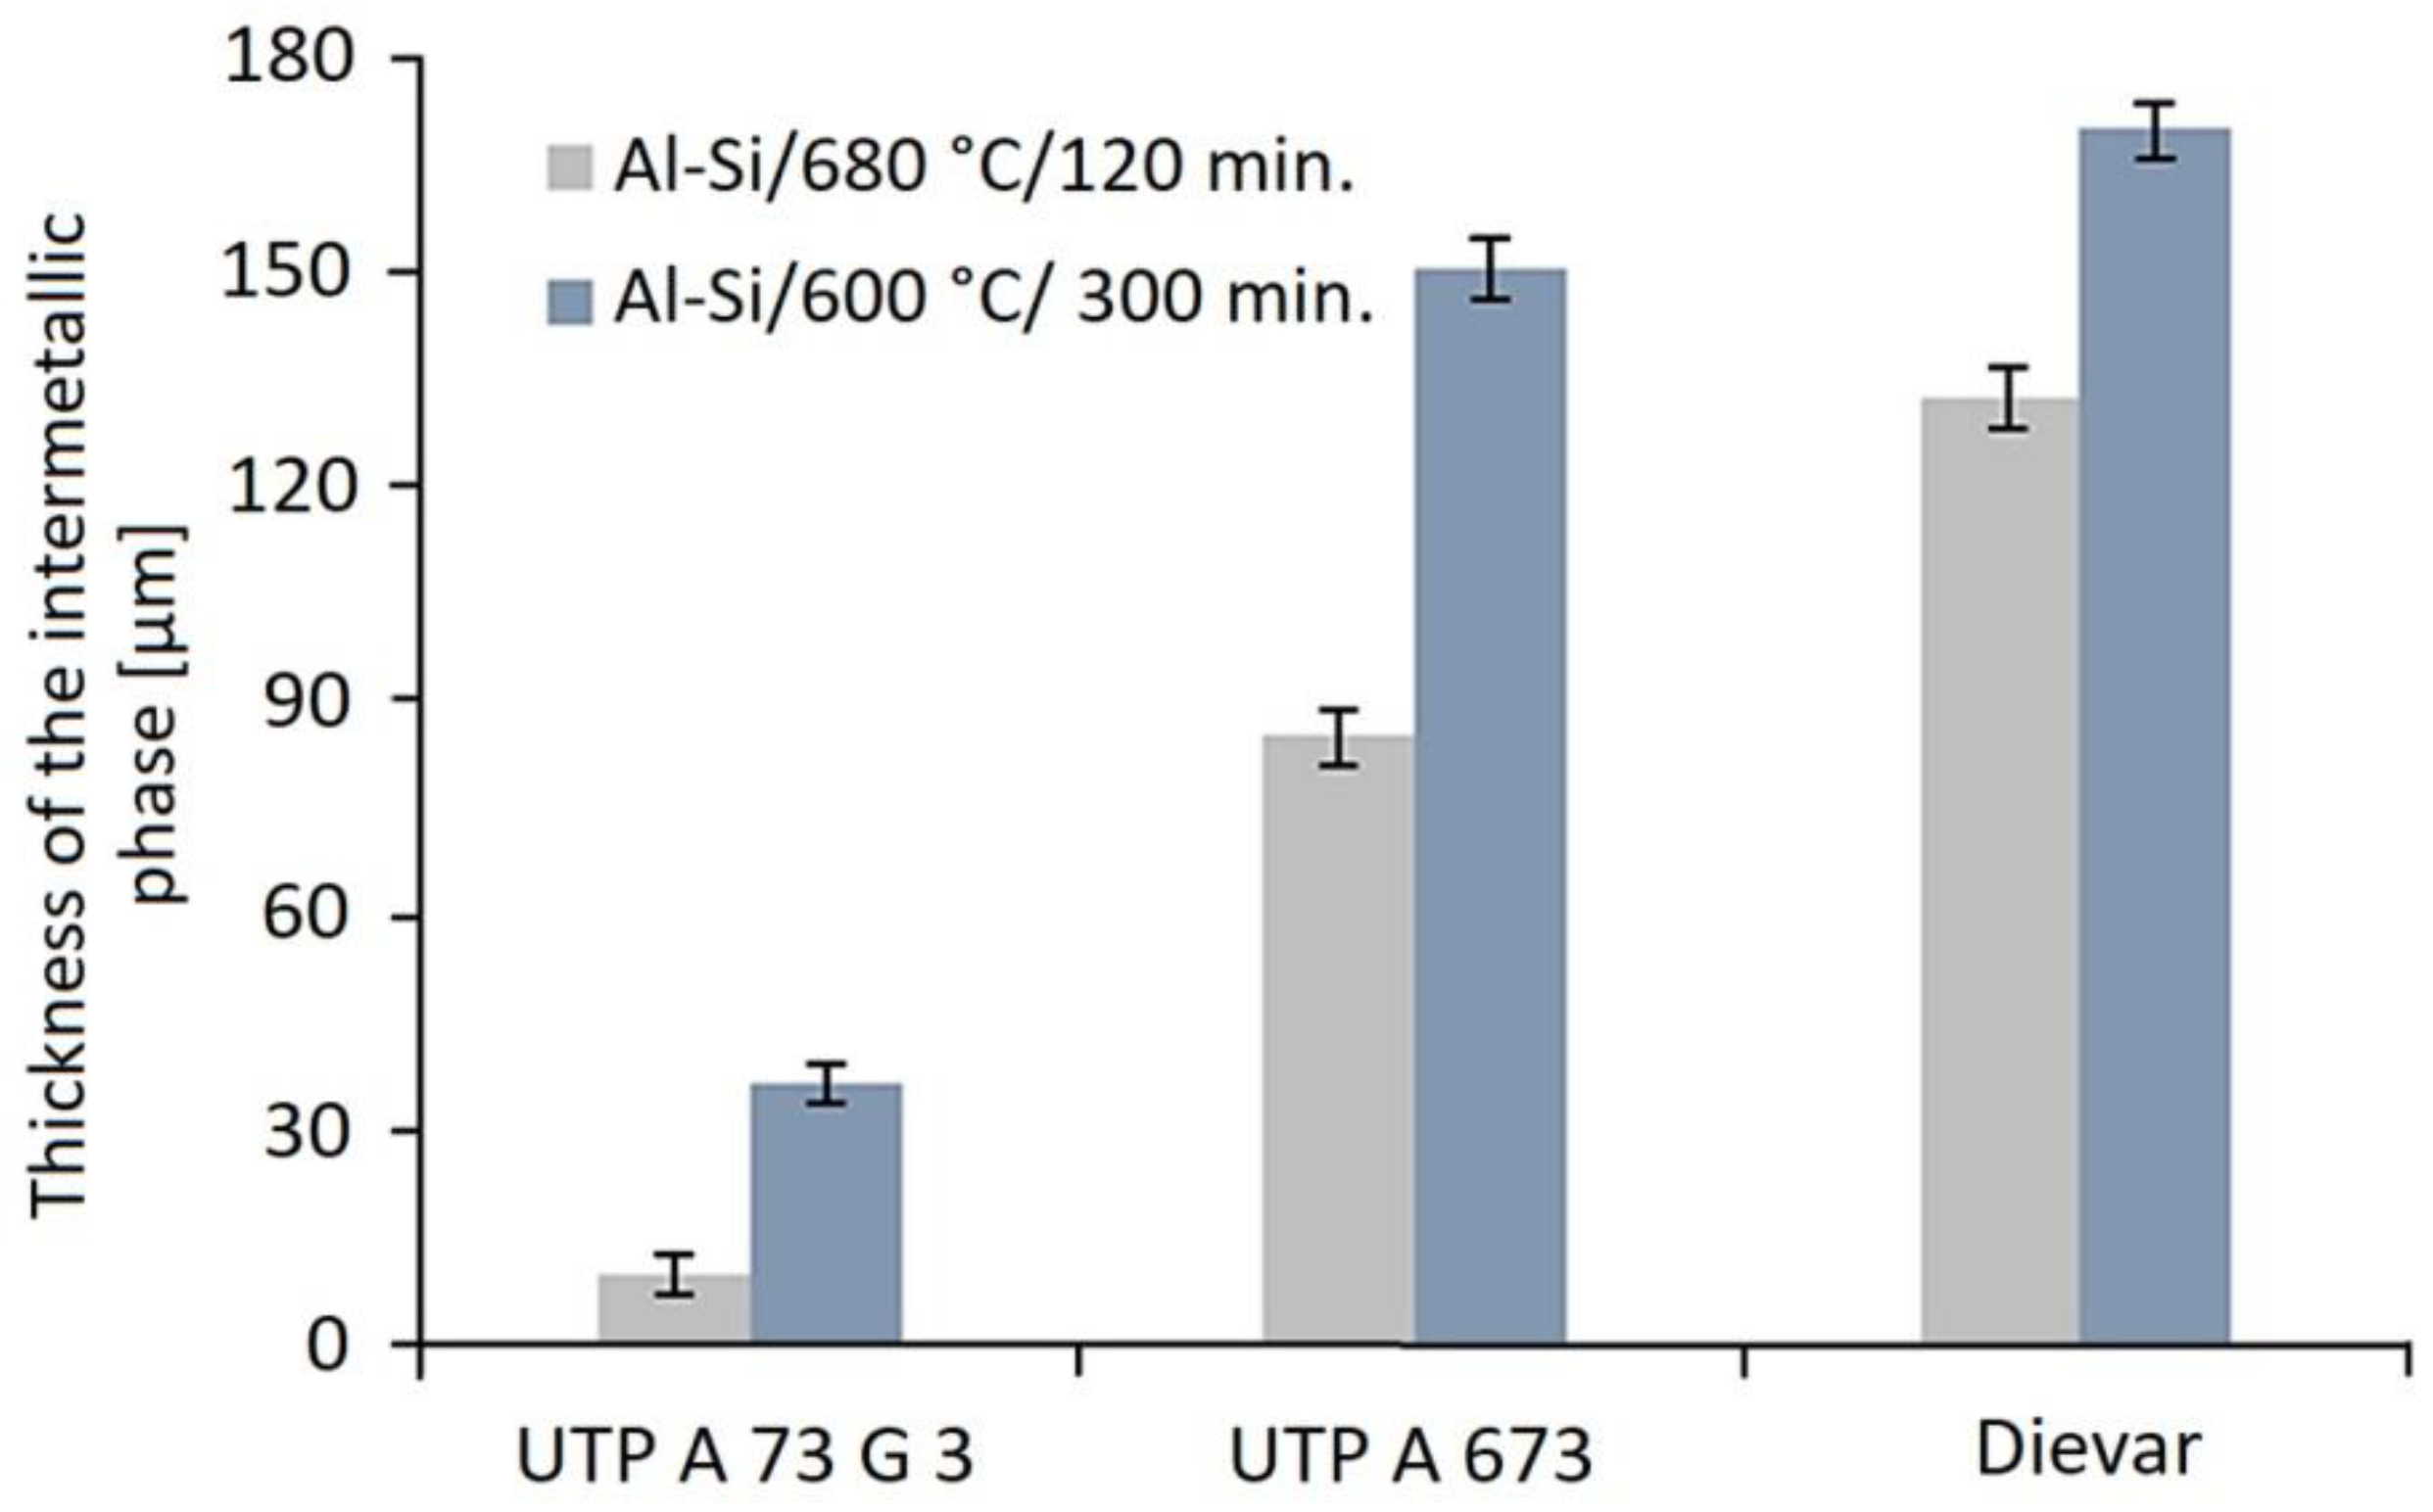
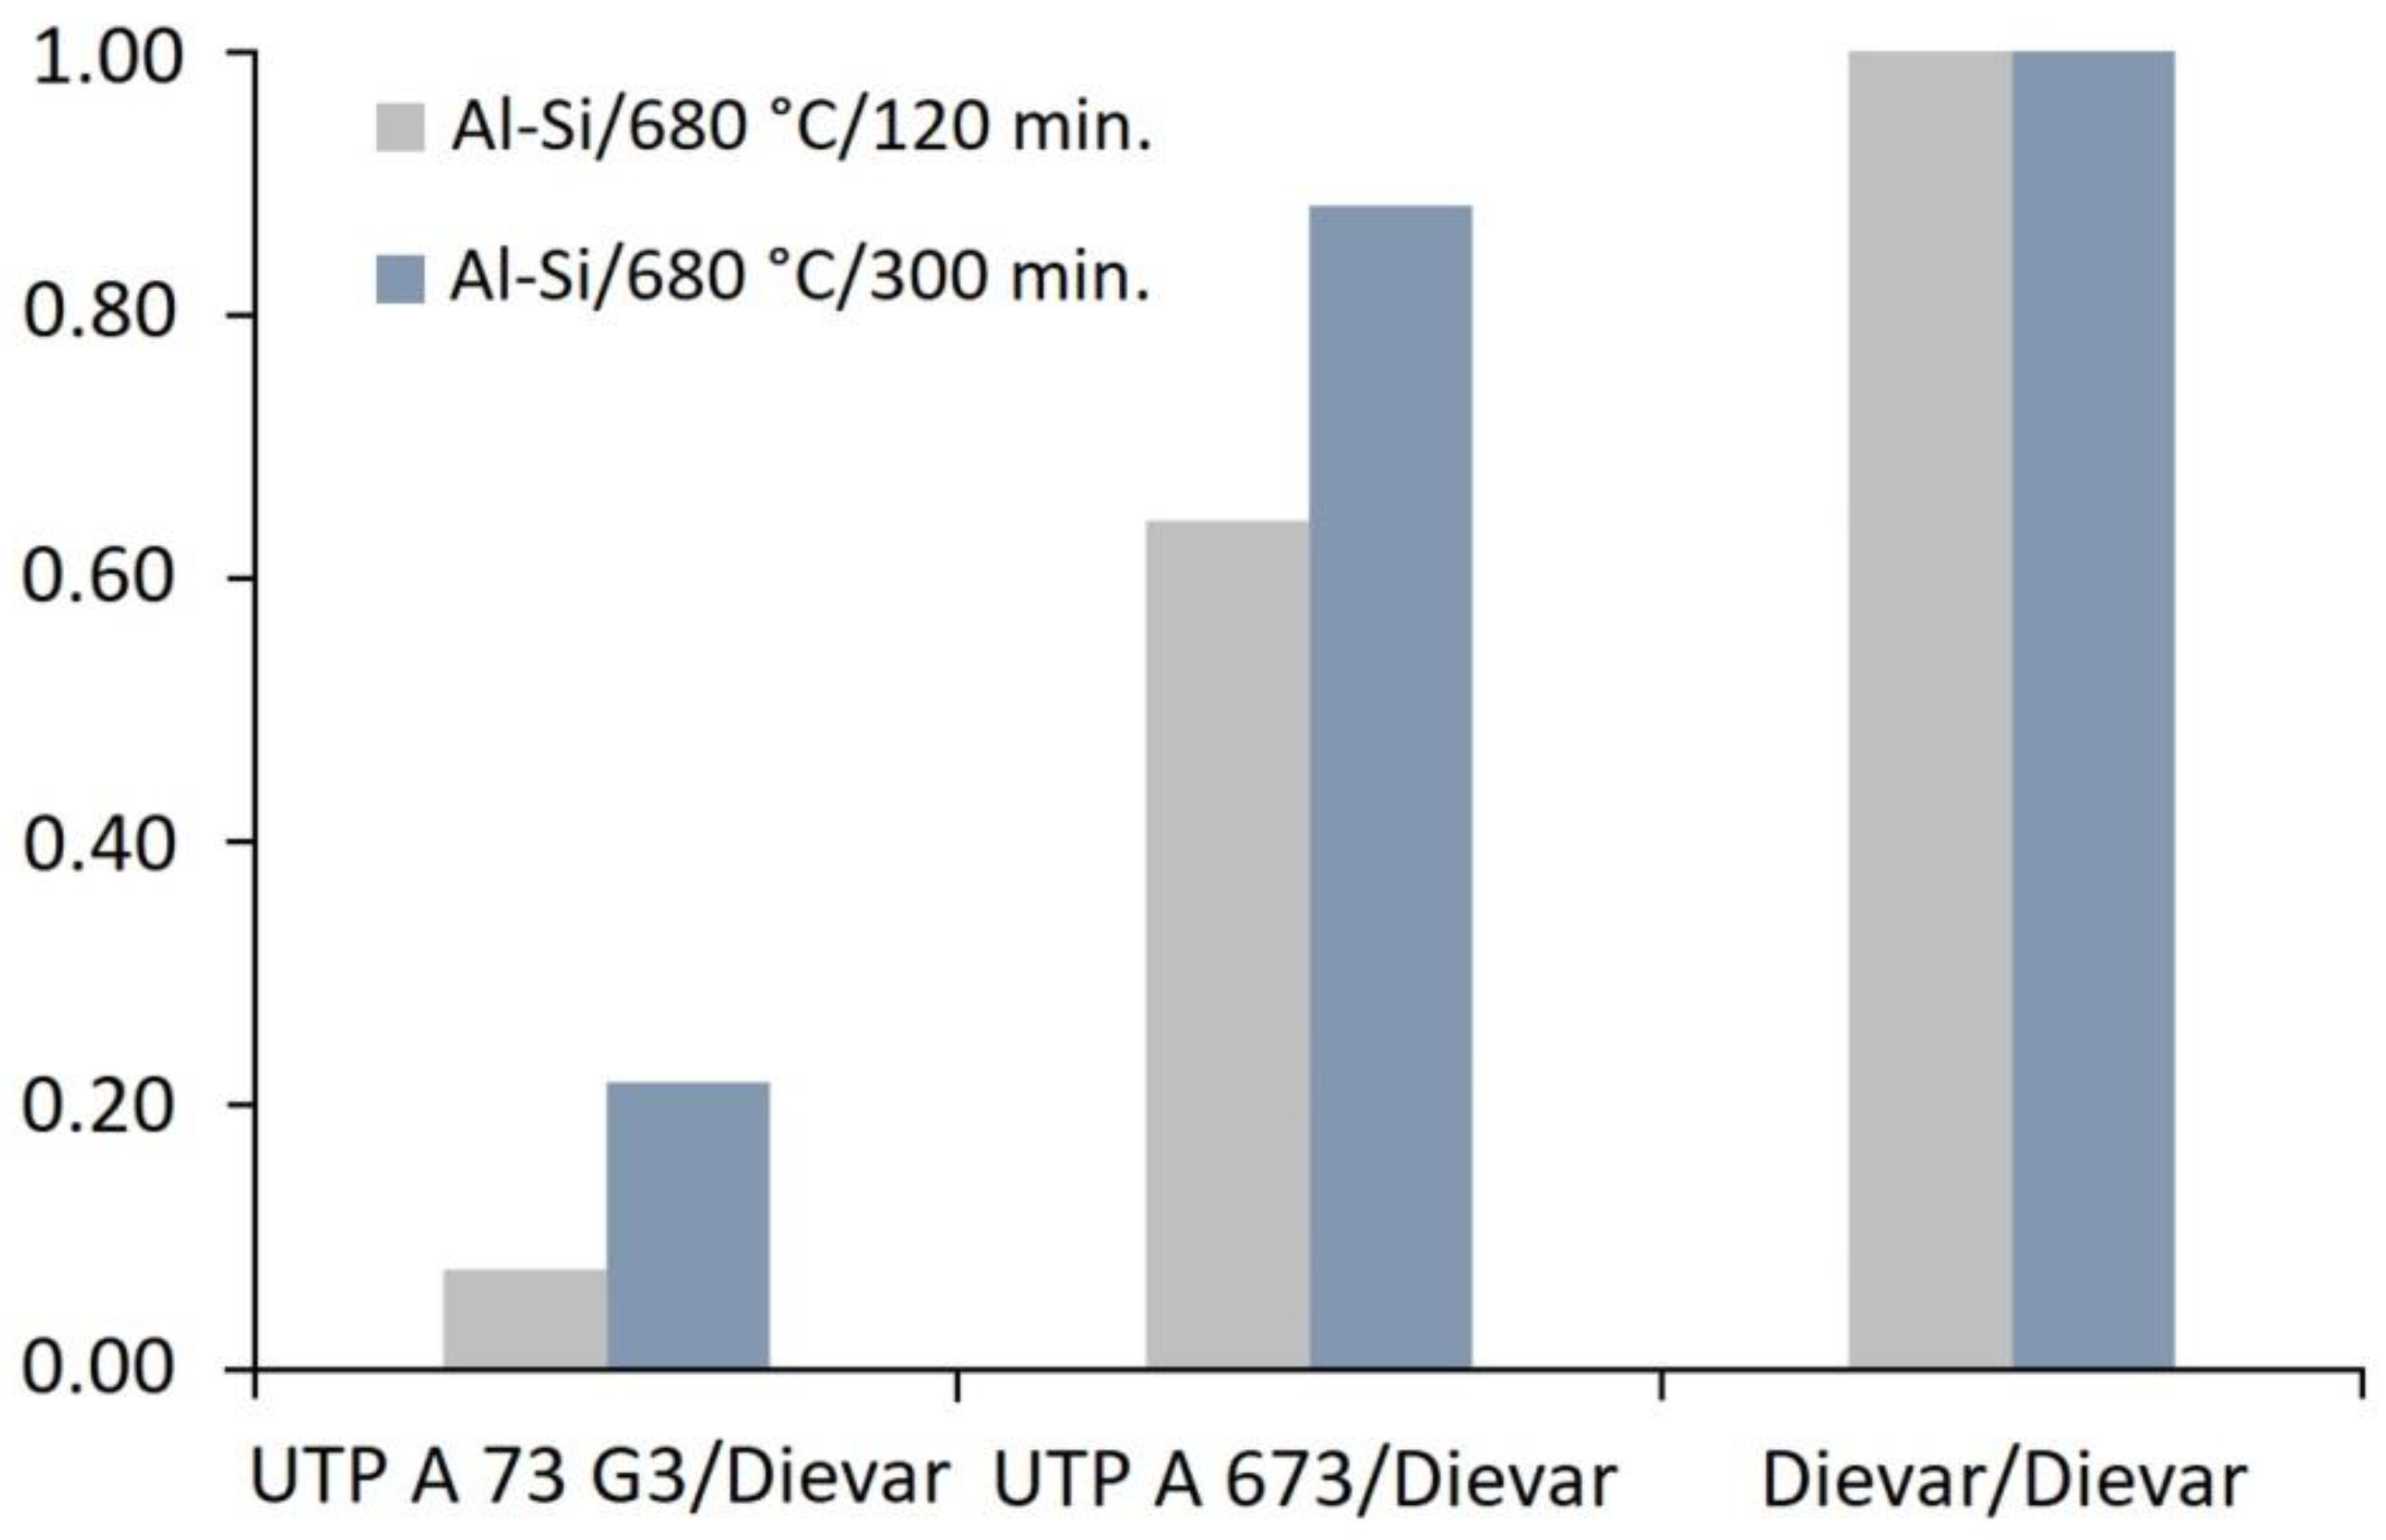
The guideline test for the grade evaluation of the cladding layers that were intended for the restoration of the injection molds is a technological test simulating the real conditions in the steel–Al alloy interaction. The results of this test have shown that it is this interaction of the pair of materials is the limiting factor in the lifespan of the injection molds. The microscopic analysis showed the separation of the entire cladding layers at the base material–base layer interface. The most extensive destruction which was due to the sample dilation occurred in the Cronitex RC 44 cladding. Here, the entire cladding layer was separated. The formation of linear intermetallic phases was observed in the sample that was made with the Dievar and UTP A 73 G3 cladding. The sample with UTP A 673 cladding also showed damage, but to a lesser extent, and the breach was jagged.
-
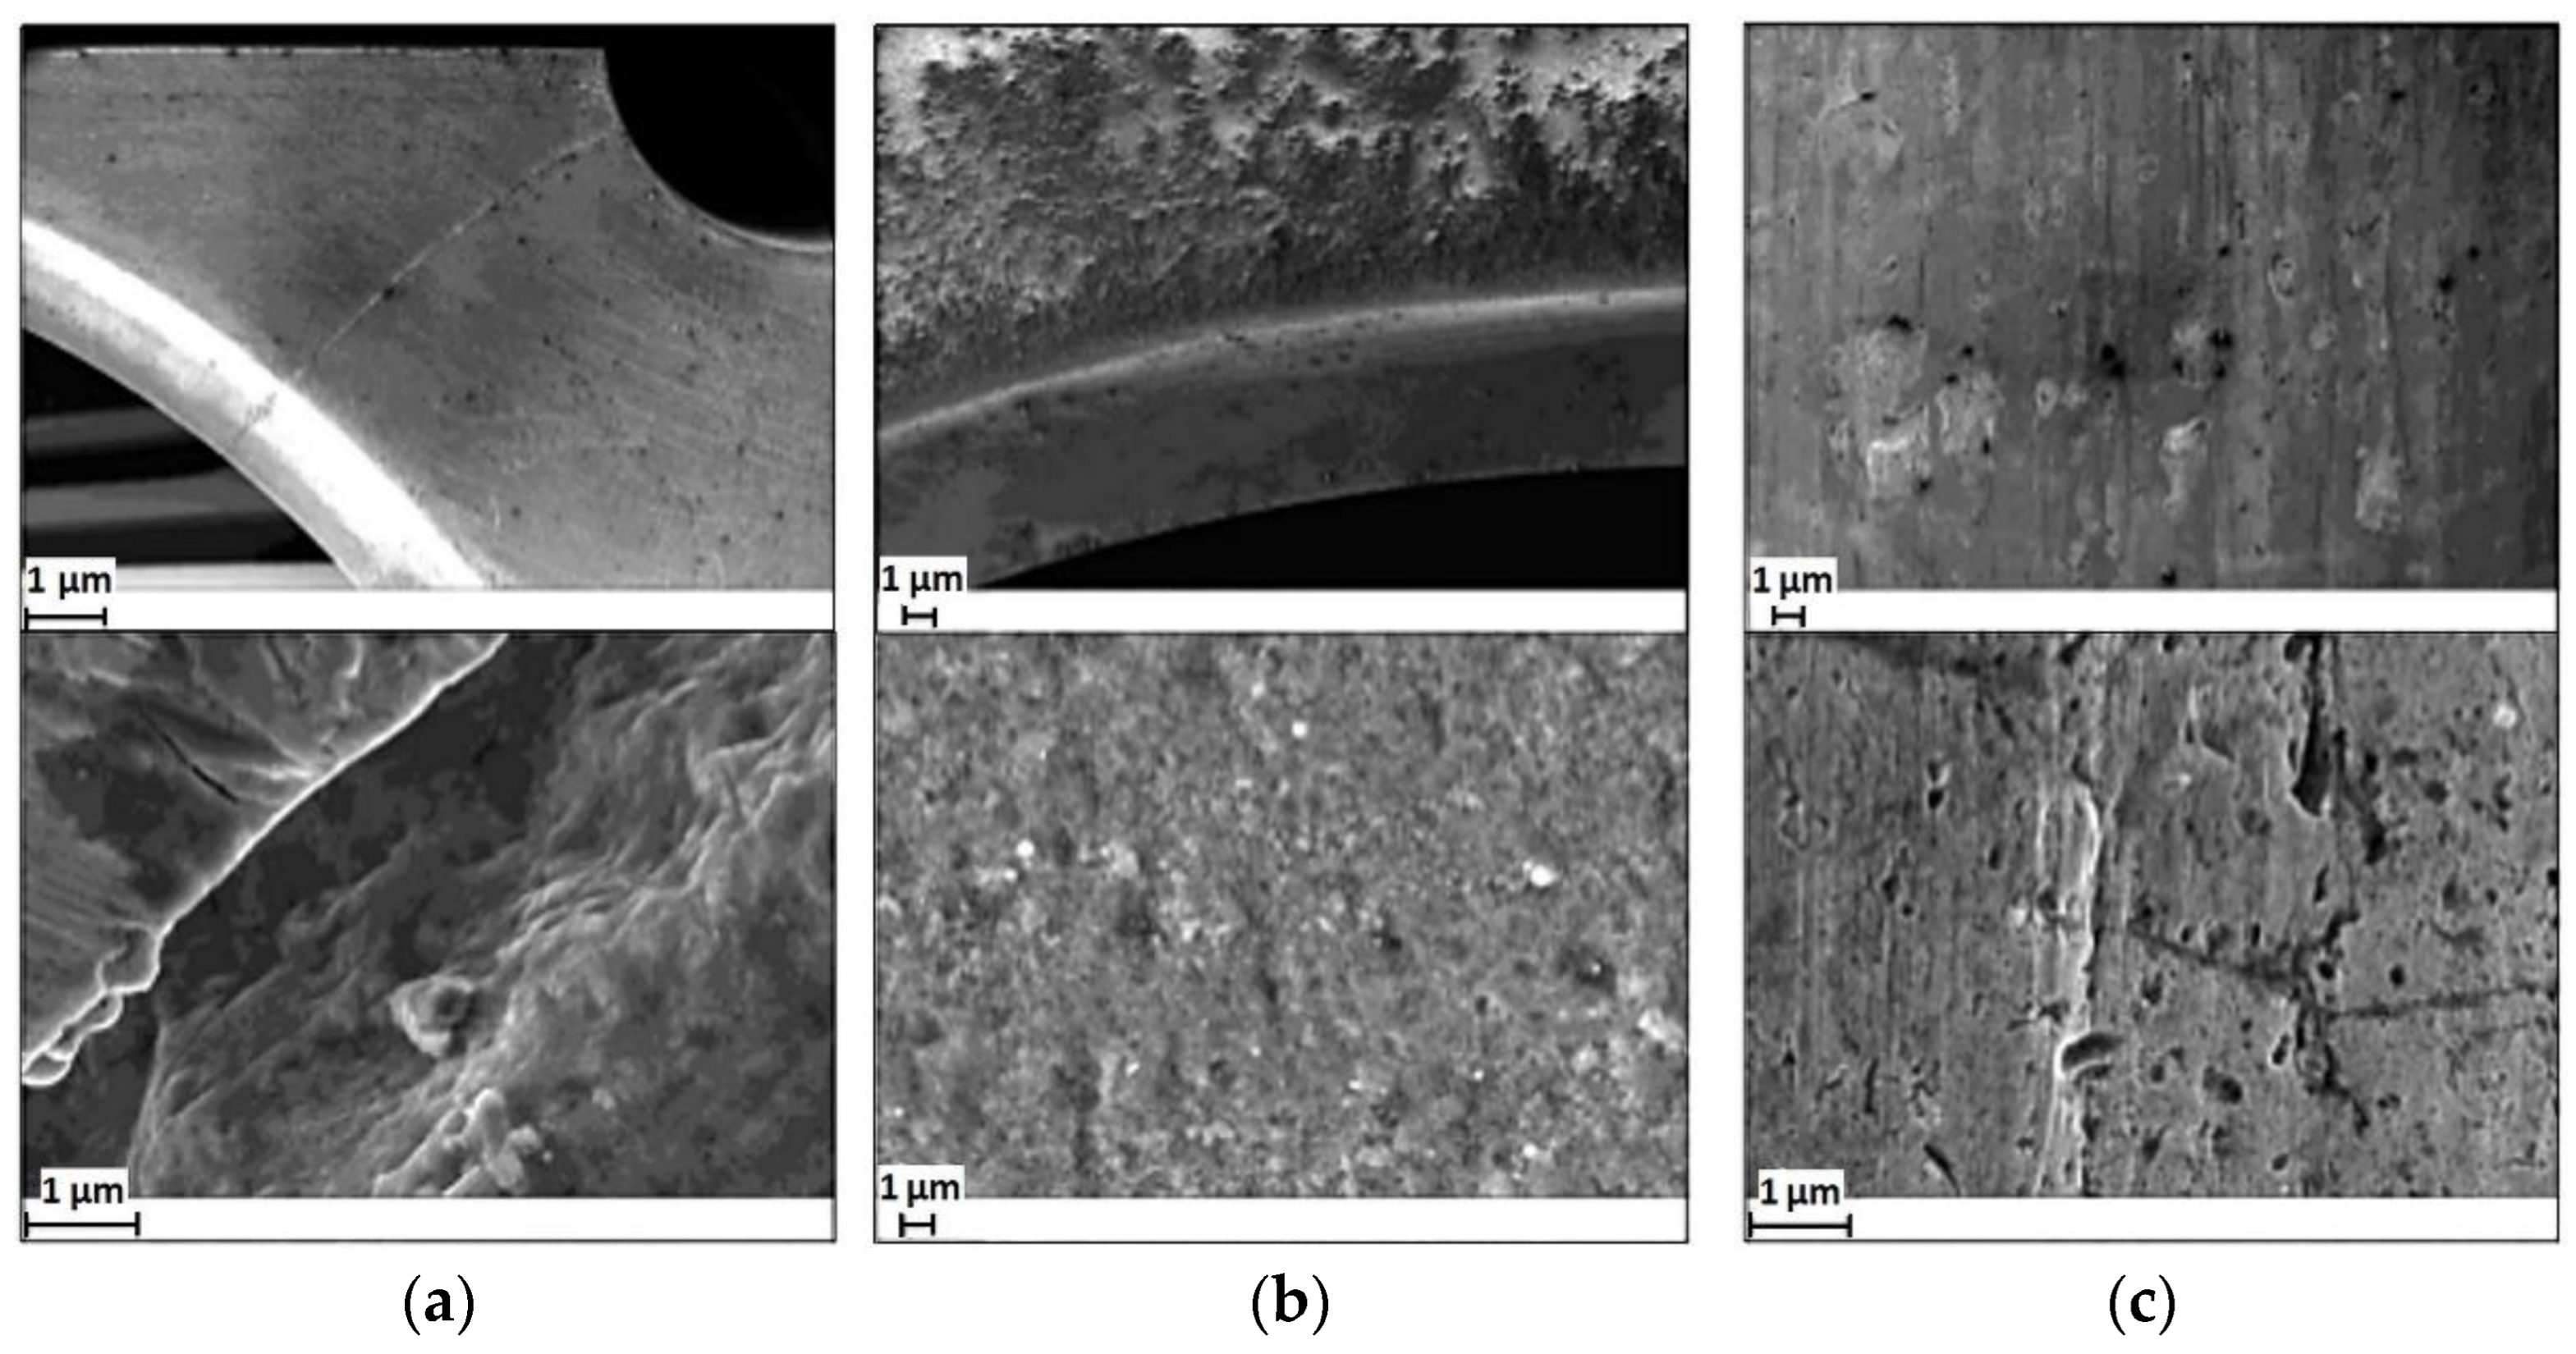
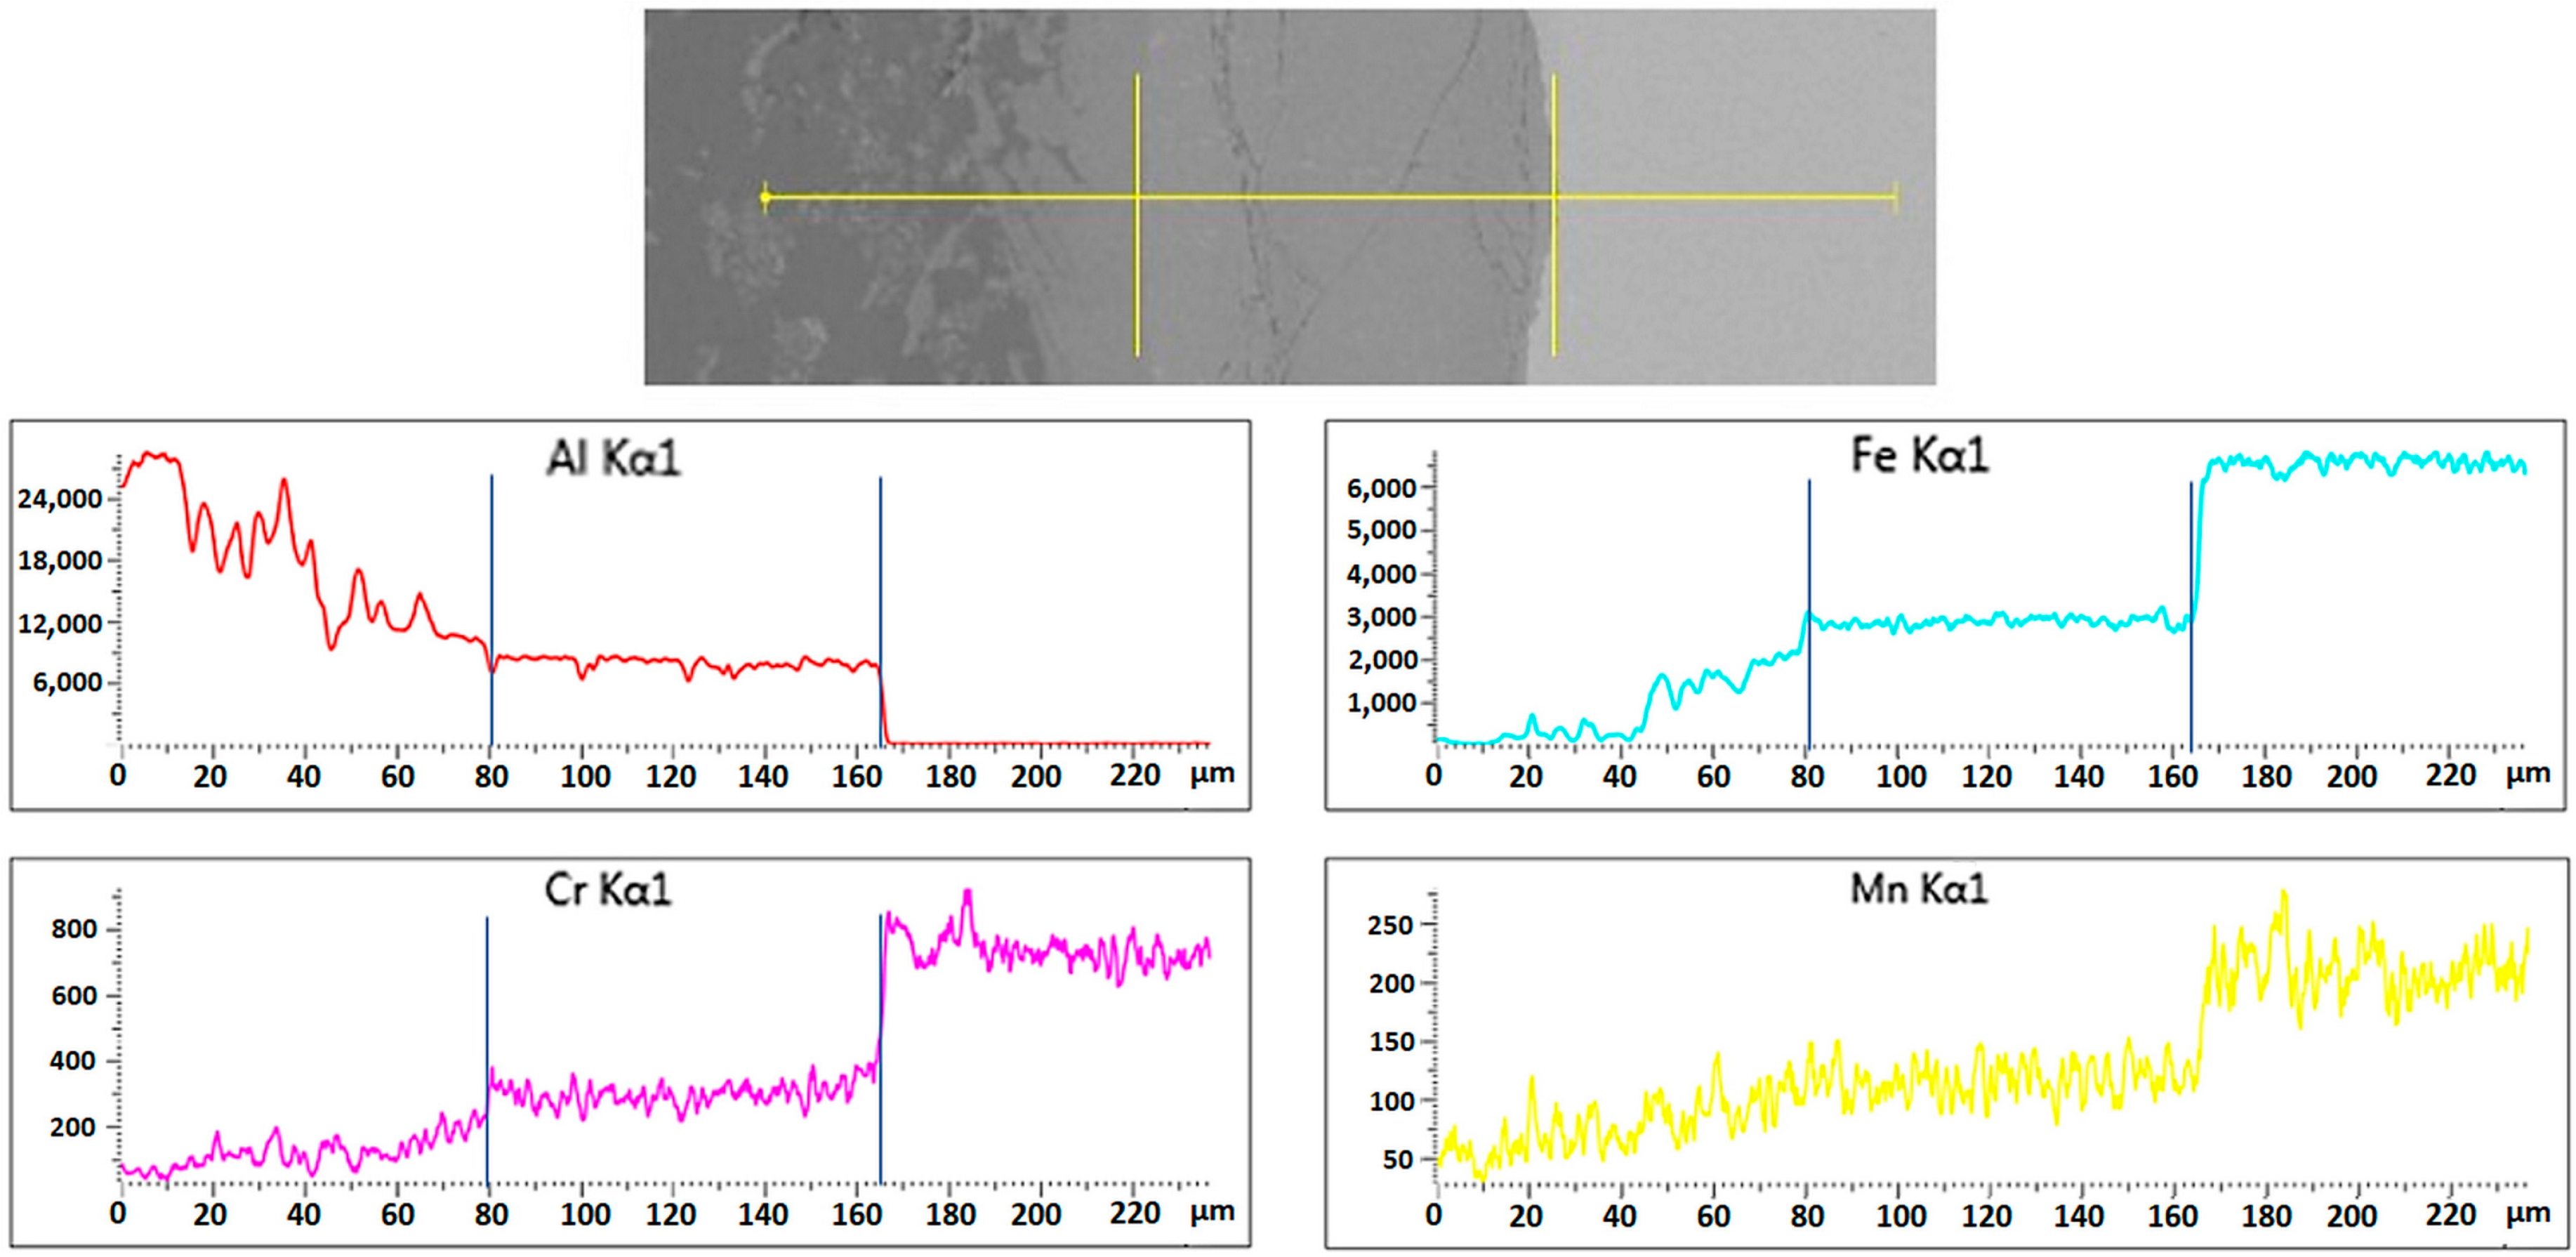
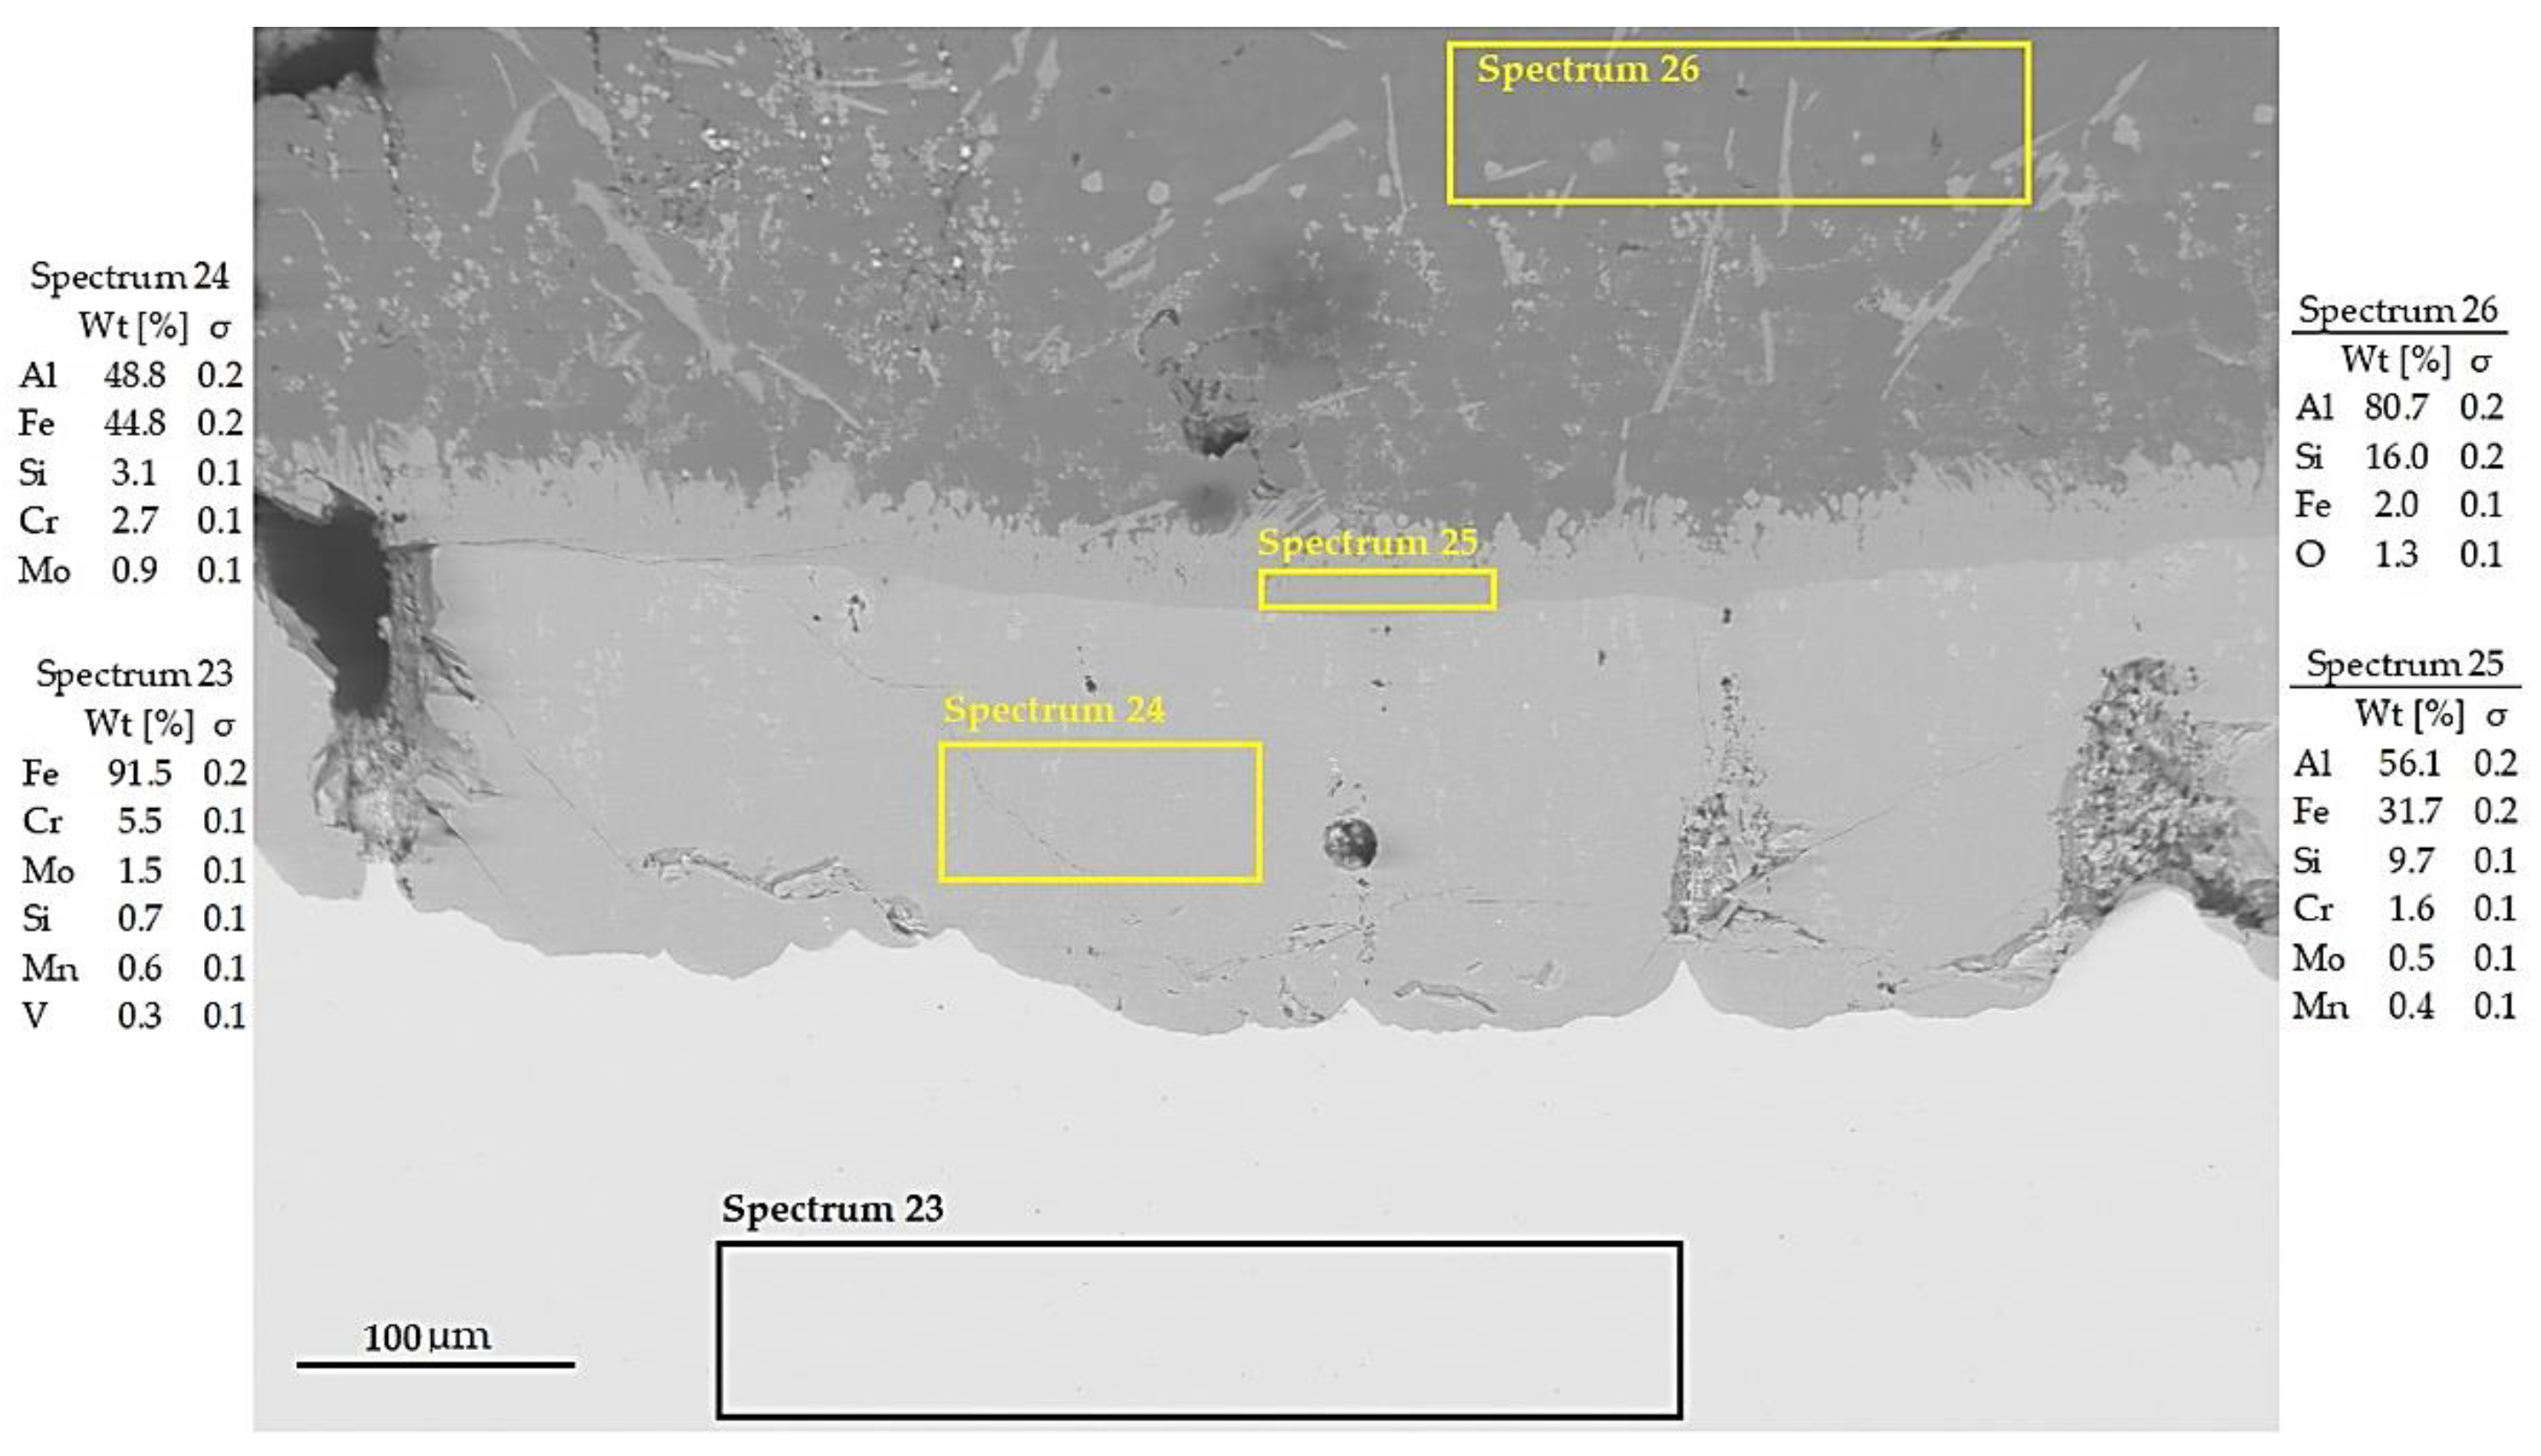
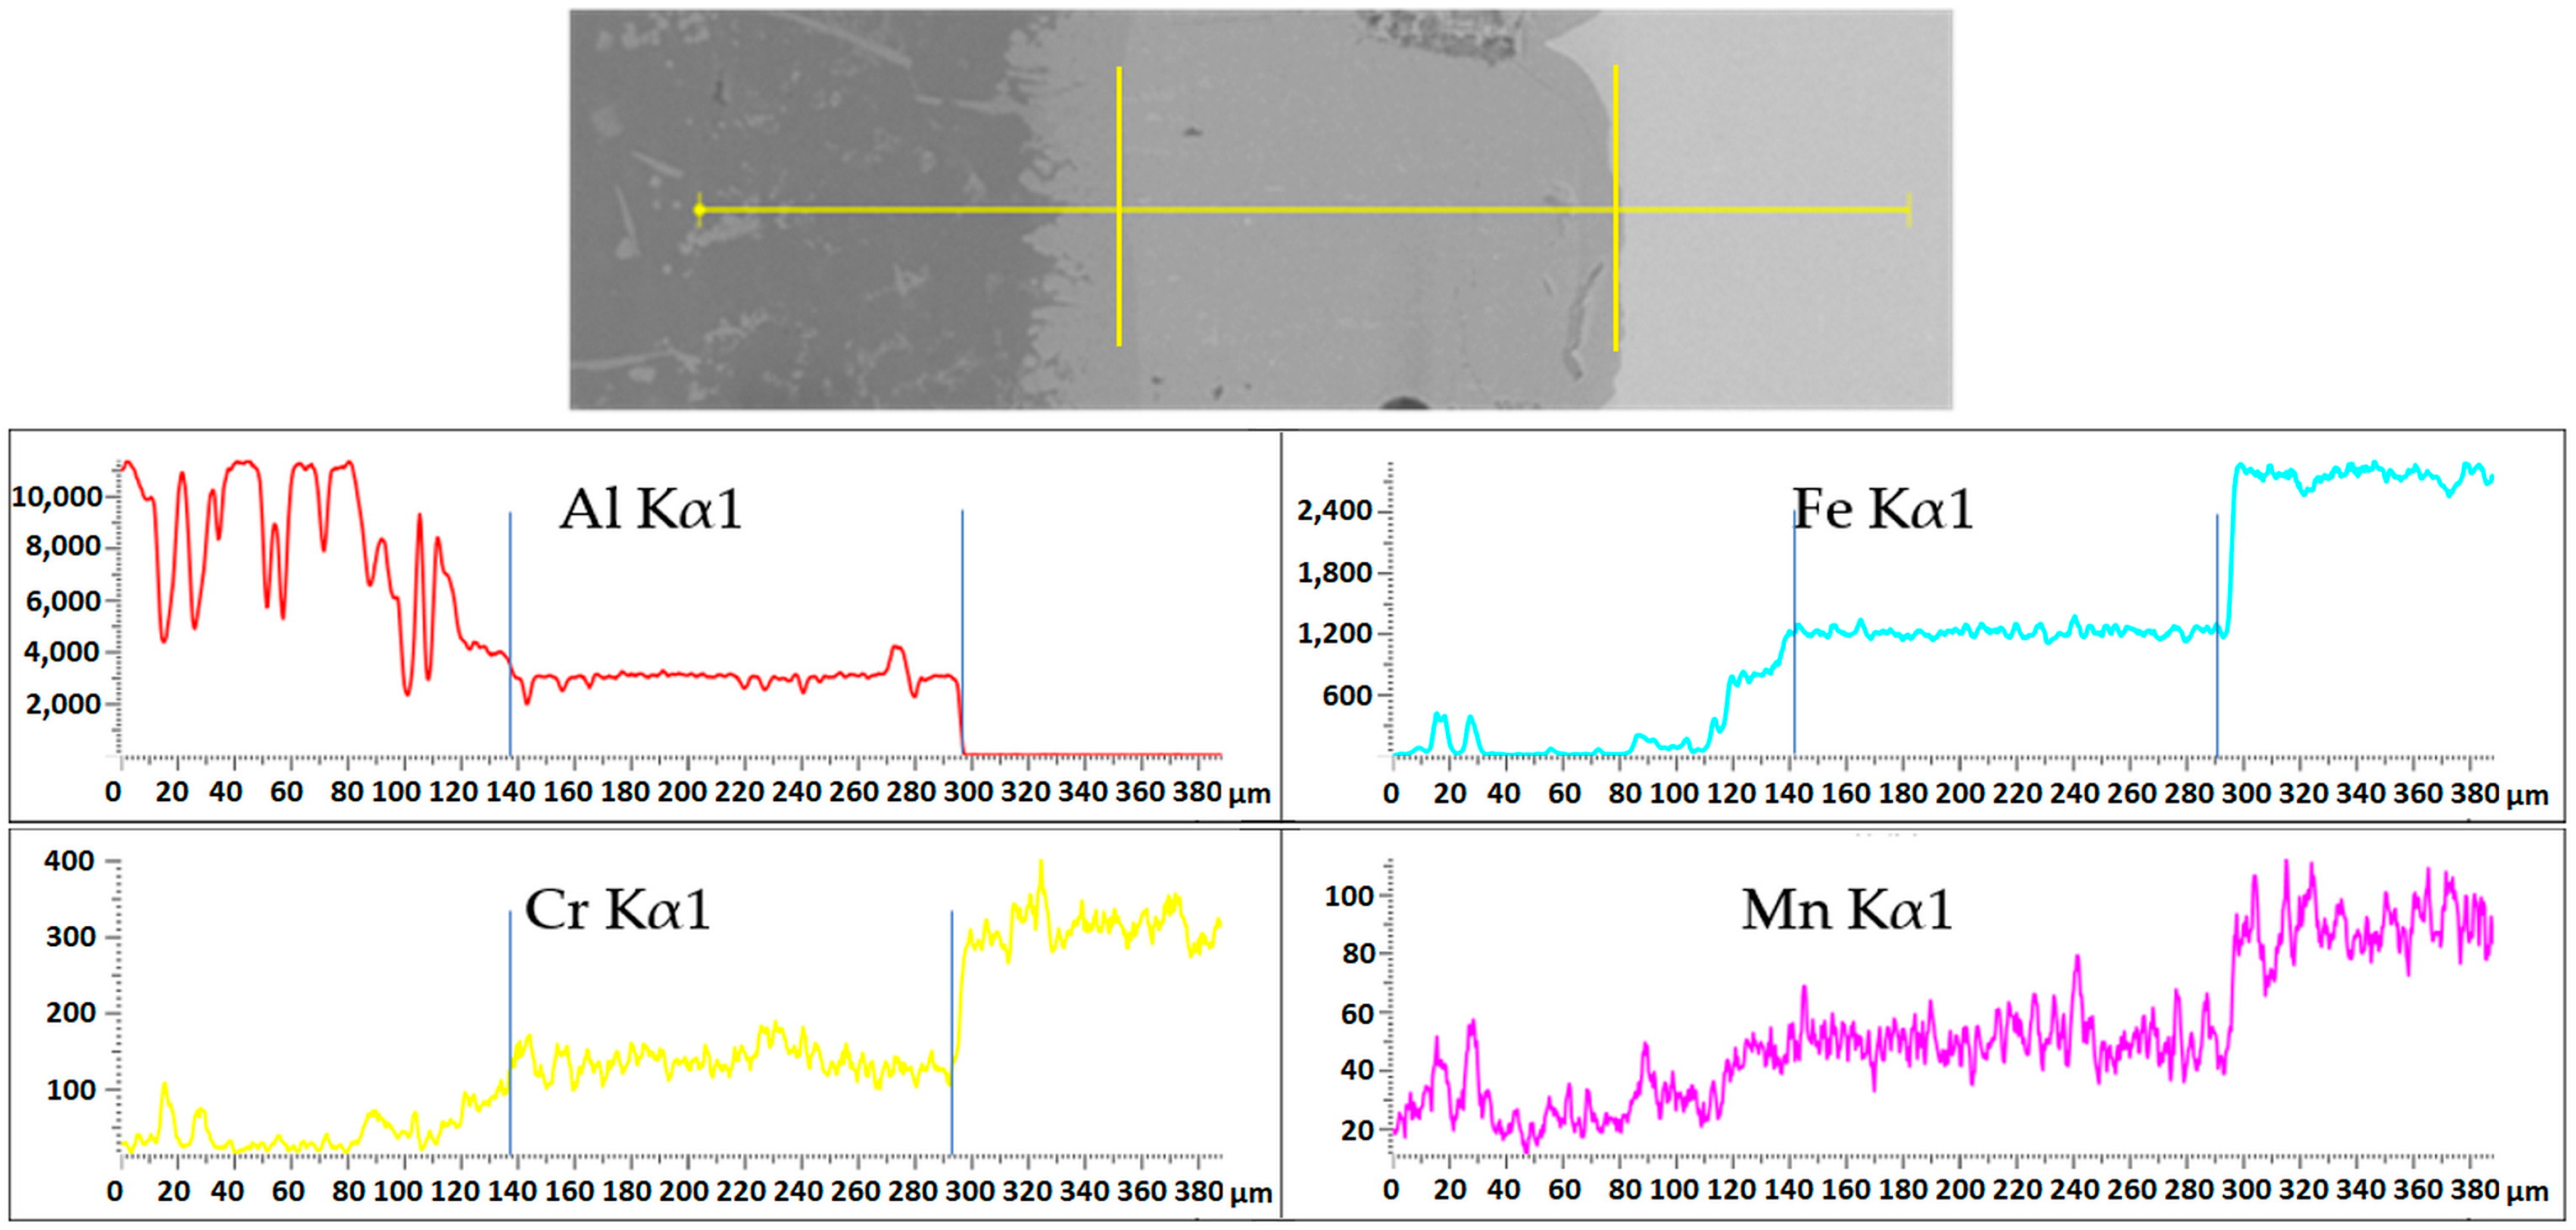
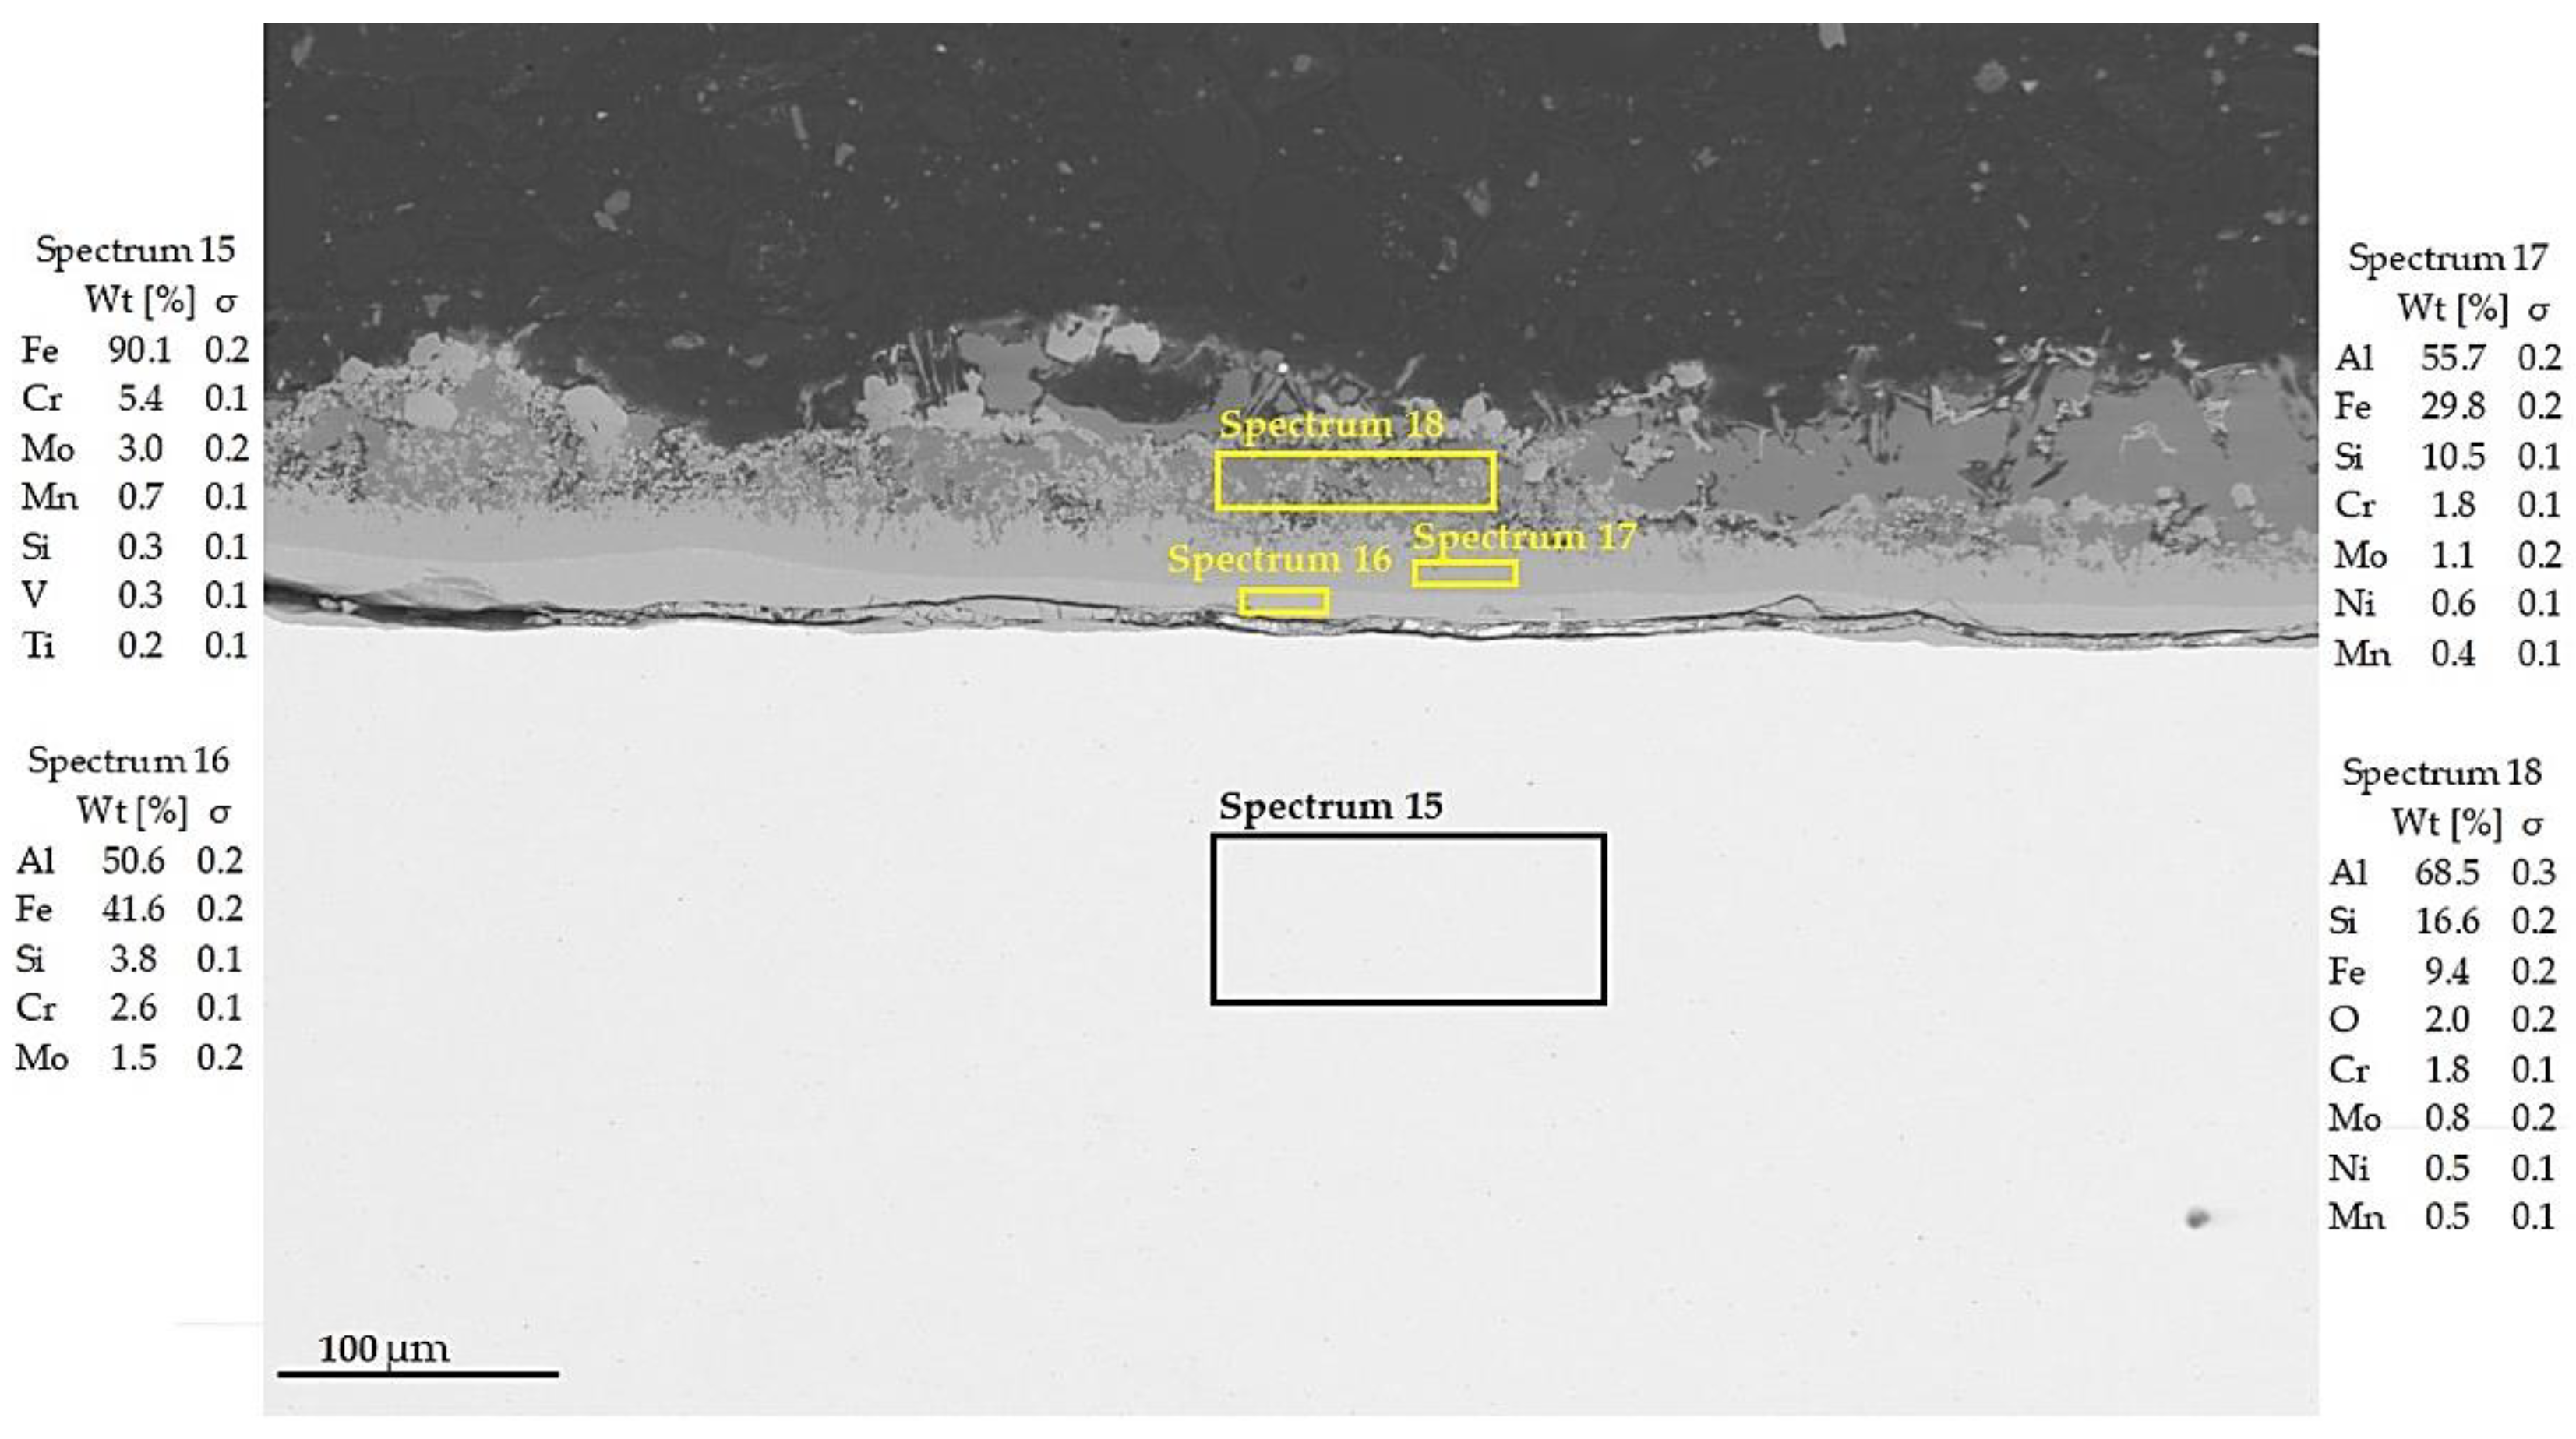
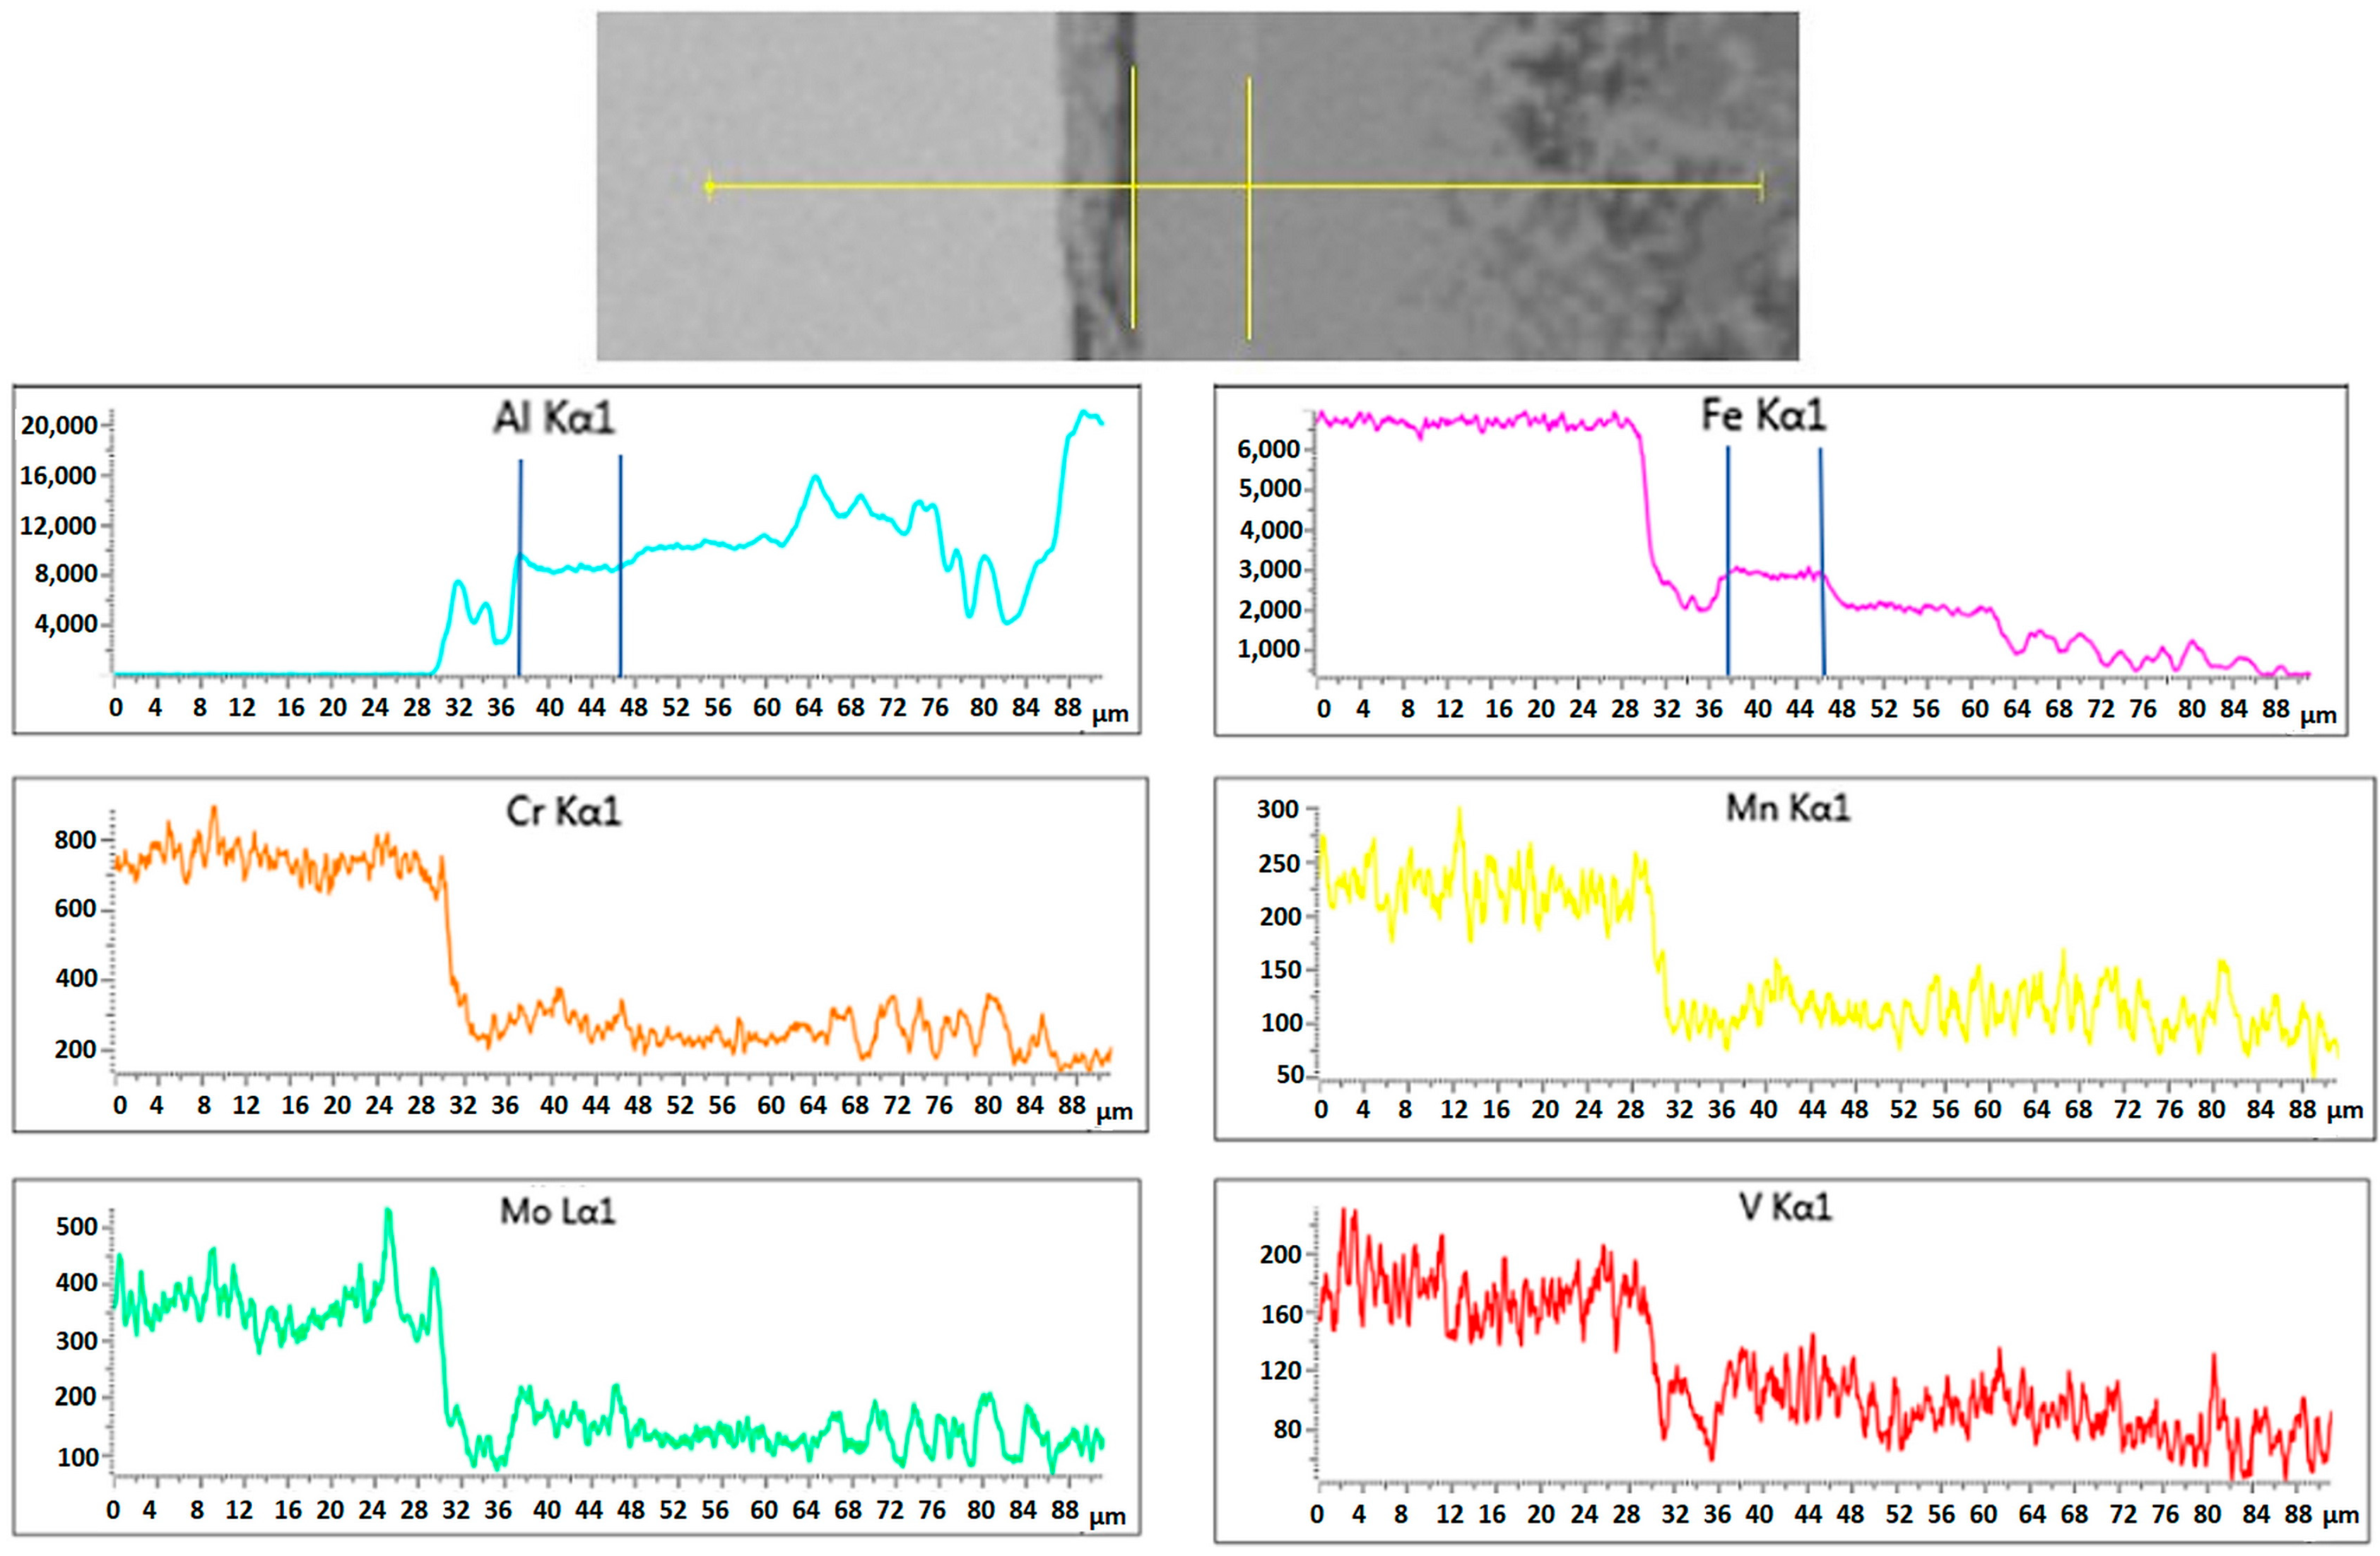
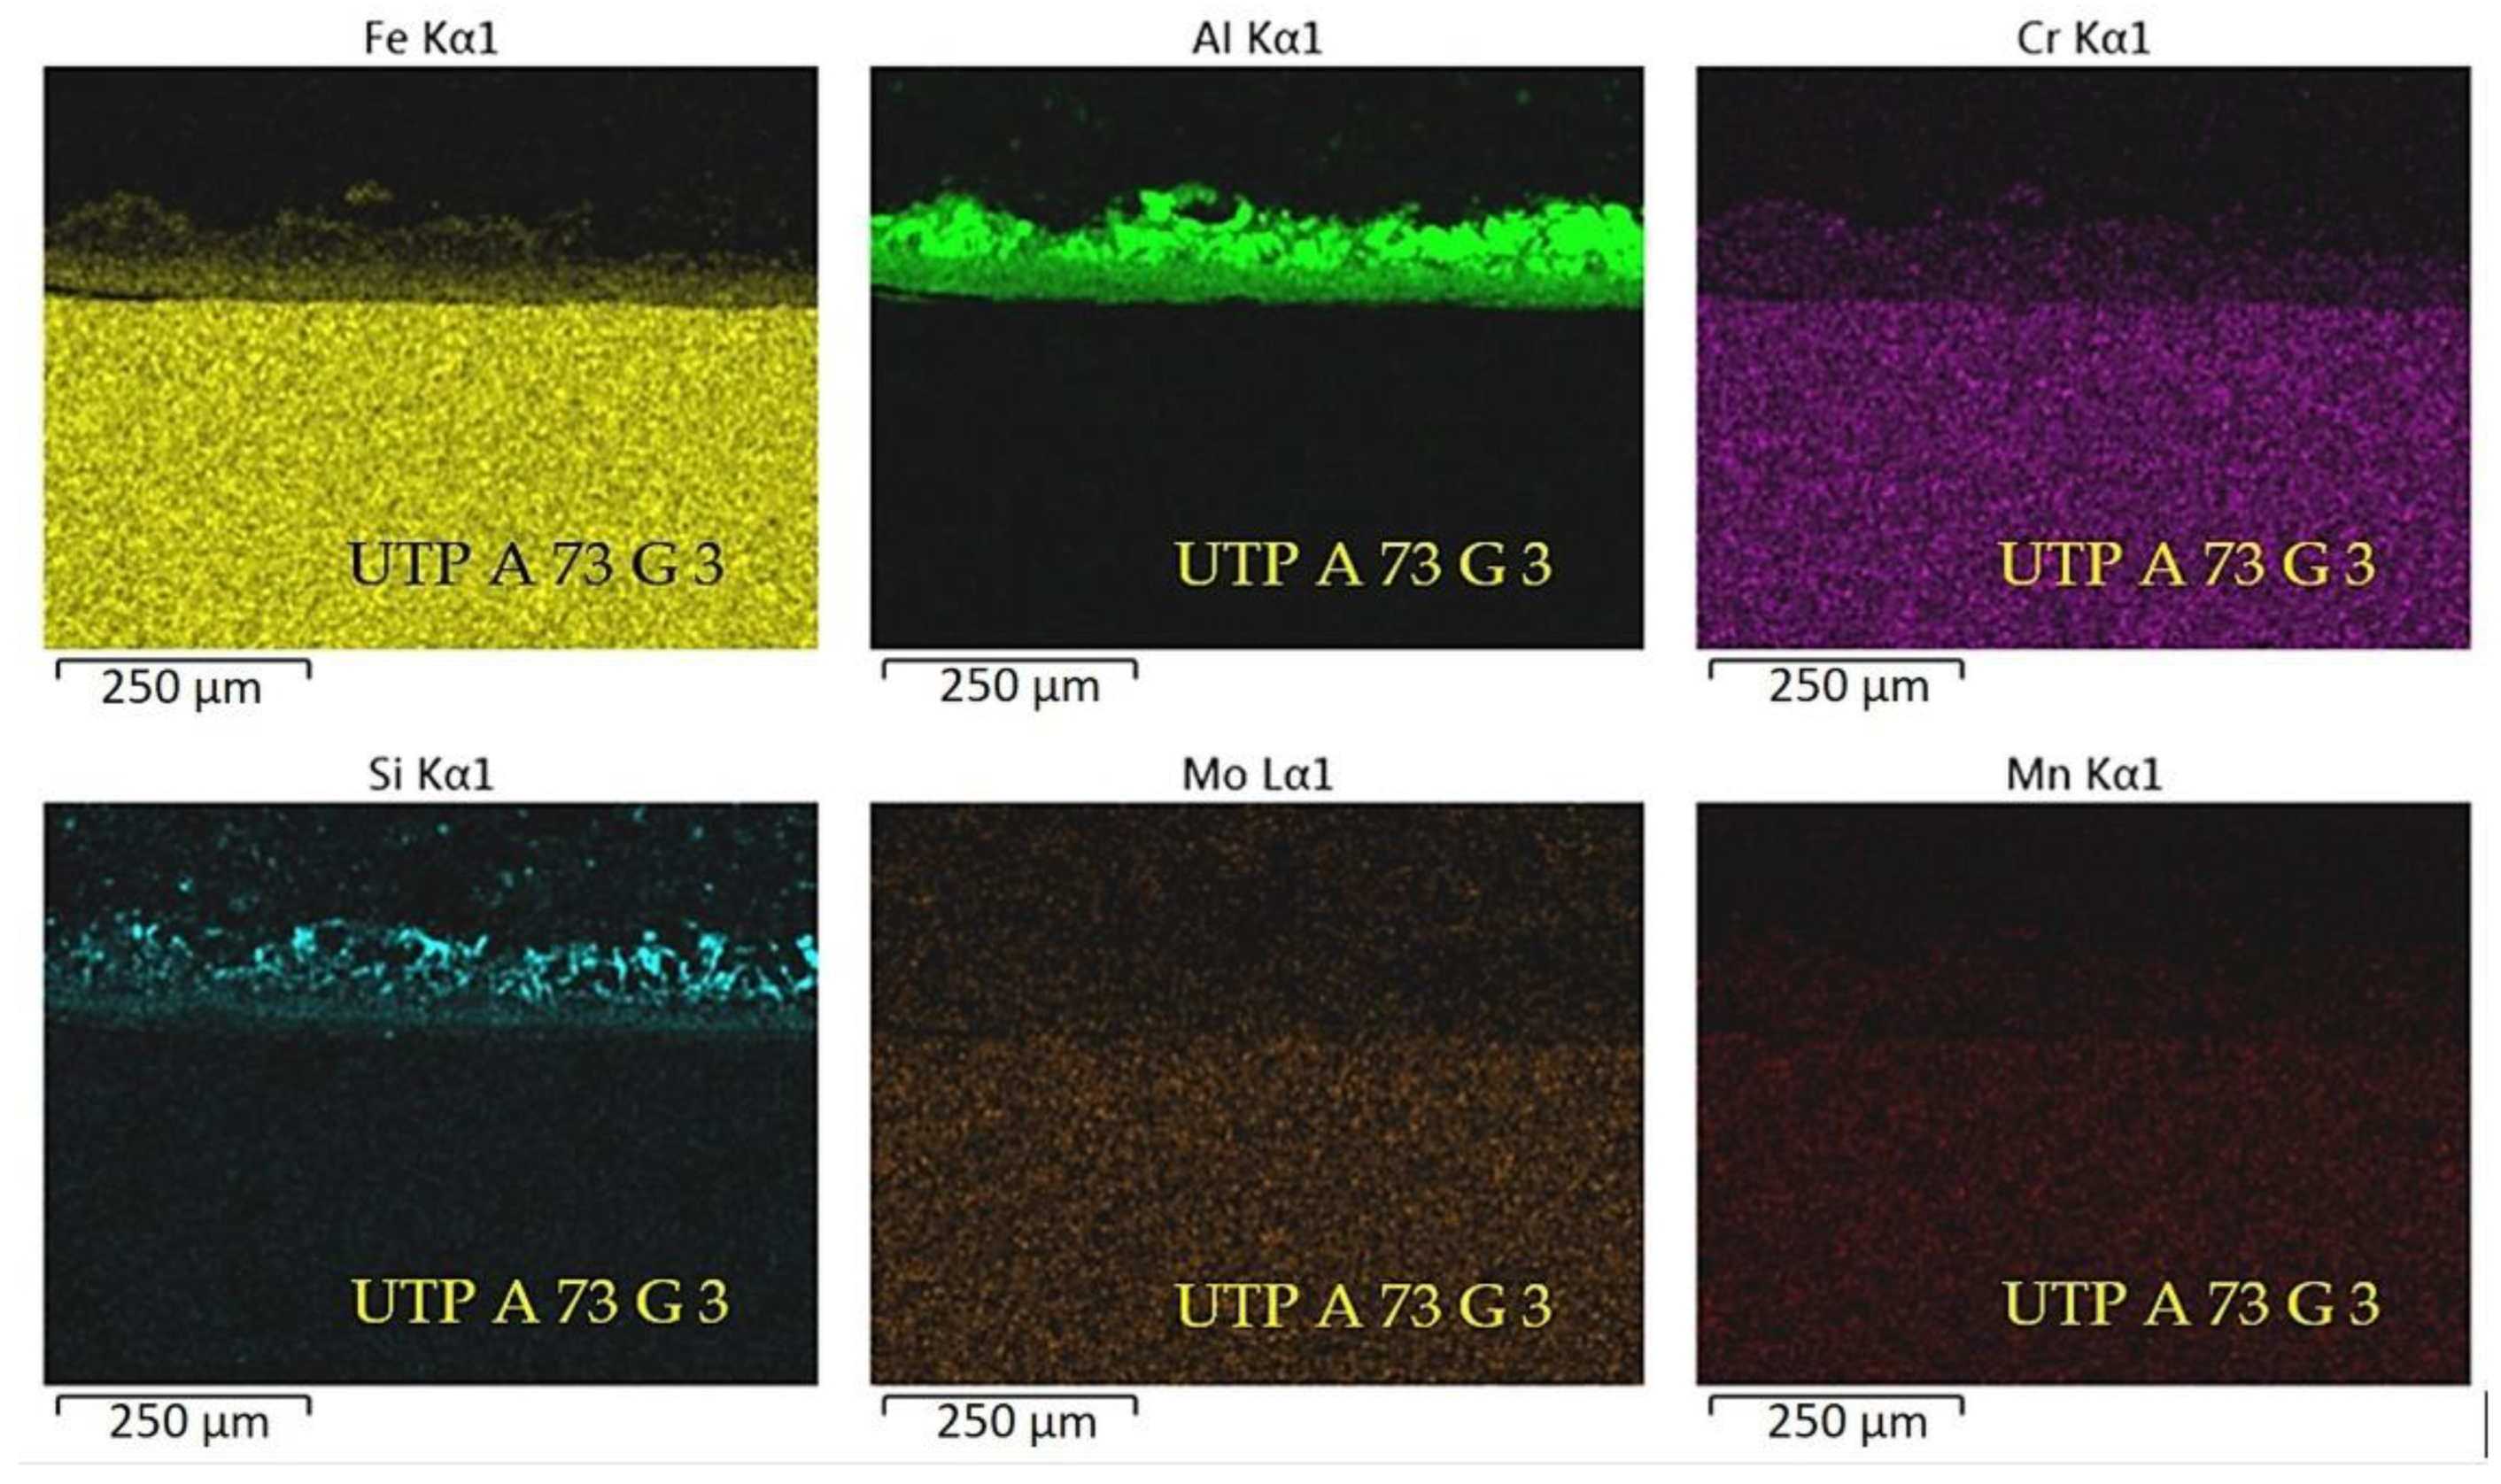
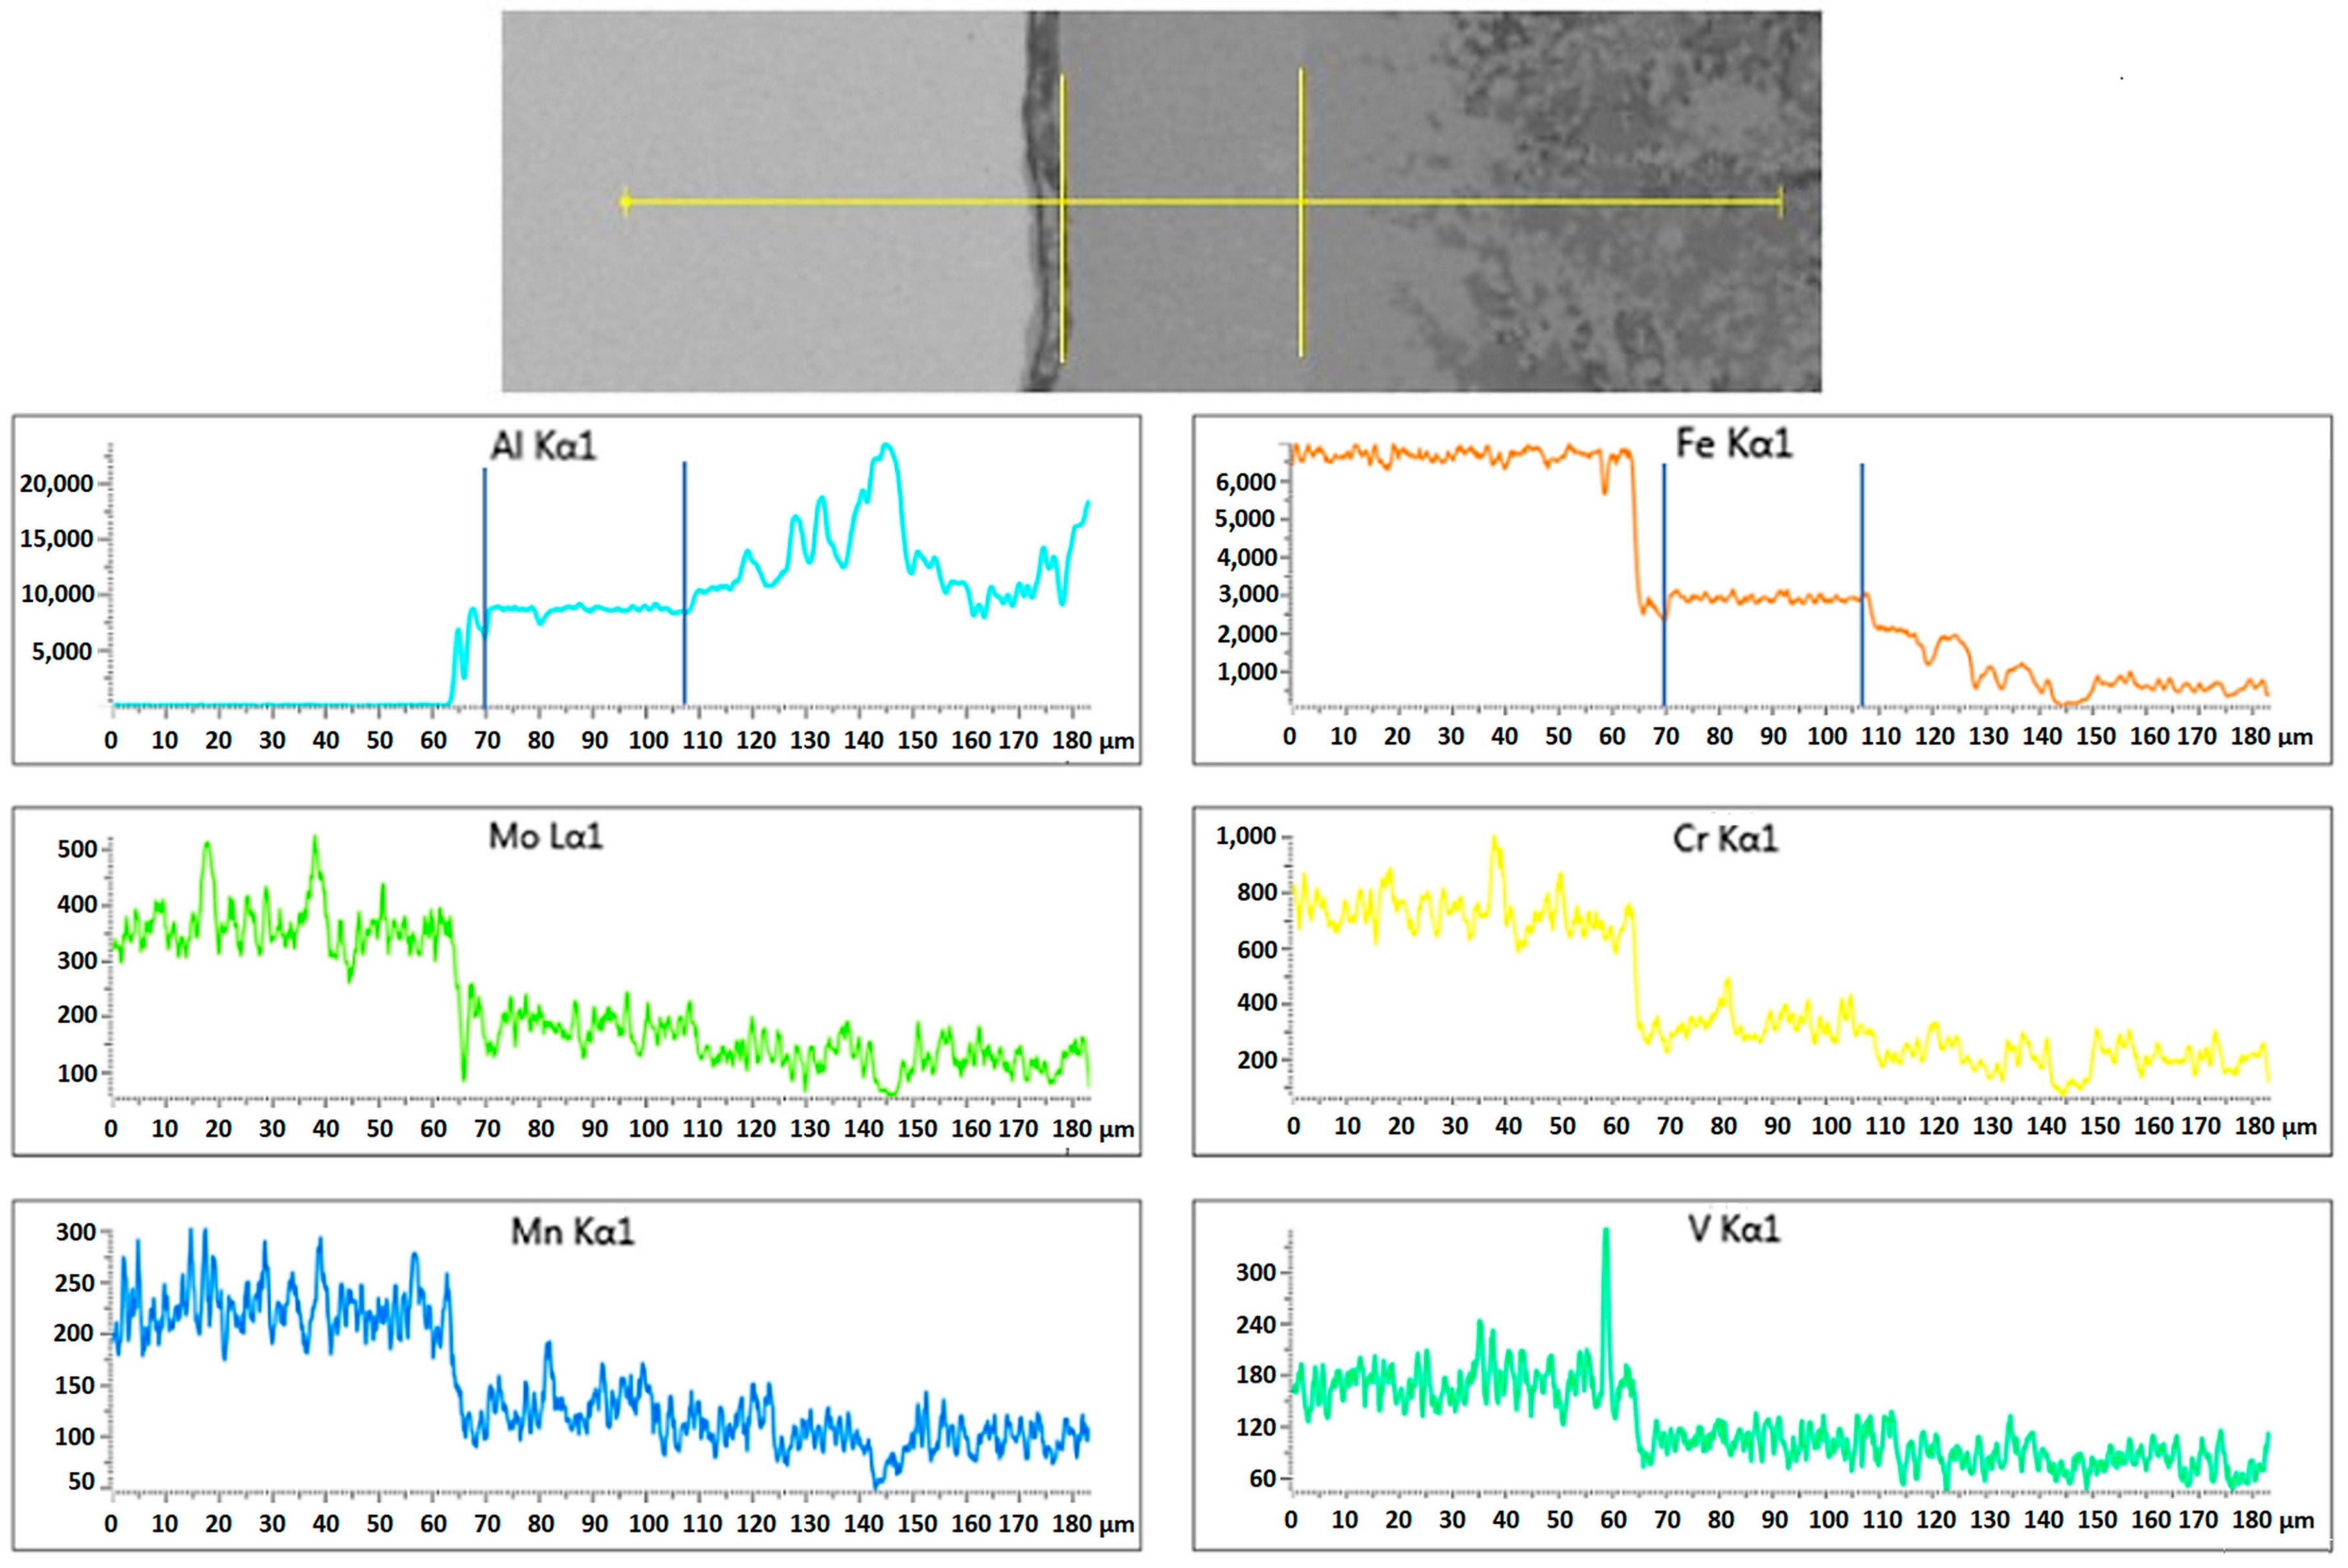
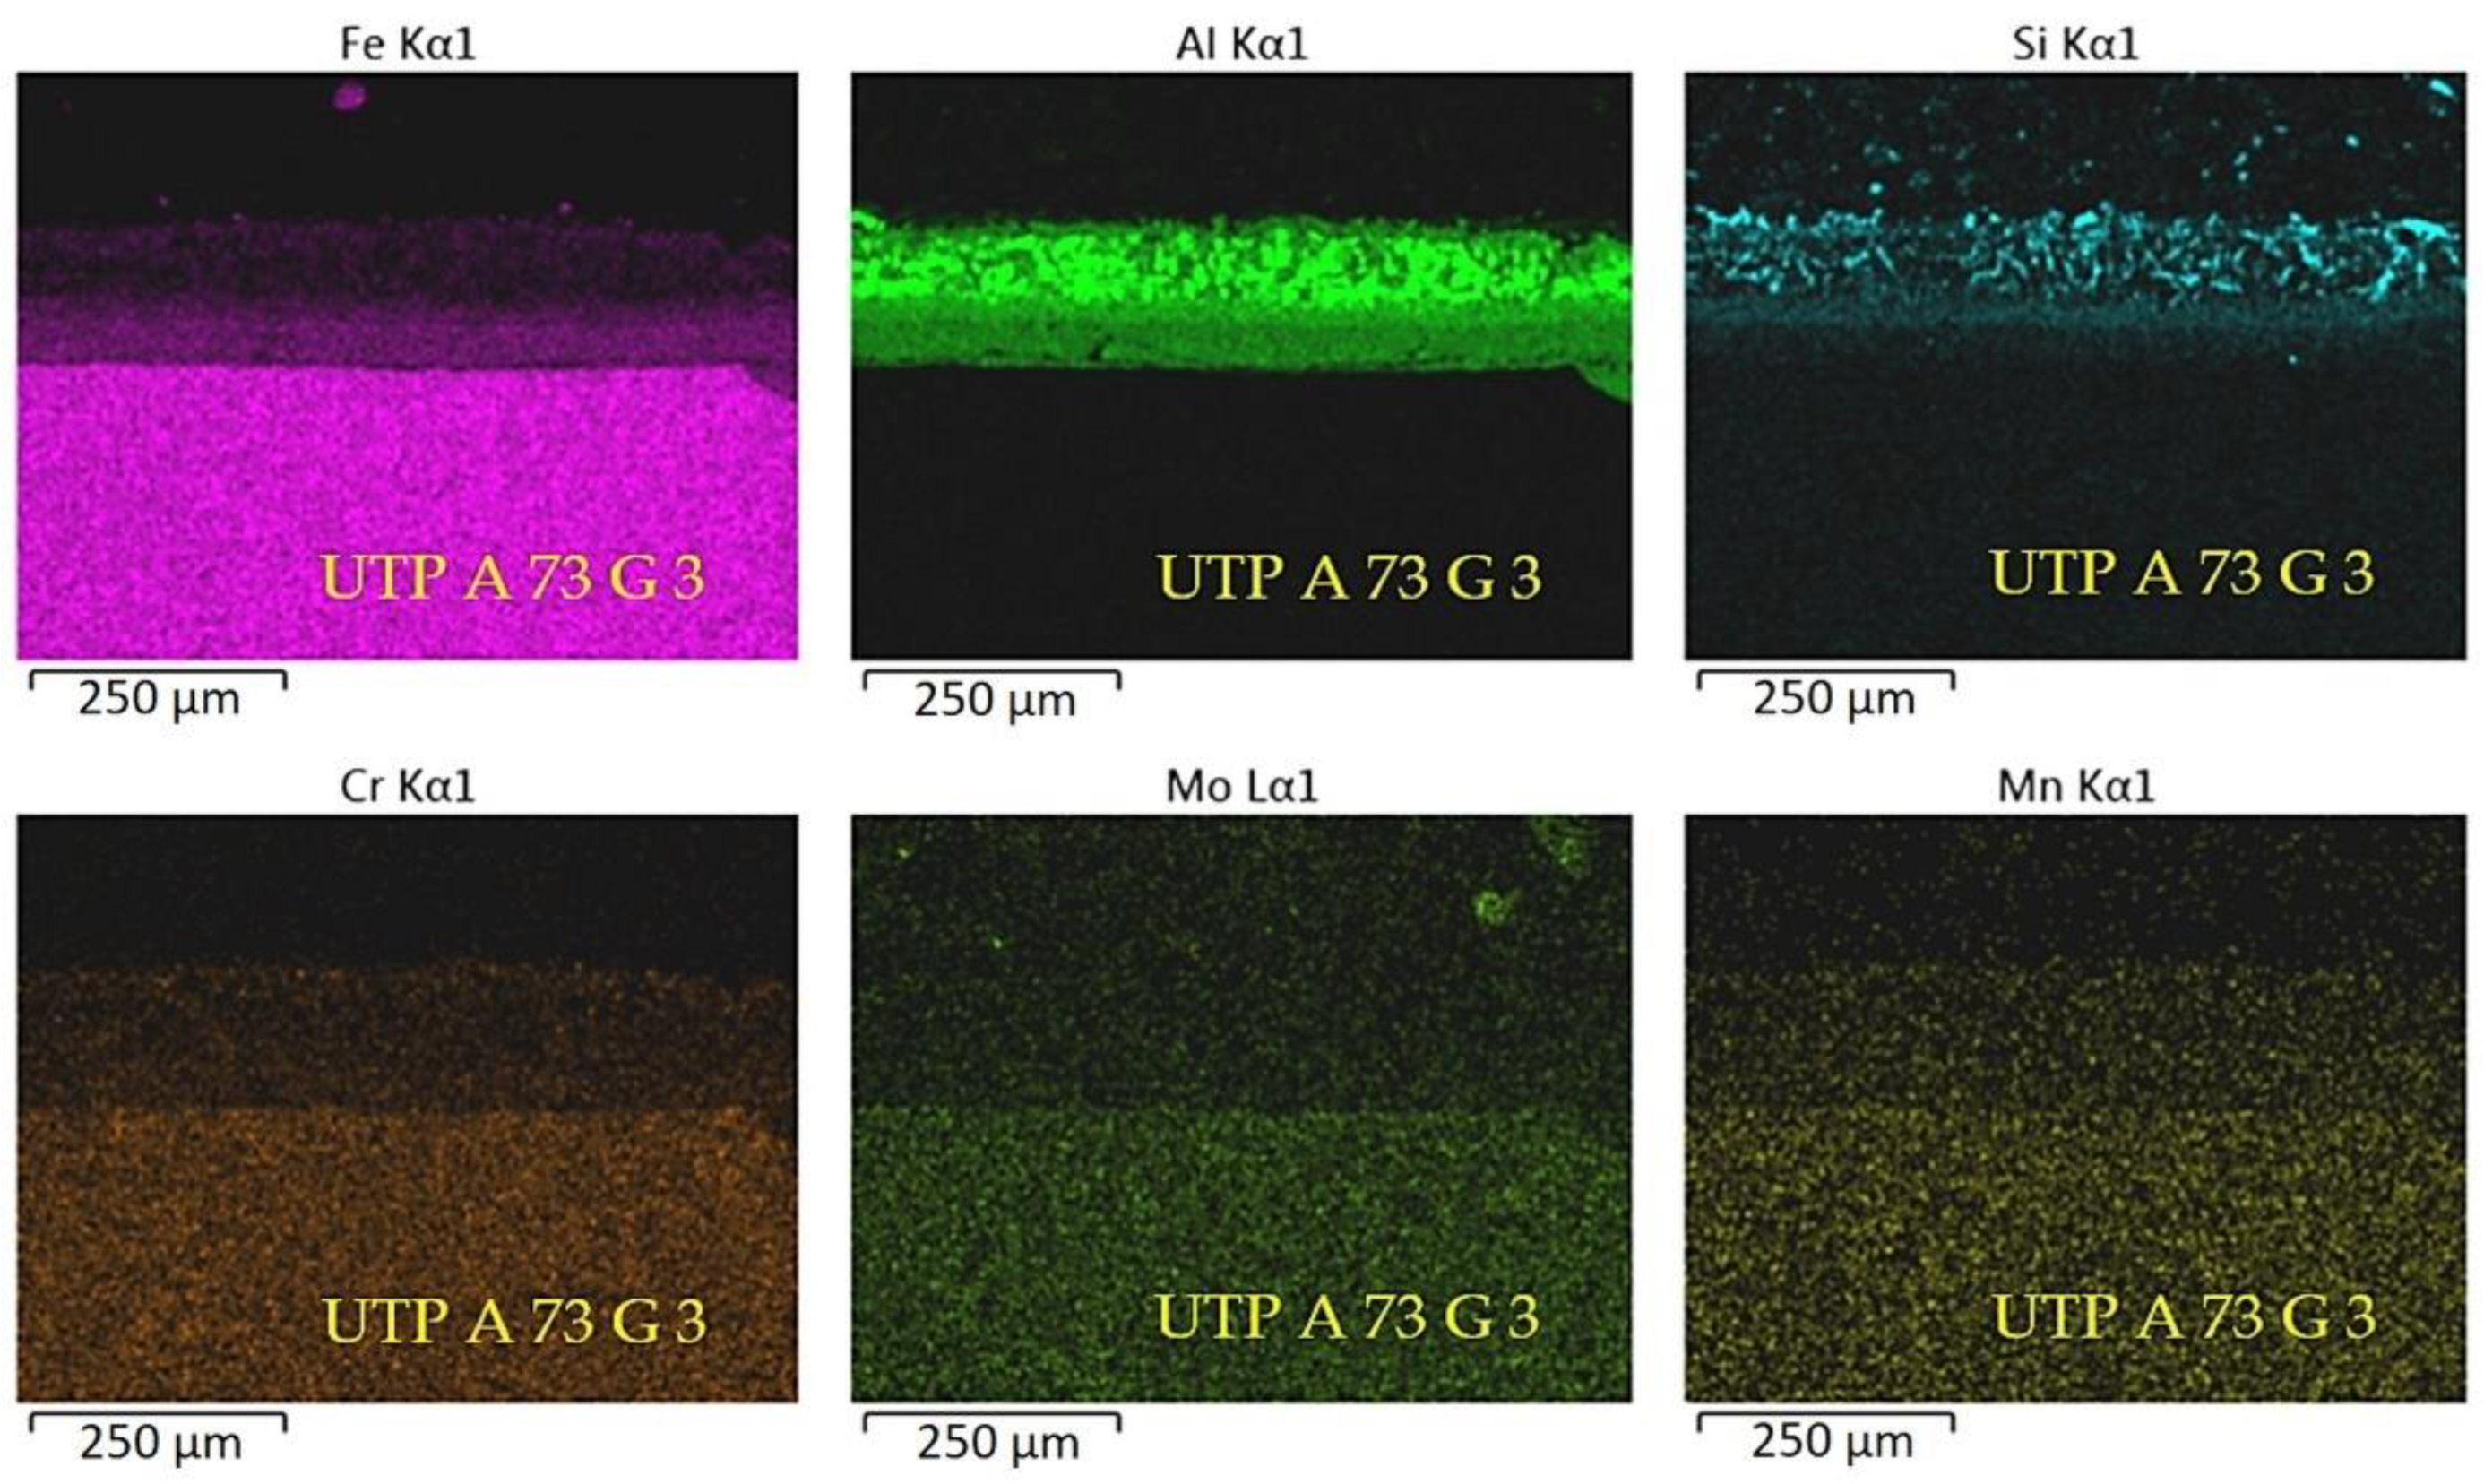
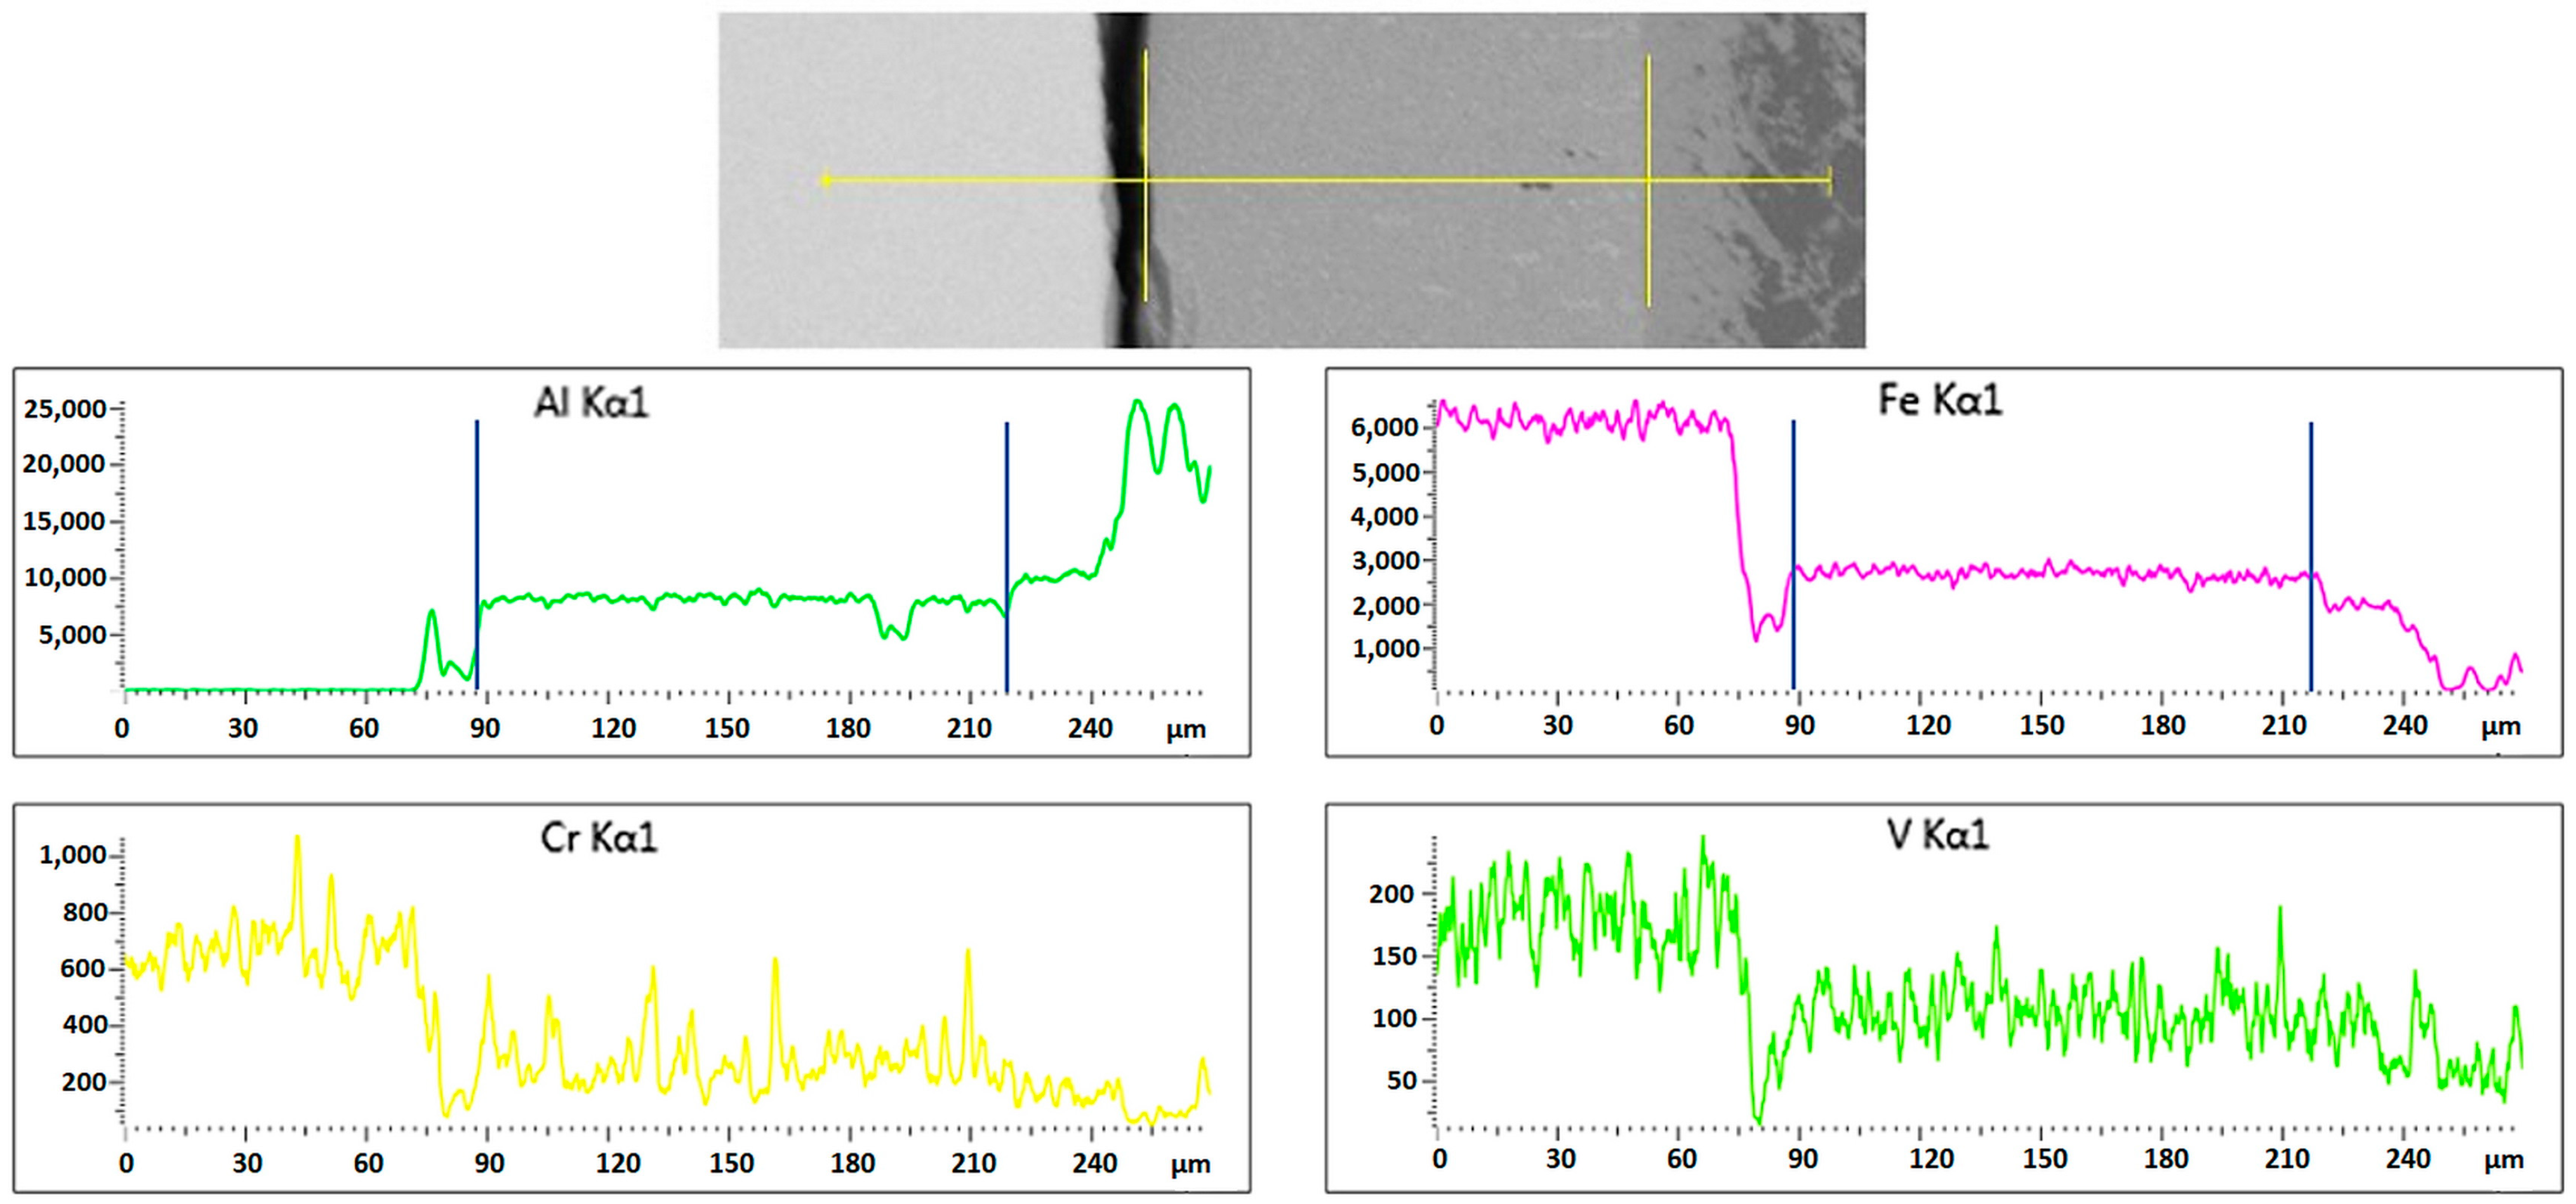
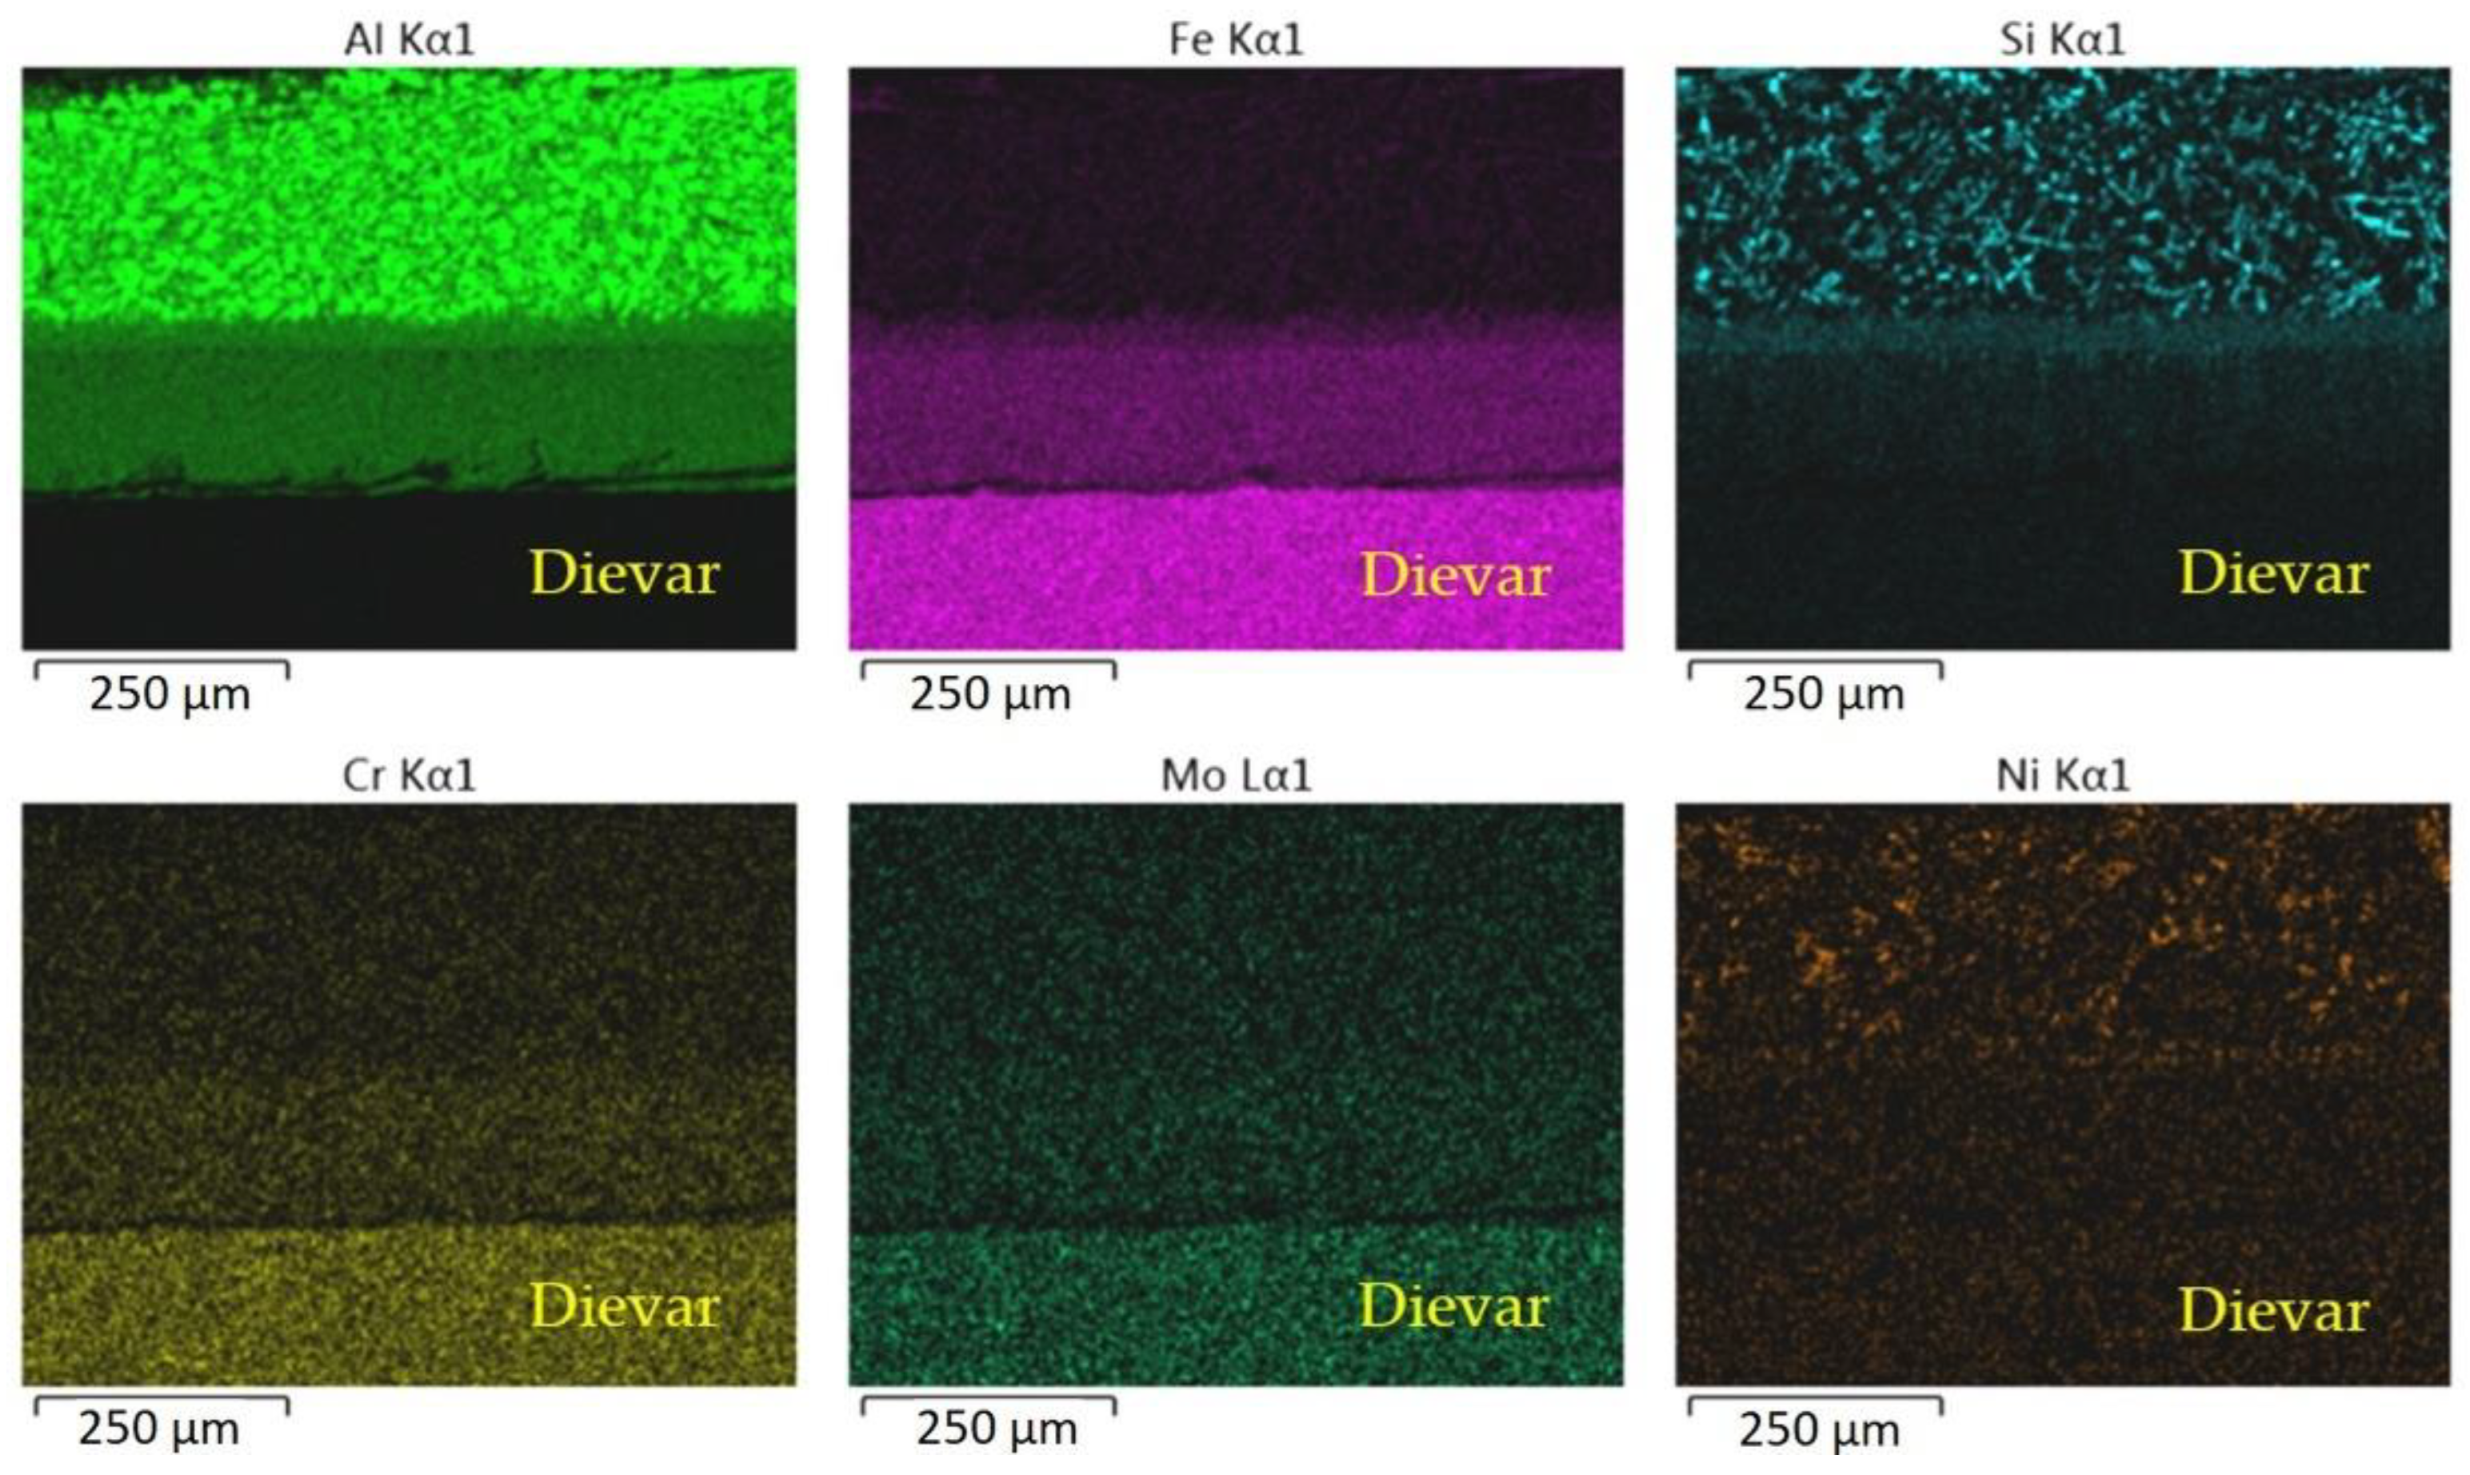
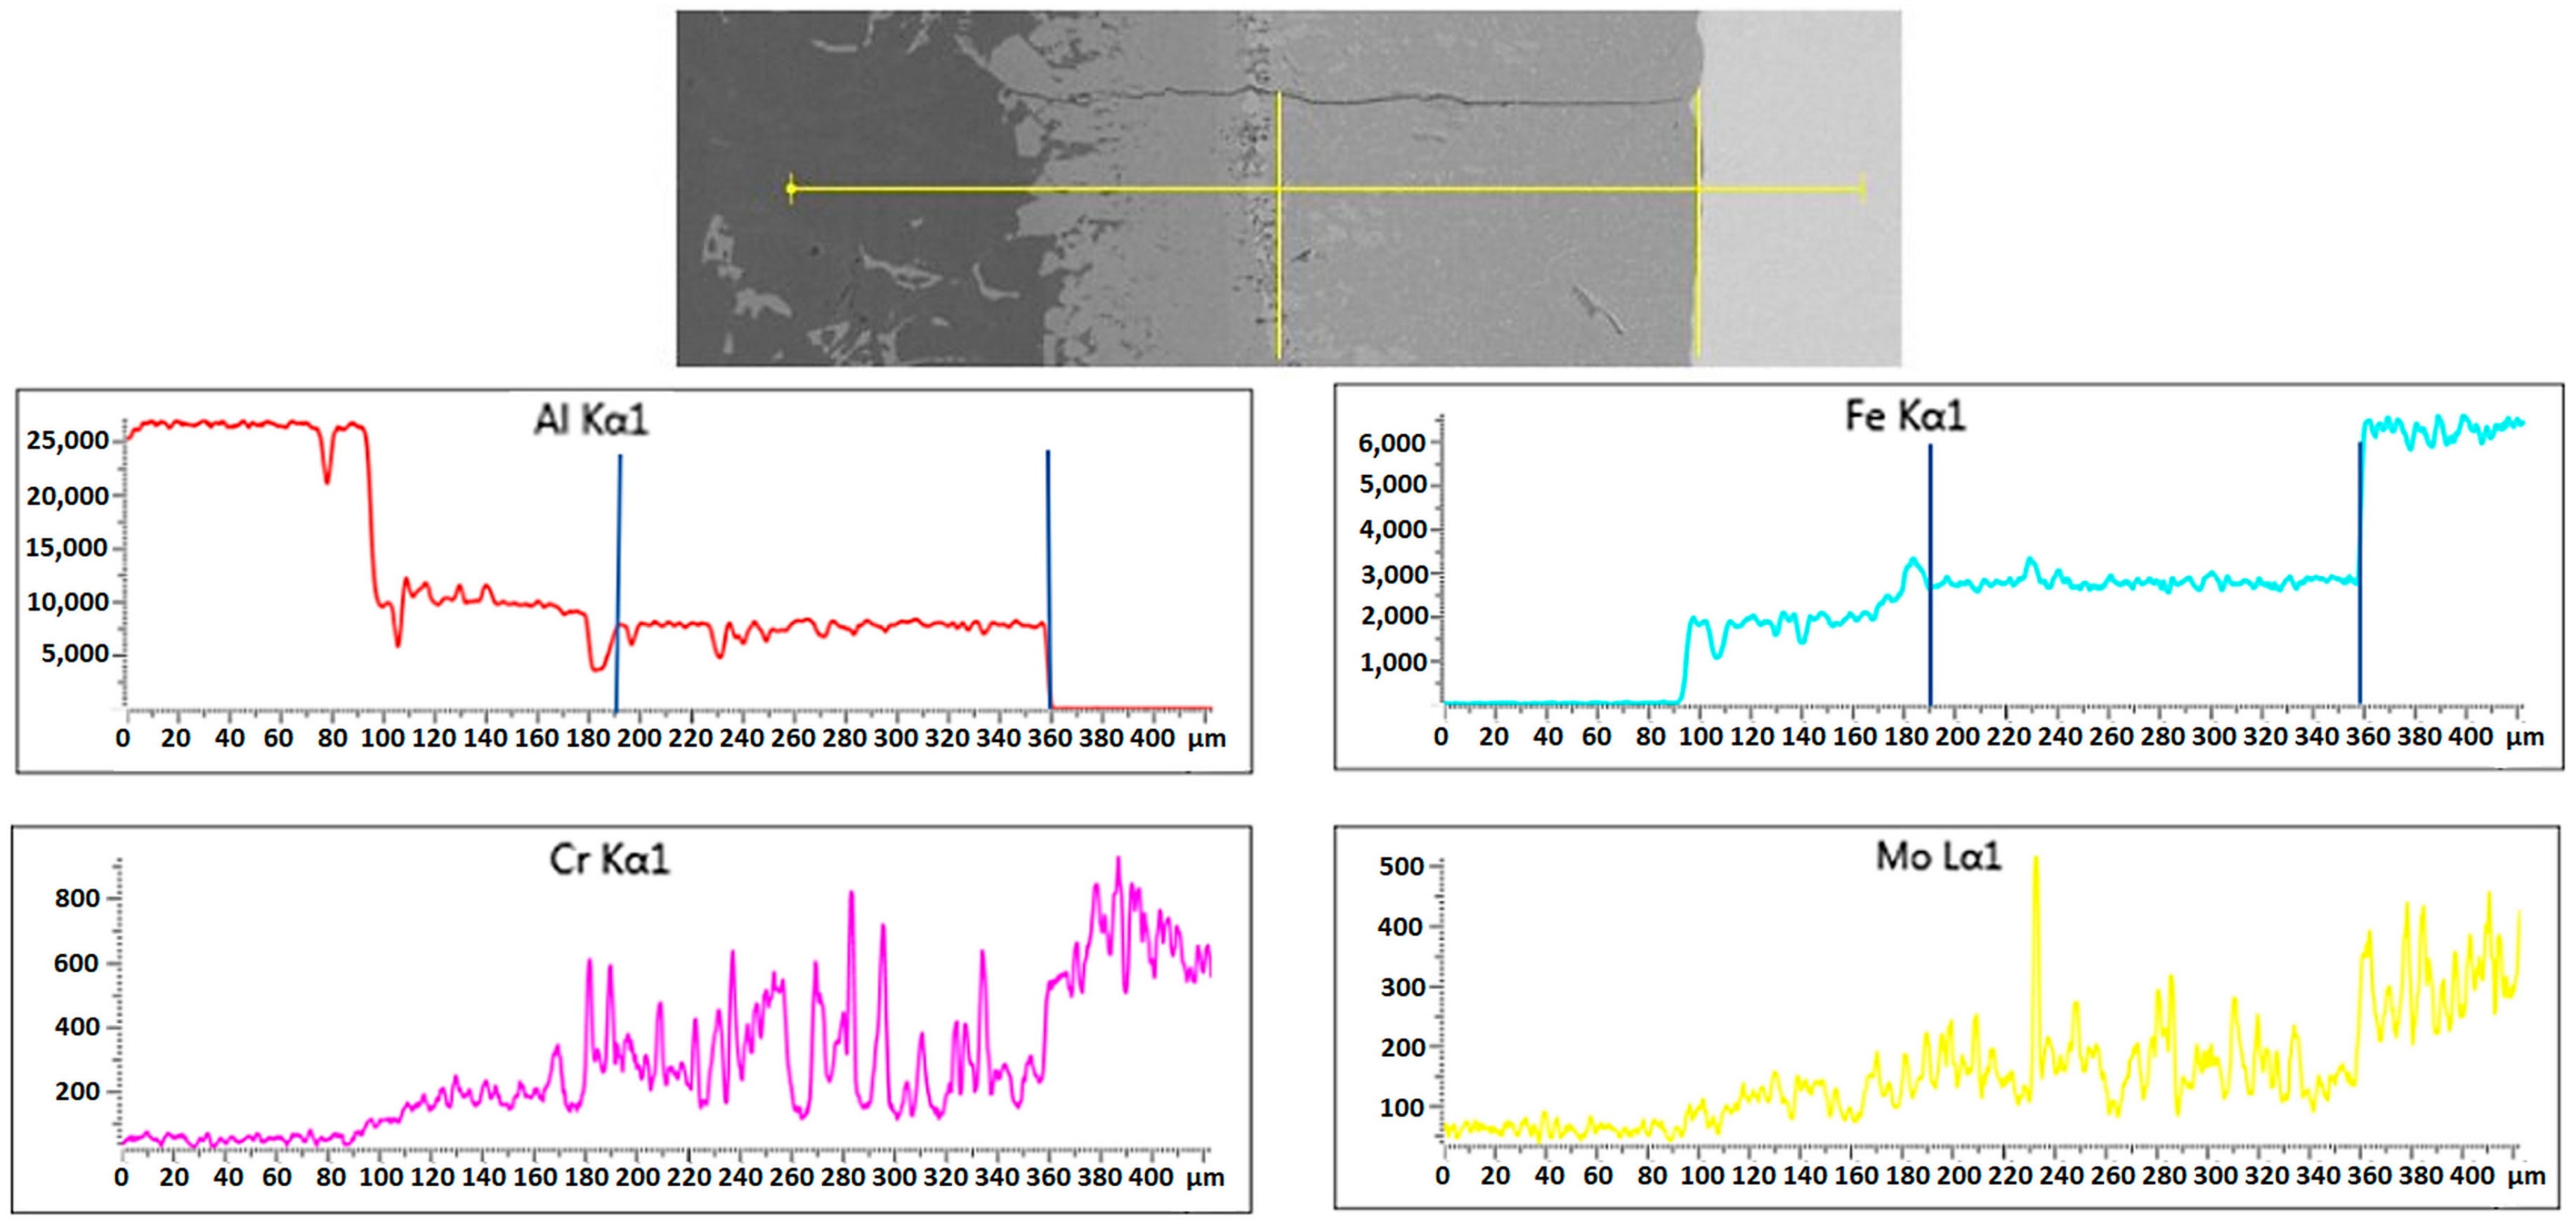
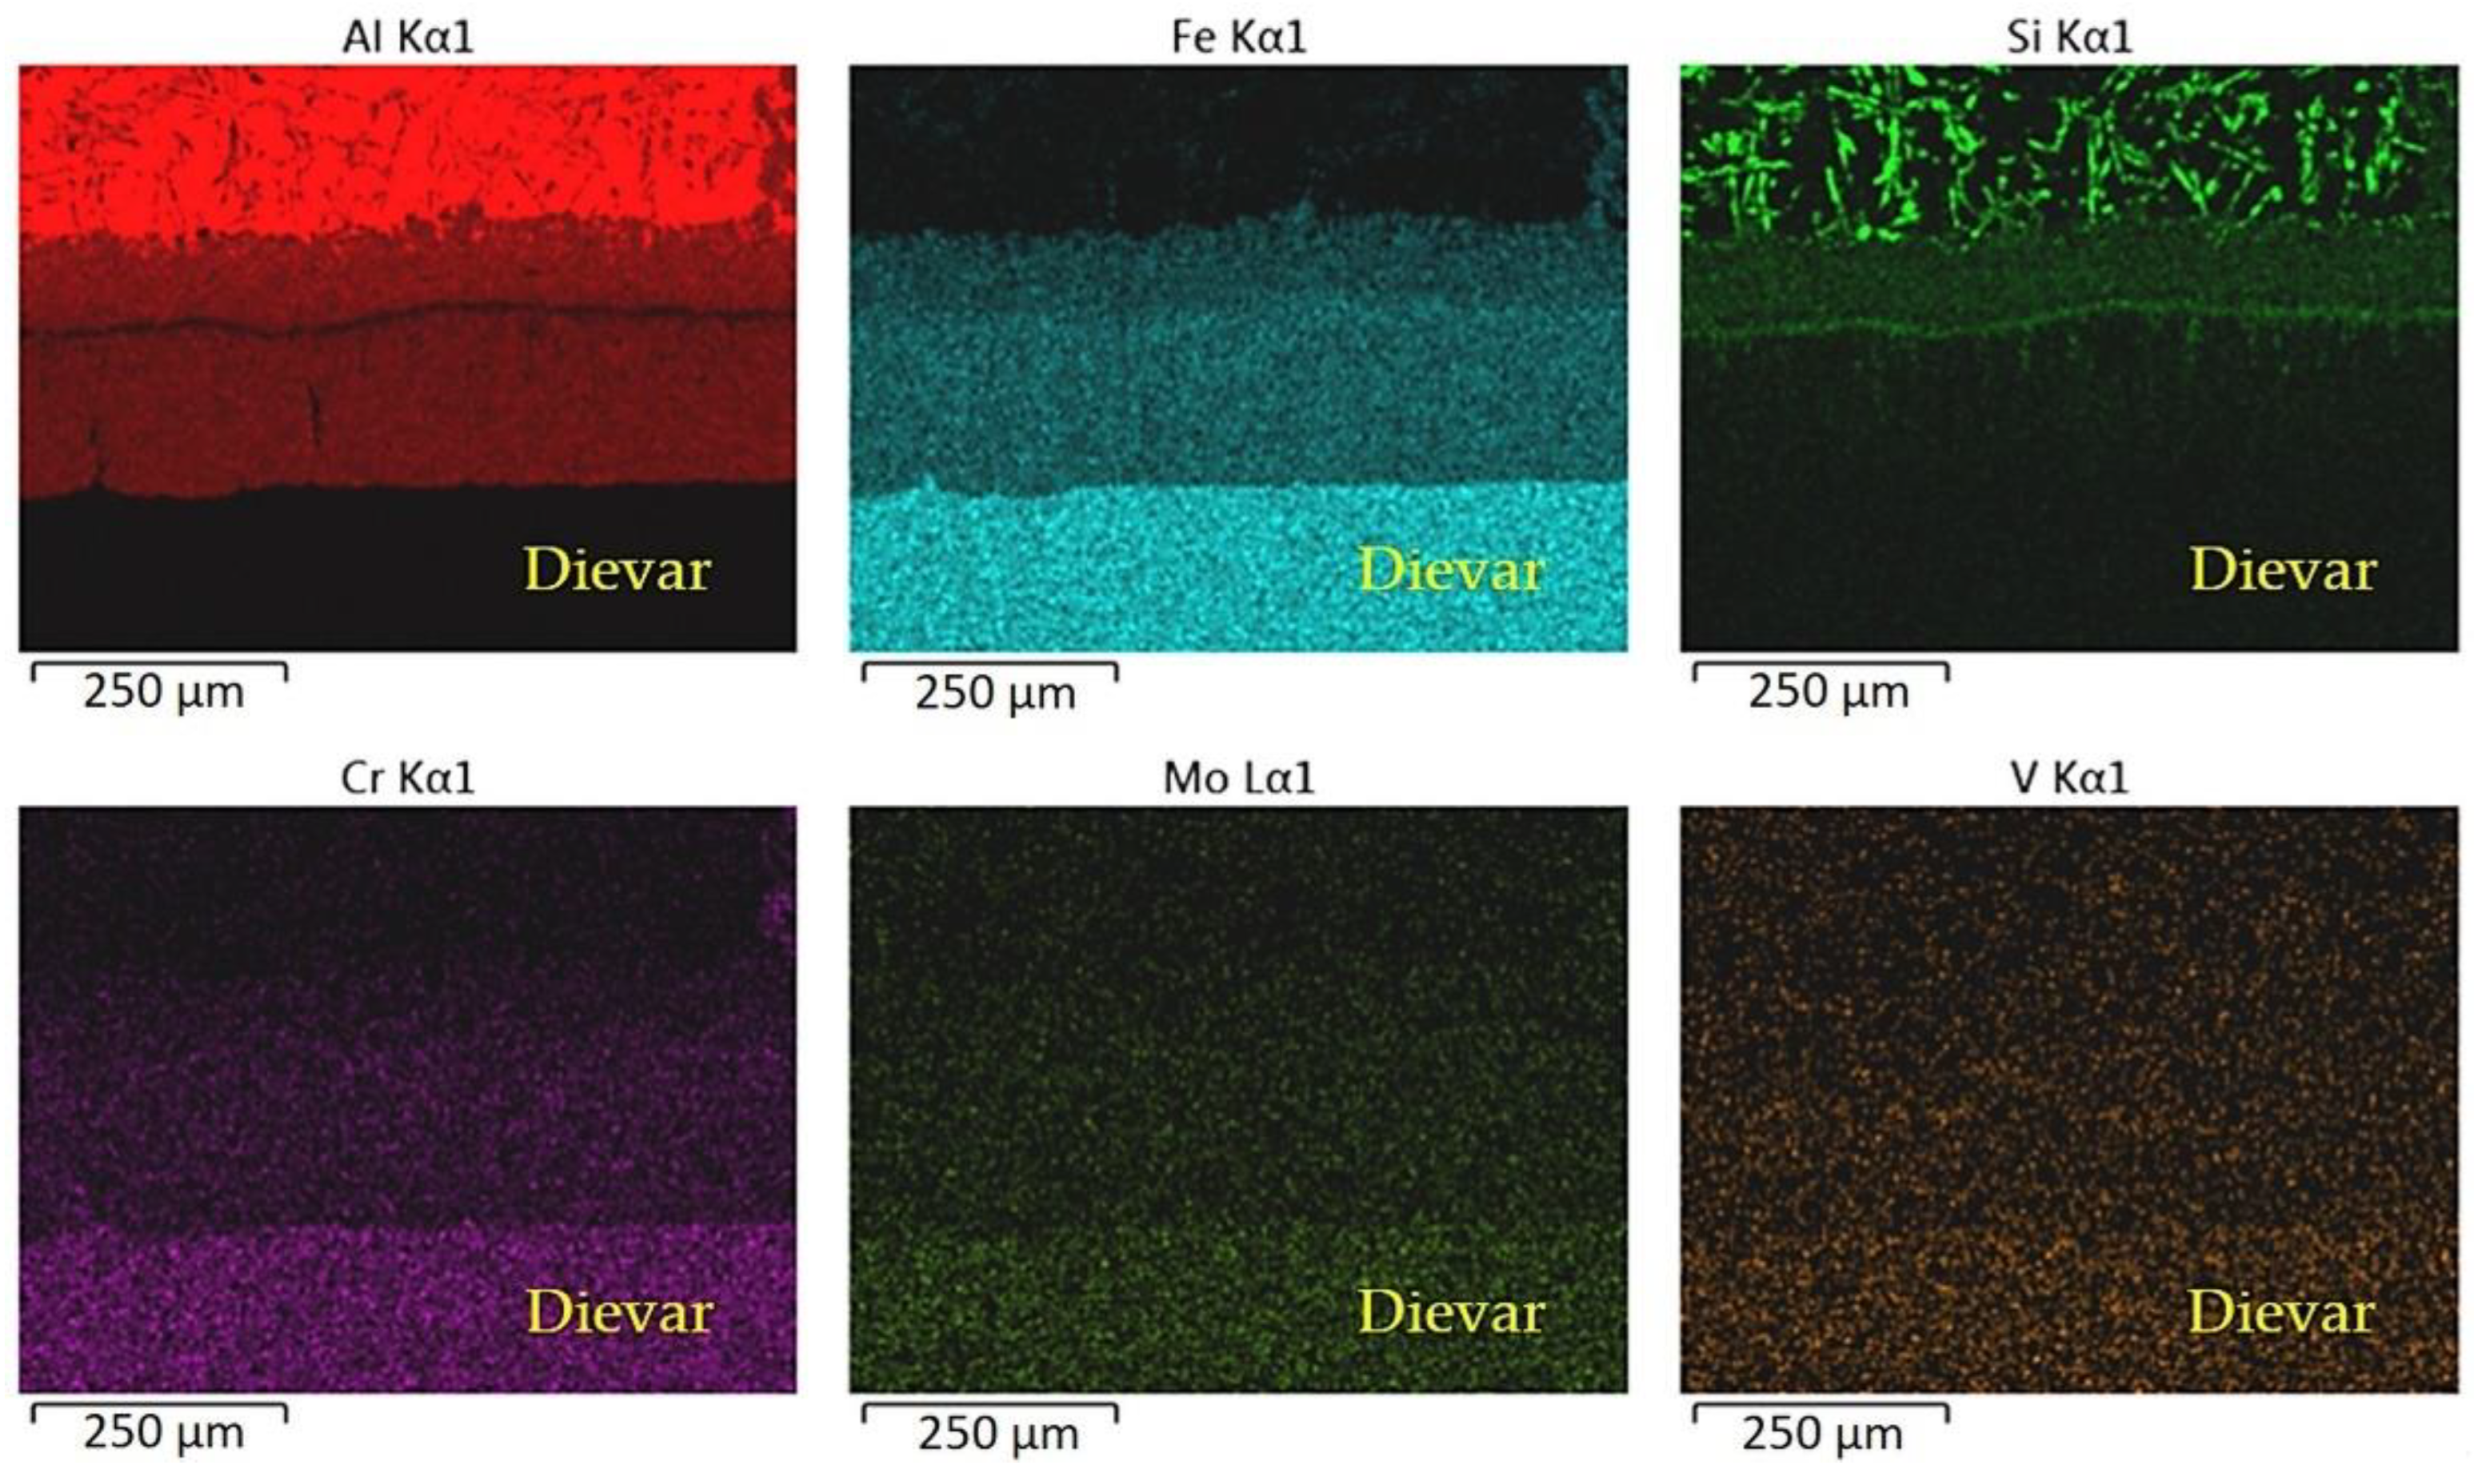
Spectral, EDX line and elemental analyses were performed on the samples after their exposure in the melt for 120 and 300 min. During the immersion of the cladding in the melt, the dissolution of the elements Fe, Al, Cr and Si in the cladding occurred. The diffusion of Al into the cladding was observed. The cladding that was made with the Cronitex RC 44 wire was not evaluated as it was destroyed during the immersion test.
-
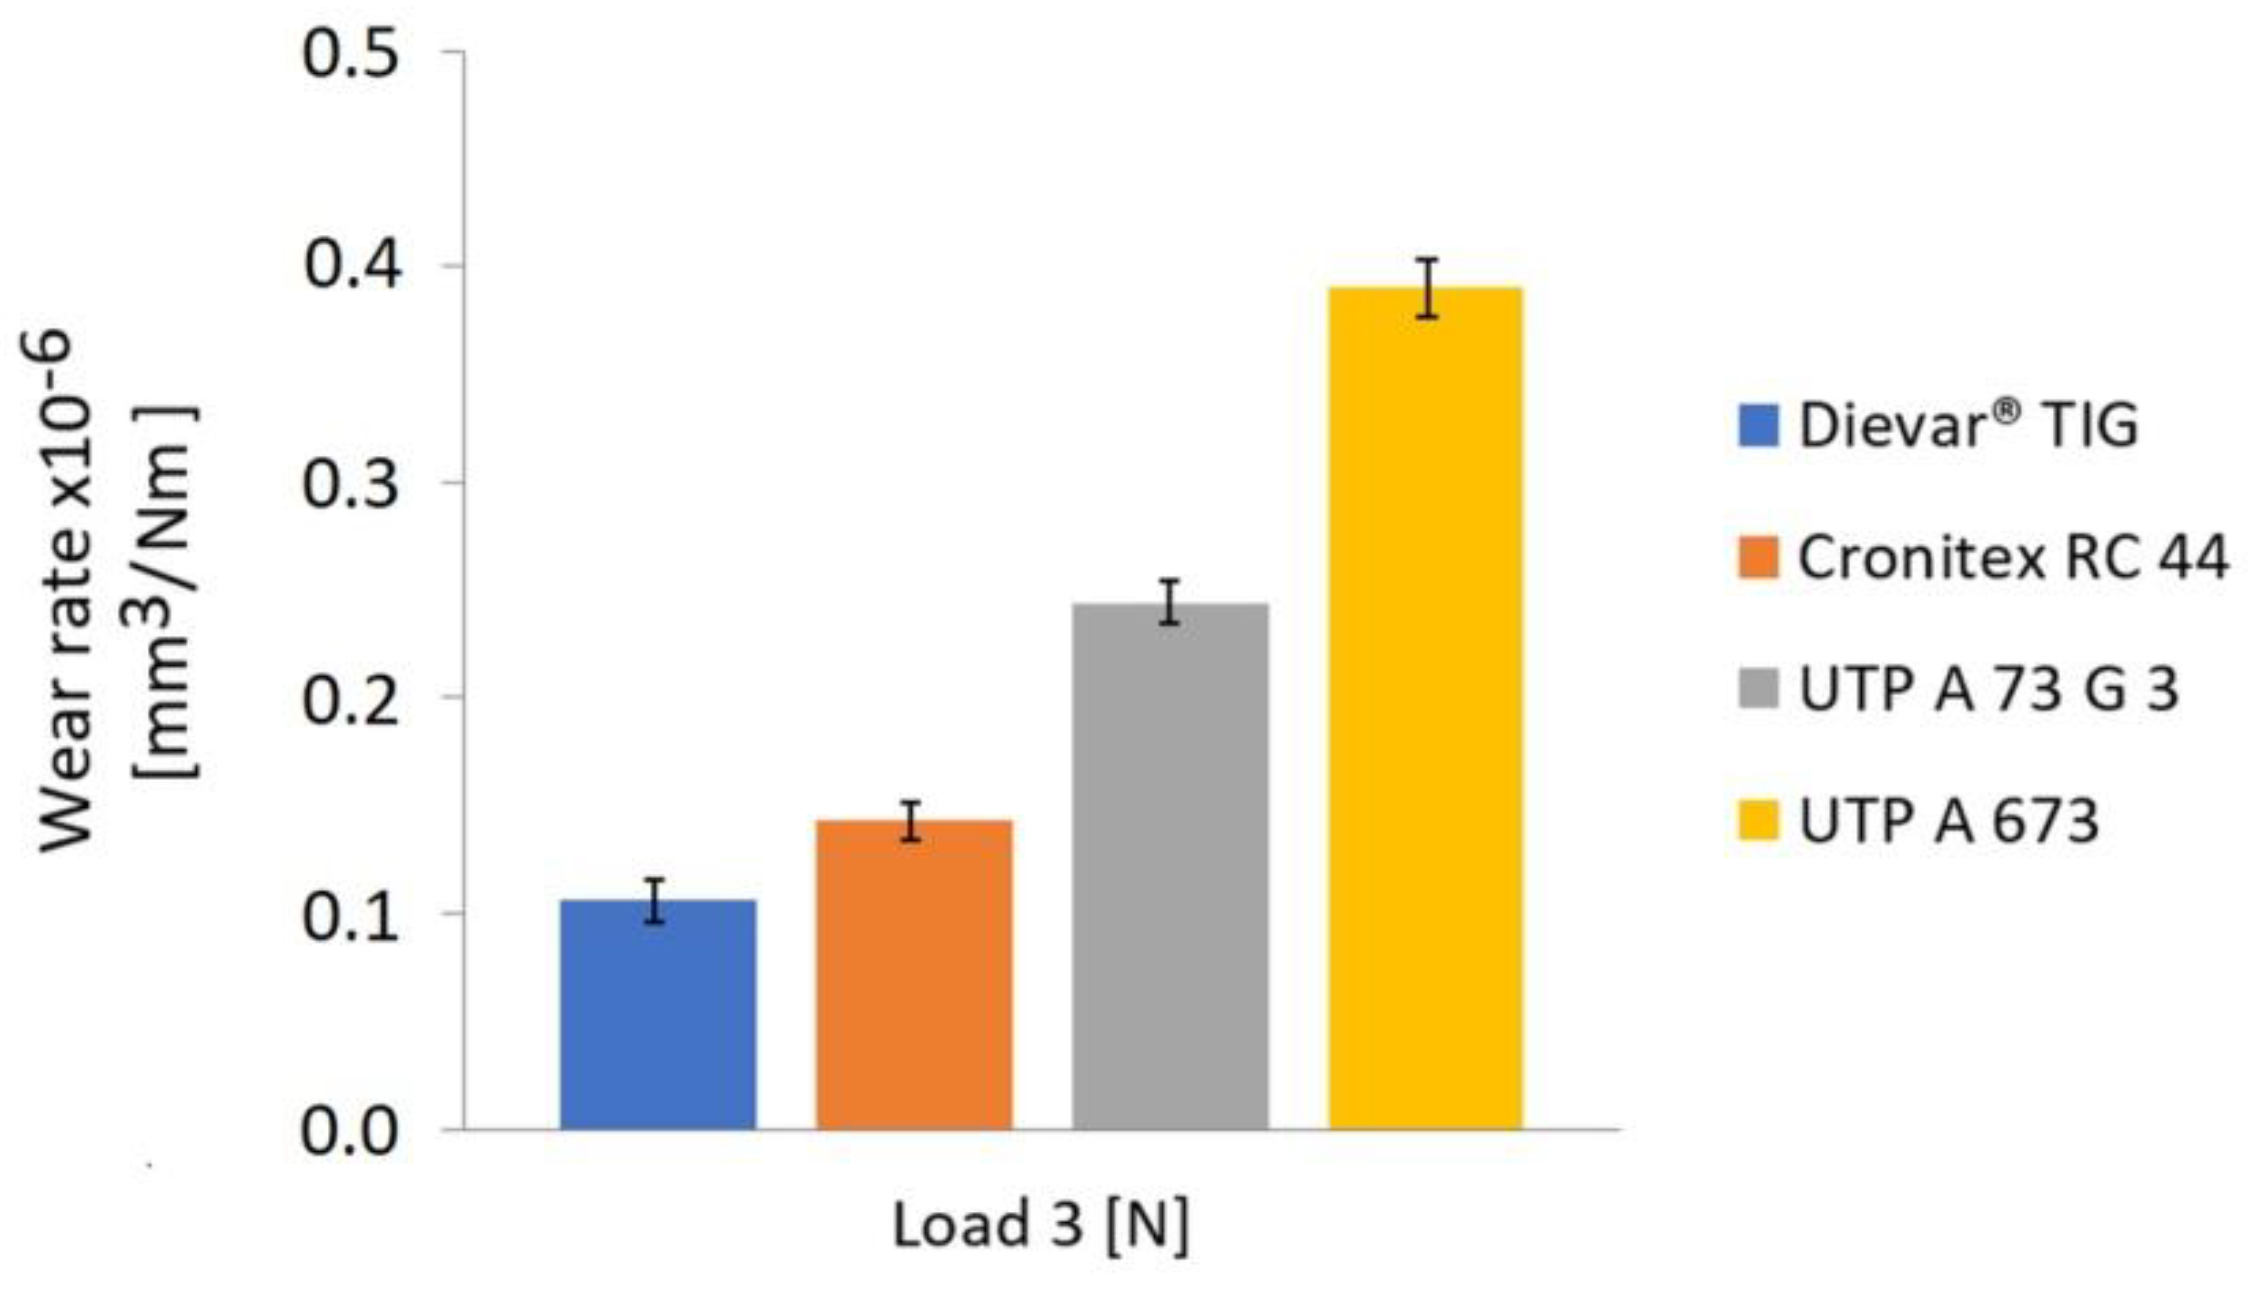
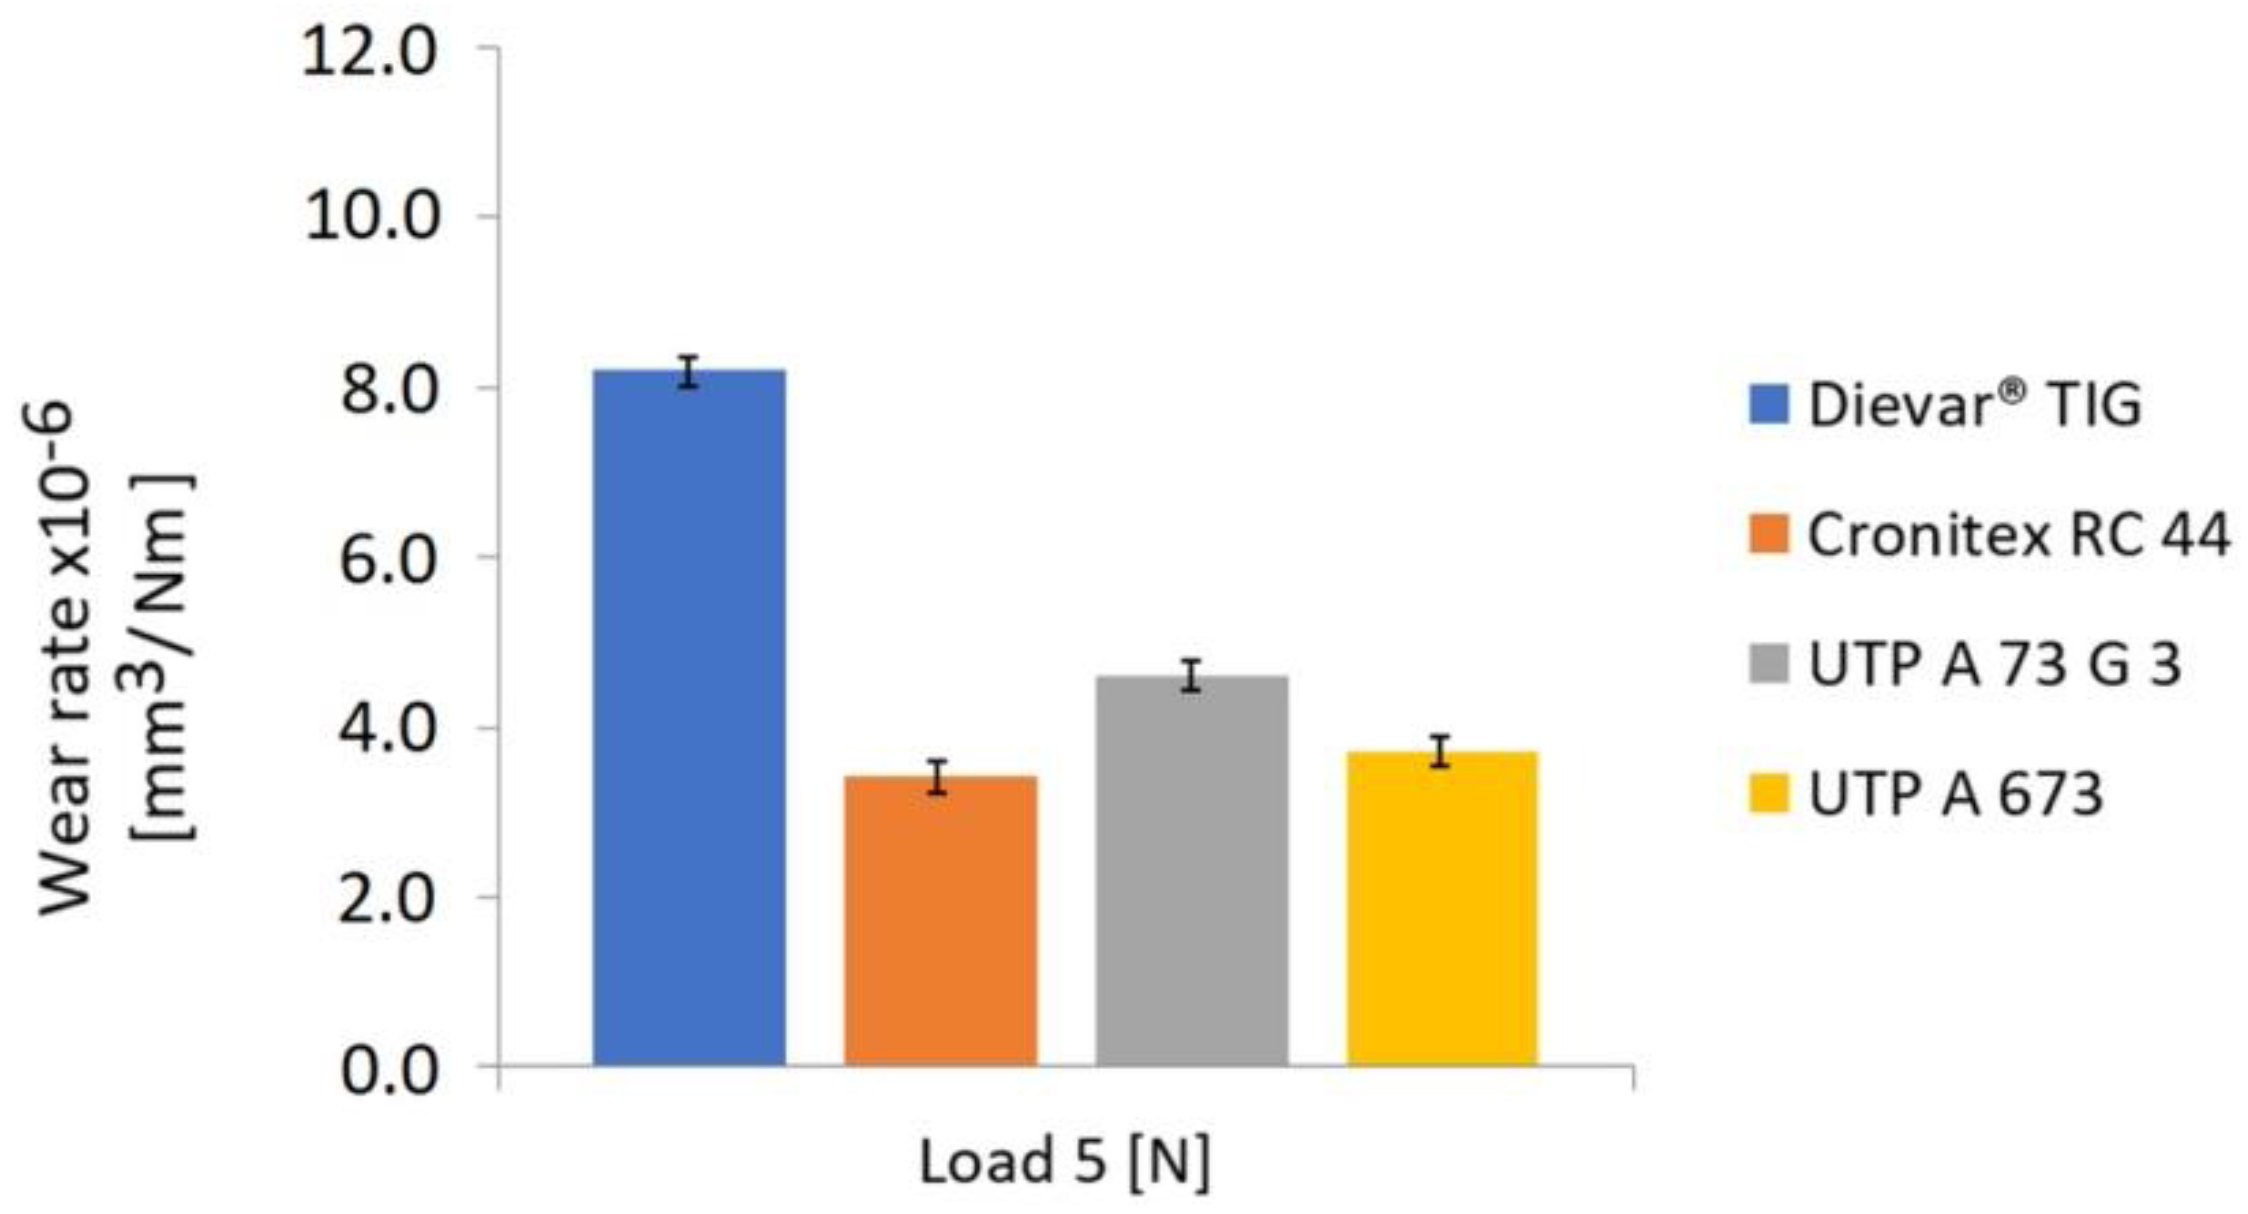
Within the evaluation of the tribological properties of the surfaces, the resistance to adhesive wear was evaluated by the ball-on-disc test. This type of wear occurred on the moving parts of the molds. The lowest wear rate was exhibited by the cladding that was made with the Cronitex RC 44 material, which is consistent with the measured hardness values.

5. Conclusions

This paper presents the research results on the grade evaluation of the cladding layers that were made with the selected additive materials. As already presented in the introduction, the production of Al alloy castings is an increasing trend. The automobile, aerospace, shipbuilding and refrigeration industries are the dominant customers of this product. Injection molding technology is primarily oriented towards serial or mass production; hence, there are high expectations of injection mold durability. However, their durability depends on several factors. The lifespan of the molds tends to be in the range of 10,000 to 500,000 moldings. Due to these tools’ prices, their repair is currently an issue. The restoration of the damaged functional surfaces of the injection molds can be carried out using both conventional and progressive technologies. However, the primary ones are the cladding methods. Of the conventional methods, the GMAW manual cladding methods are applied in practice, especially for the restoration of surfaces requiring a larger volume of cladding layer metal. For the local repairs of mold cavities, short sections, etc., the most widely used method is GTAW manual arc cladding. Among the progressive methods of cladding, the methods of robotic laser cladding or the CMT (Cold Metal Transfer) method are used.
Based on the dimensions, shape, granularity and extent of the damage of the repaired injection mold, the GTAW method was chosen for the restoration. Based on the chemical composition of the mold’s base material, which was made of Dievar steel from Uddeholm Boehler, four types of additive materials were selected for the experiment. Specifically, these were two additive materials from the UTP production, namely, the cladding wires (UTP A 73 G3 and UTP A 673), and one from the Cronitex (RC 44) and Uddeholm (Dievar TIG) production. The limiting criteria for the wire selection were the values of C in the interval (0.25–0.35%) and Cr (4.9–5.3%). The test samples were produced as three layers to eliminate the blending of the cladding layer metal with the base material. Of the samples that were prepared in this way, a comprehensive material analysis and tribological tests of the cladding were carried out under the dry sliding friction conditions. To simulate the realistic load conditions, the cladding layers were subjected to immersion testing in a melt of AlSi8Cu3 aluminum alloy at the temperature 680 ± 20 °C.
Based on the experiments that were carried out, it is possible to recommend the additive material UTP A 73 G 3 for the restoration of the functional surfaces of the molds for the injection of Al alloys, as the patterns that were created by it have shown the best results in terms of their resistance to the Al melt, which is the dominant degradation factor limiting the life of the molds. The hardness of this cladding meets the minimum hardness requirements for cladding, and it is also suitable for functional surfaces that are subjected to adhesive wear as it achieved the lowest wear rate after Cronitex RC 44 cladding. The restoration of the functional surfaces of the components is highly current due to the rapid increase of medium and high-alloyed steels on the world markets.

Author Contributions

The research was conceptualized by J.B. (Janette Brezinová), M.D. and J.V.; the experiments were conducted by J.B. (Janette Brezinová), M.V., V.P. and I.V. The results were analyzed and discussed by J.B. (Jakub Brezina), J.V., M.D., I.V. The manuscript was written and reviewed by J.B. (Janette Brezinová), J.V. and M.D. All authors have read and agreed to the published version of the manuscript.

Funding

This research was funded by the Scientific Grant Agency, “Application of progressive technologies in restoration of functional surfaces of products” (1/0497/20); the Cultural and Educational Grant Agency KEGA 046TUKE-4/2022 “Innovation of the educational process by implementing adaptive hypermedia systems in the teaching of subjects in the field of coating technology and welding of materials“; the Slovak Research and Development Agency APVV-20-0303 “Innovative approaches to the restoration of functional surfaces by laser weld overlaying”; APVV-16-0359 “The utilization of innovative technology for repair functional surfaces of mold casting dies for castings in automotive industry”.

Data Availability Statement

The data presented in this study are available upon request from the corresponding author.

Conflicts of Interest

The authors declare no conflict of interest. The funders had no role in the design of the study; in the collection, analyses, or interpretation of data; in the writing of the manuscript, or in the decision to publish the results.

References

  1. Bradley, R.K. Education in Plastics Manufacturing: Aluminum Mold Making and Injection Molding. Int. J. Mech. Eng. Educ. 2021, 50, 726–738. [Google Scholar] [CrossRef]
  2. Moritzer, E.; Martin, Y. Experimental Investigations on the Fibre Length Degradation in Injection Moulds. AIP Conf. Proc. 2017, 1914, 140004. [Google Scholar]
  3. Brezinová, J.; Džupon, M.; Viňáš, J.; Guzanová, A.; Puchý, V.; Brezina, J.; Draganovská, D.; Vojtko, M. Progressive CMT Cladding for Renovation of Casting Mold. Acta Metall. Slovaca 2020, 26, 104–110. [Google Scholar] [CrossRef]
  4. Hou, Y.; Wang, J.; Liu, L.; Li, G.; Zhai, D. Mechanism of Pitting Corrosion Induced by Inclusions in Al-Ti-Mg Deoxidized High Strength Pipeline Steel. Micron 2020, 138, 102898. [Google Scholar] [CrossRef]
  5. Sharshin, V.N.; Balandin, V.M.; Skitovich, S.V.; Tsiglov, D.A. Improvement of the Technology of Remelting Waste and Chips of Aluminum Alloys with Raised Iron Content. Litejnoe Proizv. 1997, 5, 42–47. [Google Scholar]
  6. Barth, C.F.; Steigerwald, E.A.; Troiano, A.R.; Frankenthal, R.P.; Pickering, H.W. On the Mechanism of Localized Corrosion of Iron and Stainless Steel II. Morphological Studies. J. Electrochem. Soc. 1972, 119, 1304. [Google Scholar]
  7. Klobčar, D.; Tušek, J. Thermal Stresses in Aluminium Alloy Die Casting Dies. Comput. Mater. Sci. 2008, 43, 1147–1154. [Google Scholar] [CrossRef]
  8. Camargo, S.A.; Correa Romeiro, L.; Mendes Moraes, C.A. Assessment of Thermal Behavior of a Cooling System to Reduce Thermal Fatigue Cracks in Aluminum Injection Molds. Rev. Lib. 2020, 21, 75–86. [Google Scholar] [CrossRef]
  9. Wang, K.; Shi, Y.; Zhou, X.; Zhai, C.; Li, D.; Jiang, J. Development and Prospect of Cladding Technology. Cailiao Kexue yu Gongyi/Material Sci. Technol. 2021, 29, 81–90. [Google Scholar] [CrossRef]
  10. Li, X.; Li, T.; Shi, B.; Wang, D.; Adnan, M.; Lu, H. The Influence of Substrate Tilt Angle on the Morphology of Laser Cladding Layer. Surf. Coat. Technol. 2020, 391, 125706. [Google Scholar] [CrossRef]
  11. Trembach, B.; Grin, A.; Makarenko, N.; Zharikov, S.; Trembach, I.; Markov, O. Influence of the Core Filler Composition on the Recovery of Alloying Elements during the Self-Shielded Flux-Cored Arc Welding. J. Mater. Res. Technol. 2020, 9, 10520–10528. [Google Scholar] [CrossRef]
  12. Trembach, B.; Grin, A.; Subbotina, V.; Vynar, V.; Knyazev, S.; Zakiev, V.; Trembach, I.; Kabatskyi, O. Effect of Exothermic Addition (Cuo-Al) on the Structure, Mechanical Properties and Abrasive Wear Resistance of the Deposited Metal during Self-Shielded Flux-Cored Arc Welding. Tribol. Ind. 2021, 43, 452. [Google Scholar] [CrossRef]
  13. Kumar Saha, M.; Das, S. Gas Metal Arc Weld Cladding and Its Anti-Corrosive Performance—A Brief Review. Athens J. Τechnol. Eng. 2018, 5, 155–174. [Google Scholar] [CrossRef]
  14. Trembach, B.; Grin, A.; Turchanin, M.; Makarenko, N.; Markov, O.; Trembach, I. Application of Taguchi Method and ANOVA Analysis for Optimization of Process Parameters and Exothermic Addition (CuO-Al) Introduction in the Core Filler during Self-Shielded Flux-Cored Arc Welding. Int. J. Adv. Manuf. Technol. 2021, 114, 1099–1118. [Google Scholar] [CrossRef]
  15. Singhal, T.S.; Jain, J.K. GMAW Cladding on Metals to Impart Anti-Corrosiveness: Machine, Processes and Materials. Mater. Today Proc. 2020, 26, 2432–2441. [Google Scholar] [CrossRef]
  16. Shen, H.; Deng, R.; Liu, B.; Tang, S.; Li, S. Study of the Mechanism of a Stable Deposited Height during GMAW-Based Additive Manufacturing. Appl. Sci. 2020, 10, 4322. [Google Scholar] [CrossRef]
  17. Silwal, B.; Walker, J.; West, D. Hot-Wire GTAW Cladding: Inconel 625 on 347 Stainless Steel. Int. J. Adv. Manuf. Technol. 2019, 102, 3839–3848. [Google Scholar] [CrossRef]
  18. Hou, Z.L.; Fu, K.J.; Fang, D.S.; Wang, J.J.; Qiao, J.; Yang, P.C.; Wang, Y.W. Microstructure and Mechanical Performances of Stainless Steel Cladding by Twin-Electrode GTAW. Mater. Trans. 2021, 62, 995–1000. [Google Scholar] [CrossRef]
  19. Shi, C.; Liu, P.; Yan, D.; Zhang, Y. Effect of the Particle Size of Cladding Materials on the Morphology and Corrosion Resistance of Fe-Based Laser Cladding Layers. Int. J. Electrochem. Sci. 2020, 15, 1788–1795. [Google Scholar] [CrossRef]
  20. Hongyu, L.; Lianfeng, W.; Zeming, W.; Hui, C.; Na, Z.; Hengquan, Z. Effect of Preheating Temperature on Microstructure and Stress of Laser Cladding Layer. Laser Optoelectron. Prog. 2021, 58, 0714004. [Google Scholar] [CrossRef]
  21. Yao, F.; Fang, L.; Chen, X. Geometry Analysis and Microhardness Prediction of Nickel-Based Laser Cladding Layer on the Surface of H13 Steel. Processes 2021, 9, 408. [Google Scholar] [CrossRef]
  22. Hong, J.D.; Kim, E.; Yang, Y.S.; Kook, D.H. Mechanical Property Degradation of Unirradiated Zircaloy-4 Cladding After Creep Deformation. Nucl. Technol. 2018, 206, 282–292. [Google Scholar] [CrossRef]
  23. Zixin, C.; Houming, Z.; Caixing, X. Cladding Crack in Laser Cladding: A Review. Laser Optoelectron. Prog. 2021, 58, 0700006. [Google Scholar] [CrossRef]
  24. Fu, F.; Zhang, Y.; Chang, G.; Dai, J. Analysis on the Physical Mechanism of Laser Cladding Crack and Its Influence Factors. Optik 2016, 127, 200–202. [Google Scholar] [CrossRef]
  25. Wu, H.; Udagawa, Y.; Narukawa, T.; Amaya, M. Crack Formation in Cladding under LOCA Quench Conditions. Nucl. Eng. Des. 2016, 303, 25–30. [Google Scholar] [CrossRef]
  26. Erdogan, F.; Wu, B.H. Crack Problems in Fgm Layers under Thermal Stresses. J. Therm. Stress. 1996, 19, 237–265. [Google Scholar] [CrossRef]
  27. Zhu, M.; Shi, Y.; Fan, D.; Lu, L.H.; Zhou, H. Control of Pulsed DE-MIG Welding Process. J. Shanghai Jiaotong Univ. 2015, 49, 344–347. [Google Scholar] [CrossRef]
  28. Zhou, L.B.; Shu, J.G.; Sun, J.S.; Chen, J.; He, J.J.; Li, W.; Huang, W.Y.; Niu, Y.; Yuan, T.-C. Effects of Tantalum Addition on Microstructure and Properties of Titanium Alloy Fabricated by Laser Powder Bed Fusion. J. Cent. South Univ. 2021, 28, 1111–1128. [Google Scholar] [CrossRef]
  29. Viňáš, J.; Vrabel’, M.; Greš, M.; Brezina, J.; Sabadka, D.; Fedorko, G.; Molnár, V. Restoration of Worn Movable Bridge Props with Use of Bronze Claddings. Materials 2018, 11, 459. [Google Scholar] [CrossRef] [PubMed] [Green Version]
  30. Taylor, J.A. Iron-Containing Intermetallic Phases in Al-Si Based Casting Alloys. Procedia Mater. Sci. 2012, 1, 19–33. [Google Scholar] [CrossRef] [Green Version]
  31. Thompson, S. Handbook of Mould, Tool and Die Repair Welding; Elsevier: Amsterdam, The Netherlands, 1999. [Google Scholar]
  32. Davis, J. Surface Hardening of Steels: Understanding the Basics; ASM international: Almere, The Netherlands, 2002. [Google Scholar]
  33. Blaškovič, P.; Čomaj, M. Renovation by Cladding and Thermal Spraying; STU Bratislava: Bratislava, Slovakia, 2006; ISBN 80-227-2482-3. [Google Scholar]
  34. Milewski, J.O. Additive Manufacturing of Metals; Springer Series in Materials Science; Springer International Publishing: Cham, Switzerland, 2017; Volume 258, ISBN 978-3-319-58204-7. [Google Scholar]
  35. Chen, S.; Yang, D.; Zhang, M.; Huang, J.; Zhao, X. Interaction Between the Growth and Dissolution of Intermetallic Compounds in the Interfacial Reaction Between Solid Iron and Liquid Aluminum. Metall. Mater. Trans. A Phys. Metall. Mater. Sci. 2016, 47, 5088–5100. [Google Scholar] [CrossRef]
  36. Springer, H.; Kostka, A.; Payton, E.J.; Raabe, D.; Kaysser-Pyzalla, A.; Eggeler, G. On the Formation and Growth of Intermetallic Phases during Interdiffusion between Low-Carbon Steel and Aluminum Alloys. Acta Mater. 2011, 59, 1586–1600. [Google Scholar] [CrossRef]
  37. Bouayad, A.; Gerometta, C.; Belkebir, A.; Ambari, A. Kinetic Interactions between Solid Iron and Molten Aluminium. Mater. Sci. Eng. A 2003, 363, 53–61. [Google Scholar] [CrossRef]
  38. Shahverdi, H.R.; Ghomashchi, M.R.; Shabestari, S.; Hejazi, J. Microstructural Analysis of Interfacial Reaction between Molten Aluminium and Solid Iron. J. Mater. Process. Technol. 2002, 124, 345–352. [Google Scholar] [CrossRef]
  39. Azimaee, H.; Sarfaraz, M.; Mirjalili, M.; Aminian, K. Effect of Silicon and Manganese on the Kinetics and Morphology of the Intermetallic Layer Growth during Hot-Dip Aluminizing. Surf. Coat. Technol. 2019, 357, 483–496. [Google Scholar] [CrossRef]
  40. Rezaei, H.; Akbarpour, M.R.; Shahverdi, H.R. Effects of Interfacial Layers Fracture on the Dissolution Mechanism of Solid Fe in Liquid Al. JOM 2015, 67, 1443–1450. [Google Scholar] [CrossRef]
  41. Hegde, S.; Prabhu, K.N. Modification of Eutectic Silicon in Al-Si Alloys. J. Mater. Sci. 2008, 43, 3009–3027. [Google Scholar] [CrossRef]
  42. Jogineedi, R.; Singireddy, V.R.; Kancharla, S.K.; Salvi, S.S.; Jain, A.; Filip, P. Impact of Microstructure and Surface Treatment on Thermal Properties of Gray Cast Iron Brake Rotors; SAE Technical Paper Series; SAE International: Warrendale, PA, USA, 2022. [Google Scholar]
Figure 1. Shaped part of the mold after cladding. M—Maraging layer, D—Dievar layer.
Metals 12 01781 g001
Figure 2. Detail of the cladding layers (CL). M—Maraging layer, D—Dievar layer.
Metals 12 01781 g002
Figure 3. Documentation of mold wear. (a) Crack around ejector and core void. (b) Separation medium on shaped part surface. (c) Moving core and mold shaped part contact.
Metals 12 01781 g003
Figure 4. Shaped part’s surface after cyclic treatment with separation medium and areas of moving core and mold-shaped part contact (ac).
Metals 12 01781 g004
Figure 5. The microstructures of covering and inter layer of claddings.
Metals 12 01781 g005
Figure 6. Progression of cladding layer hardness: (a) Cronitex RC 44, (b) UTP 73 G 3, (c) UTP A 673 and (d) Dievar® TIG-Weld; L1–L3 cladding layer.
Metals 12 01781 g006
Figure 7. Cladding cross crowns after their exposure in aluminum melt—120 min and 300 min.
Metals 12 01781 g007
Figure 8. Spectral analysis of UTP A 673 cladding layer after exposure in aluminum melt at 120 min.
Metals 12 01781 g008
Figure 9. EDX line analysis of the transition region between the UTP A 673 cladding layer and the base material after exposure in aluminum melt at 120 min.
Metals 12 01781 g009
Figure 10. Qualitative EDX area elemental analysis for UTP A 673 cladding after immersion at 120 min.
Metals 12 01781 g010
Figure 11. Spectral analysis of the UTP A 673 cladding after exposure in aluminum melt at 300 min.
Metals 12 01781 g011
Figure 12. EDX line analysis of the transition region between the UTP A 673 cladding and the base material after exposure in aluminum melt at 300 min.
Metals 12 01781 g012
Figure 13. Qualitative EDX area elemental analysis for UTP A 673 cladding after immersion at 300 min.
Metals 12 01781 g013
Figure 14. Spectral analysis of the UTP A 73 G 3 cladding after exposure in aluminum melt at 120 min.
Metals 12 01781 g014
Figure 15. EDX line analysis of the transition region between the UTP A 73 G 3 cladding and the base material after exposure to aluminum melt at 120 min.
Metals 12 01781 g015
Figure 16. Qualitative EDX area elemental analysis for UTP A 73 G 3 cladding after immersion at 120 min.
Metals 12 01781 g016
Figure 17. Spectral analysis of UTP A 73 G 3 cladding after exposure in aluminum melt at 300 min.
Metals 12 01781 g017
Figure 18. EDX color surface element analyses for UTP A 73 G 3 after immersion at 300 min.
Metals 12 01781 g018
Figure 19. Qualitative EDX area elemental analysis for UTP A 73 G 3 cladding and the base material after exposure in aluminum melt, 300 min.
Metals 12 01781 g019
Figure 20. Spectral analysis of Uddeholm Dievar® TIG-Weld cladding after exposure in aluminum melt at 120 min.
Metals 12 01781 g020
Figure 21. EDX line analysis of the transition region between the Uddeholm Dievar® TIG-Weld cladding and the base material after exposure in aluminum melt at 120 min.
Metals 12 01781 g021
Figure 22. Qualitative EDX area elemental analysis for Uddeholm Dievar® TIG-Weld cladding after immersion at 120 min.
Metals 12 01781 g022
Figure 23. Spectral analysis of Uddeholm Dievar® TIG-Weld cladding after exposure in aluminum melt at 300 min.
Metals 12 01781 g023
Figure 24. EDX line analysis of the transition region between Uddeholm Dievar® TIG-Weld cladding and the base material after exposure in aluminum melt at 300 min.
Metals 12 01781 g024
Figure 25. Qualitative EDX area elemental analysis for Uddeholm Dievar® TIG-Weld cladding after immersion at 300 min.
Metals 12 01781 g025
Figure 26. The intermetallic phase thickness with relatively constant iron and aluminum concentrations [µm].
Metals 12 01781 g026
Figure 27. Relative dissolution of UTP 73 G3 and UTP 673 cladding layers in the Al-Si melt was determined, and then, this was normalized to the corrosion dissolution of the Dievar cladding Dievar.
Metals 12 01781 g027
Figure 28. Results of wear rate of claddings under 3 N load.
Metals 12 01781 g028
Figure 29. Results of wear rate of claddings under 5 N load.
Metals 12 01781 g029
Figure 30. Results of wear rate of claddings under 10 N load.
Metals 12 01781 g030
Table 1. Chemical composition of the base material Dievar (1.2343) [wt.%].
CMnSiPSCrNiMoVCuFe
0.3620.4210.1660.0020.0095.090.0742.310.640.072Bal.
Table 2. Mechanical properties of the base material Dievar (1.2343) by manufacturer.
Yield Strength
[MPa]
Tensile Strength
[MPa]
Elongation A5
[%]
Hardness
HRC
142016801245
Table 3. Chemical composition of additive materials for GTAW cladding given by manufacturers [wt.%].
CMnSiCrWVMoTiFe
Cronitex RC 440.350.60.75.30.40.81.5-Bal.
UTP A 73 G 30.250.70.55.0--4.00.6Bal.
UTP A 6730.350.415.01.30.31.5-Bal.
Dievar® TIG0.320.40.34.9-0.62.1 Bal.
Table 4. Cladding parameters using GTAW method.
Electric current [Iz]95 A
Voltage [Uz]18 V
Burner nozzle diameter9.5 mm
Protective atmosphereAr 4.6
Gas flow12 L
Cladding equipment2-takt
Intercaterpillar temperature≤150 °C
Applied polarityDC+
Publisher’s Note: MDPI stays neutral with regard to jurisdictional claims in published maps and institutional affiliations.

