Article

Plastic Behavior and Microstructure Heterogeneity of an AA6063-T6 Aluminum Alloy Processed by Symmetric and Asymmetric Rolling

by
Jairo Alberto Muñoz
1,*,
Tarek Khelfa
2,
Gonzalo Ariel Duarte
3,
Martina Avalos
4,
Raúl Bolmaro
4 and
José María Cabrera
1,5
1
Department of Materials Science and Engineering EEBE, Universidad Politécnica de Catalunya, c/Eduard Maristany 10-14, 08019 Barcelona, Spain
2
Department of Materials Engineering, School of Energy and Electromechanical Engineering, Hunan University of Humanities Science and Technology, Loudi 417000, China
3
Department of Physics and Space Sciences, Universidad de Granada, Calle Prof. Vicente Callao, 3, 18011 Granada, Spain
4
Instituto de Física Rosario, Consejo Nacional de Investigaciones Científicas y Técnicas-CONICET, Universidad Nacional de Rosario, Ocampo y Esmeralda, Rosario 2000, Argentina
5
Fundació CIM-UPC, c/Llorens i Artigas 12, 08028 Barcelona, Spain
*
Author to whom correspondence should be addressed.
Metals 2022, 12(10), 1551; https://doi.org/10.3390/met12101551
Submission received: 27 August 2022 / Revised: 10 September 2022 / Accepted: 16 September 2022 / Published: 20 September 2022
(This article belongs to the Special Issue Plastic Forming, Microstructure, and Property Optimization of Metals)

Abstract

:
Rolling is one of the most employed industrial processes which can be used at multiple manufacturing stages, allowing different geometries such as plates, rods, profiles, billets, slabs, tubes, and seamless tubes to be obtained. However, rolled products develop anisotropy due to the preferential orientation of crystals in the rolling direction. Thus, some process configurations and different processing parameters (e.g., thickness reduction per rolling pass, deformation routes, roll diameters, and strain rate) have been proposed to deal with the desired anisotropy. In this context, this investigation evaluates and compares the effect of symmetrical and asymmetrical rolling on an aluminum alloy sheet deformed until a 38% thickness reduction using multiple rolling passes. The asymmetrical process displayed larger texture and microstructure gradients across the sheet thickness than the symmetrical one, manifested as more grain refinement and more intense shear texture components close to sheet surfaces. In terms of plastic anisotropy, the visco-plastic self-consistent model predicted higher average anisotropy for the symmetric rolling than the asymmetric process due to a strong combination of recrystallization and deformation texture components. Conversely, the asymmetric process showed lower planar anisotropy values due to the increase in the fraction of shear and deformation texture components near the sheet surfaces, producing a less intense overall texture than the symmetric rolling. The additional shear strain component was mainly responsible for the material strengthening and texture weakening after the asymmetrical rolling process. In addition, the shear strain produced grain refinement, decreased misorientation, and higher dislocation densities than the as-received and symmetrically rolled materials. After asymmetrical rolling, the microstructure and texture showed heterogeneous profiles across the sheet thickness. This gave rise to a heterogeneous grain size refinement, decreased misorientation close to sheet edges, and plastic gradients.

1. Introduction

Today, there is a high demand for lighter, safer, low-cost, recyclable, and green production structures. Al-Mg-Si alloys, as essential lightweight alloys, are extensively utilized in various industries, including the aerospace, automobile, and construction industries, due to their high mechanical strength, excellent recyclability, and weldability [1,2,3]. However, as compared to steel, Al-Mg-Si sheet alloys have inferior forming properties and a higher cost. As a result, better formability is necessary to enhance the competitiveness of these alloys. In this context, sheet metal manufacturing is an excellent method for meeting the abovementioned objectives. In this context, rolling is a forming process required for manufacturing both final or semi-final products previous to other forming processes in industrial applications.
On the other hand, rolling and its modifications are the most frequently used methods for generating ultrafine-grain (UFG) materials, thanks to their speediness and efficiency in producing large volumes of materials [4,5,6]. Rolling processes have also captured the interest of scientists investigating novel ways to tailor the microstructure and characteristics of metals [7,8,9]. Although there are many papers regarding rolling, researchers are always looking for novel deformation modifications or combinations with other treatments that might help to find optimized processes [10,11].
Among the several kinds of rolling processes, symmetric (SR) and asymmetric rolling (ASR) are characteristic plastic deformation techniques used for enhancing the microstructures and mechanical properties of a given metal. Moreover, the deformation by these two rolling processes is followed by the development of a particular crystallographic texture, which significantly influences the mechanical properties of the treated materials. In this regard, Wang et al. [12] demonstrated that ASR might modify shear strain, microstructure, and texture to improve the mechanical performance of an Al-Mg-Si alloy. Several investigations on the development of shear texture and grain refinement in SR and ASR processes have recently been published [7,12,13,14]. For example, Hockauf et al. [15] compared the microstructure evolution during SR in pure aluminum and 6xxx series alloys to study how the chemical composition influences mechanical performance and shear banding formation. Additionally, Madhavan et al. [16] discovered that during SR, high dislocation activity inhibits the creation of the copper texture component predicted in pure aluminum. They also found that shear banding, an active deformation process in Al-Mg alloy, favors the formation of the brass texture component. Further, Xie et al. [17] showed that ASR improves the mechanical performance of the Al-Cu-Li alloy by influencing the texture and distribution of precipitates.
Some investigations have suggested that ASR is more efficient for grain refinement than SR, resulting in improved mechanical properties of AA6061 aluminum alloy [17,18]. Furthermore, ASR, as opposed to SR, causes shear strains, which result in shear textures, which can improve the formability and strength of aluminum alloys [4]. Alternatively, changing the strain path in SR and ASR processes is another factor affecting the mechanical properties, the texture evolution, and the microstructure evolution [19,20]. For example, Bhattacharjee et al. [21] studied the influence of the strain path on the texture and microstructure evolution of pure aluminum and Al2.5% Mg alloys. They found the copper texture component in both materials treated by unidirectional cold rolling and the strengthening of the brass component through cross-rolling processing. Kong et al. [22] examined the deformation and recrystallization textures of an AA3105 aluminum alloy produced by unidirectional and crossed rolling. They showed that the β-fiber was strengthened during unidirectional rolling as the thickness reduction was increased. Ma et al. [19] found that strain path variations in ASR and conventional SR processing impacted strain distribution and stored energy, influencing microstructure, recrystallization kinetics, and mechanical properties of an AA7050 aluminum alloy.
On the other hand, a useful model that allows for a better understanding of the plastic behavior of metallic materials is the one proposed by Lebensohn and Tomé [23]. This model, called the visco-plastic self-consistent (VPSC) model, uses an anisotropic approach for modeling the plastic deformation of polycrystals, allowing the prediction of texture evolution during several plastic deformation processes. For that reason, this model has earned the attention of many researchers around the globe. For example, Graça et al. [24] studied the shear effect of the ASR process employing the VPSC model in an Al alloy. The authors demonstrated that ASR improved the mechanical properties and the plastic strain ratio. Alternatively, the model is also suitable for analyzing different metallic systems. For instance, Roatta et al. [25] used the VPSC code to model the texture evolution in a Zn-Cu-Ti alloy during monotonic loading. Durán et al. [26] evaluated the AA1000 Al alloy sheet’s formability after heat treatment using different VPSC schemes coupled with a Marciniak and Kuczynski (MK) analysis. Shore et al. [27] also employed crystal plasticity modeling to assess the anisotropic plasticity of different Al alloys after ASR processing. They found that the ratio of roll radius to sheet thickness was a dominant process parameter. Therefore, they concluded that performing ASR in the latest stages of SR allows for better mechanical performance. Moreover, Tamimi et al. [28] deformed thin AA5182 Al alloy sheets using the ASR process, and they concluded through VPSC simulations and experimental tests that ASR increases not only the shear texture components but also the planar anisotropy.
A large number of studies concerning the rolling process of Al alloys sheets have been performed lately. However, there are no studies dealing with the local microstructure and texture heterogeneities across the sheet thickness during a rolling process and their effects on the overall material plastic behavior. Hence, it is crucial to know how the different zones across the sheet thickness behave and how they affect the alloy performance.
Although most investigations are generally focused on the microstructure, texture, and mechanical properties of aluminum alloys processed by SR and ASR processes, not much research has been done in terms of the microstructure and texture heterogeneity for an AA6063 aluminum alloy. As a result, the primary goal of this study is to examine the microstructure, texture evolution, and plastic behavior in the AA6063-T6 alloy throughout SR and ASR processes, taking into account localized and overall contributions across the sheet thickness. To reach this goal, advanced microstructure characterization using electron back-scattering diffraction (EBSD) across the entire sheet thickness helped to account for the microstructure and texture gradients. In addition, EBSD texture measurements served as input data for the plastic behavior modeling using the visco-plastic self-consistent model. In this way, this study will open the way to understanding the effect of local heterogeneities on the overall plastic, mechanical, and anisotropy behavior after SR and ASR processing.

2. Materials and Methods

2.1. As-Received Material

The as-received (AR) material for this research was an AA6063-T6 (EN AW-6063, European designation) Al alloy sheet with dimensions of 100 mm × 25 mm × 3 mm and the chemical composition indicated in Table 1 (first row, composition supplied by manufacturer; second row, composition measured by energy-dispersive X-ray spectroscopy (EDX)). Prior to SR and ASR, the alloy was subjected to aging treatment (solution treatment at 530 °C for 4 h, then quenched in water, followed by heating at 190 °C for 10 h and air cooling).

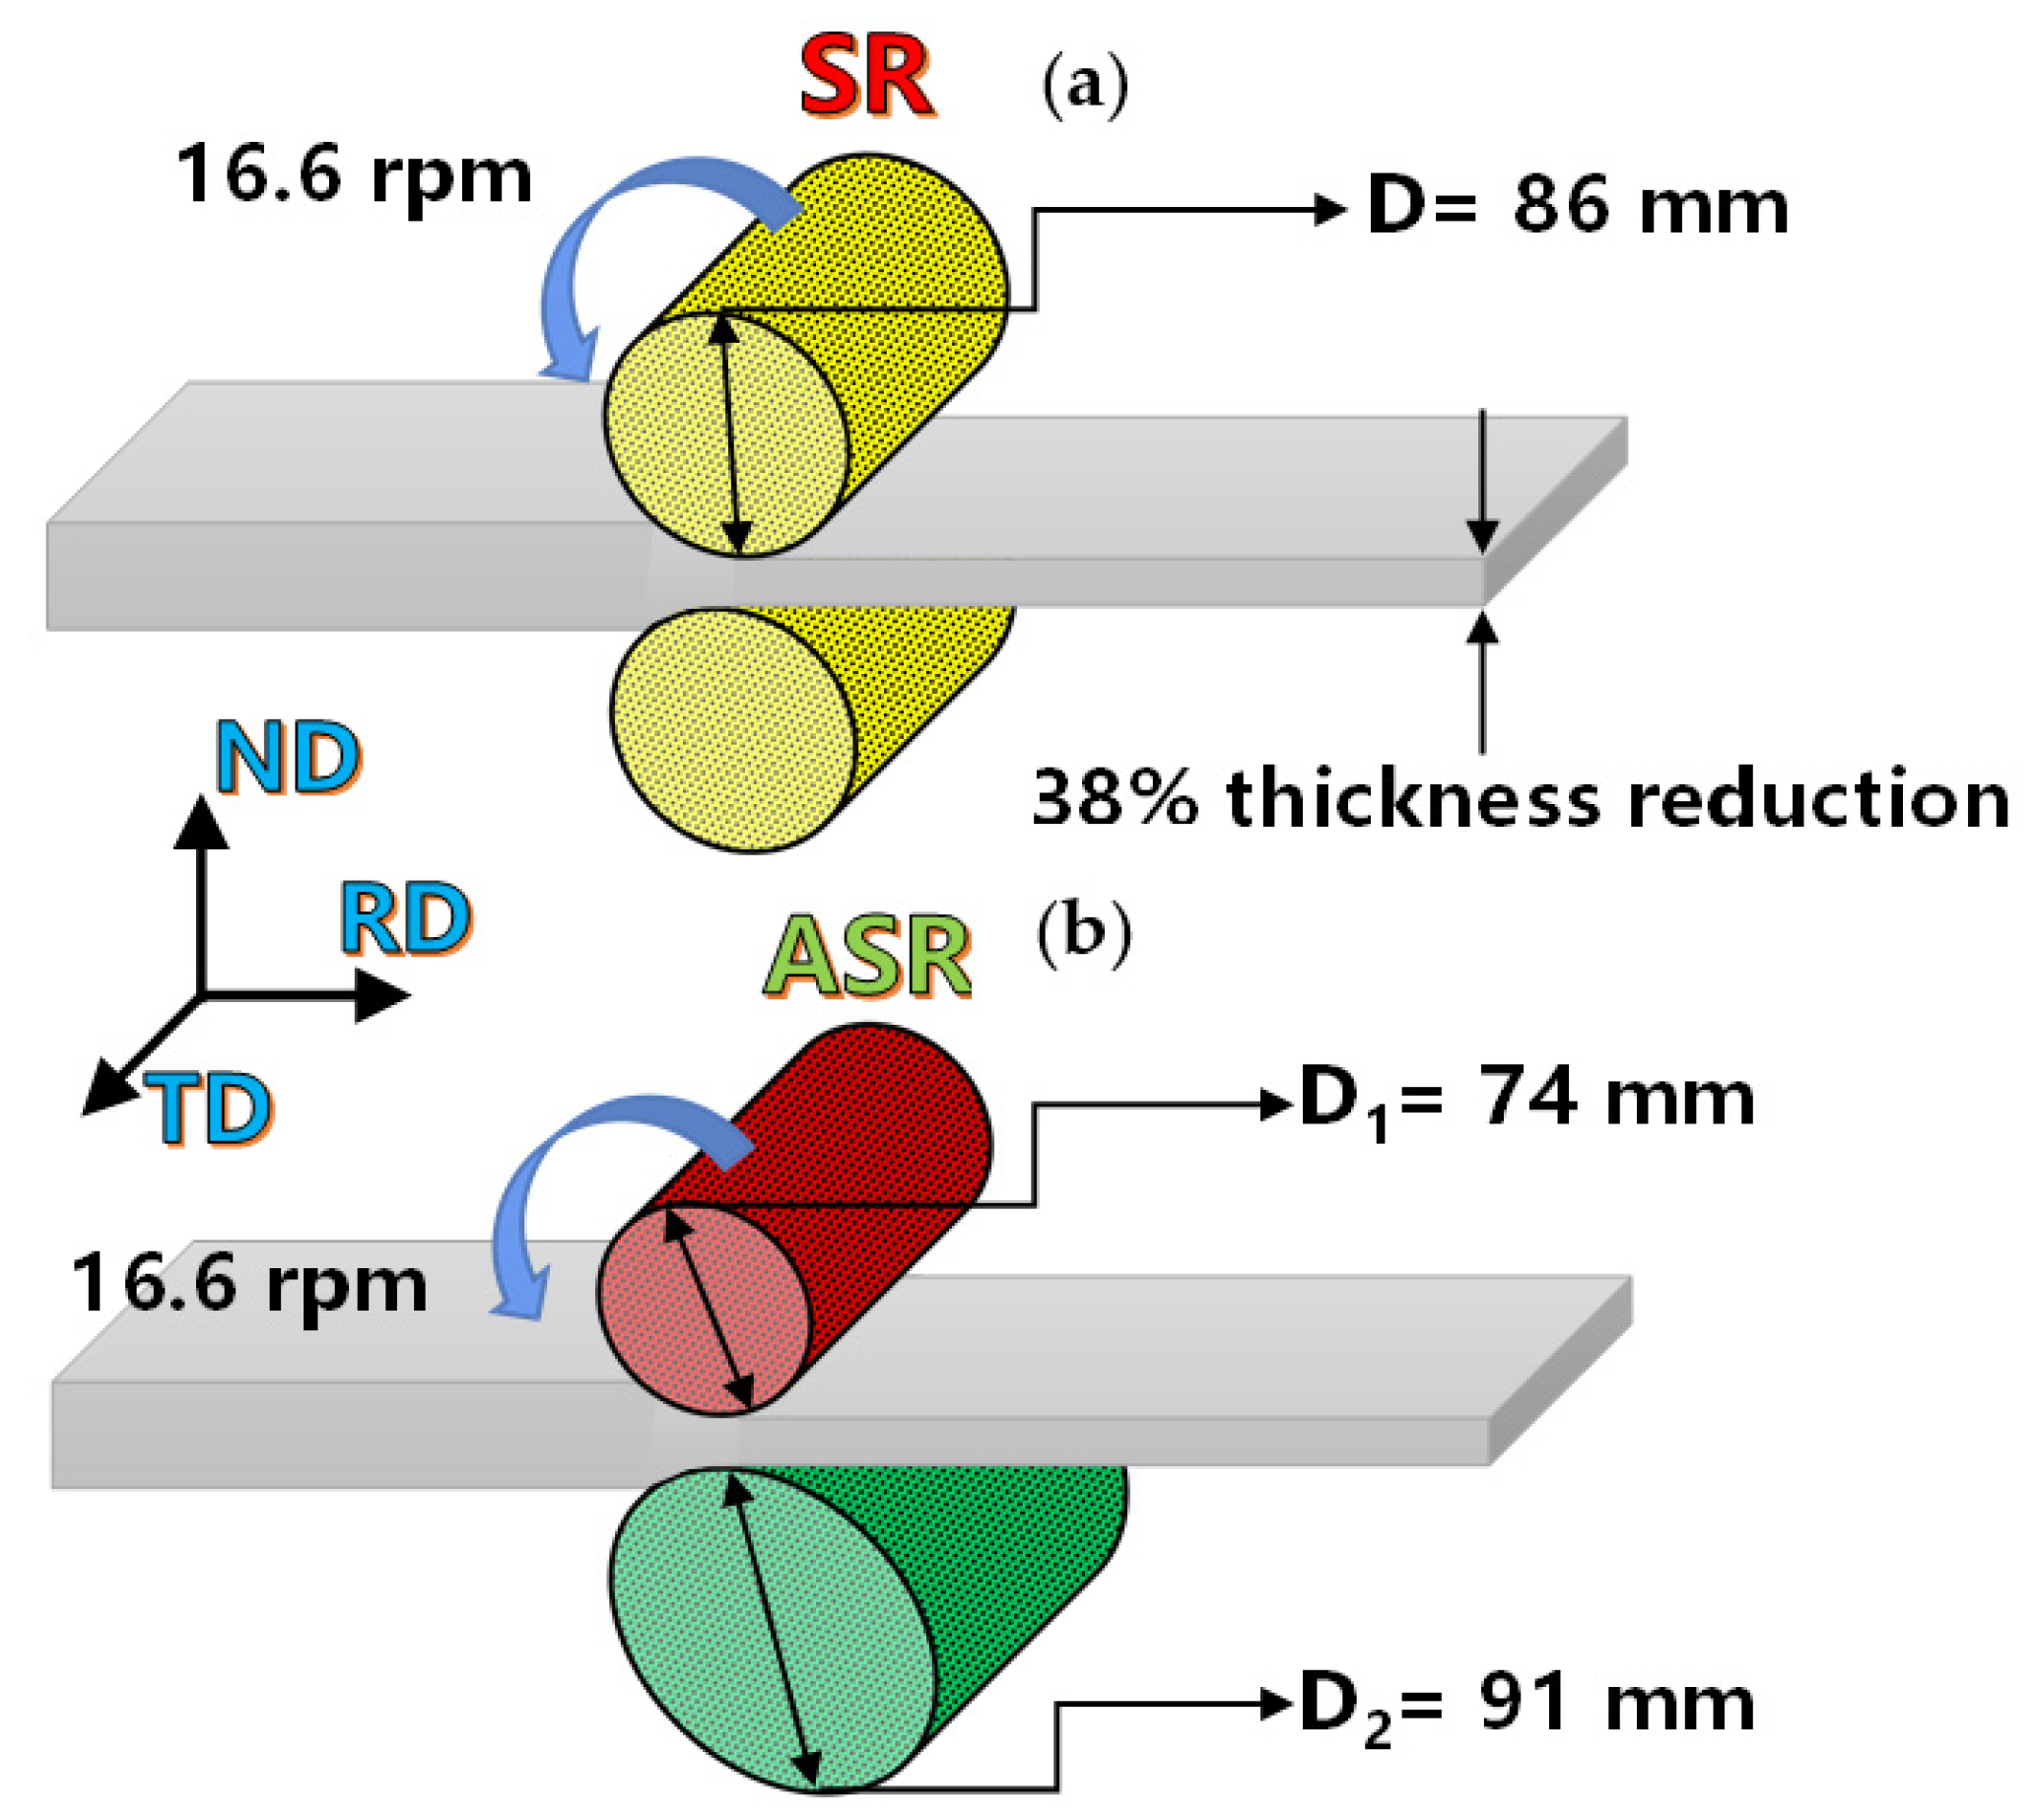
2.2. Rolling Process

Both rolling processes were conducted at room temperature using a rolling mill with a 16.6 rpm rolling speed. The roll diameters for the SR process were 86 mm. In contrast, the ASR process utilized two rollers with diameters of 91 mm and 74 mm, as indicated in Figure 1 (these values guarantee a good bite of the sheet and avoid slipping between the contact surfaces of the sheet and rolls). The total thickness reduction of 38% was achieved through repeated rolling passes of 25 μm thickness reduction each. All specimens were consistently inserted in the same orientation and direction. Therefore, the equivalent strain for the SR and ASR processes can be evaluated through Equations (1)–(3) [29,30].
ε S R = 2 3 l n ( 1 1 r )
ε S h e a r = 2 3 ( 1 r ) 2 r ( 2 r ) tan φ · l n 1 1 r
ε A S R = ε S R 2 + ε S h e a r 2
where ε S R represents the rolling equivalent strain, ε S h e a r is the shear strain, ε A S R is the equivalent asymmetrical strain, r is the thickness reduction, and φ counts as the apparent shear angle. Hence, the SR equivalent strain considering a 38% thickness reduction is 0.55.
On the other hand, the equivalent strain of the ASR process is dependent on the shear and rolling strain components, as shown in Equation (3). The shear component is a function of the apparent shear angle, which can be calculated using an array of indentation marks or painted lines, as displayed in Figure 2a,b, respectively. For this purpose, four lines of several indentations were created across the sheet thickness using different loads. The indentation marks were observed using an optical microscope ZEISS Axio Vert.A1. Through the comparison of the indentation marks and the painted lines before and after deformation, an apparent shear angle of ~18° was determined (see Figure 2). Thus, the calculated shear component according to Equation (2) is 0.11, giving rise to an equivalent strain in the ASR process of 0.56 following Equation (3).

2.3. Microstructure and Texture Characterization

The microstructure and texture were analyzed by EBSD and EDX, using an integrated TSL-OIM EDAX EBSD system mounted on a FEG SEM Quanta 200 electron microscope (manufactured by ThermoFisher scientific, Waltham, MA, USA operating at 15 kV and 70° tilt with a 15 mm working distance). For this purpose, first, specimens were cut from the transversal direction (TD) plane (or rolling direction (RD)–normal direction (ND) plane). Then, samples were mechanically polished using 2500 grit silicon carbide (SiC) paper to 0.03 μm colloidal silica suspension, per standard metallographic procedures. Next, EBSD measurements were performed on the as-received (AR) and deformed specimens across the whole sheet thickness. Five EBSD maps named S1, S2, S3, S4, and S5 were obtained across the sheet thickness to evaluate the texture and microstructure gradients.
During EBSD measurements, scanning step sizes of 1 and 0.2 μm were used. The EBSD data were processed using TSL-OIM (version 7.3b) and the MatLab MTEX toolbox open-source code (version 5.6.0) [31]. A maximum misorientation threshold angle of 5° was utilized in the oriented image microscopy (OIM) analysis software for grain size calculation, as was a clean-up procedure based on grain dilatation with a minimum grain size of 4 pixels. Grain size and kernel average misorientation (KAM) profiles were constructed over the sheet thickness taking average measurements over the width of the map every 0.5 µm (for more details of KAM profiles, see [32]). Geometrically necessary dislocations (GNDs) were calculated from two-dimensional EBSD maps using Nye’s tensor [33]:
ρ G N D ( 2 D ) = 1 b   α 12 2 + α 13 2 + α 21 2 + α 23 2 + α 33 2
where α represents the tensor components and b represents the Burgers vector for Al (2.85 × 10⁻¹⁰ m−2). From two-dimensional mapping, five components of the Nye’s tensor can be assessed, and a scalar magnitude for the GNDs is obtained applying Equation (4).

2.4. Mechanical Properties and Crystal Plasticity Modeling

Tensile tests were carried out at room temperature with a universal testing machine Instron 3362 (manufactured by Instron, Norwood, MA, USA) at a constant strain rate of 1 × 10⁻³ s−1. Electrode discharge machining ((EDM) manufactured by MAKINO, Mason, OH, USA) was used to cut bone shape samples with gauge dimensions of 12 mm × 3 mm × 4.5 mm. Vickers scale hardness profiles were obtained across the sheet thickness using a micro-durometer KMHV2000Z (manufactured by PACE TECHNOLOGIES, Tucson, AZ, USA), applied load of 0.9 N, and dwell time of 15 s.
The plastic behavior was evaluated through the visco-plastic self-consistent (VPSC) model developed by Molinary et al. [34] and Lebensohn et al. [23]. This model considers the grain as an ellipsoidal inclusion embedded in a homogeneous environment. The model is based on the mechanisms of slip and twinning systems activated by a resolved shear stress. Then, the model returns the macroscopic stress–strain response and the texture evolution after the simulation is complete. The reader is referred to [35] for more details of the code files and structure. For the material hardening, the 12 { 111 } 110 slip systems were defined, and a Voce-type law was used, as indicated in the following equation:
τ s = τ 0 s + ( τ 1 s + θ 1 s Γ ) ( 1 e x p ( Γ | θ 0 s τ 1 s | ) )
where τ s is the threshold resolved shear stress; Γ is the accumulated shear strain in each grain; and τ 0 s , θ 0 s , θ 1 s , and ( τ 0 s + τ 1 s ) represent the initial critical resolved shear stress (CRSS), the initial hardening rate, the asymptotic hardening rate, and the back-extrapolated CRSS, respectively. Table 2 presents the values used for the simulations.
Texture evolution and tensile test curves before and after rolling were simulated to verify the fitting of the VPSC model to experimental data. Other important parameters for running the simulations are the boundary conditions, such as the strain and the stress components. In this investigation, the SR process was simulated under the plane-strain condition, where the thickness reduction causes the absolute value of strain. Thus, the difference between SR and ASR processing depends on the normalized velocity gradient for rolling conditions, which can be described as follows:
[ 1 0     x 0 0     0 0 0 1 ]
where x represents the shearing effect. That is, if x = 0 , we are dealing with the SR process, while x 0 means an ASR process. The value of x is a relationship between the shear and the normal strain component, as shown in Equation (7).
x = ± γ 13 ε 33
where the shear component can be calculated from the apparent shear angle ( γ 13 = tan ( φ ) ), as shown before. The rolling test parameters for the VPSC model are indicated in Table 3.

3. Results and Discussion

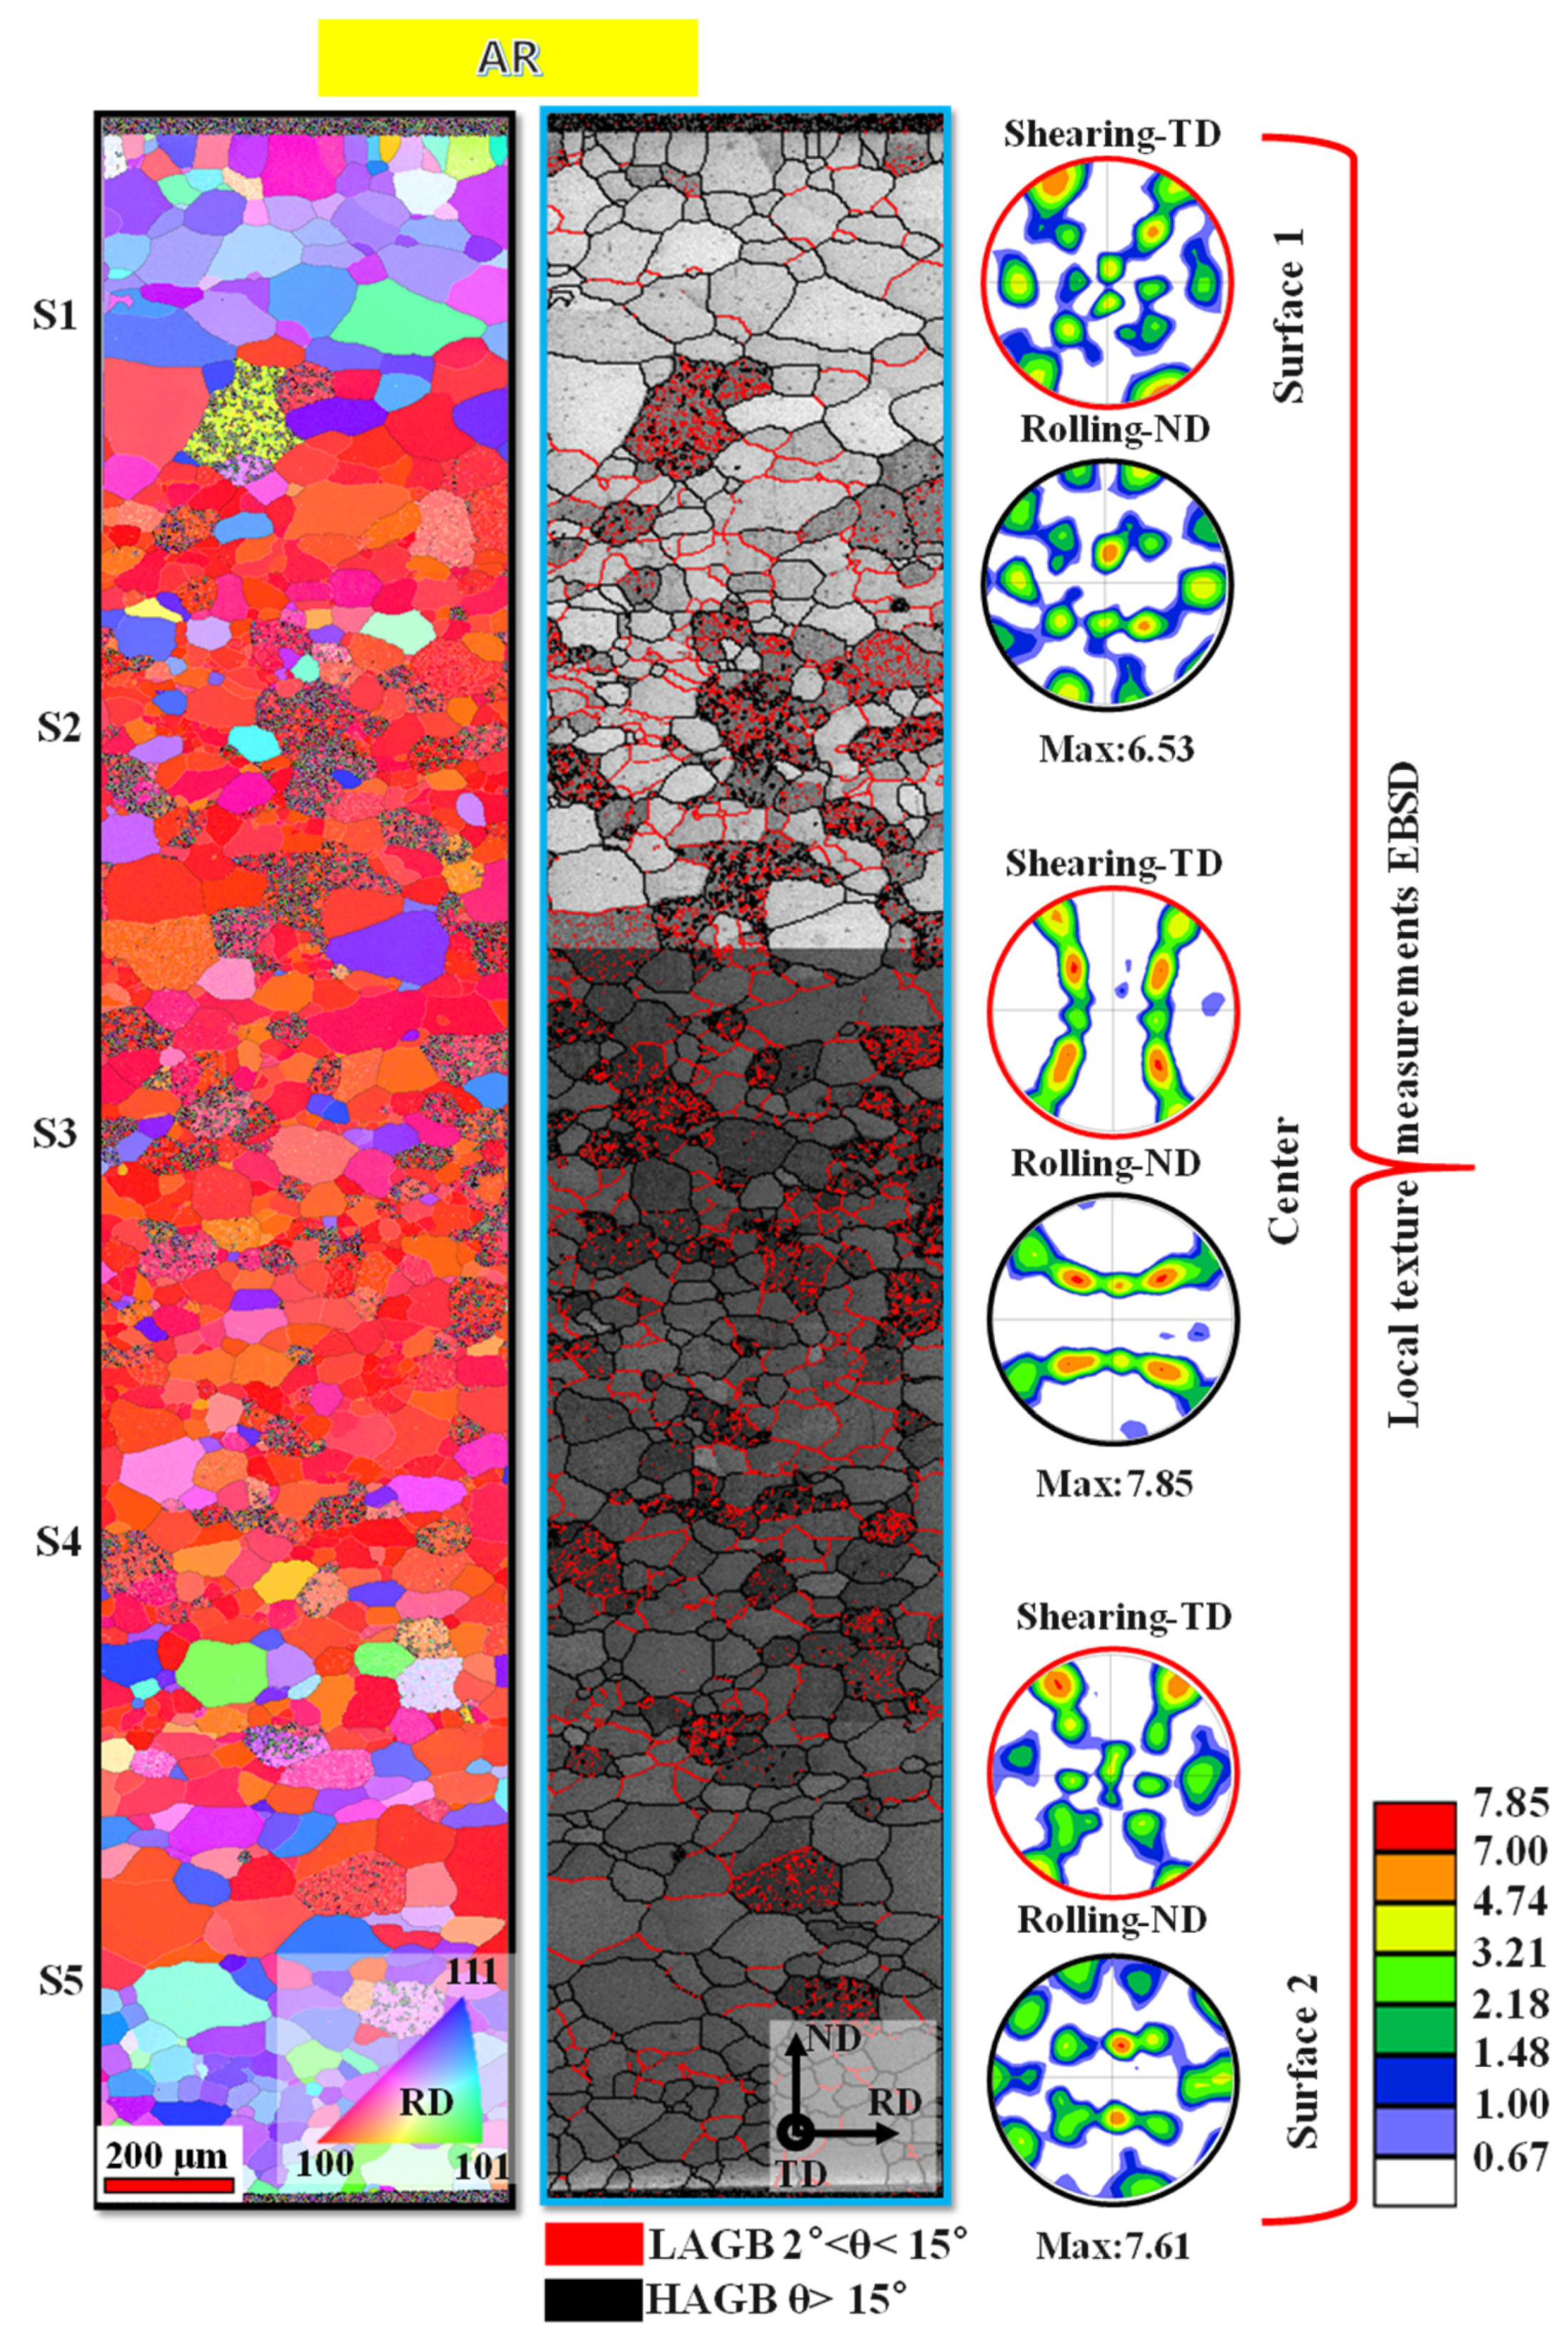
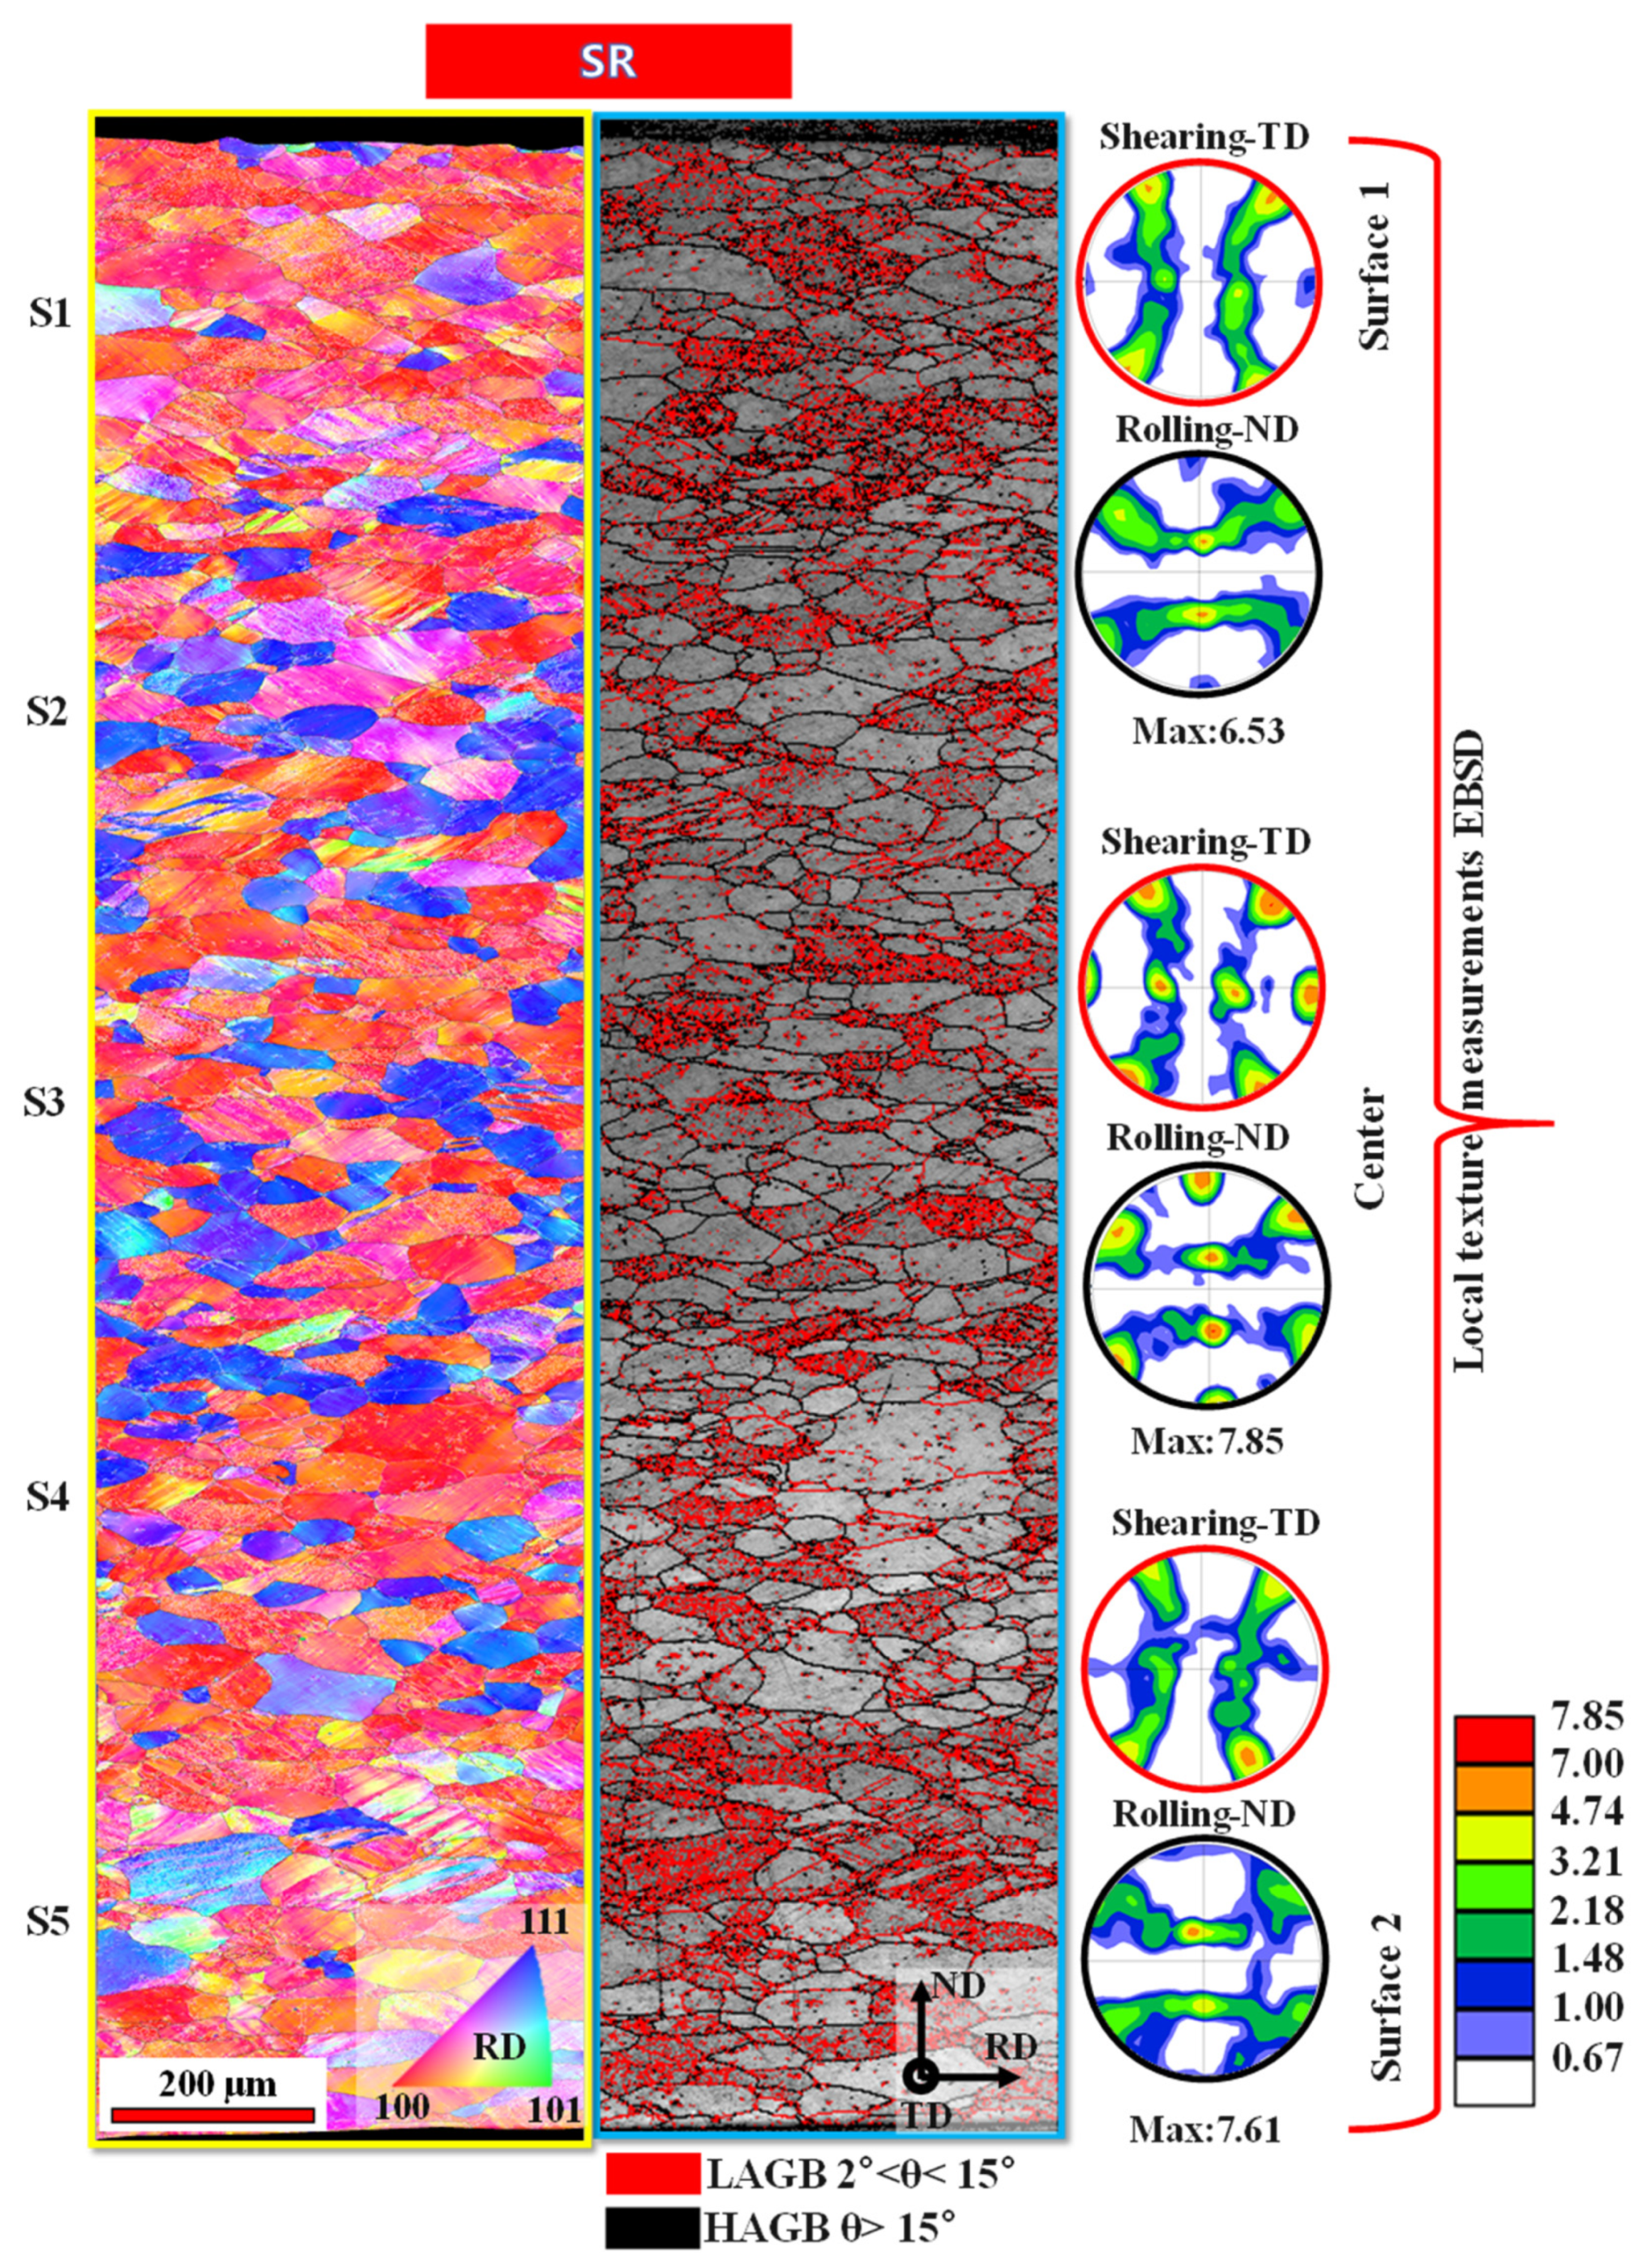
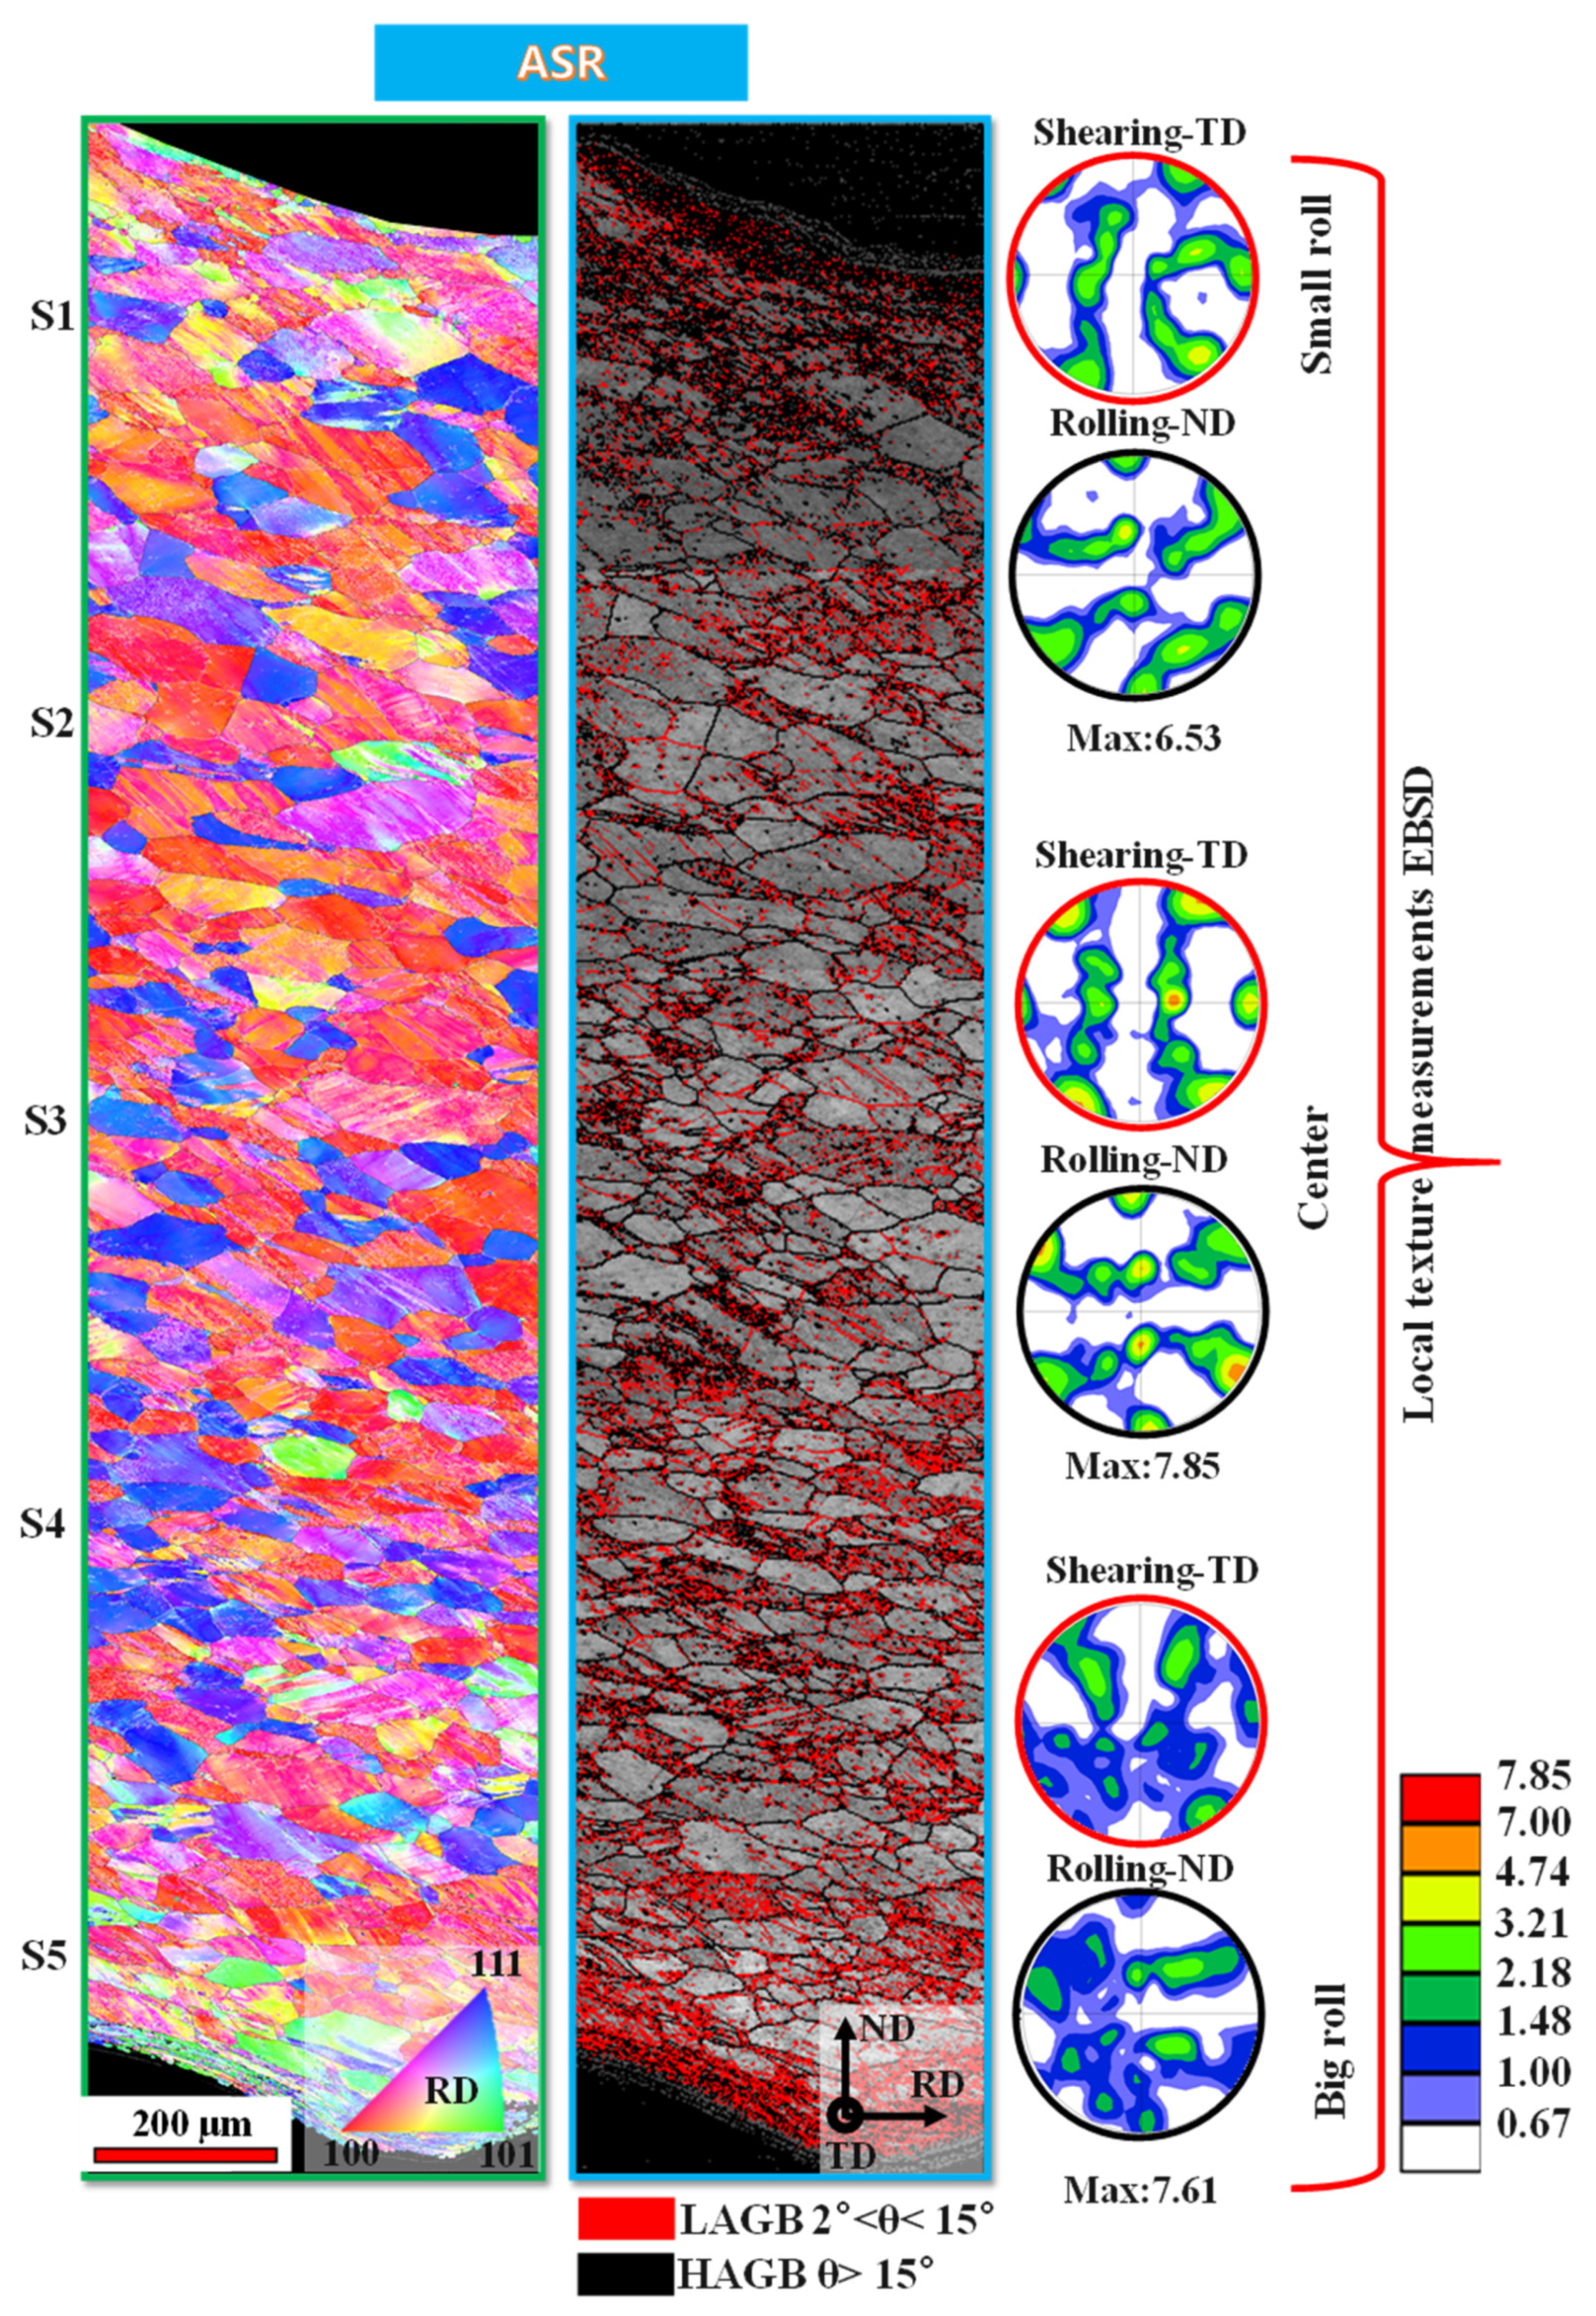
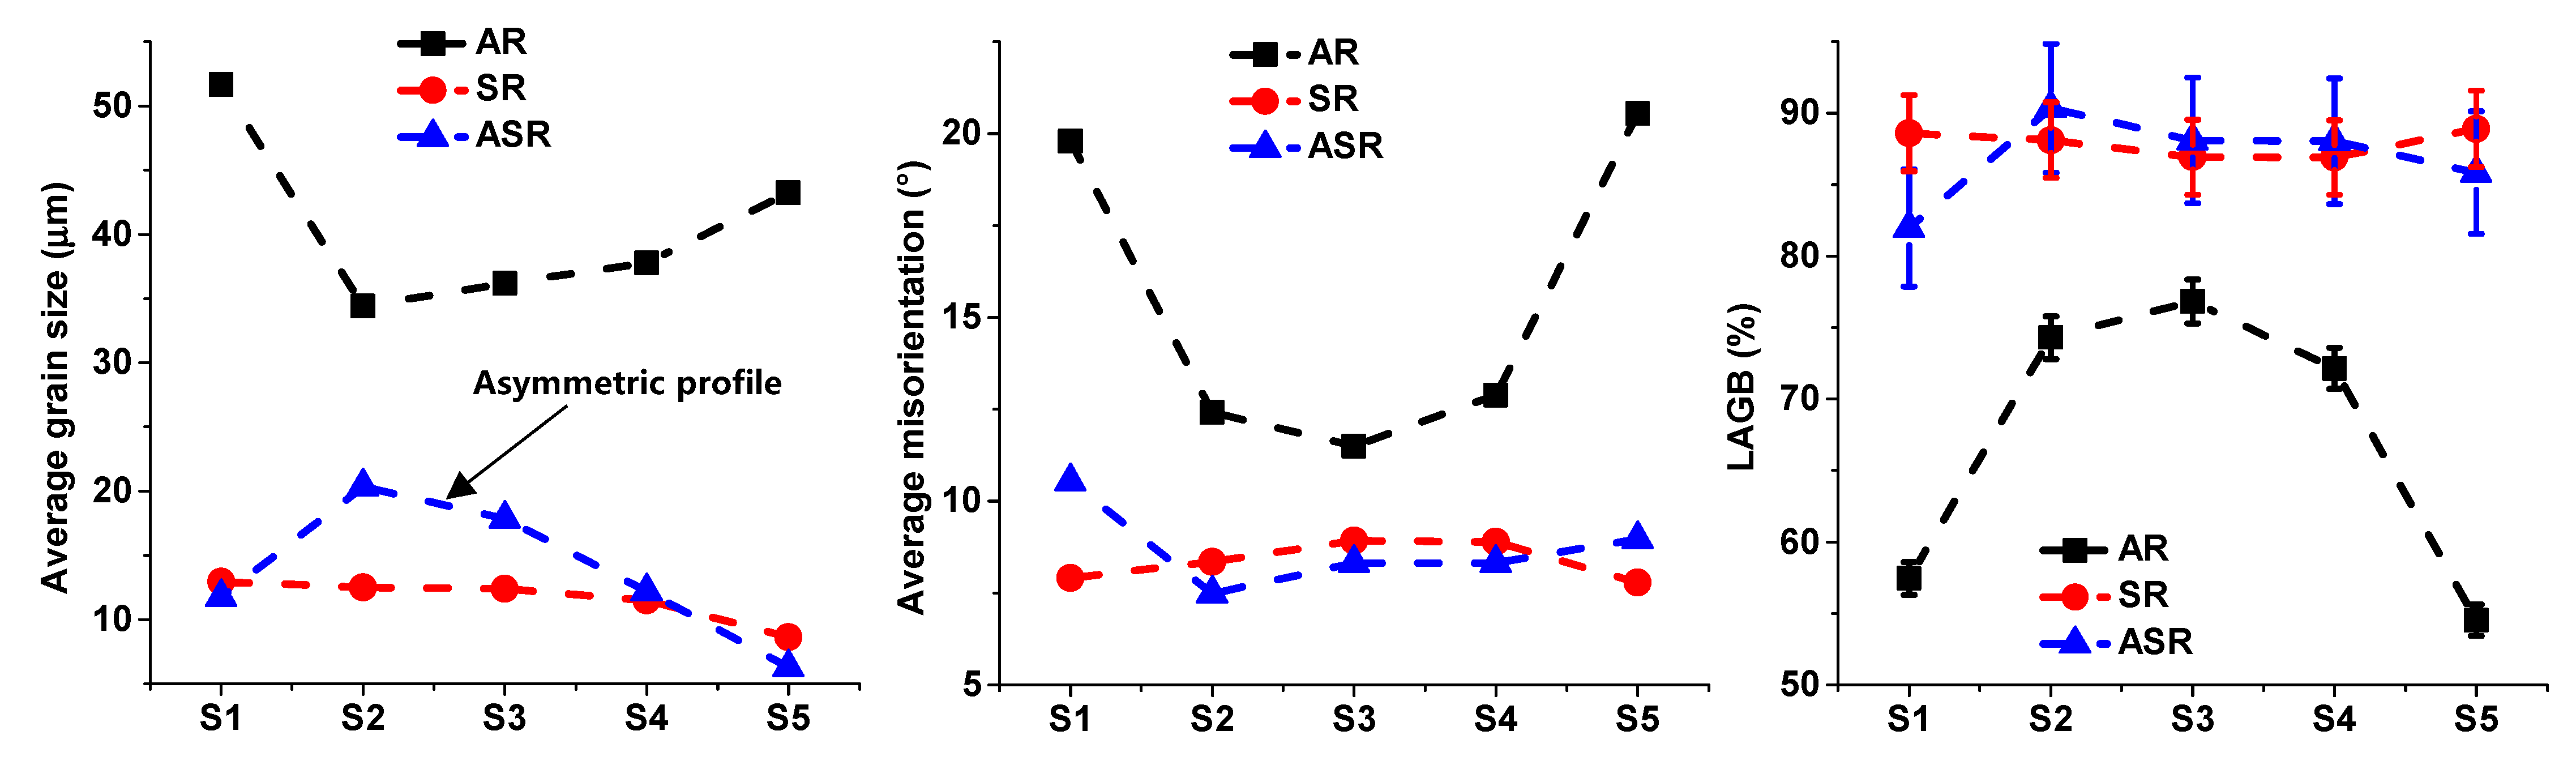
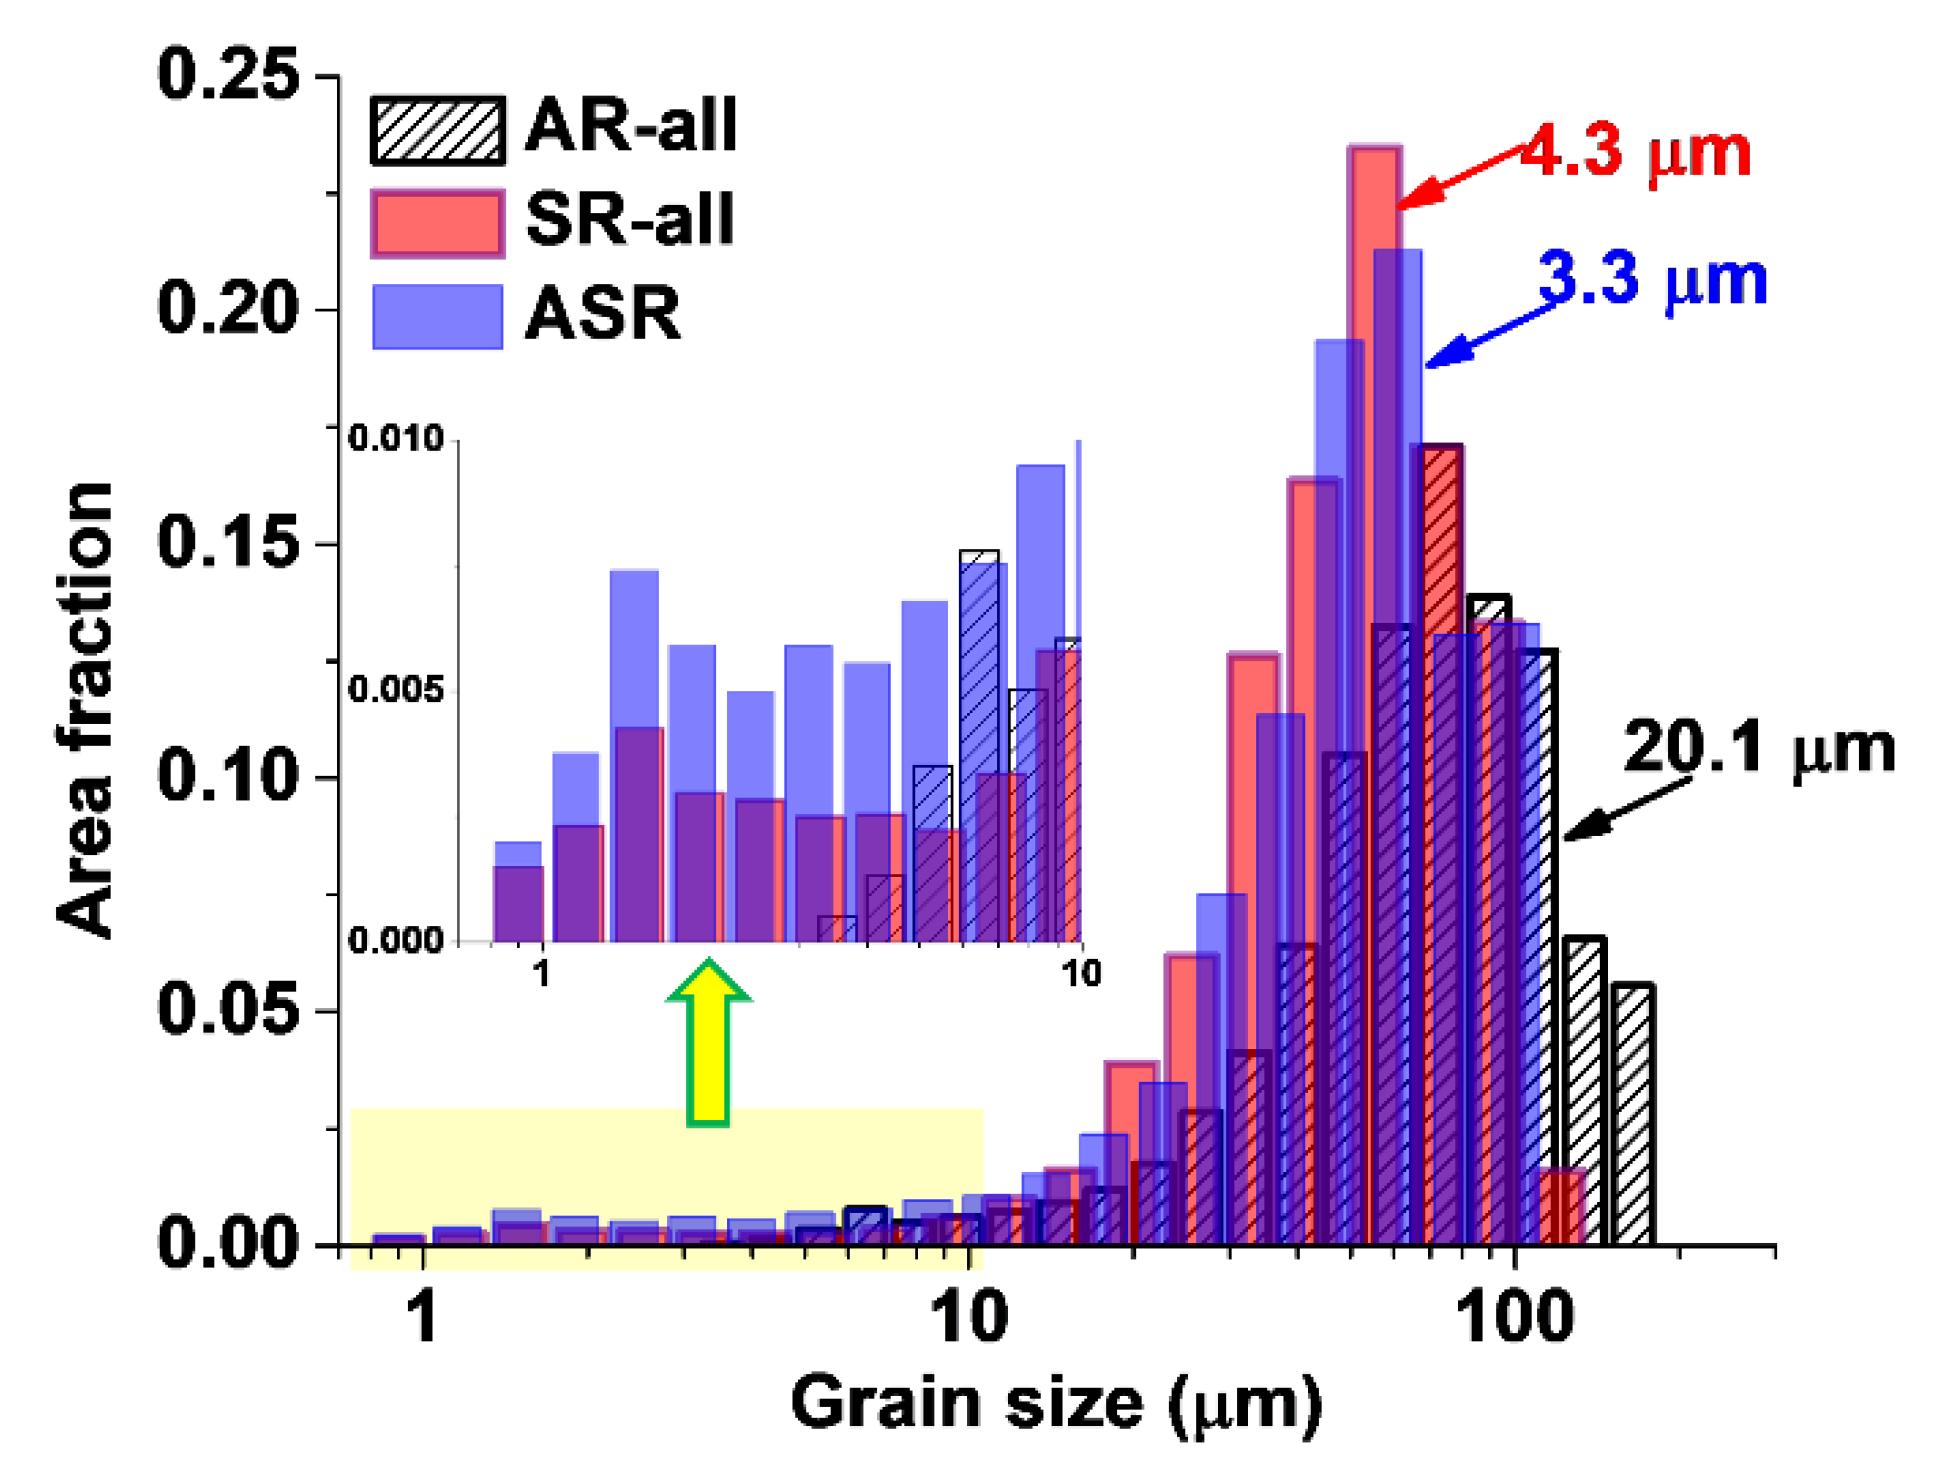
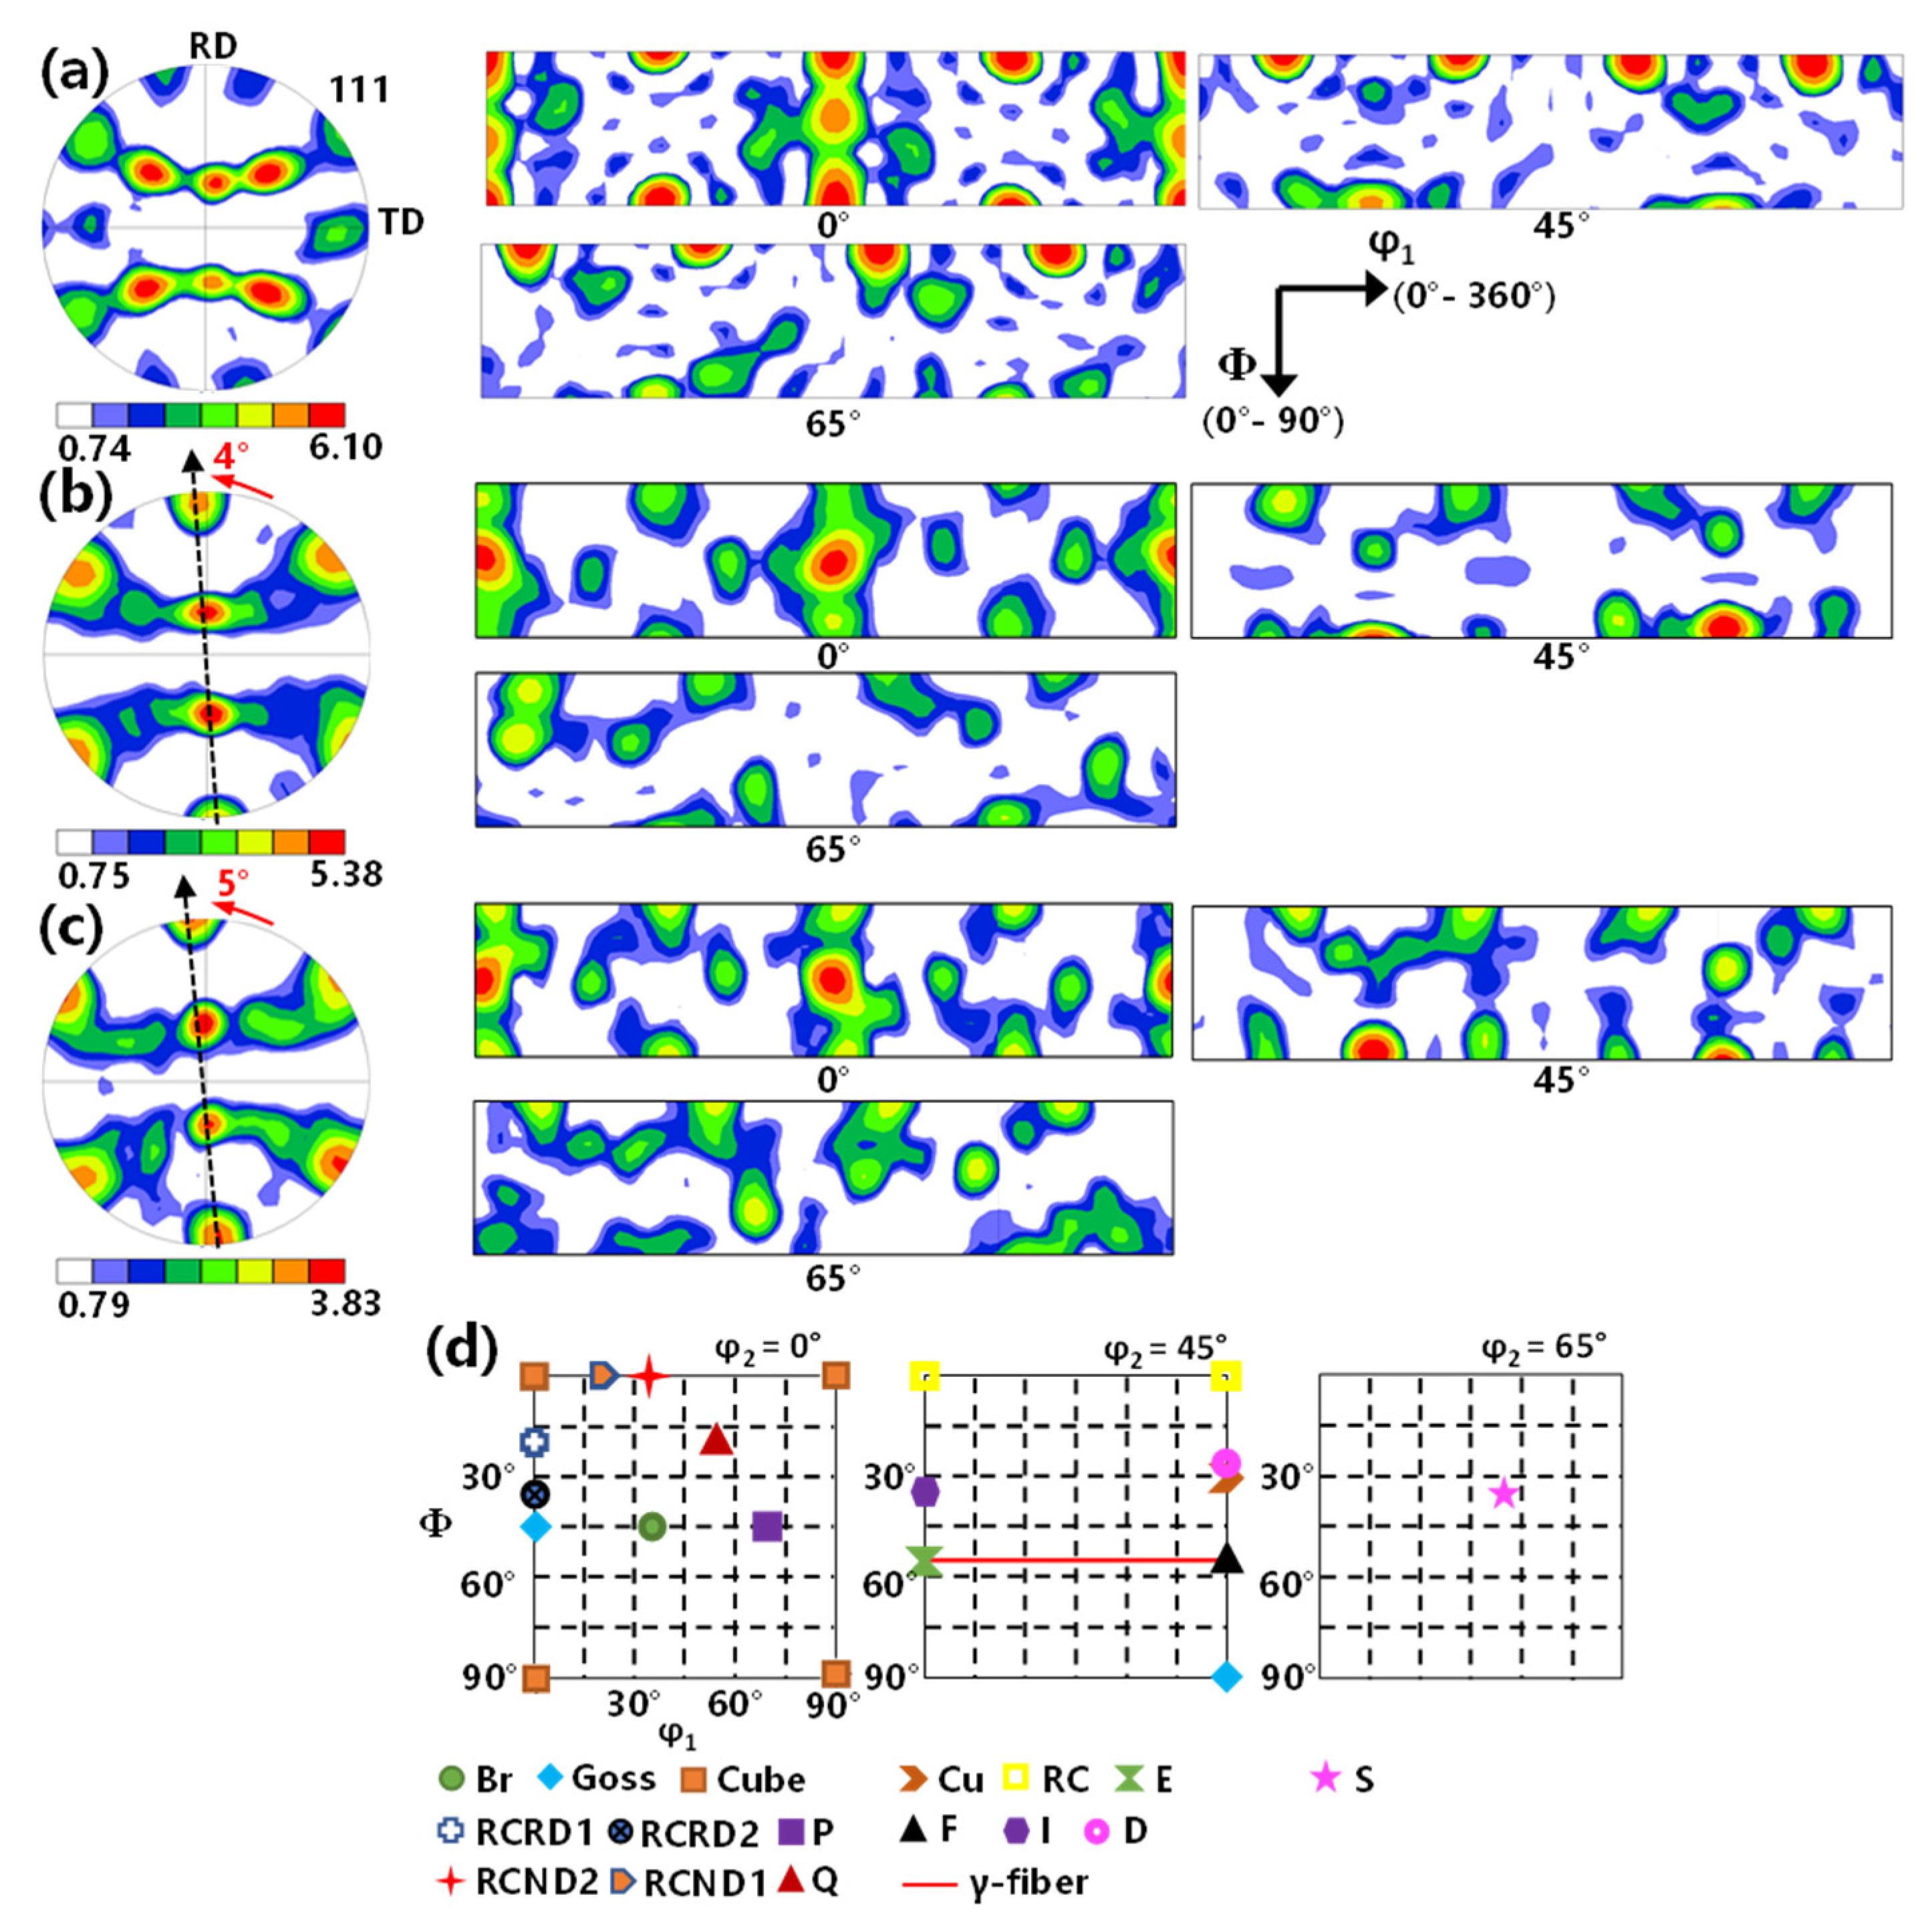
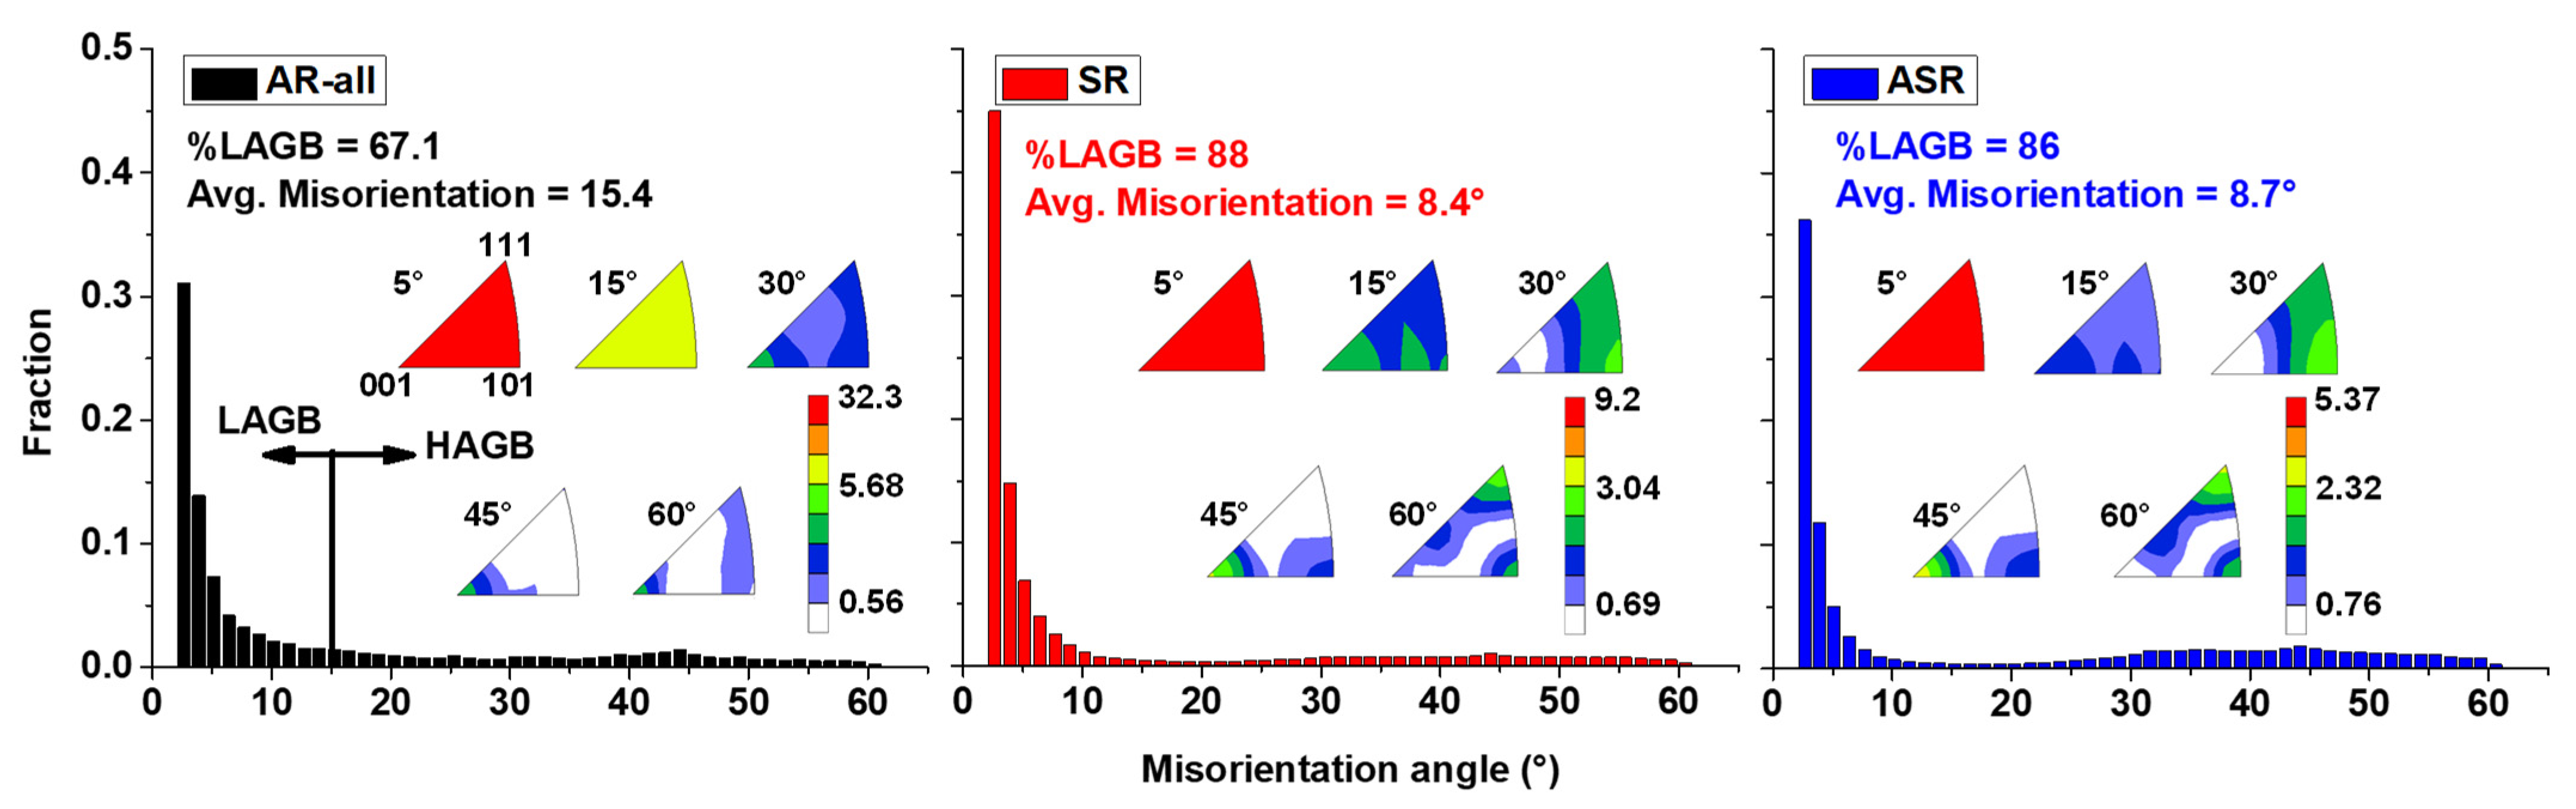
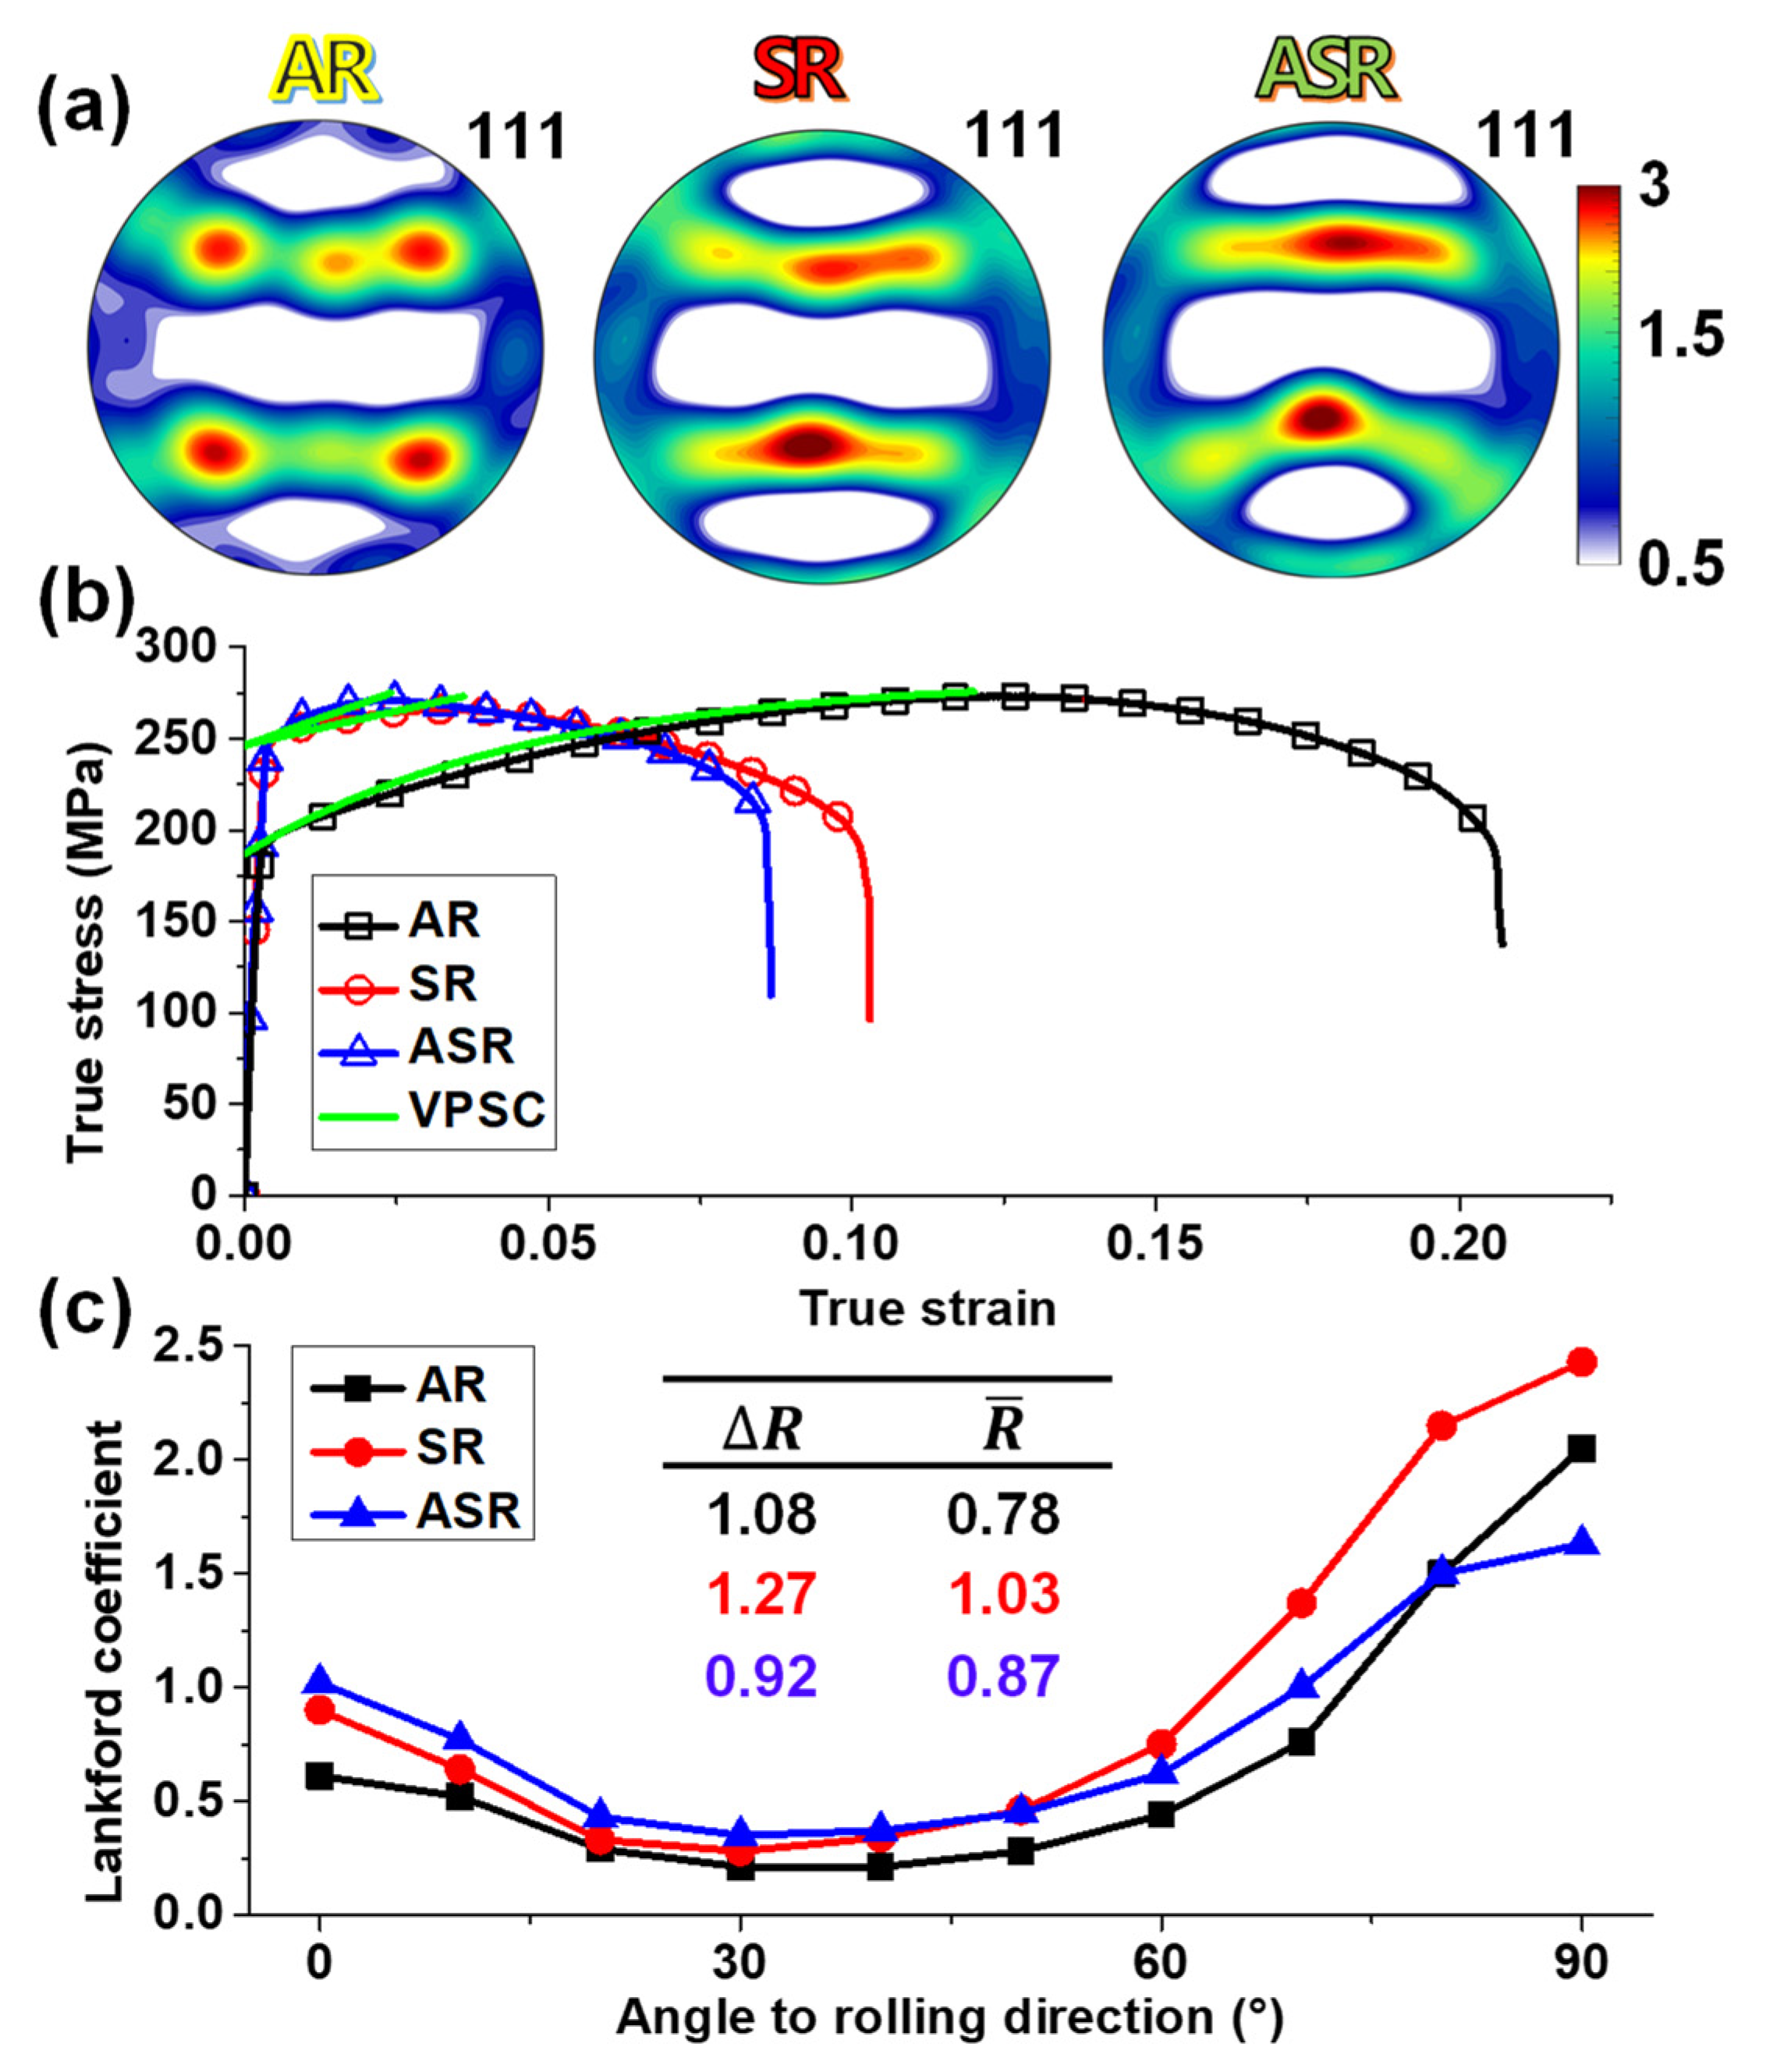
3.1. Microstructure and Texture

The microstructure analysis was performed on selected locations of the specimens named S1, S2, S3, S4, and S5. The inverse pole figure (IPF) maps, grain boundary maps, and pole figures of the AR, SR, and ASR specimens were obtained from the EBSD data. Figure 3, Figure 4 and Figure 5 depict the IPF maps, grain boundary maps, and pole figures of the AR, SR, and ASR specimens across the sheet thickness, respectively. In the image quality (IQ) maps, the high-angle grain boundaries (HAGBs) whose misorientation angle is >15° and low-angle grain boundaries (LAGBs) with a misorientation angle of 2° ≤ θ ≤ 15° are indicated in black and red colors, respectively. The microstructure of the AR specimen is composed of equiaxed grains with an average size of 41 μm (see Figure 3). Furthermore, a large number of particles was noticed inside certain grains, which can be explained by the aging effect [36].
After rolling processing, microstructure changes are more evident; both SR and ASR processes generate elongated grains showing uneven coloration according to the IPF maps, as illustrated in Figure 4 and Figure 5, respectively. This behavior is related to the grain fragmentation process occurring inside the initial grains. In this mechanism, the density of defects increases, forming micro-shear bands inside the grains with different orientations concerning the original grain. This behavior is also reflected in the material texture modification, as corroborated by the IPF maps and pole figures in Figure 4 and Figure 5.
Analyzing in detail the SR microstructure across the sheet thickness, Figure 4 suggests some texture and microstructure changes indicating a more homogeneous texture and grain size. This means the strain distribution after 38% thickness reduction is evenly distributed throughout the thickness of the sheet. For that reason, a well-defined rolling texture is observed in all the areas. The difference is a lower texture intensity in the surface vicinities than in the middle zone. Conversely, the material processed by ASR exhibits the largest microstructure and texture changes at S1 and S5 locations, i.e., near the small and big rolls, as the grain size and morphology are both significantly affected, as indicated in Figure 5. From this figure, it is evident that the shear effect of the ASR process is due to the velocity gradient between the rolls creating elongated and shear-strained grains concerning the rolling direction (RD). In addition, the shear effect also creates more randomly oriented grains near the surfaces, as the pole figures indicate lower intensities with no well-defined rolling texture components. Moreover, the shear strain also affects the center zone, generating a counterclockwise texture twist around the ND.
The above observations confirm the heterogeneity deformation state through the sheet thickness as well as the grain refinement promoted by the ASR processing due to the more intense shear deformation. Deformation processes involving shear strain components are well known for reaching smaller grain sizes than monotonic processes for the same strain magnitude. This is because shear strains break the grains’ preferential orientation, giving rise to random orientations, which is one of the reasons why severe plastic deformation techniques allow for more considerable grain refinement than conventional processing routes [37].
For the five investigated locations (S1 to S5), Figure 6 indicates the average misorientation, average grain size, and LAGB fractions before and after rolling processes. Compared to the AR specimen, it is evident that the average misorientation, average grain size, and HAGB fractions were reduced in the SR and ASR processed specimens. After SR, the different microstructural characteristics seem to be homogeneous in all the analyzed zones across the sheet thickness. For example, the grain size of the SR specimen slightly changed throughout the sheet’s thickness, having values of 12.9 μm, 12.5 μm, 12.4 μm, 11.5 μm, and 8.6 μm for the edges S1 through S5 (standard deviation of 1.7 µm), respectively. The ASR specimen achieves the opposite result, where all the microstructure characteristics show heterogeneous and asymmetric behavior. Due to the velocity gradient between the rolls, the ASR specimen shows quite the opposite, with average grain size values of 11.7 μm, 20.3 μm, 17.8 μm, 12.2 μm, and 6.3 μm at S1, S2, S3, S4, and S5 (standard deviation of 5.5 µm), respectively. Therefore, it may be deduced that the ASR sample has a heterogeneous grain size with the lowest values close to the regions S1 and S5. In addition, the grain size tends to decrease towards the S5 area from the area S2, confirming an asymmetric profile (see Figure 6).
In addition to grain refinement, grain boundary misorientation is another property affected by the ASR process. Accordingly, it is evident that the ASR specimen contains more HAGB fractions at S1 and S5, while the SR process presents less scatter between the five zones, as shown in Figure 6. The same behavior is observed for the average misorientation, suggesting a faster grain boundary evolution from LAGBs to HAGBs on the surfaces than in the middle zone. According to Zhao et al. [38], increasing accumulative equivalent strain allows subgrains to coalesce, reducing the LAGB fractions and enhancing the HAGB fractions. Muñoz et al. [13] reported similar results while studying low-carbon steel produced by the SR and ASR processes with larger GND densities near the sheet surfaces than in the middle zone. This accumulated misorientation phenomenon obeys the continuous dynamic recrystallization (CDRX) mechanism, where grain refinement is obtained from dislocation movement and grouping.
When it comes to the overall average grain size behavior, Figure 7 indicates a grain size reduction from 20 µm to 4.4 µm and 3.3 µm after SR and ASR processing, respectively (the average values were calculated given the number of grains instead their area weight). Although the grain size distributions do not reflect such differences between the AR material and the rolled ones, this is explained by the number of grains smaller than 10 µm in each material, as suggested by the inset coming from the yellow shading in Figure 7. This behavior corroborates the faster grain fragmentation, mainly around the sheet surfaces, due to the more intense and heterogeneous shearing strain in the ASR than in the SR process.
In terms of overall texture, Figure 8 represents the alloy’s texture as pole figures (PFs) and orientation distribution functions (ODFs). Thus, Figure 8a indicates that the AR sheet texture is dominated by Cube and Goss texture components, as corroborated by the ODF and the ideal orientation representation in Figure 8d. These components have been associated with the recrystallization phenomena in Al alloys processed by rolling [24,39]. On the other hand, when the sheet was rolled symmetrically and asymmetrically, a similar overall behavior was observed, as shown in Figure 8b,c. It is worth mentioning that both processes reduce the Cube component intensity while the Goss component is strengthened. Another visible observation after rolling, either by SR or ASR, is the counterclockwise twist around the ND. This could be related to the multiple rolling passes to reach the 38% thickness reduction. At first glance, the overall texture of the processed sheets seems to be dominated by the components far from the surfaces (i.e., texture in the middle zone), especially for the ASR process. However, it is important to consider that the overall texture intensity decreases more with the ASR processing than with the SR concerning the AR material, as indicated in Figure 8. This behavior can be a consequence of the texture randomization near the surfaces by the ASR process, as indicated in Figure 5.
Regarding the grain boundary nature, Figure 9 compares the misorientation angle distributions and the misorientation axes for all the analyzed conditions. This figure highlights a higher fraction of LAGBs after SR and ASR processing than in the AR material. This behavior is also indicative of grain fragmentation induced by plastic deformation. Thus, the original grains are subdivided by grouping dislocations that give rise to dislocations walls which can evolve into LAGBs or HAGBs depending on the plastic strain magnitude. Several researchers have described this grain fragmentation mechanism as a recrystallization phenomenon at low temperatures without nucleation called continuous dynamic recrystallization [40,41]. In this context, the misorientation axis distribution suggests that grain boundaries follow the same path in both processes. The difference comes from the rate at which the change occurs. Accordingly, the ASR process produces a faster change from LAGBs to HAGBs than the SR. The previous affirmation is corroborated by the larger average misorientation and the lower grain boundary texture intensity shown in the misorientation axis distribution in the ASR process.

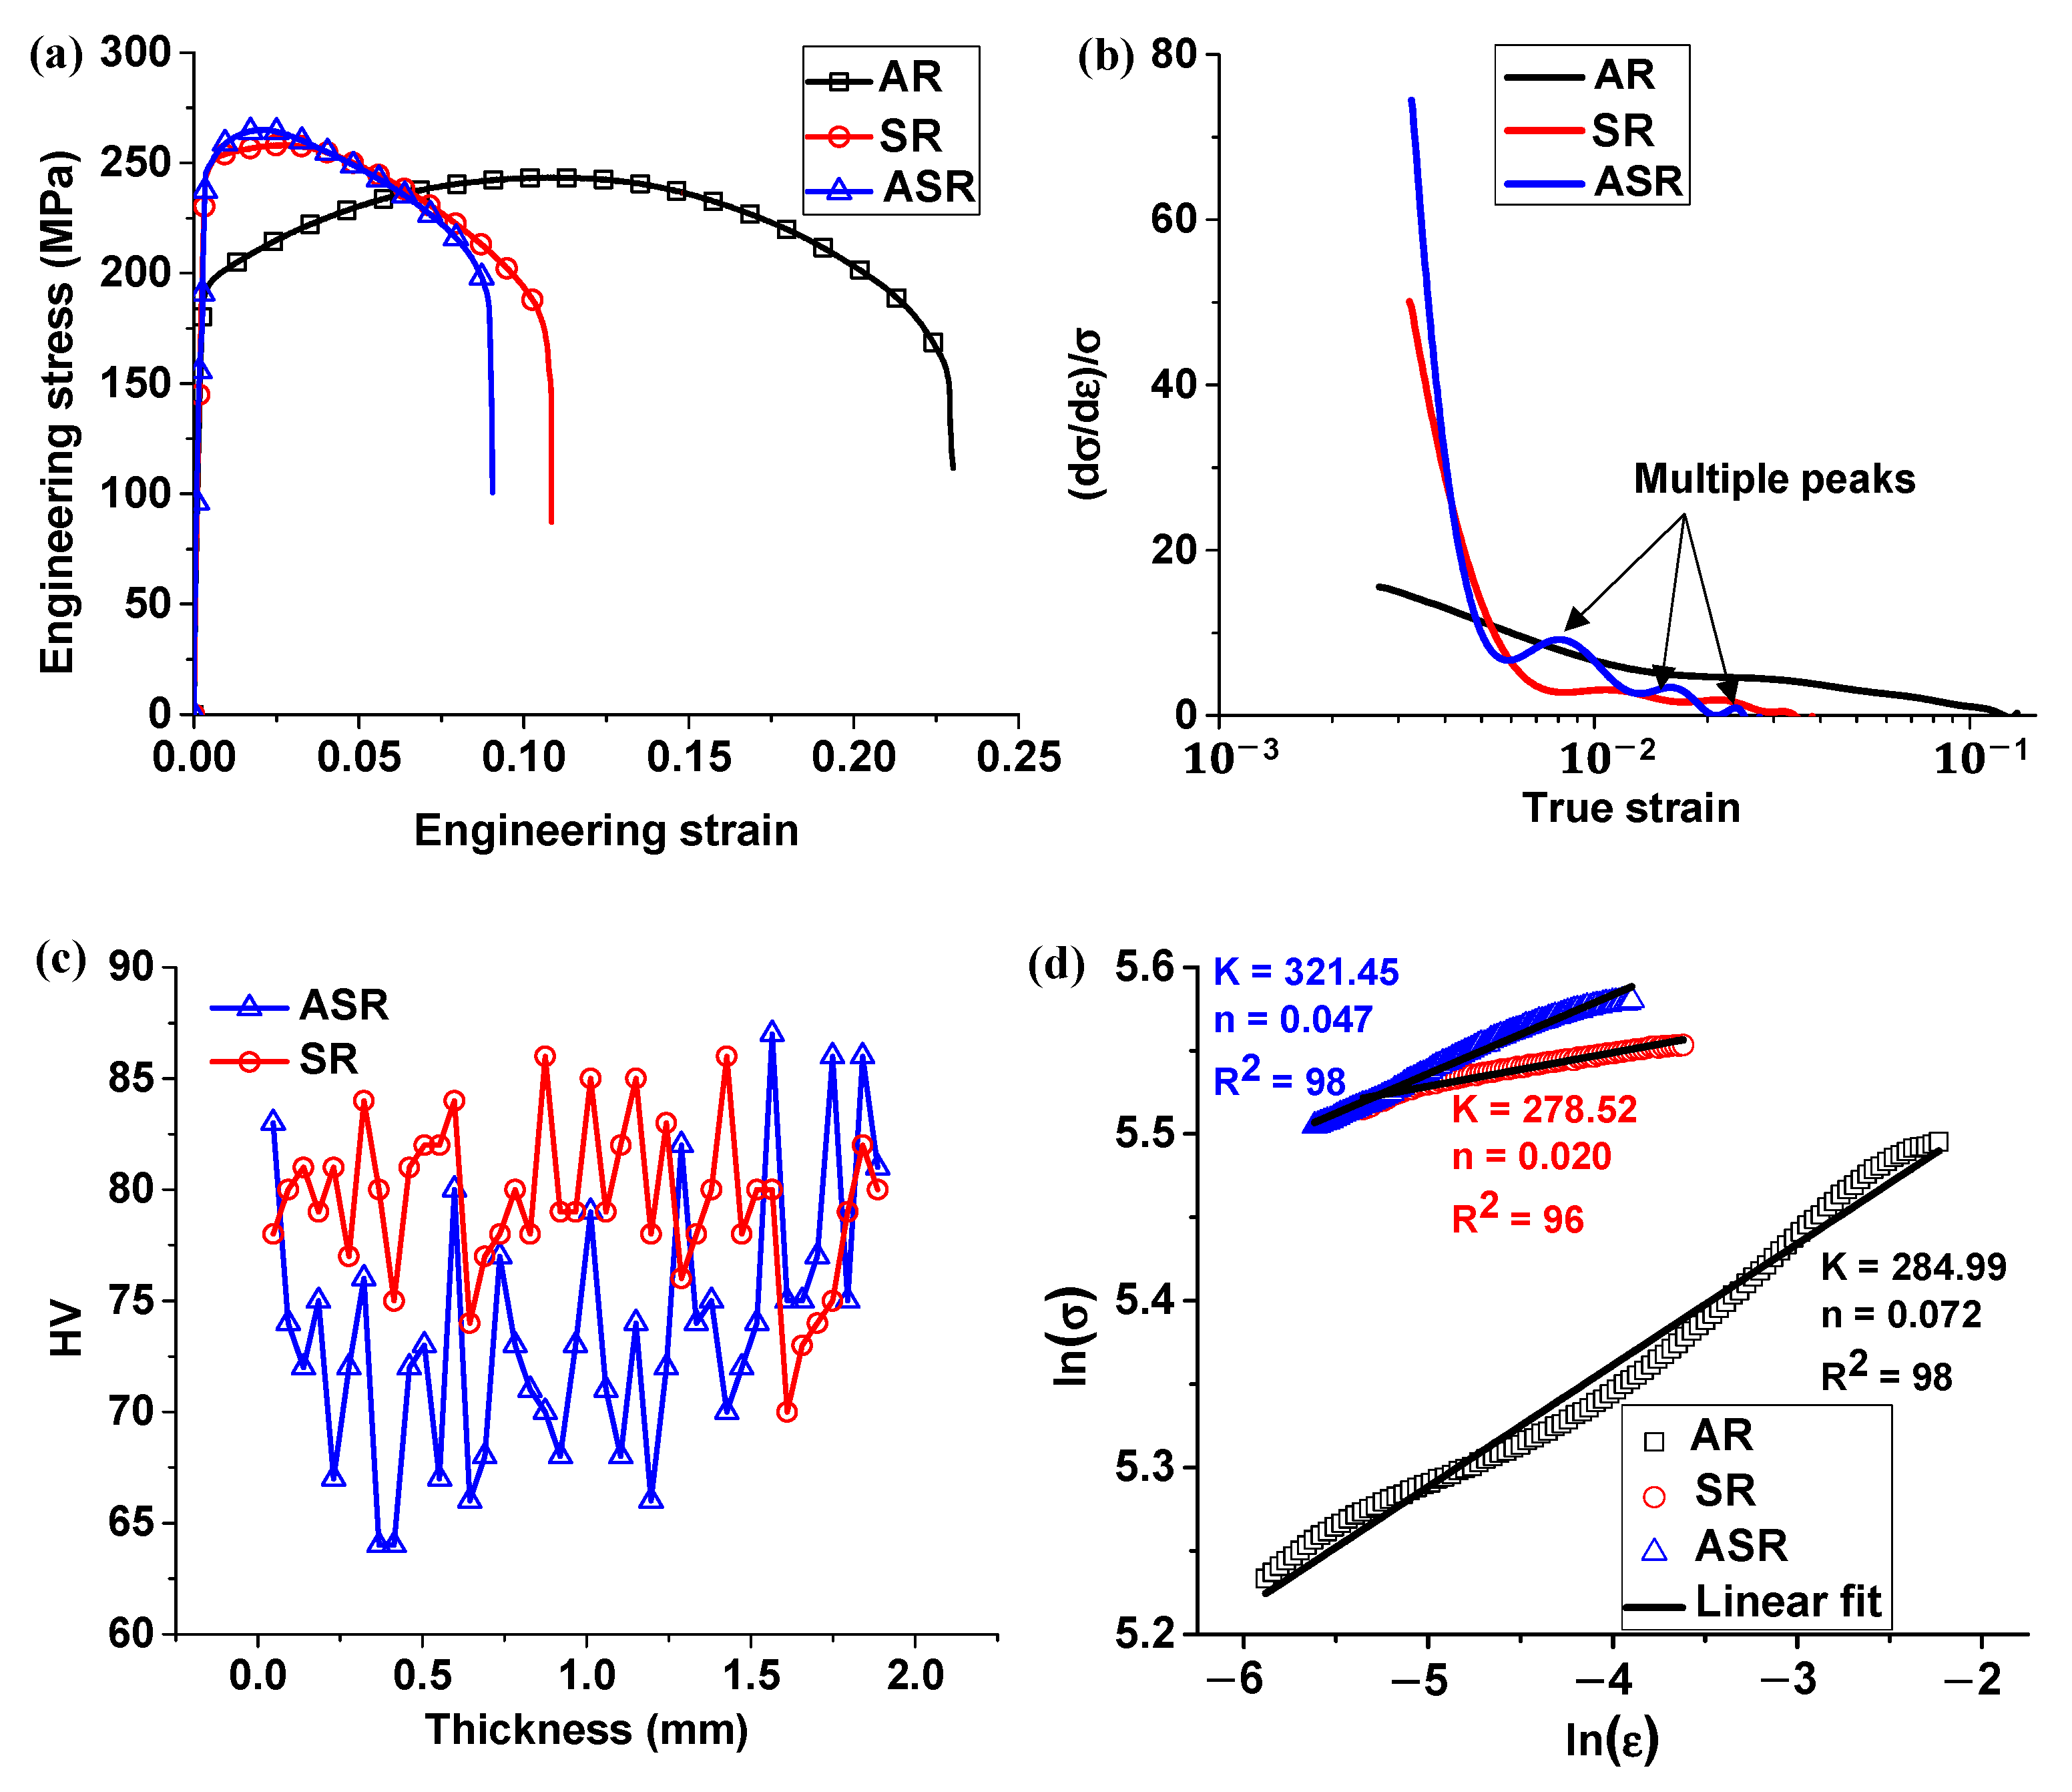
3.2. Mechanical Properties

The engineering stress–strain curves of the tensile tests of the AR, SR, and ASR specimens are depicted in Figure 10a. As observed in this figure, the ASR process slightly enhances the yield stress (YS) of the rolled specimen compared to the SR one. The YS increased from 192.2 MPa for the AR specimen to 248 MPa and 250.7 MPa after SR and ASR processing, respectively. Additionally, the ultimate tensile stress (UTS) increased from 243.5 MPa to 258.1 MPa and 265.1 MPa, correspondingly. However, the ductility decreases after the SR and ASR processes concerning the AR specimen. According to Zhu et al. [42], ductility in metallic materials is controlled by microstructure characteristics such as grain size and dislocation density. Therefore, high dislocation densities in homogeneous smaller grain sizes can affect the strain hardening capacity, reducing material ductility. This is due to the shorter mean free path for dislocation motion that also leads to faster dislocation annihilation. The above observations demonstrate that the SR and ASR processes increase the tensile strength but at the expense of ductility.
Figure 10b depicts the strain hardening rate curves of AR, SR, and ASR specimens. As can be observed, the strain hardening rates of the SR and ASR specimens exhibit dramatic decreases from a larger strain hardening rate than the AR condition. Thus, the SR and ASR materials reach the plastic instability faster than the AR material. This later presents a flatter curve that starts with a smooth decay, reaches a plateau, and finishes with a second decay until the necking occurs. On the other hand, the ASR material presents a curve with a fast decay followed by the formation of multiple peaks and valleys until necking. This behavior can be attributed to the microstructure heterogeneity between the near-surface and the middle zones of the sheet that creates a heterogeneous strain distribution. Therefore, the SR material, which is more homogeneous across the sheet thickness, presents a strain hardening curve with smooth decays and short plateaus. The hardness measurements across the sheet thickness also confirm the heterogeneity, as shown in Figure 10c. The hardness profiles agree with the observed microstructure evolution where the ASR process produced more significant changes (e.g., smaller grain sizes and a higher fraction of HAGBs in S1 and S5 than in S2–S4) close to the surface neighborhoods than in the center zone. For that reason, the greatest hardness values were obtained near the surfaces, while in the SR process, hardness values show less scatter.
One of the essential characteristics of plane products is their formability capacity. Using the Hollomon equation, this property can be assessed indirectly by measuring the strain hardening exponent. A power law describes this well-known equation as follows [43]:
σ = k ε n
where, σ , ε , k , and n represent the true stress, true strain, strength coefficient, and strain hardening exponent, respectively.
The values of the strain hardening exponent and strength coefficient for the AR, SR, and ASR specimens are given in Figure 10d. The AR specimen has a strain hardening exponent of n = 0.072. After SR and ASR processing, the values of the strain hardening exponents decrease. According to Khelfa et al. [44], the decrease in the strain hardening exponent can be explained as a function of the dislocation density. At the early stages of deformation, dislocation density increases rapidly, creating subgrains that prevent and reduce the dislocation movement inside the grains, which influences strain hardening capacity.
Analyzing the rolled conditions, the strain hardening exponent value of the ASR specimen ( n = 0.047) is 2.3 times higher than that of the SR specimen ( n = 0.02). This difference can be related to the evolution of the microstructural properties between the surface and the central areas, as evidenced by the average misorientation, grain size, and grain boundary evolutions in Figure 6. Hence, the microstructure heterogeneity across the sheet thickness after ASR processing helps in reaching better formability concerning the microstructural characteristics obtained by SR.

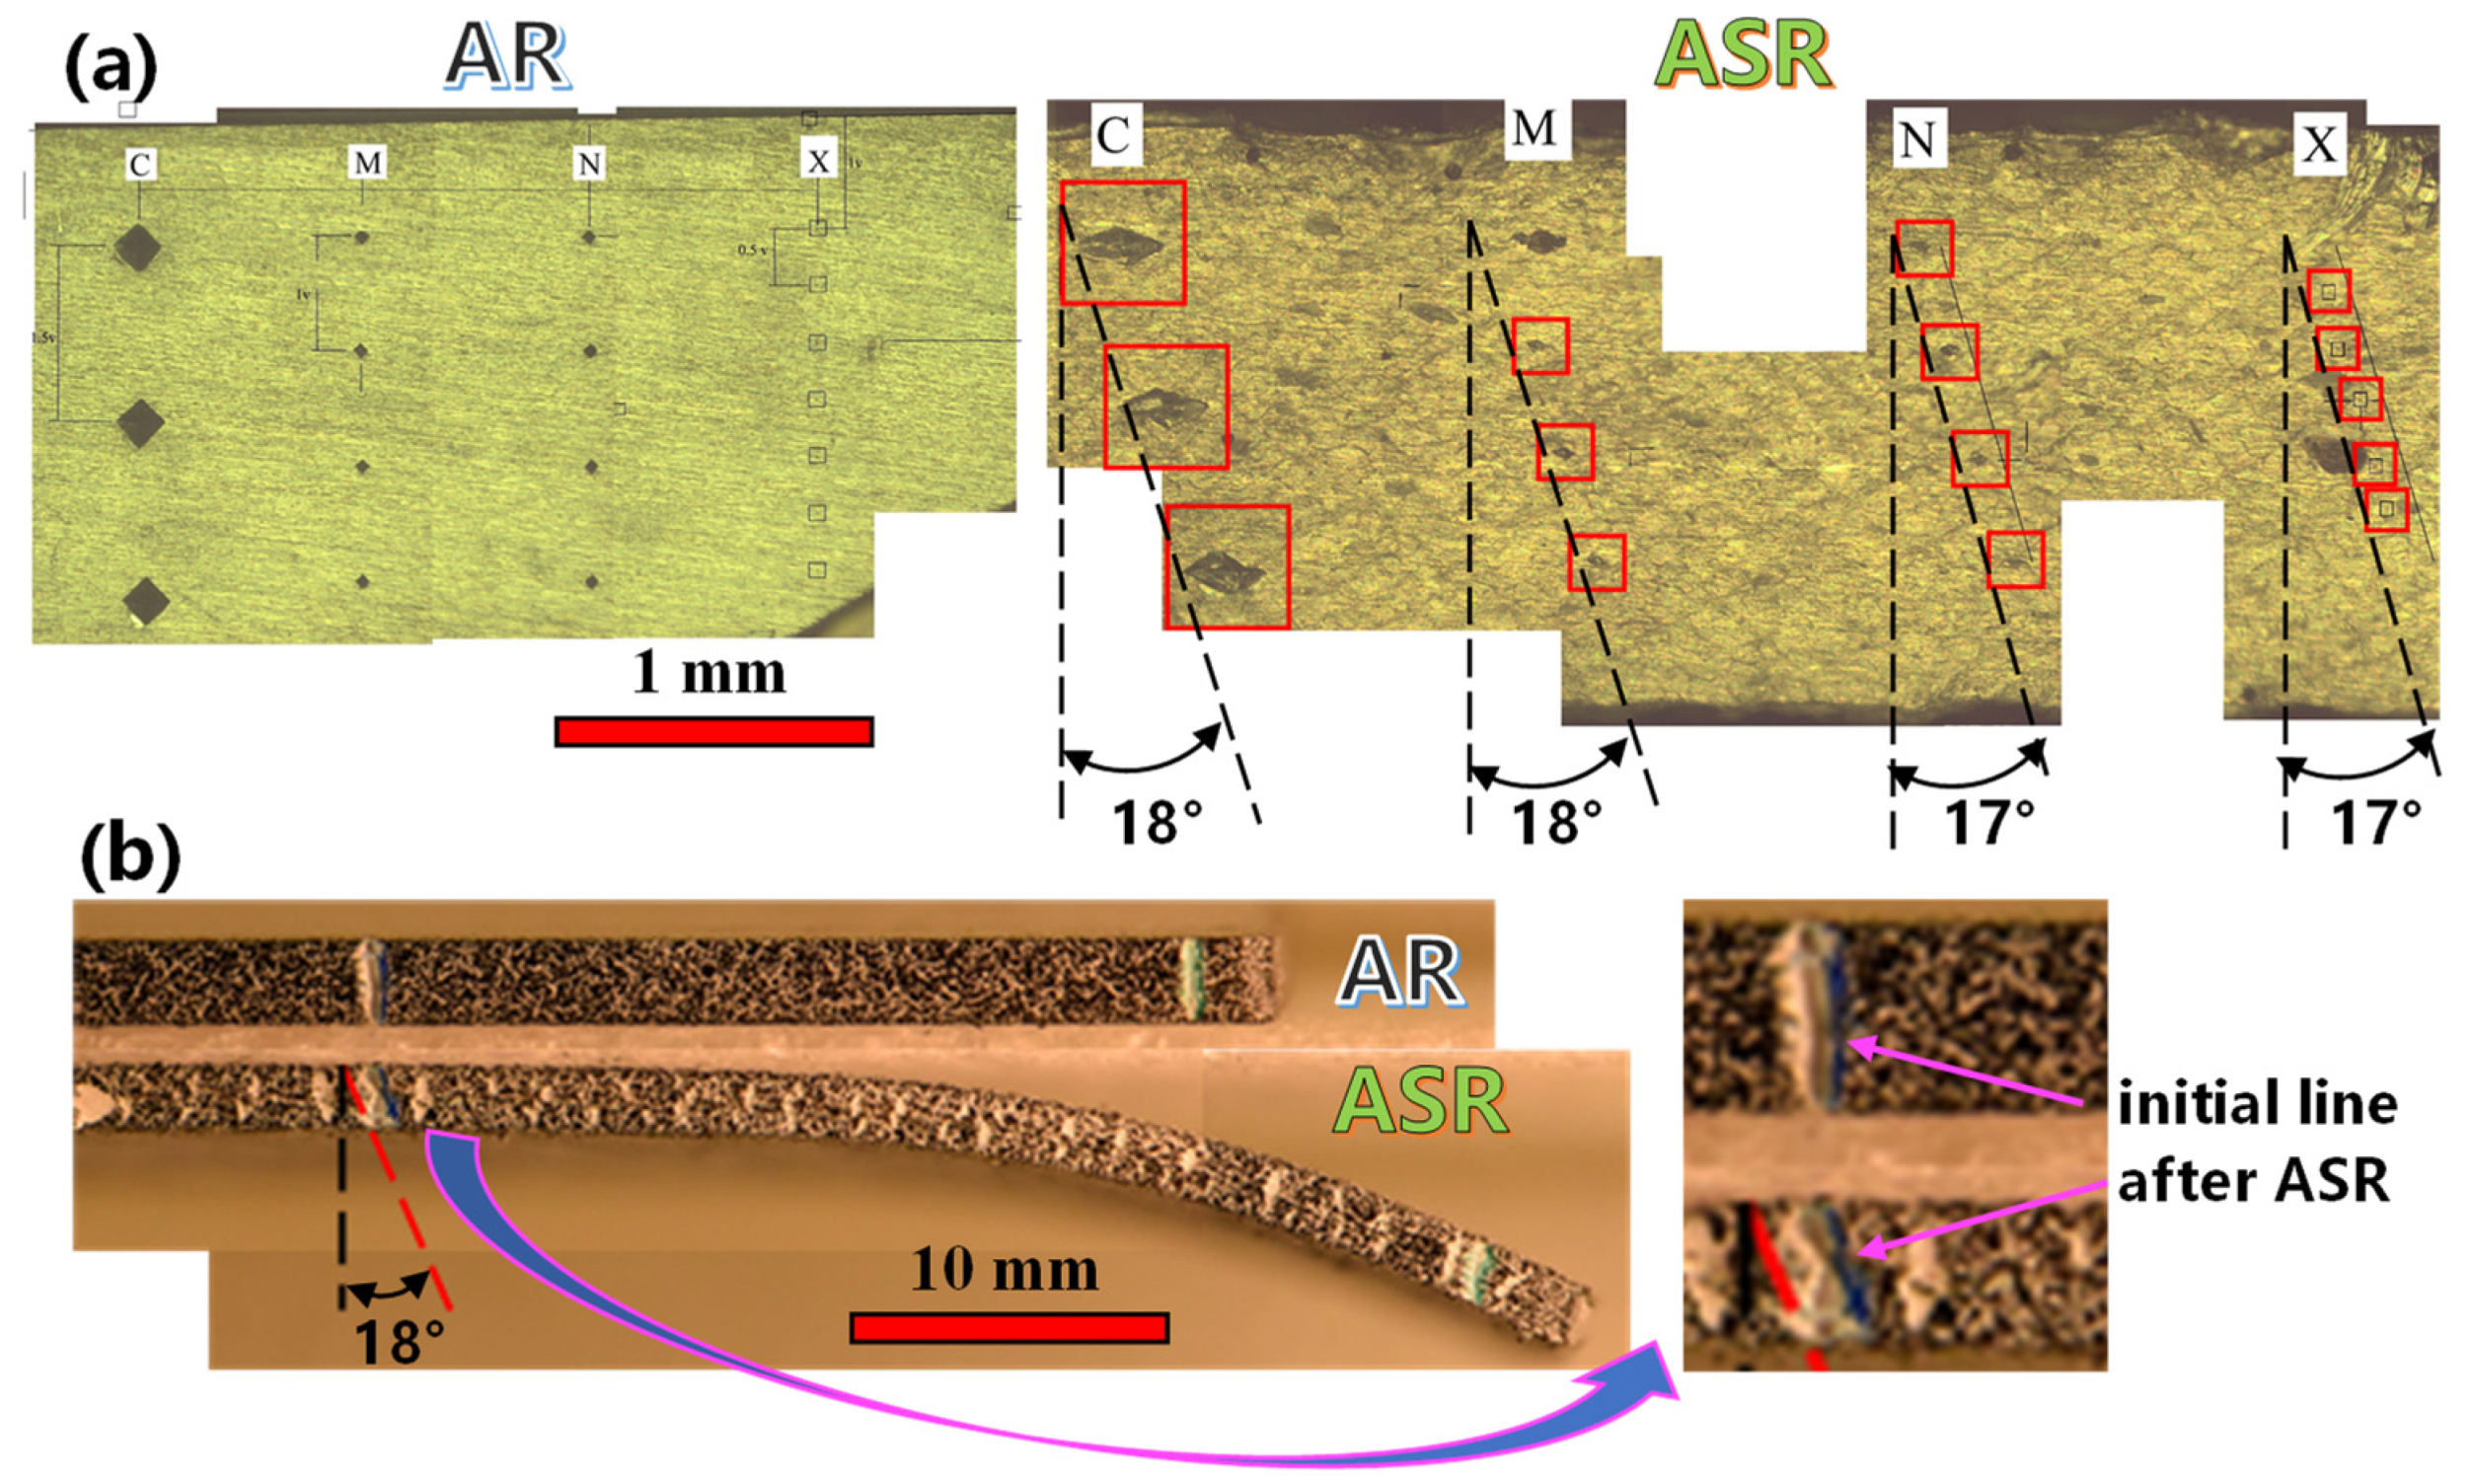
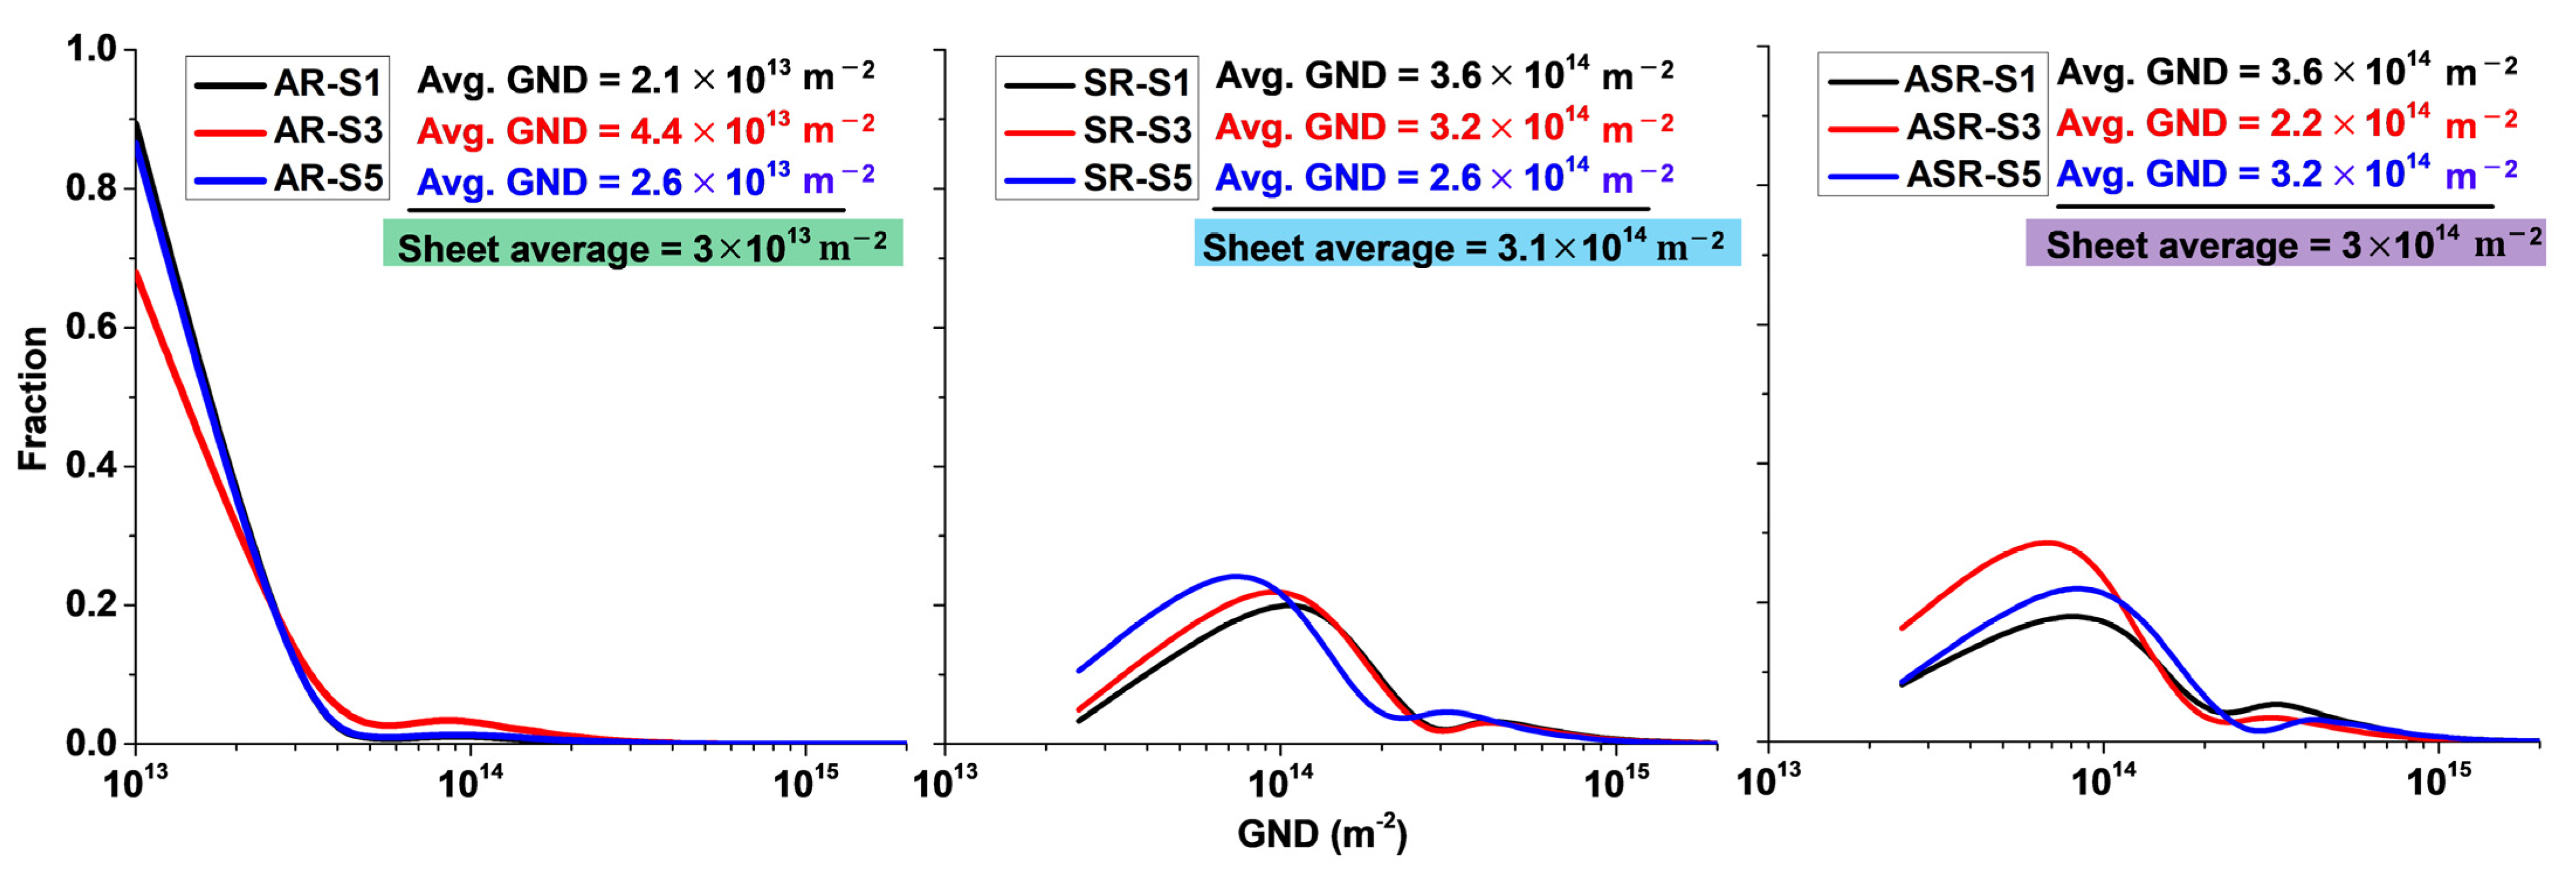
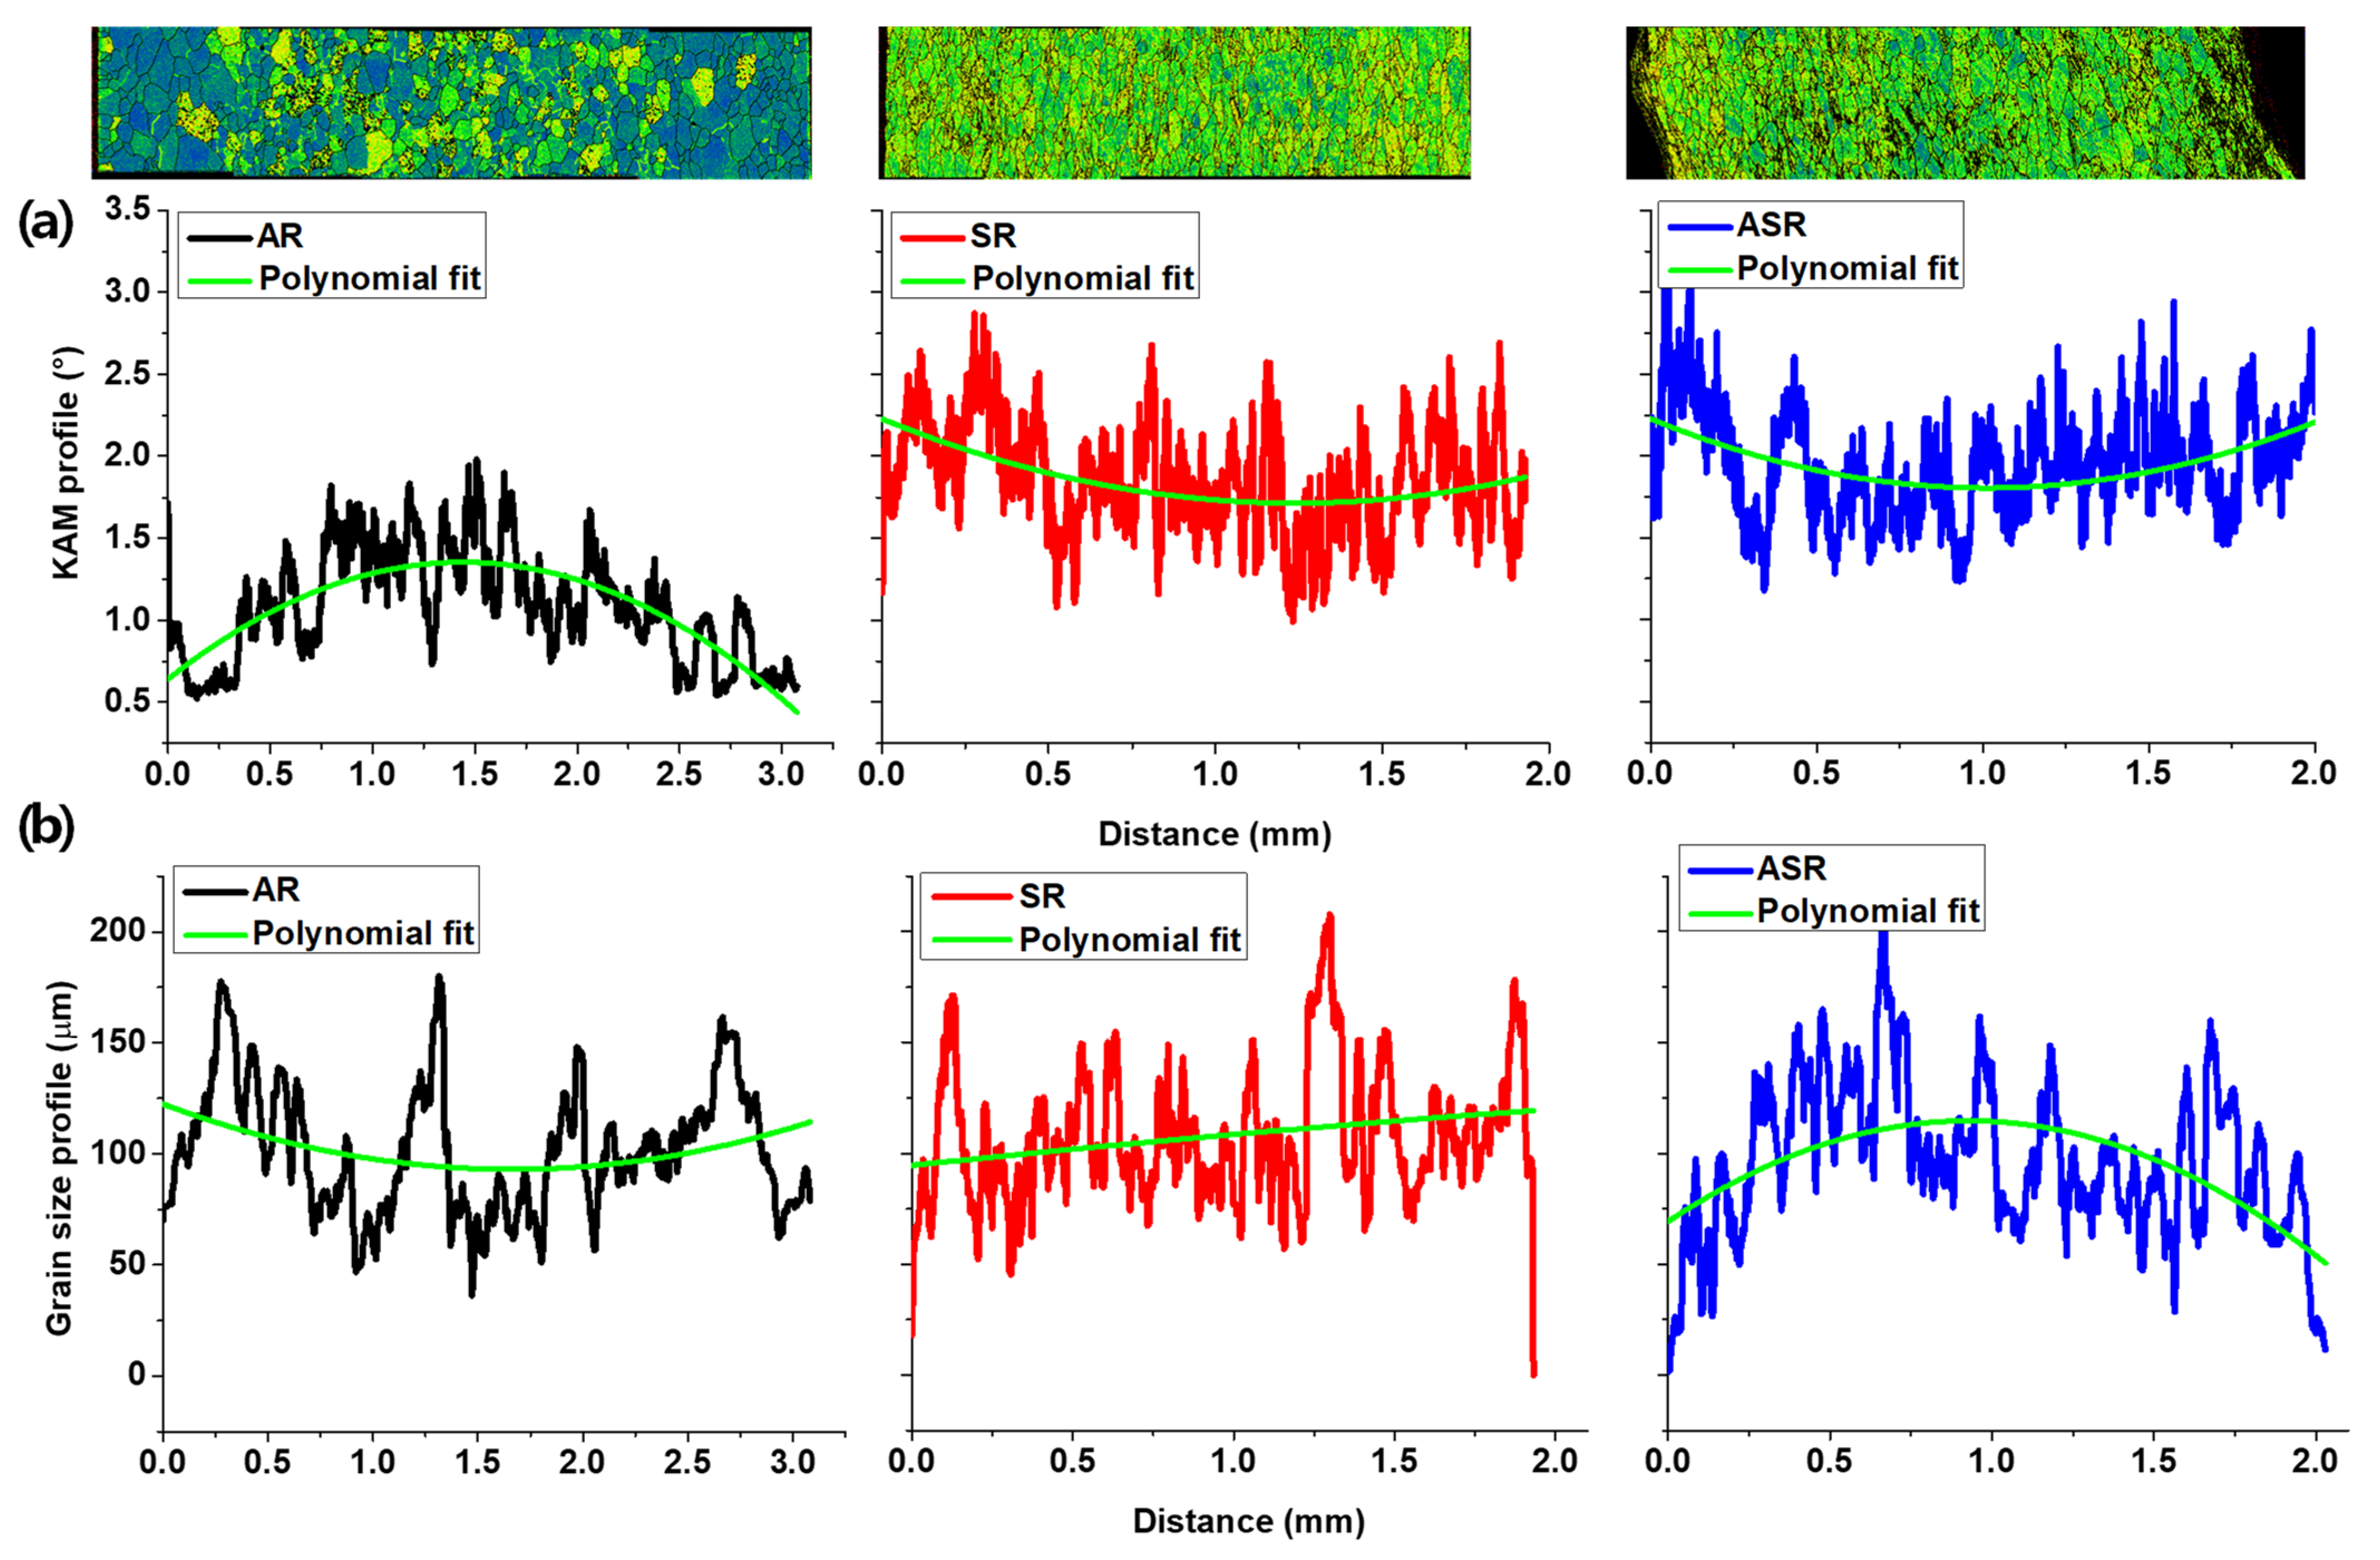
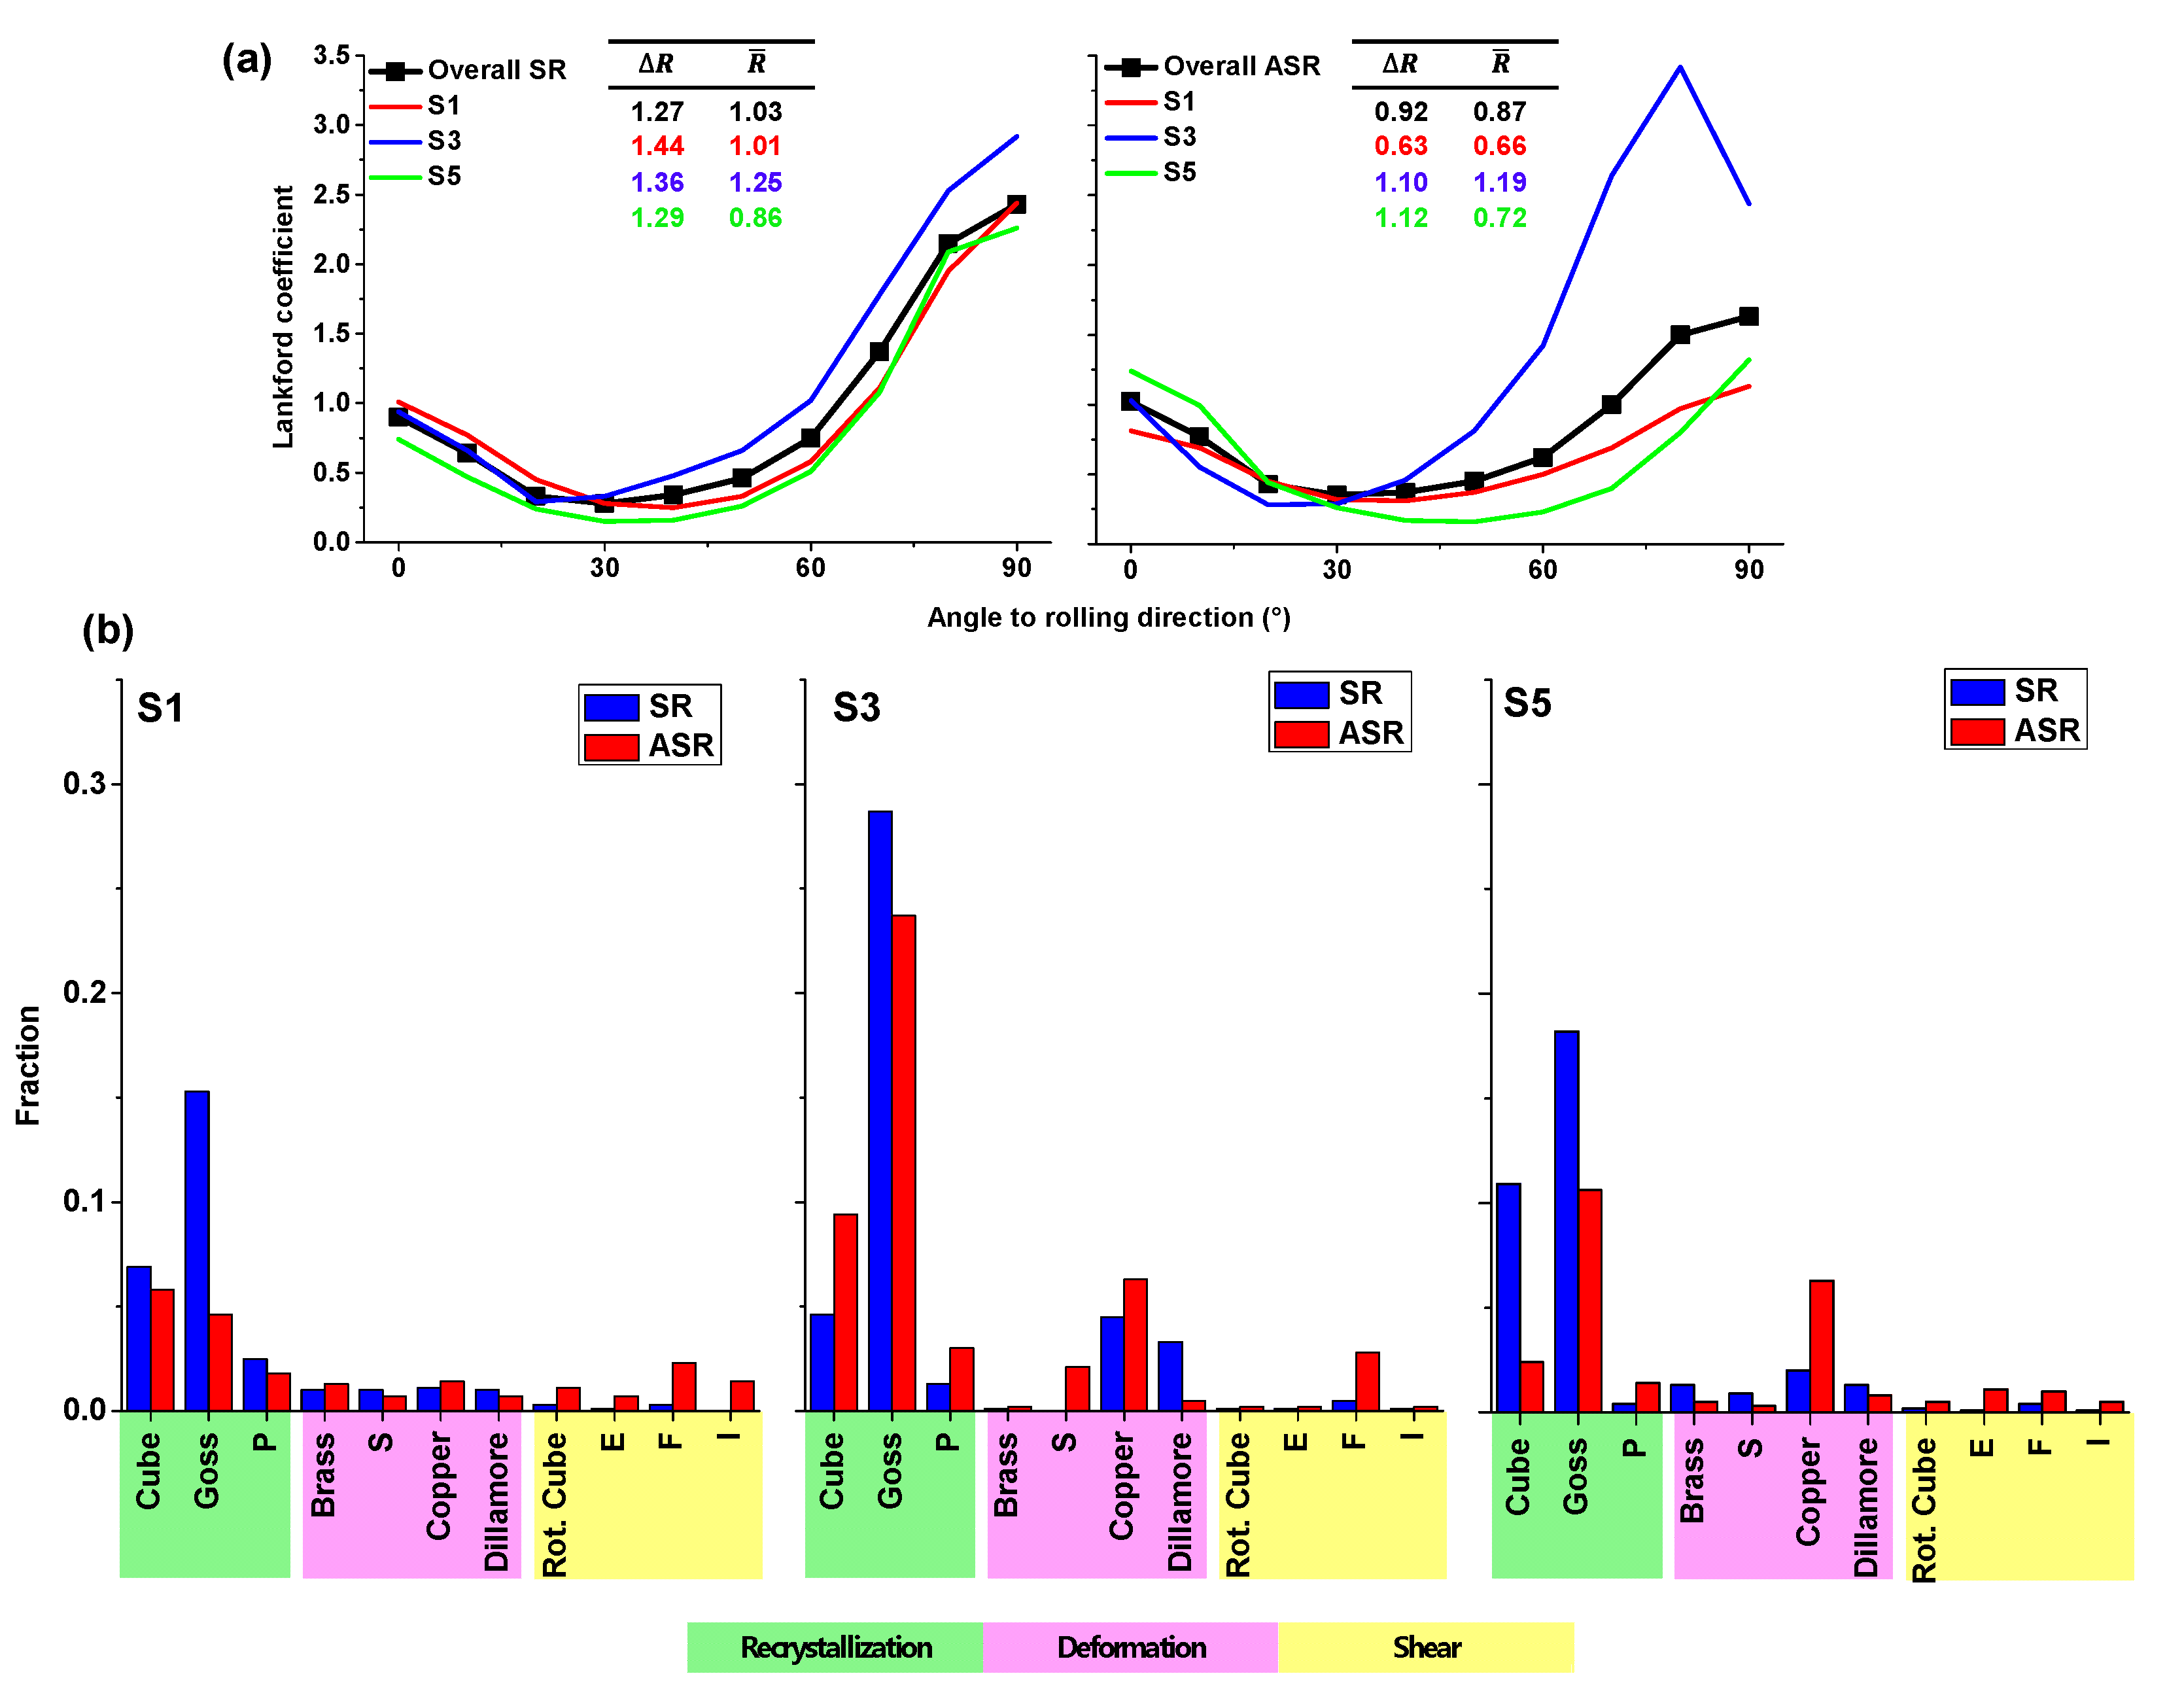
3.3. Microstructure Heterogeneity and Plastic Behavior

The grain fragmentation after rolling processing can be correlated with the GND evolution. Figure 11 represents the GND distributions in regions S1, S3, and S5 for all the materials. This figure shows that the dislocation density of rolled materials increases by one order of magnitude after plastic deformation concerning the AR material. This observation results from the amount of LAGBs and the lower average misorientation that indicates more distortions inside the original grains. Therefore, the GNDs appear to compensate for the curvature of the grains creating new grain boundaries.
GNDs are due to the contribution of two components: (1) GNDs associated with curvature-induced dislocations and (2) GNDs that build misorientation across dislocation cell walls (associated with the subgrains) [45]. Thus, based on the misorientation angle distributions, most of the GNDs created by the rolling process after 38% thickness reduction correspond with the second group. For that reason, more significant deformations are needed to obtain a refined grain size dominated by HAGBs.
It can also be appreciated in Figure 11 that in the ASR process, the GND density in the middle zone (S3) is smaller than that in the surface areas (S1 and S5). This particular distribution indicates the creation of plastic gradients between the surface and the middle zone, creating a sandwich-like structure. The creation of plastic gradients has been associated with the combination of strength and ductility [46]. However, the plastic gradients are insufficient to improve strength without sacrificing ductility. They need to be specially distributed in a heterogeneous microstructure where nanostructured and coarse grains coexist properly [47].
As shown in Figure 12a,b, the kernel average misorientation (KAM) and the grain size profiles indicate heterogeneous behaviors across the sheet thickness. Figure 12a demonstrates that after rolling, both SR and ASR produce more considerable misorientation differences around the surfaces than in the middle zone. In addition, the grain size profiles indicate that ASR gives rise to a curved profile with the smallest grains near the surfaces, while SR follows a flatter profile, as indicated in Figure 12b. From the KAM and grain size profiles, the heterogeneity of the ASR processed sheet covers almost 500 µm (~250 µm for each side). However, this heterogeneity degree is not enough to overcome the strength–ductility trade-off because the dimensional differences between the regions that make up the sheet heterogeneity are not that great. Ma et al. [48] suggest the combination of coarse with nanometric grains to reach a well-defined microstructure heterogeneity with no homogeneous plastic deformation. Although the grain size heterogeneity produced by ASR is not enough to keep the alloy ductility, it can influence the plastic anisotropy due to the marked texture changes around the sheet surfaces, as shown in Figure 4 and Figure 5.
To evaluate the plastic anisotropy, the VPSC model was adjusted by considering the overall and local texture measurements. Therefore, a predicted anisotropy for all the sheets and the different zones was obtained. Figure 13a demonstrates a good texture prediction for the SR and ASR process after 38% thickness reduction concerning the experimental pole figures indicated in Figure 8. Moreover, Figure 13b indicates a good fit of the predicted true stress–strain curves with the experimental ones. The plastic anisotropy was quantified using the normal anisotropy ( R ¯ ) and the planar anisotropy ( Δ R ) parameters defined as follows [49]:
R ¯ = R 0 + 2 R 45 + R 90 4
Δ R = R 0 2 R 45 + R 90 2
where R 0 , R 45 , and R 90 are the Lankford coefficients at 0°, 45°, and 90° orientations concerning the rolling direction.
Therefore, Figure 13c shows the predicted anisotropy for all the materials. Both processes increase the values of normal anisotropy, but the ASR produces the lowest planar anisotropy. As the mechanical response of metallic materials is controlled by texture, grain morphology, and alloying elements, the lowest planar anisotropy of the ASR process is highly related to the texture intensity reduction and the grain size and morphology heterogeneities across the sheet thickness.
Based on the satisfactory texture predictions by the VPSC model, the local texture measurements in the different zones of the sheet were used to evaluate their plastic anisotropy contributions, as indicated in Figure 14a. This figure reveals that the middle zones for both processes account for the largest normal anisotropy values. In contrast, the planar anisotropy in all the regions of the SR material is higher than that in the AR condition. Thus, the ASR process has better formability for the microstructure and texture heterogeneity between the surfaces and the middle zone. Conversely, the SR material possesses a greater normal anisotropy that helps to increase the resistance to necking [39].
The texture component distribution in the sheet explains the lower scatter of the Lankford coefficients after ASR processing. Figure 14b demonstrates that in regions S1, S3, and S5, the fraction of shearing components is higher for the ASR than for the SR material. The same behavior is observed for the deformation components, with the copper component being the most intense. It is also important to mention that after SR and ASR, the material texture changes from a dominant Cube component to the Goss orientation. The middle zone (i.e., S3), where the fraction of the recrystallization components is the highest, allows this observation to be noticed more clearly.
According to Vincze et al. [39], low Lankford coefficients at 45° are due to the recrystallization components, especially the Cube one. However, the Lankford coefficients obtained by both processes through multiple small thickness reductions gave rise to larger values of R . For example, Sidor et al. [50] found normal anisotropy values ranging from 0.42 to 0.49 when the texture was dominated by Cube and Goss components. In addition, they also demonstrated that the combination of Cube, P, Q, and E components increases the R ¯ -value to 0.74. Therefore, the SR process produces higher R ¯ values, increasing the thinning resistance by combining recrystallization and deformation components starting from a Cube-dominated texture in the AR material. On the other hand, the ASR process reduces the intensity of recrystallization components because of the deformation and shear components with the highest fractions in the surface neighborhoods. This behavior reduces the planar anisotropy because it produces less intense overall and local textures.

4. Conclusions

The processing of an AA6063-T6 aluminum alloy by symmetrical and asymmetrical rolling at room temperature promoted the development and distribution of different textures and grain sizes as a function of the deformation mode. Due to its shear strain component, the asymmetrical process gave rise to texture, grain size, misorientation, and dislocation heterogeneities across the sheet thickness, decreasing the planar anisotropy. On the other hand, the symmetric rolling kept a microstructural and texture evolution more homogeneous across the sheet thickness with a higher normal anisotropy value than the asymmetrical process. Therefore, the main texture changes consisted of shear and recrystallization components in the surfaces and middle zones for the asymmetric rolling. Conversely, the symmetrical rolling was dominated by recrystallization components changing the intense Cube component of the as-received material to the Goss component.
As for microstructural heterogeneity, the ASR process produced more grain refinement due to larger area fractions with grains smaller than 10 µm with respect to the SR process. The microstructure and texture heterogeneity of the ASR material reduced the sheet’s anisotropy, with ∆R values ranging between 0.6 and 1.1, while the SR material reached values between 1.3 and 1.4. Conversely, the average Lankford coefficient after SR processing was 15% larger than that in the ASR processing. Thus, the ASR and SR processing of an AA6063-T6 aluminum alloy seem to reduce the anisotropy and increase formability, respectively.

Author Contributions

Conceptualization, J.A.M.; methodology, J.A.M., G.A.D., M.A. and R.B.; software, J.A.M.; validation, R.B. and J.M.C.; formal analysis, J.A.M. and T.K.; investigation, J.A.M., G.A.D. and T.K.; resources, M.A., R.B. and J.M.C.; data curation, J.A.M. and T.K.; writing—original draft preparation, J.A.M., T.K. and J.M.C.; writing—review and editing, J.A.M., R.B. and J.M.C.; visualization, T.K. and G.A.D.; supervision, R.B. and J.M.C.; project administration, R.B. and J.M.C.; funding acquisition, M.A., R.B. and J.M.C. All authors have read and agreed to the published version of the manuscript.

Funding

This research received no external funding.

Institutional Review Board Statement

Not applicable.

Informed Consent Statement

Not applicable.

Data Availability Statement

Not applicable.

Acknowledgments

The authors thank Carlos Tome from Los Alamos National Laboratory for providing the visco-plastic self-consistent polycrystal software.

Conflicts of Interest

The authors declare no conflict of interest.

References

  1. Li, Z.; Zhang, Z.; Zhou, G.; Zhao, P.; Jia, Z.; Poole, W.J. The Effect of Mg and Si Content on the Microstructure, Texture and Bendability of Al–Mg–Si Alloys. Mater. Sci. Eng. A 2021, 814, 141199. [Google Scholar] [CrossRef]
  2. Wang, X.; Liu, H.; Tang, X. A Comparison Study of Microstructure, Texture and Mechanical Properties between Two 6xxx Aluminum Alloys. Met. Res. Technol. 2021, 118, 211. [Google Scholar] [CrossRef]
  3. Zhu, S.; Shih, H.-C.; Cui, X.; Yu, C.-Y.; Ringer, S.P. Design of Solute Clustering during Thermomechanical Processing of AA6016 Al–Mg–Si Alloy. Acta Mater. 2021, 203, 116455. [Google Scholar] [CrossRef]
  4. Amegadzie, M.Y.; Bishop, D.P. Effect of Asymmetric Rolling on the Microstructure and Mechanical Properties of Wrought 6061 Aluminum. Mater. Today Commun. 2020, 25, 101283. [Google Scholar] [CrossRef]
  5. Magalhães, D.C.C.; Kliauga, A.M.; Ferrante, M.; Sordi, V.L. Asymmetric Cryorolling of AA6061 Al Alloy: Strain Distribution, Texture and Age Hardening Behavior. Mater. Sci. Eng. A 2018, 736, 53–60. [Google Scholar] [CrossRef]
  6. Yu, H.L.; Lu, C.; Tieu, A.K.; Li, H.J.; Godbole, A.; Zhang, S.H. Special Rolling Techniques for Improvement of Mechanical Properties of Ultrafine-Grained Metal Sheets: A Review. Adv. Eng. Mater. 2016, 18, 754–769. [Google Scholar] [CrossRef]
  7. Chrominski, W.; Lewandowska, M. Effect of Fiber Orientation on Microstructure and Texture Evolution During the Cold-Rolling of Al–Mg–Si Alloy. Adv. Eng. Mater. 2022, 24, 2101610. [Google Scholar] [CrossRef]
  8. Zhao, J.-R.; Hung, F.-Y.; Chen, B.-J. Effects of Heat Treatment on a Novel Continuous Casting Direct Rolling 6056 Aluminum Alloy: Cold Rolling Characteristics and Tensile Fracture Properties. J. Mater. Res. Technol. 2021, 11, 535–547. [Google Scholar] [CrossRef]
  9. Kang, J.-H.; Ko, Y.G. Microstructure and Mechanical Properties of Ultrafine Grained 5052 Al Alloy Fabricated by Multi-Pass Differential Speed Rolling. J. Mater. Res. Technol. 2022, 19, 2031–2049. [Google Scholar] [CrossRef]
  10. Tian, A.; Xu, X.; Sun, L.; Deng, Y. Effects of Interrupted Ageing and Asymmetric Rolling on Microstructures, Mechanical Properties, and Intergranular Corrosion Behavior of Al-Mg-Si-Zn Alloy. J. Cent. South Univ. 2022, 29, 821–835. [Google Scholar] [CrossRef]
  11. Vincze, G.; Pereira, A.B.; Lopes, D.A.F.; Yánez, J.M.V.; Butuc, M.C. Study on Asymmetric Rolling Process Applied to Aluminum Alloy Sheets. Machines 2022, 10, 641. [Google Scholar] [CrossRef]
  12. Wang, X.; Liu, H.; Tang, X.; Wang, Y.; Guo, M.; Zhuang, L. Influence of Asymmetric Rolling on the Microstructure, Texture Evolution and Mechanical Properties of Al–Mg–Si Alloy. Mater. Sci. Eng. A 2022, 844, 143154. [Google Scholar] [CrossRef]
  13. Muñoz, J.A.; Avalos, M.; Schell, N.; Brokmeier, H.G.; Bolmaro, R.E. Comparison of a Low Carbon Steel Processed by Cold Rolling (CR) and Asymmetrical Rolling (ASR): Heterogeneity in Strain Path, Texture, Microstructure and Mechanical Properties. J. Manuf. Process. 2021, 64, 557–575. [Google Scholar] [CrossRef]
  14. Ren, X.; Huang, Y.; Liu, Y.; Zhao, Y.; Li, H. Evolution of Microstructure, Texture, and Mechanical Properties in a Twin-Roll Cast AA6016 Sheet after Asymmetric Rolling with Various Velocity Ratios between Top and Bottom Rolls. Mater. Sci. Eng. A 2020, 788, 139448. [Google Scholar] [CrossRef]
  15. Hockauf, M.; Meyer, L.W. Work-Hardening Stages of AA1070 and AA6060 after Severe Plastic Deformation. J. Mater. Sci. 2010, 45, 4778–4789. [Google Scholar] [CrossRef]
  16. Madhavan, R.; Kalsar, R.; Ray, R.K.; Suwas, S. Role of Stacking Fault Energy on Texture Evolution Revisited. IOP Conf. Ser. Mater. Sci. Eng. 2015, 82, 12031. [Google Scholar] [CrossRef]
  17. Xie, Y.; Deng, Y.; Wang, Y.; Guo, X. Effect of Asymmetric Rolling and Subsequent Ageing on the Microstructure, Texture and Mechanical Properties of the Al-Cu-Li Alloy. J. Alloys Compd. 2020, 836, 155445. [Google Scholar] [CrossRef]
  18. Wronski, S.; Bacroix, B. Microstructure Evolution and Grain Refinement in Asymmetrically Rolled Aluminium. Acta Mater. 2014, 76, 404–412. [Google Scholar] [CrossRef]
  19. Ma, C.; Hou, L.; Zhang, J.; Zhuang, L. Effect of Deformation Routes on the Microstructures and Mechanical Properties of the Asymmetrical Rolled 7050 Aluminum Alloy Plates. Mater. Sci. Eng. A 2018, 733, 307–315. [Google Scholar] [CrossRef]
  20. Goli, F.; Jamaati, R. Effect of Strain Path during Cold Rolling on the Microstructure, Texture, and Mechanical Properties of {AA}2024 Aluminum Alloy. Mater. Res. Express 2019, 6, 66514. [Google Scholar] [CrossRef]
  21. Bhattacharjee, P.P.; Saha, S.; Gatti, J.R. Effect of Change in Strain Path During Cold Rolling on the Evolution of Microstructure and Texture in Al and Al-2.5%Mg. J. Mater. Eng. Perform. 2014, 23, 458–468. [Google Scholar] [CrossRef]
  22. Kong, X.Y.; Liu, W.C.; Li, J.; Yuan, H. Deformation and Recrystallization Textures in Straight-Rolled and Pseudo Cross-Rolled AA 3105 Aluminum Alloy. J. Alloys Compd. 2010, 491, 301–307. [Google Scholar] [CrossRef]
  23. Lebensohn, R.A.; Tomé, C.N. A Self-Consistent Anisotropic Approach for the Simulation of Plastic Deformation and Texture Development of Polycrystals: Application to Zirconium Alloys. Acta Metall. Mater. 1993, 41, 2611–2624. [Google Scholar] [CrossRef]
  24. Graça, A.; Vincze, G.; Wen, W.; Butuc, M.C.; Lopes, A.B. Numerical Study on Asymmetrical Rolled Aluminum Alloy Sheets Using the Visco-Plastic Self-Consistent (VPSC) Method. Metals 2022, 12, 979. [Google Scholar] [CrossRef]
  25. Roatta, A.; Leonard, M.; Nicoletti, E.; Signorelli, J.W. Modeling Texture Evolution during Monotonic Loading of Zn-Cu-Ti Alloy Sheet Using the Viscoplastic Self-Consistent Polycrystal Model. J. Alloys Compd. 2021, 860, 158425. [Google Scholar] [CrossRef]
  26. Durán, A.I.; Signorelli, J.W.; Celentano, D.J.; Cruchaga, M.A.; François, M. Experimental and Numerical Analysis on the Formability of a Heat-Treated AA1100 Aluminum Alloy Sheet. J. Mater. Eng. Perform. 2015, 24, 4156–4170. [Google Scholar] [CrossRef]
  27. Shore, D.; Van Houtte, P.; Roose, D.; Van Bael, A. Multiscale Modelling of Asymmetric Rolling with an Anisotropic Constitutive Law. Comptes Rendus Mécanique 2018, 346, 724–742. [Google Scholar] [CrossRef]
  28. Tamimi, S.; Correia, J.P.; Lopes, A.B.; Ahzi, S.; Barlat, F.; Gracio, J.J. Asymmetric Rolling of Thin AA-5182 Sheets: Modelling and Experiments. Mater. Sci. Eng. A 2014, 603, 150–159. [Google Scholar] [CrossRef]
  29. Park, J.H.; Hamad, K.; Widiantara, I.P.; Ko, Y.G. Strain and Crystallographic Texture Evaluation of Interstitial Free Steel Cold Deformed by Differential Speed Rolling. Mater. Lett. 2015, 147, 38–41. [Google Scholar] [CrossRef]
  30. Cui, Q.; Ohori, K. Grain Refinement of High Purity Aluminium by Asymmetric Rolling. Mater. Sci. Technol. 2000, 16, 1095–1101. [Google Scholar] [CrossRef]
  31. Bachmann, F.; Hielscher, R.; Schaeben, H. Texture Analysis with MTEX–Free and Open Source Software Toolbox. Solid State Phenom. 2010, 160, 63–68. [Google Scholar] [CrossRef]
  32. Muñoz, J.A.; Komissarov, A. Back Stress and Strength Contributions Evolution of a Heterogeneous Austenitic Stainless Steel Obtained after One Pass by Equal Channel Angular Sheet Extrusion (ECASE). Int. J. Adv. Manuf. Technol. 2020, 109, 607–617. [Google Scholar] [CrossRef]
  33. Leff, A.C.; Weinberger, C.R.; Taheri, M.L. Estimation of Dislocation Density from Precession Electron Diffraction Data Using the Nye Tensor. Ultramicroscopy 2015, 153, 9–21. [Google Scholar] [CrossRef]
  34. Molinari, A.; Canova, G.R.; Ahzi, S. A Self Consistent Approach of the Large Deformation Polycrystal Viscoplasticity. Acta Metall. 1987, 35, 2983–2994. [Google Scholar] [CrossRef]
  35. Tomé, C.N.; Lebensohn, R.A. Manual for Code VISCO-PLASTIC SELF-CONSISTENT (VPSC); Los Alamos National Laboratory: Los Alamos, NM, USA, 2012.
  36. Muñoz, J.A.; Higuera, O.F.; Tartalini, V.; Risso, P.; Avalos, M.; Bolmaro, R.E. Equal Channel Angular Sheet Extrusion (ECASE) as a Precursor of Heterogeneity in an AA6063-T6 Alloy. Int. J. Adv. Manuf. Technol. 2019, 102, 3459–3471. [Google Scholar] [CrossRef]
  37. Li, S.; Beyerlein, I.J.; Bourke, M.A.M. Texture Formation during Equal Channel Angular Extrusion of Fcc and Bcc Materials: Comparison with Simple Shear. Mater. Sci. Eng. A 2005, 394, 66–77. [Google Scholar] [CrossRef]
  38. Zhao, J.; Deng, Y.; Tan, J.; Zhang, J. Effect of Strain Rate on the Recrystallization Mechanism during Isothermal Compression in 7050 Aluminum Alloy. Mater. Sci. Eng. A 2018, 734, 120–128. [Google Scholar] [CrossRef]
  39. Vincze, G.; Simões, F.J.P.; Butuc, M.C. Asymmetrical Rolling of Aluminum Alloys and Steels: A Review. Metals 2020, 10, 1126. [Google Scholar] [CrossRef]
  40. Bacca, M.; Hayhurst, D.R.; McMeeking, R.M. Continuous Dynamic Recrystallization during Severe Plastic Deformation. Mech. Mater. 2015, 90, 148–156. [Google Scholar] [CrossRef]
  41. Toth, L.S.; Gu, C. Ultrafine-Grain Metals by Severe Plastic Deformation. Mater. Charact. 2014, 92, 1–14. [Google Scholar] [CrossRef]
  42. Zhu, Y.T.; Wu, X.L. Ductility and Plasticity of Nanostructured Metals: Differences and Issues. Mater. Today Nano 2018, 2, 15–20. [Google Scholar] [CrossRef]
  43. HoLLOMON, J.H. Coordinate and Amplify the Knowledge. Trans. Am. Inst. Min. Metall. Pet. Eng. 1945, 162, 268. [Google Scholar]
  44. Khelfa, T.; Muñoz-Bolaños, J.-A.; Li, F.; Cabrera-Marrero, J.-M.; Khitouni, M. Strain-Hardening Behavior in an AA6060-T6 Alloy Processed by Equal Channel Angular Pressing. Adv. Eng. Mater. 2021, 23, 2000730. [Google Scholar] [CrossRef]
  45. Gu, C.F.; Tóth, L.S.; Beausir, B. Modeling of Large Strain Hardening during Grain Refinement. Scr. Mater. 2012, 66, 250–253. [Google Scholar] [CrossRef]
  46. Zeng, Z.; Li, X.; Xu, D.; Lu, L.; Gao, H.; Zhu, T. Gradient Plasticity in Gradient Nano-Grained Metals. Extrem. Mech. Lett. 2016, 8, 213–219. [Google Scholar] [CrossRef]
  47. Romero-Resendiz, L.; El-Tahawy, M.; Zhang, T.; Rossi, M.C.; Marulanda-Cardona, D.M.; Yang, T.; Amigó-Borrás, V.; Huang, Y.; Mirzadeh, H.; Beyerlein, I.J.; et al. Heterostructured Stainless Steel: Properties, Current Trends, and Future Perspectives. Mater. Sci. Eng. R Rep. 2022, 150, 100691. [Google Scholar] [CrossRef]
  48. Ma, E.; Zhu, T. Towards Strength–Ductility Synergy through the Design of Heterogeneous Nanostructures in Metals. Mater. Today 2017, 20, 323–331. [Google Scholar] [CrossRef]
  49. Fargas, G.; Akdut, N.; Anglada, M.; Mateo, A. Reduction of Anisotropy in Cold-Rolled Duplex Stainless Steel Sheets by Using Sigma Phase Transformation. Metall. Mater. Trans. A 2011, 42, 3472–3483. [Google Scholar] [CrossRef]
  50. Sidor, J.J. Effect of Hot Band on Texture Evolution and Plastic Anisotropy in Aluminium Alloys. Metals 2021, 11, 1310. [Google Scholar] [CrossRef]
Figure 1. Schematic representation of the (a) SR and (b) ASR processes.
Metals 12 01551 g001
Figure 2. Apparent shear angle measurements: (a) array of indentation marks (four indentation profiles named C, M, N, and X were used) and (b) painted line method for the as-received and ASR materials.
Metals 12 01551 g002
Figure 3. Inverse pole figure (IPF) maps, grain boundary (GB) maps, and pole figures of the AR material on the edges, center, and inner layers (S1 to S5) of the specimens.
Metals 12 01551 g003
Figure 4. Inverse pole figure (IPF) maps, grain boundary (GB) maps, and pole figures of the SR material on the edges, center, and inner layers (S1 to S5) of the specimens.
Metals 12 01551 g004
Figure 5. Inverse pole figure (IPF) maps, grain boundary (GB) maps, and pole figures of the ASR material on the edges, center, and inner layers (S1 to S5) of the specimens.
Metals 12 01551 g005
Figure 6. Local microstructural characteristics across the sheet thickness.
Metals 12 01551 g006
Figure 7. Overall grain size distribution for all the materials. (The average values were calculated given the number of grains instead their area weight.)
Metals 12 01551 g007
Figure 8. Texture representation for the (a) AR, (b) SR, and (c) ASR materials. (d) Ideal texture components for FCC materials.
Metals 12 01551 g008
Figure 9. Overall misorientation angle distribution together with the misorientation axis distribution.
Metals 12 01551 g009
Figure 10. (a) Engineering stress–strain curves, (b) normalized strain hardening rate curves, (c) hardness measurements across the sheet thickness, and (d) Hollomon equation fit.
Metals 12 01551 g010
Figure 11. GND distribution at different zones across the sheet thickness.
Metals 12 01551 g011
Figure 12. Microstructural profiles, (a) KAM, and (b) grain size profiles across the sheet thickness.
Metals 12 01551 g012
Figure 13. (a) Texture predicted by the VPSC model, (b) true stress–strain curves together the curves predicted by the VPSC model, and (c) Lankford coefficients predicted by the VPSC model.
Metals 12 01551 g013
Figure 14. (a) Predicted Lankford coefficients at different zones across the sheet thickness; (b) texture components at different zones across the sheet thickness.
Metals 12 01551 g014
Table 1. Al alloy 6063-T6 chemical composition (wt%).
CompositionFeSiMnMgCrZnTiCuAl
Supplied by manufacturer0.350.2–0.60.10.45–0.90.10.10.10.1Bal.
Measured by EDX-0.22-0.91----Bal.
Table 2. Voce law hardening parameters (MPa).
τ 0 s τ 1 s θ 0 s θ 1 s
76383500.4
Table 3. Rolling test parameters.
ConditionThickness
Reduction (%)
Normal Strain- ε 33
Equation (1)
γ 13 = tan ( φ ) x
SR380.55--
ASR380.550.320.59
Publisher’s Note: MDPI stays neutral with regard to jurisdictional claims in published maps and institutional affiliations.

