
The Effects of Deteriorated Boundary Conditions on Horizontally Framed Miter Gates


1
Information Technology Laboratory, U.S. Army Engineer Research and Development Center, Vicksburg, MS 39180, USA
2
Department of Civil Engineering, and Surveying, University of Puerto Rico, Mayaguez, PR 00682, USA
3
Geotechnical and Structures Laboratory, U.S. Army Engineer Research and Development Center, Vicksburg, MS 39180, USA
*
Author to whom correspondence should be addressed.
Metals 2022, 12(1), 37; https://doi.org/10.3390/met12010037
Submission received: 15 November 2021
/
Revised: 20 December 2021
/
Accepted: 21 December 2021
/
Published: 24 December 2021
(This article belongs to the Section Computation and Simulation on Metals)
Abstract
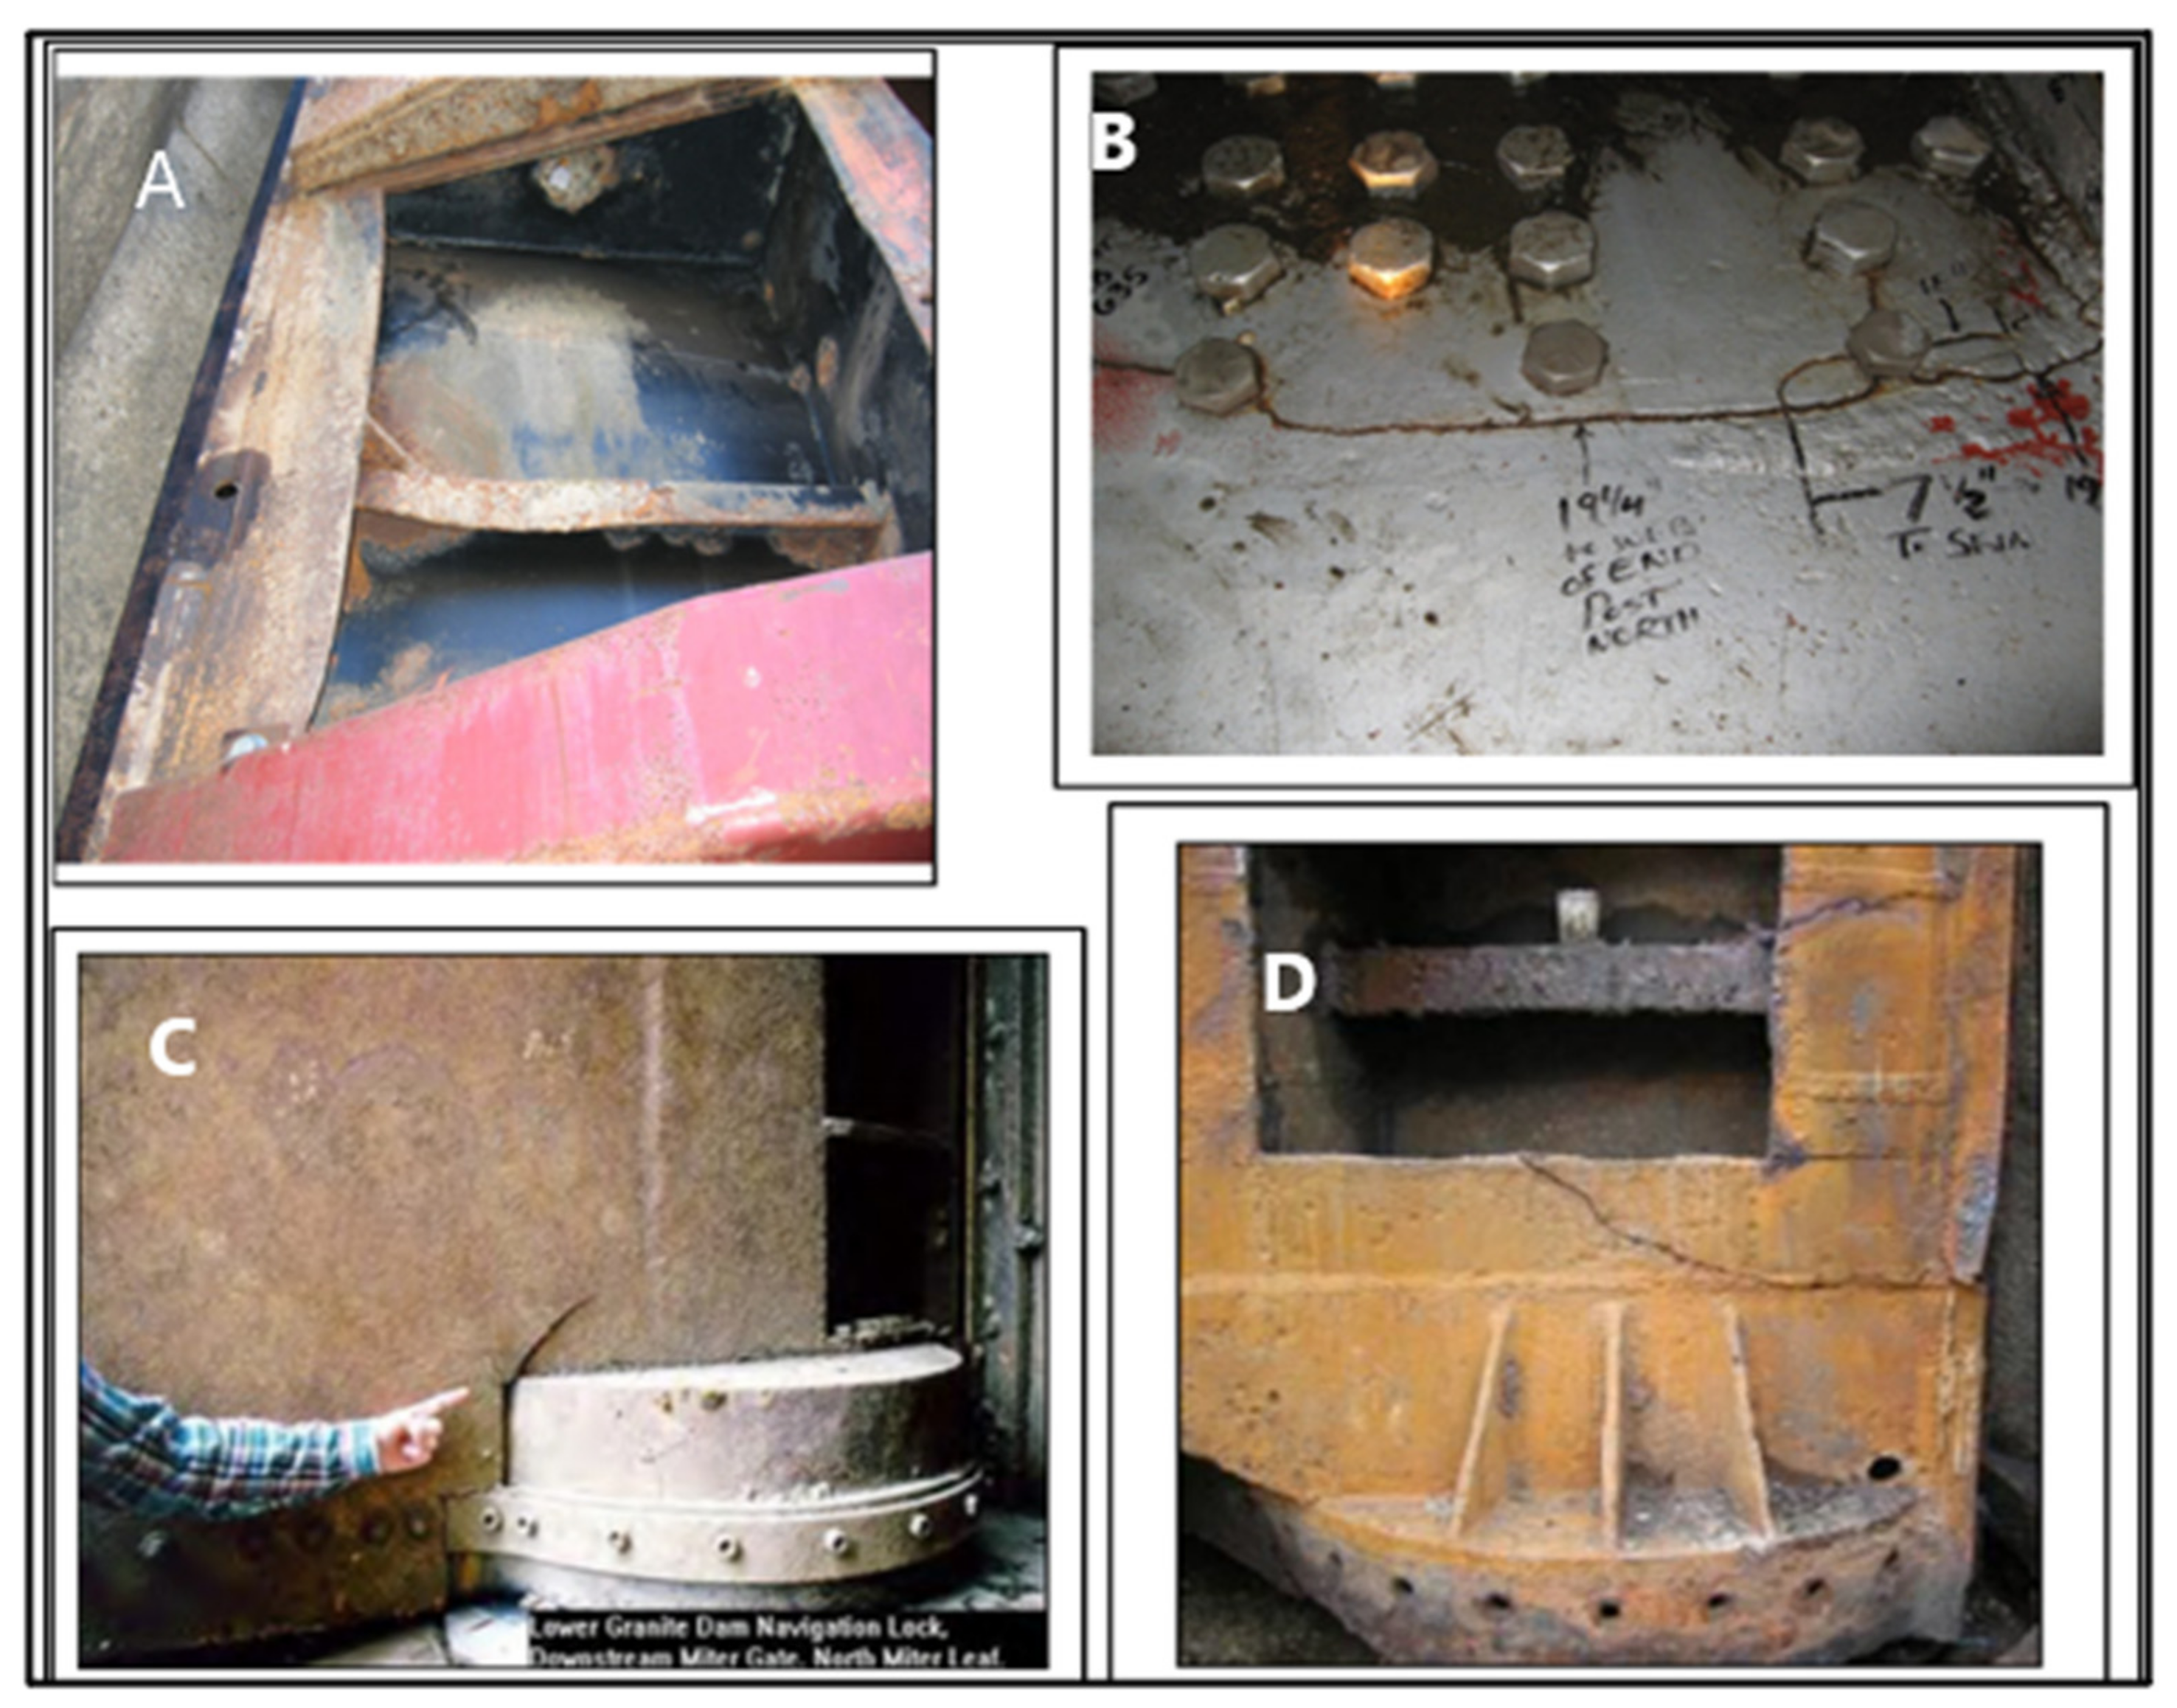
:The U.S. navigable infrastructure is a system of waterways dependent upon hydraulic steel structures (HSS) to facilitate the passage of ships and cargo. The system is linear in the sense that if one HSS is impassable, the entire river system is halted at that point. The majority of the HSS in this system were built in the first half of the 20th Century, and over seventy percent of them are past or near past their design life. Miter gates are critical HSS components within the system and many are showing signs of structural distress from continued operation past their design life. Common distress features include shear cracking within the pintle socket, partially missing Quoin blocks, fatigue fracturing, and bolt failure in the pintle region. This article focuses on gaining a fundamental understanding of the consequences of quoin block deterioration on a miter gate. The work was conducted by developing a computational model of a miter gate with different levels of quoin block deterioration. This model was validated using analytical solutions. The deterioration results demonstrated that the miter gate thrust diaphragm and quoin post experienced changes in their limit states due to deterioration. The results also demonstrated that the miter gate could overcome up to 10% of quoin block deterioration.
1. Introduction
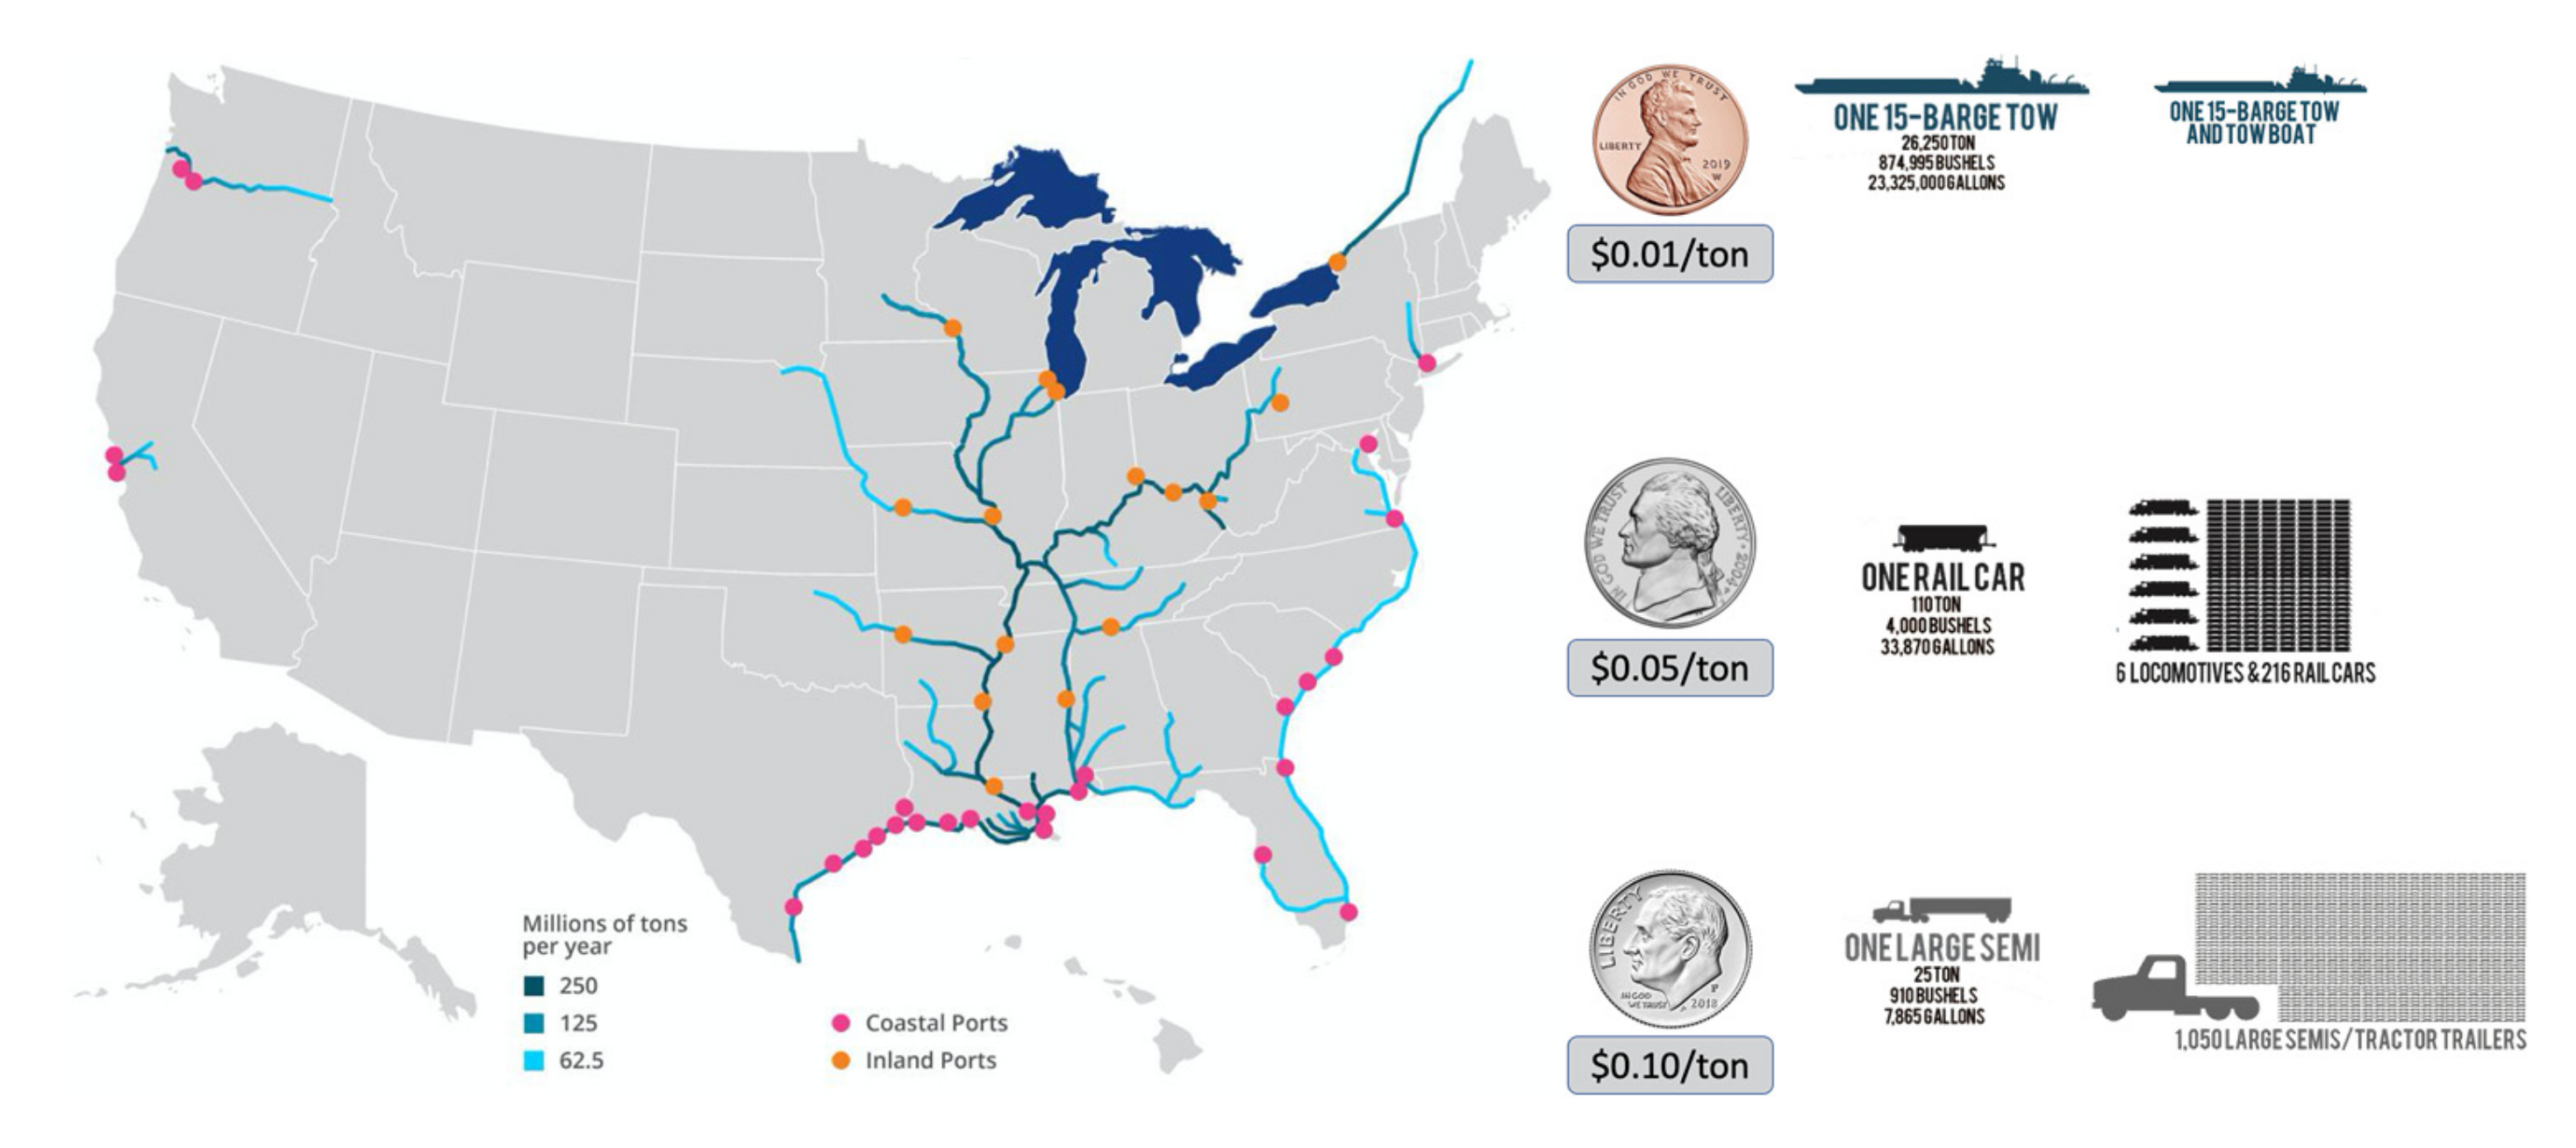
The United States has 40,233 km of inland, and intra-waterways with over 240 locks that form the Nation’s “water highway” for freight transportation [1]. Freight moves via a system of commercial towboats, which push barges lashed together as tows; each barge is capable of holding 1400–1800 tons of cargo. This intricate infrastructure, partially (12,000 miles) operated and maintained by the U.S. Army Corps of Engineers (USACE), delivers 4% by tonnage of US freight by waterway infrastructure [1] and is the most economical transportation method [2]. Figure 1 shows a map of the inland navigation system in the United States along with the cost per ton for the tree main types of transportation based on the amount of tonnage each method of transportation can hold. This portion of the system transports a significant percentage of the agricultural and industrial goods in the U.S. [1,3,4].
Much of the navigable infrastructure dates back to the first half of the twentieth century. Over seventy percent of U.S. navigational infrastructure are near or are operating past their intended design life (typically 50 years) [5] and most need repair or replacement. The largest expenditure to operate the Lock and Dams (L&Ds) is the maintenance and repair of hydraulic steel structures (HSSs). The L&Ds in the U.S. navigation system are experiencing long-term deterioration caused by continuous operation beyond their design life. Several high profile, serious incidents have occurred such as a catastrophic collapse at the Coffeeville Lock’ stoplogs, while operating under normal hydraulic loading conditions [6]. Other HSSs have required complete replacement due to serious fatigue cracking such as the Melvin Price Lock [7,8,9], the Upper Mississippi River Lock 27 [10,11], and the Dalles miter gate [12,13,14]. This low-level condition of the navigational infrastructure is costing economic losses in productivity and efficiency due to the increase of lock stoppages [1,5] (Figure 2).
HSS are a major component of the U.S. navigational infrastructure that can create significant negative ripple effects on the local economy when just one of them is out of operation [1,5,7,8,9,12,13,14]. To counter this unintended situation, the engineers at the U.S. Army Engineer Research and Development Center (ERDC) have been investigating new ways of designing, maintaining, and repairing our navigational infrastructure for the past three decades. The ERDC has been actively contributing to the understanding of HSS distress features through observation; inspection; and physical, analytical, and computational modeling [16,17,18,19,20,21].
This article presents the results of a computational model of a Lock gate (miter gate) under different levels of deterioration to the contact point (quoin block) between the gate and the lock chamber’s concrete wall. The results of the investigation will provide a fundamental understanding of the negative effects of quoin block deterioration on the structural system. Within this article, the normal operation of a lock and the miter gate’s function is introduced, along with typical gate geometry and components.
2. Operation of Lock and Dam
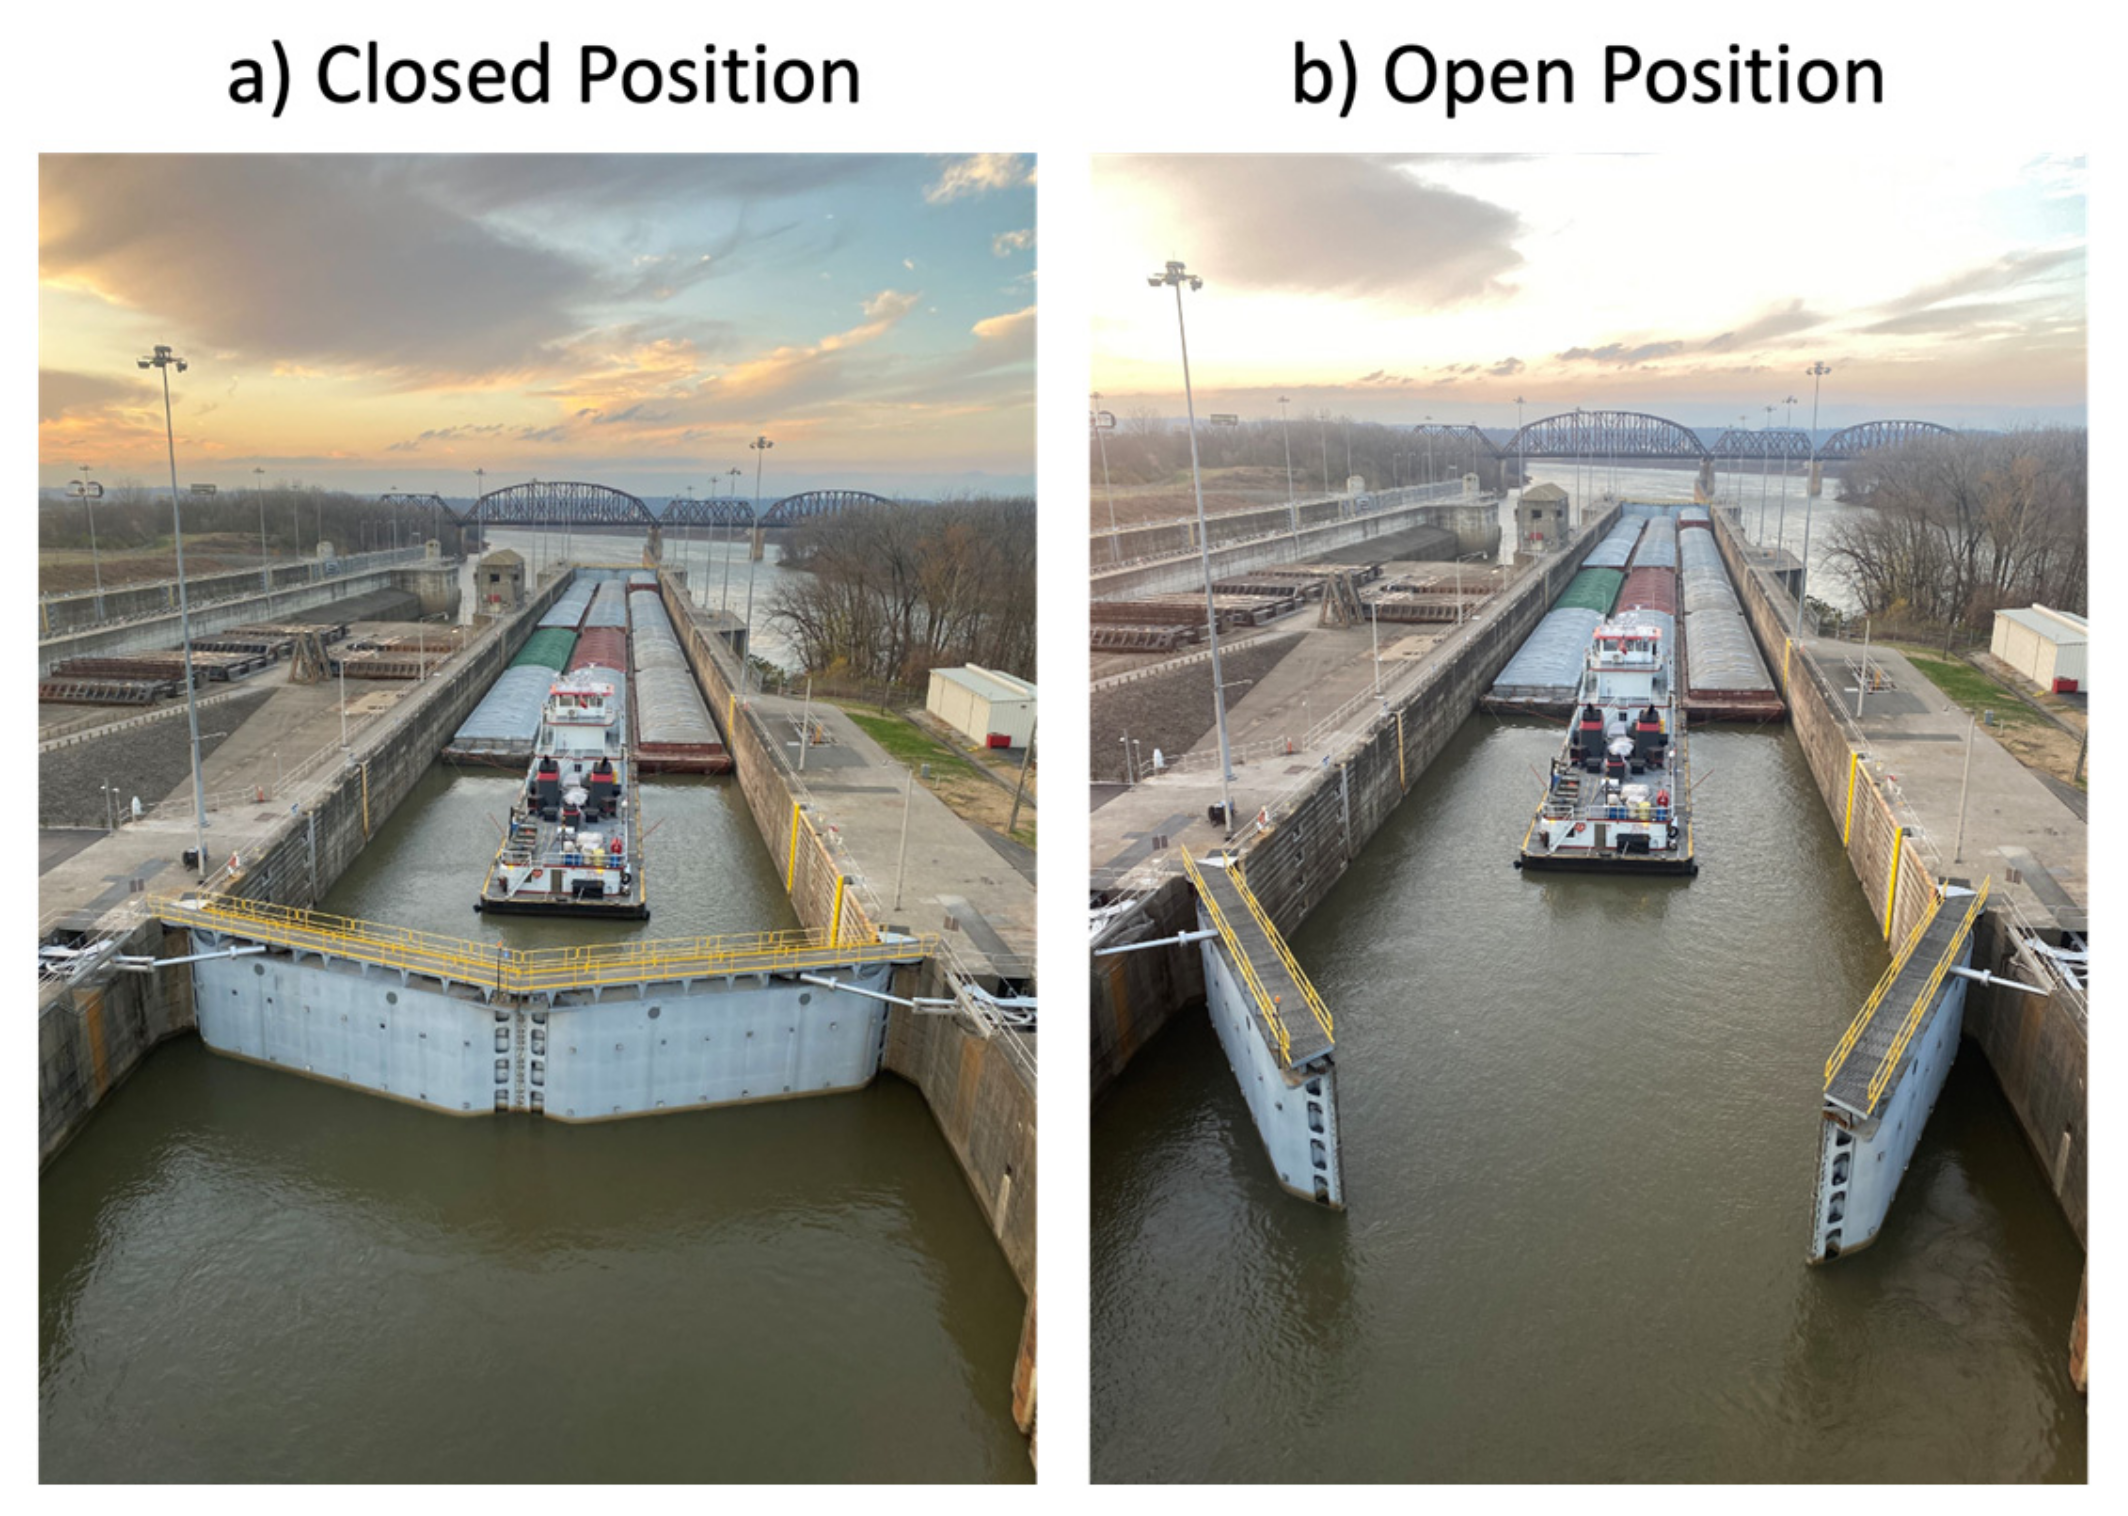
Lock chambers require operable miter gates at both ends of the lock so the water level in the lock chamber can be varied to correspond with the upper and lower approach channels [22]. These gates are critical components in a lock, which are large (HSS) enough to allow passage of vessels while maintaining required water pools at the dams. Figure 3 illustrates the steps taken to transfer a vessel from higher to lower water elevation and vice versa. Figure 4 is a photograph of a lock in operation.
2.1. Geometry of Miter Gate
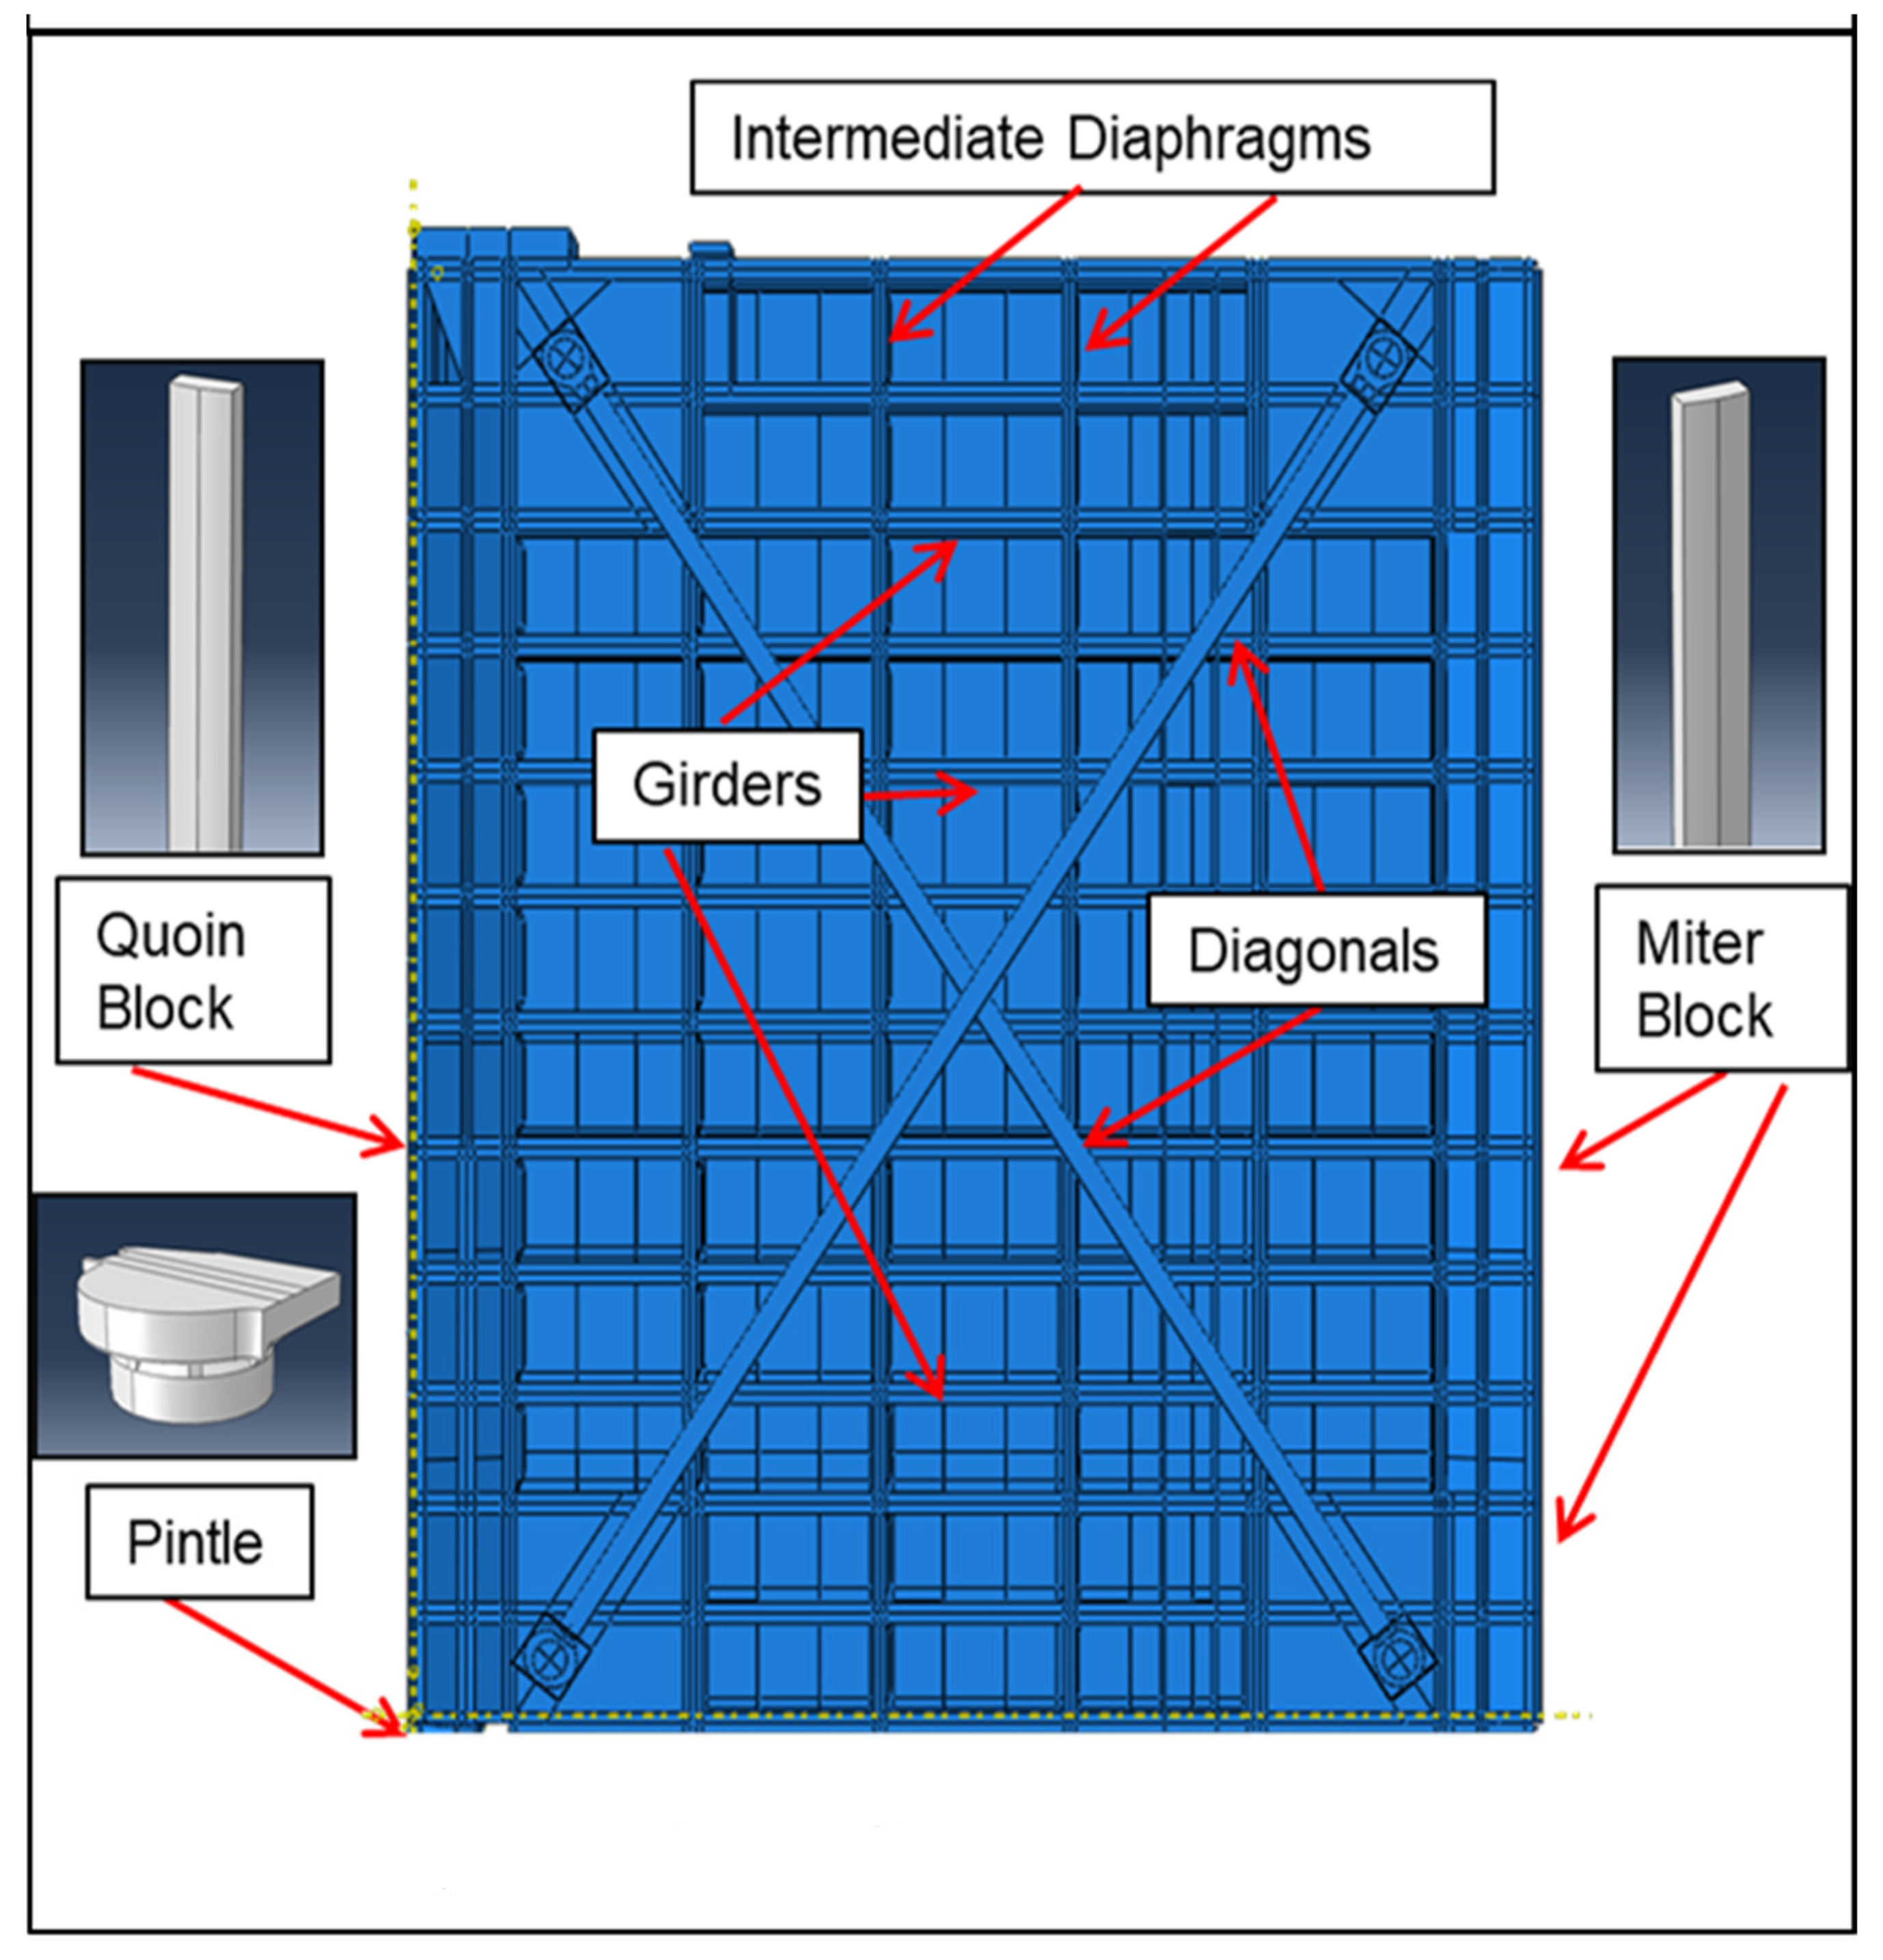
The majority of navigation locks in the USACE inventory are double leaf horizontal framed miter gates [24].The miter gates are a three-point connection of two gate leaves comprised of horizontal girders supported by vertical diaphragms (Figure 4 and Figure 5). Horizontal girders, acting as beams, support the skin plate of a horizontally framed gate. A vertical post (quoin post) at the tapered end of the gate supports each girder (Figure 6a). The girders transfer the hydrostatic loads from the skin plates to the thrust diaphragm, at the tapered end of the leaf (Figure 5 and Figure 6). The Quoin block at the end of the thrust diaphragm transmits the load from the gate quoin block to the lock wall (Figure 6). The quoin block is a continuous, usually corrosion-resisting clad steel or solid corrosion-resisting steel, column that is installed on the end plate of the gate’s tapered section (Figure 6) [17]. The blocks span the entire height of the gate. The Quoin block transmits the hydrostatic loads from the girders and thrust diaphragm onto the wall block (Figure 6).
2.2. Long-Term Deterioration
Under normal operating conditions, HSSs are subject to cyclic loading (filling and emptying of the lock, opening and closing of the miter gate), wave action, barge impact, and freeze and thaw [24]. Over time, the numerous loading conditions along with other factors, such as corrosion, fatigue, design deficiencies, and fabrication discontinuities, can result in deterioration in one or more components.
3. Miter Gate—3D Numerical Model Development
The model utilizes the quoin block deterioration from the bottom of the gate up to 25% of the gate’s total height, 24.87 m. Five different deterioration levels were executed (0, 5, 10, 15, and 25%). The horizontal and vertical stresses at the tapered end section were gathered and analyzed in order to determine the state of the gate.
3.1. Geometry
The miter gate model is 24.87 m, high, 18.80 m wide, and 2.13 m deep (Figure 8 and Figure 9). The major structural elements include 16 horizontal girders, two pre-stressed diagonals, a skin plate, vertical diaphragms, a gudgeon and pintle assembly, and quoin blocks on the quoin and miter ends (Figure 5). The approximate weight of each leaf is 304,156 kg.
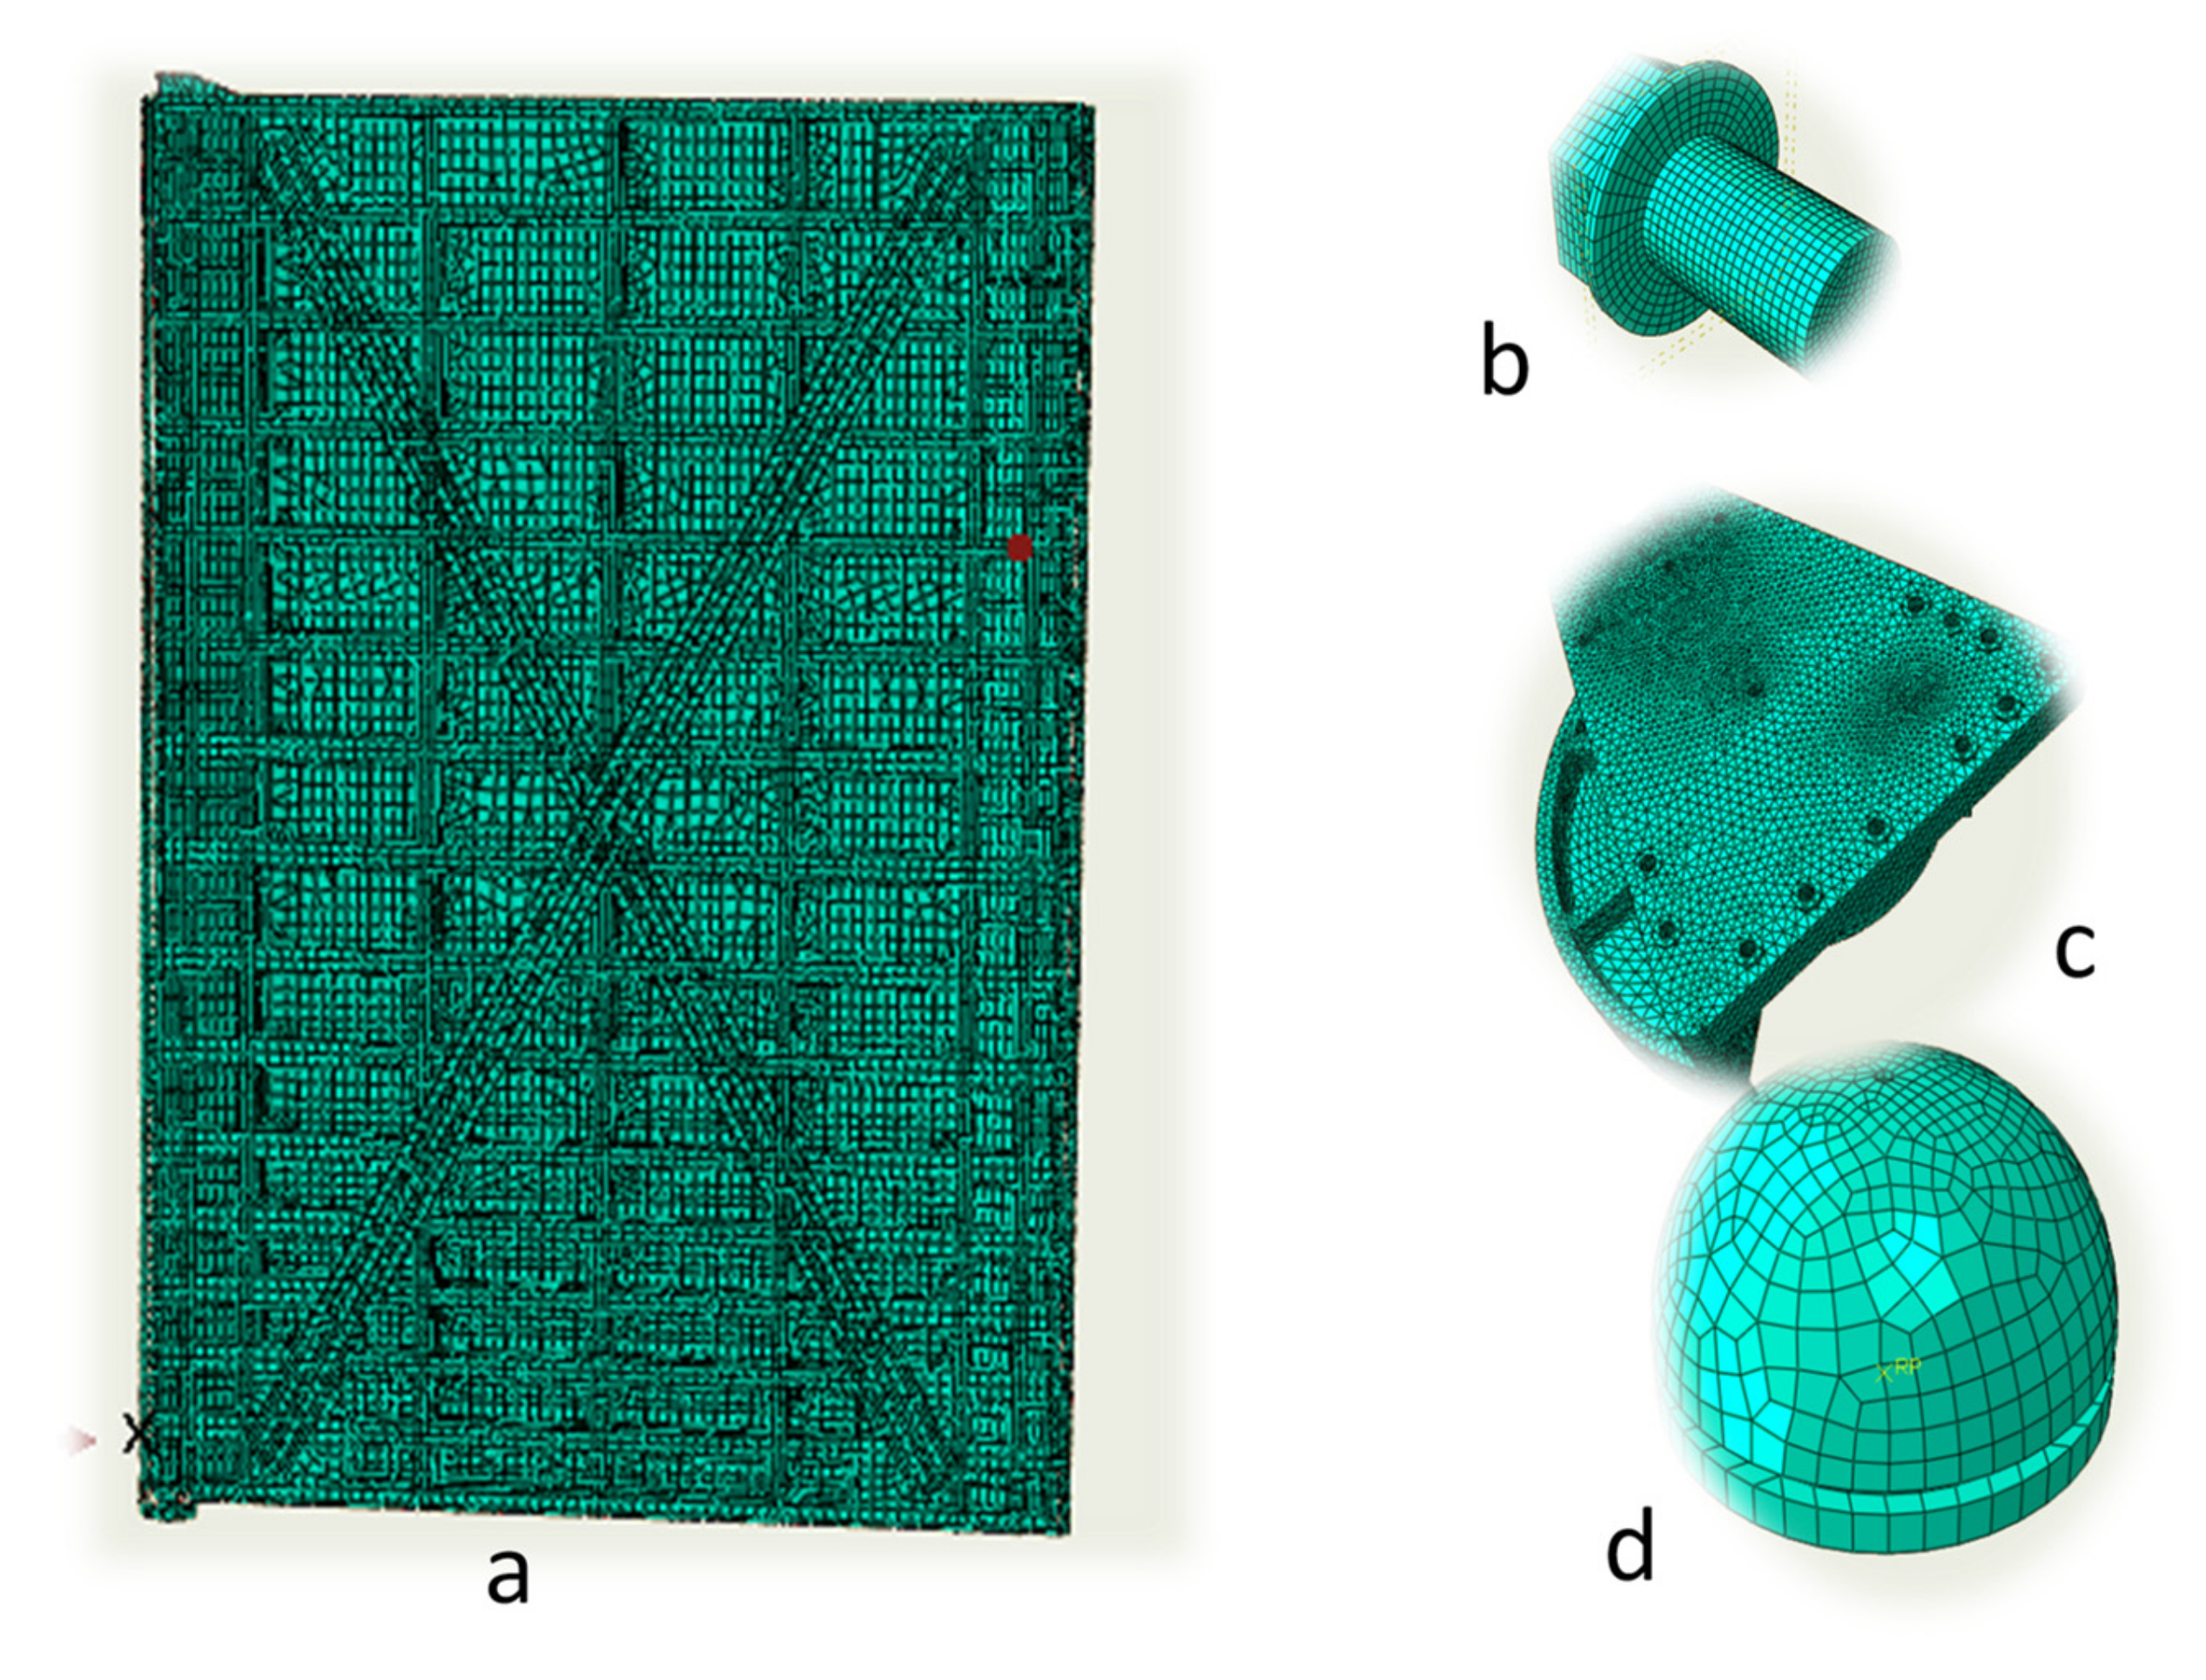
The Abaqus 2018 [27] model has 608,836 elements, 790,119 nodes, and approximately 4.0 million degrees of freedom. The general gate geometry is composed of 3D deformable shell elements (S4R; 4-node doubly curved thin shell with reduced integration), 3D solid continuous elements make up the pintle socket, quoin and miter blocks (C3D8R; 8-node linear brick with reduced integration), and the pintle ball is made of rigid body elements (R3D4; 4-node 3-D bilinear rigid quadrilateral) (Figure 8). Interface elements connect the pintle ball to the pintle, and a combination of tie constraints and interface elements, connect the pintle, bolts, and gate bottom girder-web [25,26,27,28]. The gate, pintle socket, bolts, and blocks have a seeding that generated a mesh where the majority of the elements had an aspect ratio of 1:1.
3.2. Displacement Boundary Conditions and Coordinate System
Figure 9 summarizes displacement boundary conditions applied to the miter block, quoin block, gudgeon pin, and pintle for the model. The miter block, quoin block and gudgeon pin were restricted of movement in the 1 and 2 directions. The pintle ball was restricted of movement in the 1, 2, and 3 directions thus no rotations were allowed.
3.3. Engineering Material Properties
Table 1 lists the material properties of the miter gate. These are typical property values for carbon steels.
3.4. Load Boundary Conditions
The load boundary condition consisted of the structure’s self-weight, additional dead load induced by mud or ice, hydrostatic pressure induced by the upstream and downstream water levels, diagonal pre-stressing, and bolt pre-stressing [24]. These analyses were executed with the upstream water elevation located at the top of the gate and without a lower pool, which represents the extreme loading condition.
The hydrostatic loads due to the upstream and downstream water levels were applied as pressure load on the entire surface of the skin plate. In order to represent the pre-stress in the diagonals using the finite element code, thermal gradients (ΔT) of 32.2 °C and 19.26 °C for the positive and negative diagonal, respectively, (Figure 9) produced a pre-stressing of 121.0 MPa and 89.6 MPa for the positive and negative diagonals, respectively (Figure 9).
3.5. Validation of the Computational Model
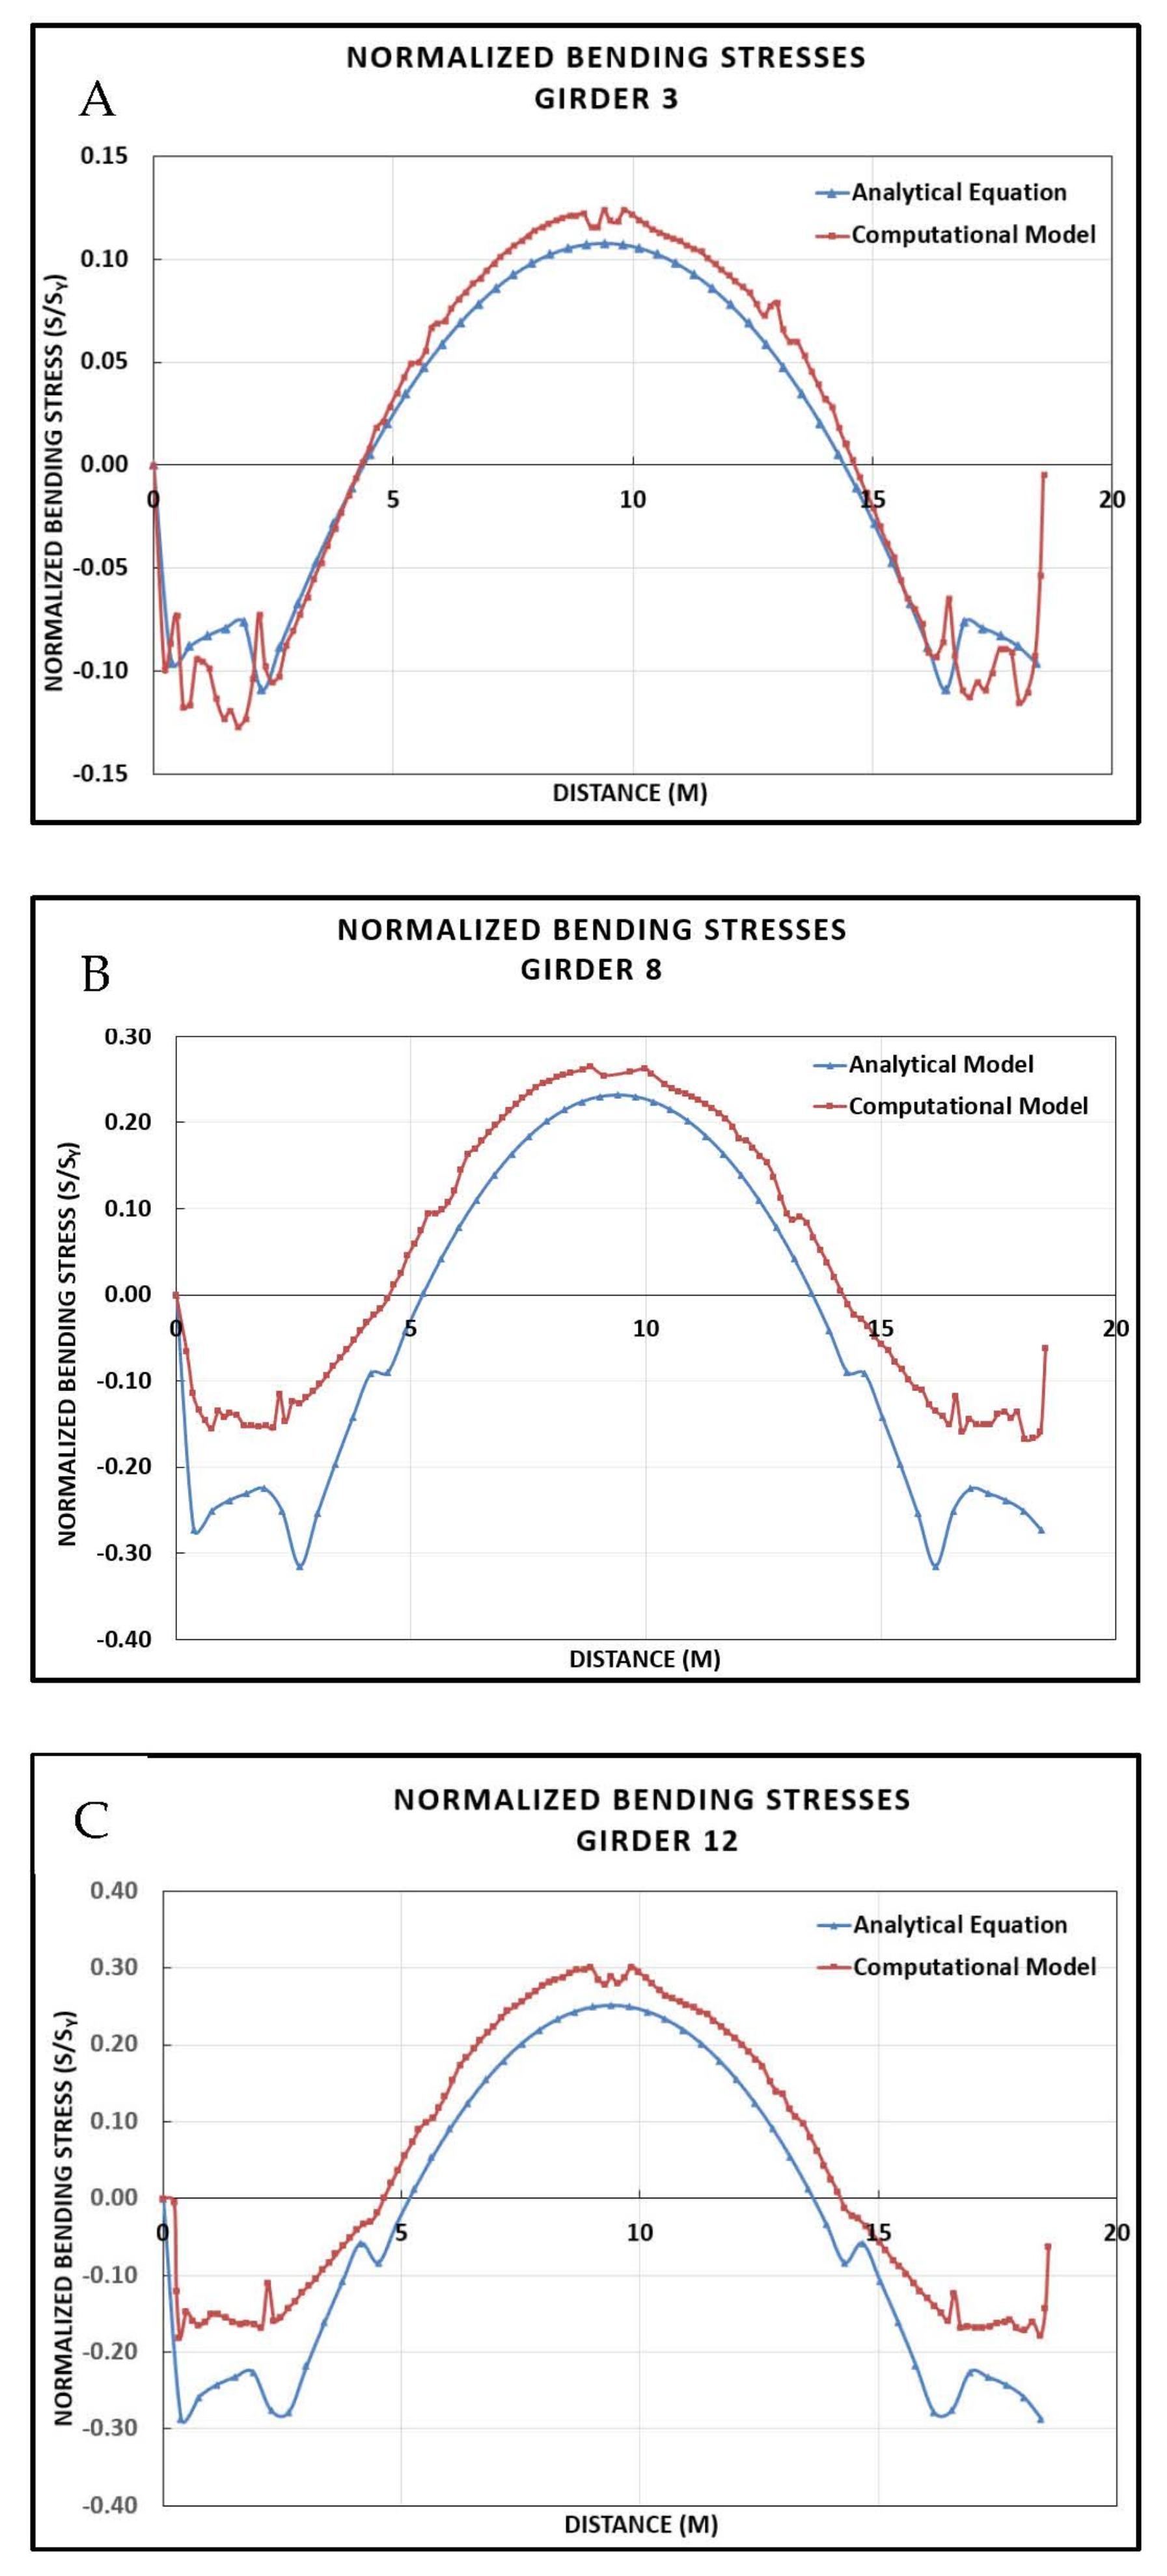
The model methodology is based on a benchmark problem of L&D27 that was verified by experimental strain data from the lock 27 [28]. The model was also analytically validated using displacements and load boundary conditions defined by ETL 1110-2-584 [24]. Figure 10 compares the analytical and computational bending stresses of three different girders, from the top, middle, and bottom of the gate.
Due to the hydrostatic pressure, the maximum flexure stress increases from approximately 41.4 MPa to 106.8 MPa from top to bottom of the miter gate. The numerical and analytical behavior of the girders show a correlation, where the maximum tensile bending stress are located in the middle while the ends experience compression. As seen in Figure 10A–C, there is variation between the analytical and computational bending stresses. The variations are attributed to the simplicity of the analytical model, while the computational model has more intricacies due to stiffeners and geometry at the end of the girder.
4. Numerical Simulations
A parametric analysis of the Quoin block’s deterioration stages was performed to evaluate stress changes with various levels of deterioration. The extent of deterioration was varied via systematic removal of the displacement boundary conditions from the bottom of the contact block and upward in segments of 0, 5, 10, 15, and 25 percent of its total height (Table 2) (Figure 9). This was accomplished by incrementally removing the boundary conditions at the quoin block from no deterioration (zero percent) to the following: 1.22 m (5 percent), 2.44 m (10 percent), 4.24 m (15 percent), and 6.20 m (25 percent) of the total quoin block height, 24.87 m, from the bottom. Table 2 lists the extent of deterioration the block as a percentage of the total height of the miter gate (24.8 m) and the corresponding length in meters. In actual conditions, the deteriorated quoin block section may have some contacts with the wall that transfer a limited number of compressive forces to the wall; however, as a conservative measure, no contact was allowed in the deteriorated section. This maximized the load transfer of the remaining elements. All solutions in this study were solved with the miter gate in the mitered (closed) position. Horizontal and vertical stresses were captured from the thrust diaphragm after each simulation.
5. Horizontal and Vertical Stresses in the Thrust Diaphragm
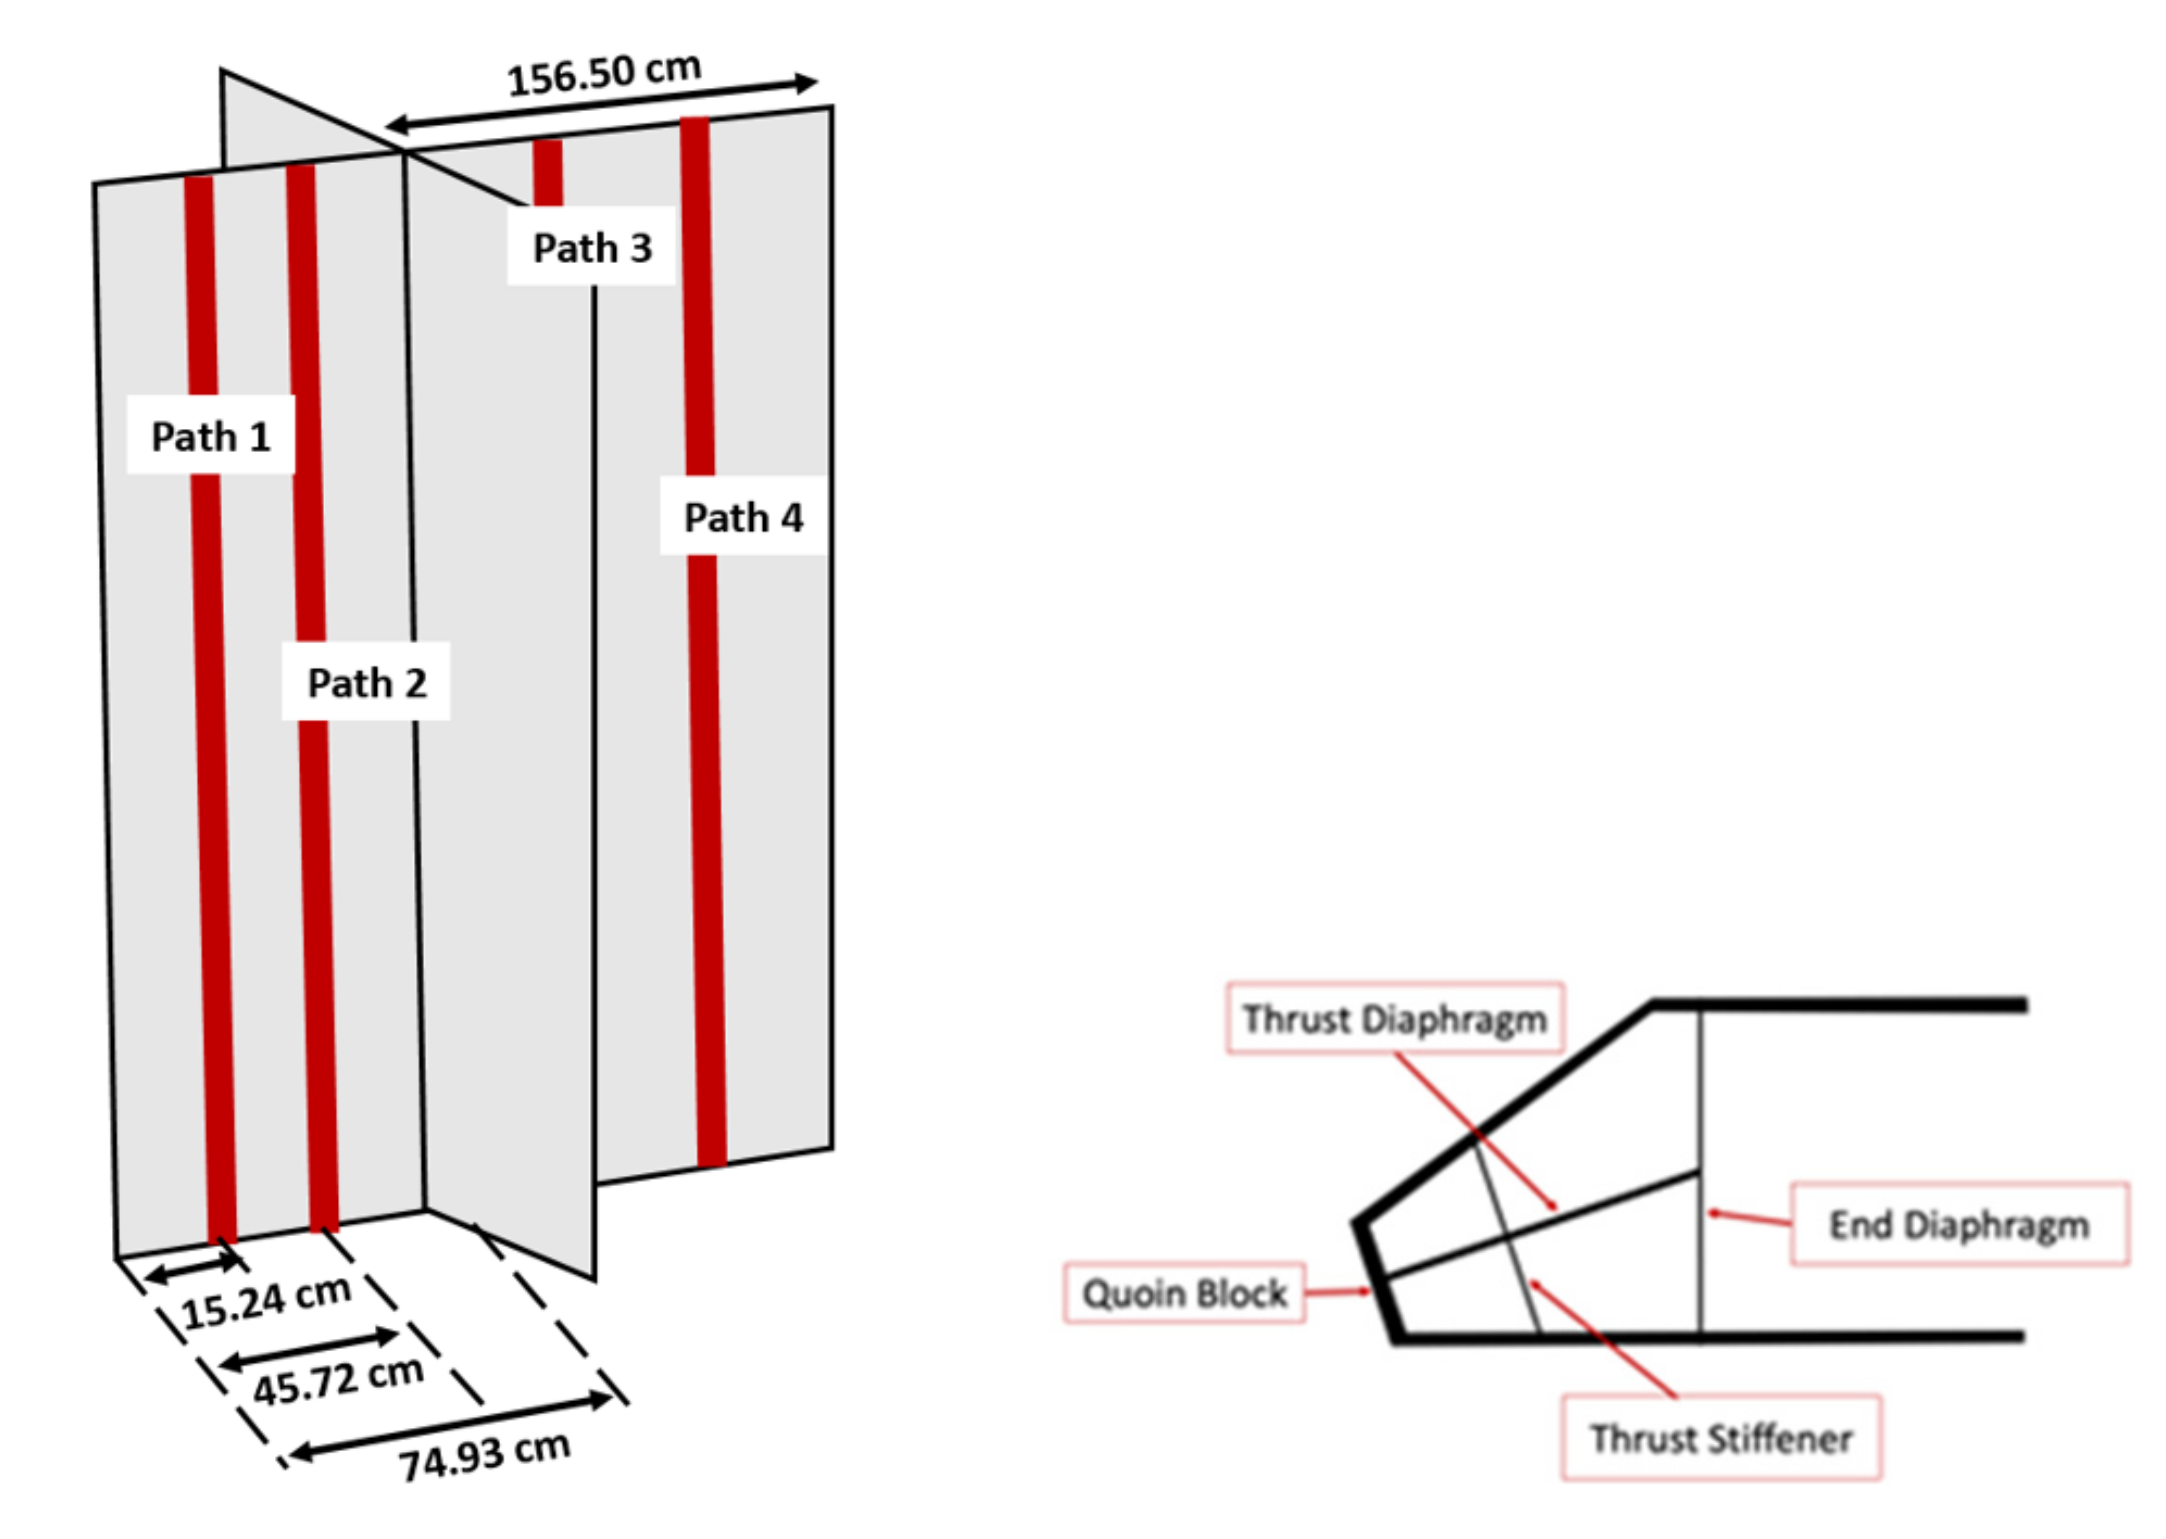
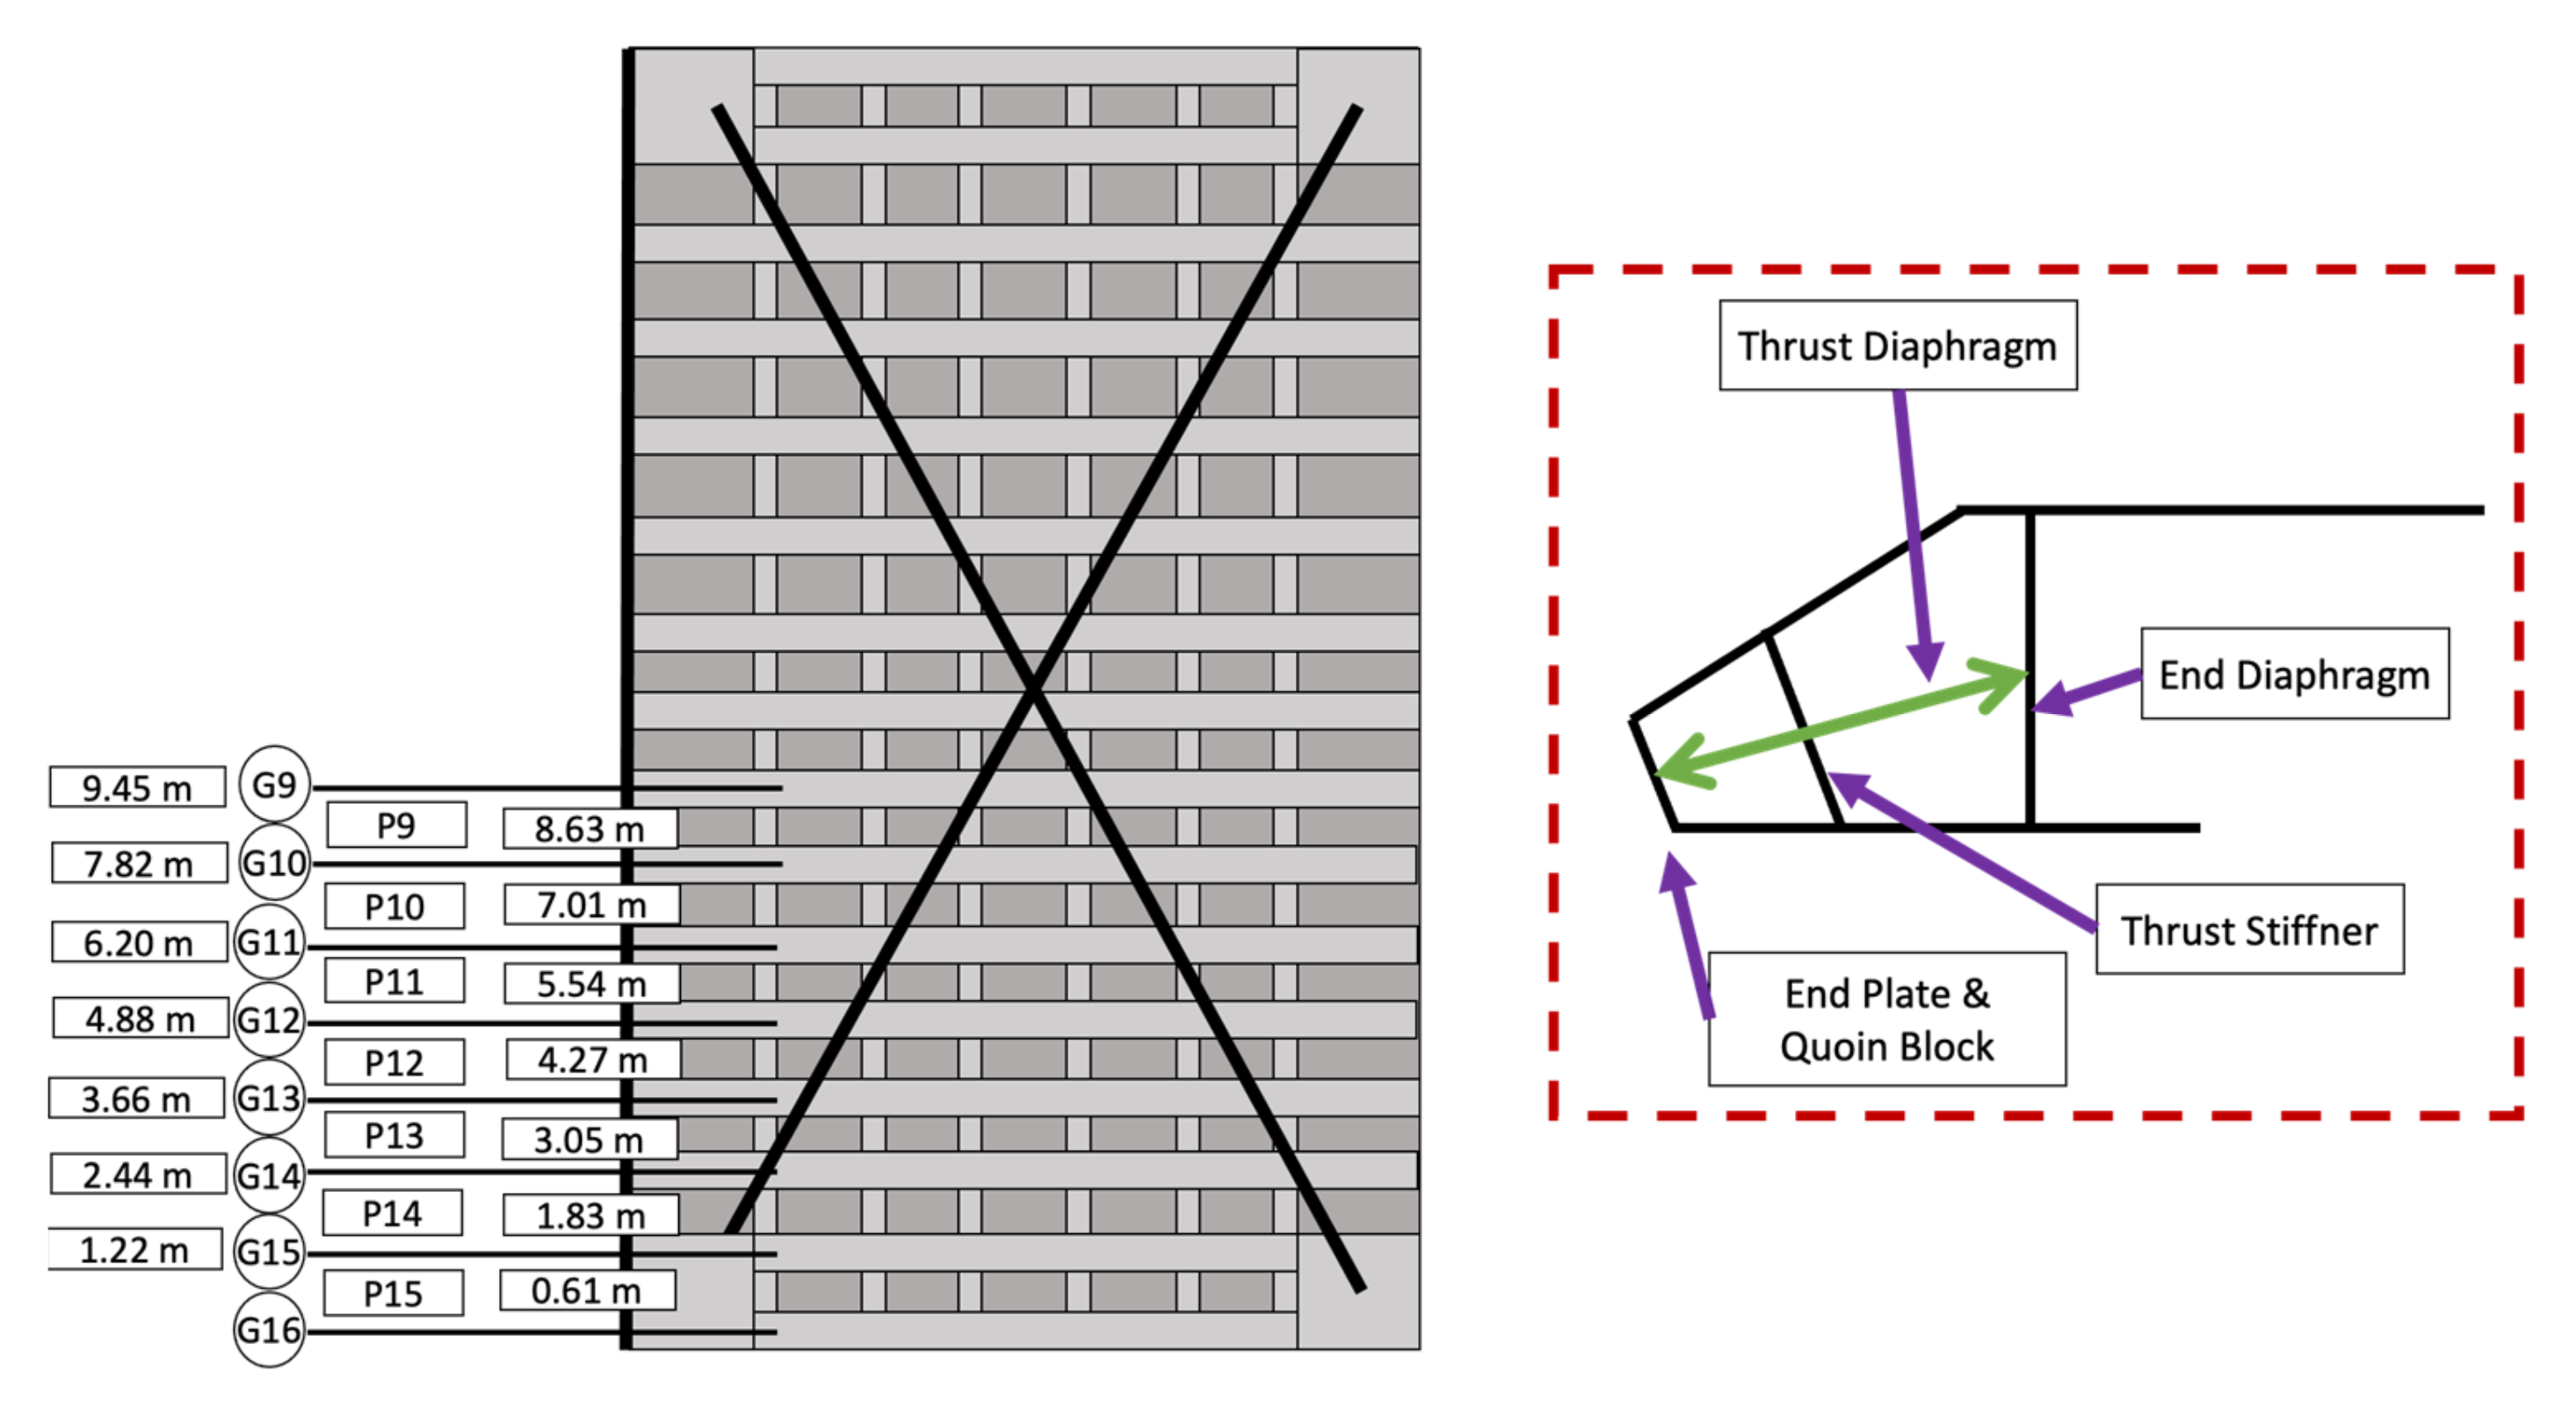
Stresses were sampled along vertical and horizontal paths that were within the tapered end of the gate. All paths were limited to the thrust diaphragm (Figure 11 and Figure 12). Vertical paths spanned the entire height of the thrust diaphragm from the top to bottom of the gate (Figure 11). Vertical Path 1 is located at 15.24 cm from the end plate and is expected to be outside the zone of Saint Venant’s effects. Vertical Path 2 is at 45.72 cm from the end plate, and vertical Paths 3 and 4 divide the distance between the stiffener and end diaphragm into three equal parts (Figure 11). The seven horizontal paths were congruent with seven panels and spanned the full width (218.44 cm) of the thrust diaphragm (pictured in green in Figure 12). The paths were selected at the centerline of girders web: 09, 10, 11, 12, 13, 14, 15 and the centerline of Panel 12 (P12) (Figure 12).
5.1. S11 Stresses along the Vertical Paths
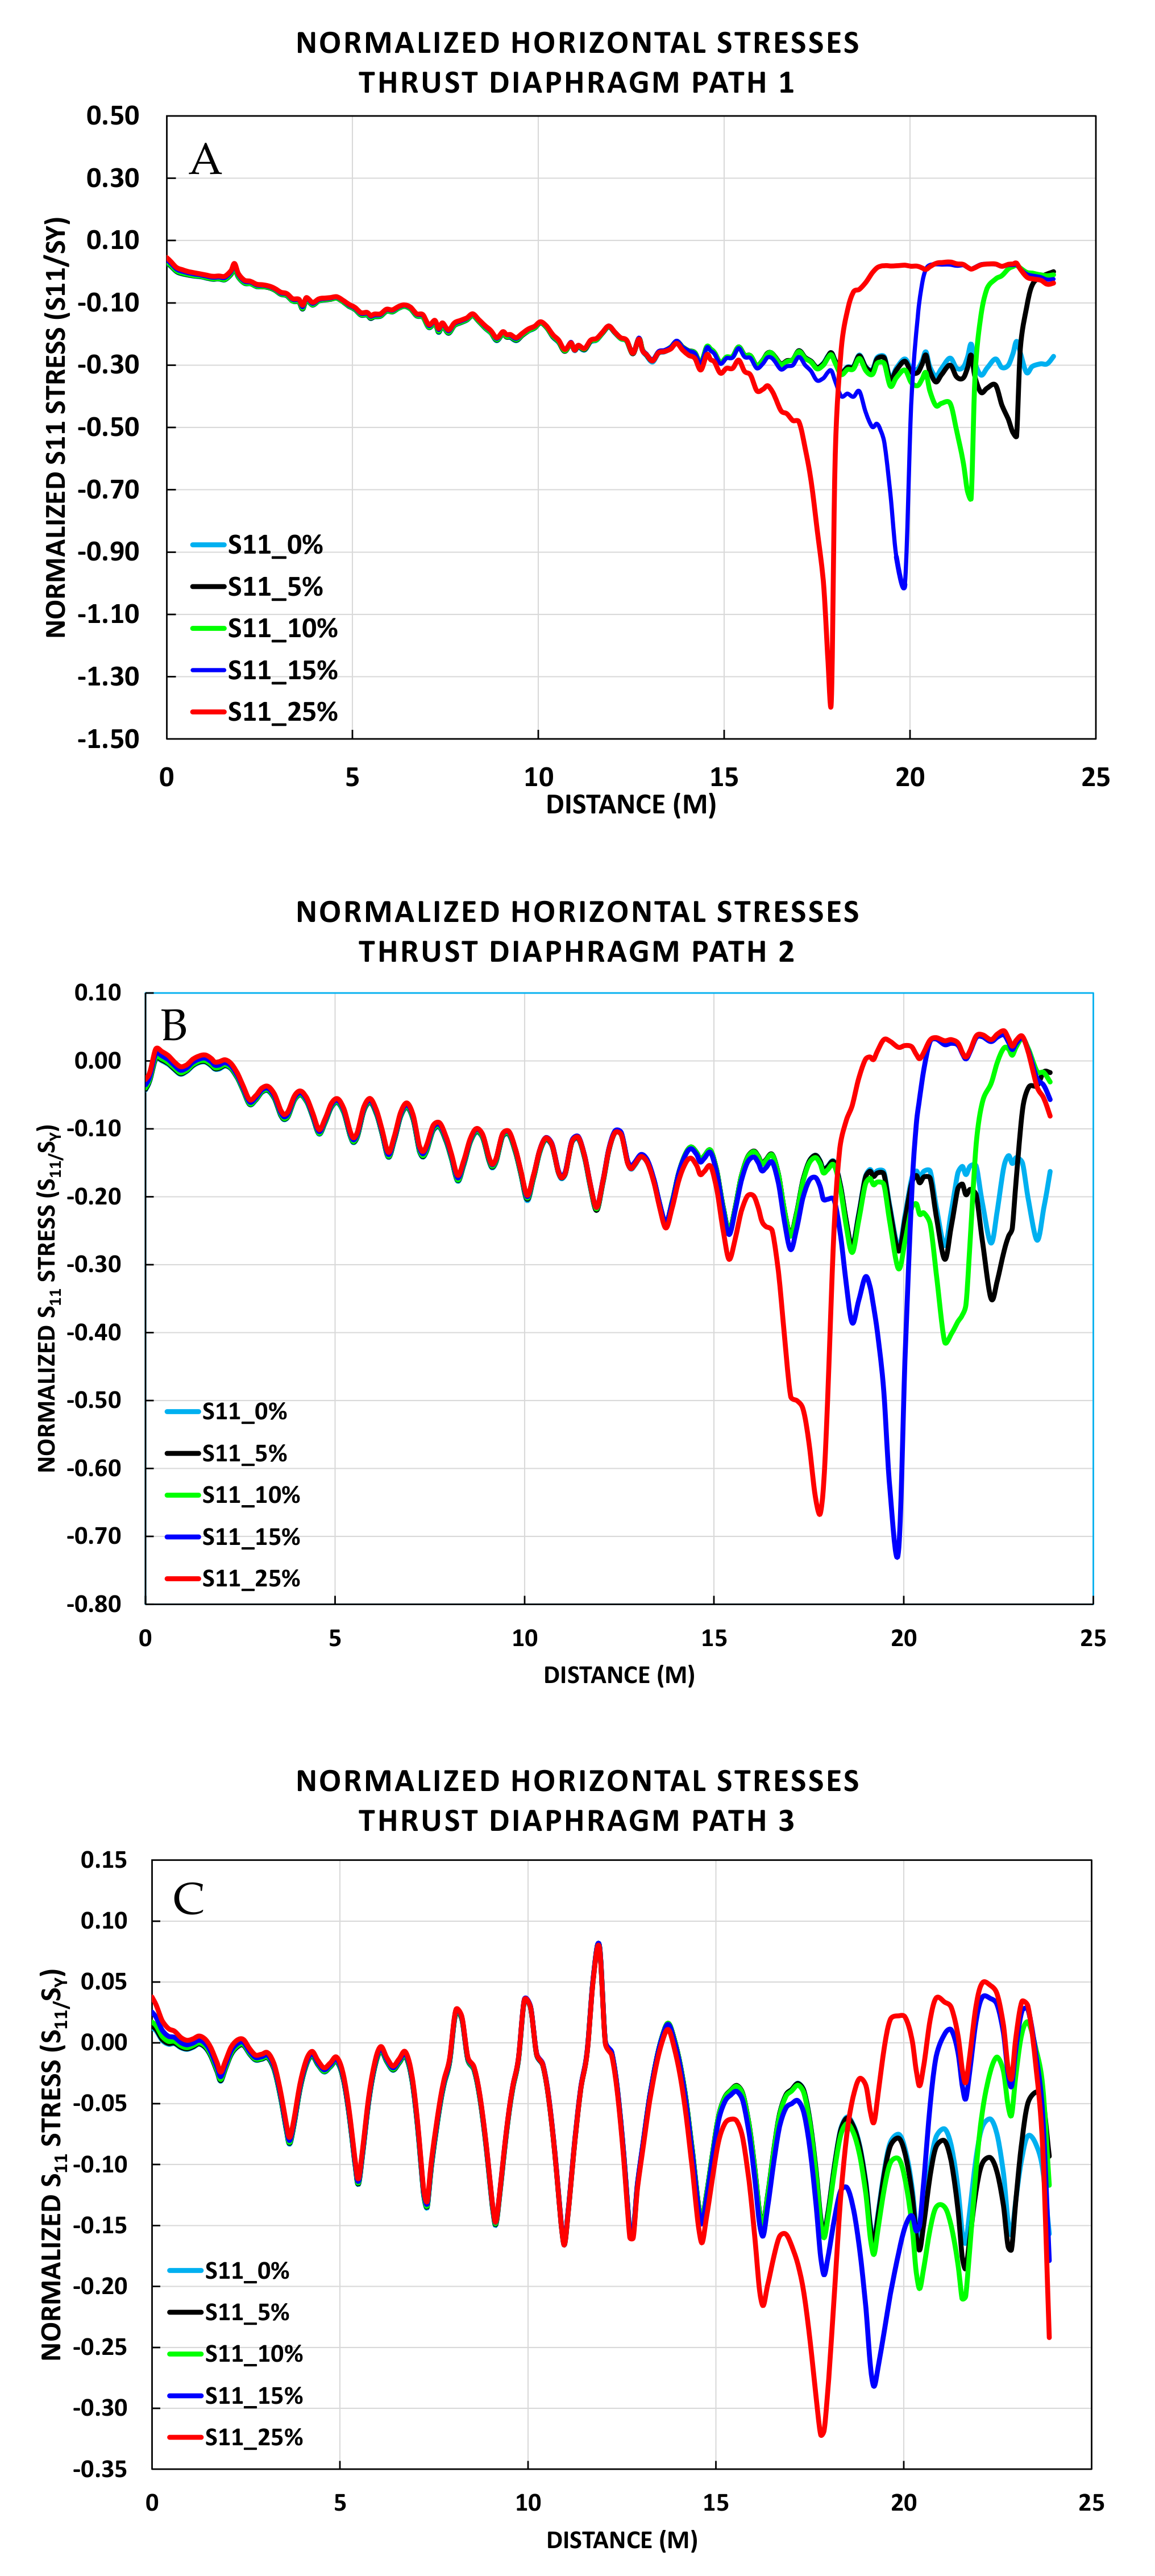
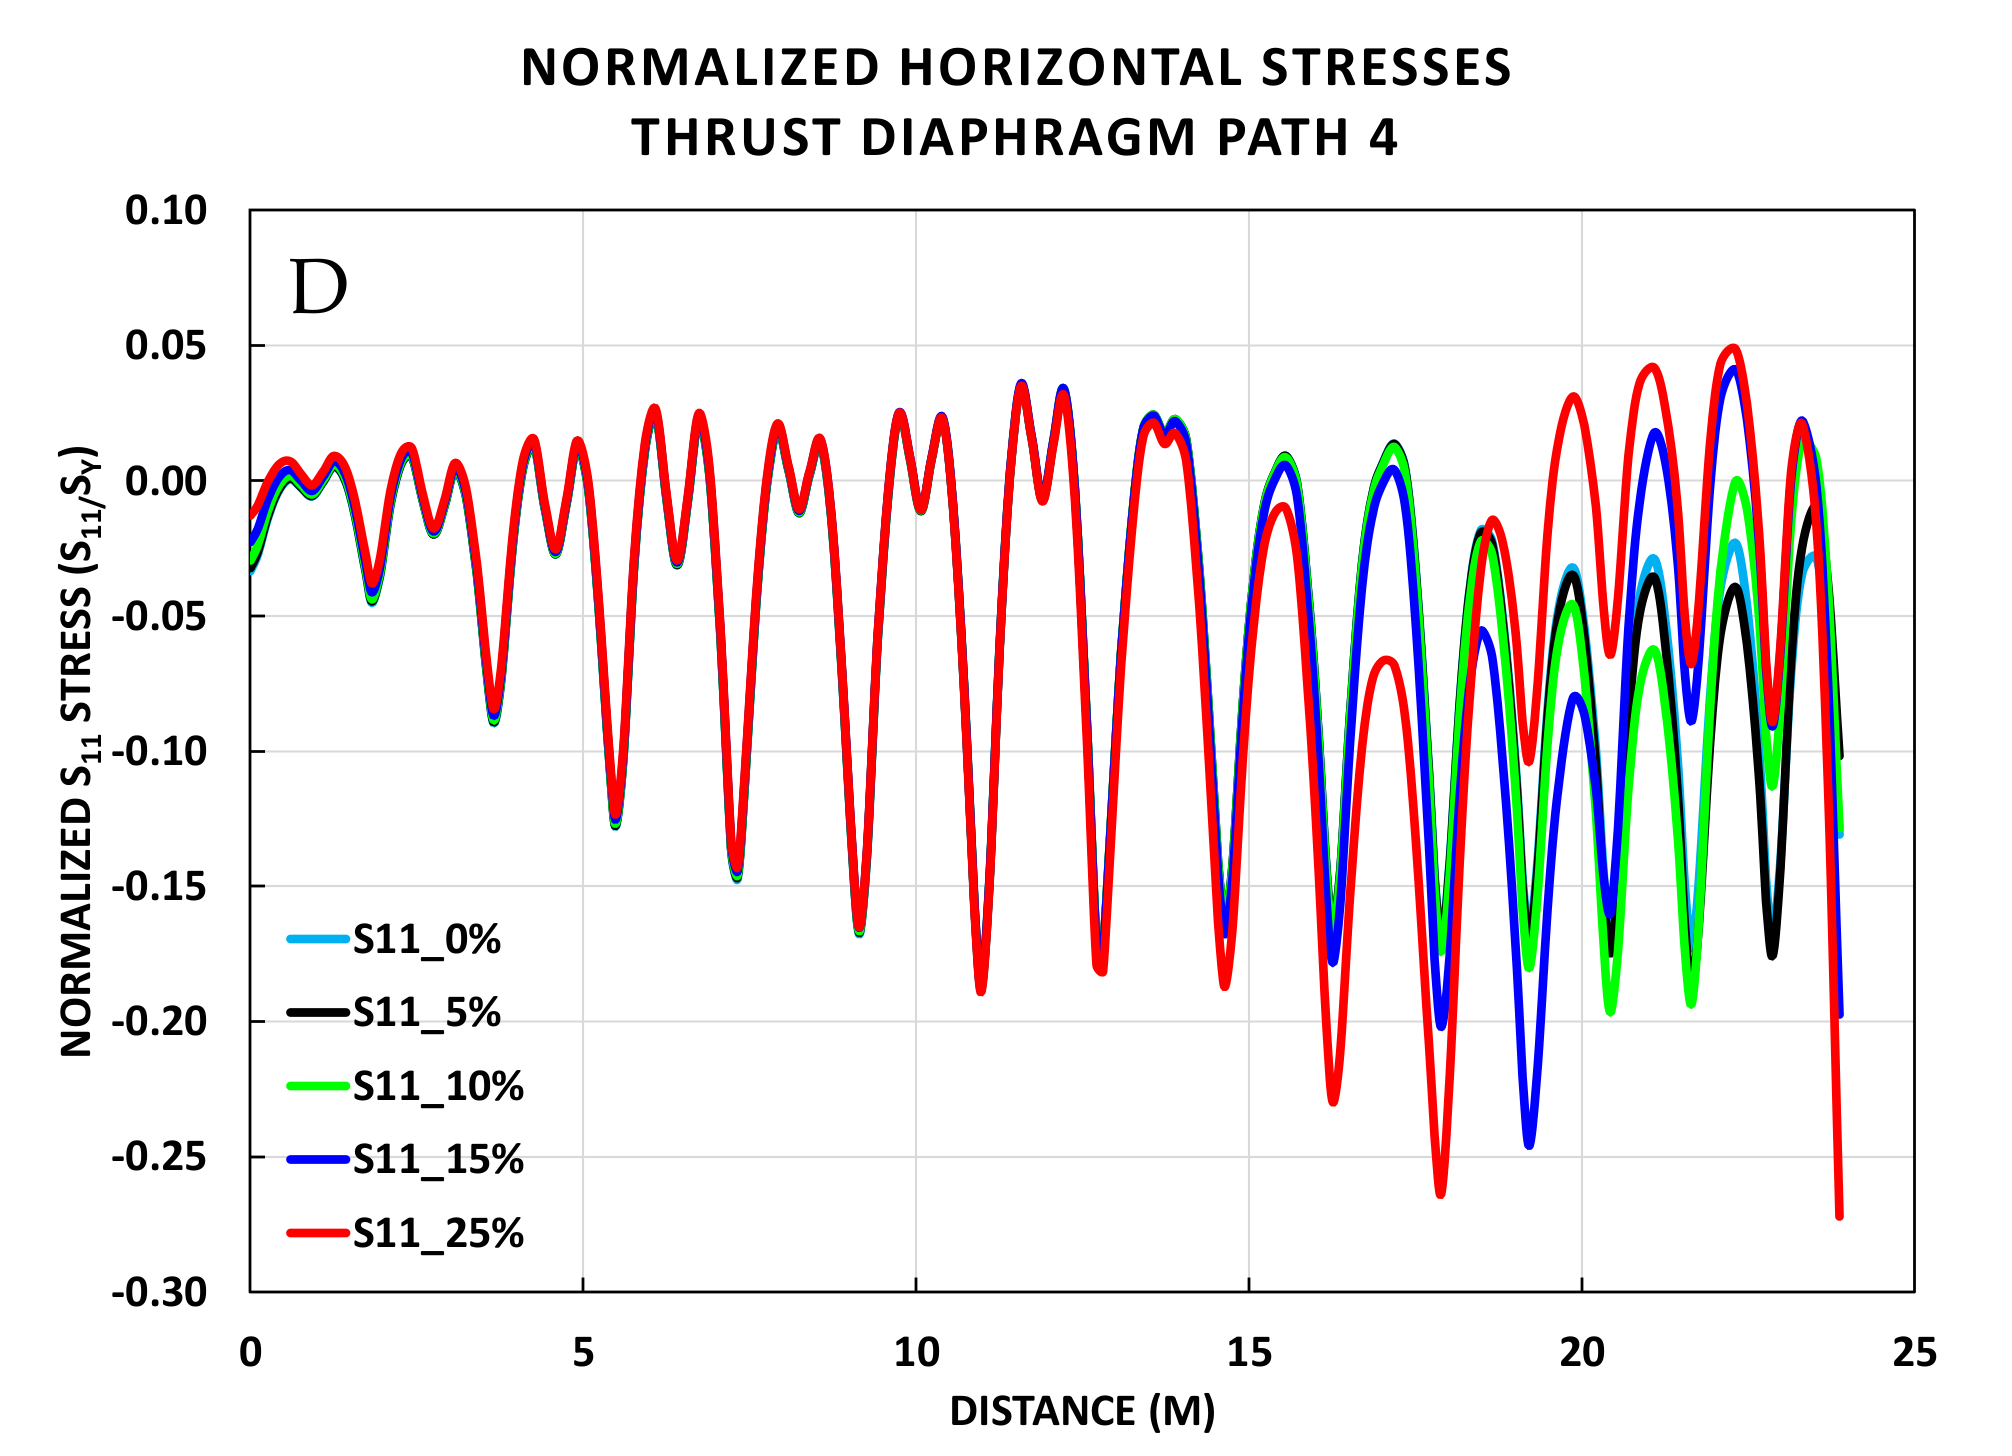
The horizontal stresses captured along the vertical paths are shown in Figure 13. The maximum influence on the thrust diaphragm by an increase in deterioration, occurs closest to the Quoin block, Path 1 (Figure 13). Increases of loading at the elevation of 1.24, 2.49, 3.73, and 6.22 m for 5, 10, 15, and 25 percent, respectively, are observed in Figure 13.
Figure 13 clearly shows that the path closest to the end plate achieved the highest overall stresses (compression and tension). Figure 13 also shows that without deterioration, the gate is in compression at the location of maximum hydrostatic pressure. As deterioration occurs, there is a change in stress state from compression to tension. The maximum compressive stress occurs at the point of the initial deterioration. The tensile stresses occur in the deteriorated portion of the thrust diaphragm.
The following stress amplitude increases from the control model are observed: from 103 MPa to 172 MPa for 5% deterioration, 103 MPa to 250 MPa for 10% deterioration, 97 MPa to 346 MPa for 15% and 92 MPa to 476 MPa for 25% deterioration. The results in Figure 13 are normalized against the yield stress of steel. Therefore, any point in the graph in Figure 13 above 1 or −1 will indicate yielding. Figure 13A indicates that for Path 1 deterioration between 10 and 15% will cause the plate to yield.
Figure 13B presents Path 2′s behavior. Compared to Path 1 the stress magnitudes are smaller on Path 2. Path 1 experiences normalized stress reductions of 0.486, 0.77, 0.58, and 0.69 for 25%, 15%, 10%, and 5% of degradation, respectively, as compared to Path 2. None of the deteriorations caused the plates to reach the yielding strength along Path 2.
5.2. S22 Stresses along Vertical Paths
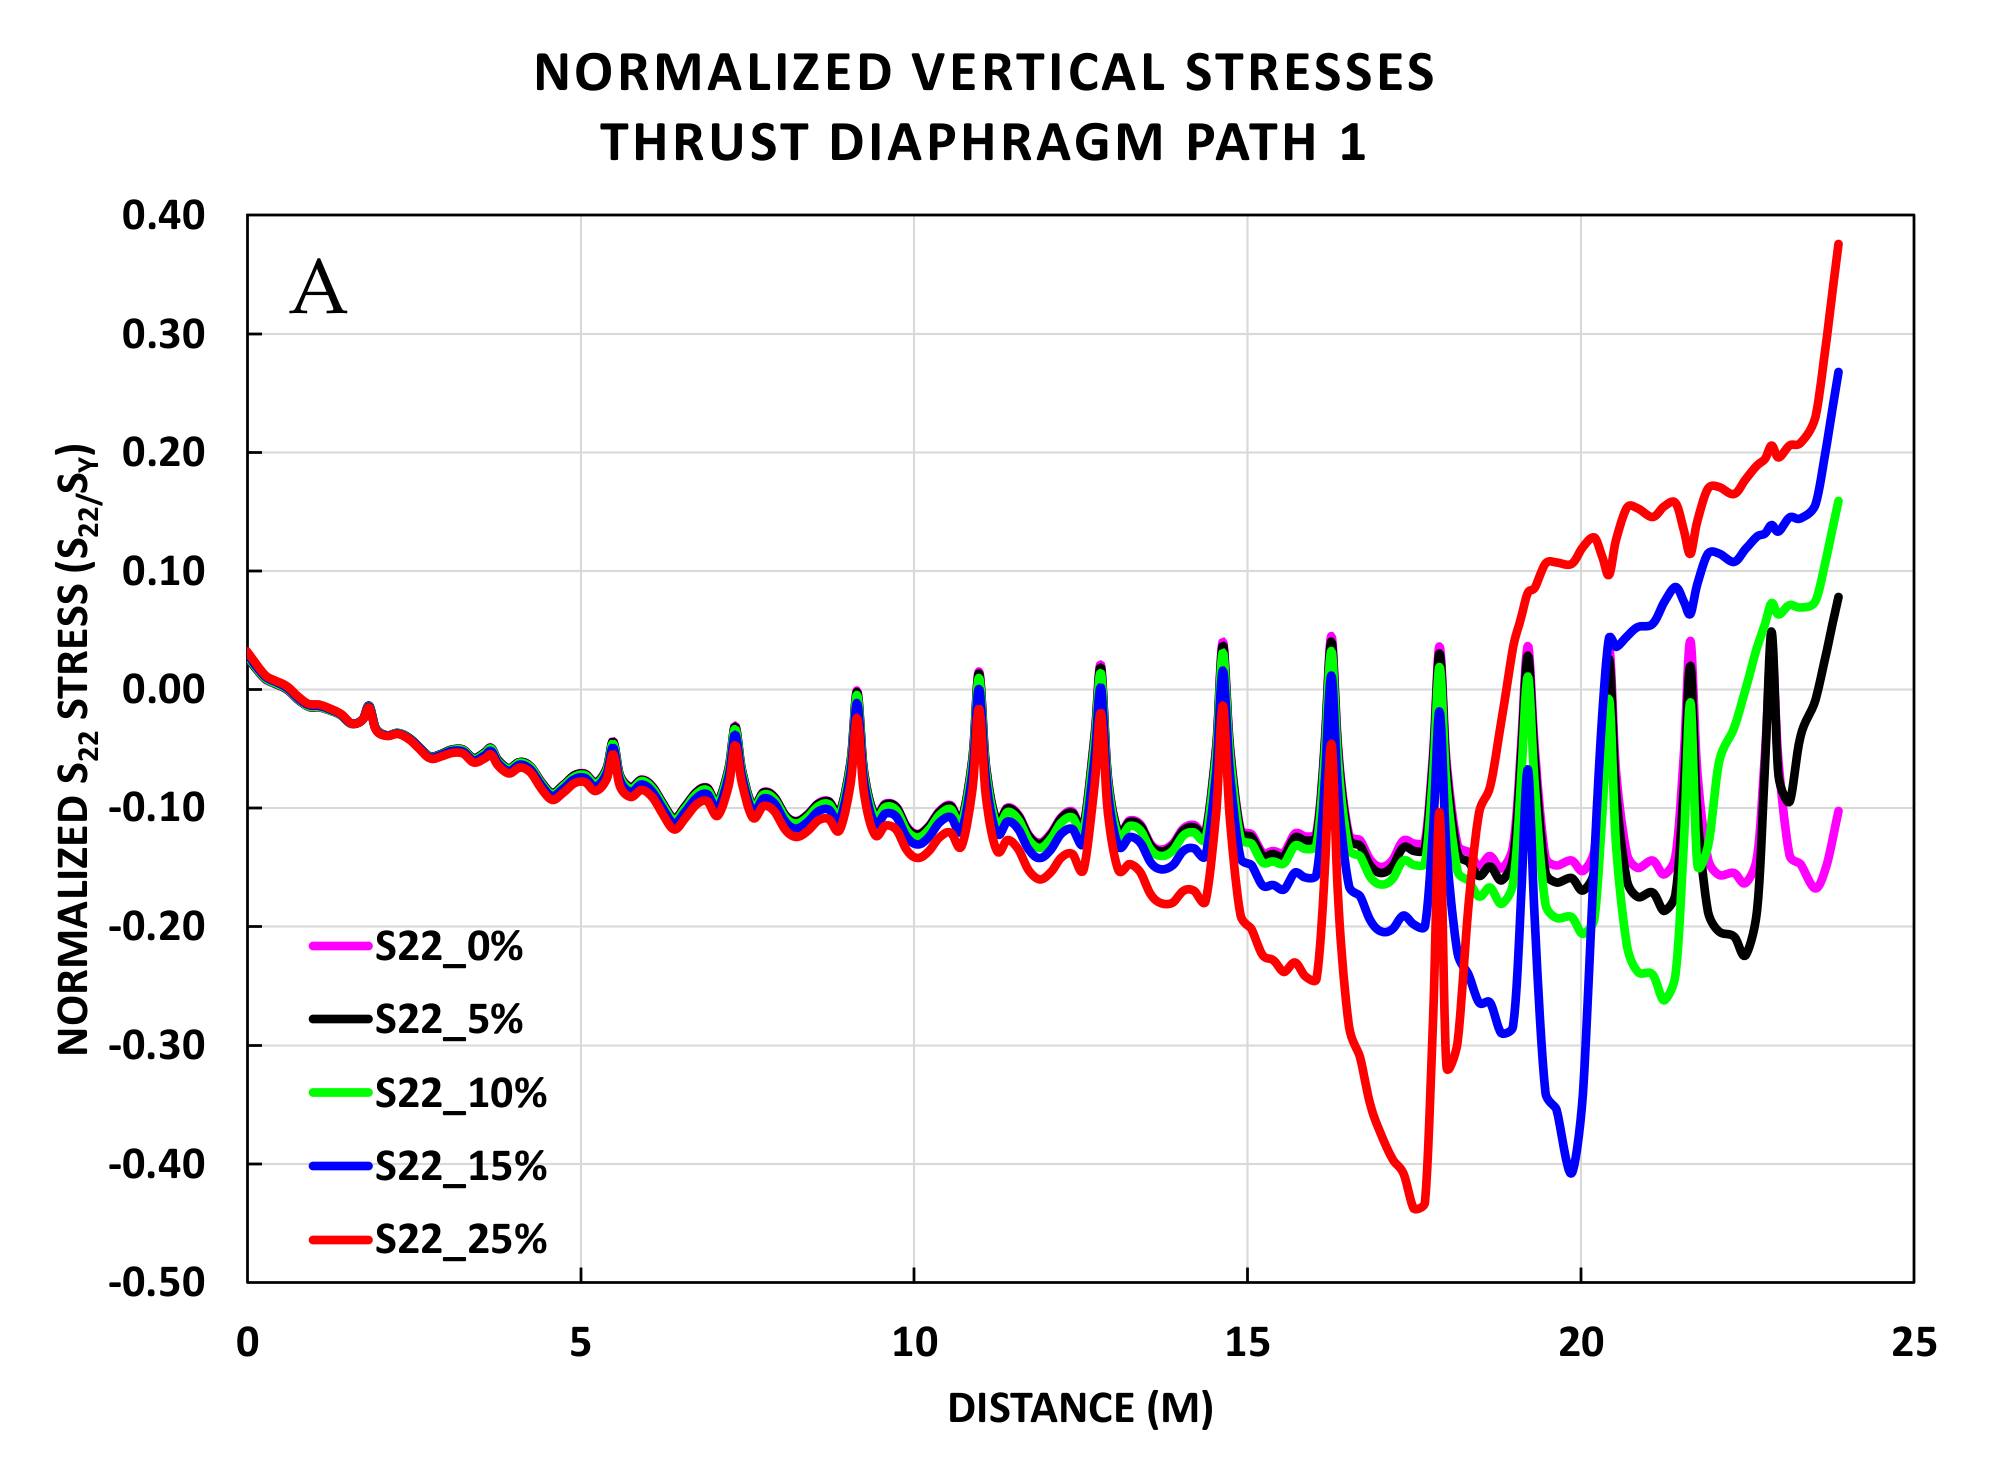
The vertical stresses (Figure 14A,B) taken from the four vertical paths have a maximum compressive stress at the point where the deterioration occurs. The stresses in the deteriorated section are in the tension regime with the maximum tensile stresses redistributing to the pintle socket. Additionally, a bending component develops on the trust diaphragm section that does not make contact to the wall. These bending stresses demonstrate that the thrust diaphragm is in tension at two girders below the deterioration’s endpoint. Between 10 and 15% deterioration in Path 1, the compressive stress increases by a factor of 1.6.
Figure 14C,D shows that the maximum, normalized, vertical stresses are 0.26 (S22/Sy) and 0.28 (S22/Sy), along vertical paths 3 and 4, respectively. These maximum stresses occur closer to the end diaphragm and behind the thrust stiffener. The bending stiffness provided by the end diaphragm and the thrust stiffener reduce the bending stress component generated on these paths, as compared to the paths 1 and 2.
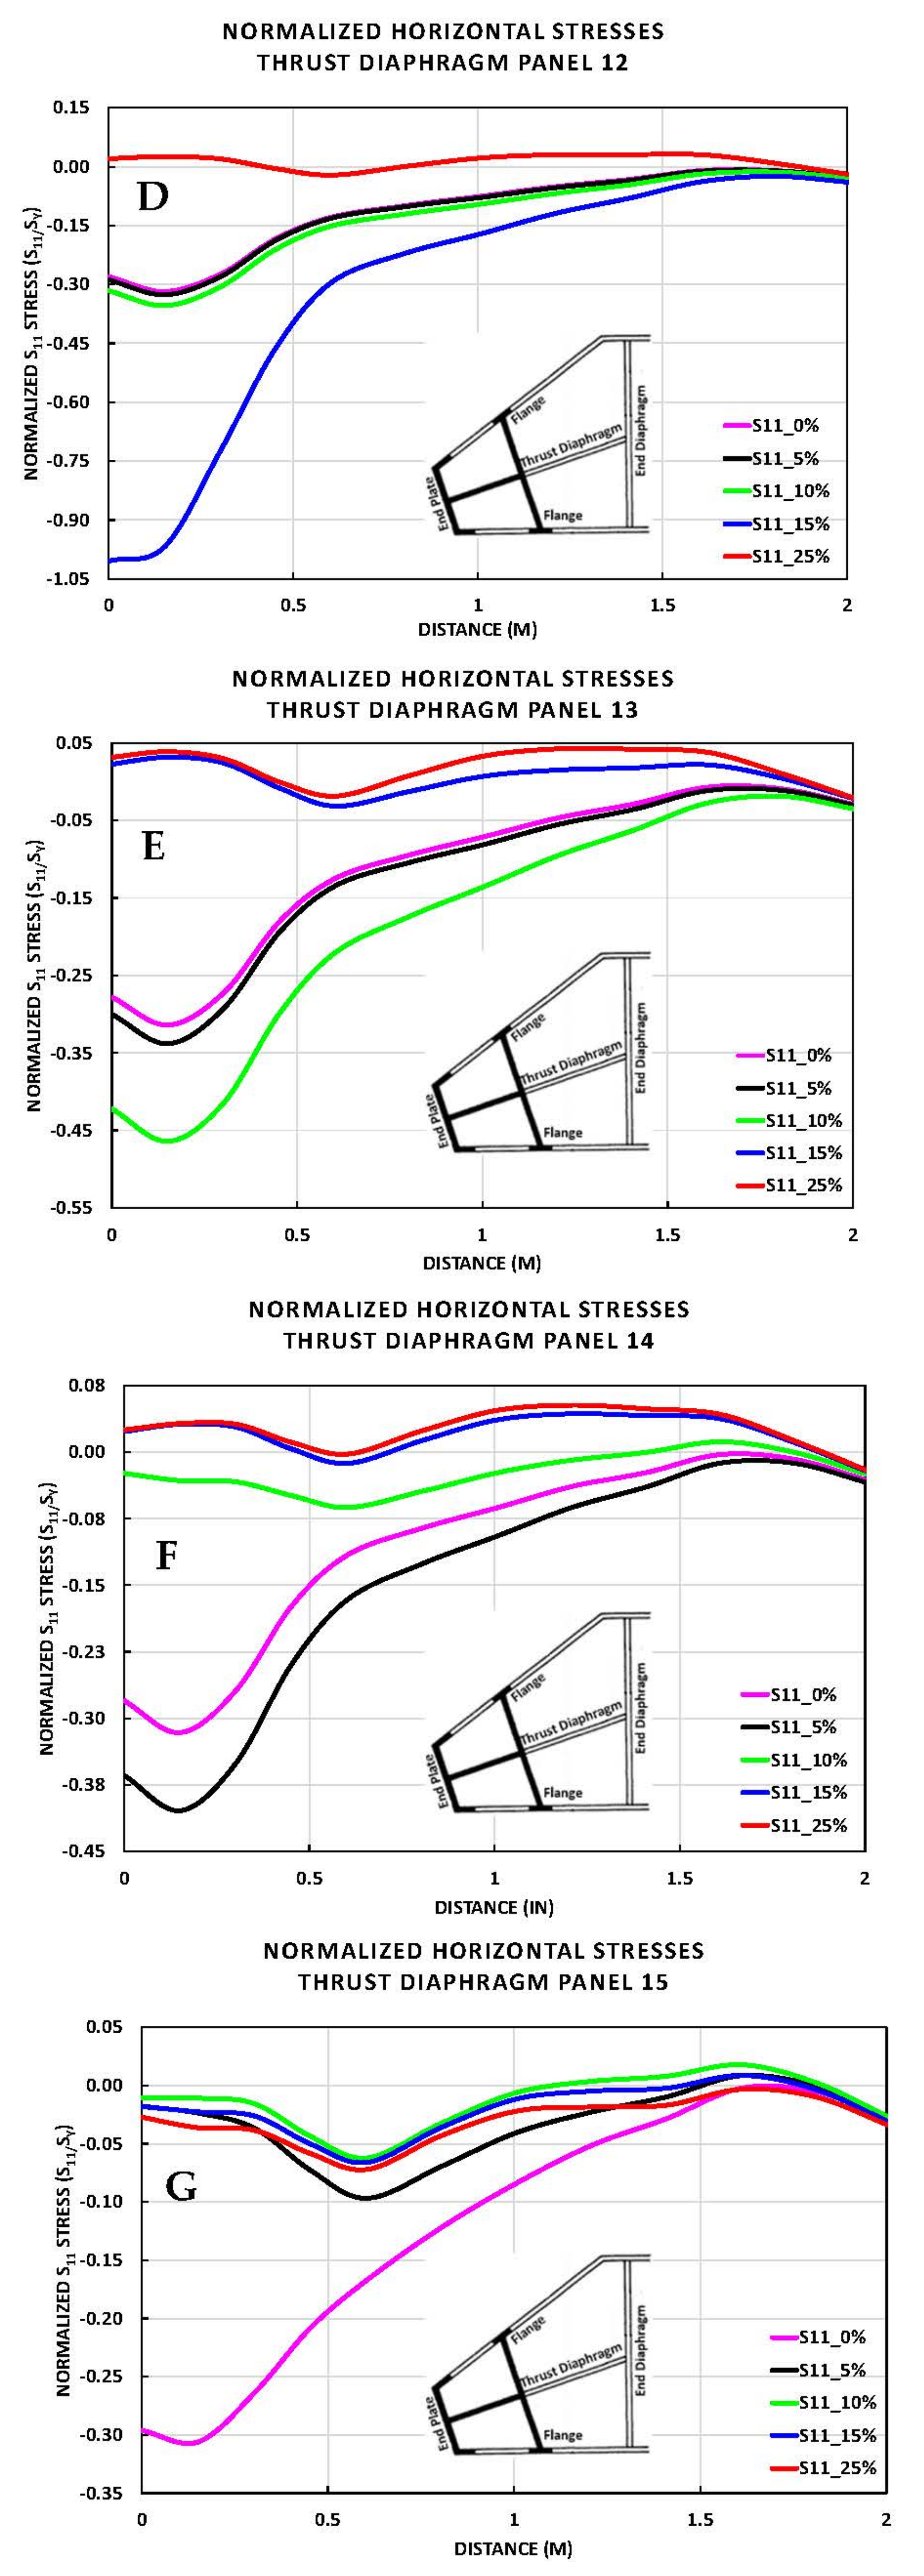
5.3. S11 Stresses on Horizontal Paths
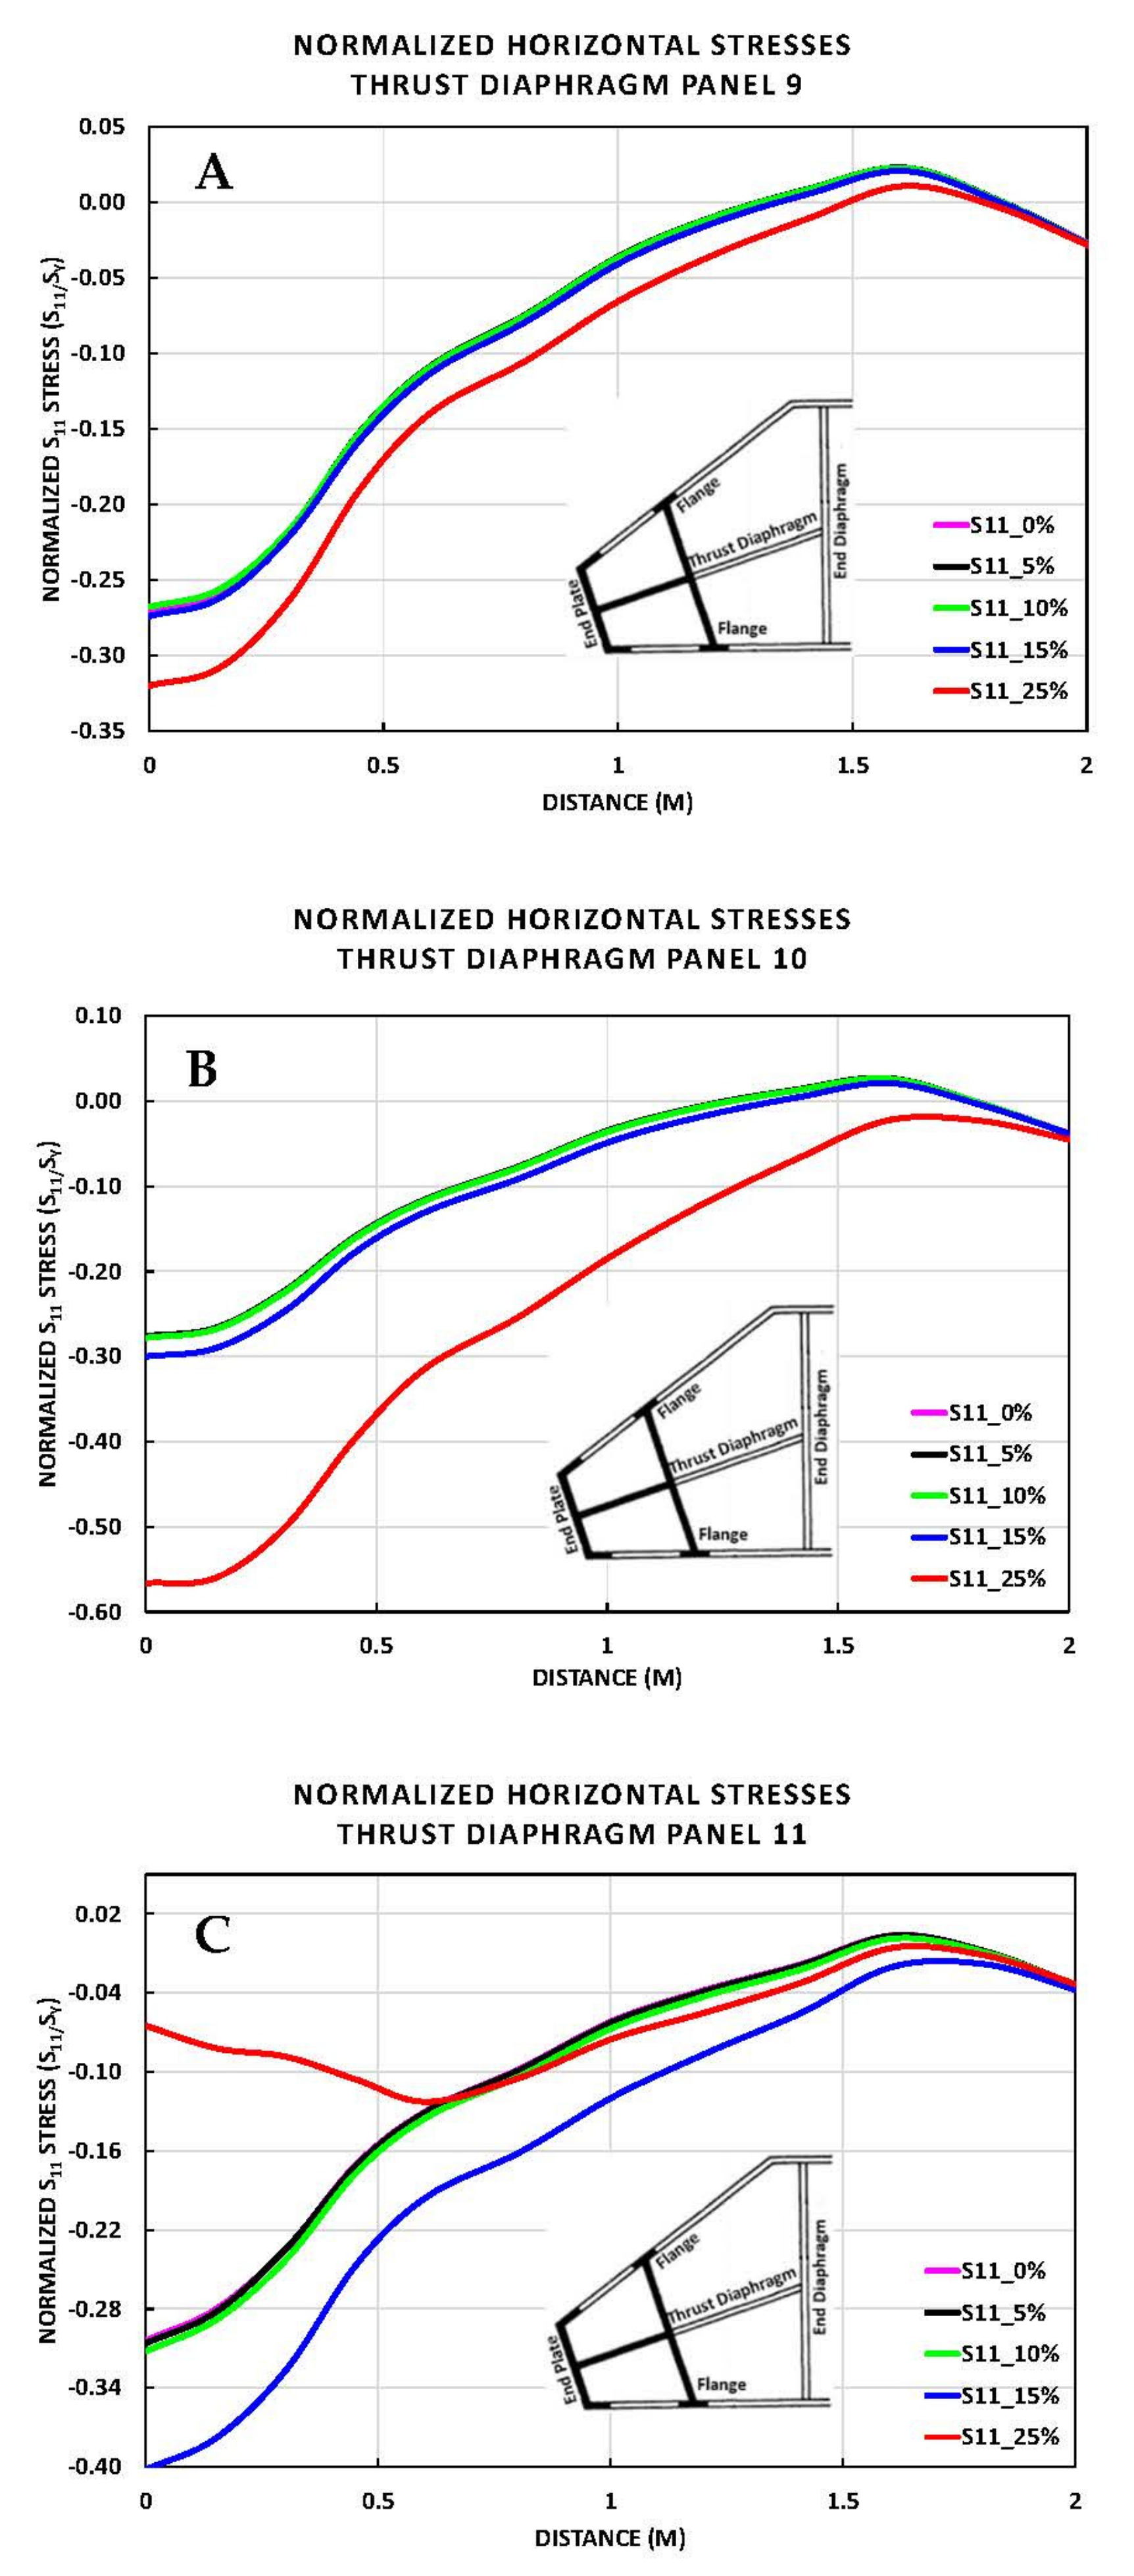
Seven horizontal paths, along the length of the thrust diaphragm (Figure 12), at different elevations were selected to observe the horizontal and vertical stresses. Figure 15A,B correspond with the path at Panel 9 and 10. Due to the lower hydrostatic pressures the deterioration effects for 5–15% are negligible, however there is a 6% and 24% stress increase at 25% of deterioration, respectively. This increase in stress at 25% deterioration from Panel 9 to Panel 10 is due to the fact that Panel 10 is closer to the point of deterioration. Figure 16C shows the effect of the deterioration due to the change in behavior of the stresses at 25% deterioration, as Panel 11 is below the 25% deterioration point. For Panel 11 (Figure 15C), since there is no contact at 25% of deterioration, there is a drastic decrease of compressive stresses. The stresses at 25% deterioration in Panel 12 (Figure 15D), are essentially 0 because there is a Panel in between the deterioration point and the stresses. At 15% of deterioration, the stresses are at their maximum, almost yielding, since the location where the stresses were collected is extremely close to the deterioration point. Panels 13 through 15 (Figure 15E–G) follow similar behavior as discussed previously, due to the different path height vs. deterioration level.
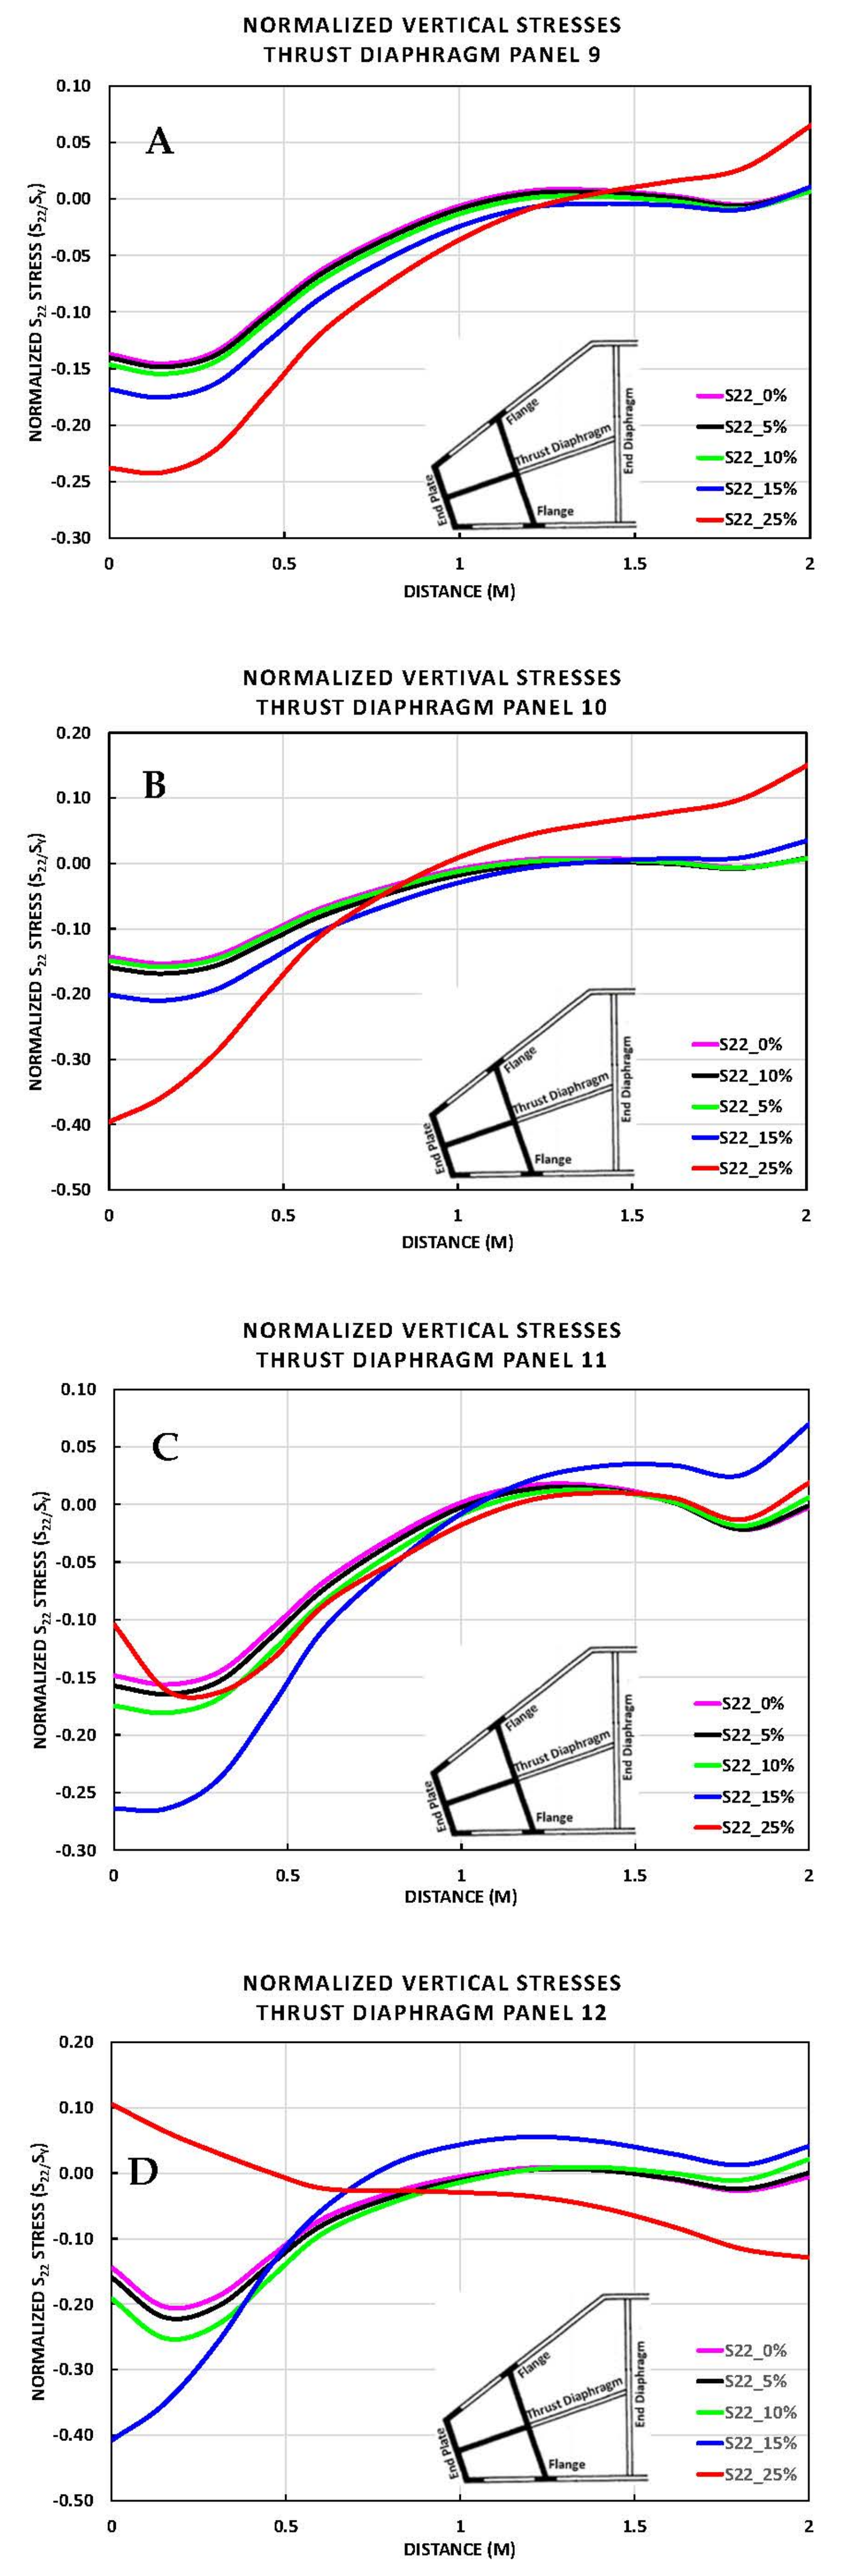
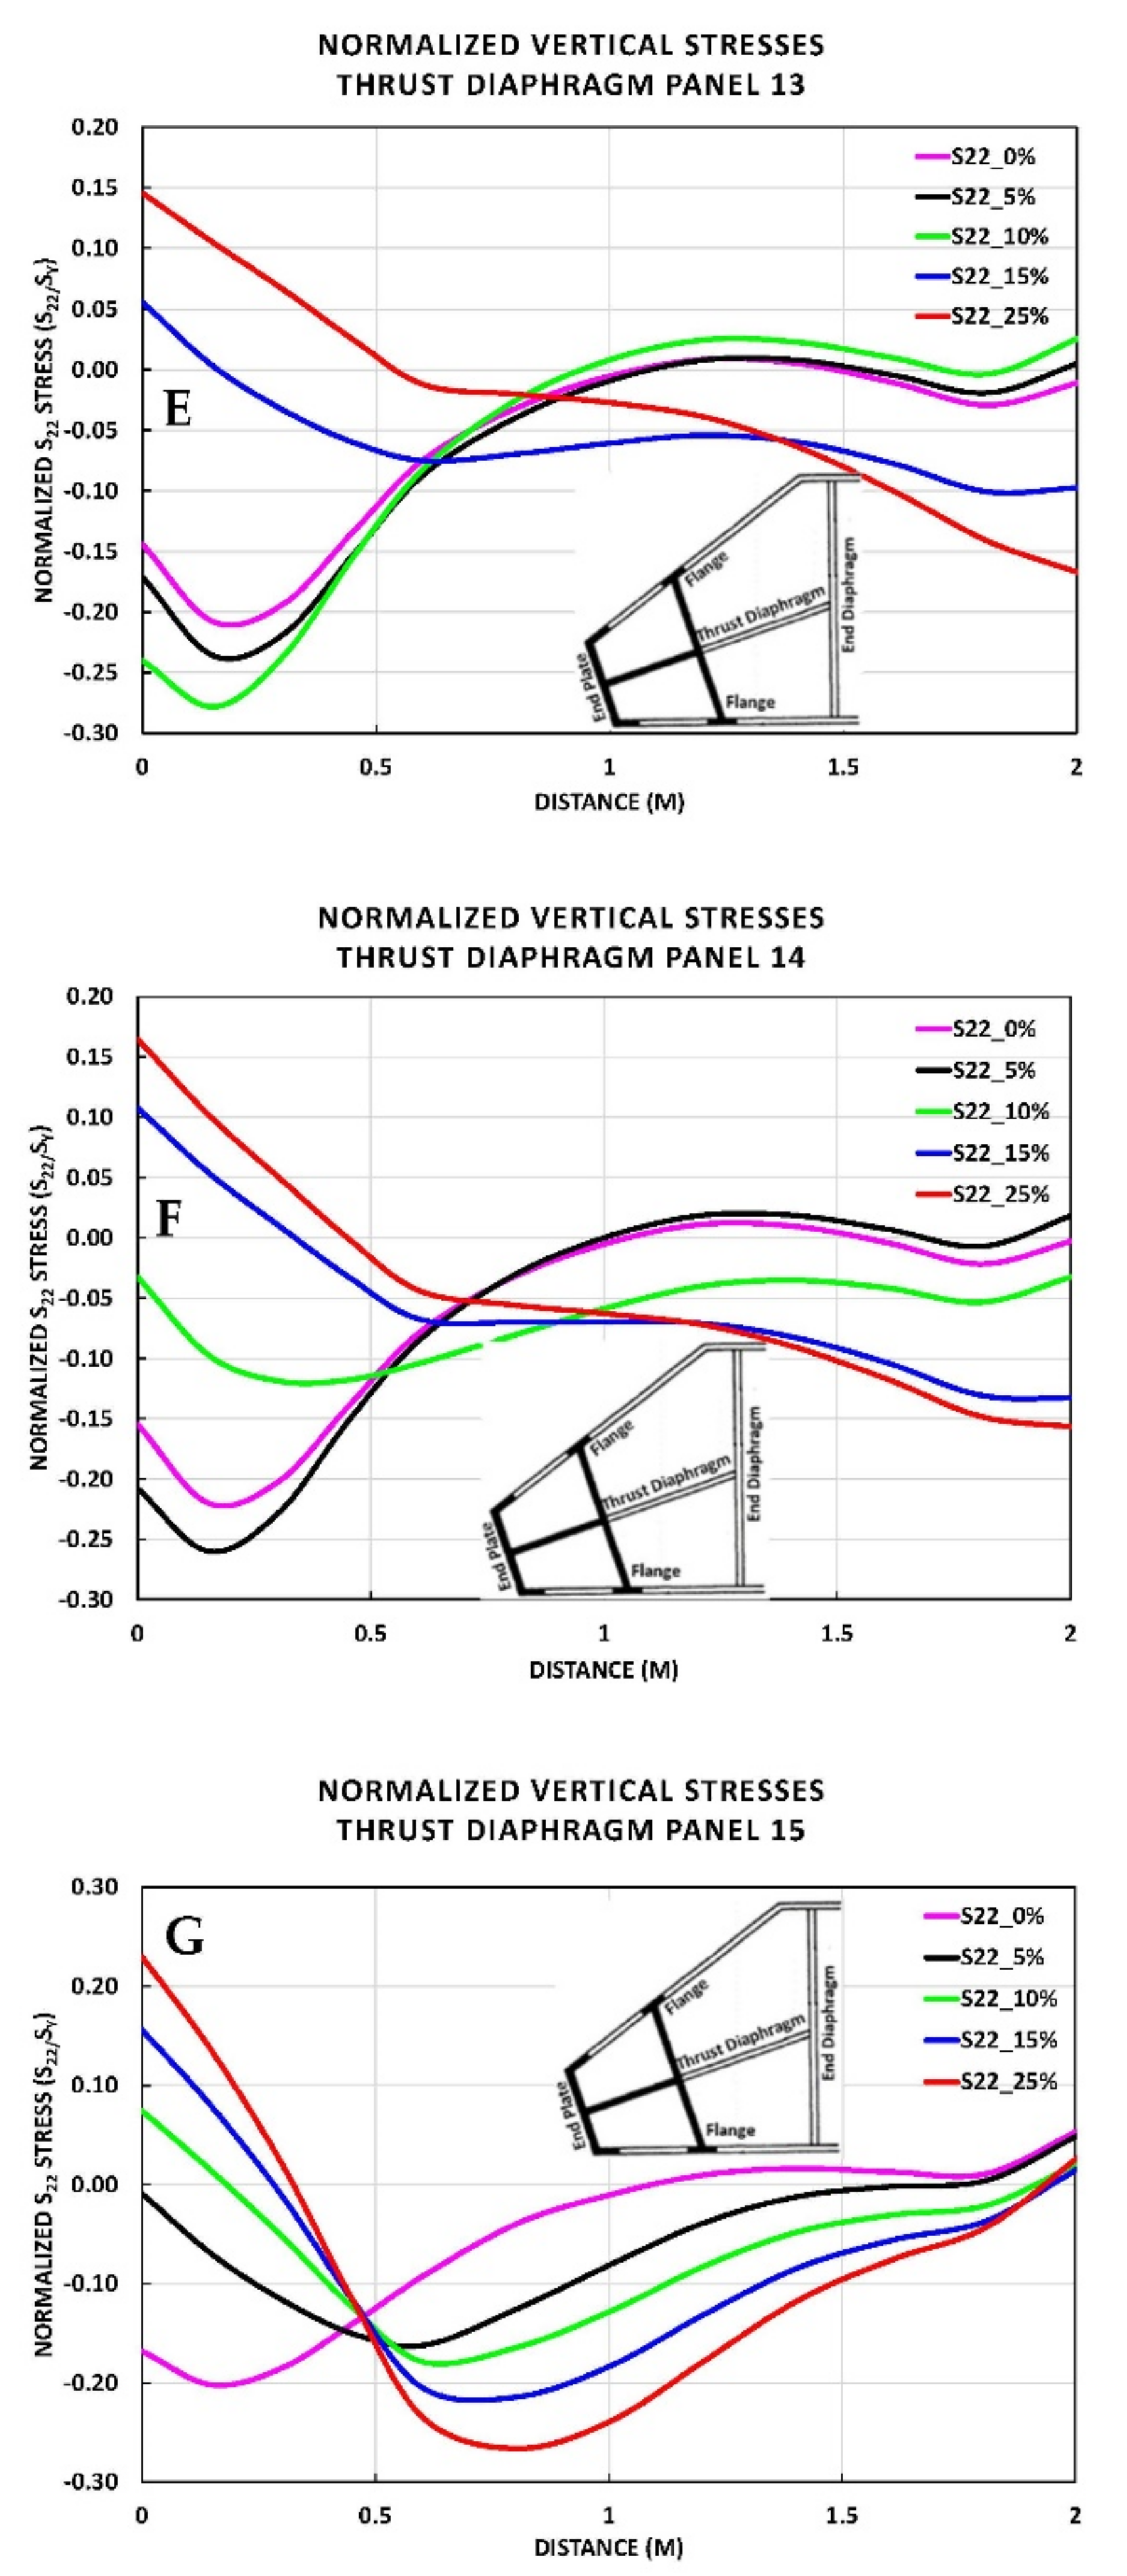
5.4. S22 Stresses along Horizontal Paths
Vertical stresses along the horizontal paths were captured at the same locations as the horizontal stresses (Figure 12) and are shown in Figure 16.
The quoin end of the thrust diaphragm is the point of maximum vertical stresses for the entire length of the miter gate as this section is designed to sustain and transfer the entire dead load of the gate to the pintle socket (quoin post). For Panels 9–10 (Figure 16A,B, due to the lower hydrostatic pressures the deterioration effects for 5–15% are negligible, however there is a 1.71 and 2.86 stress increase from the control at 25% of deterioration, respectively. This increase in stress at 25% deterioration from Panel 9 to Panel 10 is attributed to the proximity to the deterioration point; Panel 9 and 10 are 2.47 and 0.85 m above the 25% deterioration point, respectively. Panels 9 and 10 at 25% deterioration demonstrate a stress change from compression to tension, indicating an increase in bending. There is also an increase from the control by a factor of 6 and 13, respectively, in the 25% deterioration tensile stresses, along with a shift of the inflection point to the thrust diaphragm stiffener, between Panels 9 and 10.
Figure 16C (Panel 11) shows that the stresses generated by 25% deterioration are reduced by a factor of 0.67 at the contact point when compared to the control. Furthermore, Panel 11 shows an increase by a factor of 1.8 of the compressive stresses, from the control, at 15% deterioration. The effect of the 25% deterioration is seen influencing only a short portion of the thrust diaphragm (from the contact point), as the distance from the contact point increases the stresses return to the control behavior. The stresses at 15% follow the effects seen in Panel 10 for 25% deterioration, as 15% deterioration at Panel 11 is above, but approaching the deterioration line. This is due to the fact that the structure needs to maintain equilibrium, therefore there is an increase of loading at the next point of contact (Panel 11 for 15% deterioration).
It is important to note that Panel 12 (Figure 16D) is in line with the deterioration of 15% (Table 2). This accounts for the 2.67 increase in stress from the 15% deterioration compressive stresses to the control stresses. For 25% deterioration, the stress data point moves below the deterioration line, and the distance increases, there is a shift in the stress inflection point, from Panel 11 to Panel 12. The shift in inflection point leads to a stress state change from compression controlled to bending controlled, with tension at the contact point versus compression.
Figure 16G (Panel 15) demonstrates a significant behavior change in stresses as compared to the previous Panels (11–14). This behavior change can be attributed to the increase of stiffness in the section due to the pintle socket (Figure 5 and Figure 9). Despite the increase in stiffness provided by the pintle socket, the deterioration leads to an increase in tensile stresses at the contact point, compressive stresses at the thrust diaphragm stiffener, and overall bending stresses throughout the thrust diaphragm. Furthermore, the bending changes from pure bending throughout the thrust diaphragm to pure bending contained between the end plate and thrust diaphragm stiffener.
6. Conclusions
This article presents a methodology that uses a finite element analysis model to perform numerical simulations on miter gates to evaluate their behavior when subjected to different levels of deterioration of the quoin block. This is essential because the current inventory of hydraulic structures in the US are more than 50 years old and are suffering deterioration of the quoin block. Furthermore, the effects of quoin block deterioration have not been fully investigated and understood. These gates are essential to maintaining the economy that depends on the continuous flow of goods throughout the US waterway systems. The methodology presented in this article proves that detailed finite element analysis can aid in the evaluation of hydraulic structures to assess their state and to test and plan for future maintenance schedules.
The numerical model involves the simulation of all the gate components. The model was built using a previously validated method of a similar gate [28]. A further analytical validation of the gate was performed by extracting bending stresses from several girders and comparing them to an analytical equation (ETL 1110-2-584). The computational bending stresses showed a close correlation to the analytical behavior. The only variations were seen near the end of the girder where there are stiffeners and varying geometry within the computational model. Deterioration was modeled by partially releasing the contact of the gate with the wall at levels of 0, 5, 10, 15 and 25%, starting from the bottom. Horizontal and vertical paths along the thrust diaphragm were defined in the model to extract horizontal and vertical stresses along them.
The following are the overall conclusions.
- (a)
- To avoid any serious failure due to deterioration no more than 10% deterioration may be accepted;
- (b)
- All the results demonstrated a change in the limit states in the thrust diaphragm and quoin post from pure compression to tension and bending;
- (c)
- Results from horizontal stresses of the vertical paths showed significant stress increase up to 1.4 times at 25% deterioration and 1.0 times at 15% deterioration above the material’s yield stress;
- (d)
- Vertical stresses along the vertical paths showed increase in the compressive stresses above and below the elevation of the contact/no contact boundary of the quoin block. However, the stresses are safely below yielding;
- (e)
- The horizontal stresses at the horizontal paths obtained at the panels of the thrust diaphragm were also significantly below yielding except at panel 12 for the 15% deterioration; the stresses were just below yielding;
- (f)
- Similarly, the vertical stresses along the same paths are lower than the yield stresses. Panels 12, 13, 14 and 15 show a change in state from compression to tension.
Author Contributions
Conceptualization, G.A.R. and F.J.A.; methodology, G.A.R., F.J.A., C.M.L. and E.G.; validation, G.A.R. and F.J.A.; writing—original draft preparation, G.A.R. and E.G.; writing—review and editing, G.A.R. and C.M.L.; funding acquisition, G.A.R. All authors have read and agreed to the published version of the manuscript.
Funding
The authors acknowledge the financial support provided by the U.S. Army Engineer Research and Development Center, Navigations System Research Program. Permission was granted by the Director of the Information Technology Laboratory to publish this information.
Data Availability Statement
The data presented in this study are available in referenced materials.
Conflicts of Interest
The authors declare no conflict of interest. The funders had no role in the design of the study; in the collection, analyses, or interpretation of data; in the writing of the manuscript, or in the decision to publish the results.
References
- Waterways Council, Inc. 2021 Infrastructure Report Card: Inland Waterways; ASCE: Reston, VA, USA, 2021. [Google Scholar]
- Port of Pittsburg Commission. The Port District. Available online: https://www.portpitt.com/pages/the-port-district (accessed on 3 November 2021).
- Waterways Council. Waterways System: Learn about the Future of Our Waterways. Available online: https://www.waterwayscouncil.org/waterways-system (accessed on 3 November 2021).
- EBP U.S.; ASCE. Failure to Act: Ports and Inland Waterways—Anchoring the U.S. Economy; ASCE: Reston, VA, USA, 2021. [Google Scholar]
- Calvert, R. USACE’s Steve Stockton: The Urgent Need to Transform US Water Resources Infrastructure. Livebetter Magazine. 6 August 2012.
- Shippers Using Tombigbee River Face Higher Costs Due to Rerouting | JOC.Com. Available online: https://www.joc.com/maritime-news/shippers-using-tombigbee-river-face-higher-costs-due-rerouting_19940803.html (accessed on 3 November 2021).
- Debruler, D. Industrial History: Mississippi Dams and Locks #26, Alton, IL (Melvin Price). Industrial History. 31 January 2017.
- Ervin, H. Melvin Price L & D Backed Up Following July Allision. The Waterways Journal. 3 August 2018.
- Schlinkmann, M. Repairs Made, Price Locks and Dam on Mississippi River Reopens. Available online: https://www.stltoday.com/business/local/repairs-made-price-locks-and-dam-on-mississippi-river-reopens/article_6159441d-1b45-5207-b188-ec57a2446847.html (accessed on 3 November 2021).
- Mississippi River Lock 27 and Arkansas River Lock 1 Closed for Repairs. Available online: https://www.grainnet.com/article/223143/mississippi-river-locks-27-and-arkansas-river-lock-1-close-for-repair (accessed on 3 November 2021).
- Emergency Repair at Lock 27 Has Barge Traffic at a Standstill. Available online: https://news.stlpublicradio.org/economy-business/2012-09-20/emergency-repair-at-lock-27-has-barge-traffic-at-a-standstill (accessed on 3 November 2021).
- Northbank Civil and Marine, Inc. The Dalles Navigational Lock; Northbank Civil and Marine, Inc.: Vancouver, WA, USA, 2017. [Google Scholar]
- The Dalles Lock Set to Open After Emergency Repairs—Columbia Community Connection News Mid-Columbia Region. Available online: https://www.columbiacommunityconnection.com/the-dalles/the-dalles-lock-set-to-open-after-emergency-repairs (accessed on 3 November 2021).
- The Dalles Dam Mitre Gate Replacement | OXBO Inc. Available online: https://www.oxboinc.com/projects/the-dalles-dam-mitre-gate-replacement/ (accessed on 3 November 2021).
- Navigation Data Center. Public Lock Unavailability Report Files, Calendar Years 1993–2020; Lock Performance Monitoring System (LPMS); United States Army Corps Engineers Engineering Research and Development Center: Vicksburg, MI, USA, 2021. [Google Scholar]
- Eick, B.; Treece, Z.; Spencer, B.; Smith, M.; Sweeney, S.; Alexander, Q.; Foltz, S. Miter Gate Gap Detection Using Principal Component Analysis; Engineer Research and Development Center (U.S.): Vicksburg, MI, USA, 2018. [Google Scholar]
- Eick, B.; Smith, M.; Fillmore, T. Feasibility of Discontinuous Quoin Blocks for USACE Miter Gates; Engineer Research and Development Center (U.S.): Vicksburg, MI, USA, 2019. [Google Scholar]
- Riveros, G.A. Advances in Methods to Repair Fatigue Cracks in Hydraulic Steel Structures Using Fiber-Reinforced Polymers (Carbon and Basalt Fibers). Available online: https://evenscribe.com/2019/STCONG19/fsPopup.asp?efp=RkdUVFpLWUs0MDQ3&PresentationID=455668&rnd=0.5903505&mode=presinfo (accessed on 26 July 2021).
- Riveros, G.A.; Arredondo, E. Predicting Future Deterioration of Hydraulic Steel Structures with Markov Chain and Multivariate Samples of Statistical Distributions. J. Appl. Math. 2014, 2014, 360532. [Google Scholar] [CrossRef] [Green Version]
- Riveros, G.A.; Arredondo, E. Predicting Deterioration of Navigation Steel Hydraulic Structures with Markov Chain and Latin Hypercube Simulation; Coastal and Hydraulics Engineering Technical Note, ERDC/CHL CHETN-IX-24; U.S. Army Engineer Research and Development Center: Vicksburg, MS, USA, 2010. [Google Scholar]
- Riveros, G.A.; Arredondo, E. Guide to the Development of a Deterioration Rate Curve Using Condition State Inspection Data; Coastal and Hydraulics Engineering Technical Note, ERDC/CHL CHETN-IX-25; U.S. Army Engineer Research and Development Center: Vicksburg, MS, USA, 2010. [Google Scholar]
- U.S. Army Corps of Engineers (USACE). Mechanical and Electrical Design for Lock and Dam Operating Equipment; EM 1110-2-2610; USACE: Washington, DC, USA, 2013. [Google Scholar]
- Korfhage, A. McAlpine’s north chamber reopens to navigation traffic after miter gate replacement. U.S. Army Corps of Engineers Louisville District. 15 December 2020.
- U.S. Army Corps of Engineers (USACE). Design of Hydraulic Steel Structures; ETL 1110-2-584; USACE: Washington, DC, USA, 2014. [Google Scholar]
- Riveros, G.A.; Ayala Burgos, J.L.; Perez, J. Numerical Investigation of Miter Gates; Defense Technical Information Center: Fort Belvoir, VA, USA, 2009. [Google Scholar]
- Mahmoud, H.; Riveros, G. Fatigue Reliability of a Single Stiffened Ship Hull Panel. Eng. Struct. 2014, 66, 89–99. [Google Scholar] [CrossRef]
- Dassault Systèmes Simulia Corp. Abaqus 2018 Documentation; Dassault Systèmes Simulia Corp.: Providence, RI, USA, 2018. [Google Scholar]
- Riveros, G.A.; Ayala-Burgos, J.L.; Dixon, D. Numerical Investigation of Diagonals in Miter Gates: Looking for the Optimum Prestressing. J. Perform. Constr. Facil. 2017, 31, 04016073. [Google Scholar] [CrossRef]
Figure 1.
Map of the inland waterways along with a cost comparison of intercity transportation [1,2,3].

Figure 2.
Total nationwide lock unavailability [15].
Figure 2.
Total nationwide lock unavailability [15].

Figure 3.
Vessel moving through lock gates, from downstream to upstream.

Figure 4.
Horizontal miter gate (a) the miter gate is in the closed position and (b) the miter gate is in the open position [23].
Figure 4.
Horizontal miter gate (a) the miter gate is in the closed position and (b) the miter gate is in the open position [23].

Figure 5.
Downstream view of a miter gate with components.

Figure 6.
(a) Top view of the tapered end section and (b) front view of miter gate leaf with force distribution.
Figure 6.
(a) Top view of the tapered end section and (b) front view of miter gate leaf with force distribution.

Figure 7.
Distress features in horizontal miter gates caused by Quoin block deterioration, (A) out of plane deformation near Quoin block, (B) cracks propagate around bolts, (C) crack at the pintle, (D) crack above pintle.
Figure 7.
Distress features in horizontal miter gates caused by Quoin block deterioration, (A) out of plane deformation near Quoin block, (B) cracks propagate around bolts, (C) crack at the pintle, (D) crack above pintle.

Figure 8.
Main structural elements of the lower gate, Holt Lock. (a) miter gate leaf with 16 girders, (b) pintle bolt, (c) pintle socket, (d) pintle ball.
Figure 8.
Main structural elements of the lower gate, Holt Lock. (a) miter gate leaf with 16 girders, (b) pintle bolt, (c) pintle socket, (d) pintle ball.

Figure 9.
Graphic illustration showing geometry and displacement boundary conditions for the method validation experiments.
Figure 9.
Graphic illustration showing geometry and displacement boundary conditions for the method validation experiments.

Figure 10.
Three charts showing agreement in numerical and analytical solutions for the L&D No. 27. (A) Girder 3 near the top of the gate, (B) Girder 8 near the middle, (C) Girder 12 at the bottom.
Figure 10.
Three charts showing agreement in numerical and analytical solutions for the L&D No. 27. (A) Girder 3 near the top of the gate, (B) Girder 8 near the middle, (C) Girder 12 at the bottom.

Figure 11.
Vertical stress paths along the thrust diaphragm.

Figure 12.
Horizontal Paths along the thrust diaphragm aligned with Girders 9, 10, 11, 12, 13, 14, and 15; and with the centerline of Panel 12.
Figure 12.
Horizontal Paths along the thrust diaphragm aligned with Girders 9, 10, 11, 12, 13, 14, and 15; and with the centerline of Panel 12.

Figure 13.
Horizontal stresses in thrust diaphragm along vertical paths 1, 2, 3, and 4, on plots (A), (B), (C), and (D), respectively.
Figure 13.
Horizontal stresses in thrust diaphragm along vertical paths 1, 2, 3, and 4, on plots (A), (B), (C), and (D), respectively.


Figure 14.
Calculated vertical stresses along vertical paths 1, 2, 3, and 4, on plots (A), (B), (C), and (D), respectively.
Figure 14.
Calculated vertical stresses along vertical paths 1, 2, 3, and 4, on plots (A), (B), (C), and (D), respectively.


Figure 15.
(A–G) Illustration of the horizontal stress captured along these paths.


Figure 16.
(A–G) Calculated vertical stresses along seven horizontal paths within the thrust diaphragm.
Figure 16.
(A–G) Calculated vertical stresses along seven horizontal paths within the thrust diaphragm.


Table 1.
Typical material properties of steel, used in computations.
| Property | Average Value |
|---|---|
| Modulus of elasticity | 207 GPa |
| Yield Strength | 345 MPa |
| Density | 245 kg/m4 |
| Poisson’s ratio | 0.3 |
| Coefficient of thermal expansion | 11.7 E−006 m/(m × C) |
Table 2.
Horizontal paths deterioration.
| Percent | Length of Deterioration (m) | Girder (No.) | Panel (No.) |
|---|---|---|---|
| 0 | 0 | 16 | |
| 5 | 1.22 | 15 | |
| 10 | 2.44 | 14 | |
| 15 | 4.24 | 12 | |
| 25 | 6.20 | 11 |
Publisher’s Note: MDPI stays neutral with regard to jurisdictional claims in published maps and institutional affiliations. |
© 2021 by the authors. Licensee MDPI, Basel, Switzerland. This article is an open access article distributed under the terms and conditions of the Creative Commons Attribution (CC BY) license (https://creativecommons.org/licenses/by/4.0/).
Share and Cite
MDPI and ACS Style
Riveros, G.A.; Acosta, F.J.; Lozano, C.M.; Glynn, E. The Effects of Deteriorated Boundary Conditions on Horizontally Framed Miter Gates. Metals 2022, 12, 37. https://doi.org/10.3390/met12010037
AMA Style
Riveros GA, Acosta FJ, Lozano CM, Glynn E. The Effects of Deteriorated Boundary Conditions on Horizontally Framed Miter Gates. Metals. 2022; 12(1):37. https://doi.org/10.3390/met12010037
Chicago/Turabian StyleRiveros, Guillermo A., Felipe J. Acosta, Christine M. Lozano, and Eileen Glynn. 2022. "The Effects of Deteriorated Boundary Conditions on Horizontally Framed Miter Gates" Metals 12, no. 1: 37. https://doi.org/10.3390/met12010037
Note that from the first issue of 2016, this journal uses article numbers instead of page numbers. See further details here.