
The Research on Recrystallization Behaviors and Mechanism of a Medium-Density Ni-Based Alloy


1
State Key Laboratory for Advanced Materials, University of Science and Technology Beijing, Beijing 100083, China
2
School of Mechanical Engineering, University of Science and Technology Beijing, Beijing 100083, China
3
Institute for Advanced Materials and Technology, University of Science and Technology Beijing, Beijing 100083, China
4
School of Materials Science and Engineering, University of Science and Technology Beijing, Beijing 100083, China
*
Author to whom correspondence should be addressed.
Metals 2022, 12(1), 137; https://doi.org/10.3390/met12010137
Submission received: 2 November 2021
/
Revised: 5 January 2022
/
Accepted: 5 January 2022
/
Published: 11 January 2022
(This article belongs to the Special Issue Thermomechanical Processing, Microstructure Evolution and Mechanical Properties of Alloys)
Abstract
:Revealing the recrystallization behavior and mechanism of this new alloy is of great significance to subsequent research. In this study, the Ni-36.6W-15Co ternary medium heavy alloy was solution-treated at 1100–1200 °C for different lengths of time. The grain size change, microstructure and texture evolution as well as twin development during recrystallization annealing were analyzed using SEM, EBSD and TEM techniques. The study found that complete recrystallization occurs at 1150 °C/60 min. In addition, it takes a longer amount of time for complete recrystallization to occur at 1100 °C. The value of the activation energy Q1 of the studied alloys is 701 kJ/mol and the recrystallization process is relatively slow. By comparing the changes of microstructure and texture with superalloys, it is found that the recrystallization mechanism of the studied alloy is different from that of the superalloy. The development of annealing twins has a great influence on the recrystallization behavior and mechanism. The results show that the twin mechanism is considered as the dominant recrystallization mechanism of the studied alloy, although the formation and development of sub-grains appear in the early stage of recrystallization.
1. Introduction
Due to their excellent properties, such as high strength, high plasticity and toughness, heavy alloys with higher density (16–18 g/cm3) are widely used in aviation, aerospace, weapons, naval ships and other military industries, and are also widely used in machinery, electrical appliances, instruments, metallurgy and other civil industries [1,2,3]. Tungsten heavy alloys (WHAs), as a representative heavy alloy with high density, usually contain 80–98 wt% tungsten, and a small amount of other elements (Fe, Ni, Cu), and they can be considered a composite material in which the hard body-centered cubic (BCC) tungsten spherical body is bonded by a ductile face-centered cubic (FCC) matrix [4,5].
For a long time, plasticity has always been a problem troubling WHAs, which means that it is difficult to improve the properties of WHAs through deformation [6,7,8] and grain refinement [9,10]. It has been reported that increasing the content of Ni in WHAs will help improve the toughness [11]. Therefore, based on existing knowledge, Li et al. [12] developed a new type of nickel-tungsten based FCC alloy with a density that meets the requirements in some critical fields (~11.39 g/cm3), which is called a medium heavy alloy (MHA). MHAs have the same or better properties as WHAs. It is worth noting that due to the improvement in plasticity, the deformation strengthening ability of MHAs is very strong, meaning that the material can store a large amount of distortion energy, which is conducive to the formation of fine equiaxed grains during recrystallization, further improving the mechanical properties of the alloy. However, the recrystallization mechanism of these alloys has rarely been studied. Therefore, revealing the recrystallization mechanism of these alloys can provide a theoretical basis for the subsequent development of these new alloys.
Referring to the recrystallization mechanism of nickel-based superalloys with face-centered cubic structures, it is found that the recrystallization mechanism of alloys has a great relationship with the existence of the second phase. Both Wang [13] and Hu [14] found that the presence of a phase affects the static recrystallization mechanism of superalloys. Studies have shown that when the phase was present in large quantities, the recrystallization of the alloys proceeded with a sub-grain coarsening mechanism. The recrystallization of the alloy after the phase was dissolved was carried out by the grain boundary bowing mechanism. The common mechanism is the grain boundary bowing and sub-grain mechanism [13,14,15]. The twin recrystallization mechanism mainly occurs in deformed Mg alloys [16,17]. The four proposed nucleation sites for recrystallization are grain boundaries, shear bands, deformation twins and second phase particles [18,19,20]. Currently, the recrystallization nucleation sites within twins and at twin–twin or twin–grain boundary intersections have been extensively reported [21,22].
Annealing twins are often observed during grain growth following the recrystallization of certain materials, particularly face-centered cubic metals of low stacking fault energy (low-SFE) [23,24]. Annealing twin boundary formation in low-SFE metals and alloys is not only a product of recrystallized structure, but also plays an important role in the recrystallization process itself [25]. The annealed twin boundary is a type of coherent grain boundary that is a kind of special large angle grain boundary with low interfacial energy, good thermal stability and mechanical stability. The low interfacial twin plays a very important role in the strength and plasticity of materials [26]. In crystallography, annealing twins are basically composed of stacking faults on the {111} plane [27]. Jin et al. [28] researched the evolution behavior of annealing twins in pure nickel during recrystallization. It was found that a higher prior stored energy and a smaller initial grain size led to a high twin density. Wang et al. [29] proposed that the formation of twins is affected by the stored energy and grain boundary mobility caused by grain boundaries or second phases, and the twin plane is related to the grain boundary migration or the grain growth direction. Chen et al. [30] studied the grain growth and twin boundary evolution of nickel-based superalloys during annealing treatment, and found that with an increasing annealing time, the proportion of annealing twin boundaries first increased and then decreased.
As mentioned above, the recrystallization mechanism of this new alloy should be systematically analyzed. The development and evolution of twins should also be fully revealed. Based on this research, further research, such as superplasticity, can be carried out effectively. In our early experiments, we found that the recrystallization temperature of the alloy was particularly narrow. We chose large deformation (up to 90%) in order to observe the obvious recrystallization. Thus, in this study, the Ni-36.6W-15Co ternary medium heavy alloy with 90% deformation was solution-treated at 1100–1200 °C and the grain size and morphology were analyzed. Then, a macrostructural examination and transmission electron microscopy analysis were carried out to deeply analyze the recrystallization mechanism of the alloy after annealing at a severe plastic deformation.
2. Materials and Methods
A Ni-W-Co ternary alloy, containing 48 wt.% Ni, 36.6 wt.% W and 15 wt.% Co was prepared by vacuum induction melting. The cast ingot was homogenized at 1150–1200 °C for more than 12 h and forged at 1150 °C into a plate with dimensions of 20 mm wide and 15 mm thick. The samples were firstly solution treated at 1150 °C for 1 h and then cold rolled into 1.5-mm-thick plates. Specimens with dimensions of 12 × 10 × 1.5 mm3 were cut from the rolling samples. The recrystallization process was studied in the temperature range from 1100 to 1200 °C for 0–2 h. All samples were annealed in a vacuum atmosphere and then water cooled to room temperature, to maintain the microstructures.
The sample was metallographically polished and then chemically etched using a solution of 35 g of FeCl3 + 100 mL of HCl + 40 mL of C2H5OH + 10 mL of HF + 40 mL of H2O for 10–15 s, in order to reveal the microstructure of the deformed and annealed samples. SEM and EBSD observations were performed using a scanning electron microscope (JSM-7800F) operating at an accelerating voltage of 20 kV. The step sizes of the EBSD were chosen to be 0.5 and 2 μm, and the EBSD data were completed using TSL-OIM software (OIM Analysis V8, AMETEK Inc., Newark, DE, USA), software version, manufacturer, city, country. The experimental grain size is measured using “ImageTool” image processing software. As for predicted grain size, it was calculated using the trial-and-error method [30,31]. According to the coincidence-site lattice (CSL) misorientation angle between adjacent grains, the misorientation angle with 2° ≤ θ < 15°and θ ≥ 15° are referred as low angle grain boundaries (LAGBs or Σ1 boundaries) and high angle grain boundaries (HAGBs), respectively.
TEM and HRTEM were performed using a Tecnal G2 F20 transmission electron microscope at an operating voltage of 200 kV. The foils for TEM observation were prepared by slicing thin discs from the rolled and annealed samples, and final ion beam milling of the polished specimens with argon ion beams. The Vickers hardness tests were carried out using a VTD512 micro-hardness tester with a load of 500 g and a loading time of 15 s. Five points were measured for each sample, and the average value was calculated to minimize the associated errors.
3. Results
3.1. The Evolution of Microstructure during Recrystallization
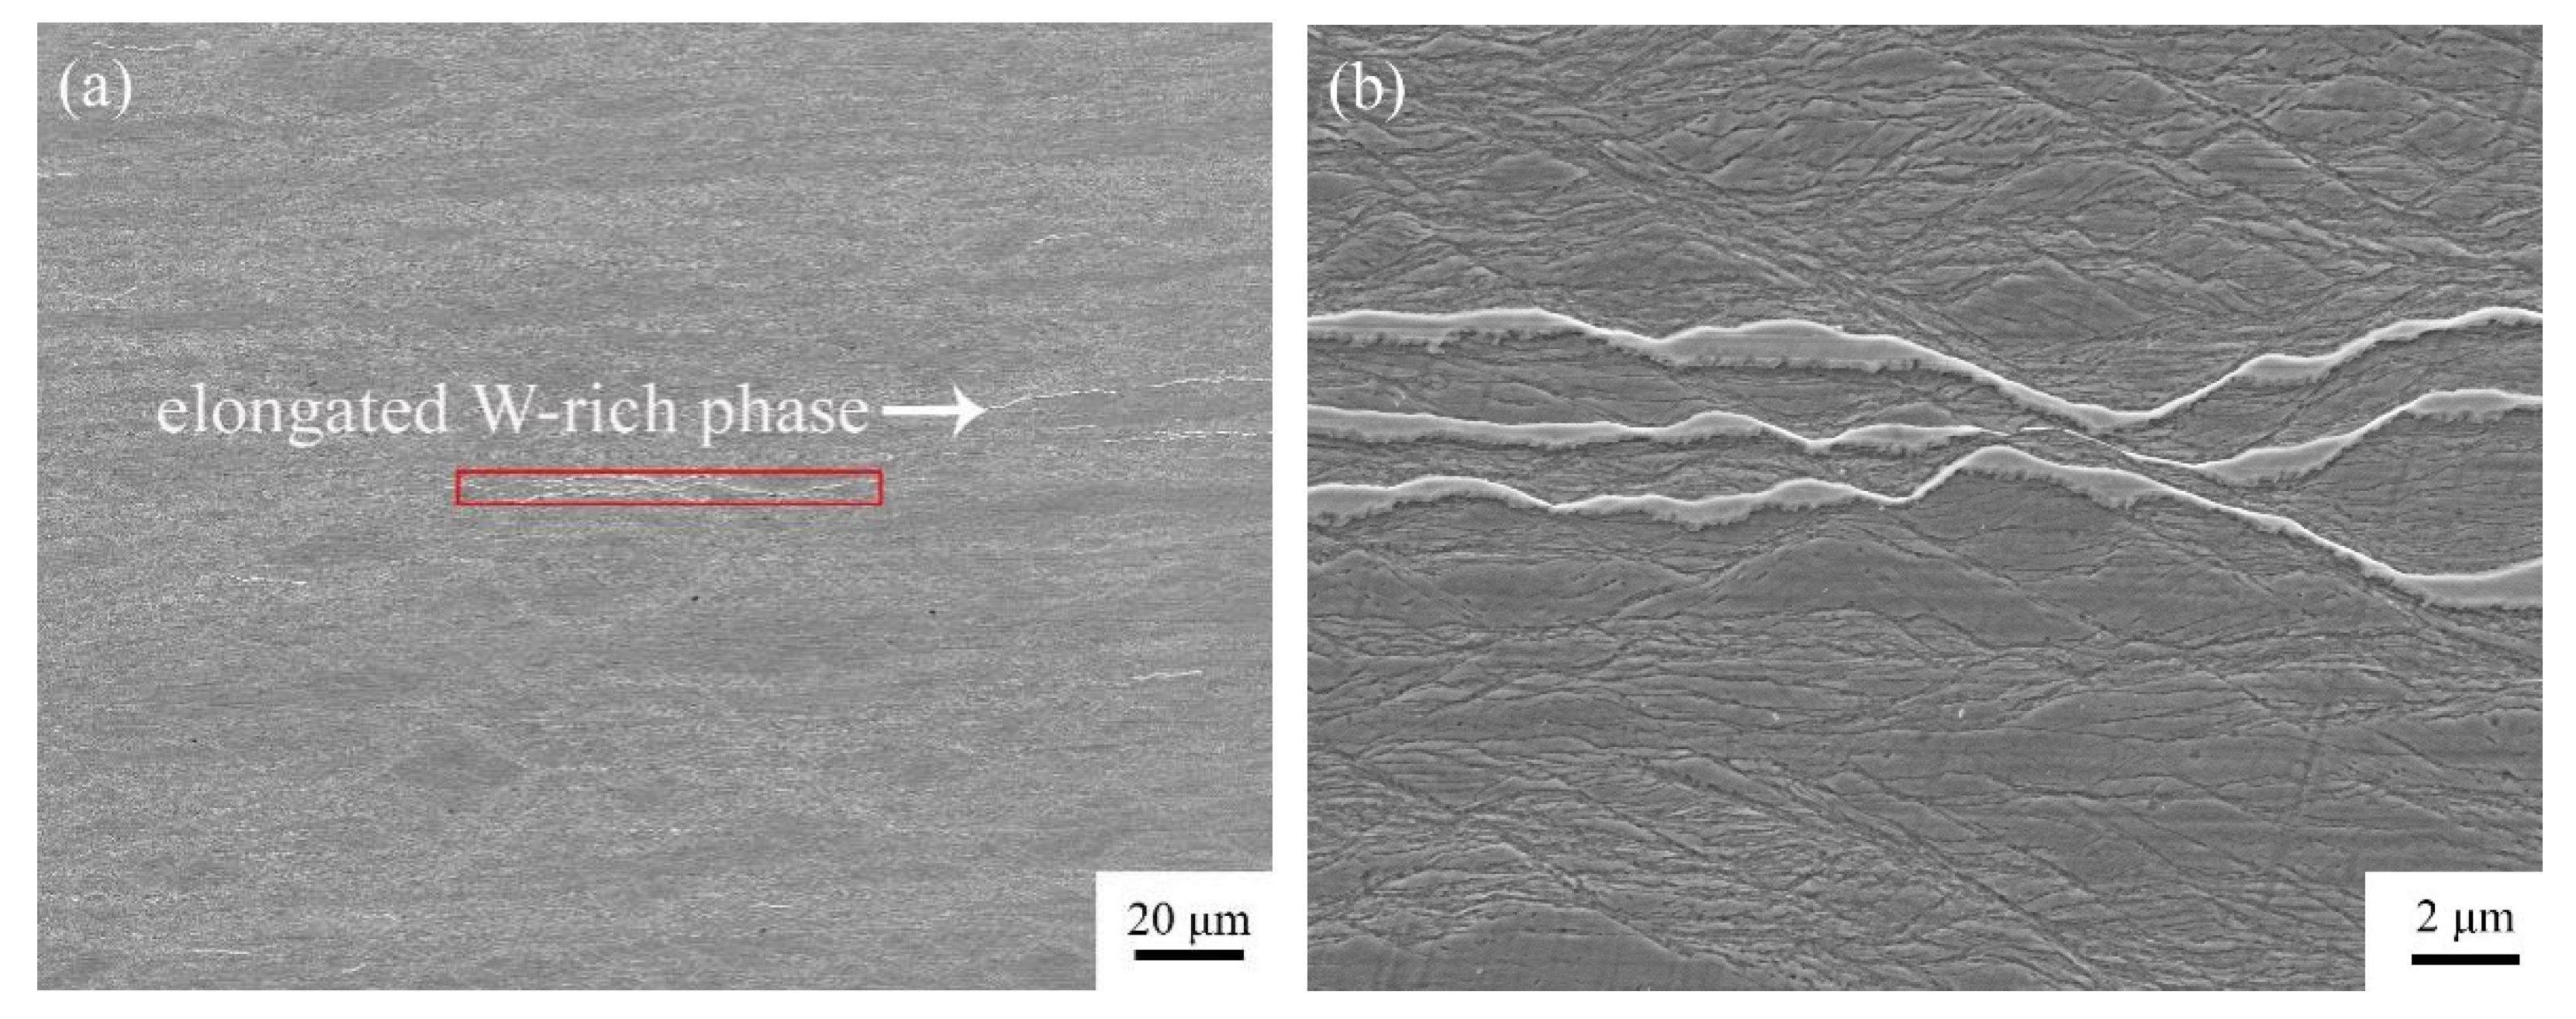
It can be seen from Figure 1a that the microstructure of the rolled state is mainly elongated grains and W-rich phases along the rolling direction. There are deformation bands in some grains, which are at a certain angle to the rolling direction. A further observation is shown in Figure 1b. Micro shear bands are clearly visible. However, due to severe deformation, it is difficult to detect the existence of deformation twins. The composition of the elongated W-rich phase measured from EDS is more than 90 wt.% W. It should be noted that most of the tungsten has been dissolved in the matrix, and only a small part is in the form of undissolved matter.
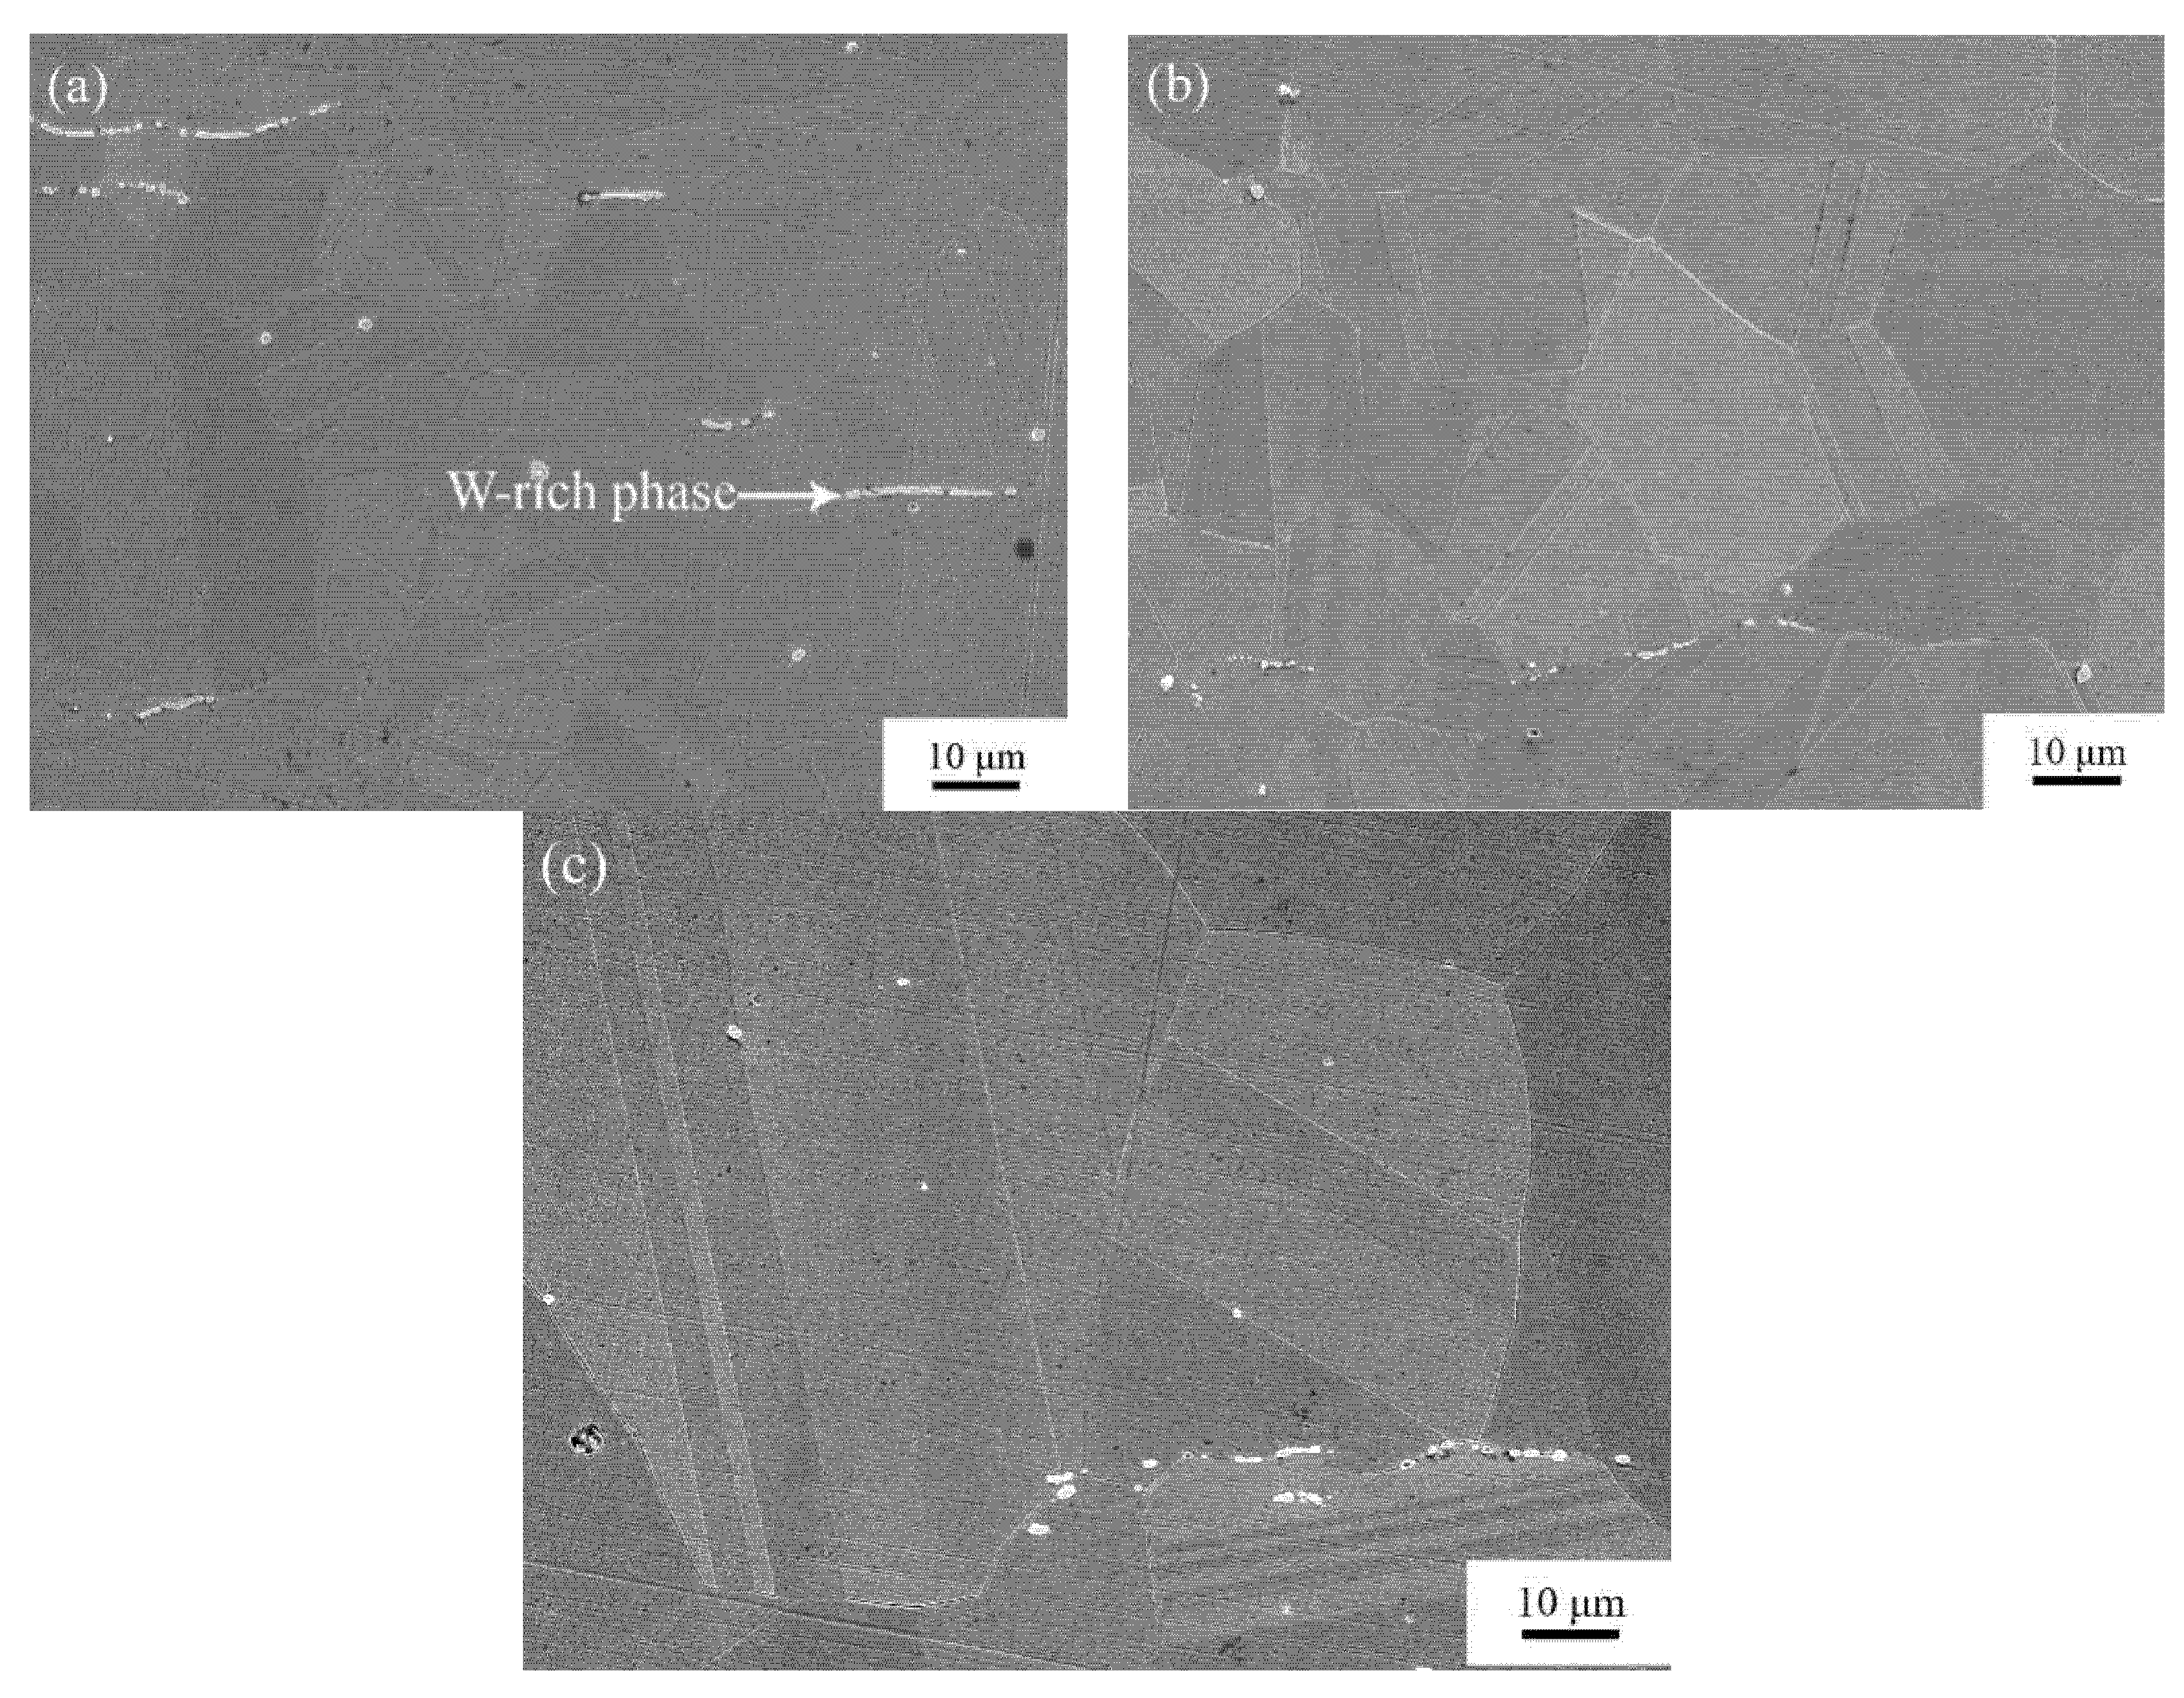
Figure 2 shows the effects of time on the SEM micrographs of the deformed samples at annealing temperatures of 1100, 1150 and 1200 °C. Here, the annealing time is 1 h. By comparing Figure 1b and Figure 2, it can be observed that the microstructure of the annealed state in a short time is completely different from that of the rolled state. Significant recrystallization occurs and the grains show inhomogeneity with a certain number of twin boundaries. It can be clearly seen that with an increasing temperature, in addition to grain growth, the shape of the grains also undergoes a great change. Irregularly shaped grains still exist, meaning that the deformed grains are not replaced by recrystallized grains. The presence of the W-rich phase, especially near the grain boundaries, will greatly reduce the plasticity of the material. The W-rich phase gradually decreased with the increase in the annealing temperature, accompanied by grain growth. By comprehensively considering the grain size and the W-rich phase, the samples were annealed at 1150 °C for differentlengths of time for further study.
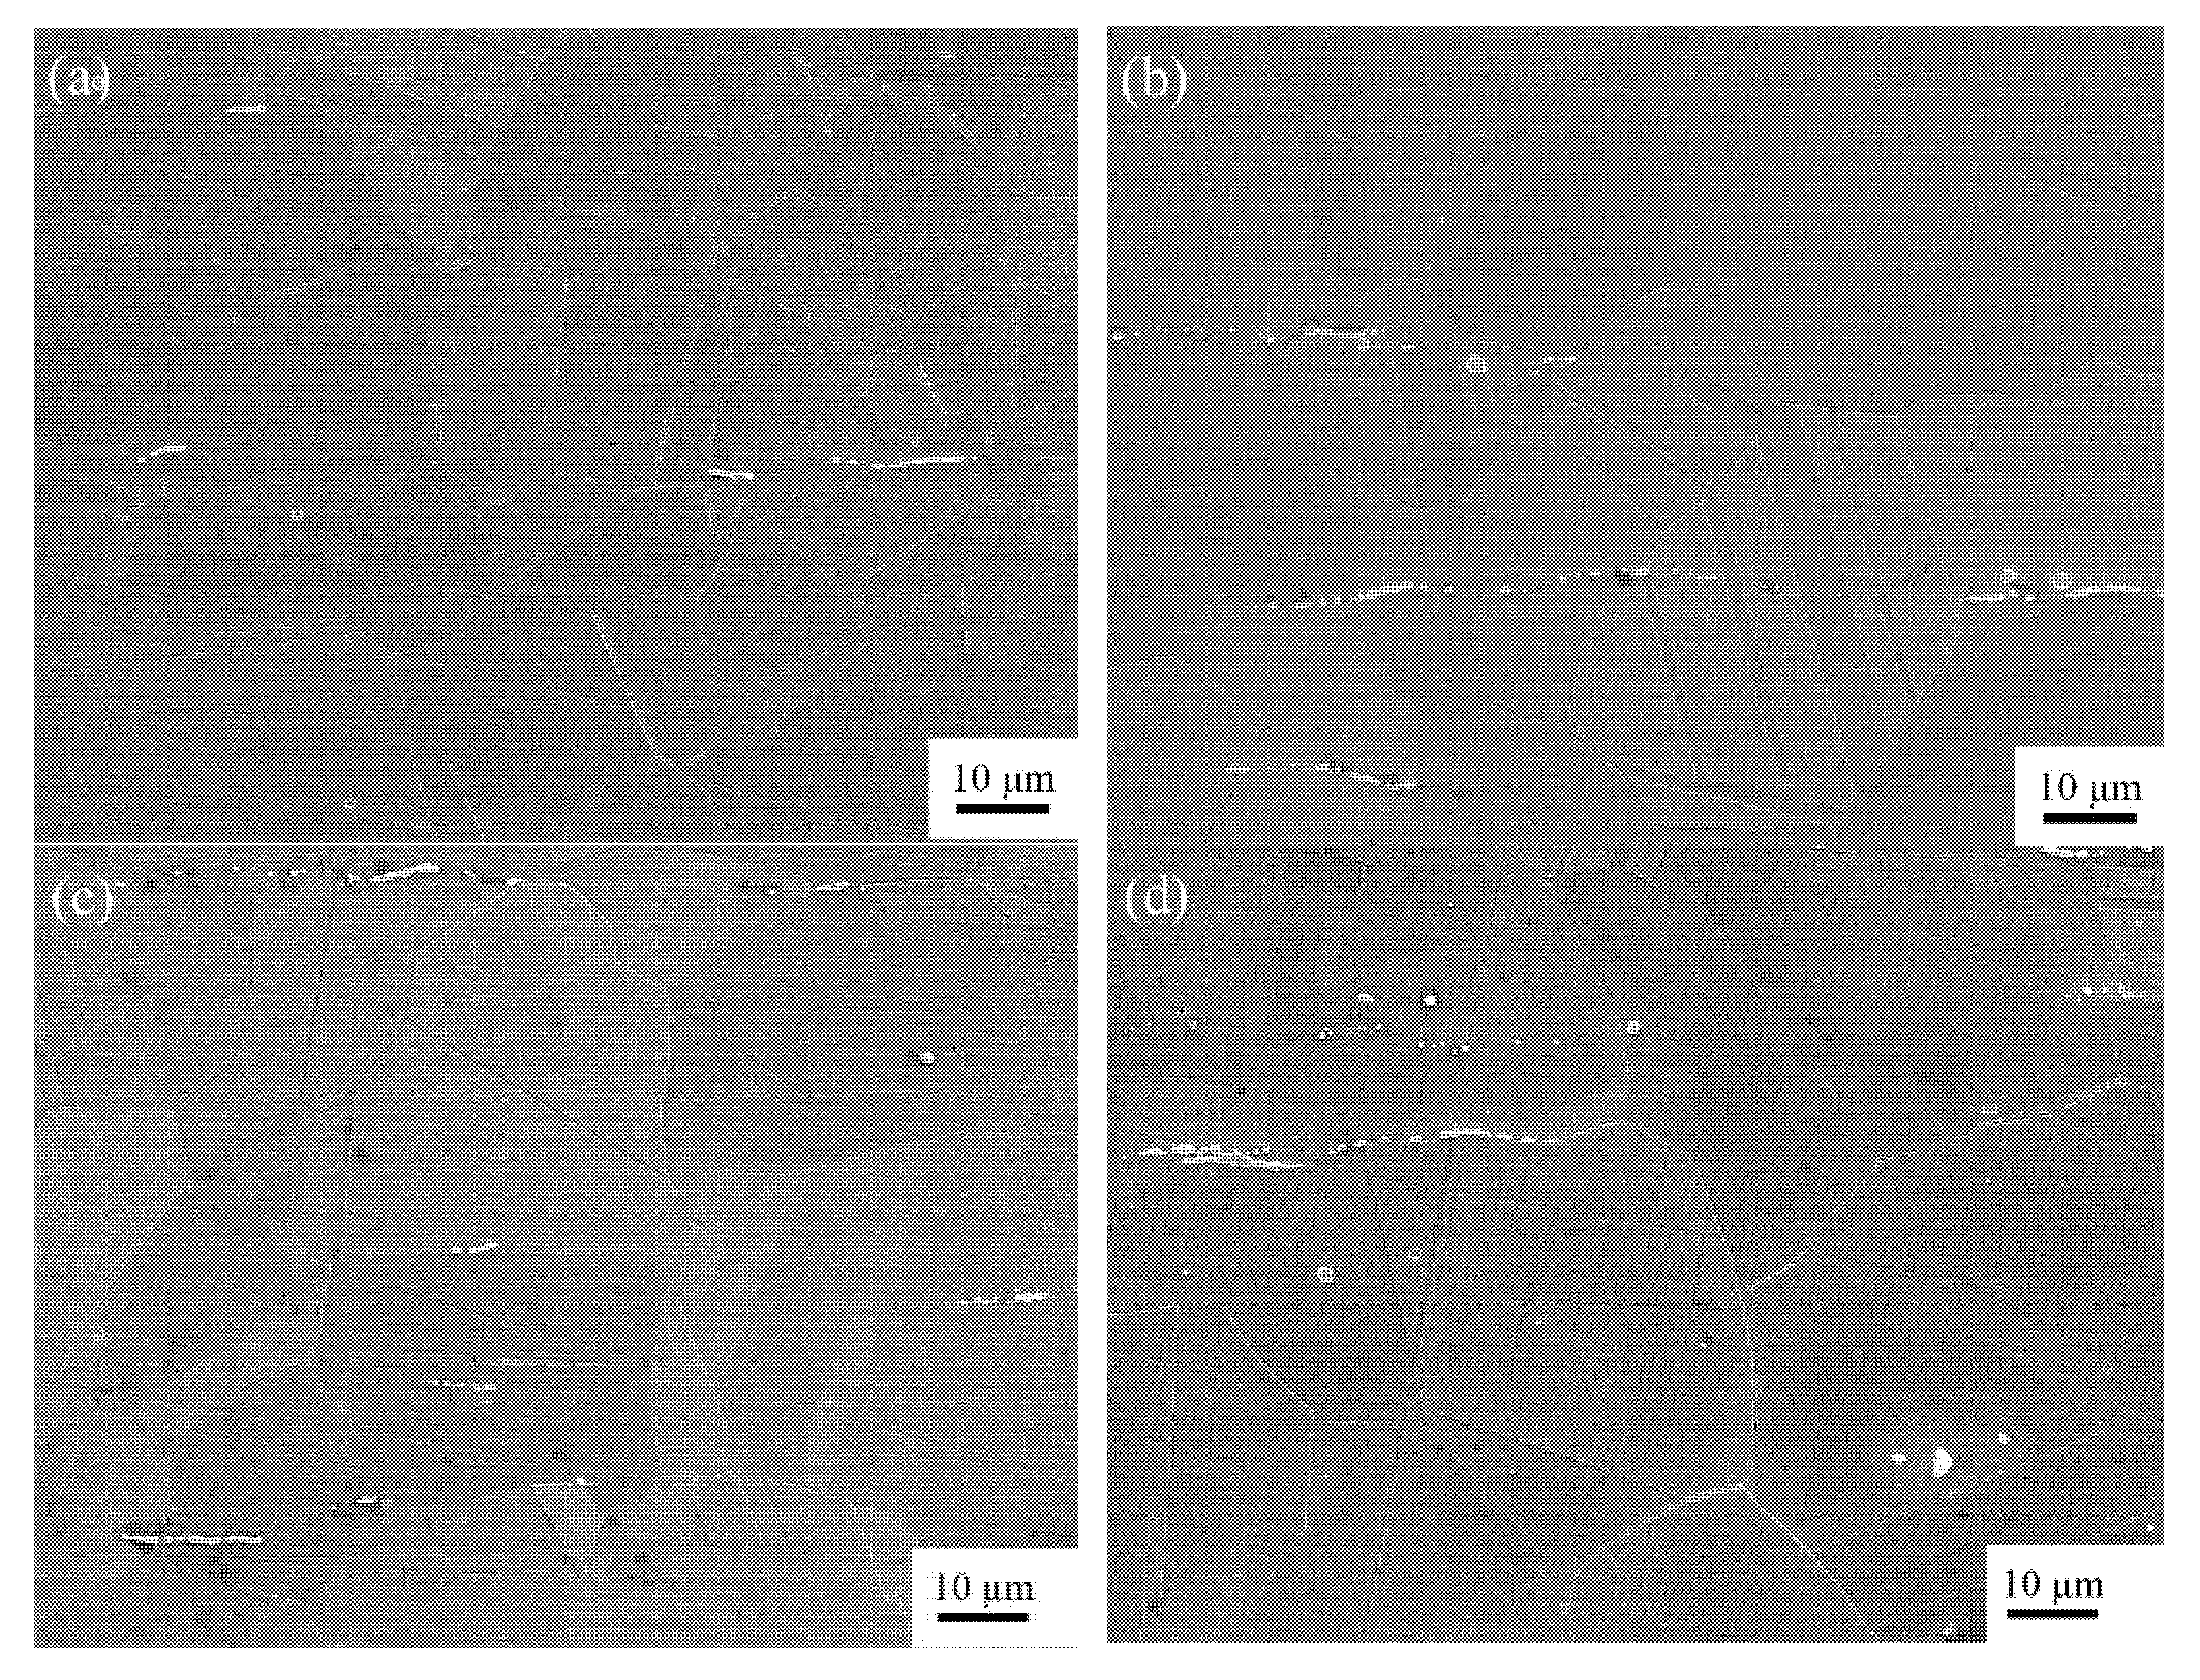
Figure 3 illustrates the SEM micrographs of the deformed samples at different times at an annealing temperature of 1150 °C. The microstructure of the annealed Ni-36.6W-15Co alloy is a mixed crystal structure composed of typical equiaxed grains and annealing twins. With the extension of time, the grain grows up and the grain boundaries tend to be flat, which is the result of grain boundary migration. This is because the grains formed during crystallization are metastable. To maintain the stability of the structure, grain growth is achieved by reducing the grain boundary area per unit volume [32]. At the same time, the number of twin boundaries increased greatly. The development of the twin is accompanied by grain growth. It seems that twins may have some influence on recrystallization. The low energy characteristics of the twin boundaries were beneficial to the stability of the structure.
3.2. The Evolution of Grain during Recrystallization
Figure 4 illustrates the effect of the annealing temperature on the grain size of the deformed samples at an annealing time of 60 min. The grain grows up rapidly with an increasing temperature. The average grain sizes are estimated to be 30.3, 40.2 and 58.8 μm. This indicates that the increasing temperature accelerates grain coarsening because grain boundary migration is very sensitive to temperature during annealing. The higher the temperature is, the more intense the submovement is and the faster the grain boundary migration is.
Figure 5 shows the effects of the annealing time on the grain size of the deformed samples at the annealing temperature of 1150 °C. It can be observed that the grain size is affected by the annealing time. Although a large number of equiaxed grains appeared in all the samples, the grain size and distribution of all the samples showed significant diversity. It can be clearly seen that the grain size is different at different annealing times by comparing the grain size distribution. When the annealing time is 10 min (Figure 5a), the specimen consists of recrystallization grains, sub-grains and a small number of deformed grains. Sub-grains and their clusters were found in the early stage of recrystallization. At 1 h (Figure 5c), the grain size increased sharply, and the subs disappeared. However, the grain size does not show significant change with a further increase in the annealing time (Figure 5d), which indicates that the rate of grain growth is slow for a fairly long time.
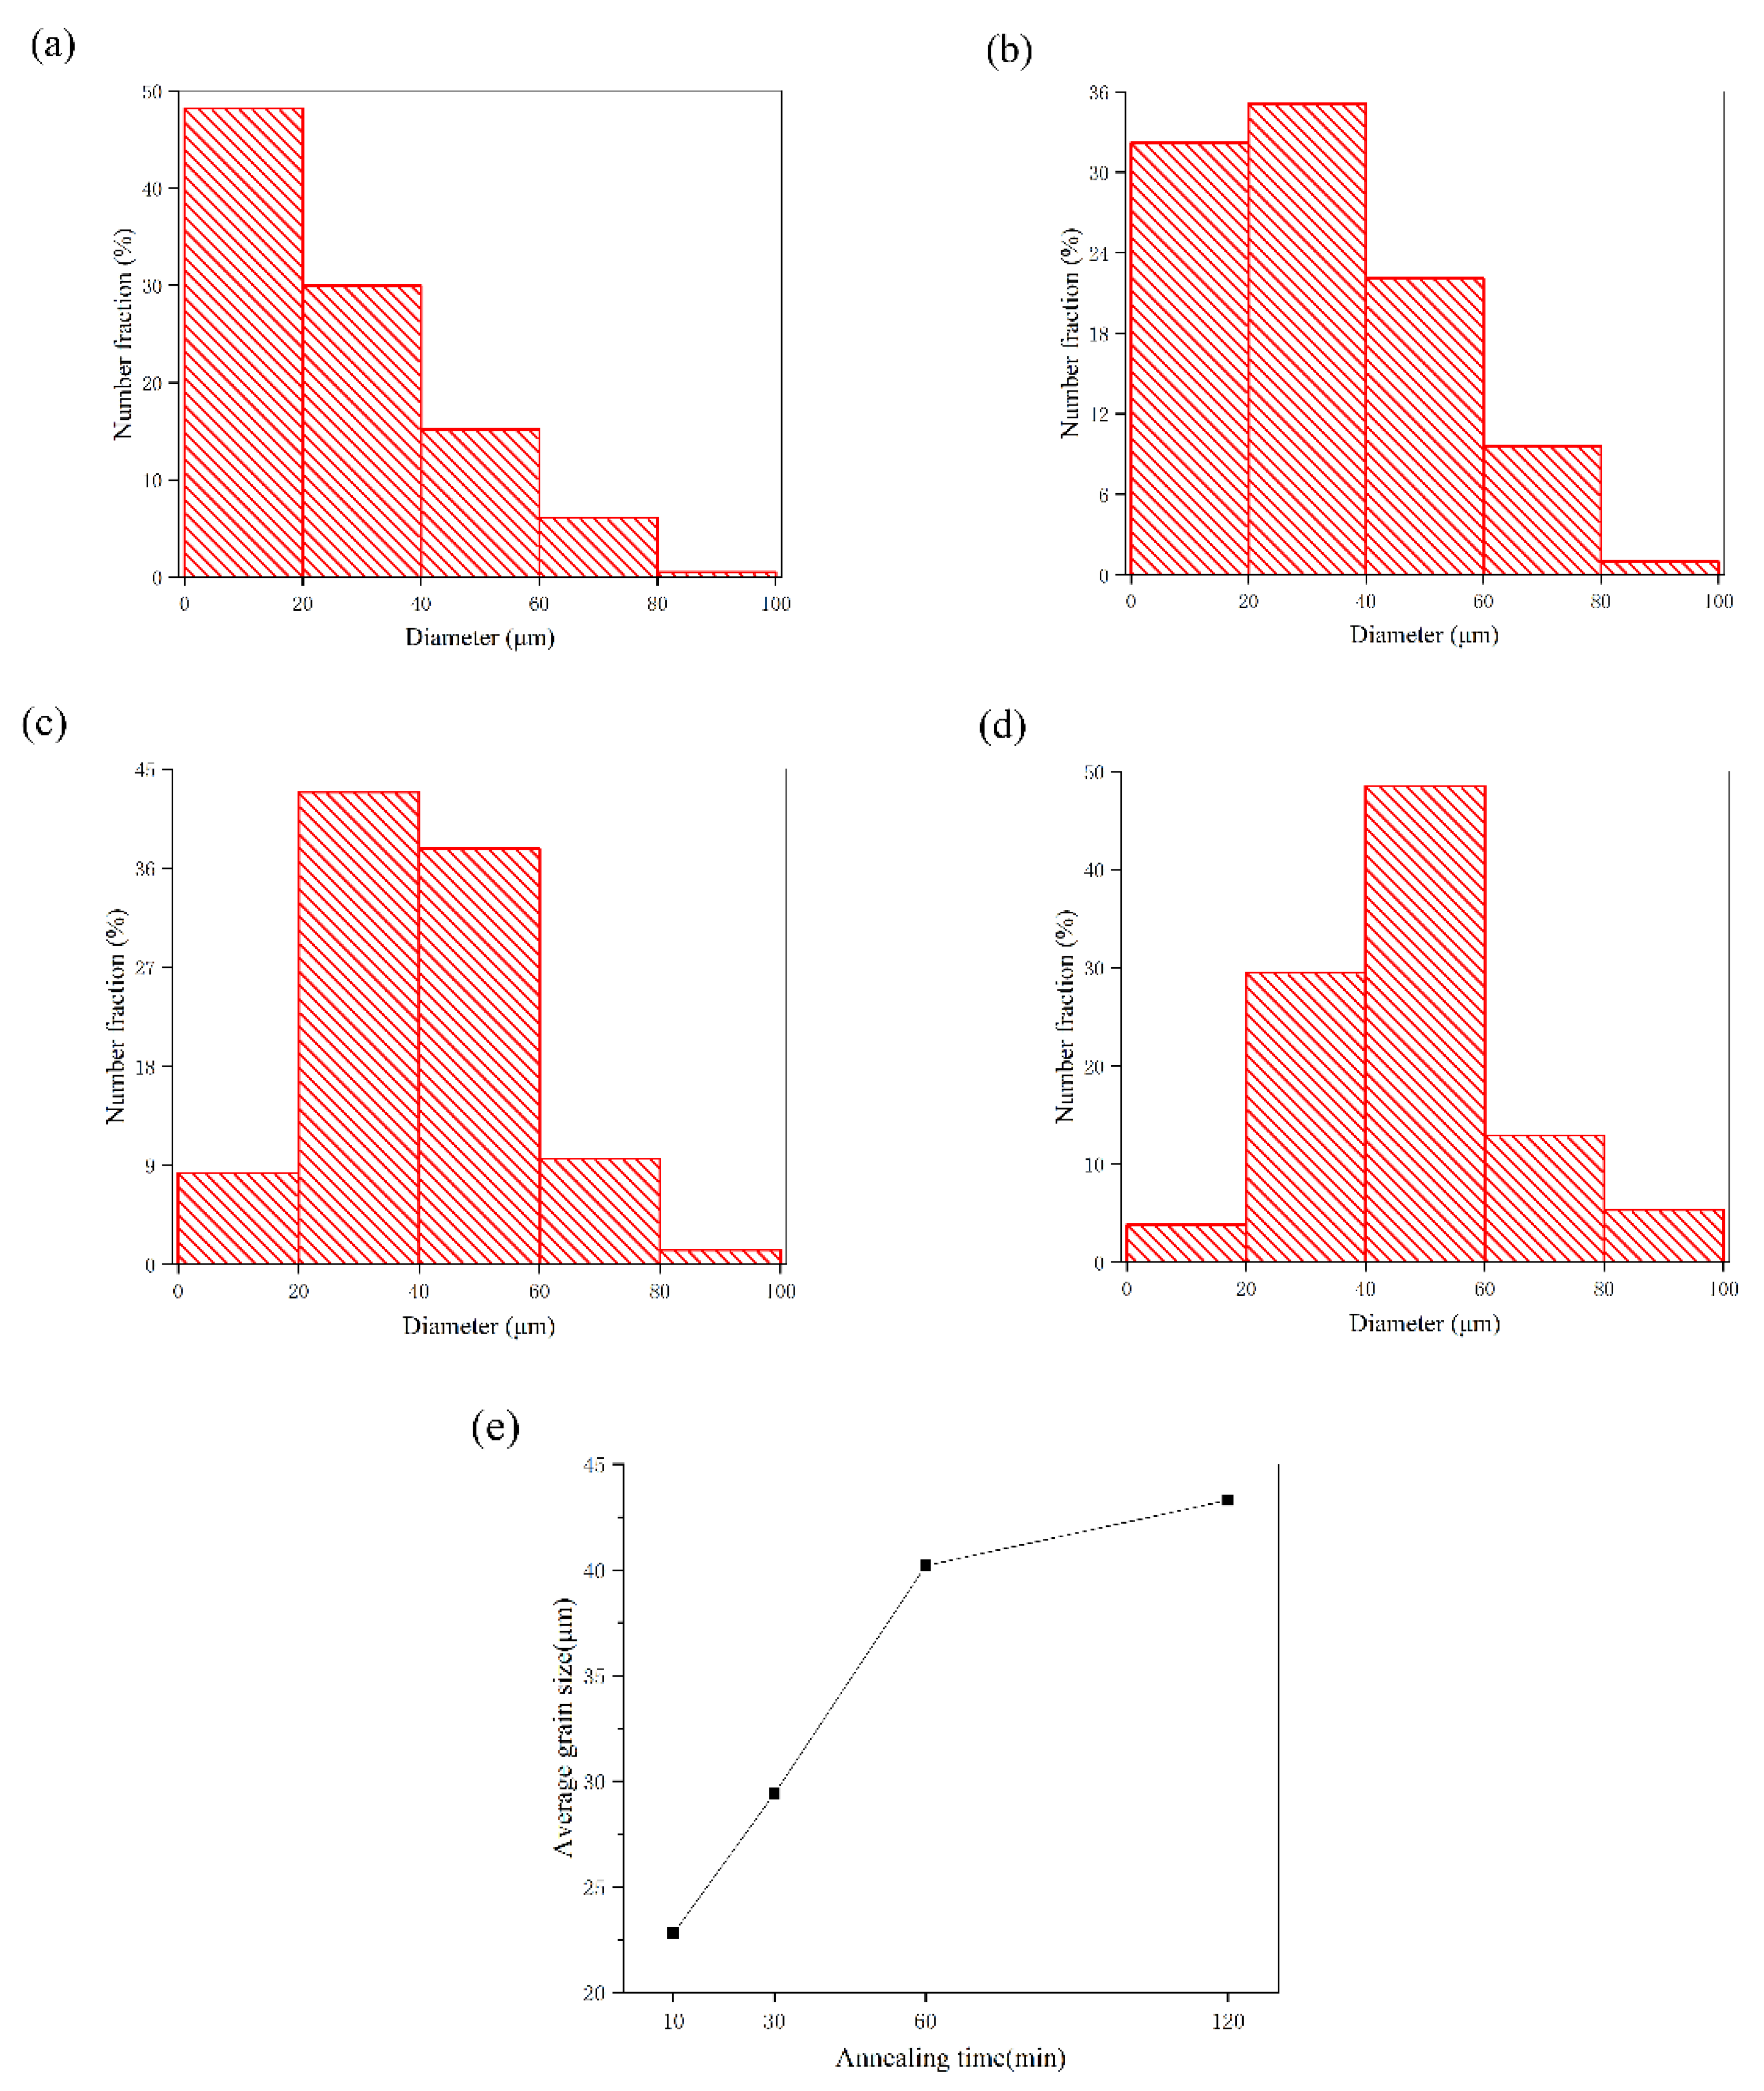
It can be clearly seen from the grain size distribution diagram that the average grain size under annealing conditions is different at different annealing times. Here, we ignore the twin boundary. In Figure 6a,b, the proportion of grains with sizes larger than 60 μm is small. With an increasing annealing time, the proportion of large grains increases, and the average grain size also increases, as shown in Figure 6c. With a further increase in the annealing time (Figure 6d), the fraction of grains with sizes lower than 20 μm sharply decreases, while the large grains show little change compared with Figure 6c. The line chart of the average grain size is depicted in Figure 6e. The results reveal that the average grain size first increases with the increasing annealing time, yet with no obvious growth process of the recrystallized grain. This can possibly be explained by the ability of grain boundary migration. Grain growth is closely related to grain boundary migration, which is controlled by the diffusion mechanism. Therefore, a longer annealing time is conducive to full grain boundary migration.
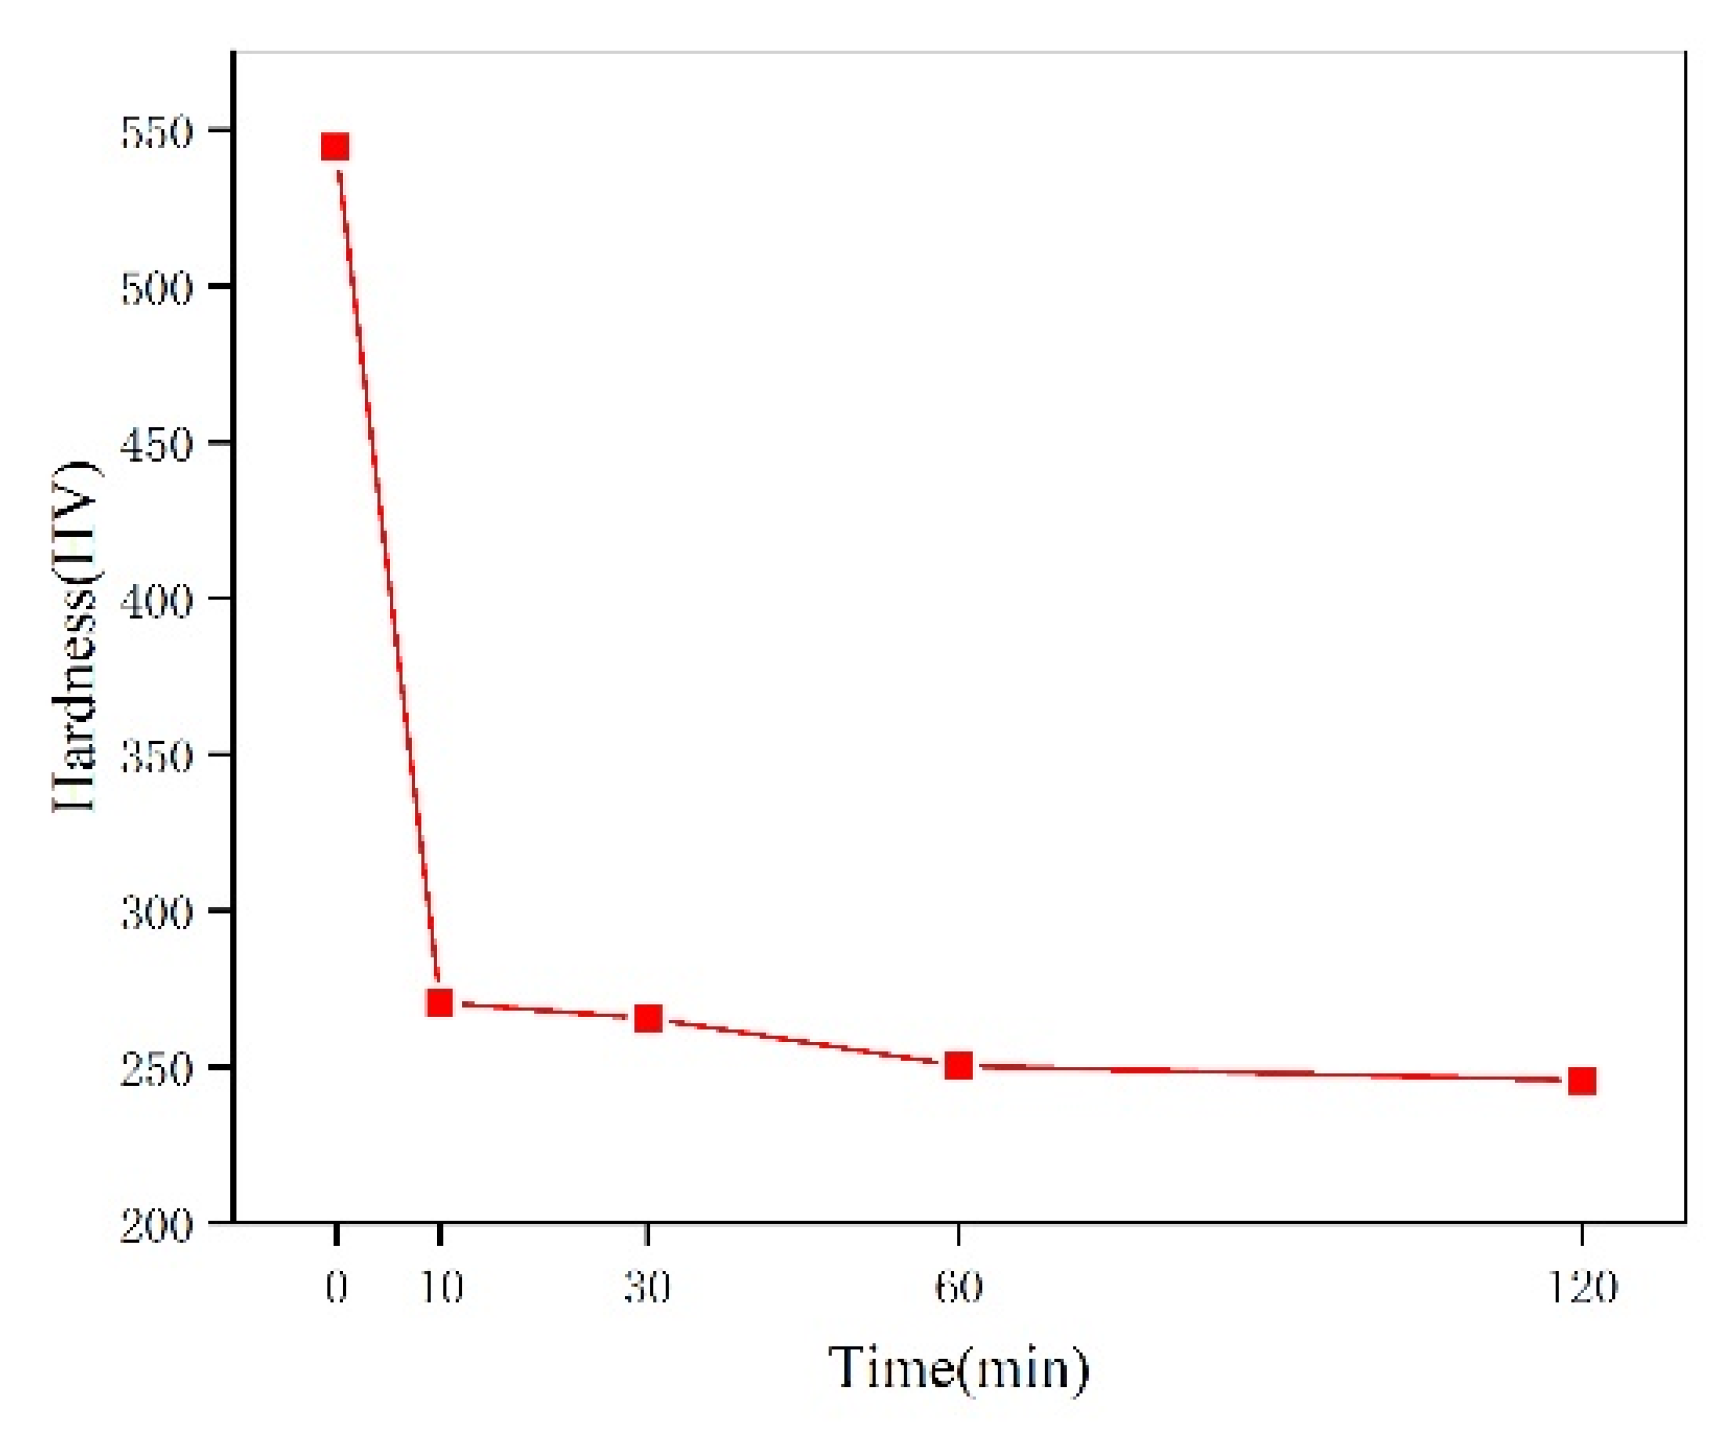
Figure 7 shows the curve of hardness changing with the annealing time. The hardness of the rolled state reaches 540 Hv due to work hardening. However, the hardness of the alloy is greatly reduced after annealing. The hardness decreases with an increasing annealing time. Work hardening still exists due to the presence of deformed grains, resulting in a slightly higher hardness during short annealing periods, e.g., 10 and 30 min. When the annealing time was extended to 60 min, it can be seen from Figure 6 that the grain growth was obviously accompanied by the disappearance of work hardening, which reduced the hardness of the alloy to a certain extent. After further annealing for a long time, the grain size changed little, while the hardness also changed little.
3.3. The Development of Twin during Recrystallization
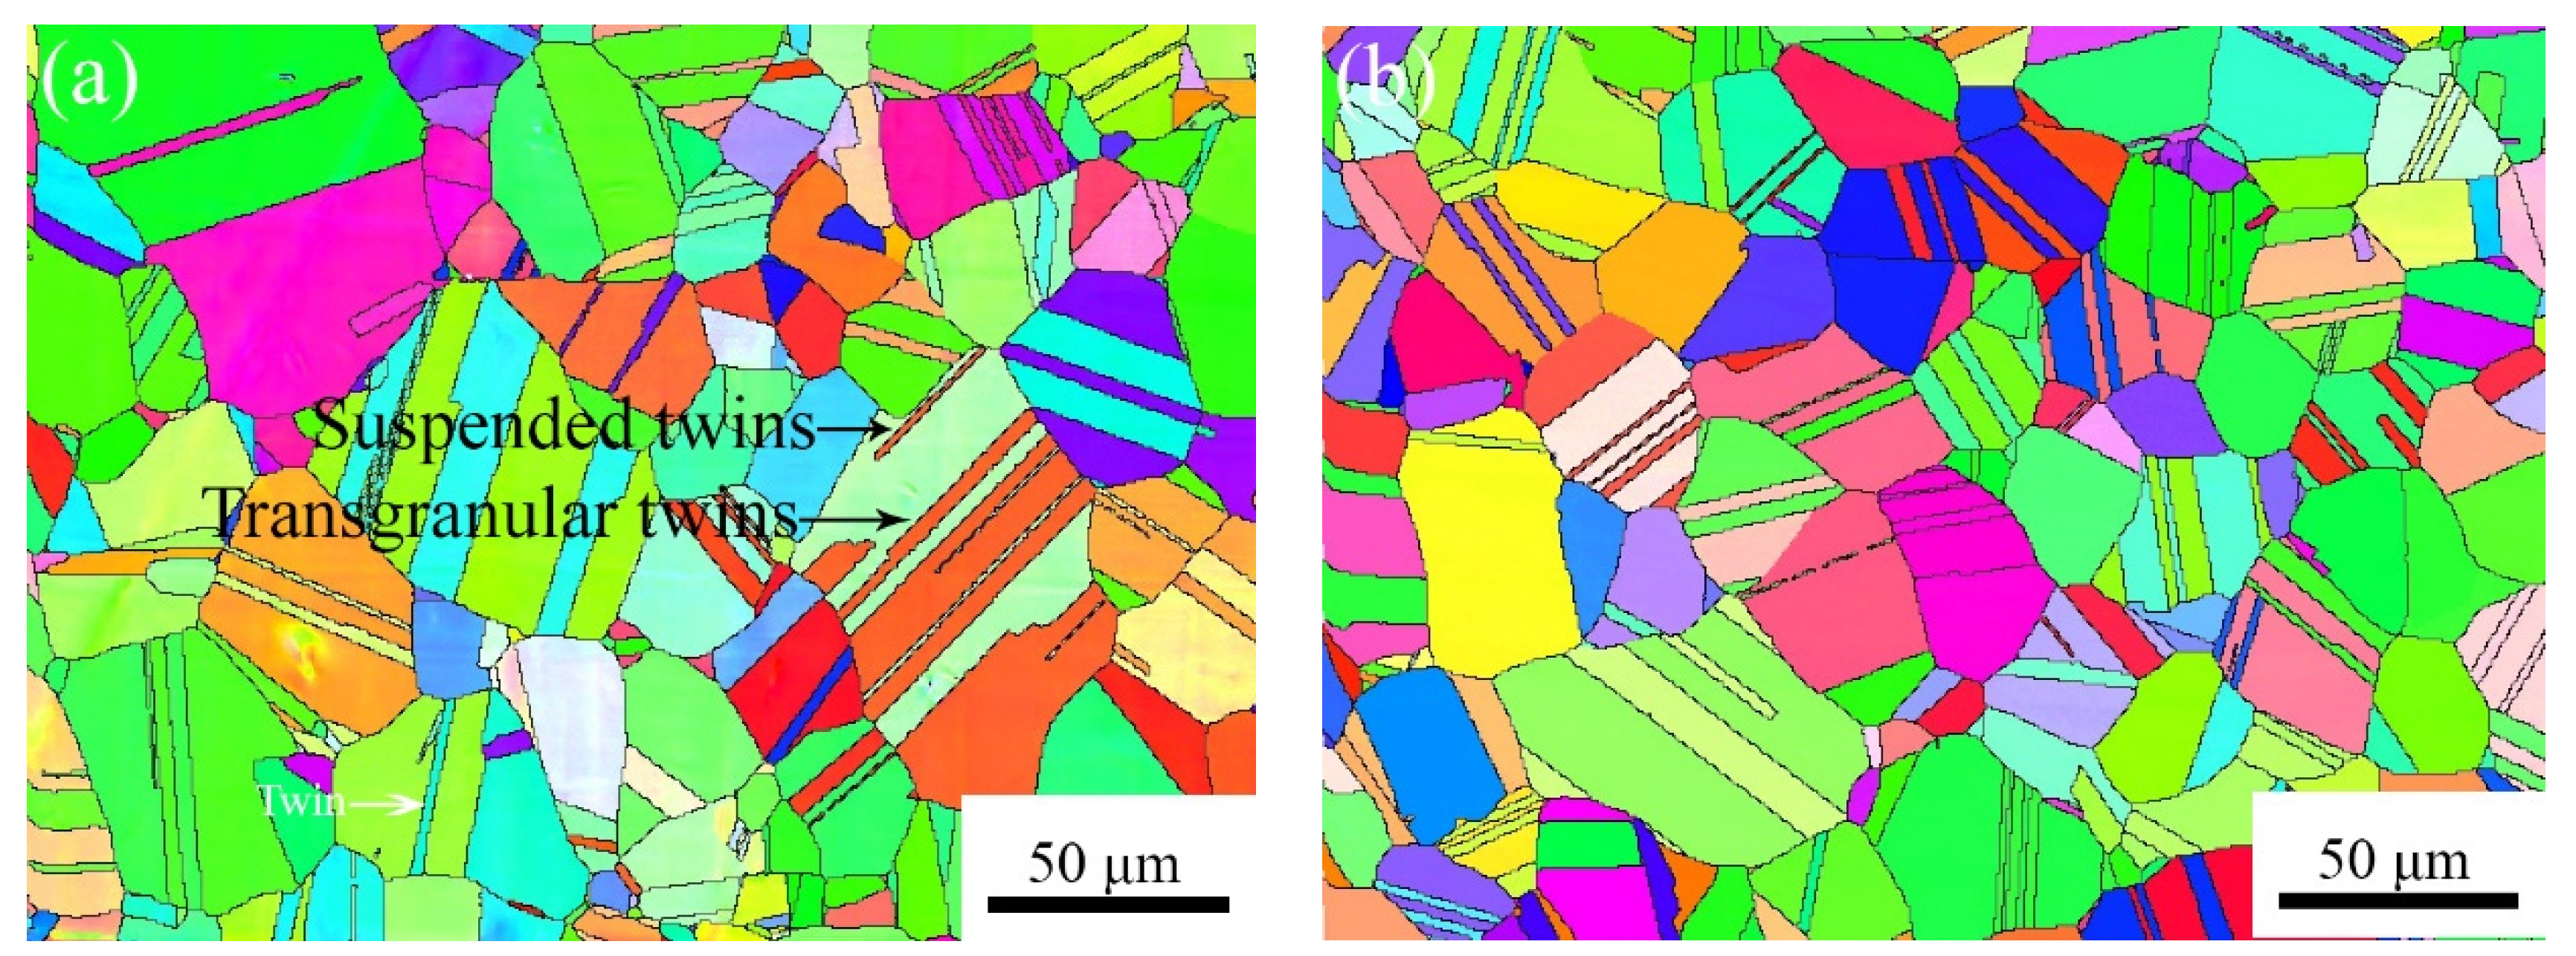
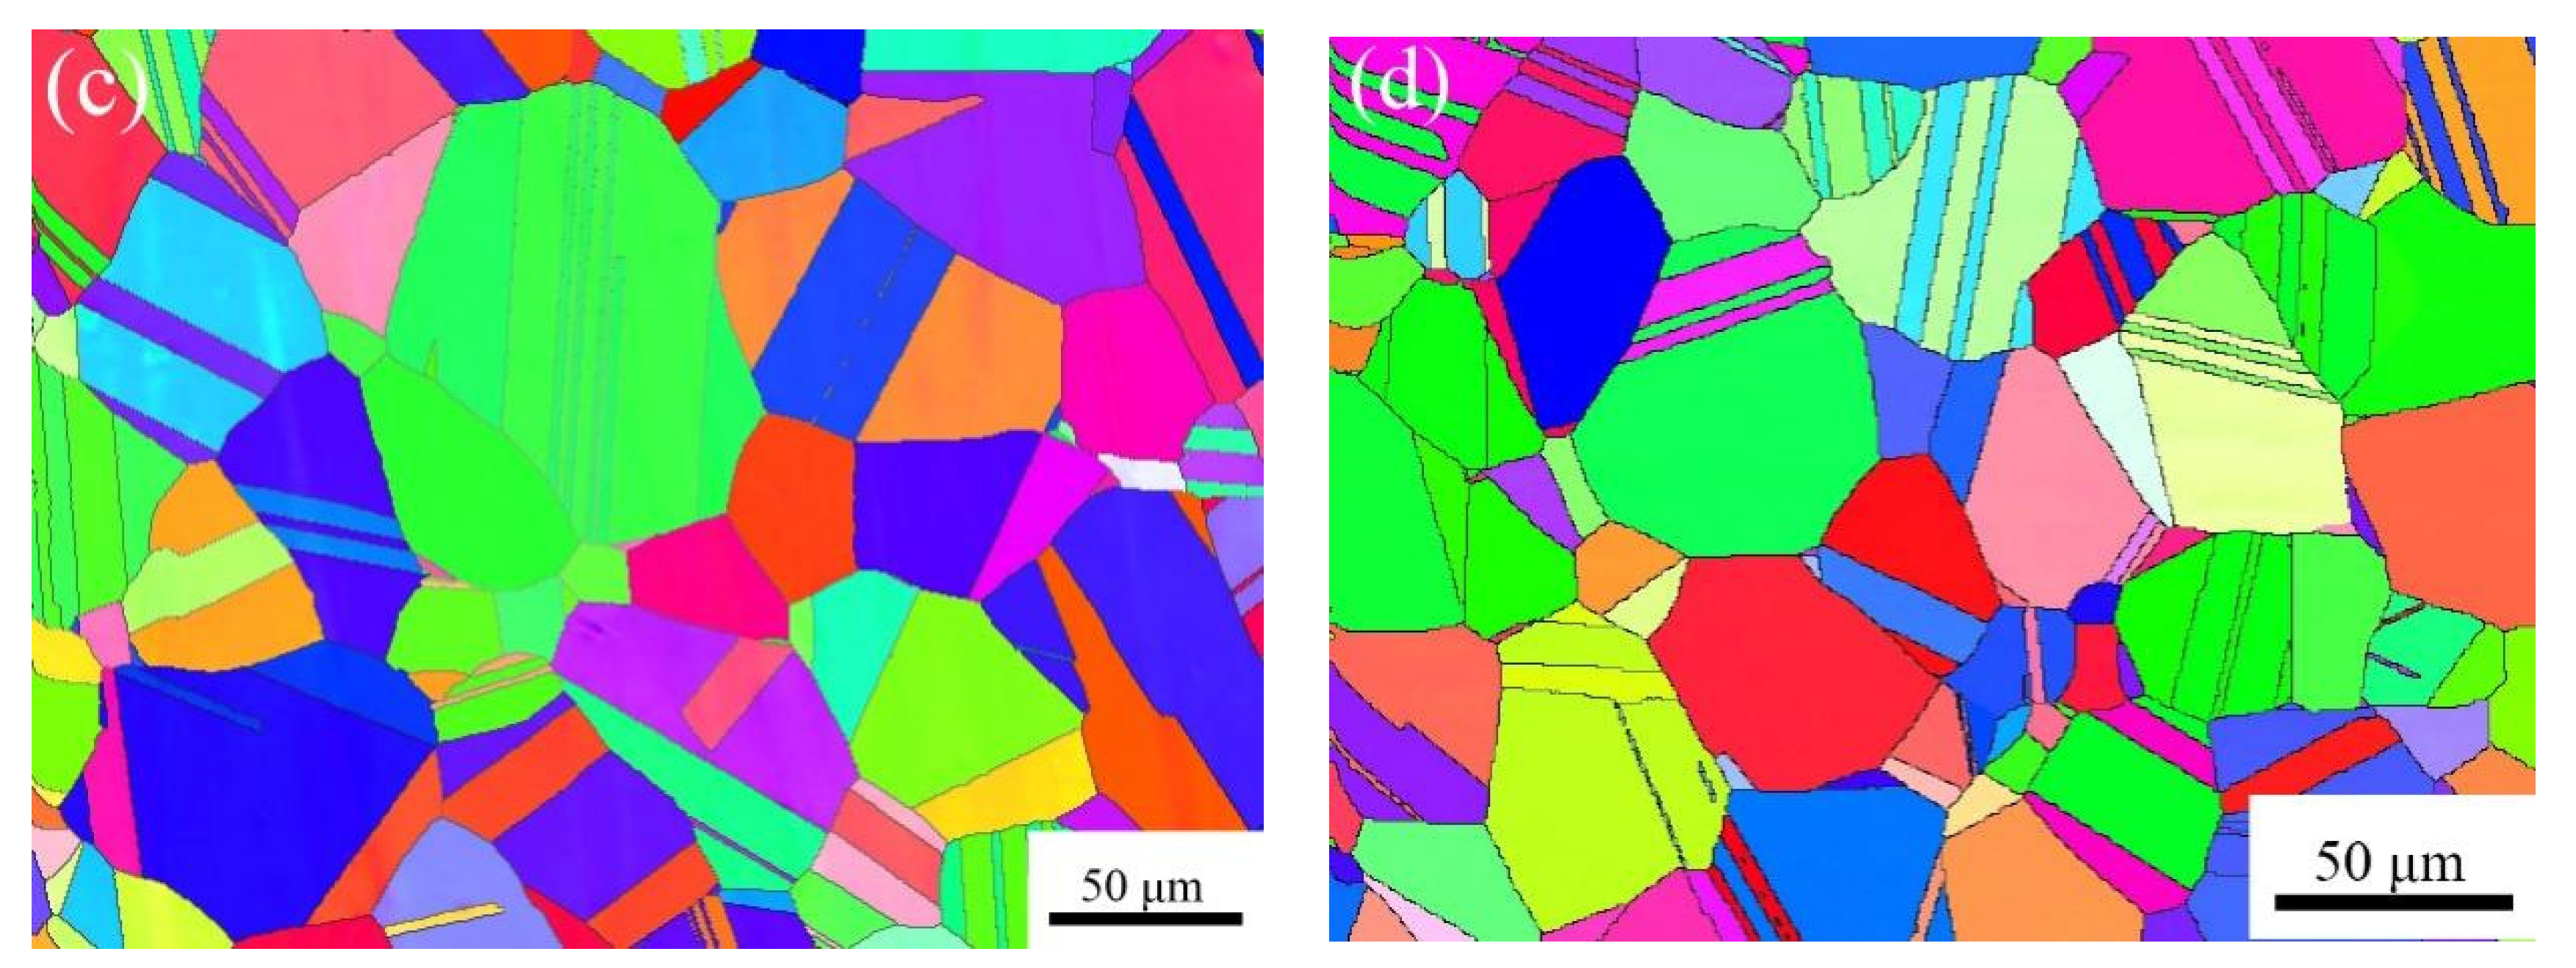
The IPF maps of the recrystallized samples reveal the random orientation distribution of the grains, implying no distinct crystallographic texture. Regardless of the annealing time, many twin grains are found in Figure 8, with a size of 10–100 μm, which is caused by the low stacking fault energy of the FCC structure. The annealing twins mainly consist of transgranular twins and suspended twins. The two ends of the transgranular annealing twin grow up with grain boundary migration, which is the coherent grain boundary, and the essence of the formation is a stacking fault. However, the suspended annealing twin stops inside the grain, the inner end of the grain is a noncoherent interface, and the formation mechanism is the movement of the partial dislocations according to the polar axis [33]. The interfacial energy of annealing twins is low and relatively stable. Meanwhile, the twin boundary plays a role in dividing grains. It is found that with an increasing annealing time, the number of suspended twins decreases gradually, while transgranular twins become the main component of twins.
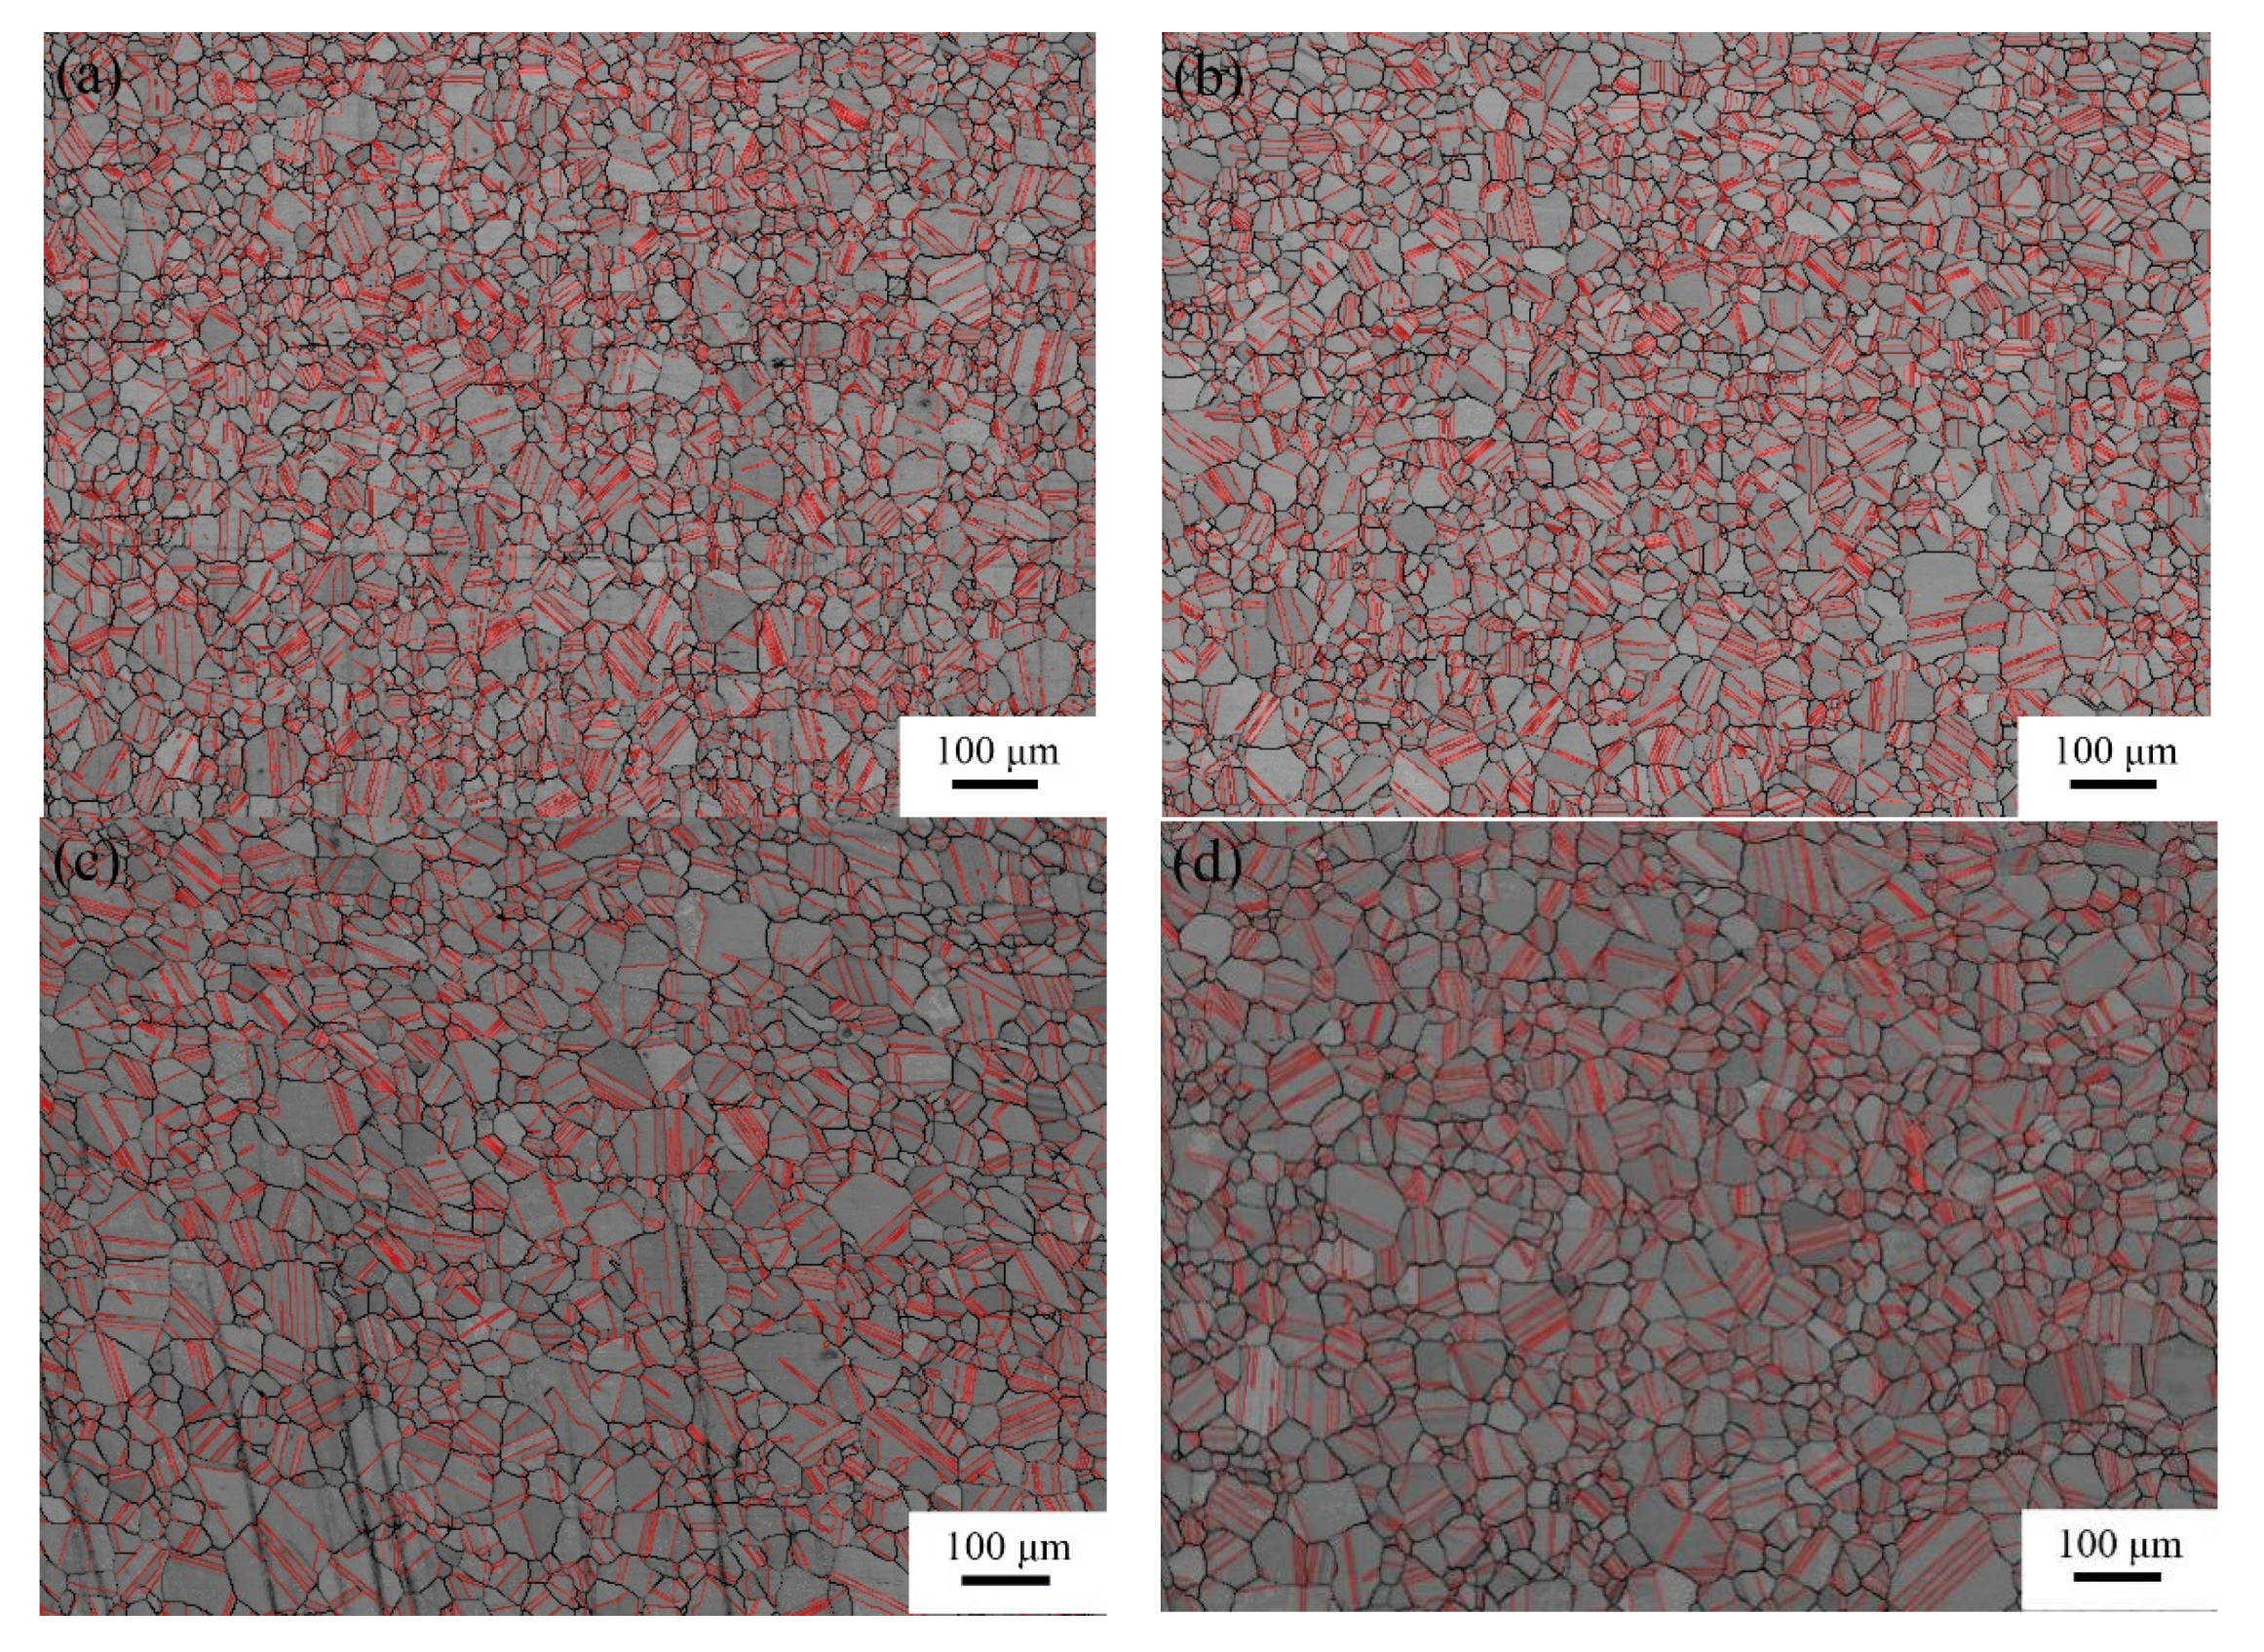
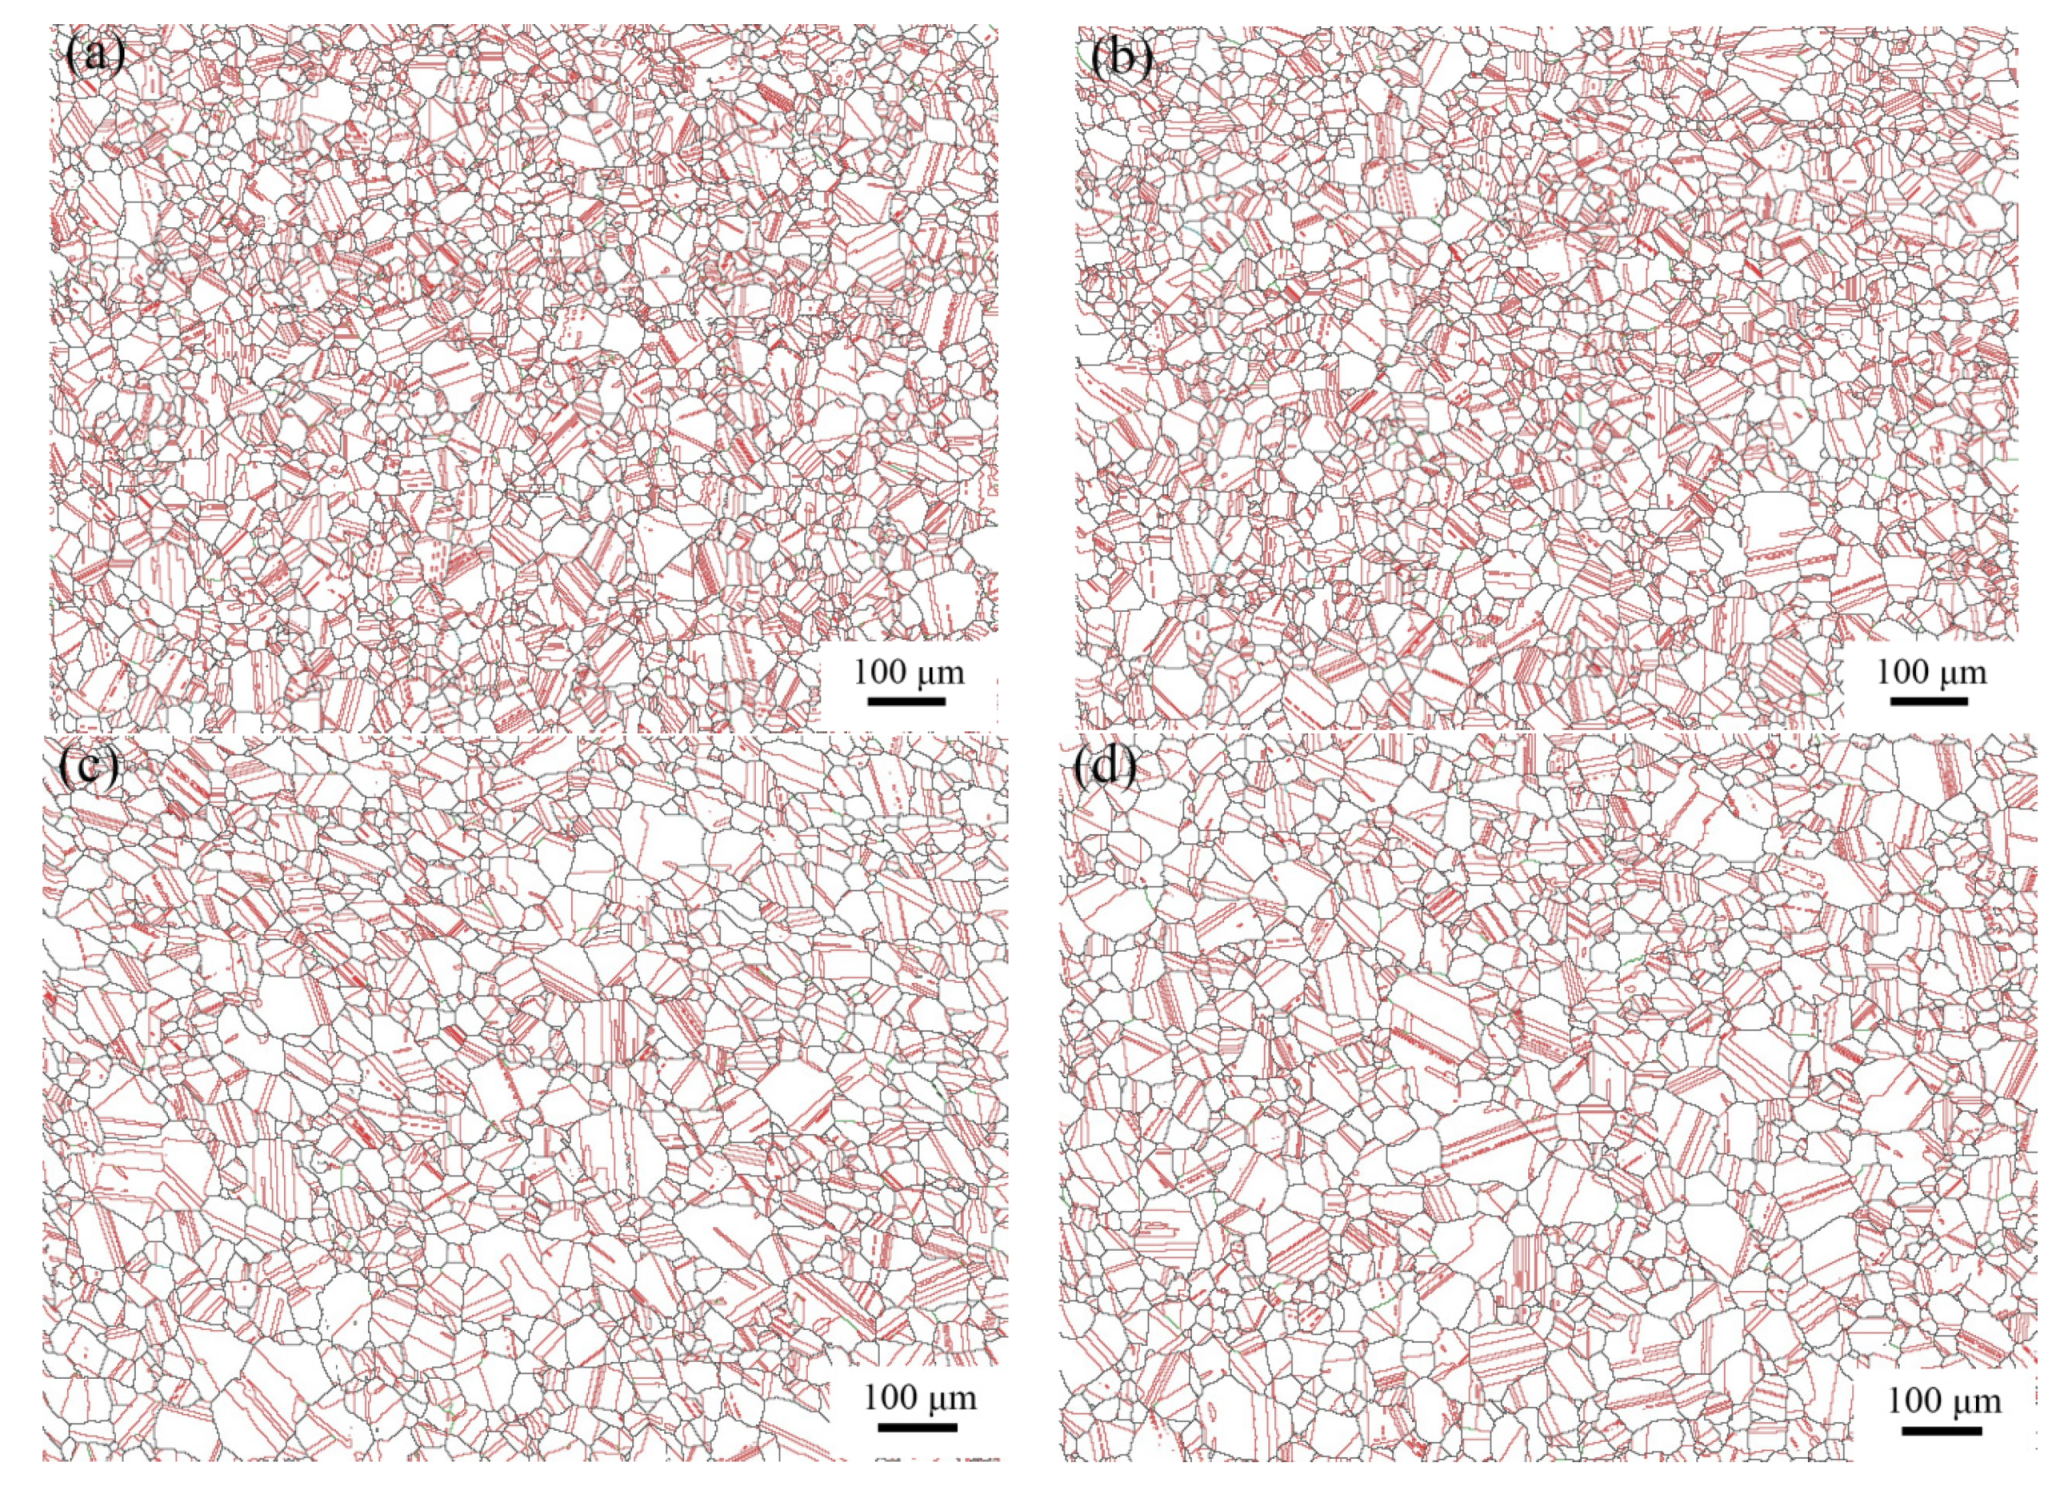
Figure 9 shows the grain boundary maps at different annealing times..In the grown grains, a mess of Σ3 boundaries with lamellar features (red line), as well as a small fraction of Σ9 boundaries (green line), can be observed. It has been reported that multiple twining is the reason for the formation of Σ9 and Σ27 boundaries [34]. As shown in Figure 9, the interactions among twins are weak in this study. Thus, the fractions of Σ9 boundaries are extremely low, and the fractions of Σ27 boundaries are almost nonexistent compared to those of the Σ3 boundaries. Therefore, through the fractional change of Σ3 boundaries, the development of twins and the process of recrystallization can be analyzed.
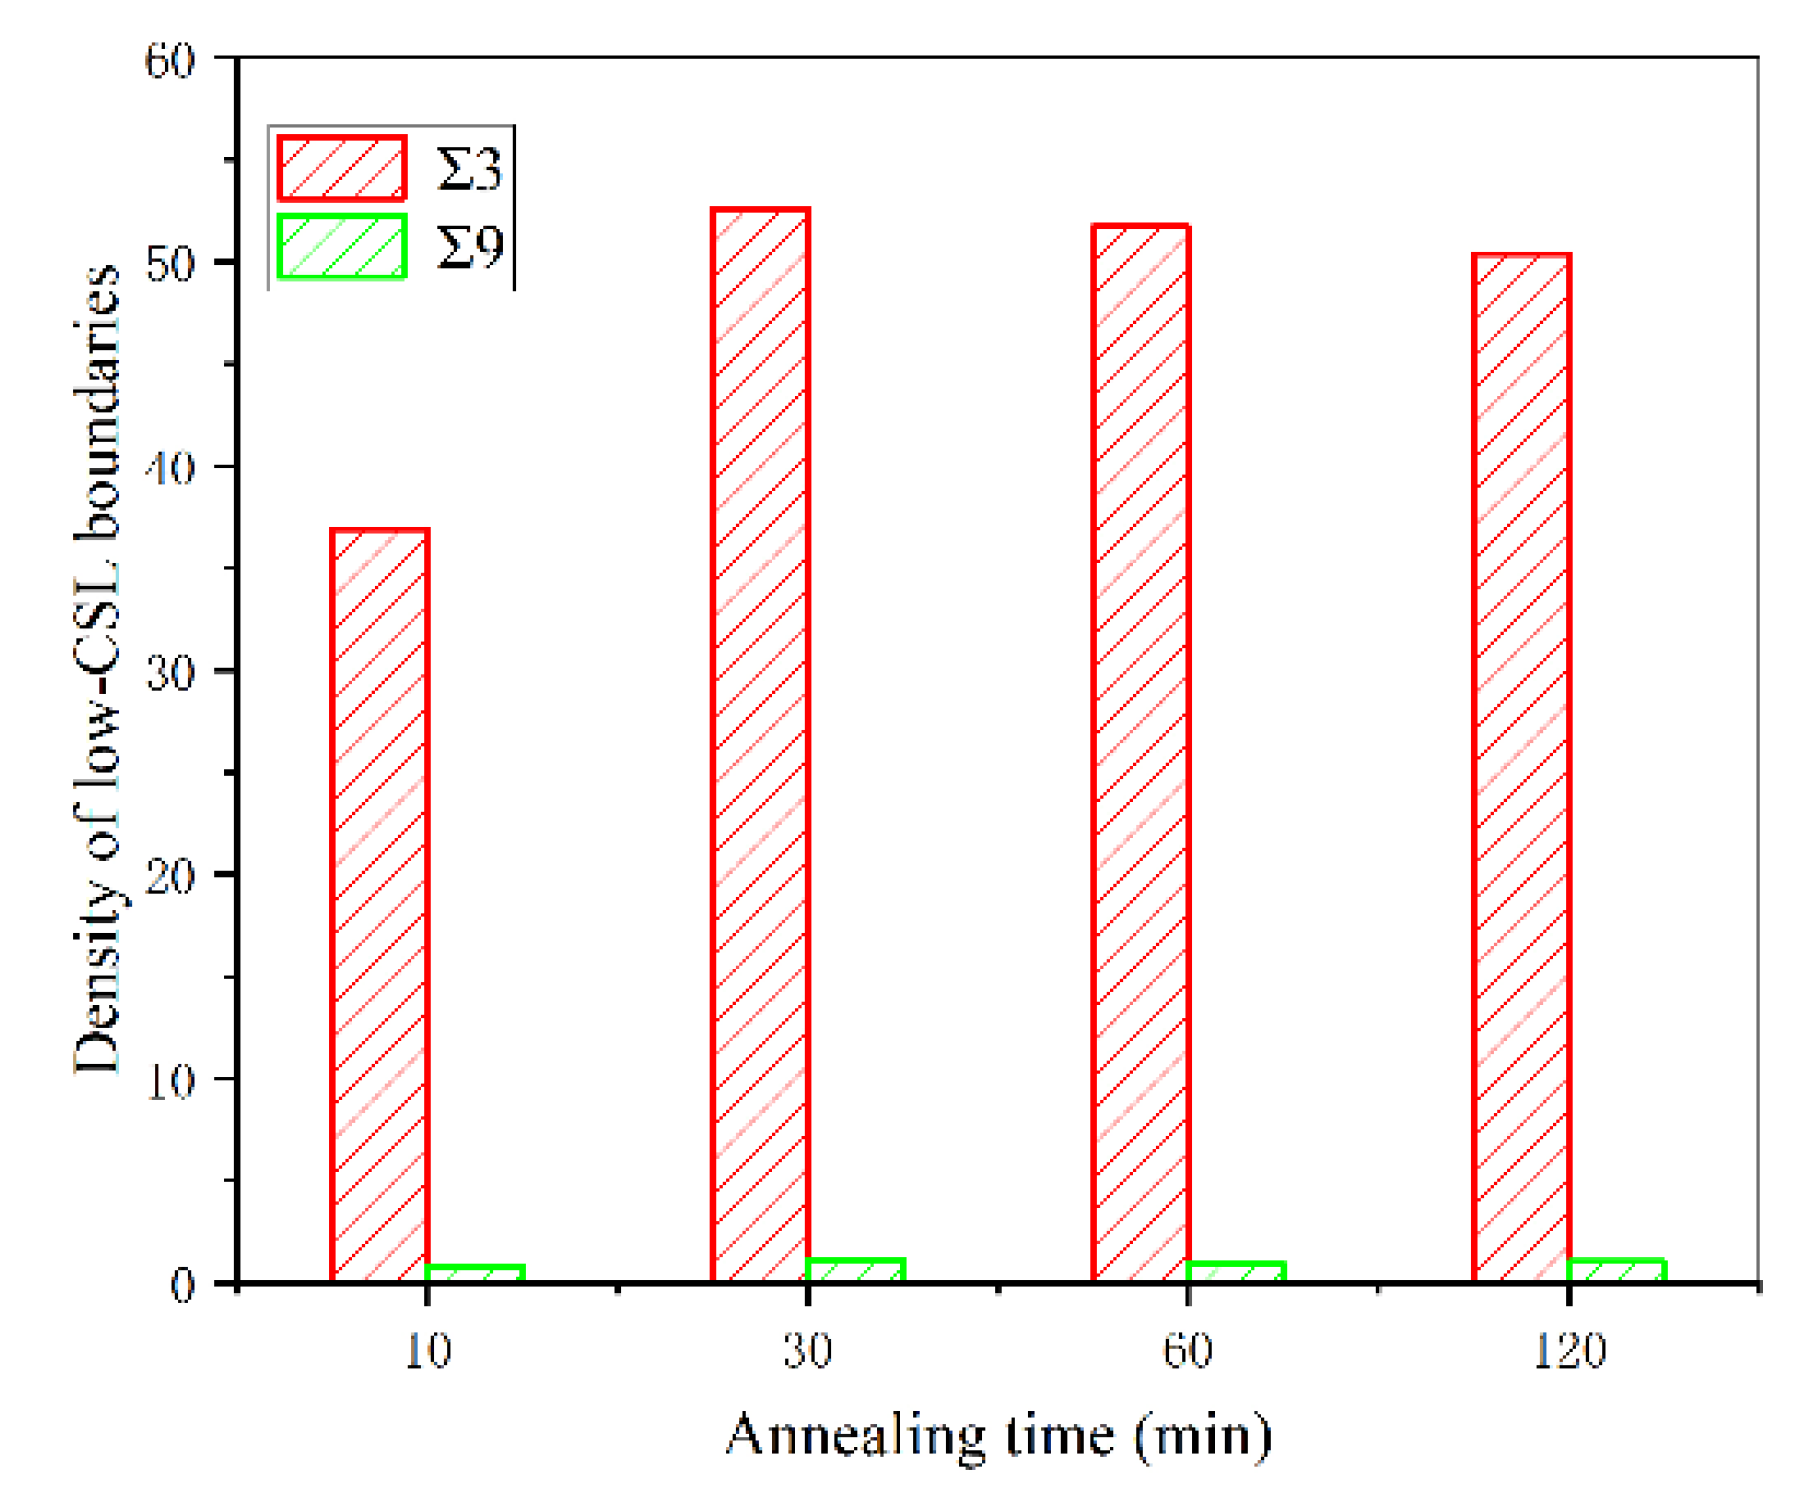
Figure 10 shows the variations in the Σ3 boundary density with annealing time. When the annealing time is increased from 10 to 30 min, the number of Σ3 boundaries increases sharply, which means that the extension of the annealing time can promote the formation of Σ3 boundaries. However, with a further increase in the annealing time, the density of Σ3 boundaries shows a slight drop. The grains grew until they collided, which affected the migration of the grain boundaries and decreased the grain boundary migration rate. Thus, it is difficult for the further development of twins. The annealing twins can be annihilated either by the migration of grain boundaries or annealing twin boundaries during grain growth. This is especially true for the lamellar twins that are terminated within grains [35]. The reason for the slight decrease in twins is the annihilation of twins during grain growth.
3.4. Variations of Textures
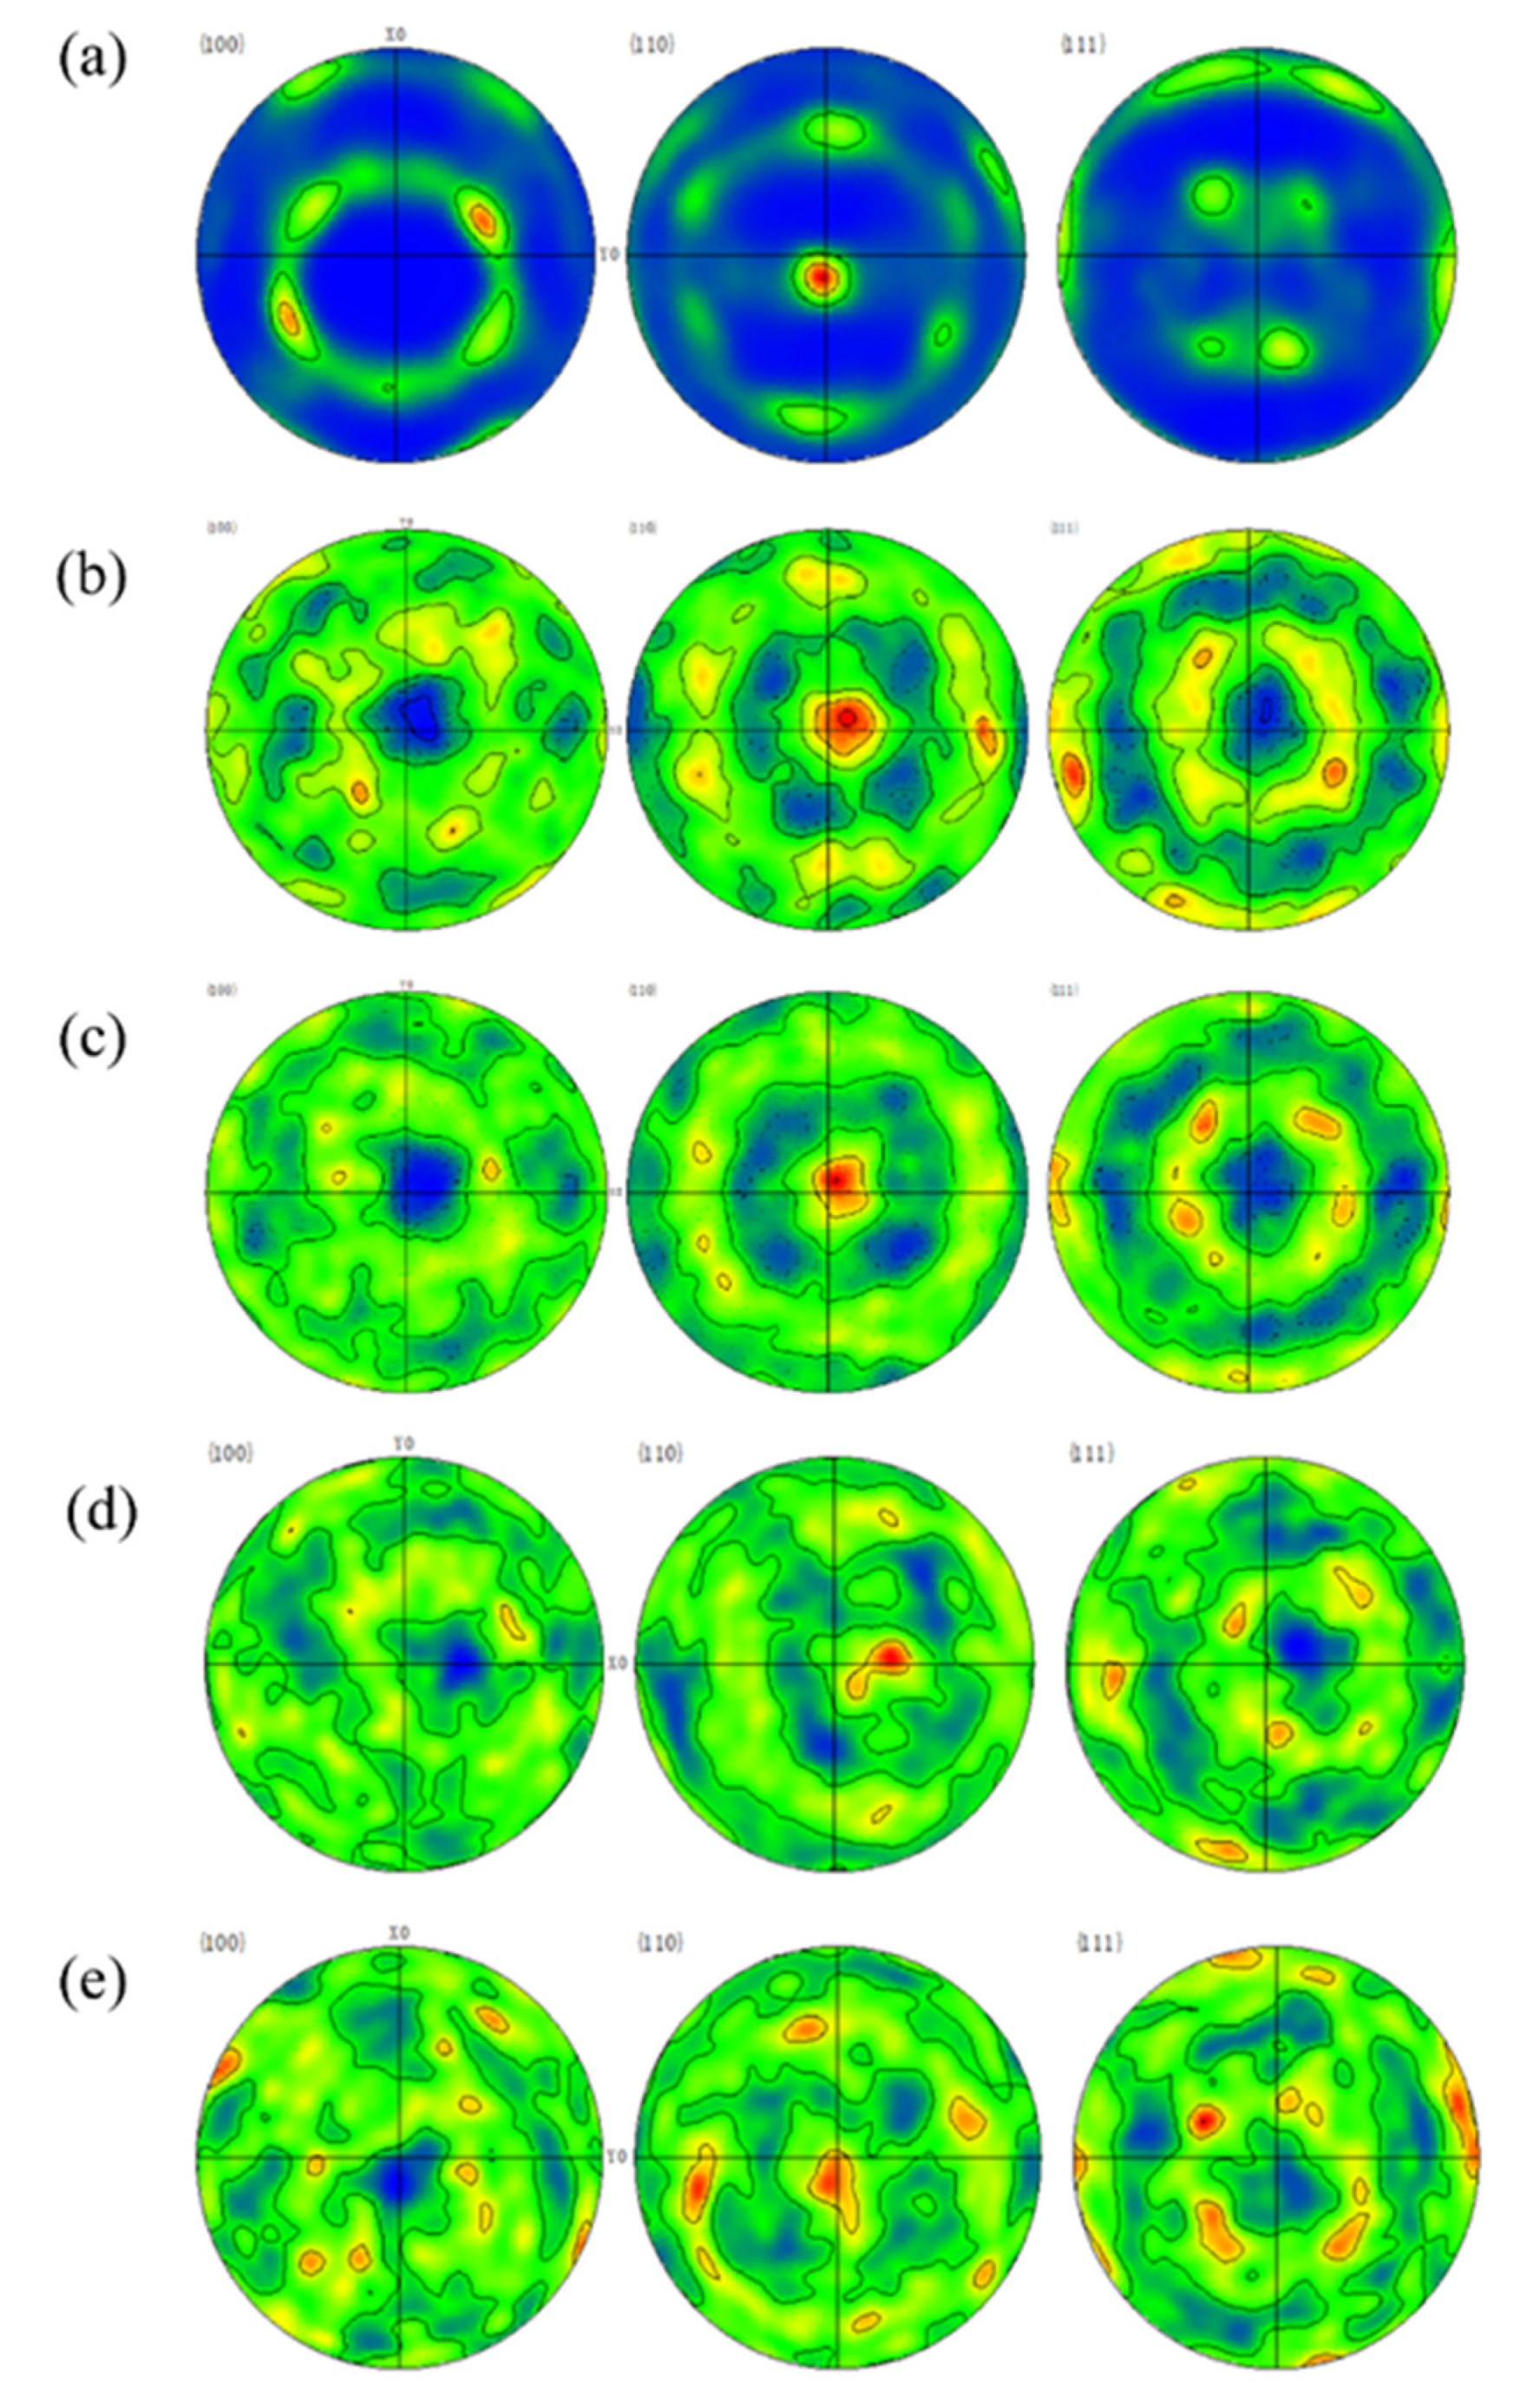
The pole figures (PF) of the samples corresponding to {100}, {110} and {111} planes, under different annealing times of (b) 10 min, (c) 30 min, (d) 1 h and (d) 2 h at 1150 °C are shown in Figure 11. Figure 11a is the rolled state. Obviously, it is found that the texture components shown in Figure 11a, i.e., the rolled specimen, are quite different from those obtained from the annealed specimens. There is a high-density texture along the {110} planes, as shown in Figure 11a, while the annealed specimens have the other texture components shown in Figure 11b–e. It has been reported that the twin orientation of cubes occurs in Ni-W alloys with a high tungsten content after annealing treatment [36], which can also be found in Figure 11b–e. Thus, variations in textures have continuity with the change in annealing time, which is related to the twins formed during the annealing process.
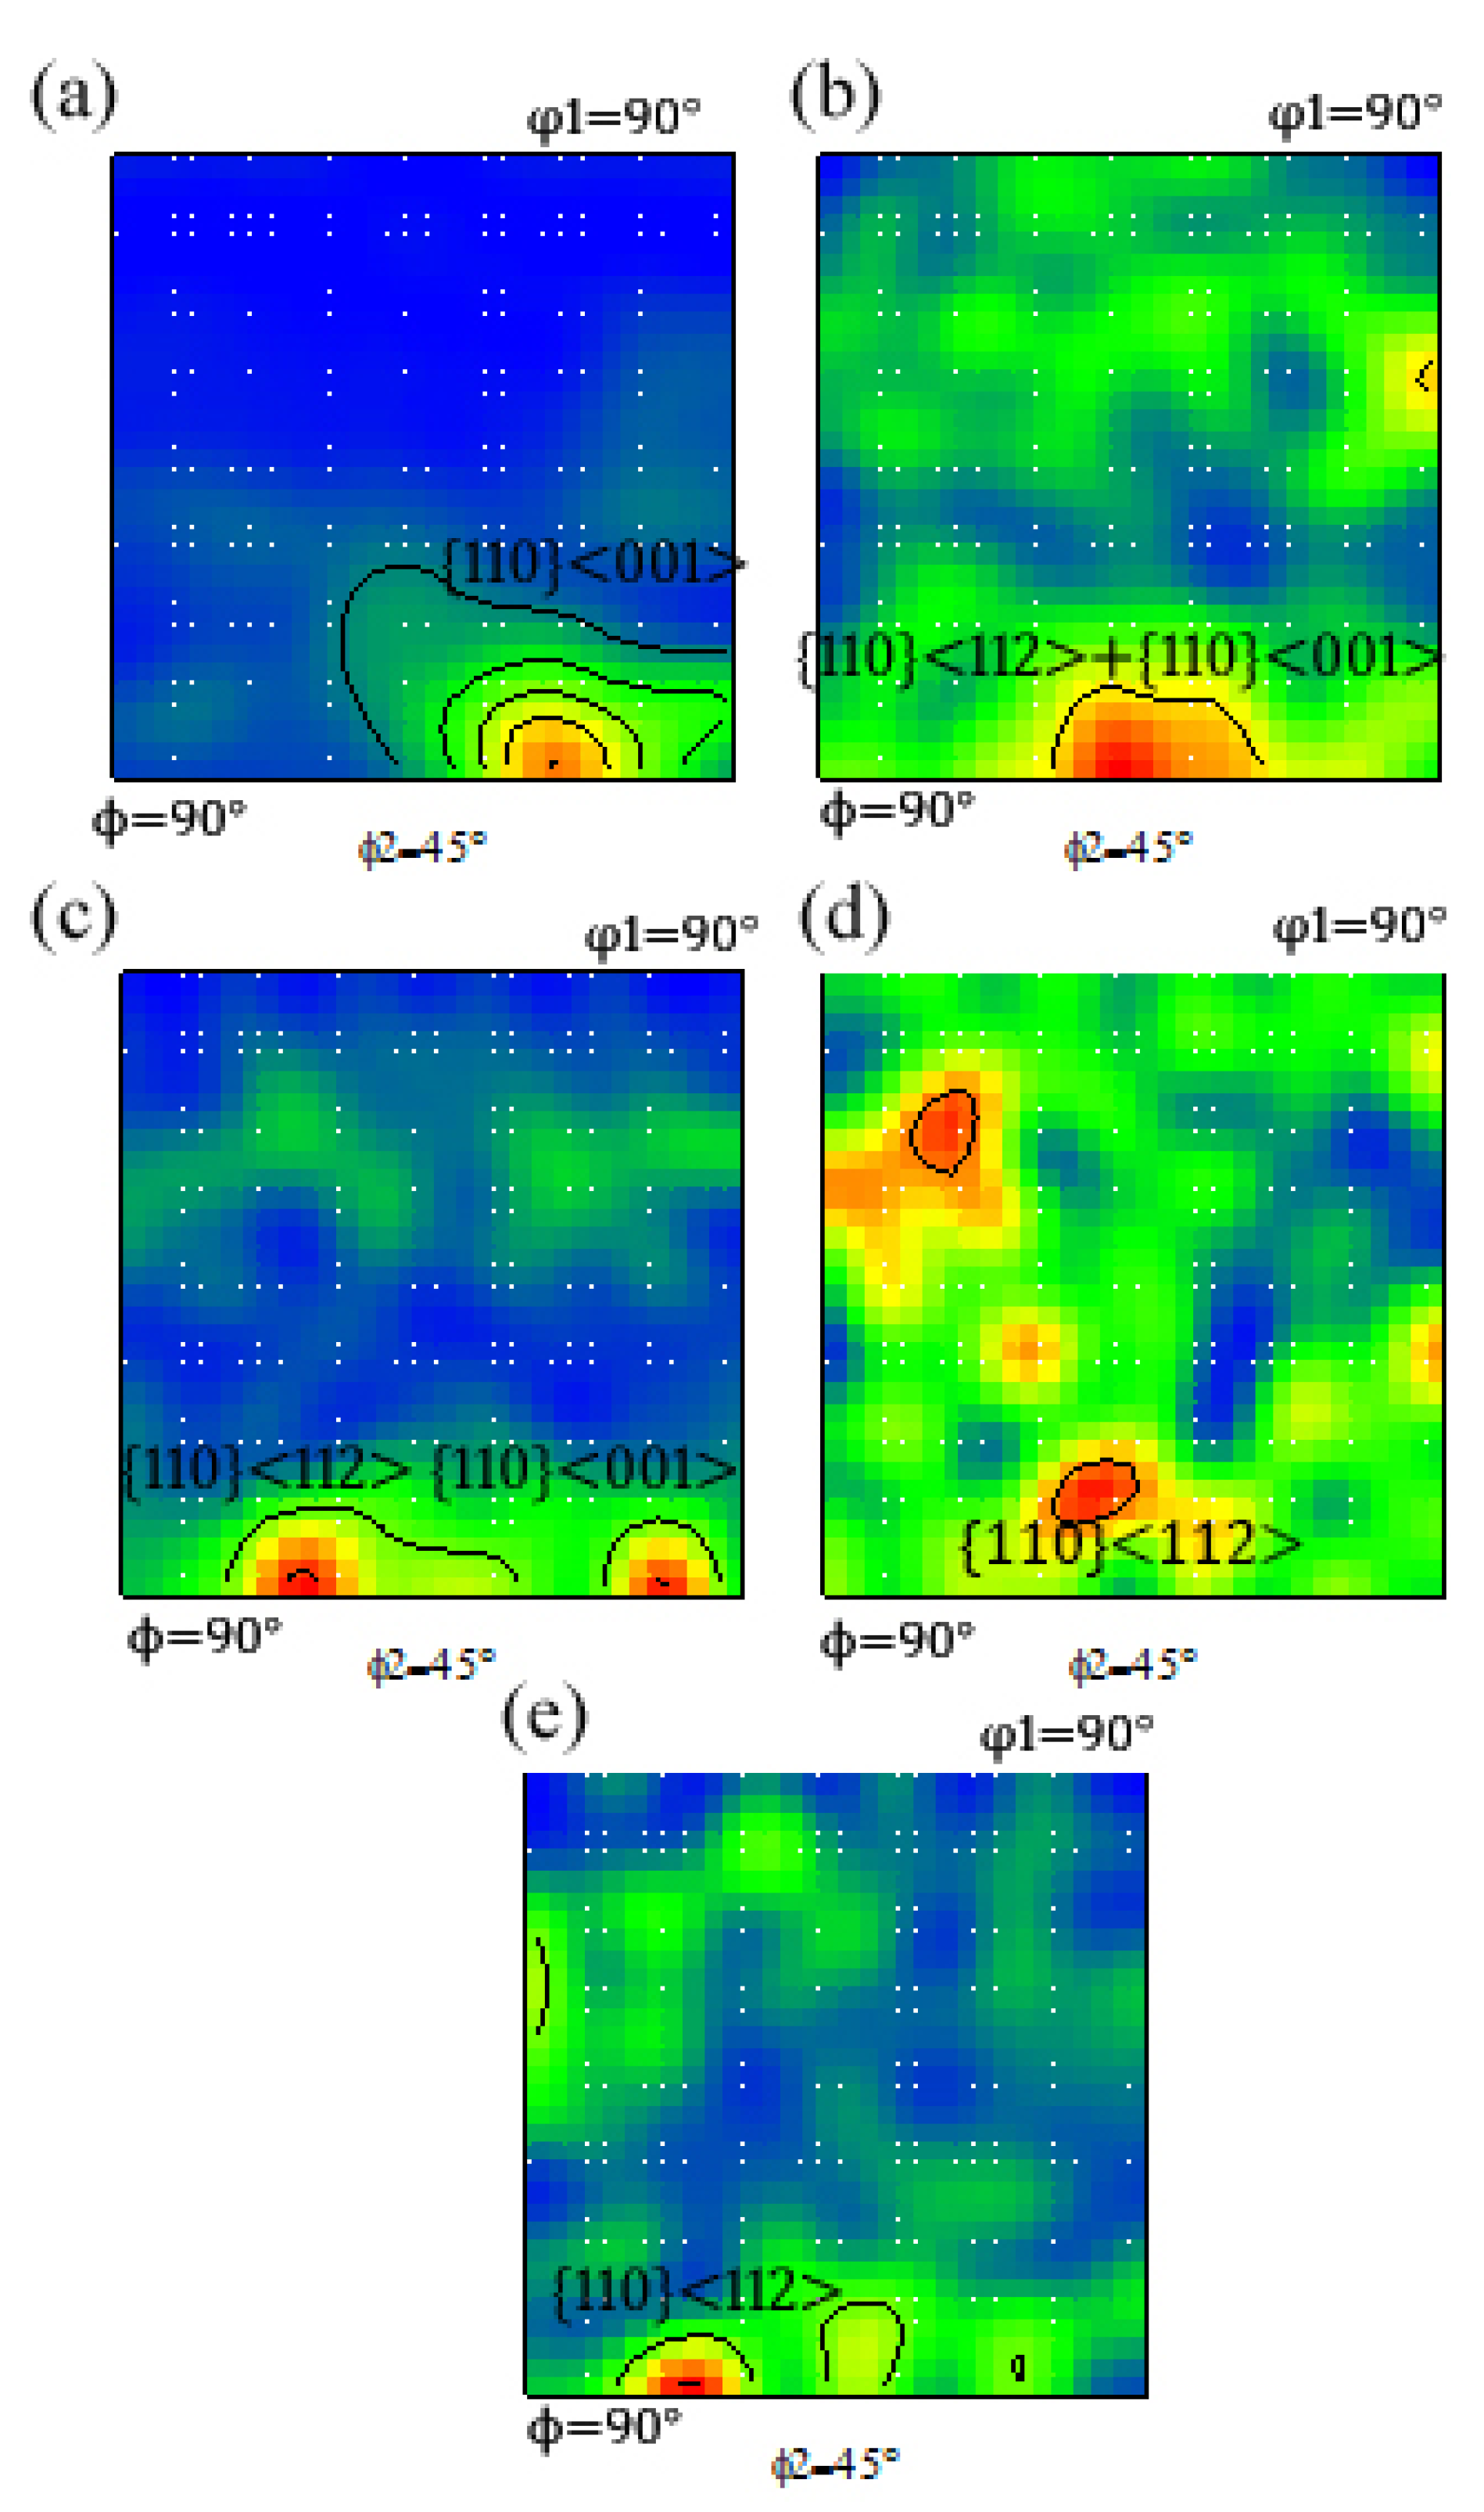
Detailed information on the variation in textures is revealed by the orientation distribution function map (ODF) with Euler angles φ2 = 45°, for the samples annealed at different times. The orientations {112}<111> and {011}<211> are both stable orientations when the FCC metal is deformed by slip. Among them, the {112}<111> texture is the twin orientation of FCC metals [37]. As shown in Figure 12a, there are mainly strong {110}<001> textures and very weak {112}<111> textures. After recrystallization annealing, unstable deformed grains disappear and stable recrystallization grains form. Recrystallization causes a recrystallization texture, as shown in Figure 12b–e. Obviously, the {110}<001> texture generated by cold deformation is gradually replaced by the {110}<112> texture. As shown in Figure 12d, the {110}<001> texture disappeared completely after annealing for 60 min, which means that the recrystallization at this time has taken place completely.
3.5. Recrystallization Process
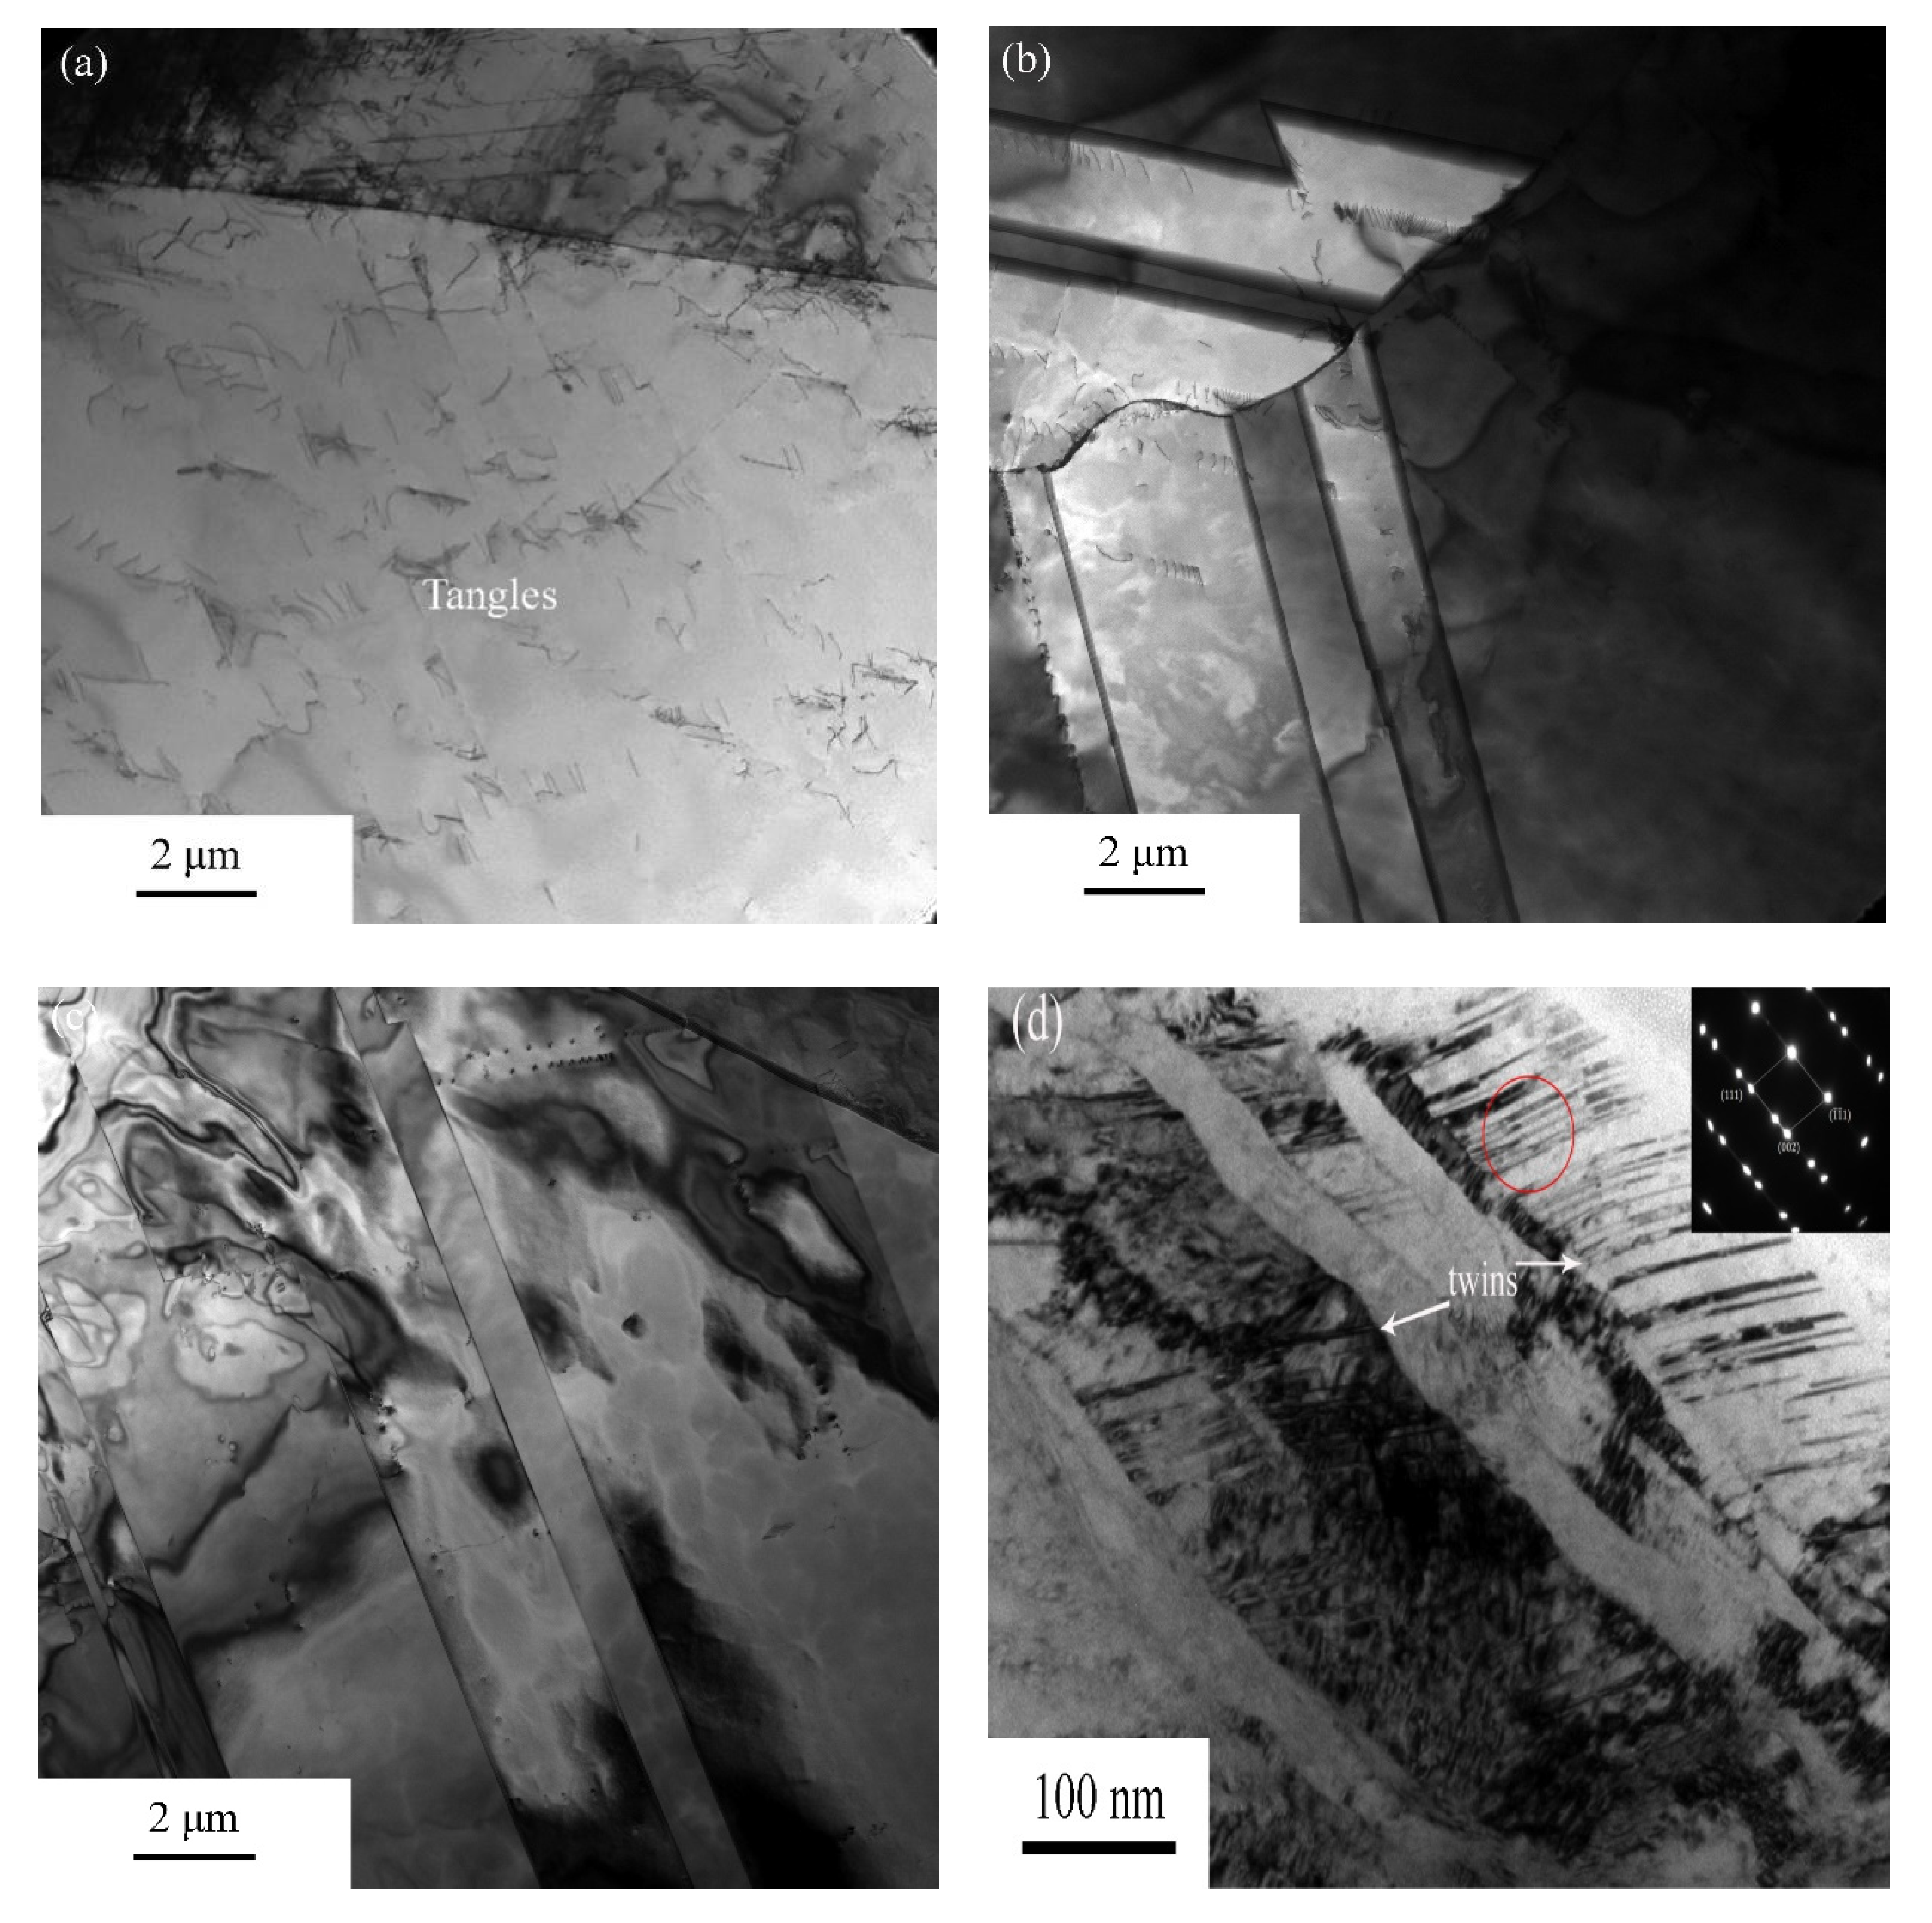
Figure 13 shows the TEM observations under different states, which can clearly show the formation and development of twins. As shown in Figure 13a, the matrix was severely cut under large deformations, and a large number of dislocation entanglements occurred, which provides a driving force for static recrystallization during subsequent annealing. Dislocations are arranged neatly along a certain direction. It has been reported that with the increase in cold deformation, the deformation of low stacking fault energy metal changes from slip deformation to twin deformation [38]. Strangely, no obvious deformation twins are found here, but there is a weak deformation twin texture in Figure 12a, which may be our negligence but does mean that there are no deformation twins. The deformation of this alloy has both ship deformation and twin deformation. In our follow-up discussion, we find that there is no correlation between the recrystallization process and the deformation twins; therefore, we are not conducting in-depth research on the deformation twins. After annealing for 10 min, a close observation of the twin boundary in Figure 13b reveals that the so-called grain boundary is still only a series of stacking faults, and there is still a high dislocation density between the stacking and stacking faults, meaning that distorted grains still exist. Stacking faults develop with grain boundary migration. Surprisingly, the dislocations between the stacking faults were aligned in the same direction, seemingly continuing to divide the grains into “blocks”. As the annealing time is prolonged, the dislocation density is reduced. Due to the grain boundary migration and the motion of the dislocations, the boundaries of the “blocks” become more obvious, and the size decreases, as shown in Figure 13c. Finally, in Figure 13d, the twins are aligned in a specific direction. These twin grains are very small, with widths of only 10–50 nm and lengths of 100–200 nm. Figure 13d demonstrates that these annealing twins are along the {110} planes, which is consistent with the texture evolution described above.
4. Discussion
Understanding the relationship between the twin and recrystallization is a critical step toward application. It can be seen from the macrostructural observations shown above that annealing twins are very important for the recrystallization mechanism of the Ni-Co-W alloy we studied in this paper. As we mentioned in Figure 7 and Figure 9, twin grains can be observed from the specimens at any annealing time. At the same time, variations in the twin boundary also appear to be consistent with those reported in previous works.
The average grain size during grain growth can be represented as follows [31]:
where d and d0 are the average grain sizes after and before grain growth, respectively. T and t are the annealing temperature and annealing time, respectively. R is the gas constant. N1, a1 and Q1 are material constants.
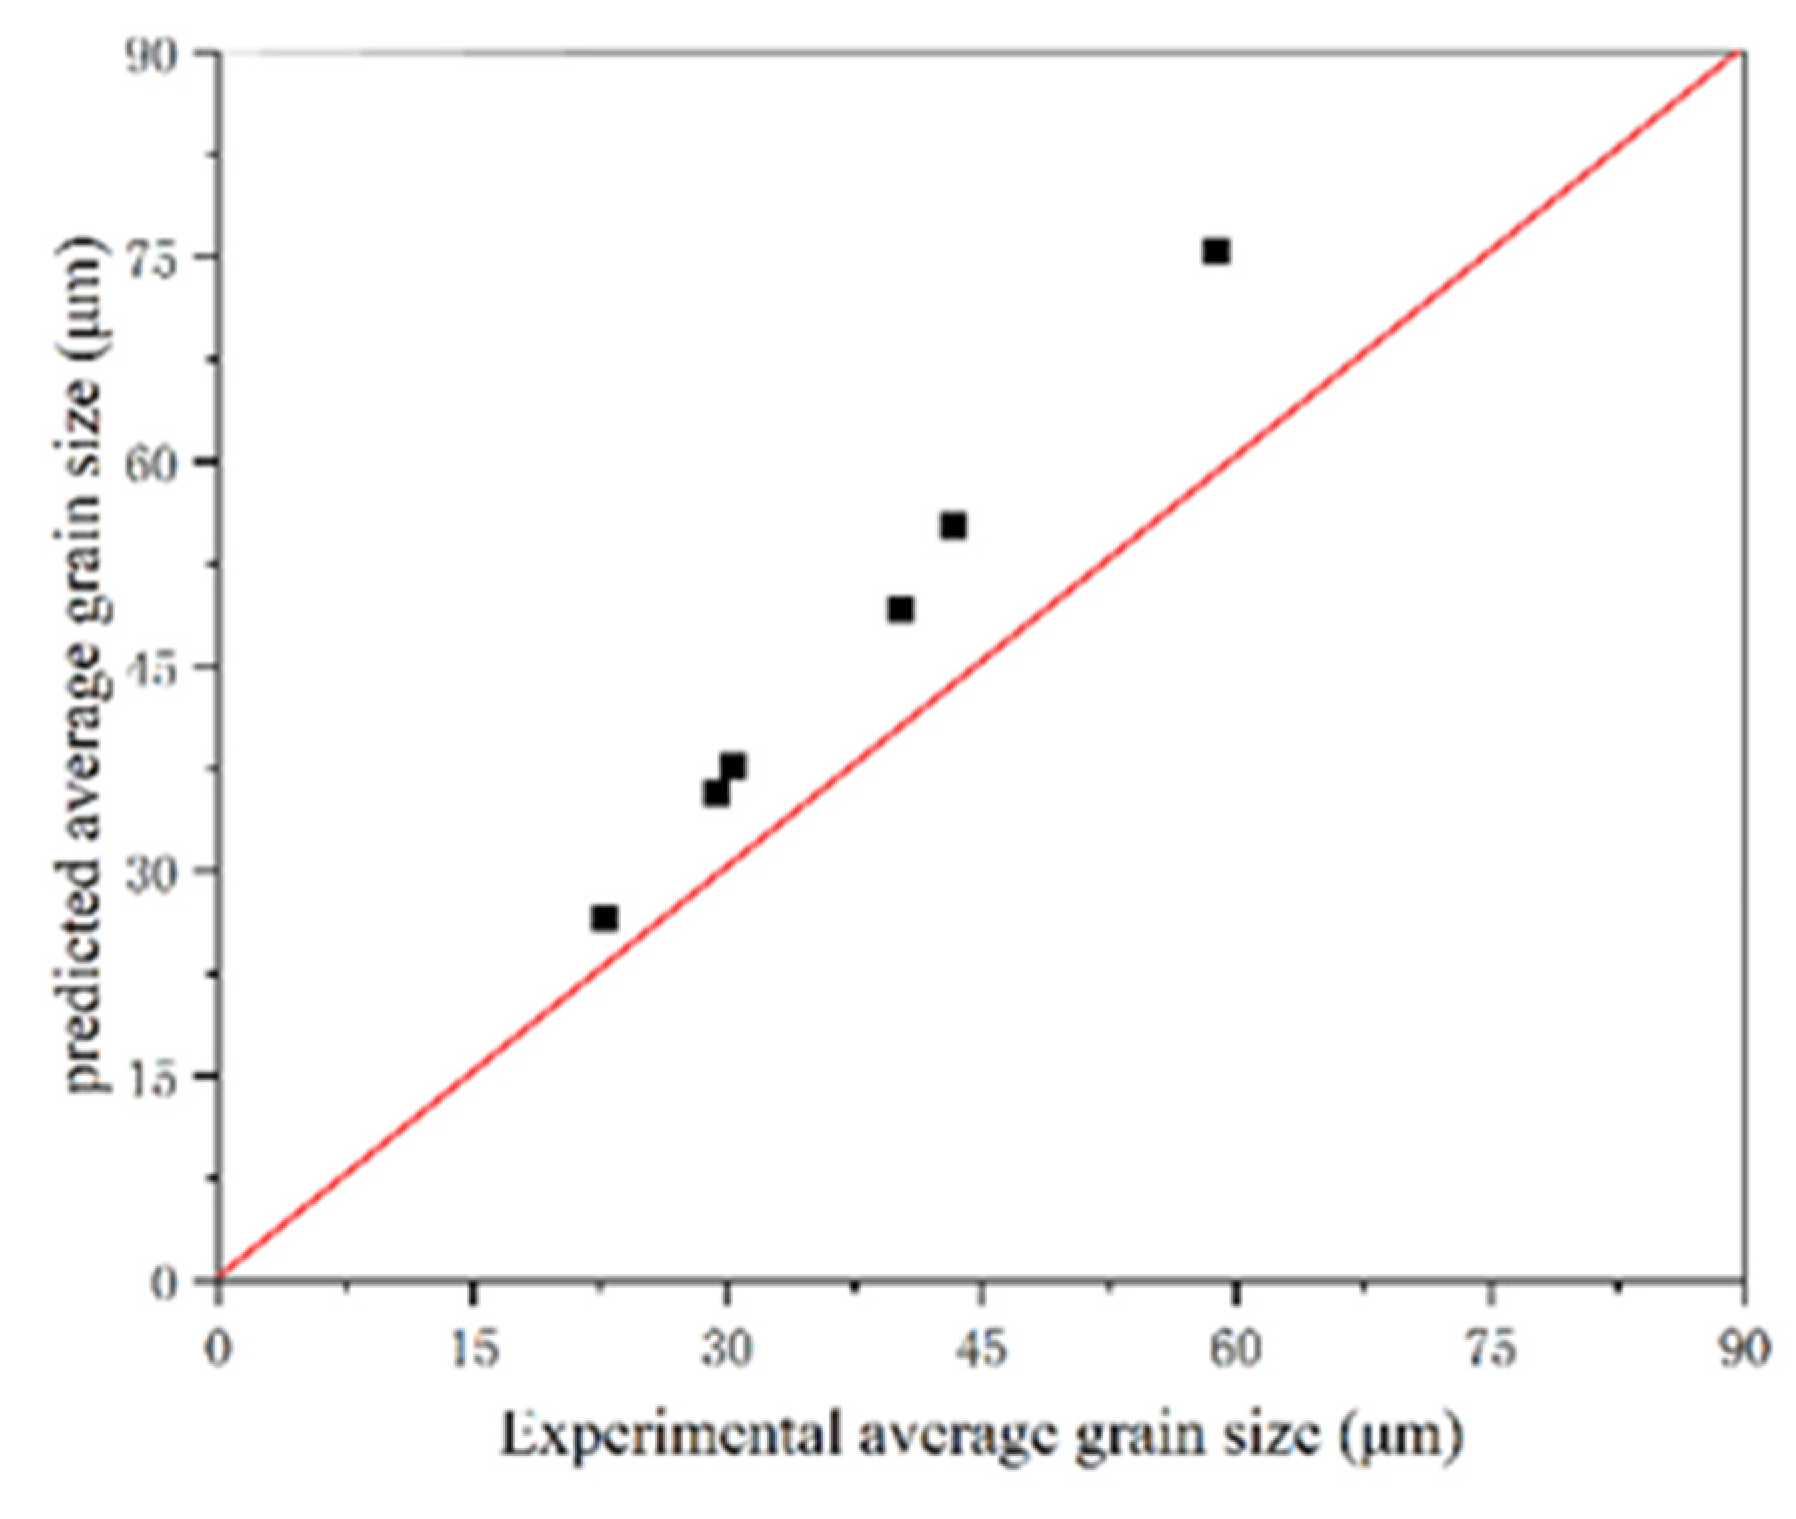
Through calculation and fitting, the value of Q1 is 701 kJ/mol for the study, which is higher than those of other alloys, such as 623.14 kJ/mol for a nickel-based superalloy [30] and 463 kJ/mol for the CrFeCoNiMo0.2 alloy [39]. Figure 14 depicts the scatter map of the experimental and predicted average grain sizes under all the tested conditions. There is no good agreement between the predicted and experimental average grain sizes, indicating that the grains did not grow up normally during the recrystallization process. As mentioned above, sub-grains were found at an early annealing time from EBSD. The microstructure at this time has changed a lot compared with the rolled state. This is because after severe deformation, the recrystallization nucleation is carried out by a sub-grain nucleation mechanism. However, low-SFE metals and alloys require lower energy for twinning during recrystallization [25,40]. In addition, in a Ni-W system, due to the large difference in the atomic radius, a stacking fault and twins are easily formed. Therefore, the massive appearance and development of twins can also be well explained. The apparent activation energy for recrystallization is too high, meaning that it requires a large driving force and high recrystallization temperature. Thus, the recrystallization mechanism of the Ni-36.6W-15Co alloy is different, that is, the early sub-grain mechanism and twin mechanism work together.
The twins can also be confirmed by the TEM observations shown in Figure 15a. The twins are generated in the grain boundaries, while the number of twins is limited. The SADP of the twin areas, as seen in Figure 15a, shows that the twin is along the (110) planes, which is typical in face-centered cubic materials. It is well known that the annealing twin formation is related to a “growth accident”, i.e., coherent twin boundaries at migrating grain boundaries due to the occurrence of stacking faults [41]. The small twin is generated at the triple junction point when a growth fault occurs. The interfacial energy of annealing twin boundaries is fairly low. It is generally only a hundredth of large angle grain boundaries. If the relative orientation of the twin boundary is lower than that of the grain boundary, the twin boundary will continuously grow with the migration of the grain boundary. As grain growth proceeds, the grain boundaries gradually tend to become straight. Accordingly, the small annealing twins also grow up, which are gradually perpendicular to the grain boundary. When the triple point coincides with another, the grain growth is terminated, and large grains and stable twins appear.
However, stacking faults can be found in Figure 15a, which divides the grains into strips. It looks similar to a twin boundary, but a stacking fault is evident from the HRTEM image, as shown in the red box in Figure 15b. A stacking fault that is forming can also be clearly seen, as shown in the red circle in Figure 15a. The formation and evolution of twins, therefore, seems to be different.
Therefore, the formation and development of twins in the annealing process of this type of alloy are different according to the more common rules of the formation and development of twins. The evolution of the twins of this alloy can be summarized in three steps. First, at the early stage of annealing, places that are severely deformed, because of a low stacking fault energy, dislocation motion or decomposition, and the atomic fault arrangement form stacking faults, which separate the distorted grains. The stacking faults develop with grain boundary migration, which forms transgranular twins. In addition, partial dislocation movement forms suspended twins. Then, with an increasing annealing time, the high dislocation density between the stacking fault bands ensures a further dislocation movement and decomposition, leading to the formation of more stacking fault bands, which continuously consume the dislocations and “eat up” the distorted grains. Finally, the dislocation motion causes the stacking faults to transform into grain boundaries, forming twins without distortion.
5. Conclusions
In this paper, the evolution of the annealing twin and recrystallization mechanism of a Ni-36.6W-15Co alloy were investigated using macrostructural analysis including SEM, EBSD and TEM techniques. The following conclusions can be drawn:
- (1).
- With the increase in the annealing temperature from 1100 to 1150 and 1200 °C, the grain size grew from 30.3 to 40.2 and 58.8 μm, respectively. Complete recrystallization can occur at above 1150 °C, with the grain size increasing from 22.8 to 29.4, 40.2 and 43.3 μm with the extension of the annealing time from 10 to 30, 60 and 120 min. The {110}<001> texture generated by cold deformation was completely replaced by the {110}<112> texture when annealed at 1150 °C for 60 min, which means that the alloy was completely recrystallized at this time.
- (2).
- The value of the apparent activation energy Q1 is 701 kJ/mol, suggesting that the recrystallization of the studied alloy requires a large driving force and high recrystallization temperature. It is believed that the recrystallization mechanism of the studied alloy shall be different from that of the superalloy, since the recrystallization of the studied alloys is relatively slow.
- (3).
- The early appearance of sub-grains and identically oriented twins revealed the difference in the recrystallization mechanism of the alloy. The twin mechanism is considered as the dominant recrystallization mechanism of the studied alloy according to the evolution of microstructures and texture distributions, although the formation and development of sub-grains appear in the early stage of recrystallization.
Author Contributions
Data curation, K.F. and R.W.; Formal analysis, K.F., X.H. and R.W.; Funding acquisition, X.H.; Investigation, K.F., Y.F., Z.L. and X.H.; Methodology, X.H., Y.F. and Z.L.; Software, W.X., R.W. and Y.F.; Supervision, W.X. and R.W.; Writing—original draft, K.F.; Writing—review and editing, X.H. All authors have read and agreed to the published version of the manuscript.
Funding
This work was funded by Youth Foundation of National Natural Science Foundation China (grant numbers 52001020) and Fundamental Research Funds for the Central Universities (FRF-IDRY-19-012).
Institutional Review Board Statement
Not applicable.
Informed Consent Statement
Not applicable.
Data Availability Statement
Data is contained within the article.
Conflicts of Interest
The authors declare that that they have no known competing financial interest of personal relationships that could have appeared to influence the work reported in this paper.
References
- Hu, K.; Li, X.Q.; Ai, X. Fabrication, characterization, and mechanical properties of 93W-4.9Ni-2.1Fe/95W-2.8Ni-1.2Fe-1Al2O3 heavy alloy composites. Mater. Sci. Eng. A 2015, 636, 452–458. [Google Scholar] [CrossRef]
- Xu, Z.; Huang, F. Thermomechanical behavior and constitutive modeling of tungsten-based composite over wide temperature and strain rate range. Int. J. Plast. 2013, 40, 163–184. [Google Scholar] [CrossRef]
- German, R.M.; Bourguignon, L.L.; Rabin, B.H. Critical developments in tungsten heavy alloys. Powder Metall. 1992, 5, 3–13. [Google Scholar]
- Li, Y.Y.; Hu, K.; Li, X.; Ai, X.; Qu, S.G. Fine-grained 93W–5.6Ni–1.4Fe heavy alloys with enhanced performance prepared by spark plasma sintering. Mater. Sci. Eng. A 2013, 573, 245–252. [Google Scholar] [CrossRef]
- Xiang, D.P.; Ding, L.; Li, Y.Y.; Chen, X.Y.; Zhang, T.M. Fabricating fine-grained tungsten heavy alloy by spark plasma sintering of low-energy ball-milled W–2Mo–7Ni–3Fe powders. Mater. Sci. Eng. A 2013, 578, 18–23. [Google Scholar] [CrossRef]
- Rittel, D.; Levin, R.; Dorogoy, A. On the isotropy of the dynamic mechanical and failure properties of swaged tungsten heavy alloys. Metall. Mater. Trans. A 2004, 35, 3787. [Google Scholar] [CrossRef]
- Liu, J.X.; Li, S.K.; Fan, A.L.; Sun, H.C. Effect of fibrous orientation on dynamic mechanical properties and susceptibility to adiabatic shear band of tungsten heavy alloy fabricated through hot-hydrostatic extrusion. Mater. Sci. Eng. A 2008, 487, 235–242. [Google Scholar] [CrossRef]
- Liu, J.X.; Li, S.K.; Zhou, X.Q.; Zhang, Z.H.; Zheng, H.Y.; Wang, Y.C. Adiabatic shear banding in a tungsten heavy alloy processed by hot-hydrostatic extrusion and hot torsion. Scr. Mater. 2008, 59, 1271–1274. [Google Scholar] [CrossRef]
- Hsu, C.; Lin, S. Coalescence of tungsten grains around molybdenum grains in the presence of a liquid phase. Scr. Mater. 2005, 46, 869–873. [Google Scholar] [CrossRef]
- Gu, D.D.; Li, Y.L.; Wang, H.Q.; Jia, Q.B.; Zhang, G.Q. Microstructural development and its mechanism of mechanical alloyed nanocrystalline W–10Ni alloy reinforced with Y2O3 nanoparticles. Int. J. Refract. Met. Hard Mater. 2014, 44, 113–122. [Google Scholar] [CrossRef]
- German, R.M.; Bourguignon, L.L.; Rabin, B.H. Microstructure Limitations of High Tungsten Content Heavy Alloys. JOM 1985, 37, 36–39. [Google Scholar] [CrossRef]
- Li, Y.; Liu, G.Q.; Hu, X.B.; Wu, L.H.; Tan, C.W.; Vinayak, P.; Dravid Liu, S.Z. A novel medium heavy alloy (MHA) with excellent static/dynamic properties and impact toughness. Scr. Mater. 2018, 162, 311–315. [Google Scholar]
- Wang, D.l.; Li, J.B.; Jin, T. Recrystallization of Ni base superalloy DZ4. Acta Metall. Sin. 2006, 2, 167–171. [Google Scholar]
- Hu, B.F.; Chen, H.M. Static recrystallization mechanism of FGH95 superalloy. Chin. J. Nonferrous Met. 2004, 6, 901–906. [Google Scholar]
- Yang, J.; Luo, J.; Li, X.Y.; Li, M.Q. Evolution mechanisms of recrystallized grains and twins during isothermal compression and subsequent solution treatment of GH4586 superalloy. J. Alloys Compd. 2021, 850, 1–12. [Google Scholar] [CrossRef]
- Guan, D.K.; Rainforth, W.M.; Ma, L.; Wynne, B.; Gao, J.H. Twin recrystallization mechanisms and exceptional contribution to texture evolution during annealing in a magnesium alloy. Acta Mater. 2017, 126, 132–144. [Google Scholar] [CrossRef]
- Basu; Al-Samman, T. Twin recrystallization mechanisms in magnesium-rare earth alloys. Acta Mater. 2015, 96, 111–132. [Google Scholar] [CrossRef]
- Suh, B.-C.; Shim, M.-S.; Shin, K.S.; Kim, N.J. Current issues in magnesium sheet alloys: Where do we go from here? Scr. Mater. 2014, 84–85, 1–6. [Google Scholar] [CrossRef]
- Hiesch, J.; Al-Samma, T. Superior light metals by texture engineering: Optimized aluminum and magnesium alloys for automotive applications. Acta Mater. 2013, 61, 818–843. [Google Scholar]
- Humphreys, F.J.; Hatherly, M. Recrystallization and Related Annealing Phenomena; Elsevier: Amsterdam, The Netherlands, 2004. [Google Scholar]
- Li, X.; Yang, P.; Wang, L.N.; Meng, L.; Cui, F. Orientational analysis of static recrystallization at compression twins in a magnesium alloy AZ31. Mater. Sci. Eng. A. 2009, 517, 160–169. [Google Scholar] [CrossRef]
- Al-Samman, T.; Molodov, K.D.; Molodov, D.A.; Gottstein, G.; Suwas, S. Softening and dynamic recrystallization in magnesium single crystals during c-axis compression. Acta Mater. 2012, 60, 537–545. [Google Scholar] [CrossRef]
- Jia, D.; Sun, W.R.; Xu, D.S.; Yu, L.X.; Xin, X.; Zhang, W.H.; Qi, F. Abnormal dynamic recrystallization behavior of a nickel-based superalloy during hot deformation. J. Alloys Compd. 2019, 787, 196–205. [Google Scholar] [CrossRef]
- Prithiv, T.S.; Bhuyan, P.; Pradhan, S.K.; Sarma, V.S.; Mandal, S. A critical evaluation on efficacy of recrystallization vs. strain induced boundary migration in achieving grain boundary engineered microstructure in a Ni-base superalloy. Acta Mater. 2018, 146, 187–201. [Google Scholar] [CrossRef]
- Field, D.P.; Bradford, L.T.; Nowell, M.M.; Lillo, T.M. The role of annealing twins during recrystallization of Cu. Acta Mater. 2007, 55, 4233–4241. [Google Scholar] [CrossRef]
- Jin, Y.; Lin, B.; Bernacki, M.; Rohrer, G.S.; Rollett, A.D.; Bozzolo, N. Annealing twin development during recrystallization and grain growth in pure nickel. Mater. Sci. Eng. A. 2014, 597, 295–303. [Google Scholar] [CrossRef] [Green Version]
- Burke, J.E. The formation of annealing twins. JOM 1950, 188, 1324–1328. [Google Scholar] [CrossRef]
- Jin, Y.; Lin, B.; Rollett, A.D.; Rohrer, G.S.; Bernacki, M.; Bozzolo, N. Thermo-mechanical factors influencing annealing twin development in nickel during recrystallization. J. Mater. Sci. 2015, 50, 5191–5203. [Google Scholar] [CrossRef]
- Wang, W.; Lartigue-Korinek, S.; Brisset, F.; Helbert, A.L.; Bourgon, J.; Baudin, T. Formation of annealing twins during primary recrystallization of two low stacking fault energy Ni-based alloys. J. Mater. Sci. 2015, 50, 2167–2177. [Google Scholar] [CrossRef]
- Chen, X.M.; Lin, Y.C.; Wu, F. EBSD study of grain growth behavior and annealing twin evolution after full recrystallization in a nickel-basd superalloy. J. Alloys Compd. 2017, 724, 198–207. [Google Scholar] [CrossRef]
- Roucoules, C.; Hodgson, P.D.; Yue, S.; Jones, J.J. Softening and microstructure change following the dynamic recrystallization of Austenite. Metall. Mater. Trans. A 1994, 25, 389–400. [Google Scholar] [CrossRef]
- Jang, Y.S.; Ko, D.C.; Kim, B.M. Application of the finite element method to predict microstructure evolution in the hot forging of steel. J. Mater. Process. Technol. 2000, 101, 85–94. [Google Scholar] [CrossRef]
- Gao, Y.B.; Ding, Y.T.; Chen, J.J.; Meng, B.; Ma, Y.J.; Xu, J.Y. Behavior of cold work hardening and annealing softening and microstructure characteristics of GH3625 superalloy. Chin. J. Nonferrous Metals. 2019, 29, 44. [Google Scholar]
- Randle, V.; Rios, P.R.; Hu, Y. Grain growth and twinning in nickel. Scr. Mater. 2008, 58, 130–133. [Google Scholar] [CrossRef]
- Grube, W.L.; Rouze, S.R. The origin, growth and annihilation of annealing twins in austenite. Can. Metall. Q. 1963, 2, 31–52. [Google Scholar] [CrossRef]
- Sarma, V.S.; Eickemeyer, J.; Schultz, L.; Holzapfel. Recrystallisation texture and magnetisation behaviour of some FCC Ni–W alloys. Scr. Mater. 2004, 50, 7. [Google Scholar]
- Leffers, T.; Ray, R.K. The brass-type texture and its deviation from the copper-type texture. Prog. Mater. Sci. 2008, 54, 351–396. [Google Scholar] [CrossRef]
- Chen, J.J.; Ding, Y.T.; Gao, Y.B.; Ma, Y.J.; Wang, X.M.; Yan, K. Static Recrystallization Behavior of Deformation Induced Inconel 625 Superalloy Pipe. Chin. J. Nonferrous Met. 2021, 50, 14–22. [Google Scholar]
- Wang, J.; Liu, Y.; Liu, B.; Wang, Y.; Cao, Y.; Li, T.; Zhou, R. Flow behavior and microstructure of powder metallurgical CrFeCoNiMo0.2 high entropy alloy during high temperature deformation. Mater. Sci. Eng. A Struct. Mater. Prop. Microstruct. Process. 2017, 689, 233–242. [Google Scholar] [CrossRef]
- Chen, X.P.; Li, L.F.; Sun, H.F.; Wang, L.X.; Liu, Q. Studies on the evolution of annealing twins during recrystallization and grain growth in highly rolled pure nickel. Mater. Sci. Eng. A 2015, 622, 108–113. [Google Scholar] [CrossRef]
- Mahajan, S. Critique of mechanisms of formation of deformation, annealing and growth twins: Face-centered cubic metals and alloys. Scr. Mater. 2013, 68, 95–99. [Google Scholar] [CrossRef]
Figure 1.
The secondary electron image of sample in (a) rolled state, and (b) is a large version of the red box in (a).
Figure 1.
The secondary electron image of sample in (a) rolled state, and (b) is a large version of the red box in (a).

Figure 2.
The microstructure of the Ni-36.6W-15Co sample after annealing at (a) 1100 °C, (b) 1150 °C and (c) 1200 °C for 60 min.
Figure 2.
The microstructure of the Ni-36.6W-15Co sample after annealing at (a) 1100 °C, (b) 1150 °C and (c) 1200 °C for 60 min.

Figure 3.
The microstructure of the Ni-36.6W-15Co sample after annealing for (a) 10 min, (b) 30 min, (c) 60 min and (d) 120 min at 1150 °C.
Figure 3.
The microstructure of the Ni-36.6W-15Co sample after annealing for (a) 10 min, (b) 30 min, (c) 60 min and (d) 120 min at 1150 °C.

Figure 4.
Relationship between annealing temperature and average grain size.

Figure 5.
Grain and grain boundary network of Ni-36.6W-15Co after annealing for (a) 10 min, (b) 30 min, (c) 60 min and (d) 120 min at 1150 °C.
Figure 5.
Grain and grain boundary network of Ni-36.6W-15Co after annealing for (a) 10 min, (b) 30 min, (c) 60 min and (d) 120 min at 1150 °C.

Figure 6.
Grain size distribution maps Ni-36.6W-15Co after annealing for (a) 10 min, (b) 30 min, (c) 60 min, (d) 120 min at 1150 °C and (e) line chart of average grain size.
Figure 6.
Grain size distribution maps Ni-36.6W-15Co after annealing for (a) 10 min, (b) 30 min, (c) 60 min, (d) 120 min at 1150 °C and (e) line chart of average grain size.

Figure 7.
Relationship between annealing time and hardness at 1150 °C.

Figure 8.
Orientation imaging maps of Ni-36.6W-15Co after annealing for (a) 10 min, (b) 30 min, (c) 60 min and (d) 120 min at 1150 °C.
Figure 8.
Orientation imaging maps of Ni-36.6W-15Co after annealing for (a) 10 min, (b) 30 min, (c) 60 min and (d) 120 min at 1150 °C.


Figure 9.
Grain boundary maps of Ni-36.6W-15Co after annealing for (a) 10 min, (b) 30 min, (c) 60 min and (d) 120 min at 1150 °C.
Figure 9.
Grain boundary maps of Ni-36.6W-15Co after annealing for (a) 10 min, (b) 30 min, (c) 60 min and (d) 120 min at 1150 °C.

Figure 10.
Variations of density of low-CSL boundary with annealing time.

Figure 11.
The pole figure (PF) of Ni-36.6W-15Co in (a) rolled, and after annealing for (b) 10 min, (c) 30 min, (d) 60 min and (e) 120 min at 1150 °C.
Figure 11.
The pole figure (PF) of Ni-36.6W-15Co in (a) rolled, and after annealing for (b) 10 min, (c) 30 min, (d) 60 min and (e) 120 min at 1150 °C.

Figure 12.
The orientation distribution function (ODF) of Ni-36.6W-15Co in (a) rolled, and after annealing for (b) 10 min, (c) 30 min, (d) 60 min and (e) 120 min at 1150 °C.
Figure 12.
The orientation distribution function (ODF) of Ni-36.6W-15Co in (a) rolled, and after annealing for (b) 10 min, (c) 30 min, (d) 60 min and (e) 120 min at 1150 °C.

Figure 13.
The TEM bright field photograph of Ni-36.6W-15Co in (a) rolled, and after annealing for (b) 10 min, (c) 30 min and (d) 120 min at 1150 °C.
Figure 13.
The TEM bright field photograph of Ni-36.6W-15Co in (a) rolled, and after annealing for (b) 10 min, (c) 30 min and (d) 120 min at 1150 °C.

Figure 14.
Comparisons of the experimental and predicted average grain sizes.

Figure 15.
The TEM bright field photograph of Ni-36.6W-15Co after annealing at 1150 °C for 10 min, (a) selected area diffraction patters (SADP) of the twin and (b) is HRTEM image of the stacking fault.
Figure 15.
The TEM bright field photograph of Ni-36.6W-15Co after annealing at 1150 °C for 10 min, (a) selected area diffraction patters (SADP) of the twin and (b) is HRTEM image of the stacking fault.

Publisher’s Note: MDPI stays neutral with regard to jurisdictional claims in published maps and institutional affiliations. |
© 2022 by the authors. Licensee MDPI, Basel, Switzerland. This article is an open access article distributed under the terms and conditions of the Creative Commons Attribution (CC BY) license (https://creativecommons.org/licenses/by/4.0/).
Share and Cite
MDPI and ACS Style
Feng, K.; Huang, X.; Wang, R.; Xue, W.; Fu, Y.; Li, Z. The Research on Recrystallization Behaviors and Mechanism of a Medium-Density Ni-Based Alloy. Metals 2022, 12, 137. https://doi.org/10.3390/met12010137
AMA Style
Feng K, Huang X, Wang R, Xue W, Fu Y, Li Z. The Research on Recrystallization Behaviors and Mechanism of a Medium-Density Ni-Based Alloy. Metals. 2022; 12(1):137. https://doi.org/10.3390/met12010137
Chicago/Turabian StyleFeng, Kai, Xiaxu Huang, Rui Wang, Wenli Xue, Yilei Fu, and Zhaoxin Li. 2022. "The Research on Recrystallization Behaviors and Mechanism of a Medium-Density Ni-Based Alloy" Metals 12, no. 1: 137. https://doi.org/10.3390/met12010137
Note that from the first issue of 2016, this journal uses article numbers instead of page numbers. See further details here.