Article

Kinetic and Metallography Study of the Oxidation at 1250 °C of {Co+Ni}-Based Superalloys Containing Ti to Form MC Carbides

by
Patrice Berthod
1,*,
Synthia Annick Ozouaki Wora
2,
Lionel Aranda
1,
Ghouti Medjahdi
3 and
Erwan Etienne
4
1
CNRS, IJL, Université de Lorraine, 54000 Nancy, France
2
Faculté des Sciences et Technologies, Université de Lorraine, 54500 Vandoeuvre-lès-Nancy, France
3
CC X-Gamma, IJL, Université de Lorraine, 54000 Nancy, France
4
CC 3M, IJL, Université de Lorraine, 54000 Nancy, France
*
Author to whom correspondence should be addressed.
Metals 2022, 12(1), 10; https://doi.org/10.3390/met12010010
Submission received: 13 November 2021 / Revised: 15 December 2021 / Accepted: 17 December 2021 / Published: 22 December 2021
(This article belongs to the Special Issue Hot Oxidation and Corrosion of High Performance Metallic Alloys)

Abstract

:
Six conventionally cast chromium-rich titanium-containing alloys based on cobalt and nickel with various Co/Ni ratios were considered. They were tested in oxidation in air at 1250 °C for 70 h in a thermo-balance. The mass gain curves were exploited to specify different types of kinetic constants as well as several parameters characterizing the oxide spallation occurring during cooling. The obtained results show that, the higher the Ni content, the slower the mass gain and the better the quality of the protective external chromia scale. Secondly, no dependence of the oxide spallation characteristics on the Co content was clearly noted. Globally, the isothermal oxidation behavior becomes better when Ni is more and more present at the expense of Co. Titanium seems to be playing a particular role in the process of oxidation. It notably leads to the presence of an external thin TiO2 continuous scale beyond the chromia scale. The thermogravimetry records were numerically treated to determine the parabolic constant and the chromia volatilization constant. The values of these constants evidenced a double tendency: chromia growth acceleration and chromia volatilization slow-down. These trends are to be confirmed and further investigated.

1. Introduction

Many applications—industrial or transportation engines, for instance—involve, in service, local temperatures that can reach very high levels. At the same time, the concerned components may be constantly or cyclically subjected to significant constrains, and materials may suffer severe deformation, cracking and rupture [1,2,3]. Among the superalloys usually considered for such applications, there are the nickel-based {gamma prime}-reinforced single-crystalline superalloys. These ones are still the best performing metallic materials for service at a temperature around 1000 °C under severe stress conditions. However, they cannot be used at 1100 °C and even a little above. This is due to the disappearance of the γ’ precipitates that are at the origin of their superior mechanical resistance [3,4]. Refractory alloys based on metals with high melting points, such as niobium, molybdenum or tantalum, still need to be improved before industrialization. Furthermore, their densities will inevitably weigh down the aircrafts or increase the centrifugal stresses affecting the pieces subjected to high-speed rotation (e.g., turbine blades). (Refractory) High Entropy Alloys—(RHEA) HEA—are rather novel, and they need also to mature as do other emerging alloys, such as γ’-strengthened CoAlW alloys. In addition, generally, ceramics cannot be chosen for mobile pieces because of their lack of ductility and toughness at all temperatures.
Fortunately, some classical foundry alloys based on cobalt with the presence of nickel appear as provisional alternative solutions for the needs of metallic alloys able to honorably resist the applied mechanical solicitations and the chemical aggressivity of the working environment. This is due to stable carbides and their high levels of chromium contents [5,6], respectively. Monocarbides involving high molar mass metals are certainly among the most interesting carbides in terms of their strengthening effect and morphology stability at a high temperature. This is notably the case of the tantalum monocarbides (TaC) that have been exploited in cobalt-based superalloys for a long time (e.g., [7,8,9]). Hafnium monocarbides formed in superalloys based on various elements, including Co, Ni… [10,11,12], are other examples.
Titanium is also a metal that is able to form MC carbides. A particular interest of this element is its atomic mass, which is much lower than the tantalum and hafnium ones. Using it instead of Ta or Hf as an MC-former element should lead to a slight lowering in the volume mass of the alloys. Script-like-shaped eutectic TiC carbides were successfully obtained in cobalt-based alloys [13,14]. This morphology was earlier identified to be particularly favorable to high creep resistance at elevated temperatures in the cases of TaC [9] and HfC [10,12]. Concerning specifically TiC, one may mention that the polycristalline cast chromium-rich alloys based on nickel and cobalt and containing TiC carbides were recently tested by us in creep. This was done at 1200 °C during about 100 h using a three-point flexural bending test machine for a resulting applied constant stress of 7.5 MPa. The rates of movement of the central point measured during the second stage of creep were comprised between 1 and 3 µm per hour. These deformation rates are interestingly low for alloys belonging to this category for such a high-temperature test.
Unfortunately, titanium is also a metal that is very easy to oxidize, as well as prompt to form nitrides. When Ti is present in alloys with content able to lead to TiC carbides in quantity high enough to strengthen them against creep, titanium may influence the global oxidation behavior of the alloys at a high temperature. A first study was recently undertaken concerning oxidation at 1200 °C for 170 h in laboratory air for a series of chromium-rich alloys based on nickel and cobalt and containing titanium and carbon in equal molar contents [15]. This showed that, despite what was possible to fear with the presence of titanium, the resistance of the alloys was globally good, even for a high level of the test temperature. Chromia was the main oxide present as a continuous external oxide scale. It was also observed that titanium formed oxides internally but also externally. Indeed, besides some dispersed small oxides involving Ti appearing in the subsurface, an outer continuous thin scale of TiO2 formed beyond the thick chromia scale.
The topic of the present work is to complete the knowledge regarding the oxidation behavior at an elevated temperature for the same basis of alloys. This was done by rising the test temperature to a temperature 50 °C higher (thus, now close to the start of melting of several of these alloys) and by using thermogravimetry. The objectives are several. First: are these alloys still resistant against oxidation at 1250 °C? and what are their mass gain kinetics? Does catastrophic oxidation occur for some of the alloys? What are the kinetics of mass loss by chromia volatilization (and, as a corollary: if TiO2 is present again with the same distribution as at 1200 °C, is there really an effect of this outer scale on the volatilization of chromia?)? To answer these questions, new samples of alloys, similar to the ones of the series previously studied at 1200 °C, were prepared and tested in a thermo-balance at 1250 °C.

2. Materials and Methods

2.1. Chemical Compositions of the Studied Alloys, Elaboration and As-Cast Characteristics

The six alloys considered in this work having the same chemical compositions as the ones previously studied at 1200 °C were elaborated. They are based either on nickel alone, on cobalt alone or on a mix of both elements. Concerning the other elements, they have the following common characteristics:
-
25 wt.% Cr for promoting a chromia-forming behavior, and thus an oxidation resistance high enough
-
0.4 wt.% C to allow obtaining carbides in a quantity high enough for an efficient mechanical strengthening, but not continuous for preserving good levels of toughness and ductility
-
1.6 wt.% Ti for obtaining a molar fraction in Ti equal to the one in C.
All alloys were obtained by melting pure elements (Alfa Aesar, Haverhill, MS, USA, purity >99.9%) under 300 mbars of pure Argon in a medium frequency induction furnace (CELES, Lautenbach, France). The values of the main operating parameters were: input voltage increased up to 5 kV, frequency of about 100 kHz, 5 min of stage in liquid state before cooling). Compact ingots weighing 40 g were obtained. Each ingot was cut in several parts using a Buehler metallographic saw.
A part of each ingot was embedded in resin, ground and polished to obtain metallographic samples with a mirror-like surface. The microstructures were observed with a Scanning Electron Microscope JEOL JSM 6010LA (JEOL, Tokyo, Japan) in the Back Scattered Electrons mode (BSE, Mumbai, India) for an acceleration voltage equal to 20 kV. The chemical compositions were controlled using the Energy Dispersion Spectrometer attached to the SEM.

2.2. Oxidation Tests and Kinetic Exploitation of the Mass Variation Records

For each alloy, a 3 × 10 × 10 mm3 parallelepiped with ground faces, and smoothed edges and corners, was prepared by cutting followed by surface preparation using 1200-grit SiC papers. This parallelepiped was hanged in the hot zone of the resistive furnace of a TGA92 thermobalance (SETARAM, Lyon, France). It was subjected to heating at +20 °C min−1, followed by a 70 h isothermal stage at 1250 °C and to a cooling at −5 °C min−1. During the whole thermal cycle, the sample was present in a continuous flow (1.5 L h−1) of dry synthetic air (80% N2-20% O2).
The isothermal mass gain curves were plotted versus time to consider their shapes first. In the case of obvious parabolic kinetic suggesting that oxidation may follow Wagner’s law, a specific numerical treatment was applied to specify the parabolic and chromia volatilization constants. The used procedure was described in an earlier work [16]. A first determination was classically done based on Equation (1) by plotting mass gain versus the square root of time. The slope of the corresponding regression straight line was measured, and the value of the parabolic constant Kp (noted Kpa with “a” for “apparent”) was deduced. The second determination, based on Equation (2), was done by plotting the mass gain multiplied by its time-derived value versus the opposite value of mass gain. The equation of the obtained regression straight line allowed determining the real parabolic constant Kpr (“real” because the absence of minimization due to the chromia mass loss) and the chromia volatilization constant Kv. These two equations are:
m   = 2 × Kp a × t
m × dm dt =   Kp r   Kv   × m
where m, the mass gain per surface unit area, is function of time, t is time, Kpa is the apparent parabolic constant, Kpr is the real parabolic constant and Kv is the chromia volatilization constant.

2.3. Post Mortem Part of the Oxidation Characterization

The oxidized alloys were subjected to X-ray diffraction (Bruker D8 Advance diffractometer) to help for the identification of the oxides formed externally or internally (close to the surface). Thereafter, a gold layer was deposited—using a JEOL cathodic pulverizator—for giving electrical conductivity to the oxidized surfaces. These ones were observed with the SEM in Secondary Electrons mode (SE) and characterized by Energy Dispersion Spectrometry (EDS) X-mapping. Finally, the oxidized samples were covered all around with a metallic shell formed by electrolytic deposition of nickel in a Watt’s bath heated at 50 °C (1.6 A/dm2 for 2 h).
Protected by this nickel shell, the oxidized samples were sectioned using the Buehler metallographic saw. The two parts were embedded in a cold resin mixture (ESCIL, Chassieu, France, resin and hardener). The resulting metallographic samples were ground and polished until obtaining cross-sectional mirror-like samples. These ones were observed in the Back Scattered Electrons mode (BSE) under 20 kV): external oxides, internal oxides, subsurface affected by oxidation, deep part of the alloy (not affected by oxidation). EDS spot analyses were performed under 20 kV to identify the natures of the oxides and their chemical compositions, as well as the changes in chemical composition of the alloy in extreme surface and in subsurface. Notably, EDS elemental concentration profiles were acquired from the extremal alloy surface toward the bulk, over about 400 µm with 13 successive spot analyses (distance between two successive points: 35 µm).

3. Results

3.1. The Obtained Alloys

The SEM observations, in BSE mode, of the metallographically prepared samples showed that the microstructures of the alloys are similar to the ones of the samples previously studied in oxidation at 1200 °C [15]: all the initial microstructures are dendritically structured and contain more or less dark particles present in the interdendritic zones (Figure 1). EDS spot analyses were carried out with thin electrons beam (spot size rated to 50 according to the notation of the SEM manufacturer) on the coarsest carbides found in the metallographic samples. The obtained results demonstrated that three types of carbides are present: TiC in all the alloys but especially in the cobalt-richest ones (black script-shaped or black compact particles), Cr23C6 in the Ni-containing Co-based alloys (pale grey compact particles) and Cr7C3 in the Ni-richest alloys (acicular dark grey particles). The EDS full frame analyses carried out for the ×250 magnification demonstrated that the targeted chemical compositions were successfully obtained in the cases of the elements with high molar mass (Table 1 and Table 2). They also corresponded well to the chemical compositions of the samples previously tested at 1200 °C. The carbon content can be considered as being well-respected as well taking into account the surface (or volume) fractions of the obtained population of carbides. Indeed, these fractions are typical of the ones of many 0.4 wt.%C-containing alloys of a similar type studied earlier (the carbon contents of which were verified by spark spectrometry).

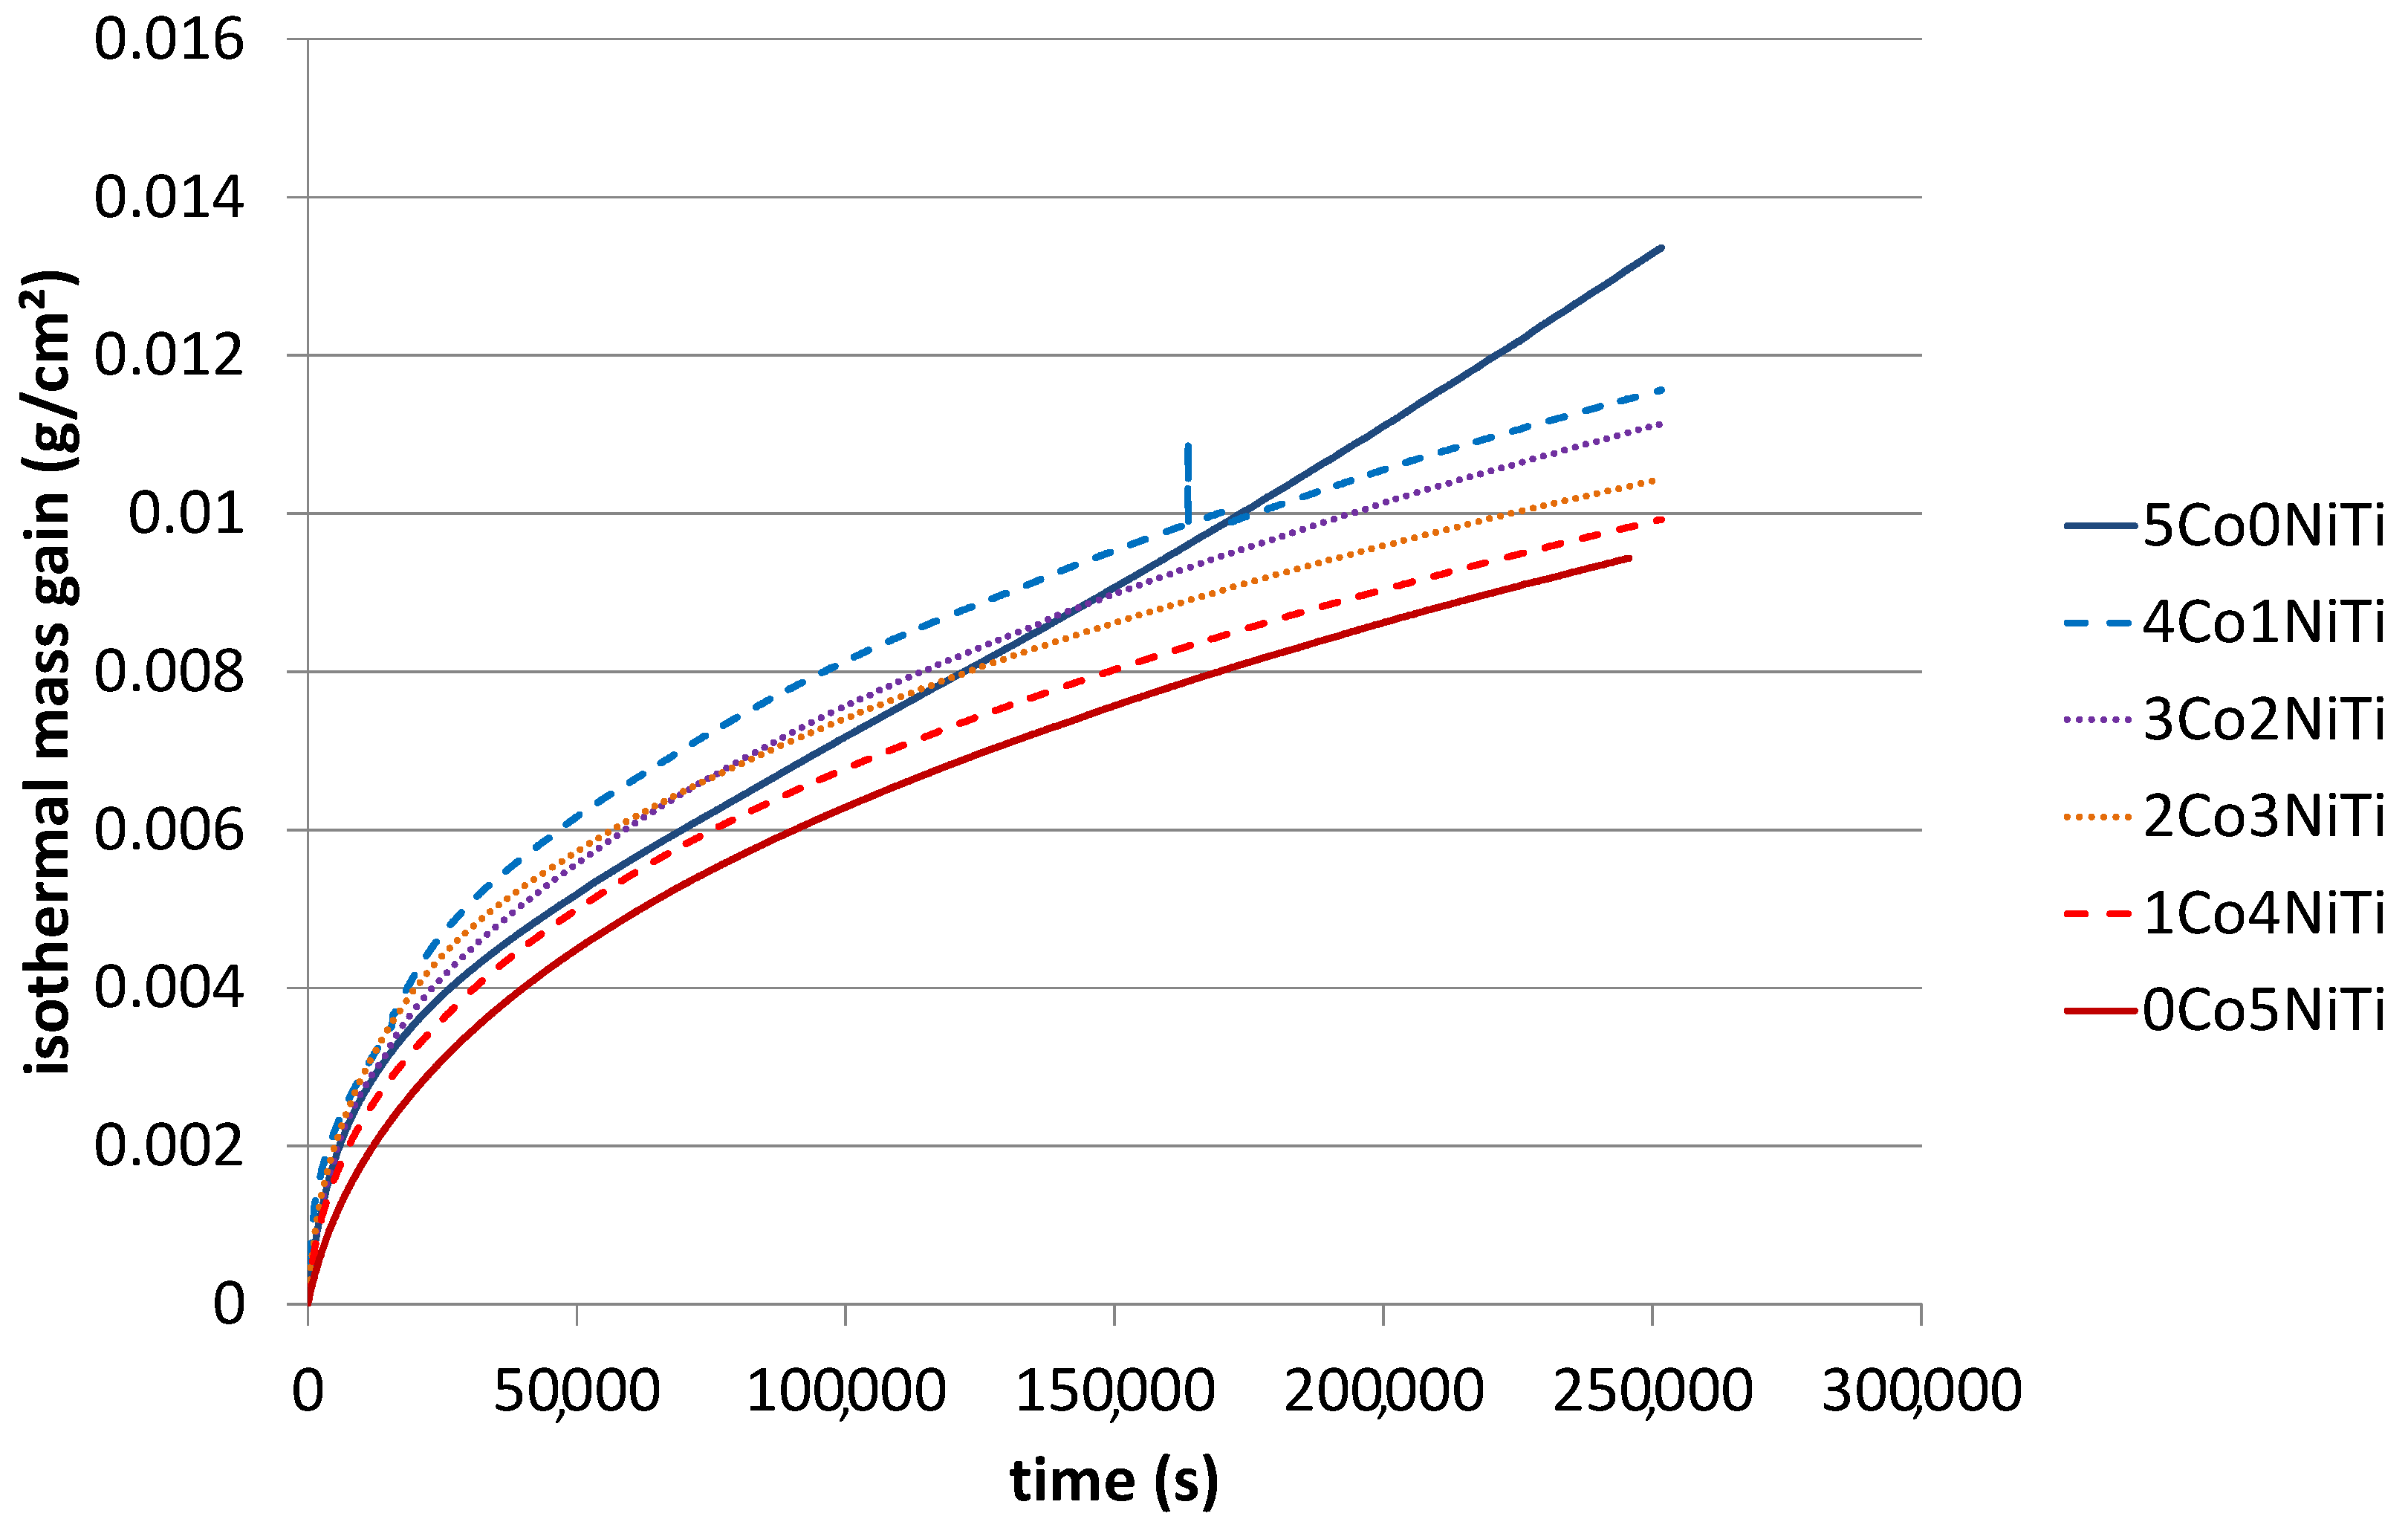
3.2. Mass Gain during Isothermal Oxidation

The mass gains during the isothermal stage at 1250 °C for 70 h are plotted together versus time in Figure 2. All the curves present a general shape that evocates a parabolic kinetic, except the one corresponding to the Co-richest alloy (5Co0NiTi). For the later alloy, the mass gain kinetic became linear about 20 h after the beginning of the isothermal stage. If one excludes the 5Co0NiTi curve, all the other curves are regularly ordered, from the upper ones to the lower ones, when more and more nickel is present (and less and less cobalt is present). The same observation can be done for all six curves by considering the final mass gains after 70 h of isothermal oxidation.
Different characteristics concerning the isothermal kinetic were noted on the two types of curves. The analysis of the isothermal part of the mass gain files was carried out according to a procedure presented elsewhere [16]. This led to the values of the different kinetic constants displayed in Table 3.
A linear constant Kl was specified at the beginning of the isothermal stage by determining the slope of the straight line tangential to the {mass gain versus time}-curves plotted in Figure 2). When more and more nickel is present at the expense of cobalt—at least from 4Co1NiTi to 0Co5NiTi—one can see that this linear constant Kl decreases from about 120 to 30 × 10−8 g cm−2 s−1. At the same time, the value of the apparent parabolic constant classically determined, Kpa, also decreases, from about 370 × 10−12 g2 cm−4 s−1 (5Co0NiTi) to 200 × 10−12 g2 cm−4 s−1 (10−12 g2 cm−4 s−1 (0Co5NiTi). The real parabolic constant, Kpr, also decreases from the 5Co0NiTi alloy to the 0Co5NiTi one: from about 730 × 10−12 g2 cm−4 s−1 to 290 × 10−12 g2 cm−4 s−1. To finish, from 5Co0NiTi to 0Co5NiTi again, the volatilization constant, which represents the mass loss due to the volatilization of chromia (Cr2O3) re-oxidized to form a volatile oxide (CrO3), also decreases. However, this decrease is less regular than observed for the parabolic constant of the two types, apparent or real.

3.3. Characterization of the Oxidized States

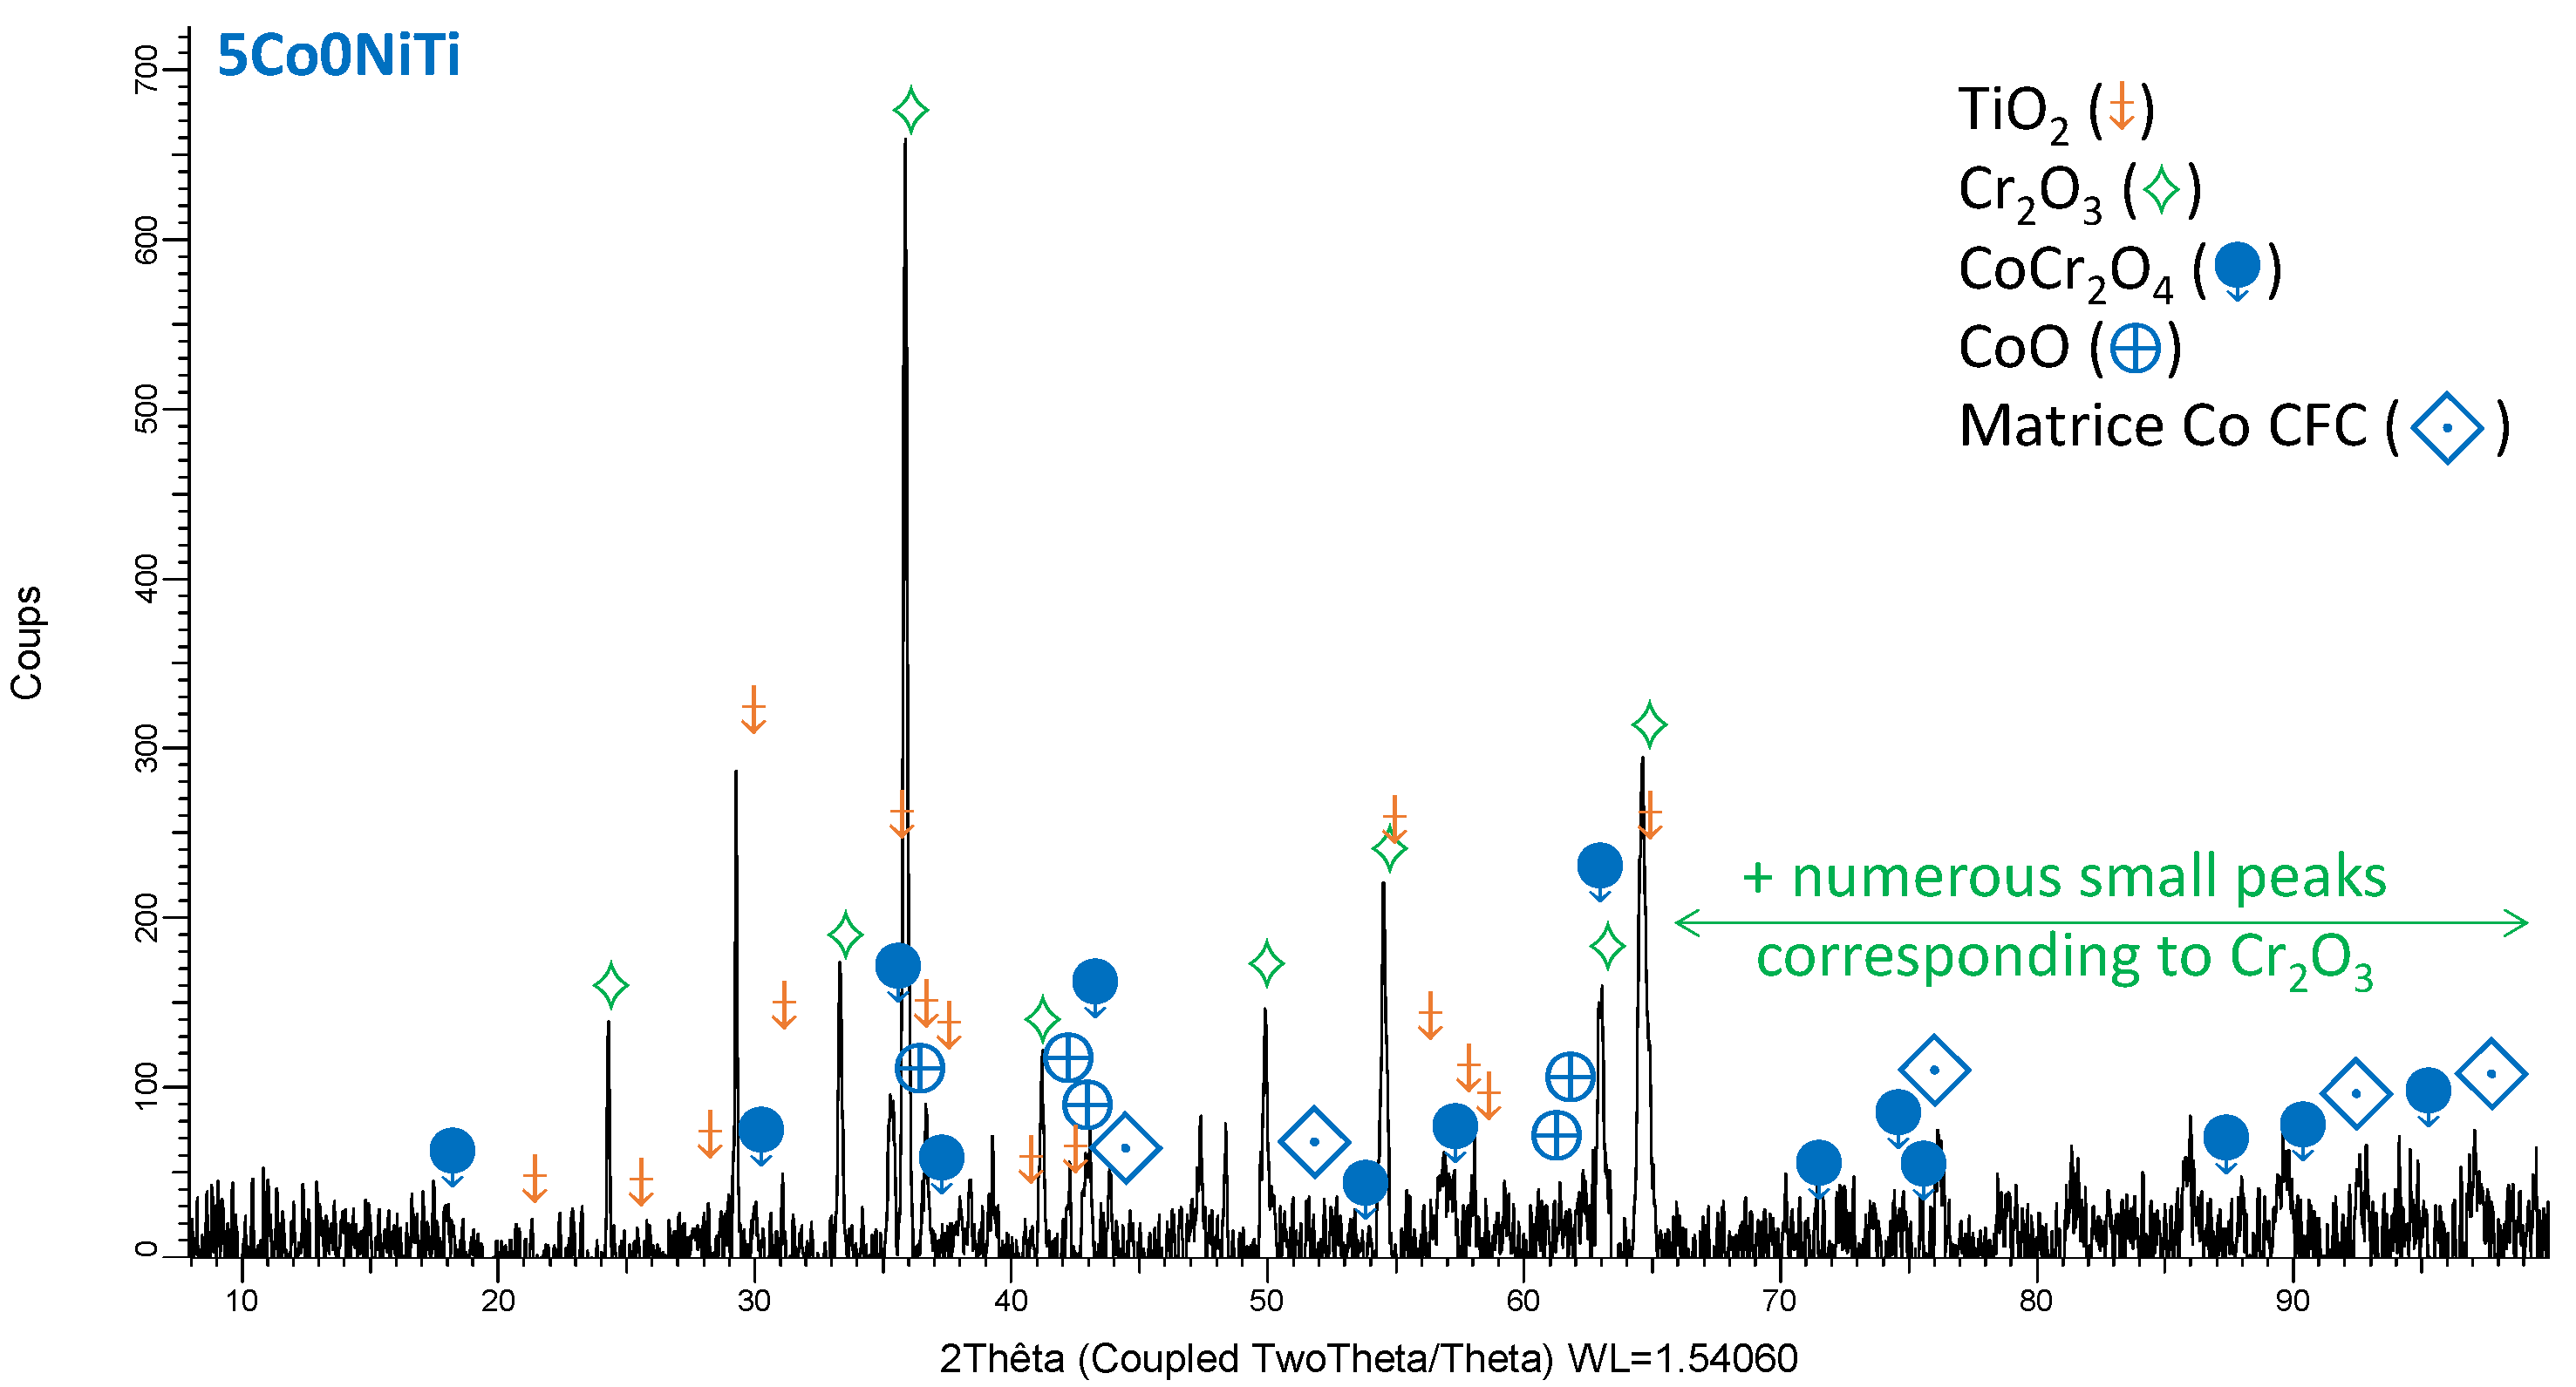
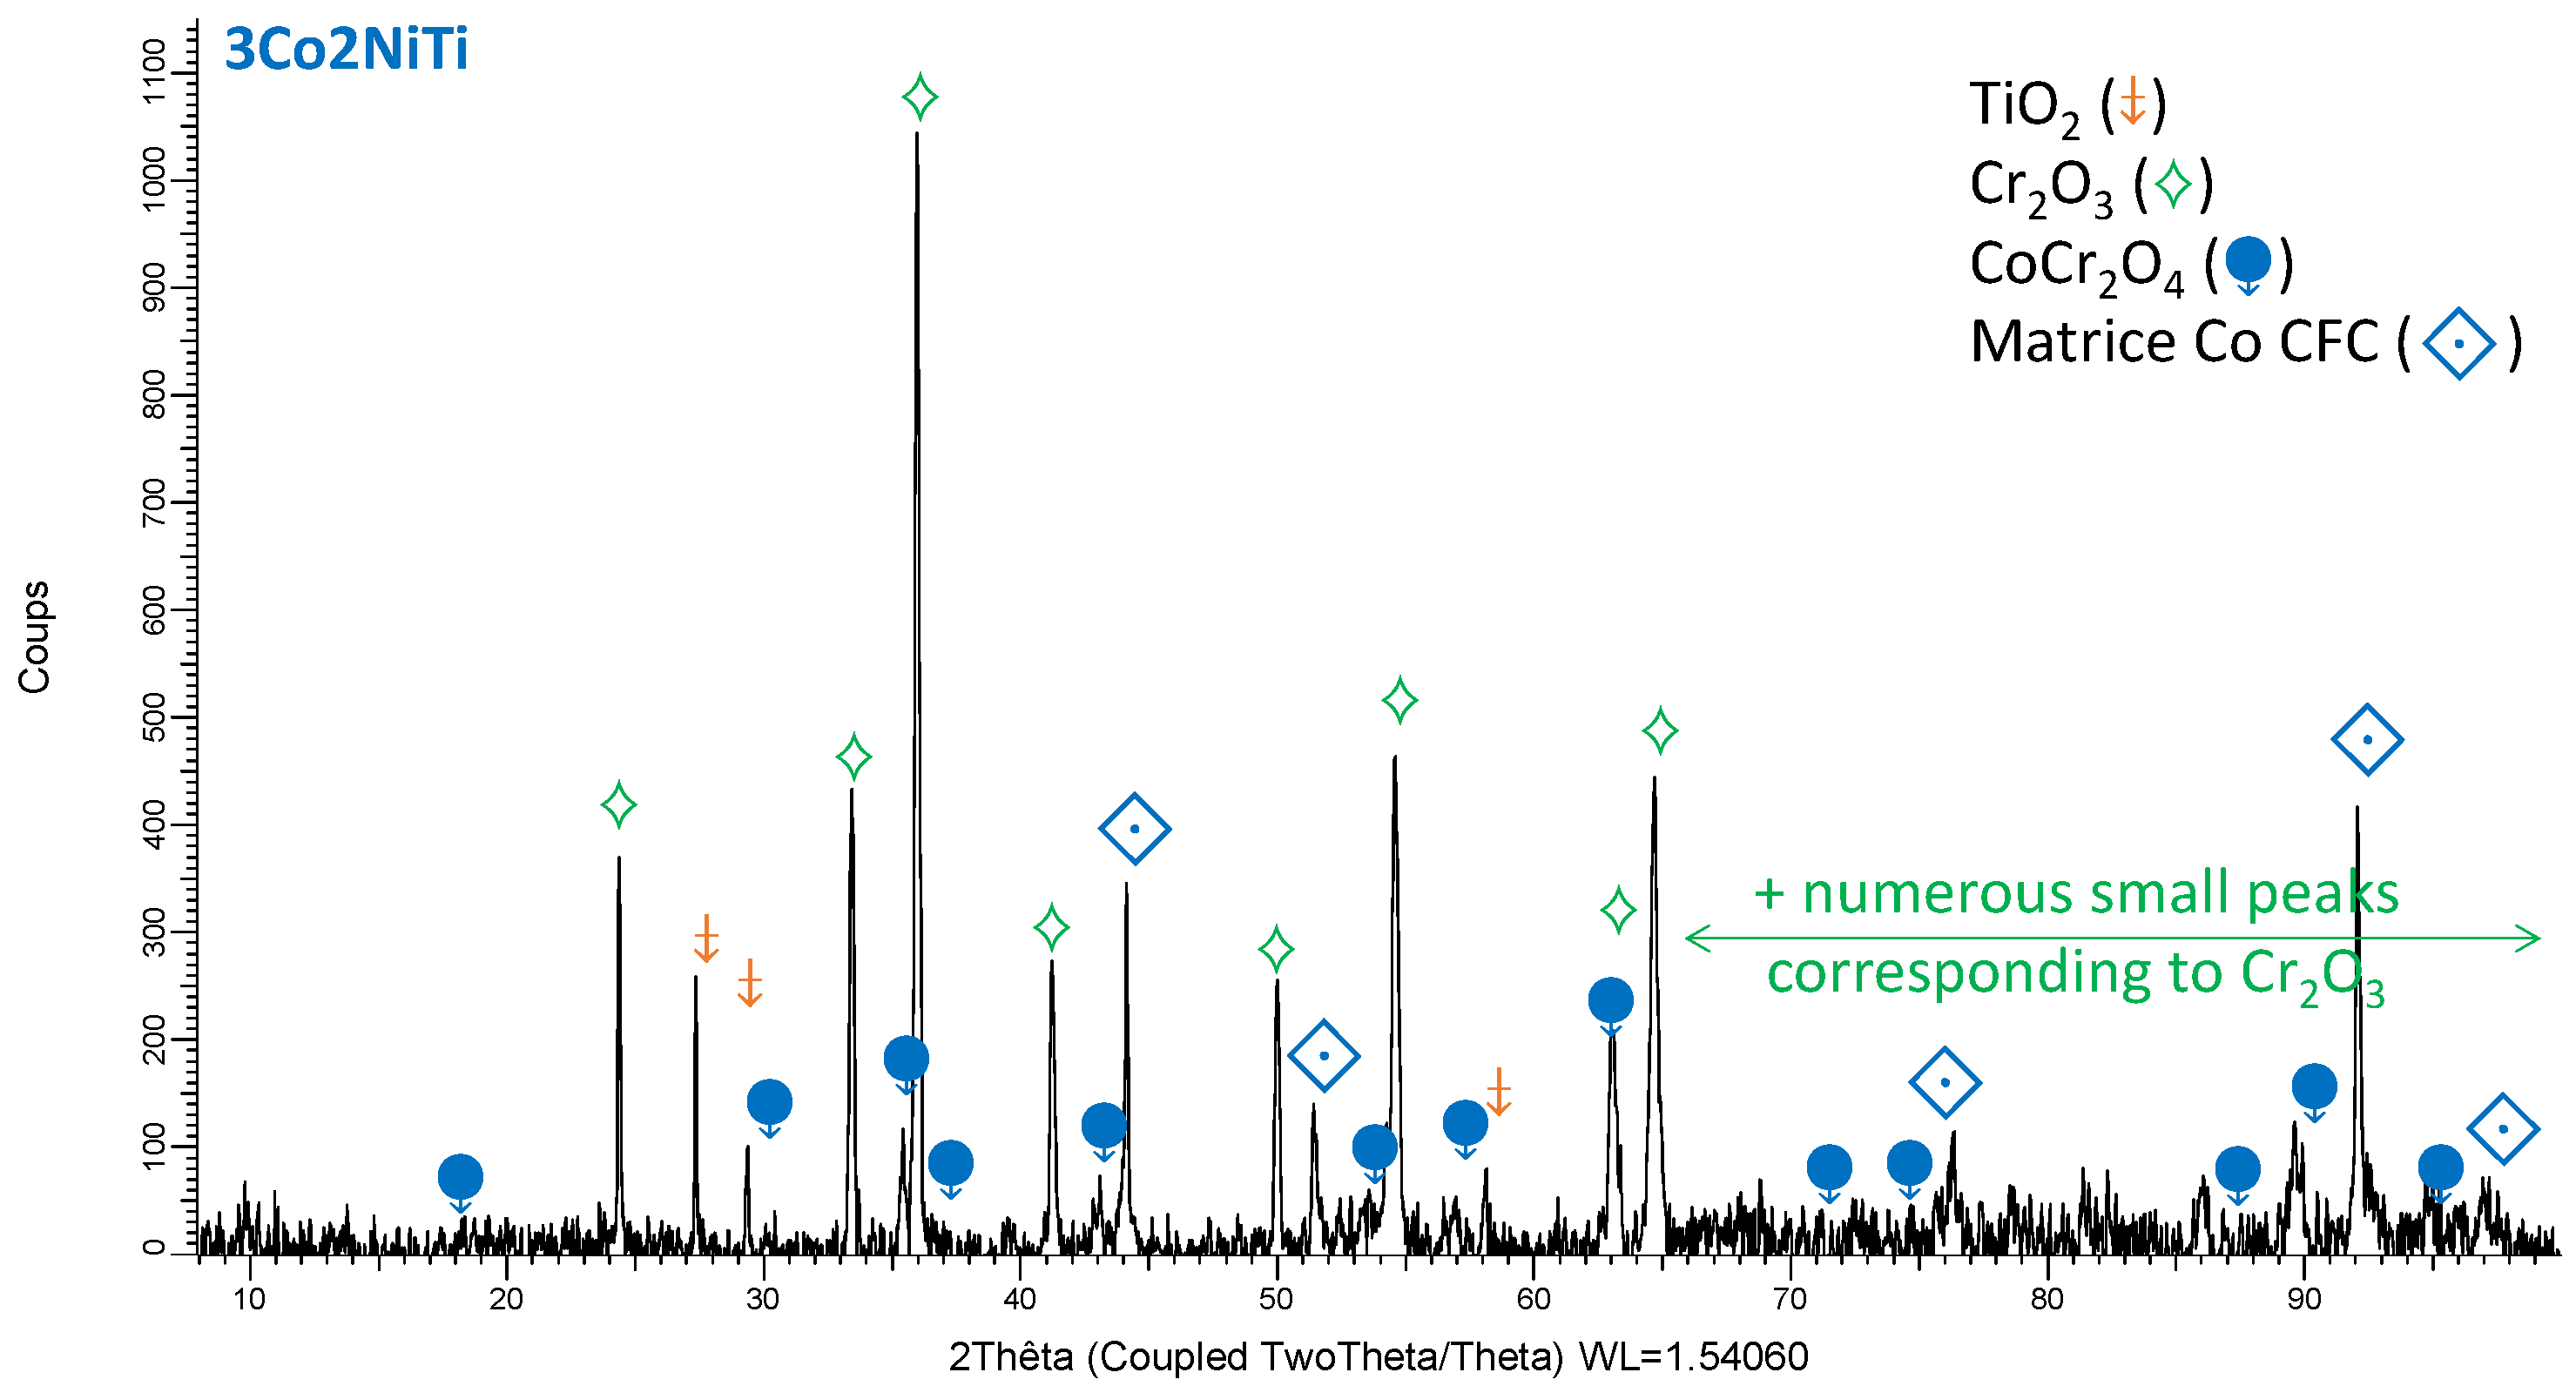
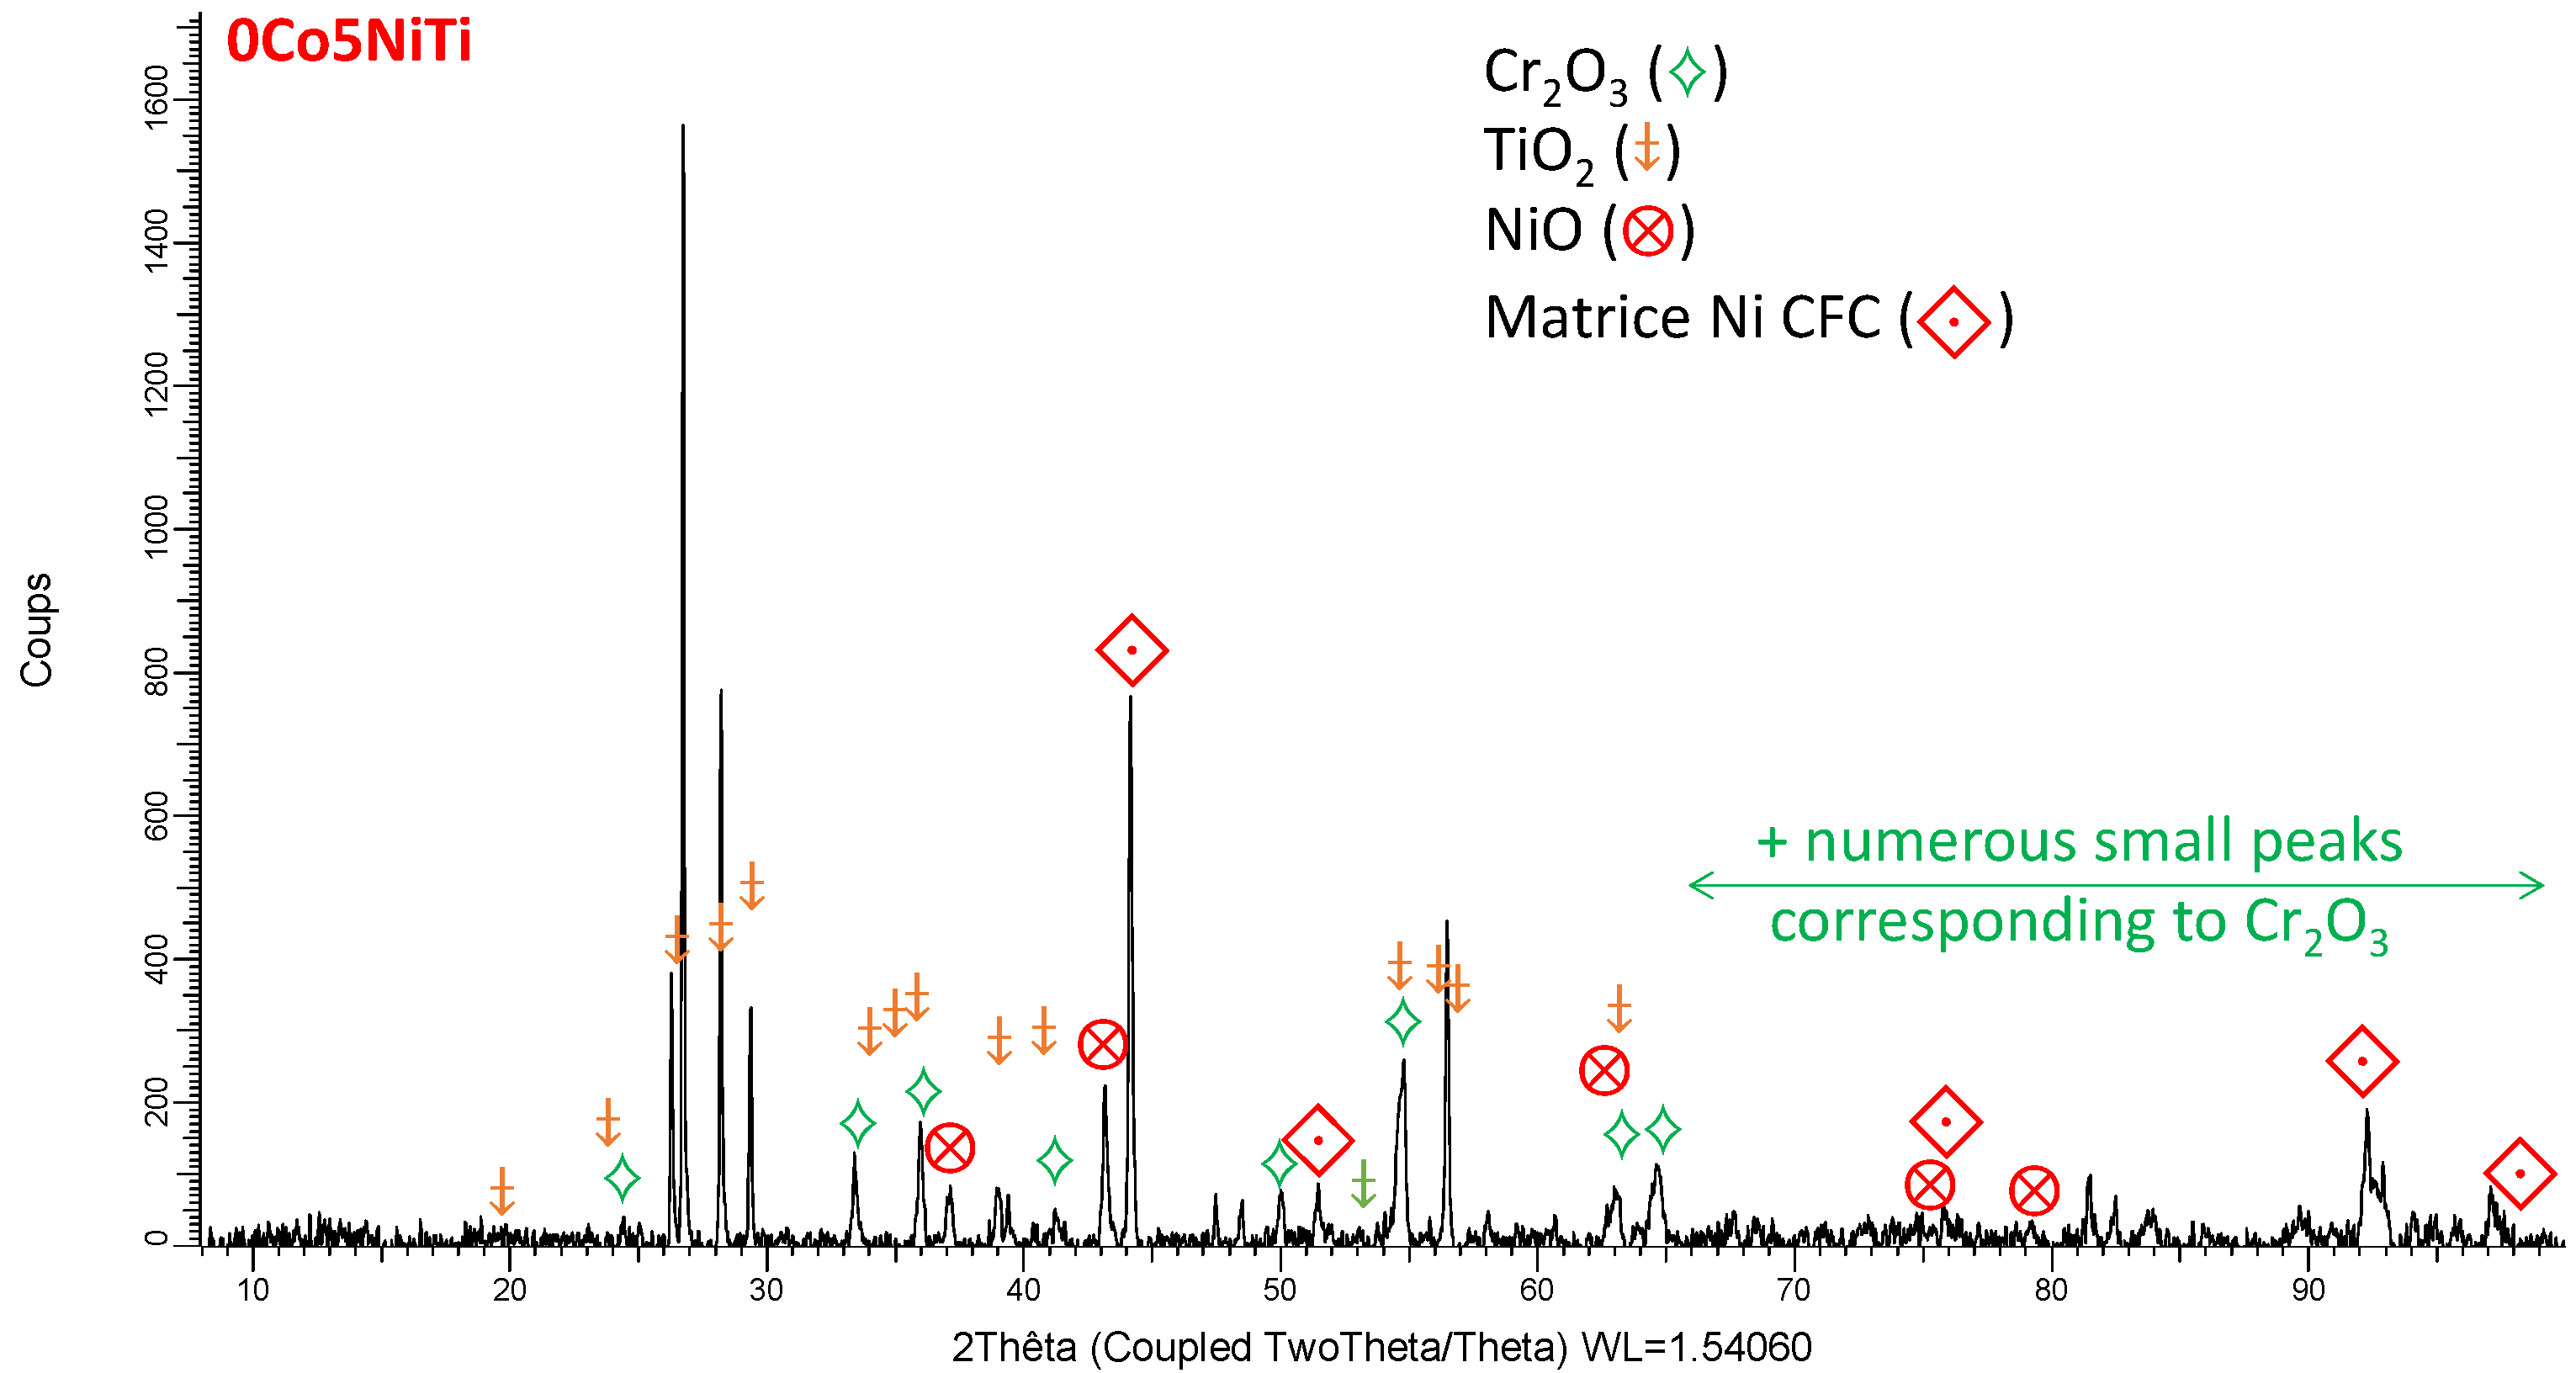
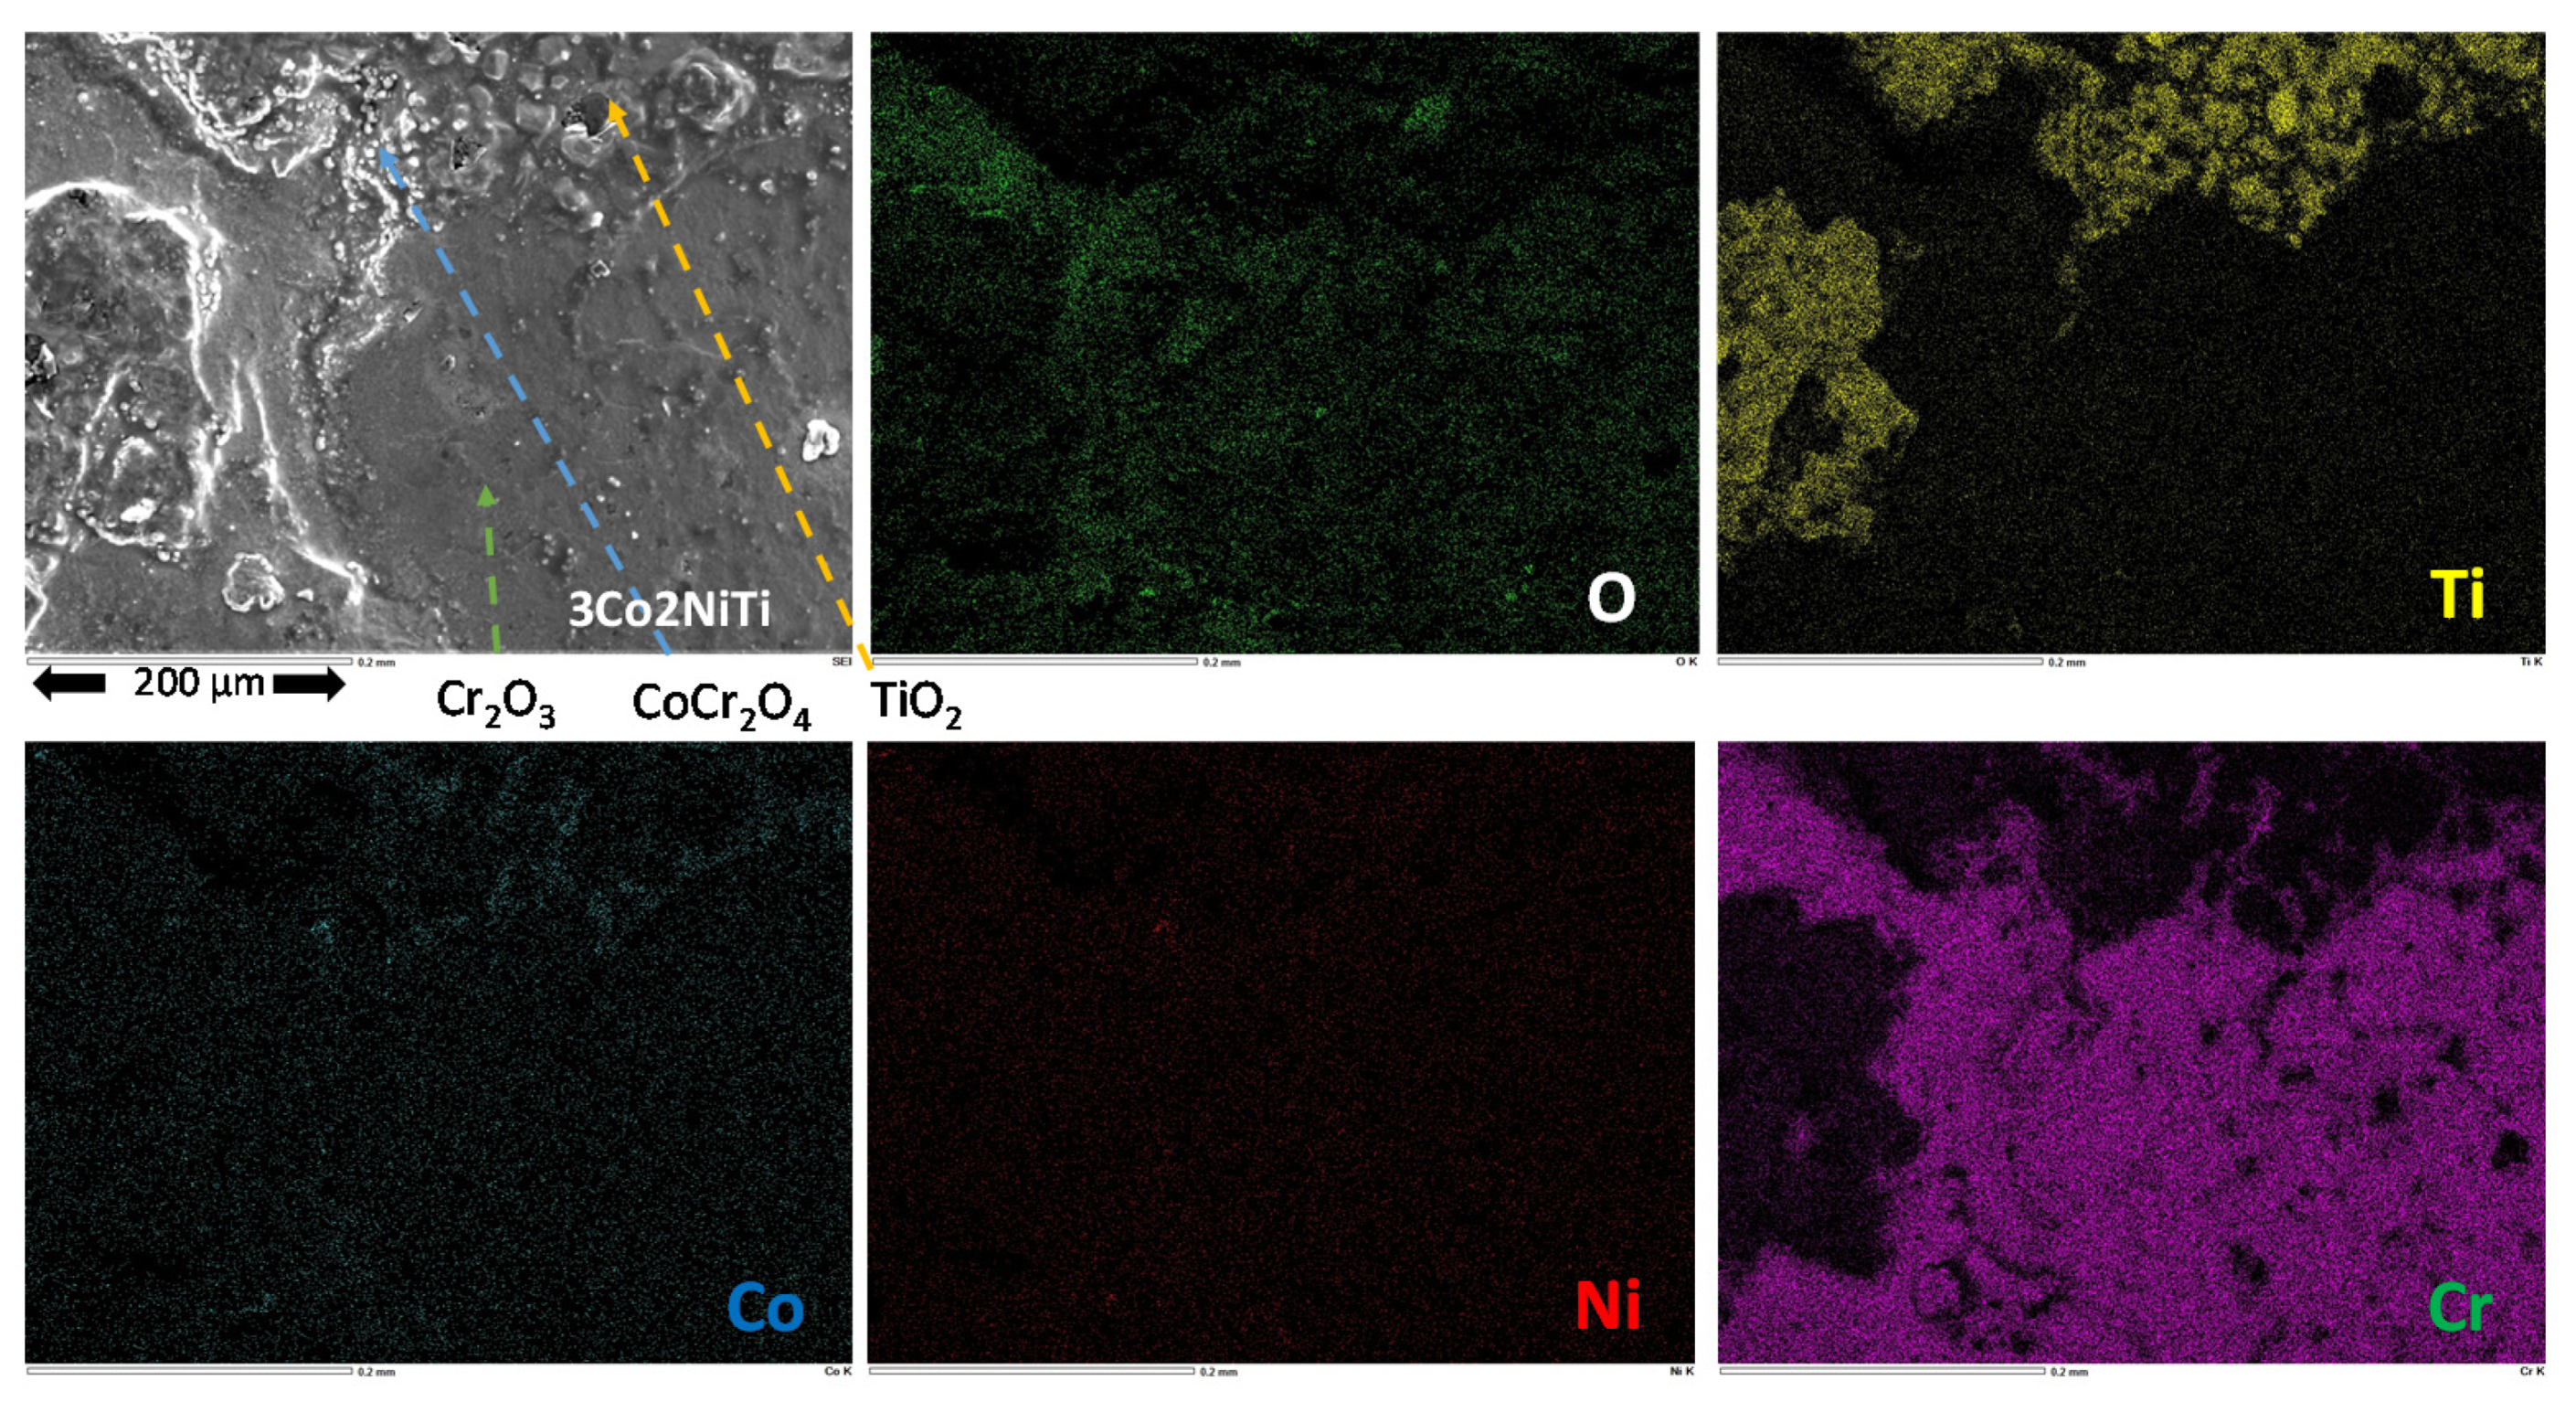
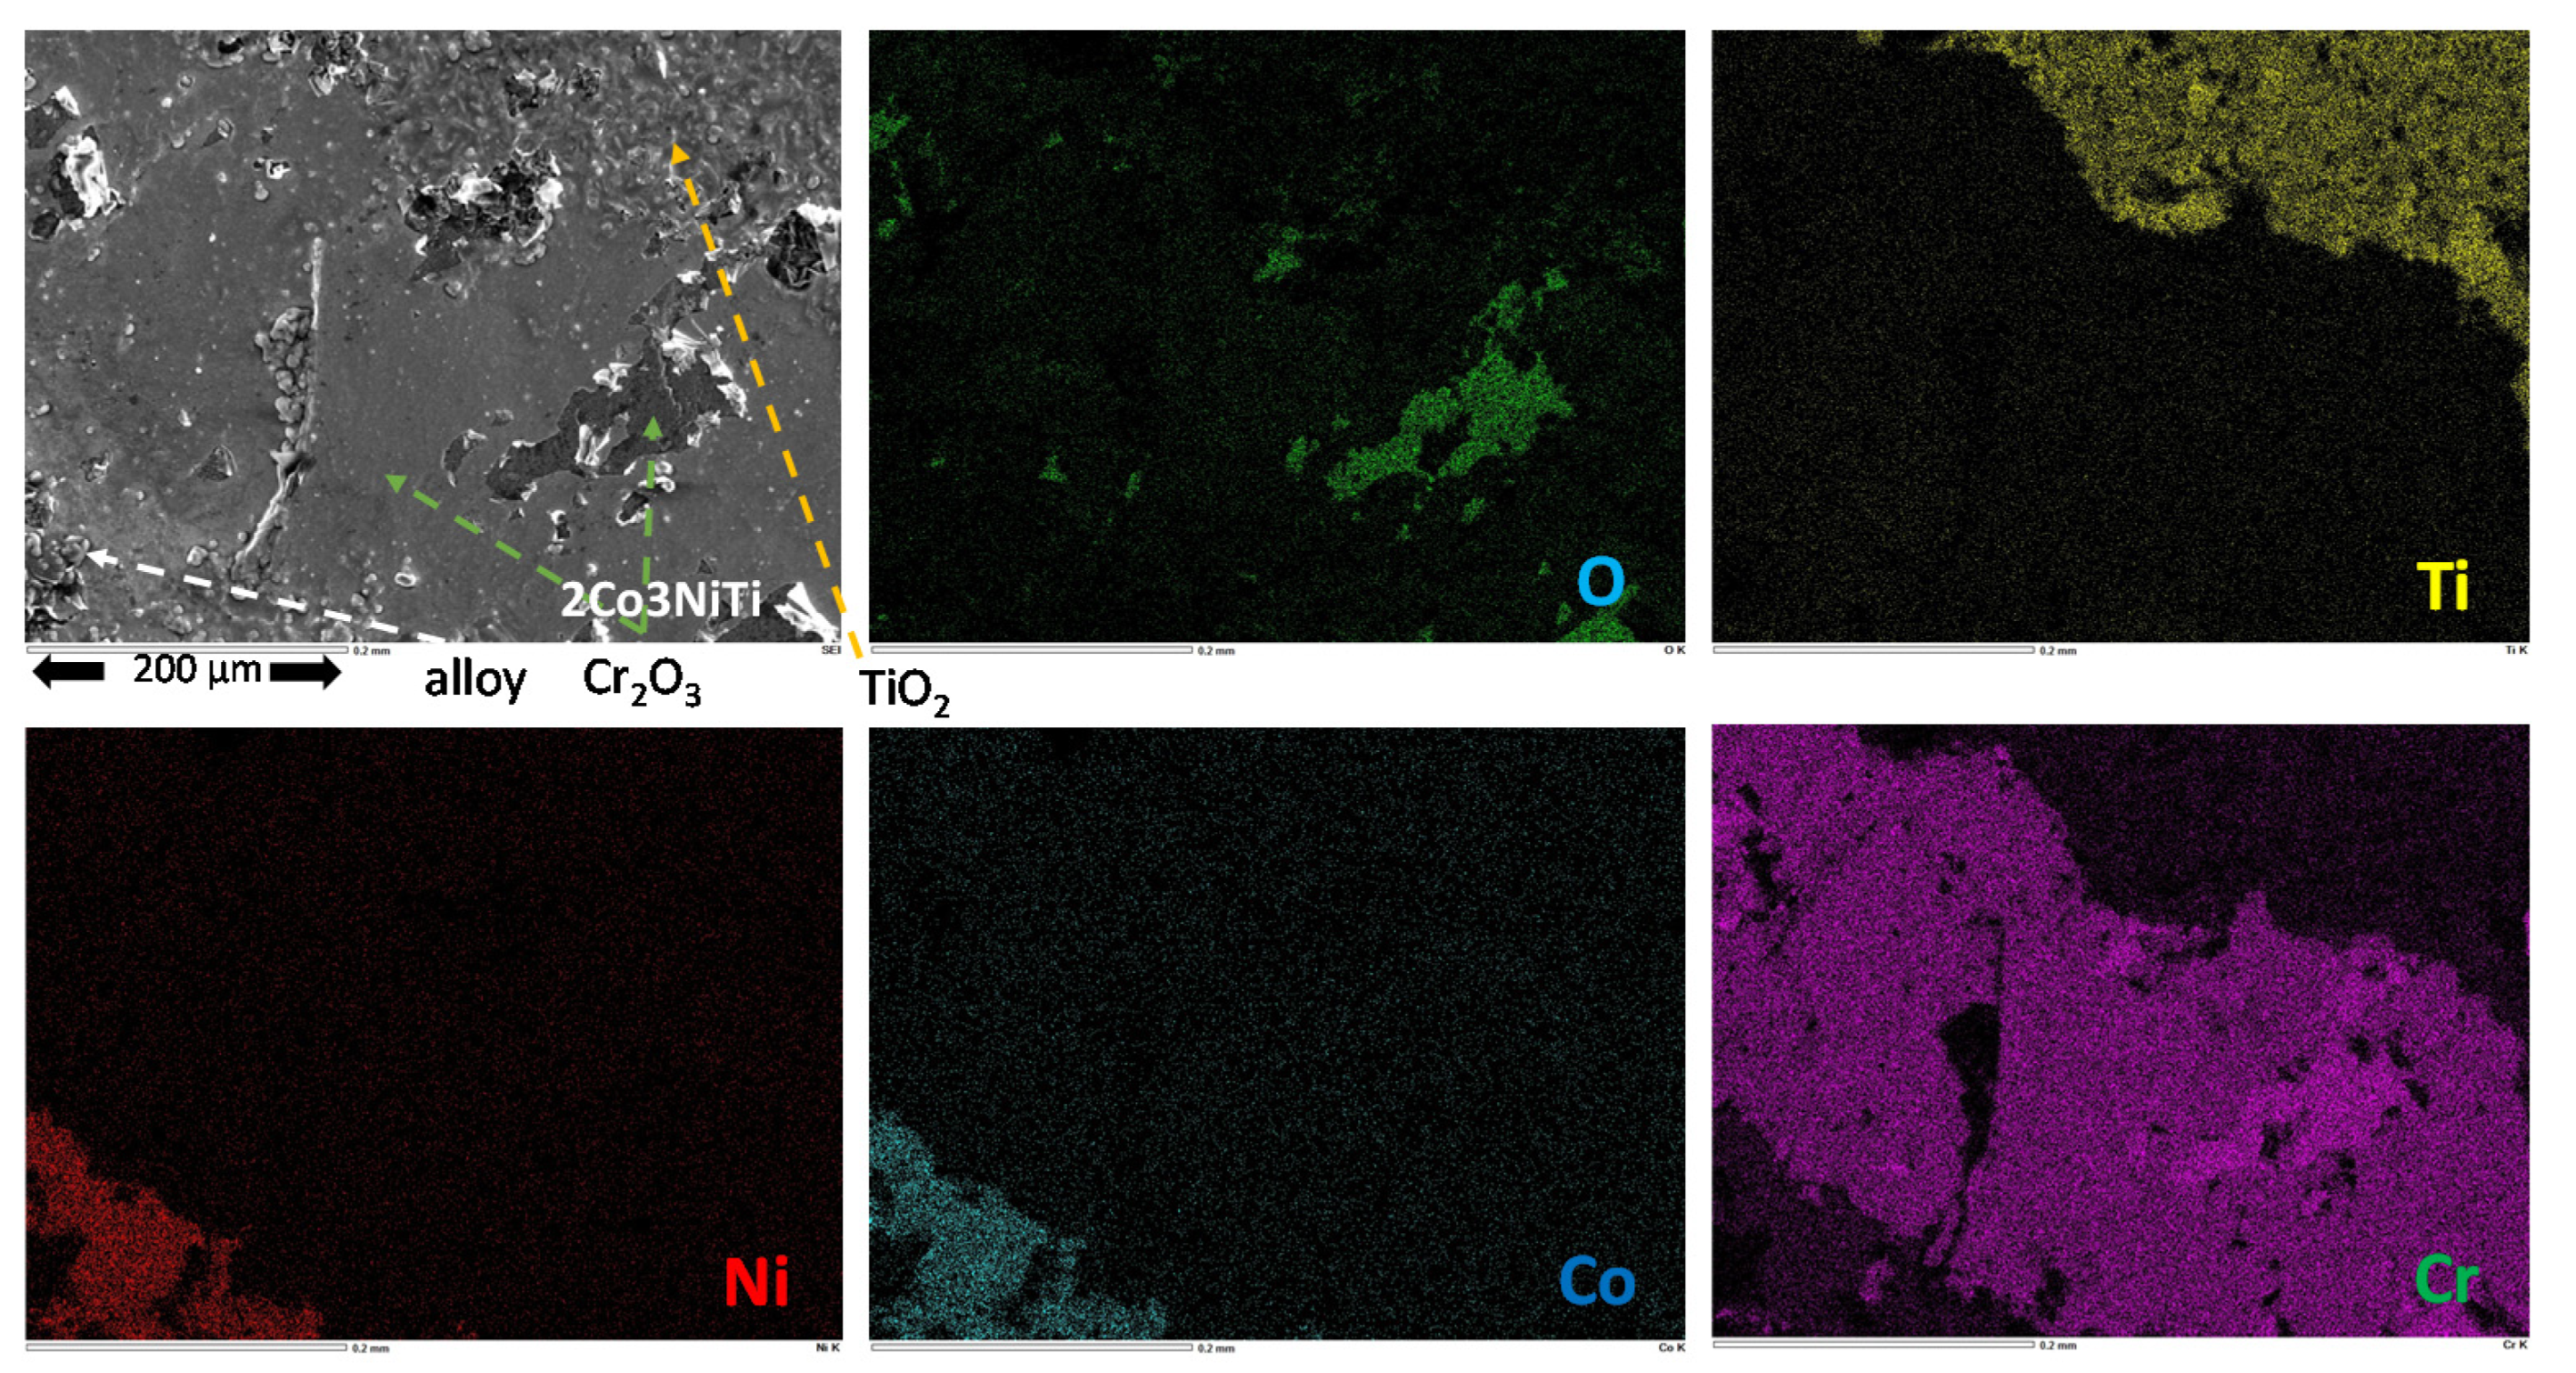
3.3.1. Nature and Morphologies of the External Oxides Remaining on Surface

Extracted out of the thermo-balance and from the alumina-gained platinum suspension, the oxidized samples were first subjected to X-ray diffraction. Two diffractograms are given as examples in Figure 3 (5Co0NiTi) and Figure 4 (3Co2NiTi) for the Co-richest alloys, and in Figure 5 (2Co3NiTi) and Figure 6 (0Co5NiTi) for the Ni-richest alloys.
Chromia (Cr2O3) is present on the surface of all the oxidized samples. However, one must also notice the presence of the titanium oxide TiO2 for all the alloys. Cobalt oxides (CoO) and the spinel involving cobalt and chromium (CoCr2O4) are also noticed, but only for the Co-richest alloys. The Ni-richest alloys, after oxidation, are all free of these oxides involving cobalt. XRD only detected the Cr2O3 and TiO2 oxides. One must also note that the diffraction peaks corresponding to the matrixes of the alloys are systematically found in the diffractograms: they are the contributions of the zones denuded by oxide spallation.
After gold deposition, the oxidized samples, with now good electrical conductivity on the surface, were studied using the SEM and by X-ray cartography. Two examples given in Figure 7 for the Co-rich alloys (represented by the 3Co2NiTi alloy) and in Figure 8 for the Ni-rich (represented by the 2Co3NiTi alloy) allow distinguishing the spinel oxides involving cobalt, chromia, TiO2 and zones of the alloy’s surface denuded by oxide spallation.

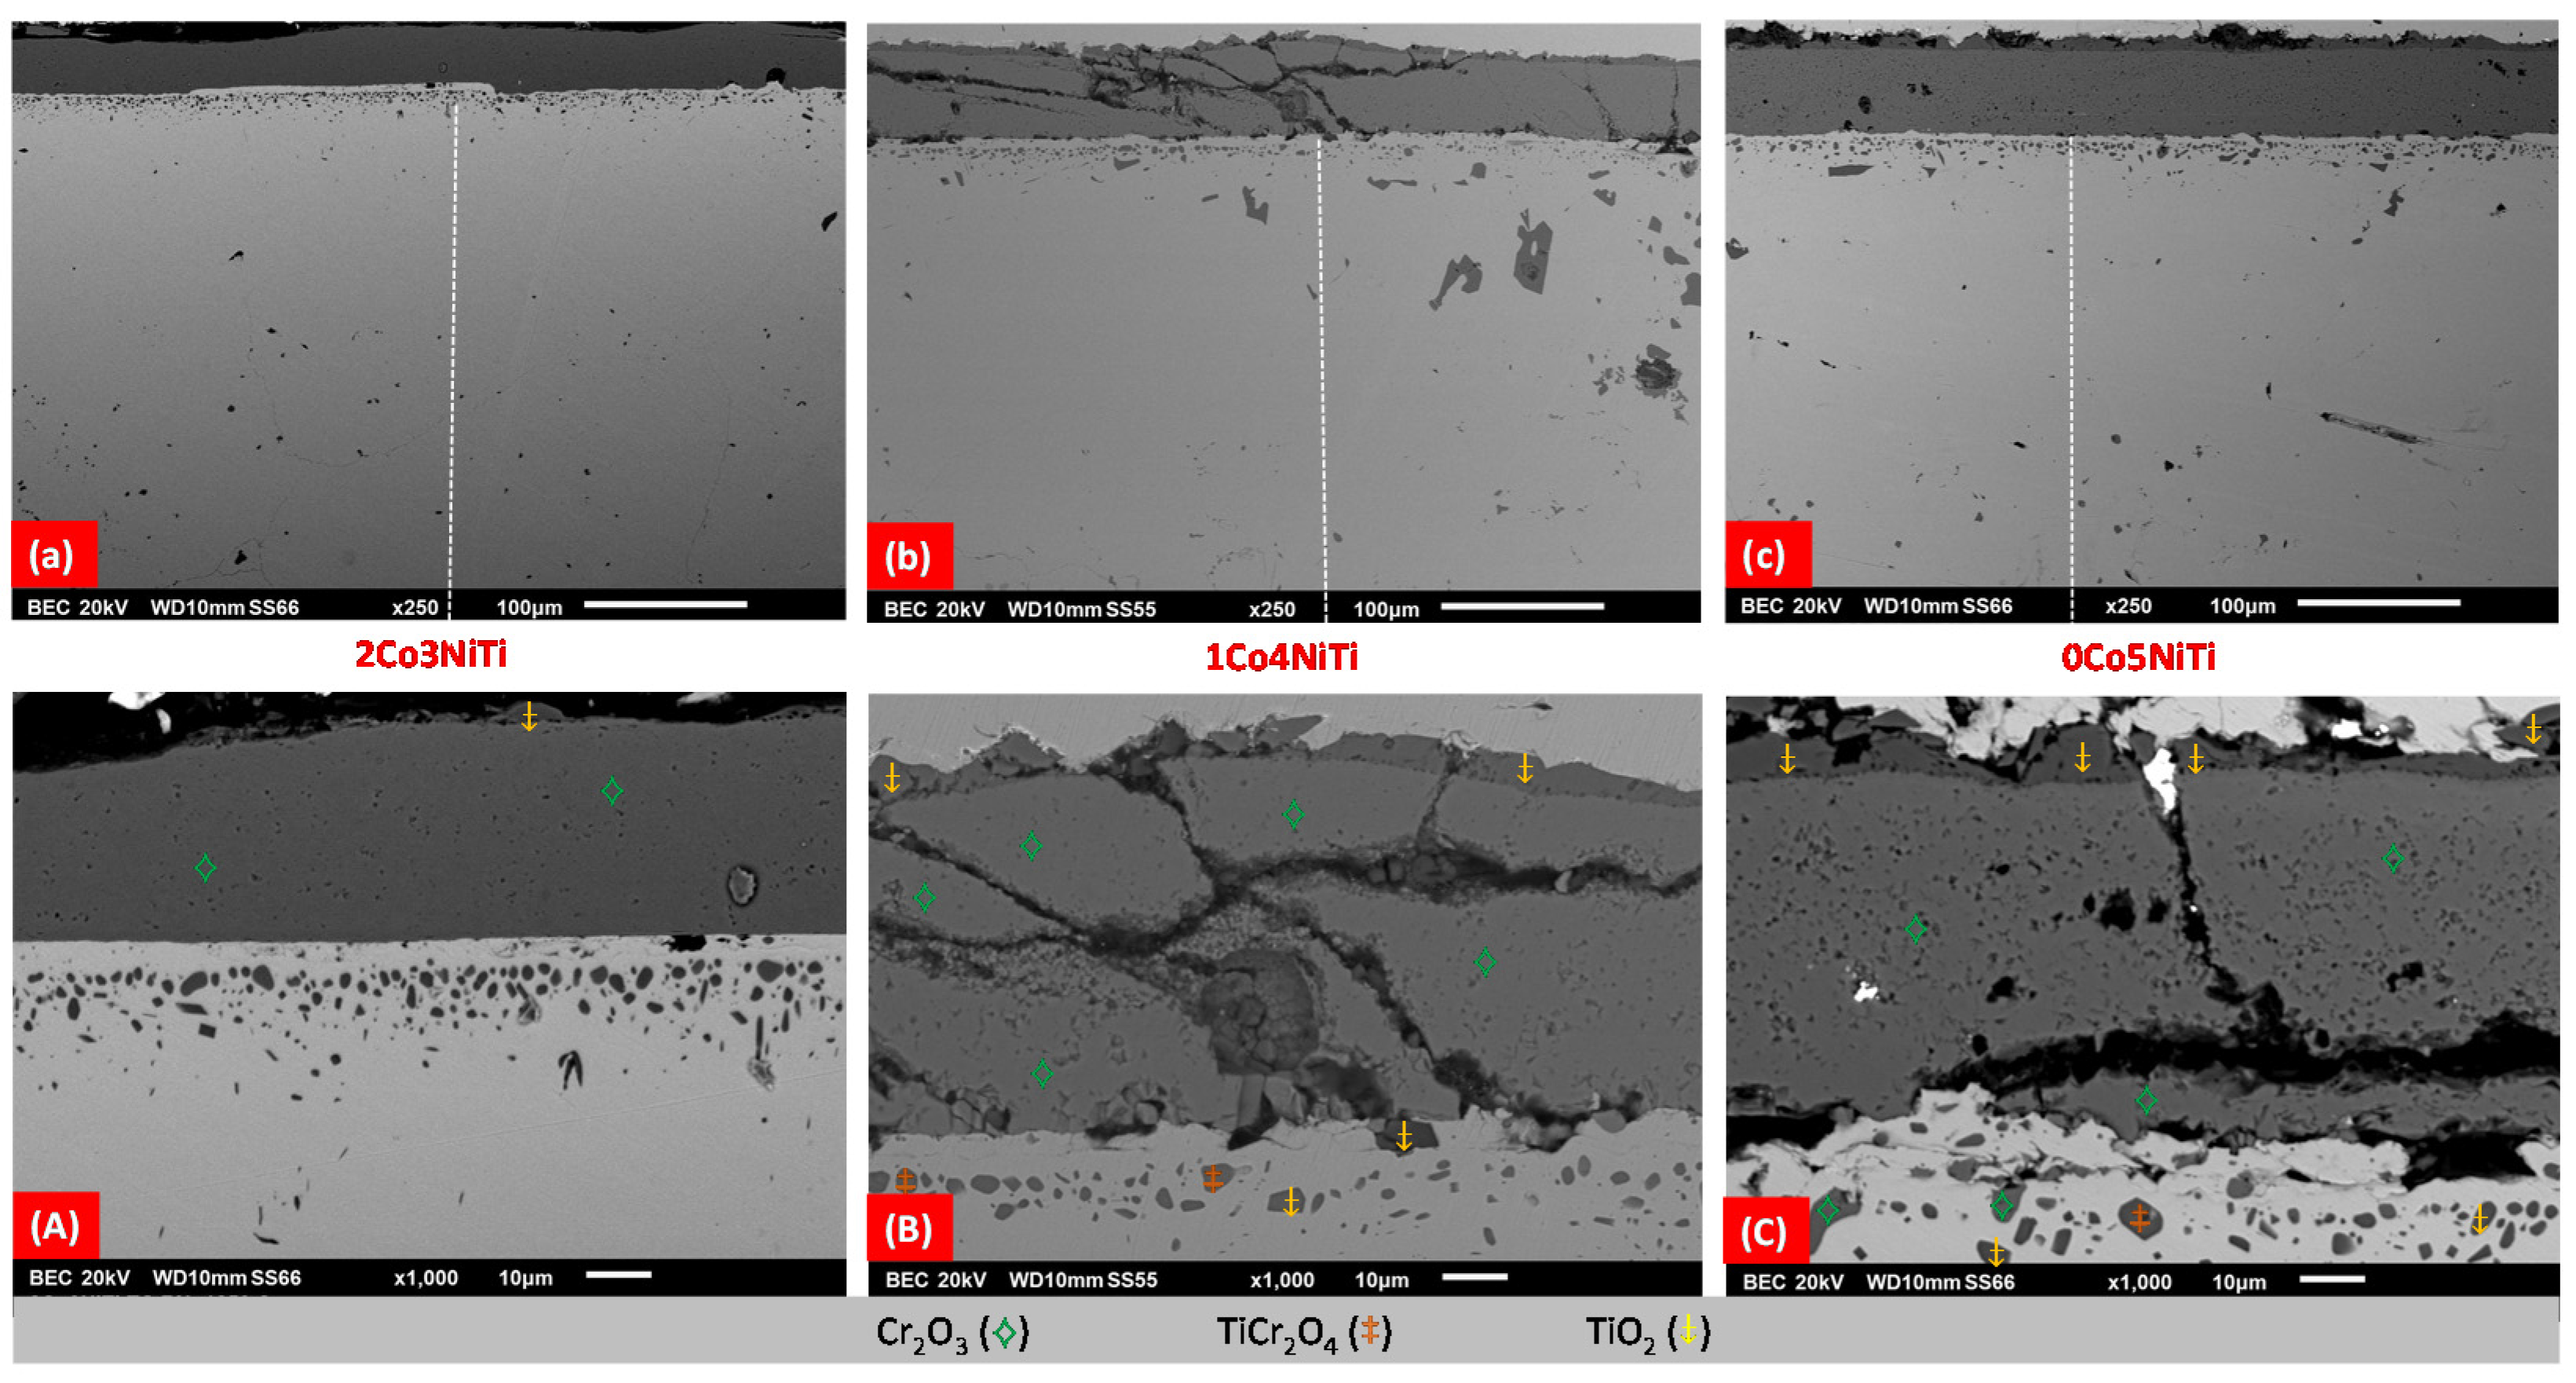
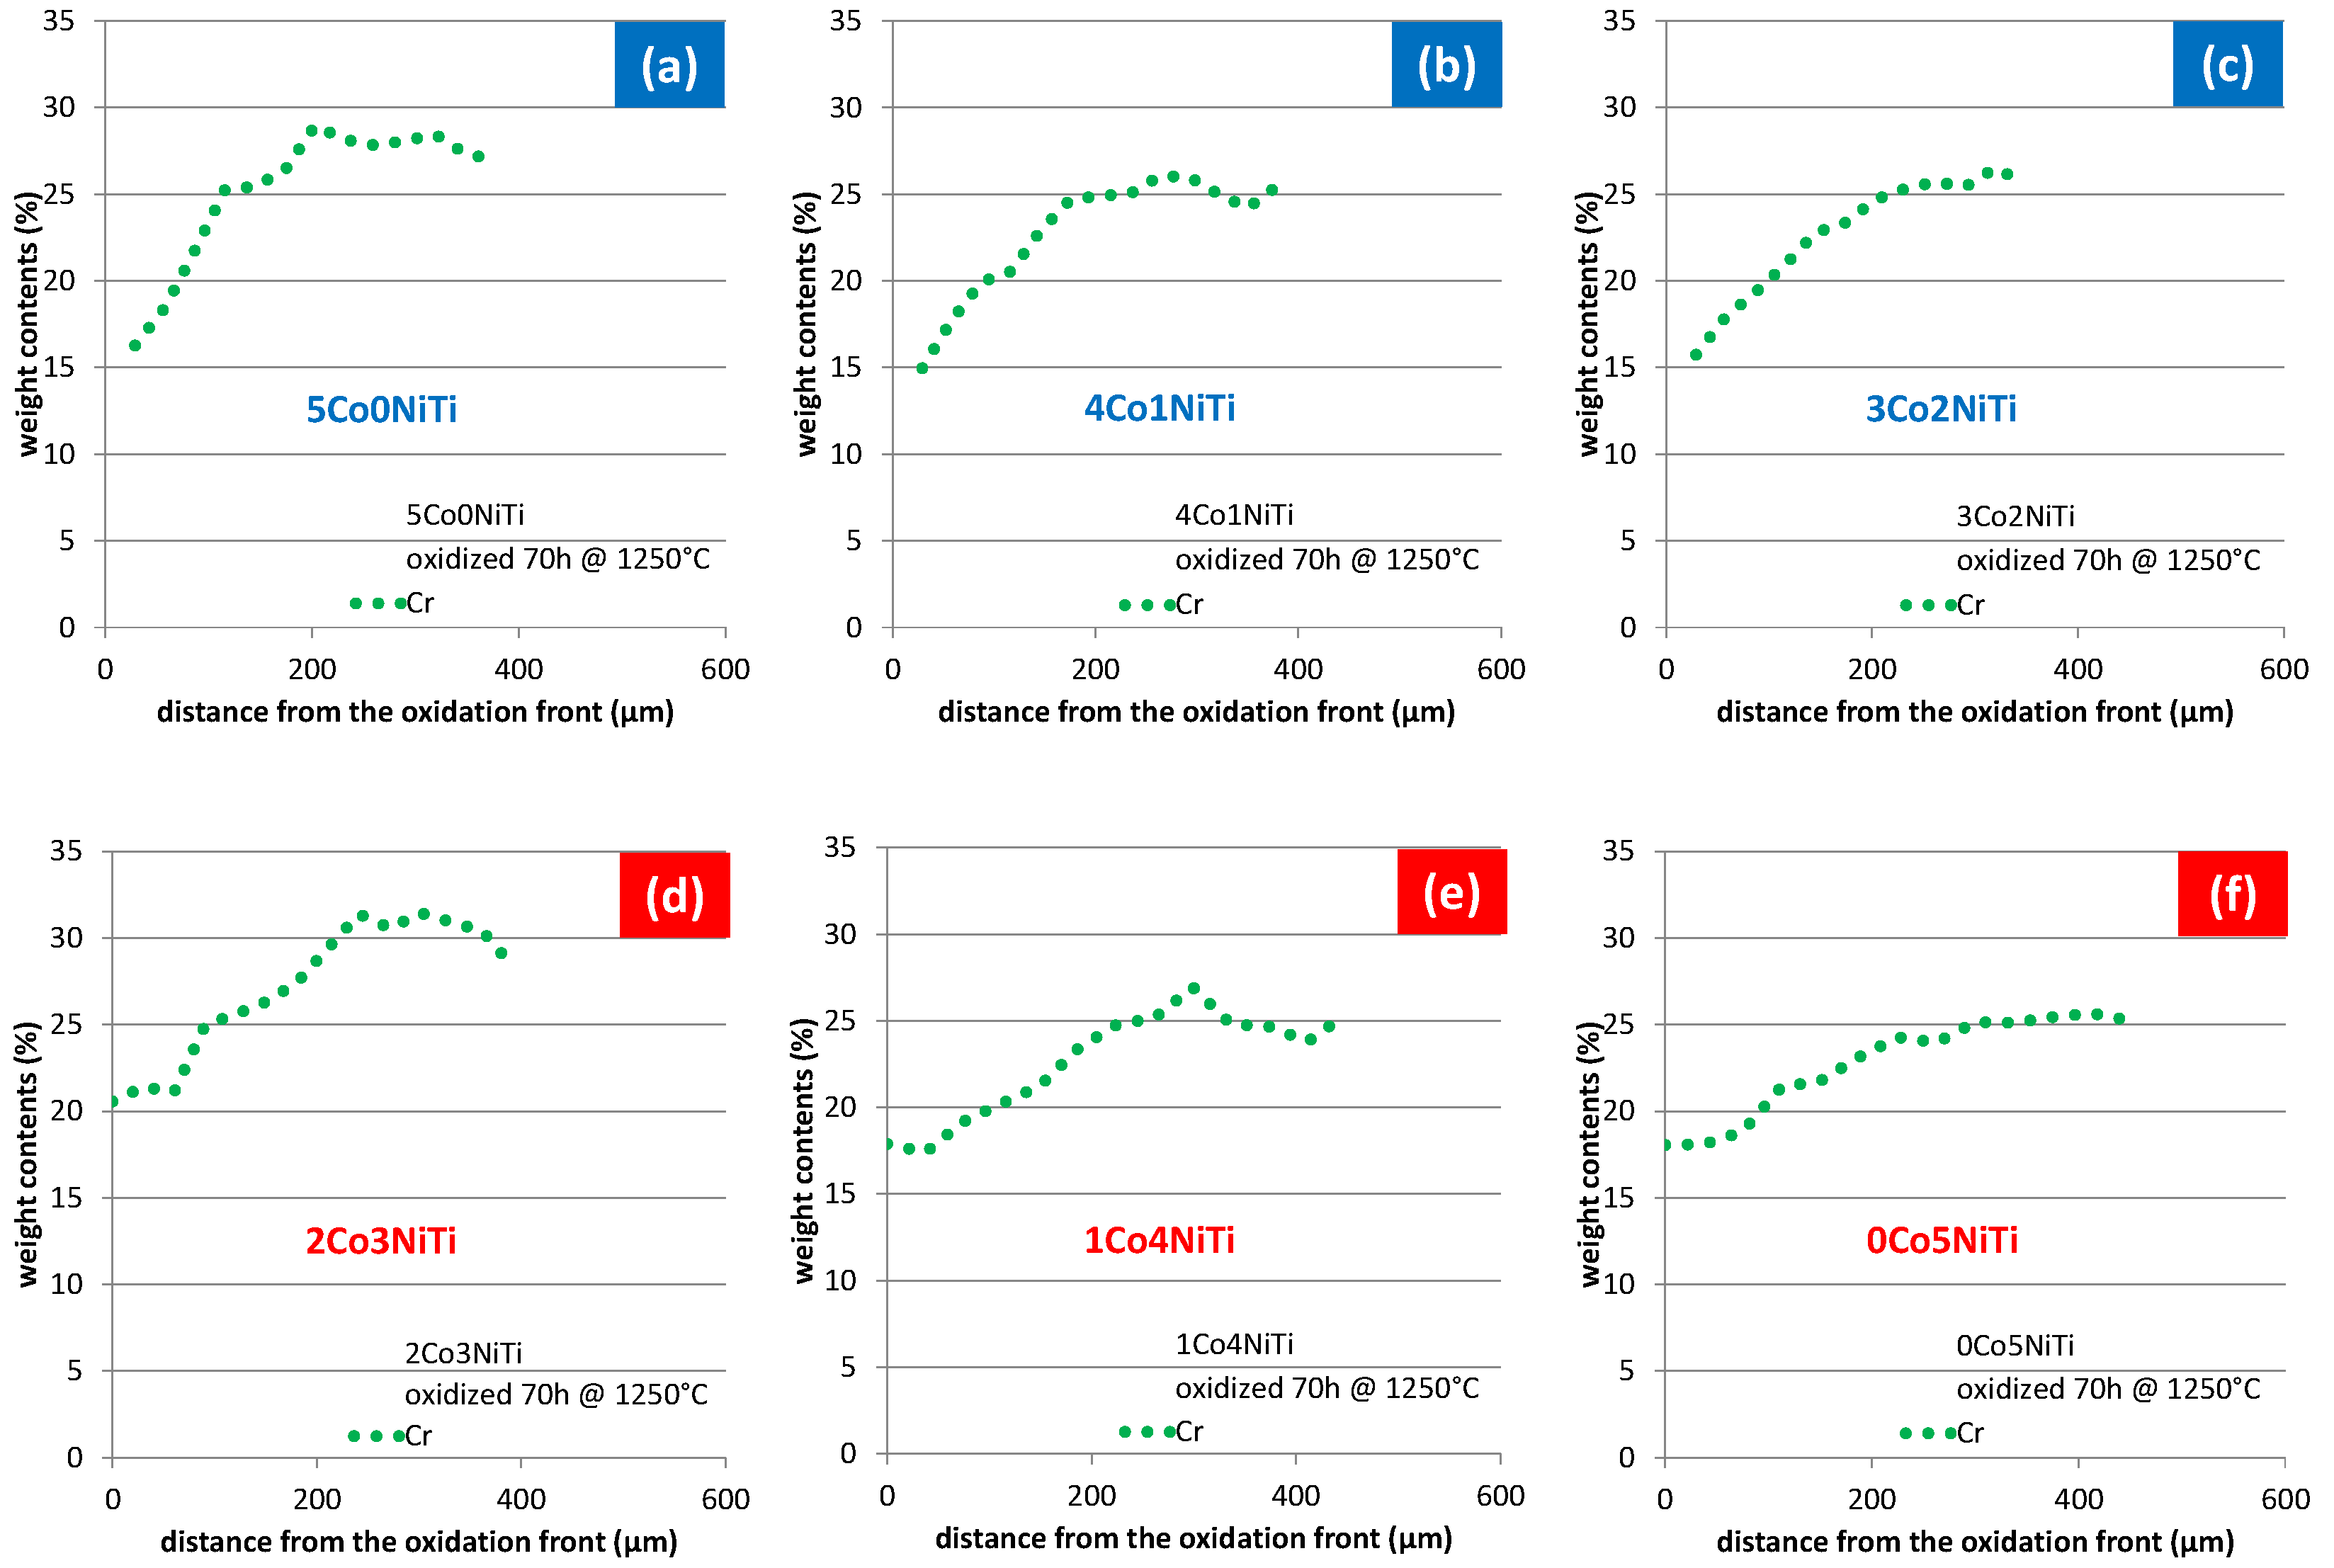
3.3.2. Cross-Sectional Observations and Analyses of the External and Internal Oxides

After cross-sectional preparation, the oxidized samples were examined in the thickness of the external oxides and in the subsurface. Cross-sectional views at two different magnifications are available for the Co-richest alloys in Figure 9, and in Figure 10 for the Ni-richest alloys. These micrographs were taken specifically where spallation did not occur (maximal and constant thickness observed all around the cross-section). Spot EDS analysis allowed identifying the external and internal oxides. In all cases, there is a thick chromia scale covering the alloys continuously. An upper thin layer of CoO (or (Co,Ni)O) covers the chromia scale for the Co-richest alloys. In the case of the Ni-richest alloys, there are fragments of an outer TiO2 scale, which isolates chromia from the atmosphere. The irregular boundary observed between chromia and the subjacent alloy, for the Co-richest alloys, suggests an inwards oxide growth (mainly anionic). For the Ni-richest alloys, the frontier is obviously more regular, and it indicates that the oxide growth is outwards (mainly cationic). Internal oxidation also occurred for all the alloys, with, finally, the presence of small oxides of different species: Cr2O3, TiCr2O4 and TiO2.
The formation of external and internal oxides of chromium (mainly chromia) and of titanium (mainly TiO2) has necessarily impoverished the subsurface in these two elements. EDS spot analyses were acquired along a straight line perpendicular to the alloy surface to establish concentration profiles. The ones concerning chromium are presented in Figure 11.
The Cr-depleted depths are of about 200 µm for all the alloys. Differences between alloys appear when one considers the minimal Cr content measured in the subsurface very close to the oxidation front: here, for the Co-richest alloys, the local chromium content has decreased to about 15 wt.%, while this is only 18 to 20 wt.% for the Ni-richest alloys. Consequently, the average concentration gradient is greater for the Co-richest alloys than for the Ni-richest alloys.

4. Discussion

A recent work [15] showed that the resistance against oxidation, in air at 1200 °C for a long time, of a series of alloys analogous to the six studied alloys was correct for such an elevated temperature, and even good for the majority of them. This study completes this observation by demonstrating that it is again the case when the temperature is 1250 °C. This was certainly not known in advance considering that the additional 50 °C was possibly able to significantly influence the behavior in a negative way. Indeed, it was possible, and even probable, that, at 50 °C above a temperature already particularly high for such rather simple alloys, the oxidation would become catastrophic. Thus, the observation that it was not the case and that the alloys resisted as they resisted at the lower temperature, 1200 °C, is a new and interesting result. Furthermore, the chromium content in the extreme surface close to the oxidation front is still higher than 15 wt.% Cr—or equal to this value in the worst cases—as shown by the concentration profiles. Consequently, there is still a potential of oxidation resistance for durations longer than 70 h, at least for five of the six alloys since the start of local rapid oxidation was detected for the 5Co0NiTi alloy.
Here, the oxidation test was not done in a furnace but in a thermo-balance, which allowed specifying the isothermal oxidation kinetic. Almost all the mass gains were globally parabolic, indicating that a thickening external oxide scale was limiting oxidation more and more. In addition, these kinetic data allowed seeing that the base element plays a role on the oxidation rate: the higher the nickel content (at the expense of cobalt), the slower the mass gain.
During cooling, a rather intensive oxide spallation occurred obviously. Nevertheless, there are many locations on the surface where the whole scale thickness achieved at the end of the isothermal scale is preserved. Here, it was possible to characterize the oxidation products formed externally as well as the ones formed internally. The post mortem characterization of the oxidized samples showed that this oxide scale was principally constituted of chromia. This showed, in addition, that a continuous outer TiO2 scale was present. This TiO2 scale was much thinner than the chromia one. It was extended along the outer side of the chromia scale, and it thus isolated chromia from air. This double-layer constitution of the external oxide scale was also previously observed after oxidation at 1200 °C [15].
The presence of TiO2 in the external scales formed on superalloys oxidized at a high temperature was earlier noticed in several works, but for oxidation temperatures lower than 1200 °C. In some cases, TiO2 was mixed with Al2O3, Cr2O3 and spinels [17,18,19,20,21], but not with the shape and locations observed at 1200 °C [15] and at 1250 °C in the present work. In other cases, the presence of TiO2 was effectively noticed at the outer surface of an alumina scale [22,23] or a chromia scale [24] for other oxidized alloys (RHEA, nickel-based alloys…).
It was earlier reported that the oxide scale grows by the outward diffusion of Cr and Ti and ingress of O [22,25], and that Ti induces a doping effect that enhances the growth rate of chromia [20,24]. It was also seen that Ti can diffuse through chromia [26,27]. When temperatures of oxidation become higher, this favors the location of Ti on the external side of the external scale at the expense of its presence inside the chromia scale [20,28]. In the present case, taking into account the elevated temperature of the tests (at least 100 °C higher than all the temperature tests of these previous works), it is not surprising that a TiO2 outermost scale covered the chromia scales of all six of the studied alloys.
The presence of this outer continuous scale of TiO2, which seemingly isolates chromia from the air, suggests that a protection effect may be expected, notably concerning the re-oxidation of chromia into gaseous CrO3. This phenomenon, which becomes possible as soon as the temperature is higher than 1000 °C in air at the atmospheric pressure, is expected to be intensive for 1200 °C and above. Such an effect should be beneficial since chromia should be preserved from overconsumption, which can be dangerous for the long-term sustainability of the alloys.
To verify whether chromia was effectively protected from volatilization, one can consider the obtained values of the volatilization constant (Table 3) and compare them to the reference ones. No Kv values were available for Kv in one case [16], a study in which the dependences on the temperature of real Kp and Kv were investigated for a model chromia-forming Ni–30Cr alloy. From the Kp and Kv values at 1100 °C, 1200 °C or 1300 °C and from the corresponding activation energies that were determined in this work (242 kJ mol−1 for Kp and 104 kJ mol−1 for Kv [16]), one deduced the values of both constants for 1250 °C. For the reference Ni–30Cr alloy, this gave 210 × 10−10 g cm−2 s−1 for Kv, which tends to be higher than the values of Kv obtained in the present work. This suggests that the presence of TiO2 covering the outer side of the chromia scale effectively limits its volatilization. Unfortunately, it seems that this point was not really studied before today, at least to our knowledge.
At the same time, the estimation for 1250 °C of the real Kp value of the reference Ni–30Cr alloy leads to 128 × 10−12 g2 cm−4 s−1, which is significantly lower than the real Kp values obtained for the alloys of the present study. Two reasons can be considered for that: the additional mass gain associated with the TiO2 growth (added to the mass gain due to the chromia growth), and perhaps the acceleration of the Cr diffusion through the chromia scale due to the doping effect of Ti [20,24].
To summarize, one can say that the good general oxidation resistance of these alloys earlier observed at 1200 °C [15] is still present at 50 °C. The presence of Ti, which was expected as deleterious for the global oxidation behavior, may have a contrasted influence: it possibly favored the diffusion through the external scale of the ionic species involved in the oxidation reaction (by a doping effect), while, at the same time, it was able to form an outer TiO2 continuous scale, possibly protecting the chromia from volatilization. The first observations of this double effect were carried out here by considering the obtained values of the parabolic constants and the volatilization constants. These ones tend to be higher than (and, respectively, lower than) the Kp and Kv constants at 1250 °C of a chromia-forming model alloy.

5. Conclusions and Outlooks

In oxidation at a high temperature, the studied alloys behaved at 1250 °C as well as 1200 °C. Unlike these prior tests at 1200 °C, thermogravimetry was used in the present investigations. This allowed specifying, for this temperature of 1250 °C, the oxidation constants characterizing separately the mass gain by oxide growth and the mass loss by re-oxidation in volatile oxide of a part of the formed chromia. Seemingly, the presence of titanium influences both phenomena: the acceleration of the chromia growth (higher Kp) and the slow-down of chromia volatilization (lower Kv). If the first effect of titanium was already known (doping effect of titanium for ion diffusion through chromia), the second seems to have never been evocated: the protective effect of the outermost TiO2 scale preserving chromia from volatilization, although such outermost TiO2 layer was earlier observed for various superalloys or refractory alloys containing titanium. This is the use of thermogravimetry and a numerical treatment to specify Kp and Kv simultaneously, which allowed here observing this possible effect. Now, deeper investigations can be envisaged, first to confirm this suspected effect and second to better know how and how fast this outermost TiO2 develops; is it growing from the earliest times of oxidation (end of heating, first time of isothermal stage) or only after a delay? When does it become continuous? Oxidation tests stopped after different durations may allow answering such questions. In the case of confirmation, Ti additions to different kinds of superalloys for promoting the TiO2 formation may be considered for protecting chromia from too-rapid volatilization.

Author Contributions

Conceptualization, P.B.; methodology, P.B. and L.A.; validation, P.B.; formal analysis, P.B. and S.A.O.W.; investigation, P.B., S.A.O.W., L.A. and G.M.; resources, L.A. and E.E.; data curation, P.B. and L.A.; writing—original draft preparation, P.B.; writing—review and editing, P.B.; supervision, P.B.; project administration, P.B.; funding acquisition. All authors have read and agreed to the published version of the manuscript.

Funding

This research received no external funding.

Institutional Review Board Statement

Not applicable.

Informed Consent Statement

Not applicable.

Data Availability Statement

Not applicable.

Conflicts of Interest

The authors declare no conflict of interest.

References

  1. Sims, C.T.; Hagel, W.C. The Superalloys; John Wiley & Sons: New York, NY, USA, 1972. [Google Scholar]
  2. Bradley, E.F. Superalloys: A Technical Guide; ASM International: Metals Park, OH, USA, 1988. [Google Scholar]
  3. Donachie, M.S.; Donachie, S.J. Superalloys: A Technical Guide, 2nd ed.; ASM International: Materials Park, OH, USA, 2002. [Google Scholar]
  4. Durand-Charre, M. The Microstructure of Superalloys; CRC Press: Boca Raton, FL, USA, 1997. [Google Scholar]
  5. Kofstad, P. High Temperature Corrosion; Elsevier: London, UK, 1988. [Google Scholar]
  6. Young, D.J. High Temperature Oxidation and Corrosion of Metals; Elsevier: Amsterdam, The Netherlands, 2008. [Google Scholar]
  7. Drapier, J.M.; Leroy, V.; Dupont, C.; Coutsouradis, D.; Habraken, L. Structural stability of MAR-M 509, a cobalt-base superalloy. Cobalt 1968, 41, 199–213. [Google Scholar]
  8. Beltran, A.M.; Sims, C.T.; Wagenheim, N.T. High temperature properties of Mar-M alloy 509. J. Met. 1969, 21, 39–47. [Google Scholar] [CrossRef]
  9. Michon, S.; Aranda, L.; Berthod, P.; Steinmetz, P. High temperature evolution of the microstructure of a cast cobalt base superalloy—Consequences on its thermomechanical properties. Metall. Res. Technol. 2004, 101, 651–662. [Google Scholar] [CrossRef]
  10. Berthod, P.; Conrath, E. Mechanical and Chemical Properties at High Temperature of {M-25Cr}-based Alloys Containing Hafnium Carbides (M = Co, Ni or Fe): Creep Behavior and Oxidation at 1200 °C. J. Mater. Sci. Technol. Res. 2014, 1, 7–14. [Google Scholar] [CrossRef]
  11. Berthod, P.; Conrath, E. Microstructure evolution in bulk and surface states of chromium rich nickel based cast alloys reinforced by hafnium carbides after exposure to high temperature air. Mater. High Temp. 2014, 31, 266–273. [Google Scholar] [CrossRef] [Green Version]
  12. Berthod, P.; Conrath, E. Creep and oxidation kinetics at 1100 °C of nickel-base alloys reinforced by hafnium carbides. Mater. Des. 2016, 104, 27–36. [Google Scholar] [CrossRef] [Green Version]
  13. Khair, M.; Berthod, P. As-cast microstructures and hardness of chromium-rich cobalt-based alloys reinforced by titanium carbides. Mater. Sci. Indian J. 2016, 14, 102–109. [Google Scholar]
  14. Berthod, P.; Khair, M. Thermodynamic and experimental study of cobalt-based alloys designed to contain TiC carbides. Calphad 2019, 65, 34–41. [Google Scholar] [CrossRef]
  15. Berthod, P.; Ozouaki Wora, S.A. Influence of Ti and Co/Ni Ratio on the Oxidation at 1200 °C of Chromium-Containing {Ni, Co}-Based Cast Alloys. Metall. Mater. Trans. A 2022, 53, 277–289. [Google Scholar] [CrossRef]
  16. Berthod, P. Kinetics of high temperature oxidation and chromia volatilization for a binary Ni–Cr alloy. Oxid. Met. 2005, 64, 235–252. [Google Scholar] [CrossRef] [Green Version]
  17. Zhang, Q.; Li, C. High temperature stable anatase phase titanium dioxide films synthesized by mist chemical vapor deposition. Nanomaterials 2020, 10, 911. [Google Scholar] [CrossRef] [PubMed]
  18. Liu, F.J.; Zhang, M.C.; Dong, J.X.; Zhang, Y.W. High-temperature oxidation of FGH96 P/M superalloy. Acta Metall. Sin. (Engl. Lett.) 2007, 20, 102–110. [Google Scholar] [CrossRef]
  19. Bak, S.H.; Lee, D.B. High temperature SO2-gas corrosion of Ni-Cr-Co base superalloy between 800 and 1000 °C. Defect Diffus. Forum 2010, 312–315, 451–454. [Google Scholar]
  20. Buscail, H.; Perrier, S.; Josse, C. Oxidation mechanism of the Inconel 601 alloy at high temperatures. Mater. Corros. 2011, 62, 416–422. [Google Scholar] [CrossRef]
  21. Weng, F.; Yu, H.; Chen, C.; Wan, K. High-temperature oxidation behavior of Ni—based superalloys with Nb and Y and the interface characteristics of oxidation scales. Surf. Interface Anal. 2015, 47, 362–370. [Google Scholar] [CrossRef]
  22. Seal, S.; Kuiry, S.C.; Bracho, L.A. Studies on the surface chemistry of oxide films formed on IN-738LC superalloy at elevated temperatures in dry air. Oxid. Met. 2001, 56, 583–603. [Google Scholar] [CrossRef]
  23. Mueller, F.; Gorr, B.; Christ, H.J.; Chen, H.; Kauffmann, A.; Heilmaier, M. Effect of microalloying with silicon on high temperatire oxidation resistance of novel refractory high-entropy alloy Ta-Mo-Cr-Ti-Al. Mater. High Temp. 2018, 35, 168–176. [Google Scholar] [CrossRef] [Green Version]
  24. Jalowicka, A.; Nowak, W.; Young, D.J.; Nischwitz, V.; Naumenko, D.; Quadakkers, W.J. Boron depletion in a nickel base superalloy induced by high temperature oxidation. Oxid. Met. 2015, 83, 393–413. [Google Scholar] [CrossRef]
  25. Rabbani, F.; Ward, L.P.; Strafford, K.N. A comparison of the growth kinetics and scale morphology for three superalloys at 930 °C in air and low PO2 environments. Oxid. Met. 2000, 54, 139–153. [Google Scholar] [CrossRef]
  26. Lenglet, M.; Delaunay, F.; Lefez, B. FTIR study of the influence of minor alloying elements on the high-temperature oxidation of nickel alloys. Mater. Sci. Forum 1997, 251–254, 267–274. [Google Scholar] [CrossRef]
  27. Berthier, C.; Lameille, J.M.; Lenglet, M.; Abida, D.; Lopitaux, J.; Beucher, E. Relationship between the presence of alloying elements and the growth of oxide scale formed on the ferritic stainless steel AISI 430. Influence of Mn, Al, and Ti. Mater. Sci. Forum 1997, 251–254, 89–95. [Google Scholar] [CrossRef]
  28. Litz, J.E.; Rahmel, A.; Schorr, M.; Weiss, J. Scale formation on the nickel-base superalloys IN 939 and IN 738 LC. Oxid. Met. 1989, 32, 167–184. [Google Scholar] [CrossRef]
Figure 1. The as-cast microstructures of the six alloys: 5Co0NiTi (a), 4Co1NiTi (b), 3Co2NiTi (c), 2Co3NiTi (d), 1Co4NiTi (e) and 0Co5NiTi (f); SEM/BSE micrographs.
Metals 12 00010 g001
Figure 2. The mass variation curves plotted versus time to observe the mass gain evolution for all the six alloys during the isothermal stage.
Metals 12 00010 g002
Figure 3. Diffractogram acquired on one side of the oxidized 5Co0NiTi sample.
Metals 12 00010 g003
Figure 4. Diffractogram acquired on one side of the oxidized 3Co2NiTi sample.
Metals 12 00010 g004
Figure 5. Diffractogram acquired on one side of the oxidized 2Co3NiTi sample.
Metals 12 00010 g005
Figure 6. Diffractogram acquired on one side of the oxidized 0Co5NiTi sample.
Metals 12 00010 g006
Figure 7. X-map obtained on the oxidized surface zone of the 3Co2NiTi alloy (evidencing the TiO2, CoCr2O4 and Cr2O3 zones).
Metals 12 00010 g007
Figure 8. X-map obtained on the oxidized surface zone of the 2Co3NiTi alloy (evidencing the TiO2, Cr2O3 and denuded zones).
Metals 12 00010 g008
Figure 9. Cross-sectional observation of the external oxides and of the subsurfaces affected by oxidation (Co-richest alloys); white dotted arrows: line scans corresponding to the concentration profiles presented in Figure 11; (a) and (A): 5Co0NiTi, (b) and (B): 4Co1NiTi, (c) and (C): 3Co2NiTi.
Metals 12 00010 g009
Figure 10. Cross-sectional observation of the external oxides and the subsurfaces affected by oxidation (Ni-richest alloys); white dotted arrows: line scans corresponding to the concentration profiles presented in Figure 11; (a) and (A): 2Co3NiTi, (b) and (B): 1Co4NiTi, (c) and (C): 0Co5NiTi.
Metals 12 00010 g010
Figure 11. Concentration profiles for chromium acquired by EDS across the subsurface; (a): 5Co0NiTi, (b): 4Co1NiTi, (c): 3Co2NiTi, (d): 2Co3NiTi, (e): 1Co4NiTi, (f): 0Co5NiTi.
Metals 12 00010 g011
Table 1. Chemical compositions of the three Co-richest alloys (confirmed by EDS full frame analysis; wt.%).
Co-Based AlloysCo (Bal.)NiCrTiC
5Co0NiTi(73)0251.60.4 *
4Co1NiTi(58)15251.60.4 *
3Co2NiTi(44)29251.60.4 *
* Carbon cannot be analyzed in full frame EDS; content supposed well-respected considering the obtained carbides surface fractions.
Table 2. Chemical compositions of the three Ni-richest alloys (confirmed by EDS full frame analysis; wt.%).
Ni-Based AlloysNi (Bal.)CoCrTiC
2Co3NiTi(44)29251.60.4 *
1Co4NiTi(58)15251.60.4 *
0Co5NiTi(73)0251.60.4 *
* Carbon cannot be analyzed in full frame EDS; content supposed well-respected considering the obtained carbides surface fractions.
Table 3. Values of the kinetic constants determined for the isothermal oxidation using the classical method (5Co0NiTi) or the complete method taking chromia volatilization into account (the five other alloys).
Co-Rich AlloysKl × 10−8 g/cm2/sKpa × 10−12 g2/cm4/sKpr × 10−12 g2/cm4/sKv × 10−10 g/cm2/s
5Co0NiTi79.1368(728) *(914)
4Co1NiTi122(272) *460188
3Co2NiTi89.4(259) *404170
Ni-rich alloys
2Co3NiTi 81.8(222) *394209
1Co4NiTi64.7(206) *352190
0Co5NiTi30.0(197) *292132
*: between parentheses and written in italics: corresponding indicative values of Kpa, Kpr and Kv obtained by the other determination method (less representative).
Publisher’s Note: MDPI stays neutral with regard to jurisdictional claims in published maps and institutional affiliations.

