
A Detailed Machinability Assessment of DC53 Steel for Die and Mold Industry through Wire Electric Discharge Machining


 ,
,  ,
,  , ,
, ,  and
and
Abstract
:1. Introduction
- Investigating the influence of machining parameters on recast layer thickness (process limitation), surface roughness and kerf width (quality), and material removal rate (productivity).
- Optimizing input parameters such as wire feed (WF), pulse on duration (Pon), open voltage (OV), and servo voltage (SV) controlling process productivity and work quality of DC53 die steel processes with zinc-coated brass wire.
- Exploring the statistical significance of machining process science on physical changes on the material surface.
- Examining microstructural surface evolution using optical microscopy and scanning electron microscopy.
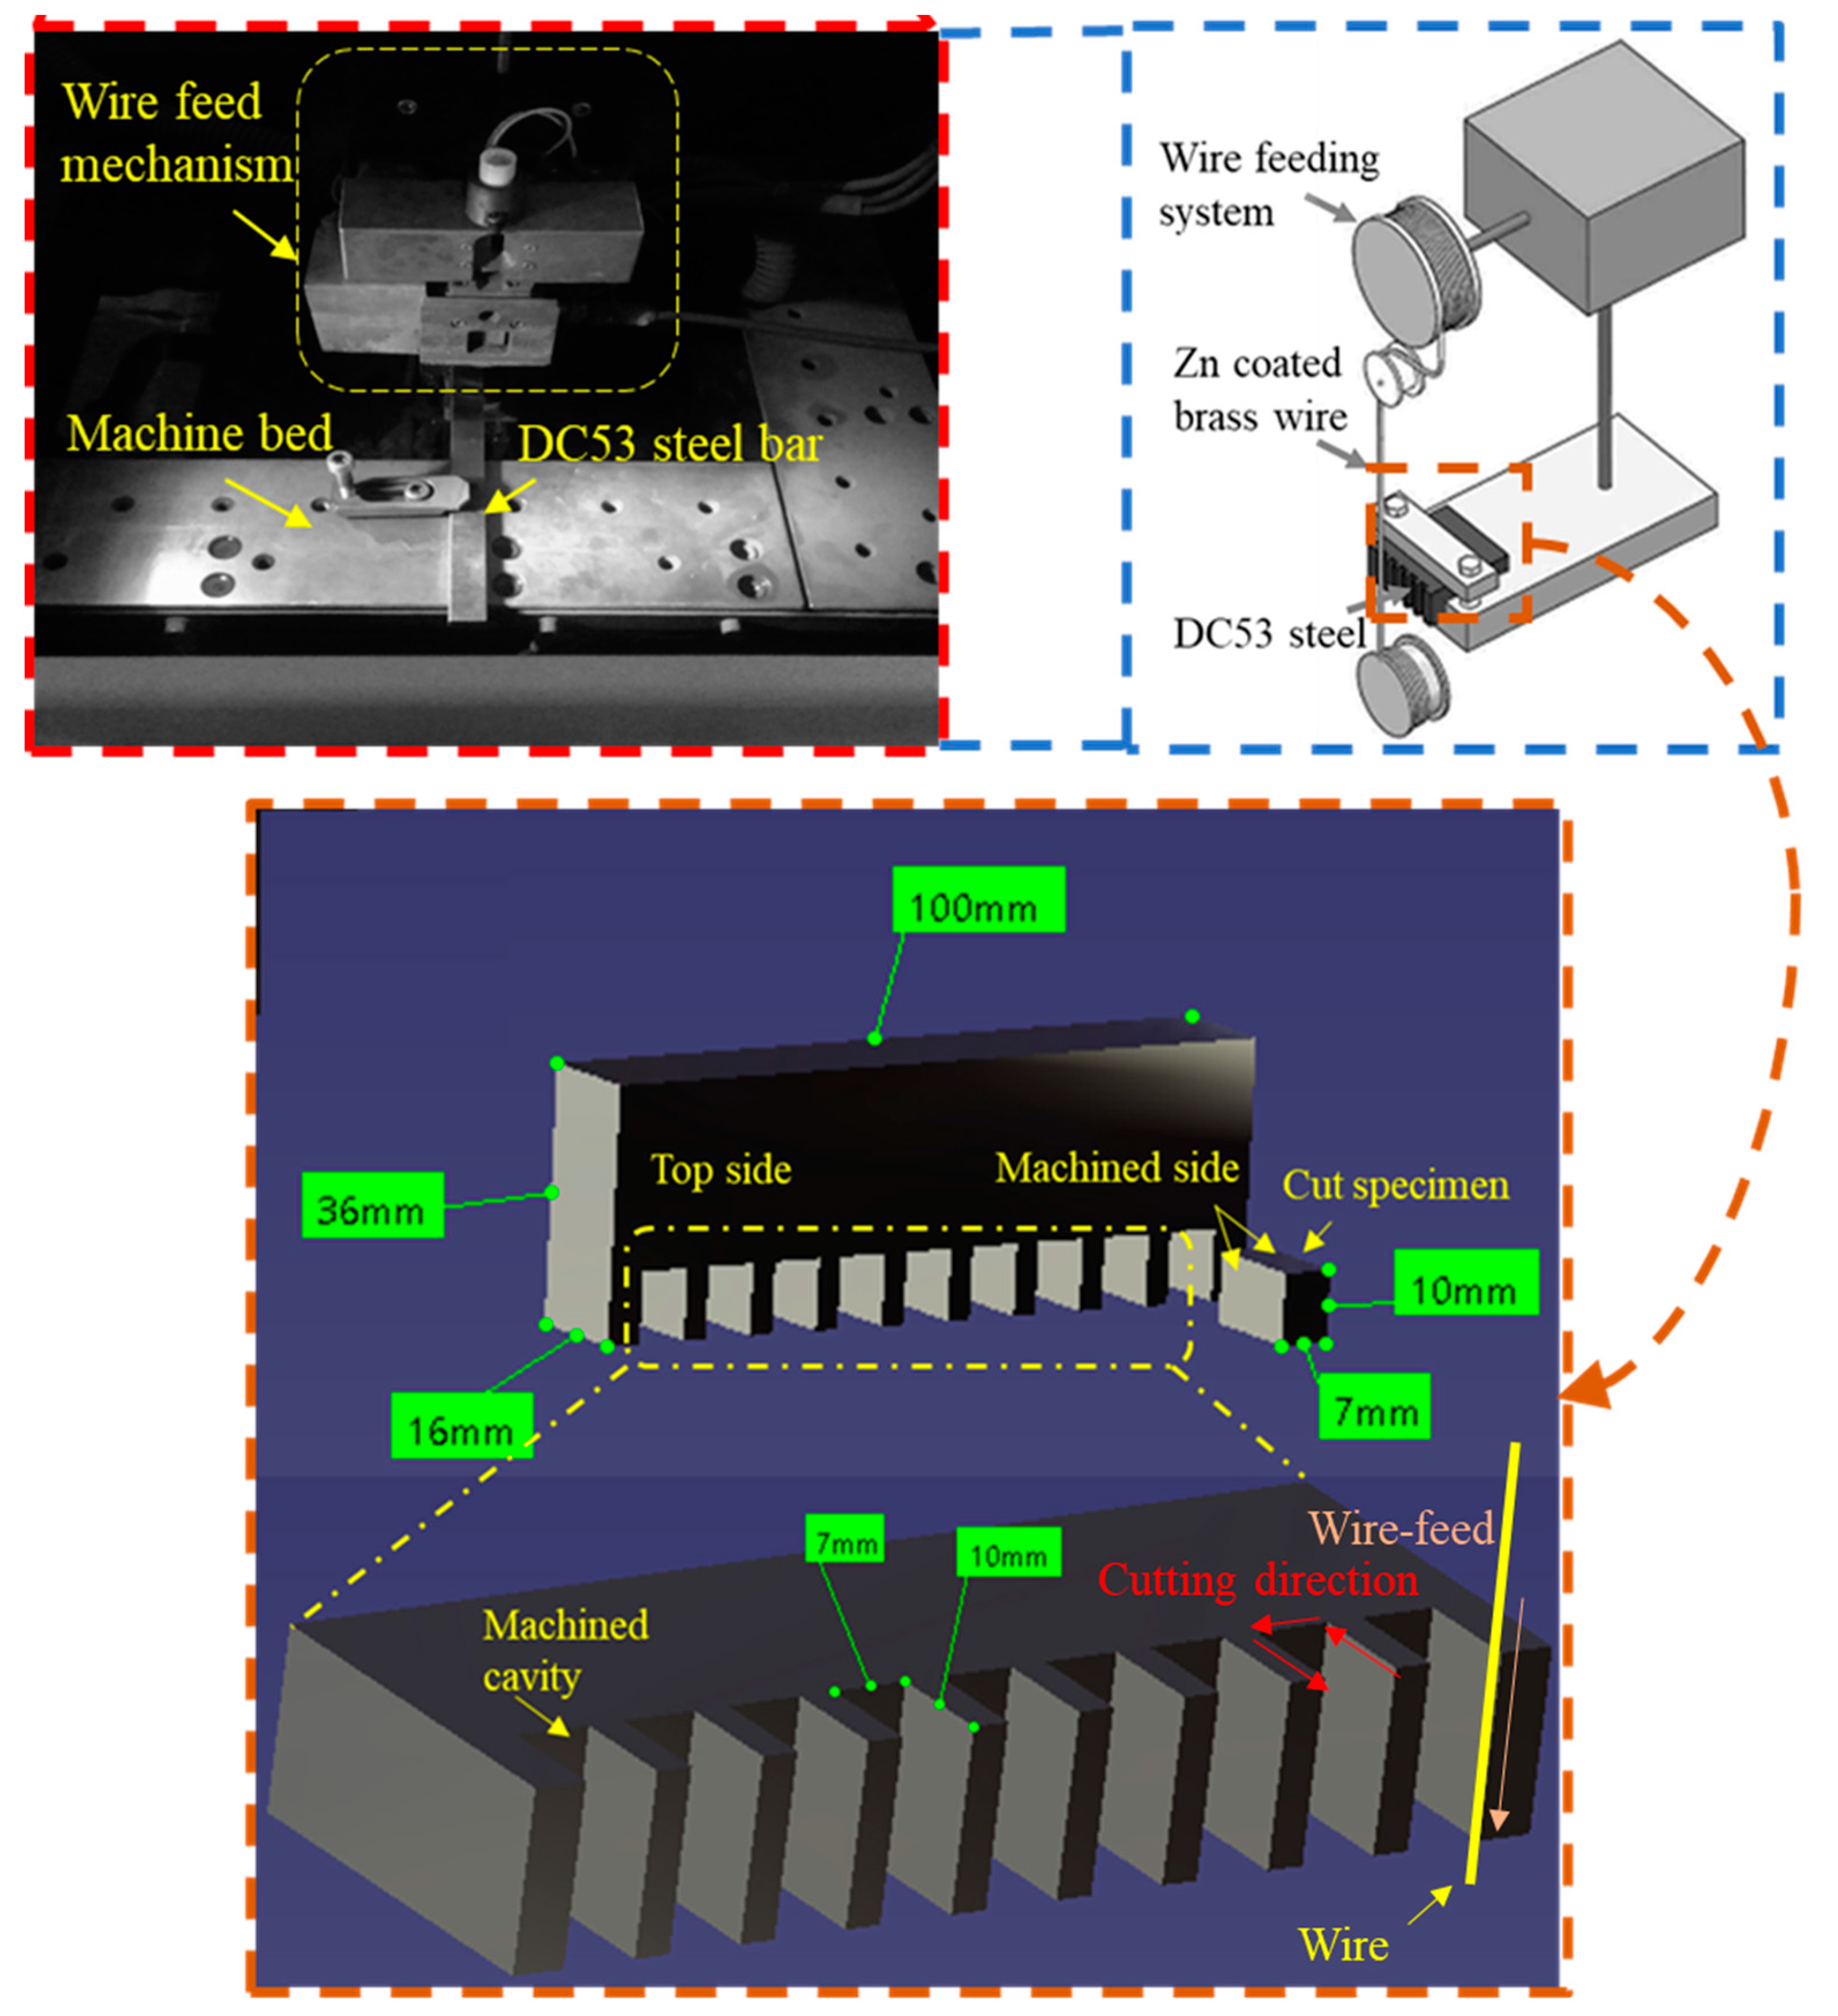
2. Materials and Methods
3. Results and Discussion
3.1. Parametric Significance Analysis
3.2. Process-Parametric Effect Analysis
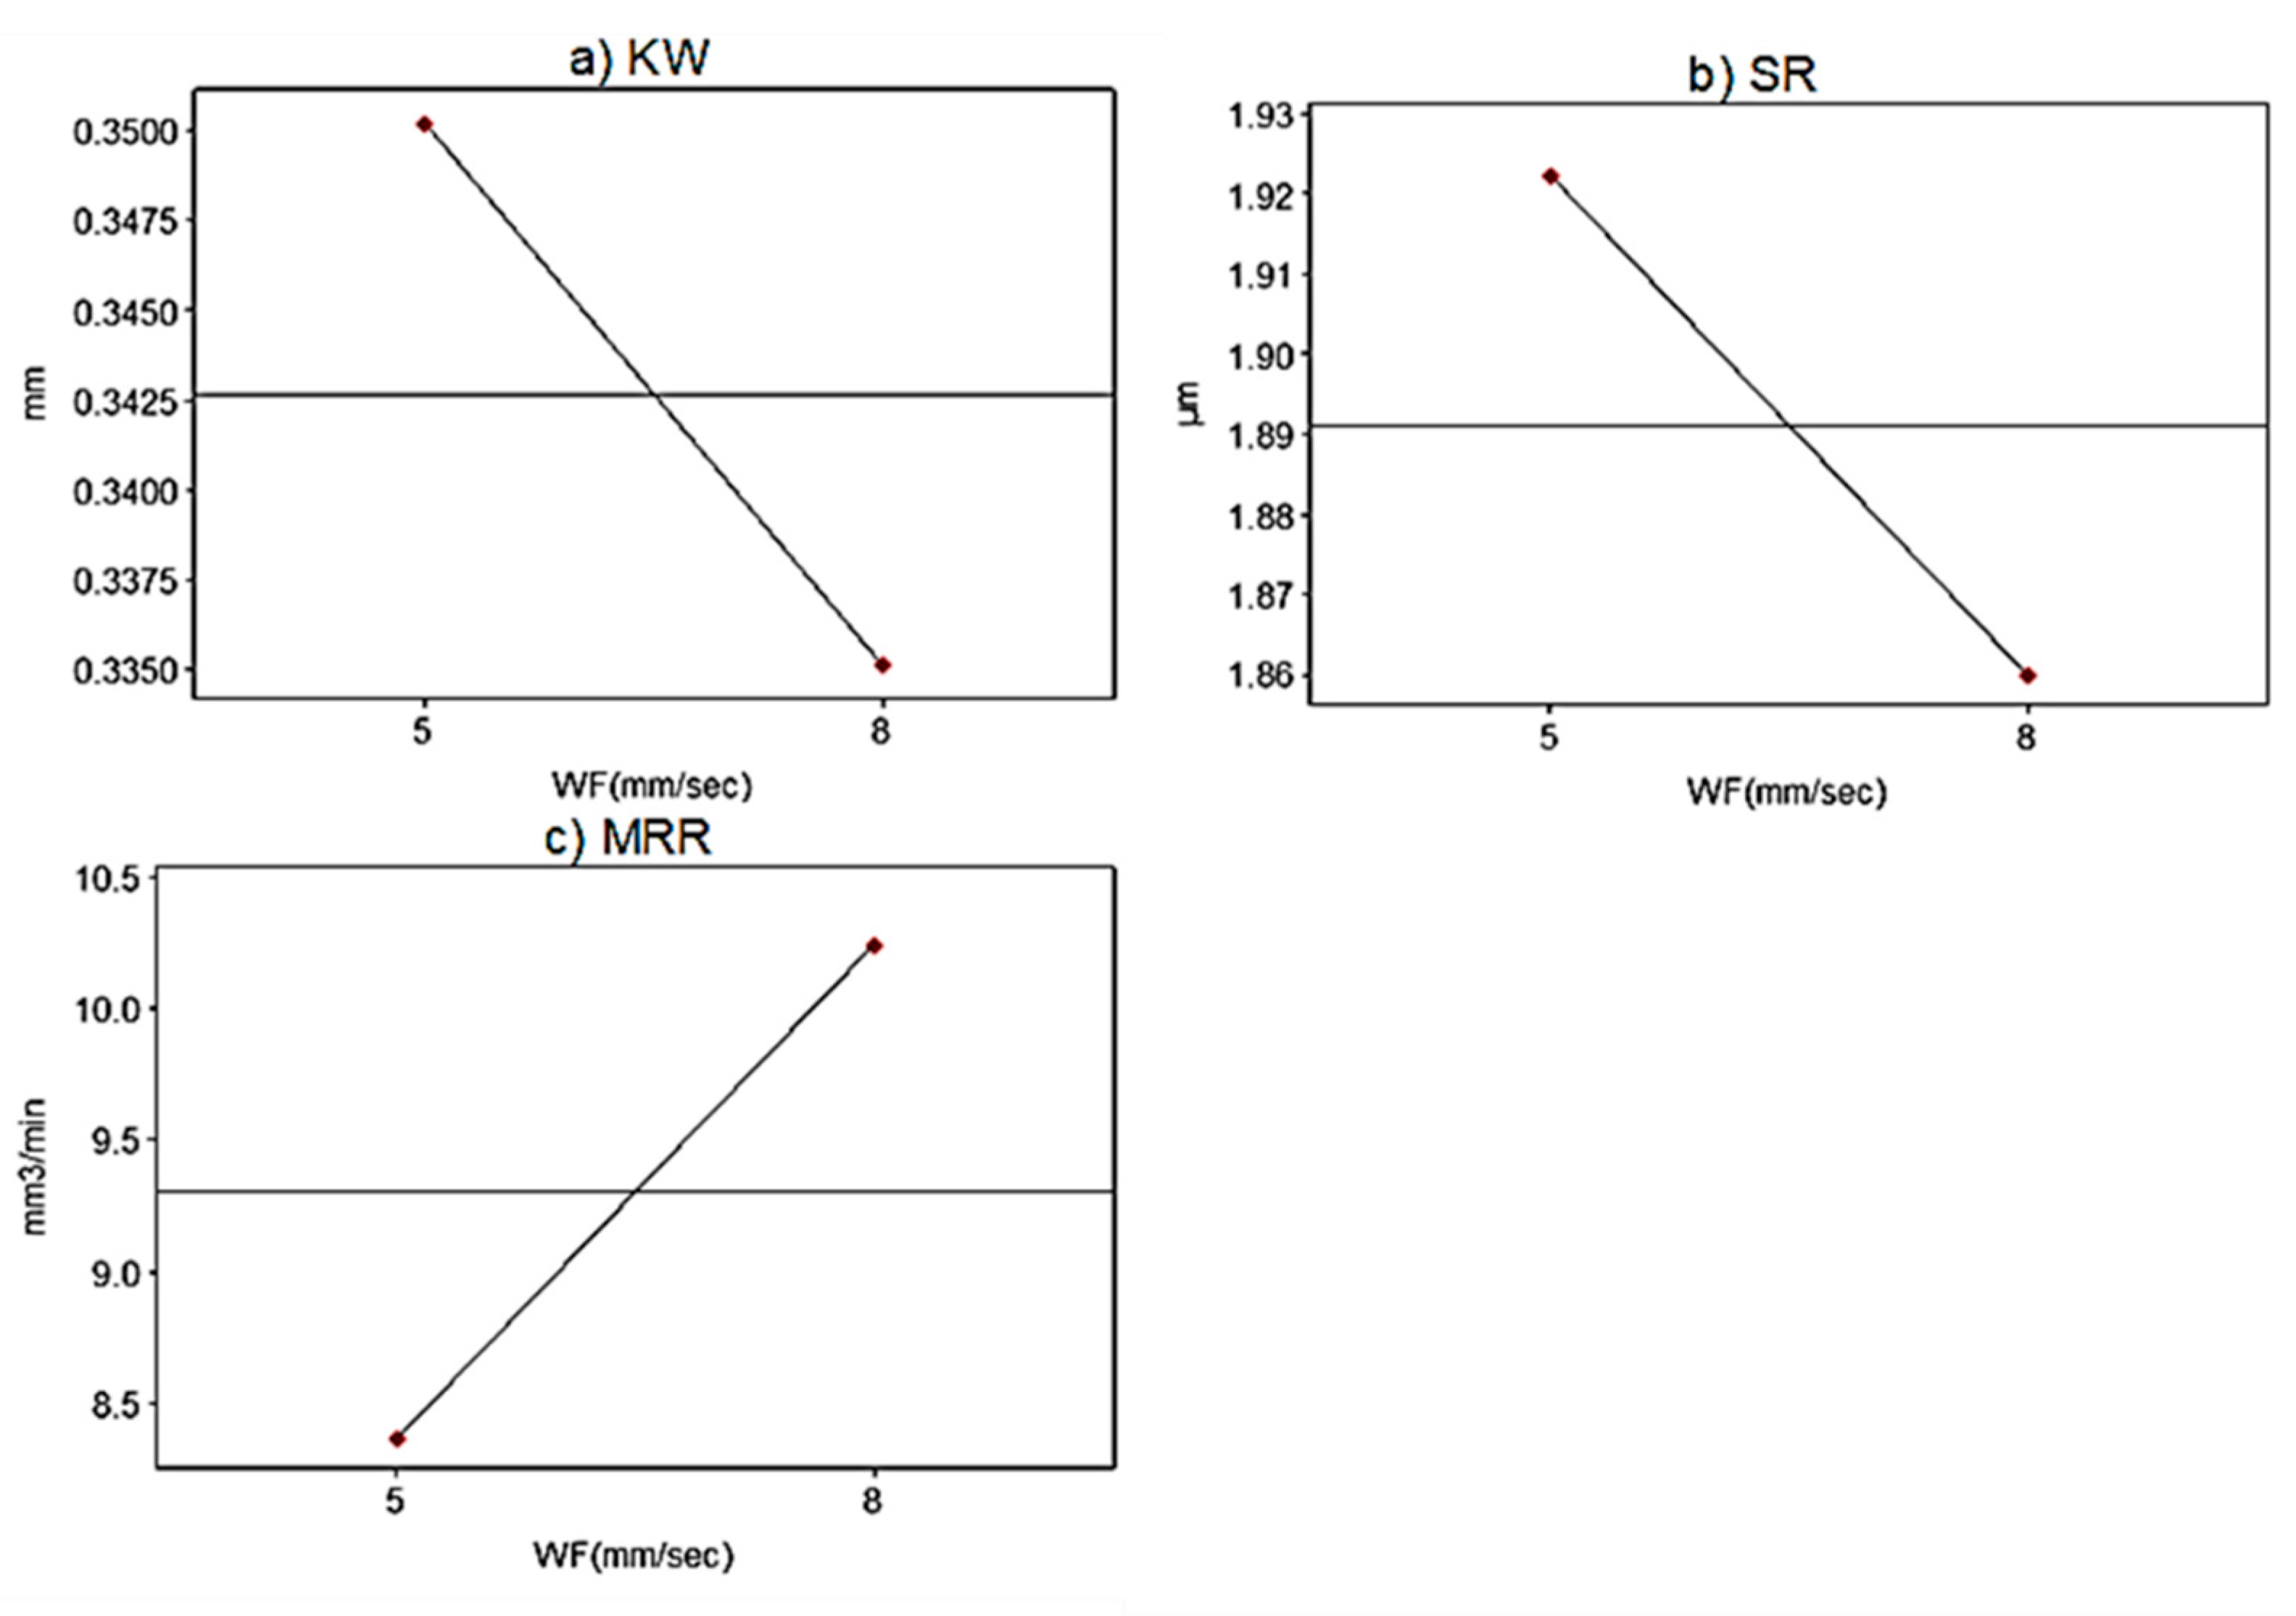
3.2.1. Effects of the Wire Feed
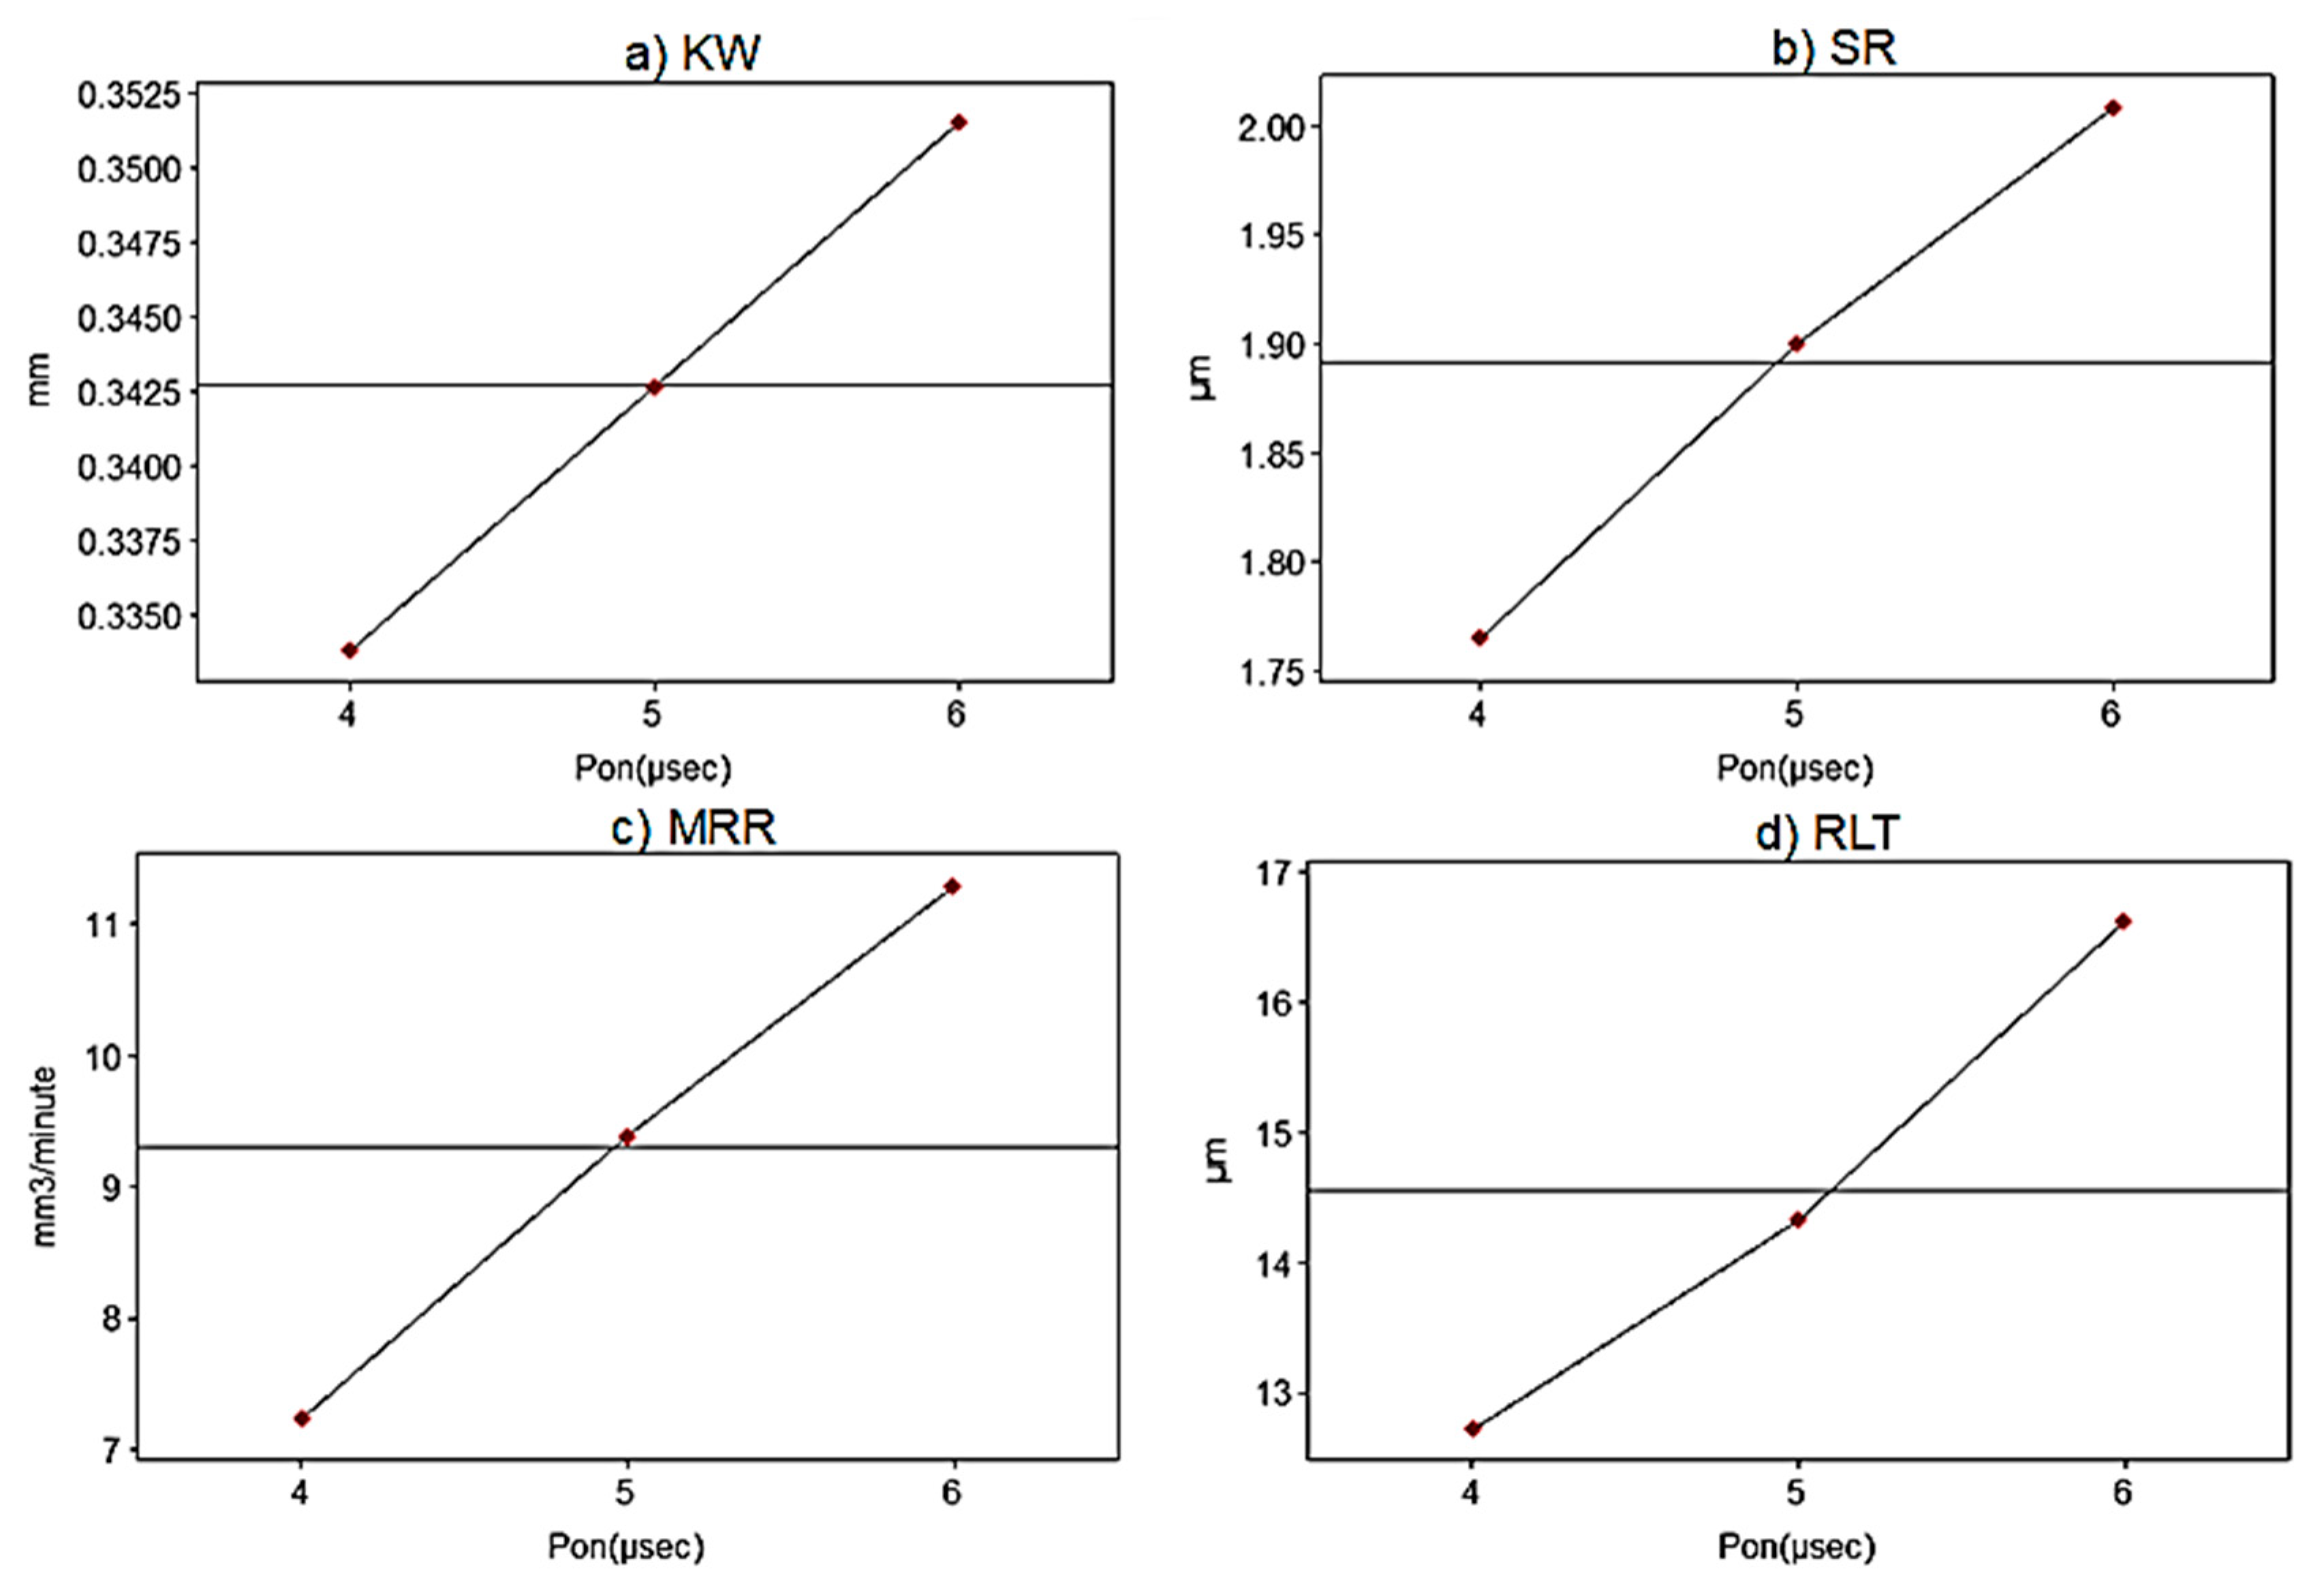
3.2.2. Effects of Pulse-On Duration
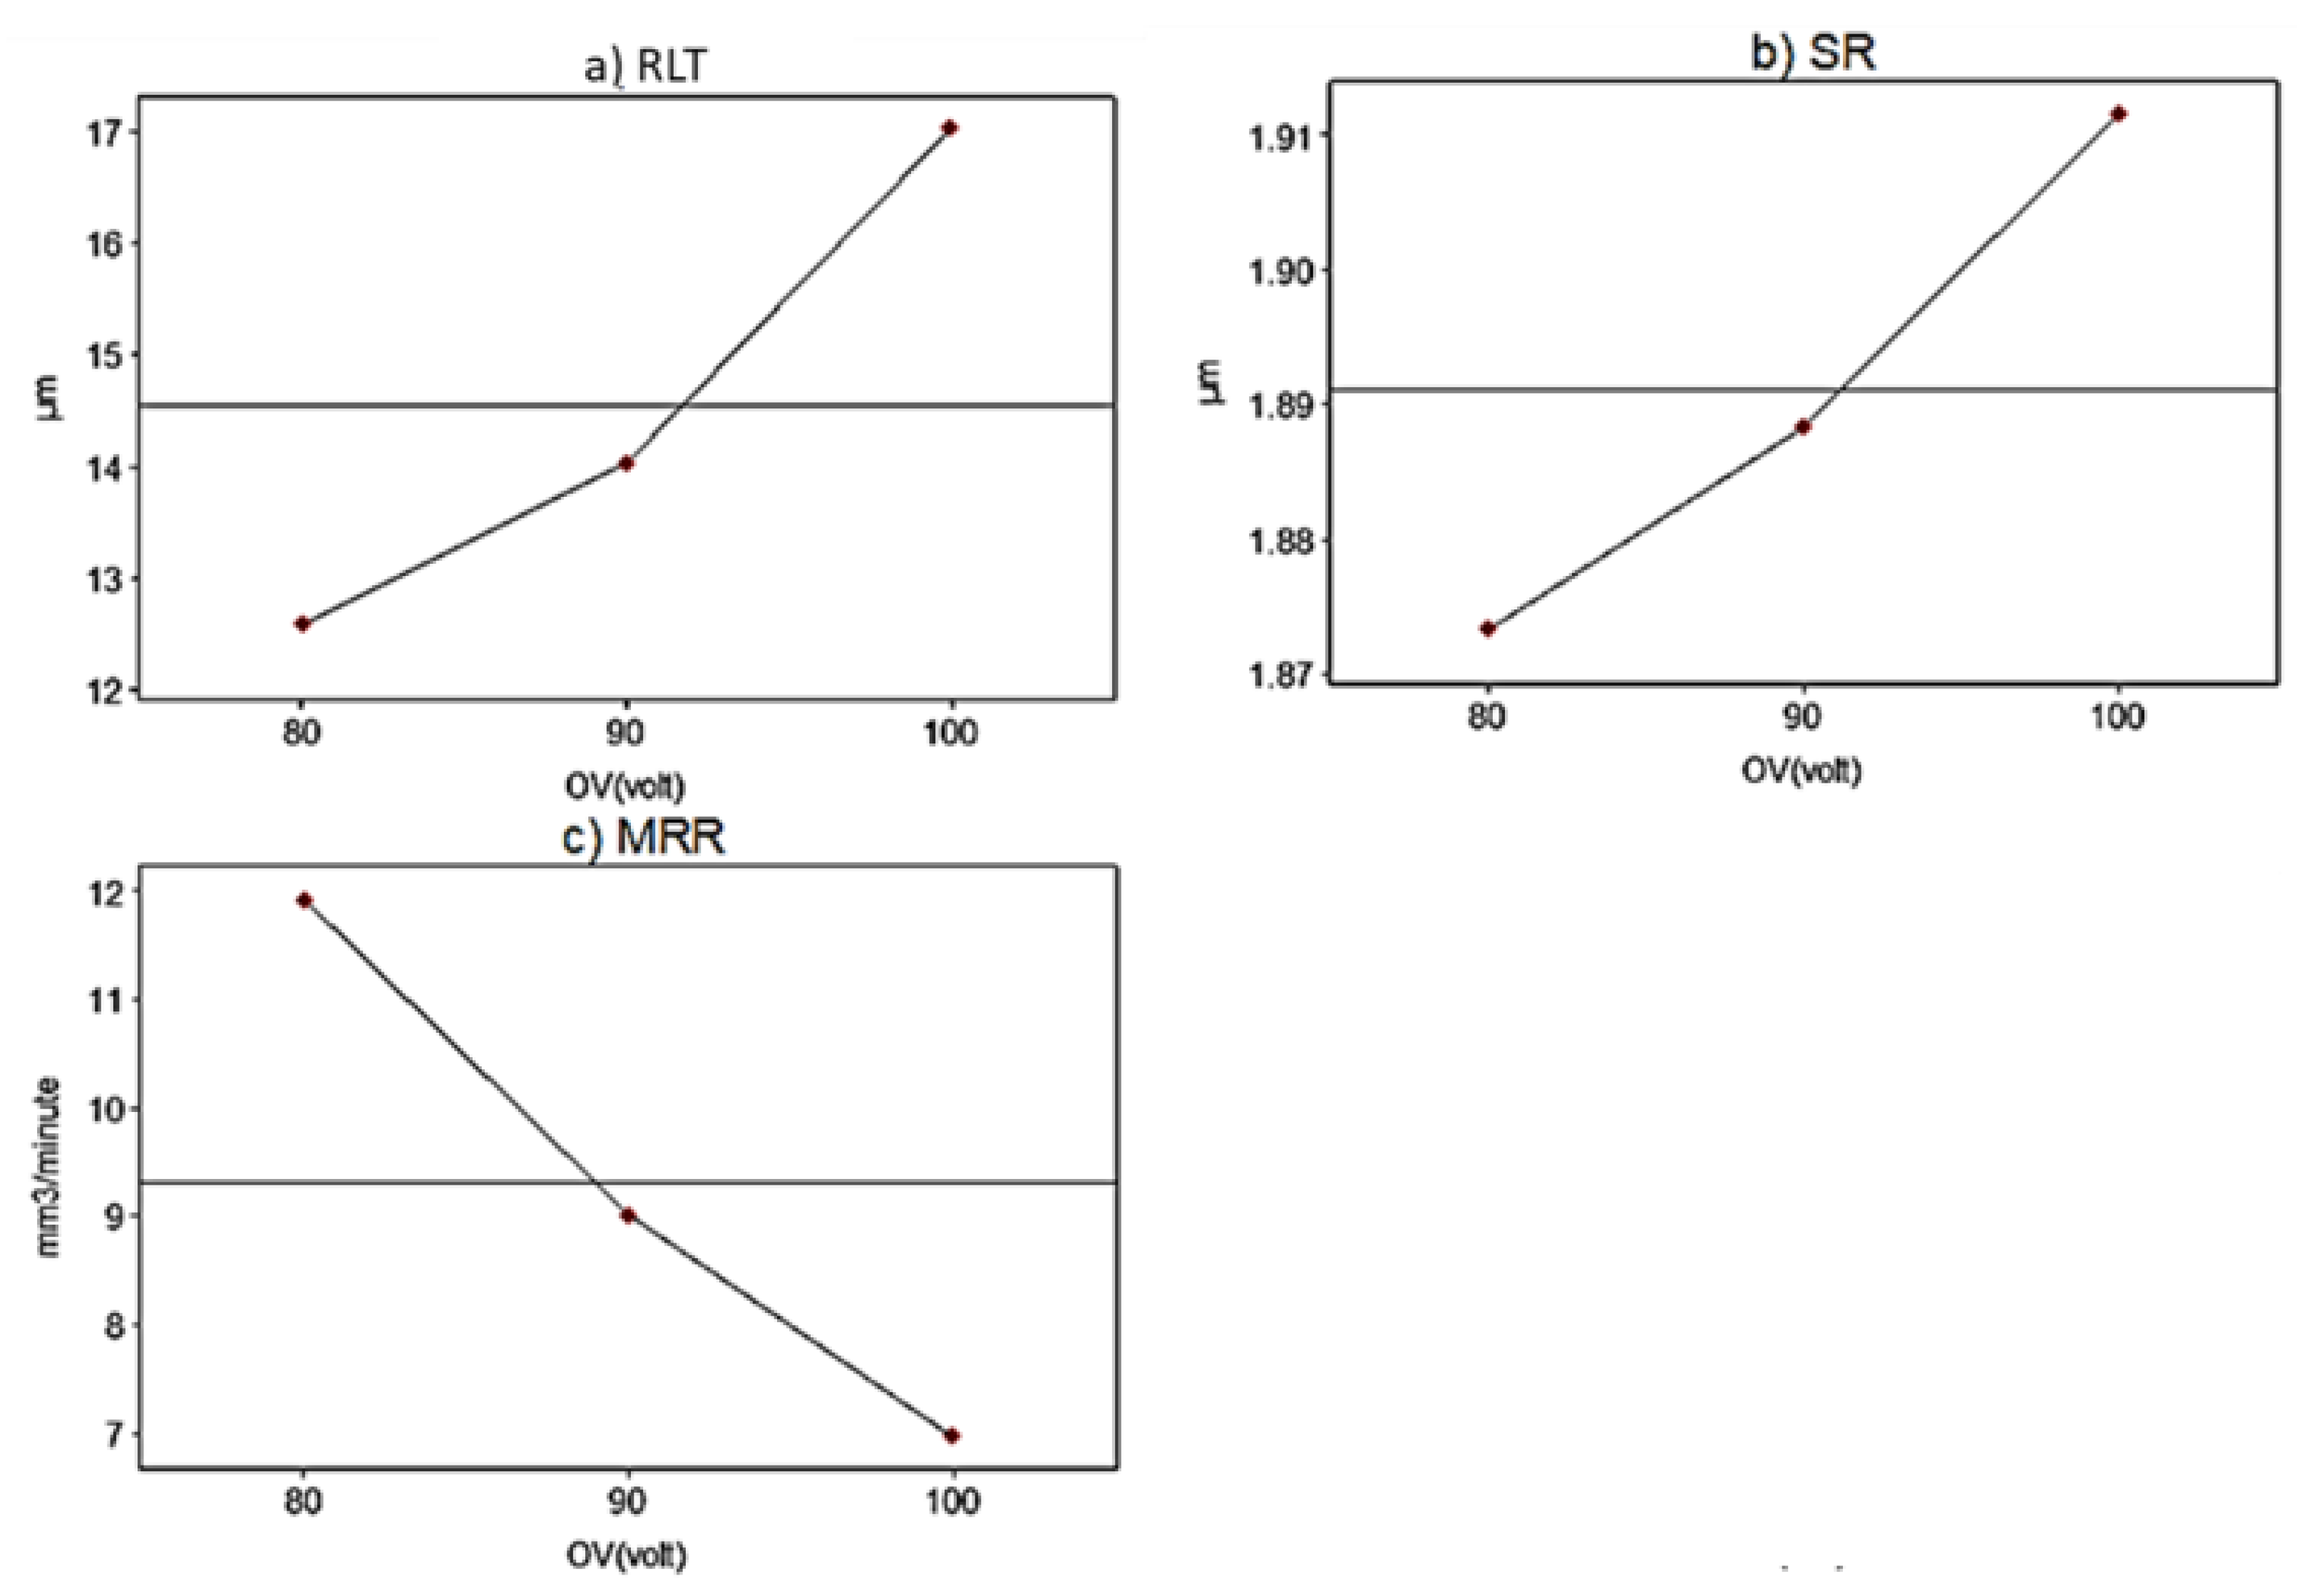
3.2.3. Effects of Open Voltage
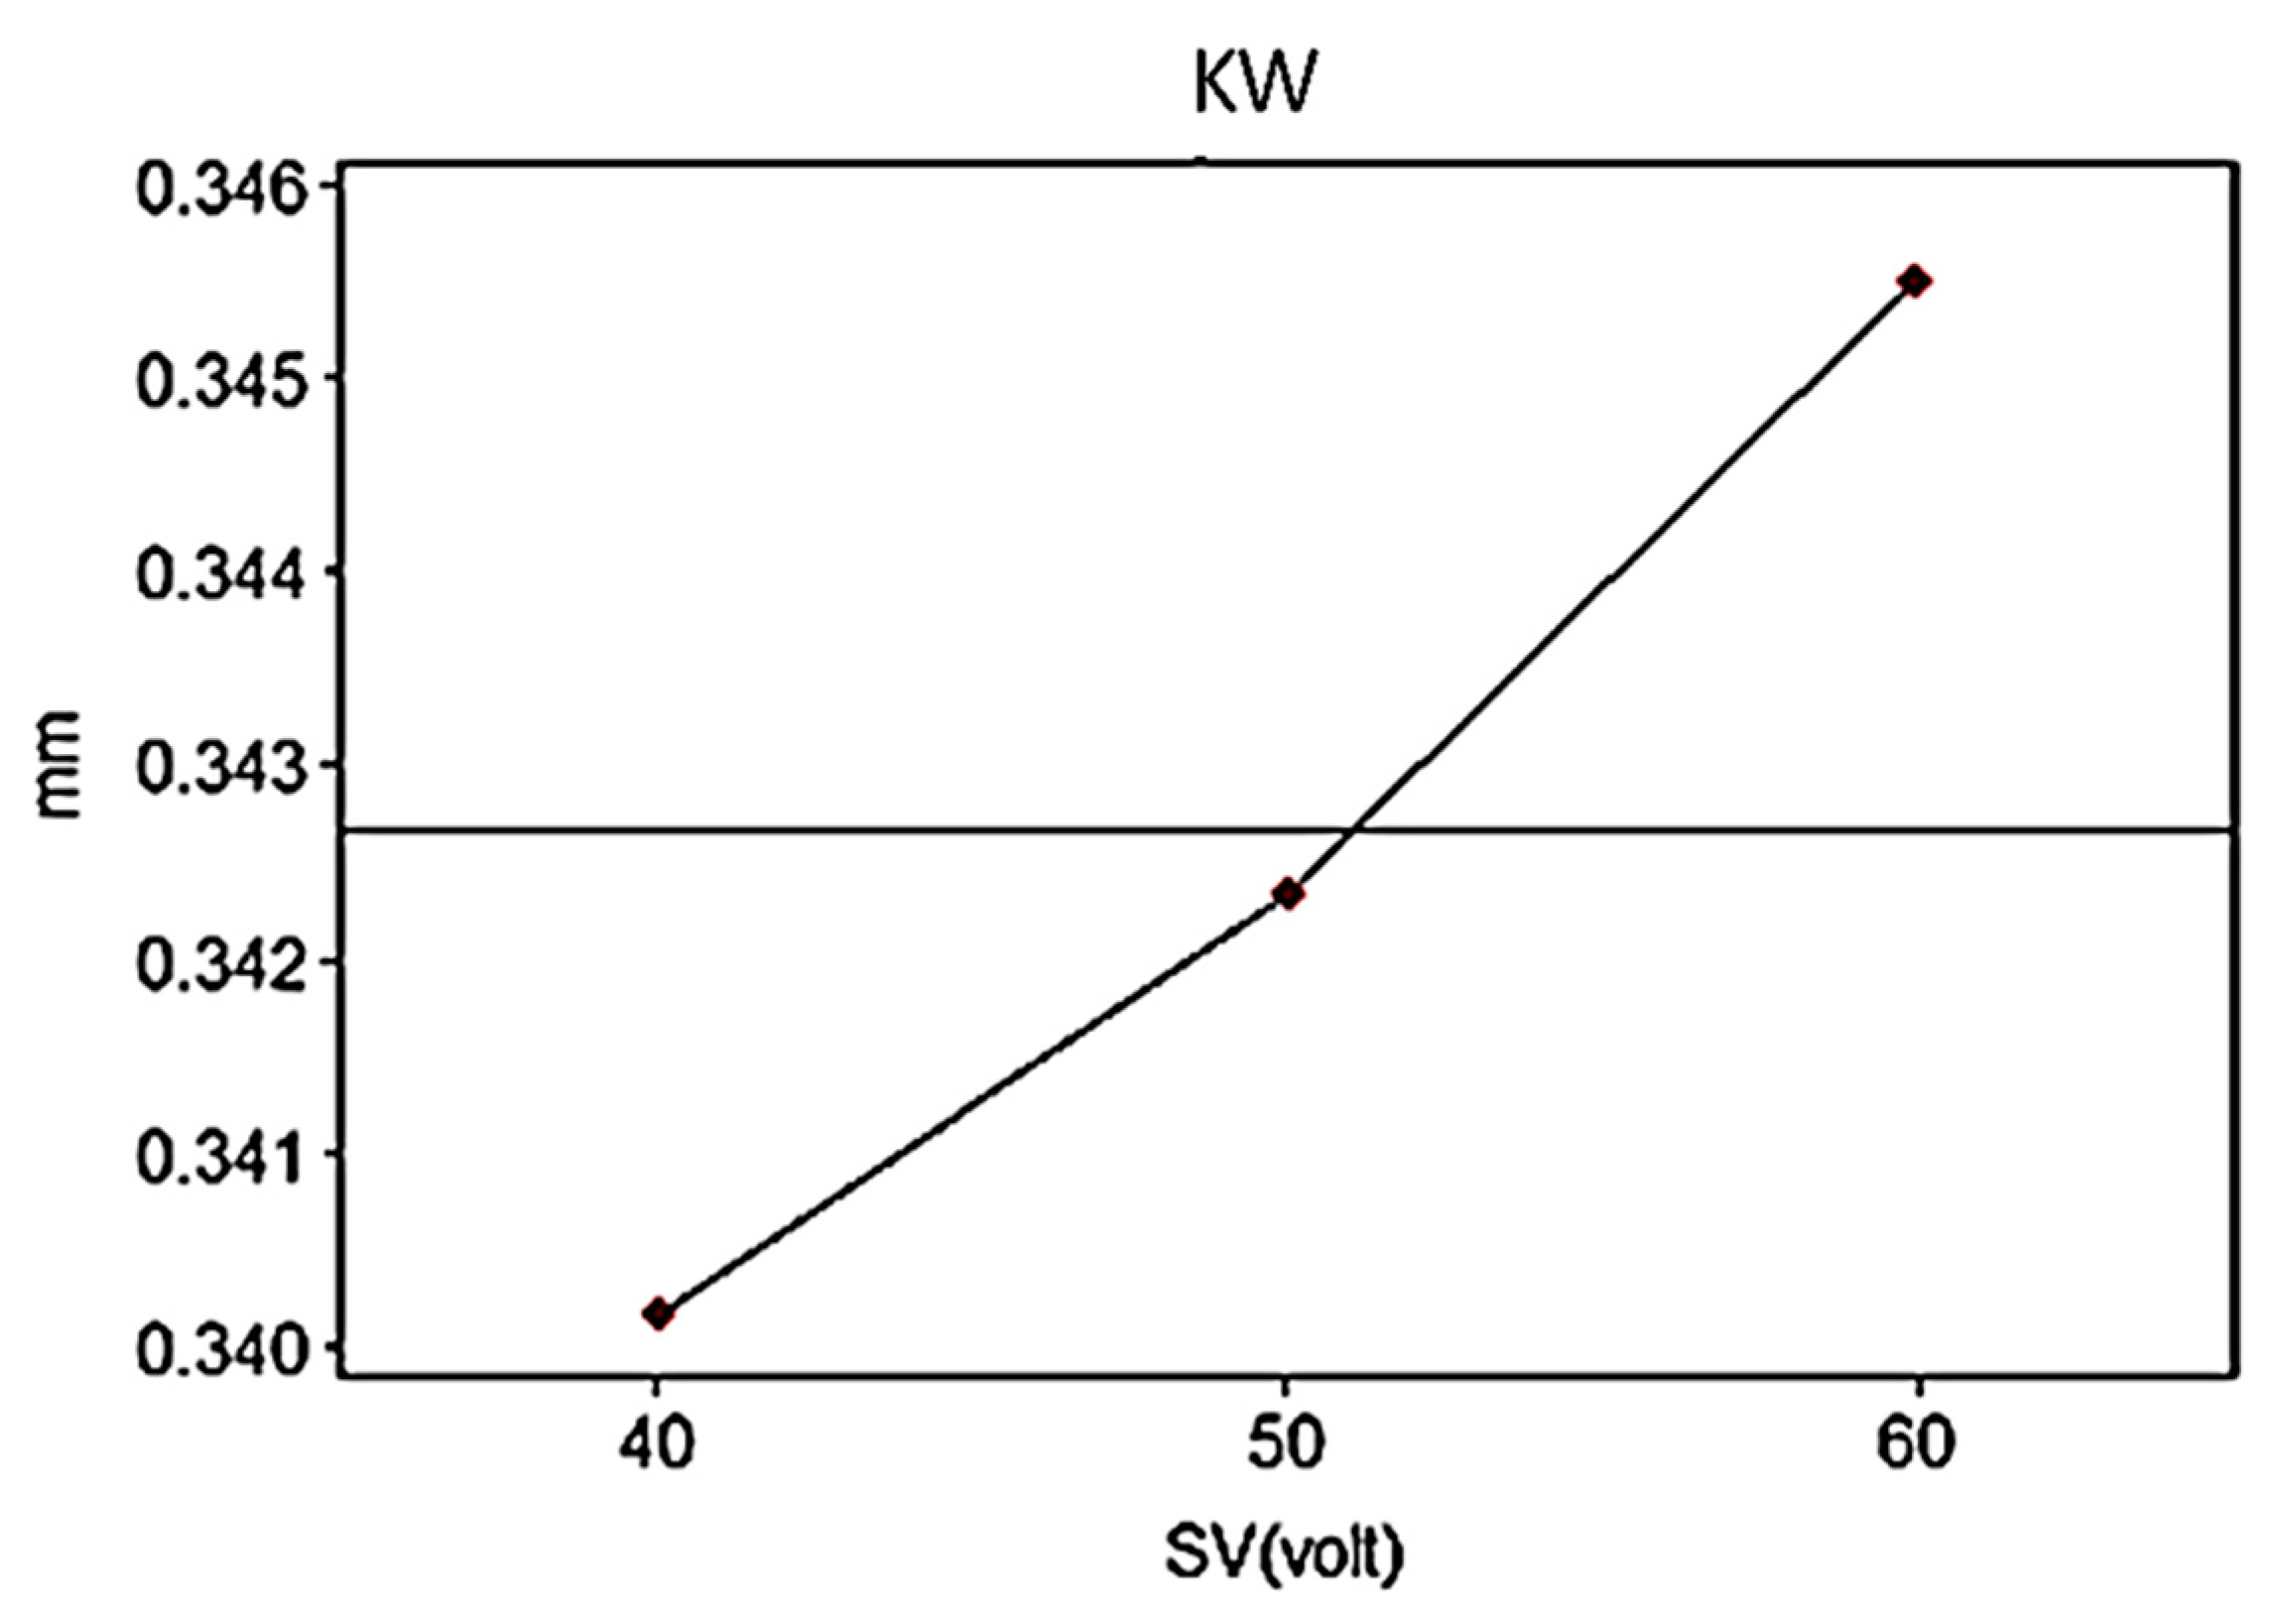
3.2.4. Effects of Servo Voltage
3.3. Mathematical Modelling and Parametric Optimization
3.4. Recast Layer Measurement and Microstructural Evaluation
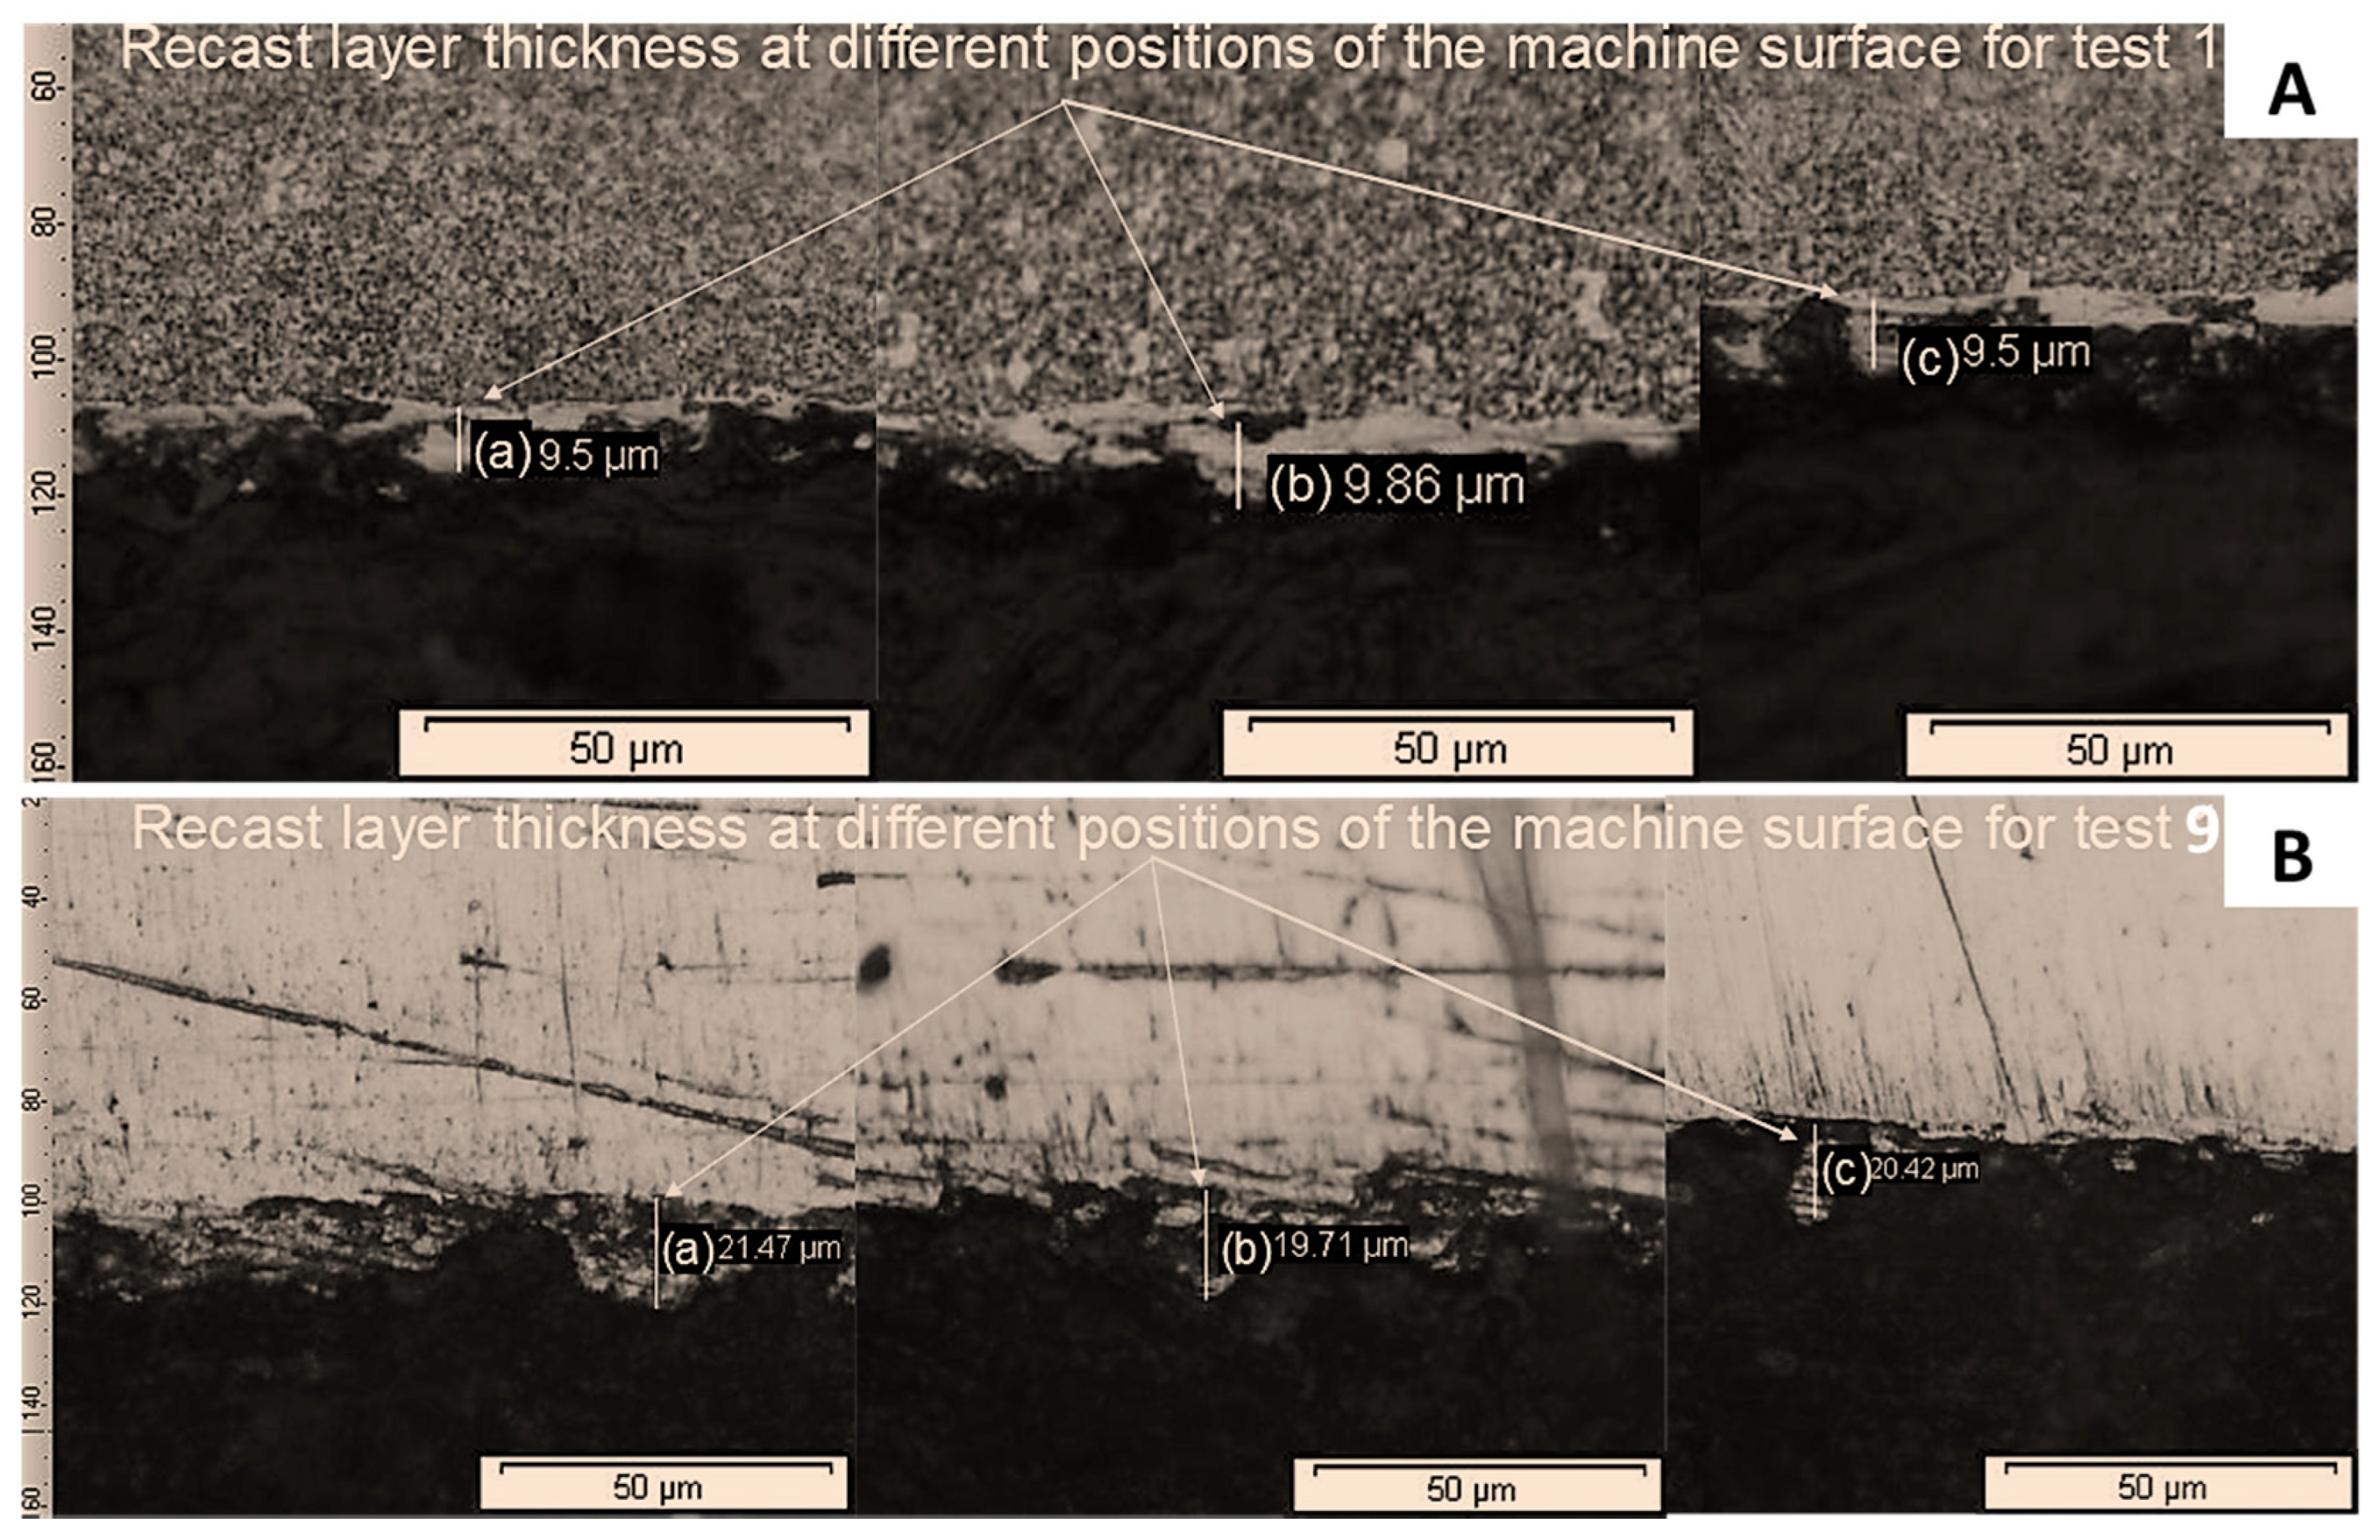
3.4.1. Optical-Based Microscopic Analysis
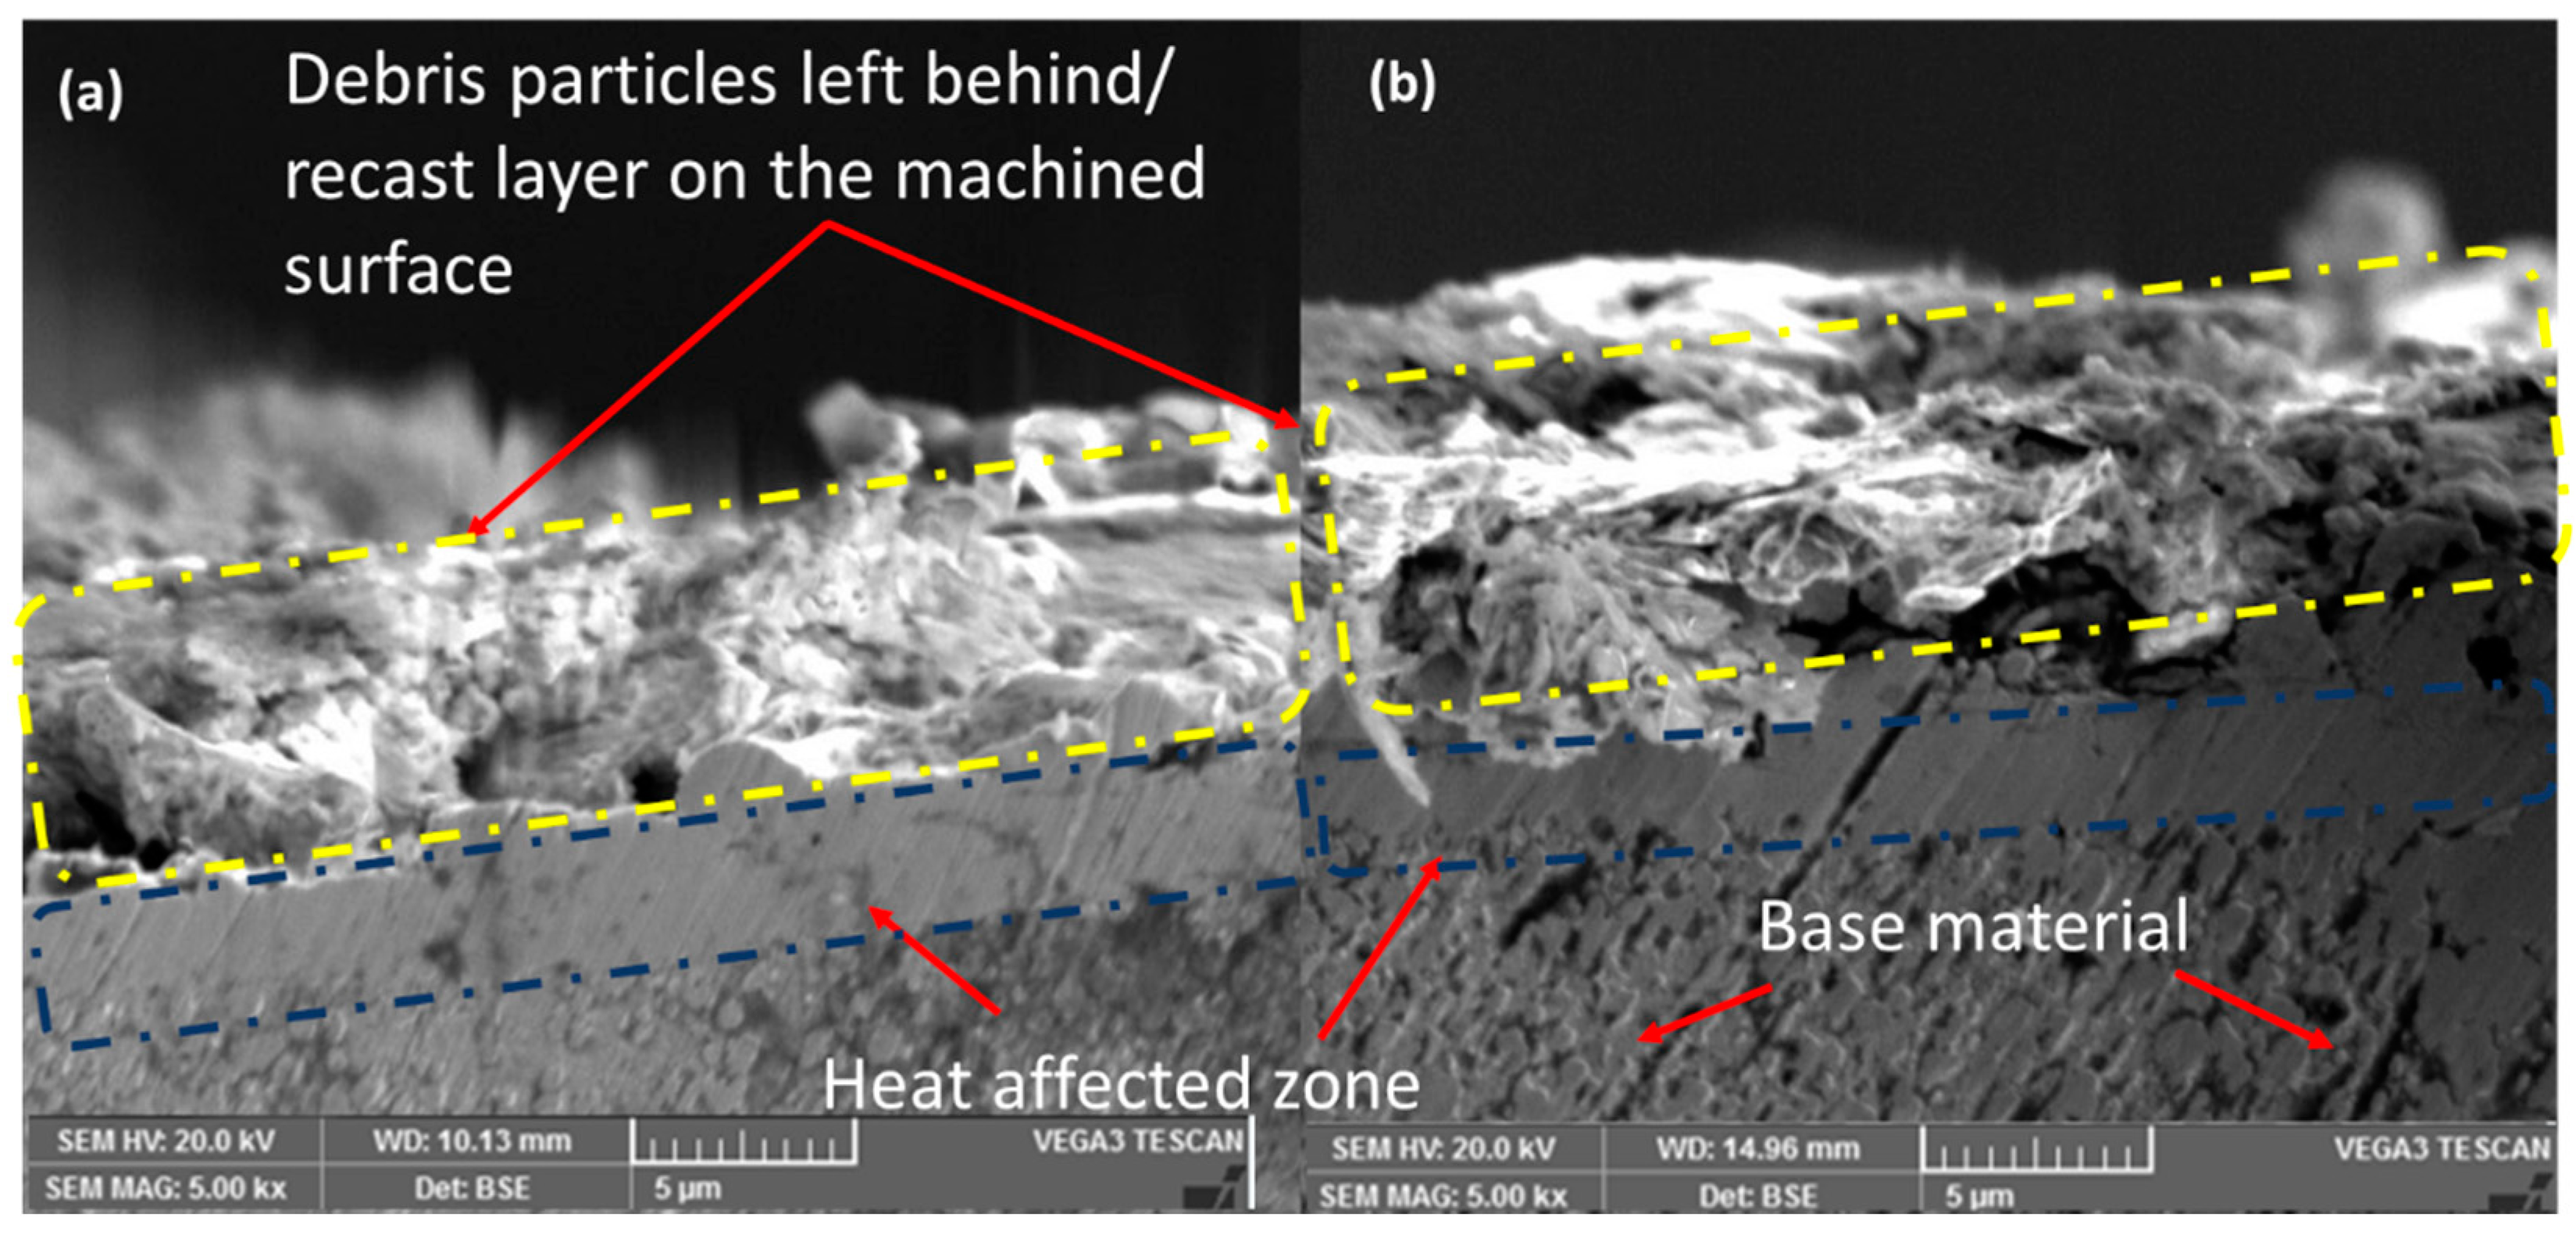
3.4.2. Scanning Electron Microscopic Analysis
3.5. Comparison with Previous Studies
4. Conclusions
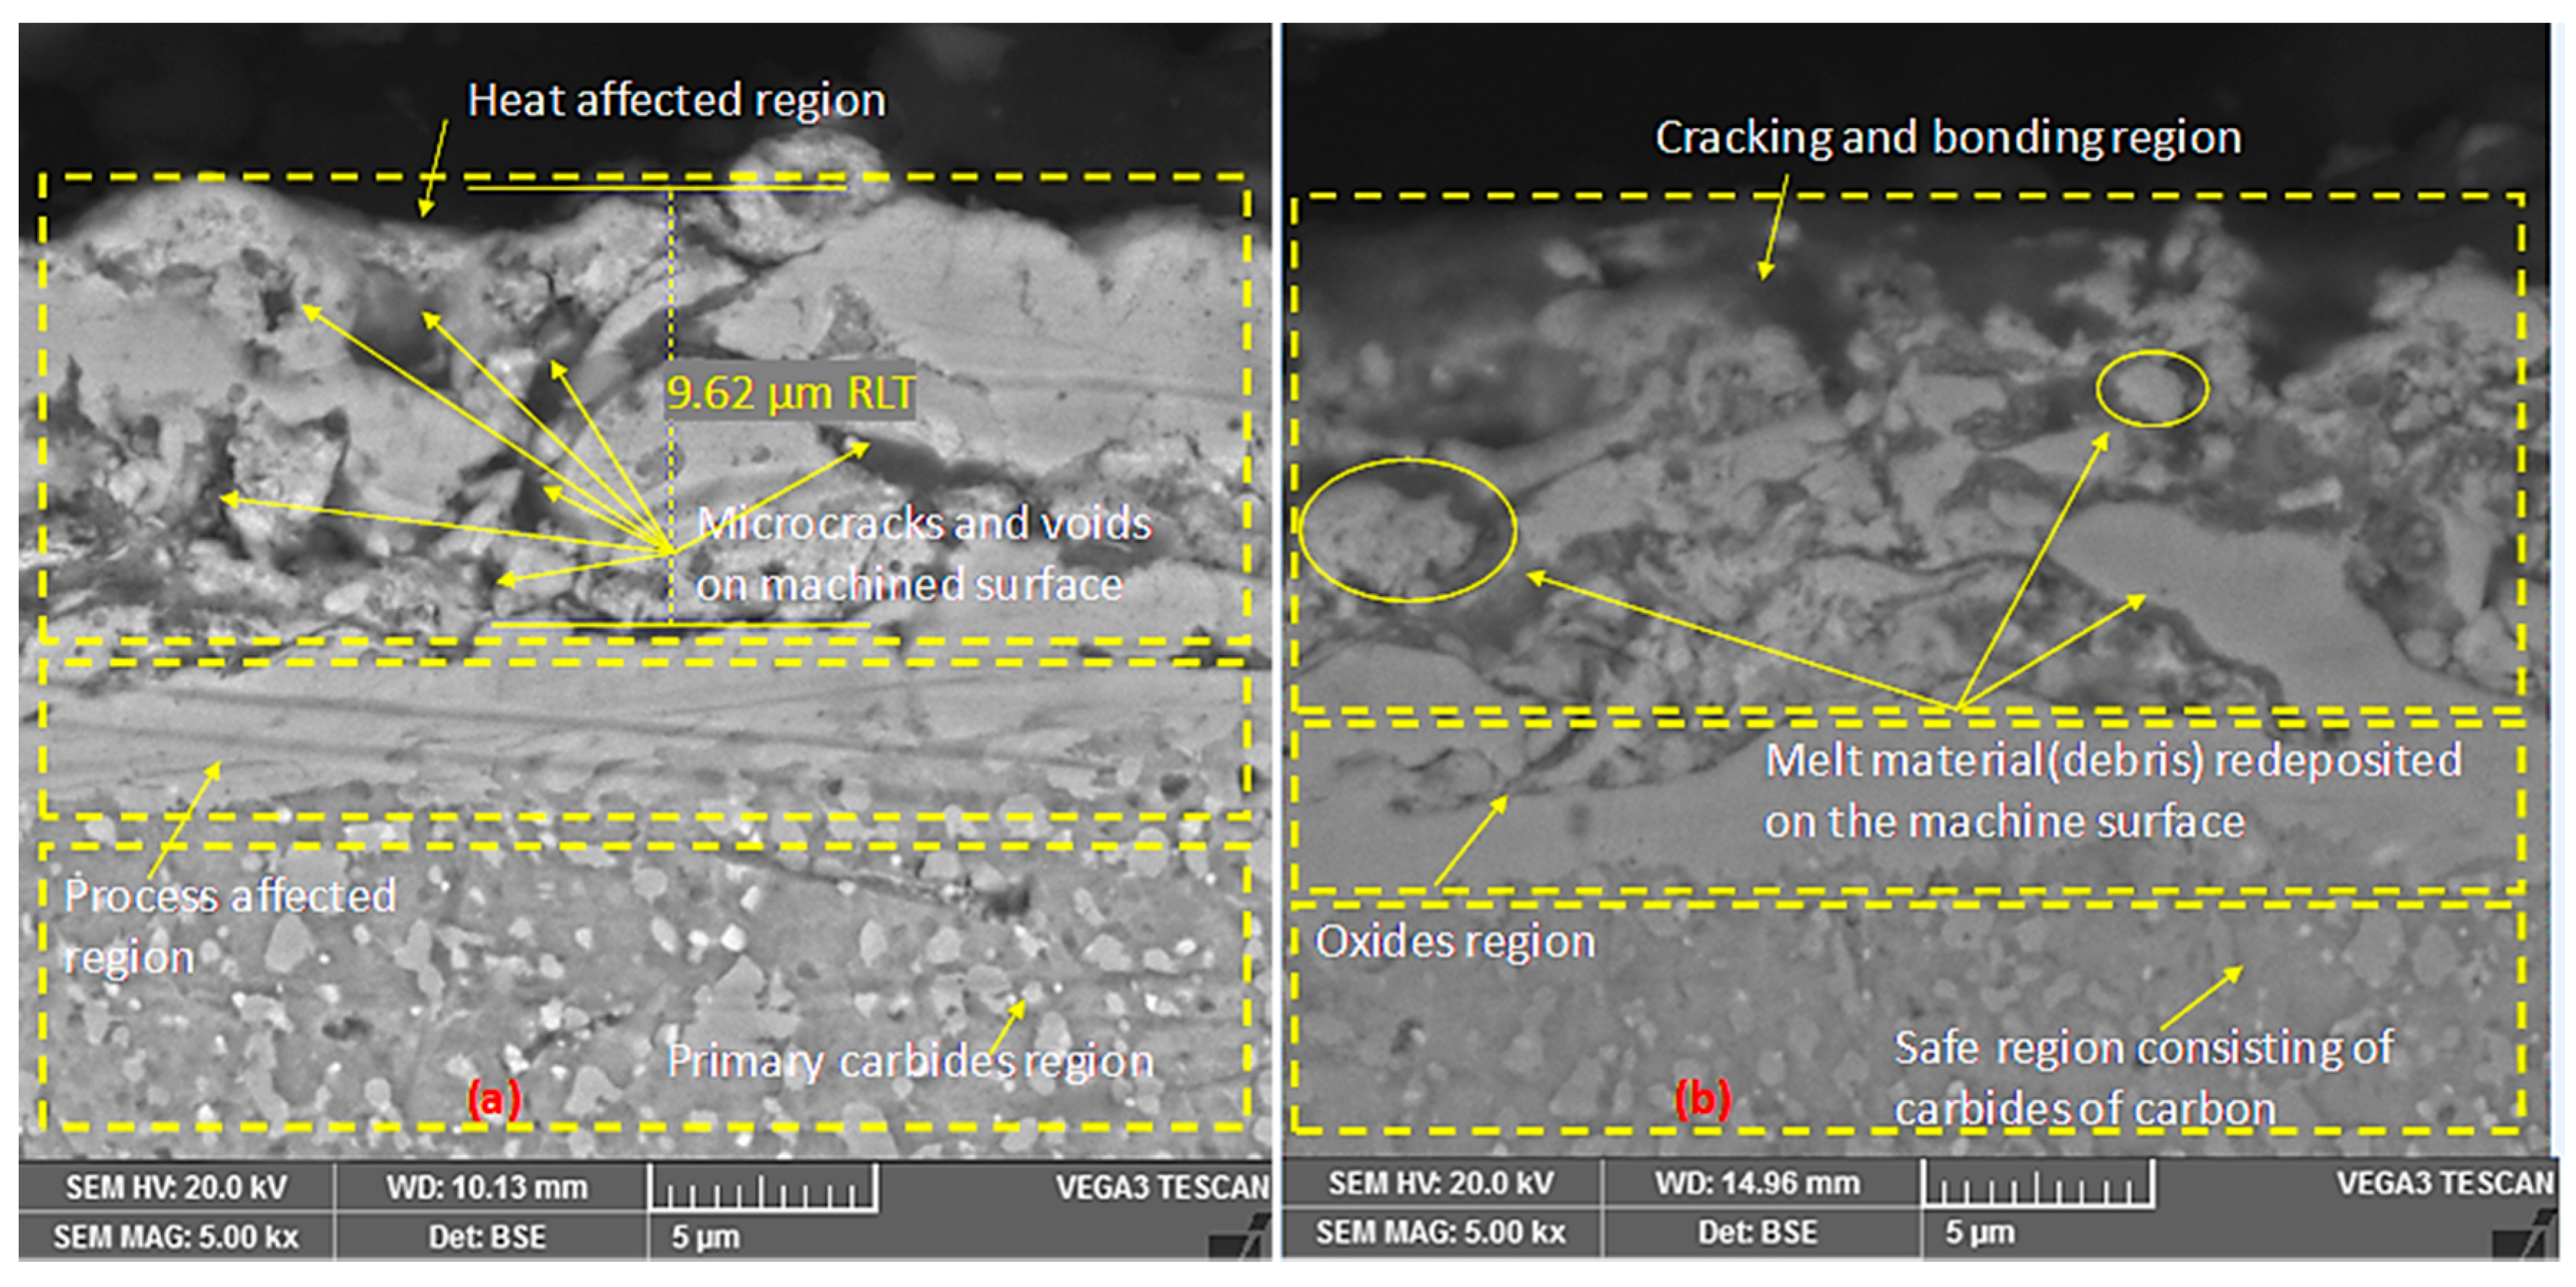
- RLT was directly influenced by varying the Pon and it was observed that SEM examination revealed three surface regions; (i) thermally affected region consisting of debris particles of different sizes and shapes, cracks and craters, (ii) process-affected zone consisting of oxides, and (iii) safe region consisting of the primary carbides of carbon. Minimum average RLT of 9.63 µm was measured and observed after the examination of machined surface morphology.
- The variance analysis results inferred that Pon was found to be the most significant machining variable for all output responses with higher contribution percentages such as SR (84.83%), KW (41.56%), RLT (40.00%), and MRR (32.81%), respectively. High Pon results ina high plasma channel consisting the pool of electrons and ions melted material because of the generation of an adequate heat-affected zone on the machined surface.
- WF (45.64%), Pon (41.56%), and the SV (3.774%) are the significant factors for KW. However, the detailed influential variables for SR include Pon (84.83%), WF (8.320%), OV (2.10%), and SV (1.15%). The significant variables for recast layer thickness involved OV (52.06%) and Pon (40.00%). Open voltage, pulse on duration, and wire feed with percentage contributions of 49.07%, 32.81%, and 10.51%, respectively, are significant for MRR. The rapid transport of wire resulted in less workpiece–wire electrode interaction, and produced a smaller heat-affected zone because of minor thermal damages. Therefore, less molten material was redeposited on the workpiece surface.
- The experimental results reveal that WF influences prominently in reducing KW, SR, and RLT and increasing MRR. All response measures were directly increased by increasing Pon due to the amplified discharge energy of the sparks produced.
- The optimized parameters obtained are “WF 8 mm/s”, “Pon 4 µs”, “OV 80 V” and “SV 56 V” resulting 1.710 µm SR, 10.367 mm3/min MRR, 0.327 mm KW, and 10.443 µm RLT. The regression models (showing less than a 3% error from the physical experimentation) are developed based on a thorough investigation to support the machinists for achieving the required features.
Author Contributions
Funding
Institutional Review Board Statement
Informed Consent Statement
Data Availability Statement
Conflicts of Interest
Abbreviations
| ANOVA | Analysis of variance |
| CMM | Coordinate measuring machine |
| DOE | Design of experiments |
| HAZ | Heat affected zone |
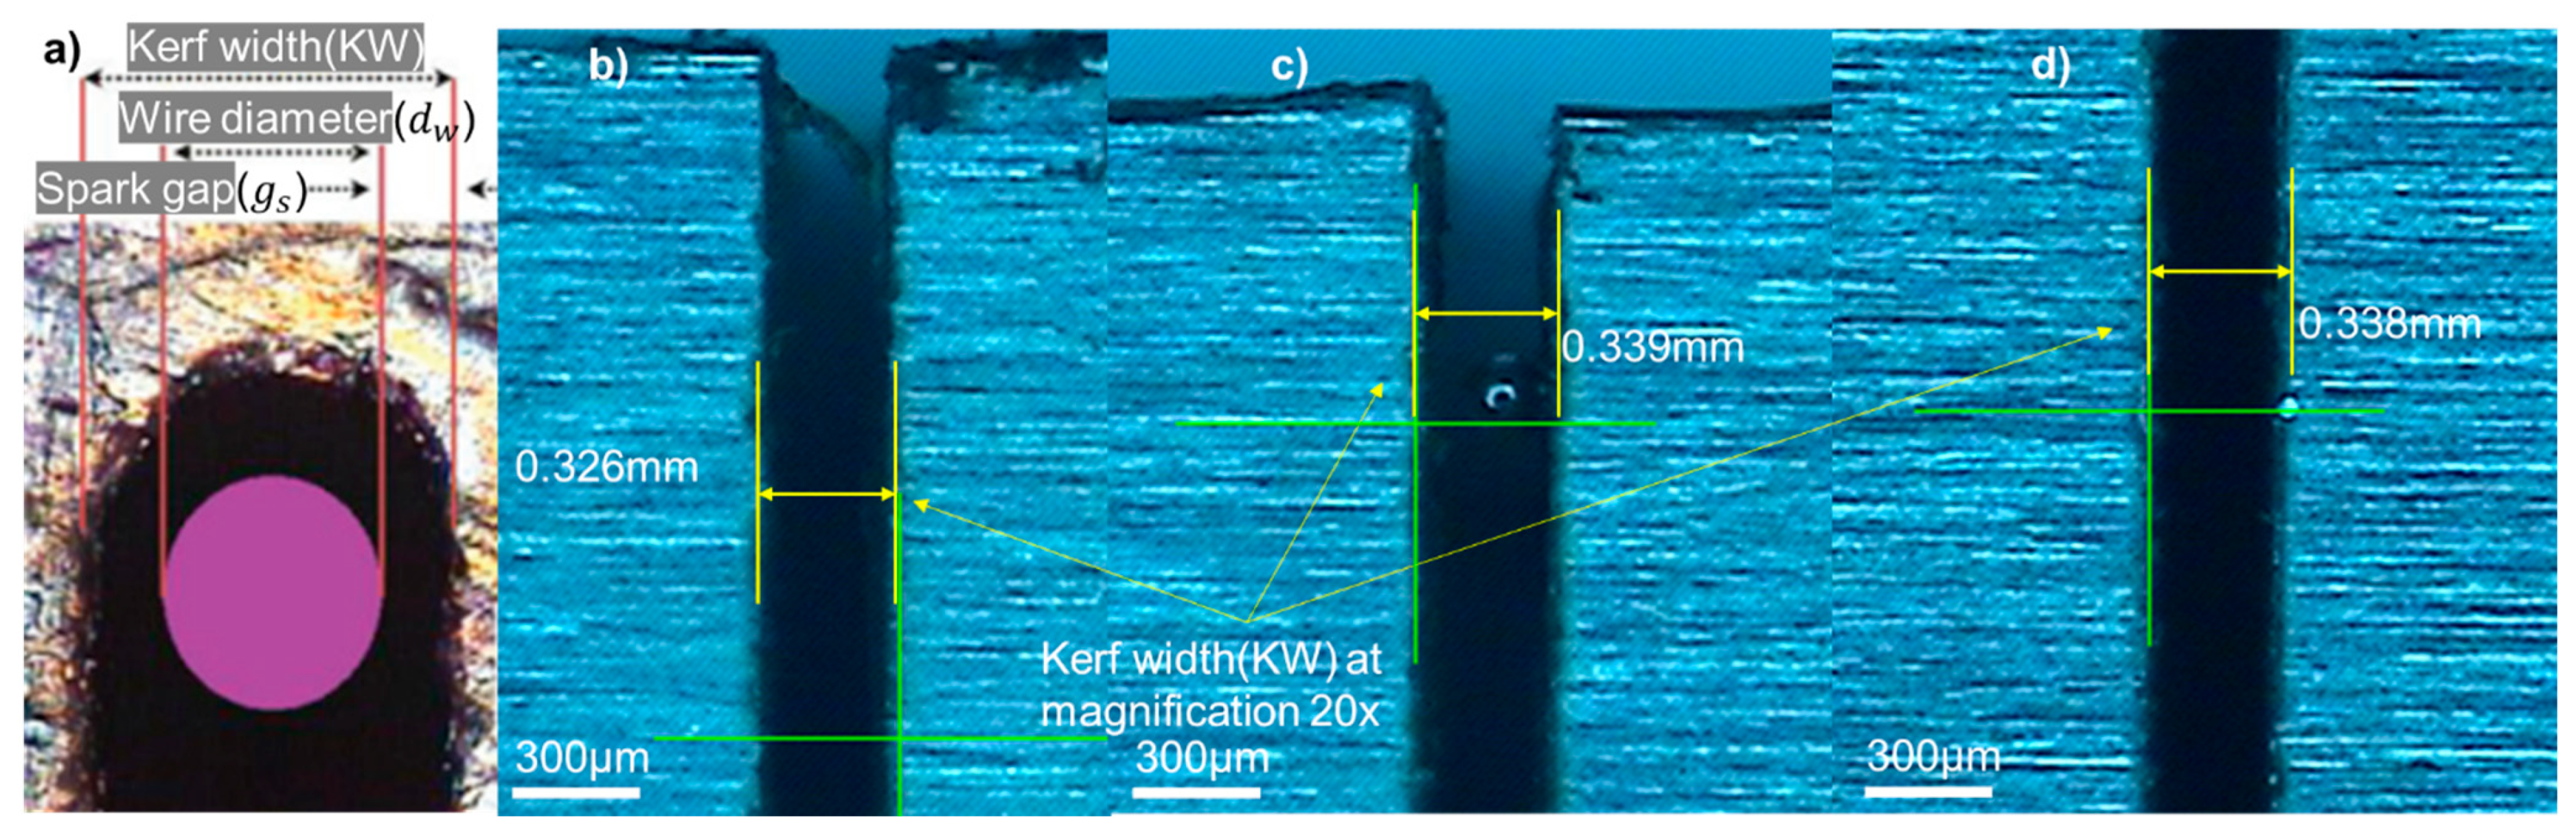
| KW | Kerf width (µm) |
| MRR | Material removal rate (mm3/min) |
| OV | Open voltage (volt) |
| OA | Orthogonal array |
| ⍴ | Density (kg⁄m3) |
| PCR | Percent contribution (%) |
| Pon | Pulse on duration (µs) |
| Poff | Pulse off time (µs) |
| RLT | Recast layer thickness (µm) |
| SR | Surface roughness (µm) |
| SV | Servo voltage (volt) |
| SEM | Scanning electron microscopy |
| WEDM | Wire electric discharge machining |
| WF | Wire feed (mm/s) |
| WT | Wire tension (gms-f) |
| Wb | Weight of the workpiece prior machining (g) |
| Wa | Weight of the workpiece prior after machining (g) |
References
- Kanlayasiri, K.; Boonmung, S. Effects of wire-EDM machining variables on surface roughness of newly developed DC 53 die steel: Design of experiments and regression model. J. Mater. Process. Technol. 2007, 192–193, 459–464. [Google Scholar] [CrossRef]
- Singh, V.; Bhandari, R.; Yadav, V.K. An experimental investigation on machining parameters of AISI D2 steel using WEDM. Int. J. Adv. Manuf. Technol. 2017, 93, 203–214. [Google Scholar] [CrossRef]
- Durairaj, M.; Sudharsun, D.; Swamynathan, N. Analysis of process parameters in wire EDM with stainless steel using single objective Taguchi method and multi objective grey relational grade. Procedia Eng. 2013, 64, 868–877. [Google Scholar] [CrossRef] [Green Version]
- Zhang, G.; Zhang, Z.; Guo, J.; Ming, W.; Li, M.; Huang, Y. Modeling and optimization of medium-speed WEDM process parameters for machining SKD11. Mater. Manuf. Process. 2013, 28, 1124–1132. [Google Scholar] [CrossRef]
- Lodhi, B.K.; Agarwal, S. Optimization of machining parameters in WEDM of AISI D3 steel using taguchi technique. Procedia CIRP 2014, 14, 194–199. [Google Scholar] [CrossRef] [Green Version]
- Thiagarajan, C.; Sararvanan, M.; Senthil, J. Performance Evaluation of Wire Electro Discharge Machining on D3-Tool Steel. Int. J. Pure Appl. Math. 2018, 118, 943–949. [Google Scholar]
- Manjaiah, M.; Laubscher, R.F.; Kumar, A.; Basavarajappa, S. Parametric optimization of MRR and surface roughness in wire electro discharge machining (WEDM) of D2 steel using Taguchi-based utility approach. Int. J. Mech. Mater. Eng. 2016, 11, 7. [Google Scholar] [CrossRef] [Green Version]
- Ikram, A.; Mufti, N.A.; Saleem, M.Q.; Khan, A.R. Parametric optimization for surface roughness, kerf and MRR in wire electrical discharge machining (WEDM) using Taguchi design of experiment. J. Mech. Sci. Technol. 2013, 27, 2133–2141. [Google Scholar] [CrossRef]
- Vaghela, J.R.; Valaki, J.B.; Pandit, J.H. Parametric Optimization of Machining Parameters of AISI D3 Tool Steel Using Wire Cut Electric Discharge Machining—A Taguchi Based Approach. Natl. Conf. Emerg. Res. Trends Eng. 2016. Available online: https://www.researchgate.net/publication/300262070 (accessed on 22 March 2021).
- Zhang, G.; Zhang, Z.; Guo, J.; Ming, W.; Li, M.; Huang, Y.; Shao, X. The multi-objective optimization of medium-speed WEDM process parameters for machining SKD11 steel by the hybrid method of RSM and NSGA-II. Int. J. Adv. Manuf. 2014, 70, 2097–2109. [Google Scholar] [CrossRef]
- Rupajati, P.; Soepangkat, B.O.P.; Pramujati, B.; Agustin, H.C.K. Optimization of Recast Layer Thickness and Surface Roughness in the Wire EDM Process of AISI H13 Tool Steel Using Taguchi and Fuzzy Logic. Appl. Mech. Mater. 2014, 493, 529–534. [Google Scholar] [CrossRef]
- Hasriadi, B.O.P.; Soepangkat, H.S. The Effects of Pulse on Time and Arc on Time on Surface Quality in Wire-EDM of ASSAB XW-42 and ASSAB 8407 2M Tool Steels. Appl. Mech. Mater. 2016, 836, 173–178. [Google Scholar] [CrossRef]
- Hernández-Castillo, I.; Sánchez-López, O.; Lancho-Romero, G.A.; Castañeda-Roldán, C.H. An experimental study of surface roughness in electrical discharge machining of AISI 304 stainless steel. Eng. Res. 2018, 38, 90–96. [Google Scholar] [CrossRef]
- Saini, T.; Goyal, K.; Bhandari, D. Multi-response optimization of WEDM parameters on machining 16MnCr5 alloy steel using Taguchi technique. Multiscale Multidiscip. Model. Exp. Des. 2018. [Google Scholar] [CrossRef]
- Oßwald, K.; Lochmahr, I.; Schulze, H.P.; Kröning, O. Automated Analysis of Pulse Types in High Speed Wire EDM. Procedia CIRP 2018, 68, 796–801. [Google Scholar] [CrossRef]
- Solomon, R.S.; Sevvel, P.; Jaiganesh, V.; Satheesh, C. An Investigational Review on Influence of Performance Parameters during Wire Electrical Discharge Machining of Various Grades of Steels. J. Adv. Res. Dyn. Cont. Sys. 2017, 9, 101–109. [Google Scholar]
- Shivade, A.S.; Shinde, V.D. Multi-objective optimization in WEDM of D3 tool steel using integrated approach of Taguchi method & Grey relational analysis. J. Ind. Eng. Int. 2014, 10, 149–162. [Google Scholar] [CrossRef] [Green Version]
- Azam, M.; Jahanzaib, M.; Abbasi, J.A.; Wasim, A. Modeling of cutting speed (CS) for HSLA steel in wire electrical discharge machining (WEDM) using moly wire. J. Chin. Inst. Engr. 2016, 39, 802–808. [Google Scholar] [CrossRef]
- Dhobe, M.M.; Chopde, I.K.; Gogte, C.L. Investigations on Surface Characteristics of Heat Treated Tool Steel after Wire Electro-Discharge Machining Investigations on Surface Characteristics of Heat Treated Tool Steel after Wire Electro-Discharge Machining. Mater. Manuf. Process. 2013, 28, 1143–1146. [Google Scholar] [CrossRef]
- Khanna, R.; Singh, H. Comparison of optimized settings for cryogenic-treated and normal D-3 steel on WEDM using grey relational theory. Proc. Inst. Mech. Eng. Part L J. Mater. Des. Appl. 2016, 230, 219–232. [Google Scholar] [CrossRef]
- Sharma, S.; Kumar Vates, U.; Bansal, A. Parametric optimization in wire EDM of D2 tool steel using Taguchi method. Mater. Today Proc 2020. [Google Scholar] [CrossRef]
- Ramaswamy, A.; Perumal, A.V.; Jagadeesan, J.; Nagarajan, H.V. Optimization of WEDM process parameters for D3 die steel using RSM. Mater. Today Proc. 2020, 37, 2063–2069. [Google Scholar] [CrossRef]
- Payla, A.; Chopra, K.; Mussada, E.K. Investigations on power consumption in WEDM of EN31 steel for sustainable production. Mater. Manuf. Process. 2019, 34, 1855–1865. [Google Scholar] [CrossRef]
- Chen, X.; Wang, Z.; Wang, Y.; Chi, G. Investigation on MRR and Machining Gap of Micro Reciprocated Wire-EDM for SKD11. Int. J. Precis. Eng. Manuf. 2020, 21, 11–22. [Google Scholar] [CrossRef]
- Singh, S.; Maheshwari, S.; Pandey, P.C. Some investigations into the electric discharge machining of hardened tool steel using different electrode materials. J. Mater. Process. Technol. 2004, 149, 272–277. [Google Scholar] [CrossRef]
- Abdulkareem, S.; Khan, A.A.; Zain, Z.M. Experimental investigation of machining parameters on surface roughness in dry and wet wire-electrical discharge machining. Adv. Mater. Res. 2011, 264–265, 831–836. [Google Scholar] [CrossRef]
- Mouralova, K.; Benes, L.; Bednar, J.; Zahradnicek, R.; Prokes, T.; Matousek, R.; Hrabec, P.; Fiserova, Z.; Otoupalik, J. Using a DoE for a comprehensive analysis of the surface quality and cutting speed in WED-machined hadfield steel. J. Mech. Sci. Technol. 2019, 33, 2371–2386. [Google Scholar] [CrossRef]
- Camposeco-Negrete, C. Prediction and optimization of machining time and surface roughness of AISI O1 tool steel in wire-cut EDM using robust design and desirability approach. Int. J. Adv. Manuf. Technol. 2019, 103, 2411–2422. [Google Scholar] [CrossRef]
- Nawaz, Y.; Maqsood, S.; Naeem, K.; Nawaz, R.; Omair, M.; Habib, T. Parametric optimization of material removal rate, surface roughness, and kerf width in high-speed wire electric discharge machining (HS-WEDM) of DC53 die steel. Int. J. Adv. Manuf. Technol. 2020, 107, 3231–3245. [Google Scholar] [CrossRef]
- Rehman, M.; Khan, S.A.; Naveed, R. Parametric optimization in wire electric discharge machining of DC53 steel using gamma phase coated wire. J. Mech. Sci Technol. 2020, 34, 2767–2773. [Google Scholar] [CrossRef]
- Çardaklı, İ.S. Thin Section High Cooling Rate Solidification, Thermomechanical Processing and Characterization of AISI DC53 Cold Work Tool Steel; Middle East Technical University: Ankara, Turkey, 2019; Available online: https://open.metu.edu.tr/bitstream/handle/11511/45197/index.pdf (accessed on 31 March 2021).
- Ishfaq, K.; Anwar, S.; Ali, M.A.; Raza, M.H.; Farooq, M.U.; Ahmad, S.; Salah, B. Optimization of WEDM for precise machining of novel developed Al6061-7.5% SiC squeeze casted composite. Int. J. Adv. Manuf. Technol. 2020. [Google Scholar] [CrossRef]
- Mughal, M.P.; Farooq, M.U.; Mumtaz, J.; Mia, M.; Shareef, M.; Javed, M.; Pruncu, C.I. Surface modification for osseointegration of Ti6Al4V ELI using powder mixed sinking EDM. J. Mech. Behav. Biomed. Mater. 2020, 104145. [Google Scholar] [CrossRef] [PubMed]
- Umar Farooq, M.; Pervez Mughal, M.; Ahmed, N.; Ahmad Mufti, N.; Al-Ahmari, A.M.; He, Y. On the Investigation of Surface Integrity of Ti6Al4V ELI Using Si-Mixed Electric Discharge Machining. Materials 2020, 13, 1549. [Google Scholar] [CrossRef] [PubMed] [Green Version]
- Tosun, N.; Cogun, C.; Tosun, G. A study on kerf and material removal rate in wire electrical discharge machining based on Taguchi method. J. Mater. Process. Technol. 2004, 152, 316–322. [Google Scholar] [CrossRef]
- Mussada, E.K.; Hua, C.C. Rao AKP Surface hardenability studies of the die steel machined by WEDM. Mater. Manuf. Process. 2018, 33, 1745–1750. [Google Scholar] [CrossRef]
- Somashekhar, K.P.; Ramachandran, N.; Mathew, J. Material removal characteristics of microslot (kerf) geometry in μ-WEDM on aluminum. Int. J. Adv. Manuf. Technol. 2010, 51, 611–626. [Google Scholar] [CrossRef]
- Groover, M. Fundamentals of Modern Manufacturing: Materials, Processes, and Systems, 4th ed.; John Wiley & Sons, Inc.: Hoboken, NJ, USA, 2013; ISBN 978-0470467008. [Google Scholar]
- Tilekar, S.; Das, S.S.; Patowari, P.K. Process Parameter Optimization of Wire EDM on Aluminum and Mild Steel by Using Taguchi Method. Procedia Mater. Sci. 2014, 5, 2577–2584. [Google Scholar] [CrossRef]
- Farooq, M.U.; Ali, M.A.; He, Y.; Khan, A.M.; Pruncu, C.I.; Kashif, M.; Asif, N. Curved profiles machining of Ti6Al4V alloy through WEDM: Investigations on geometrical errors. J. Mater. Res. Technol. 2020, 9, 16186–16201. [Google Scholar] [CrossRef]
- Ishfaq, K.; Farooq, M.U.; Anwar, S.; Ali, M.A.; Ahmad, S.; El-Sherbeeny, A.M. A comprehensive investigation of geometrical accuracy errors during WEDM of Al6061-7. 5% SiC composite. Mater. Manuf. Process. 2020, 36, 362–372. [Google Scholar] [CrossRef]
- Asad, A.M.; Kashif, I.; Raza, M.H.; Umar, F.M.; Mufti, N.A.; Pruncu, C.I. Mechanical characterization of aged AA2026-AA2026 overcast joints fabricated by squeeze casting. Int. J. Adv. Manuf. Technol. 2020, 107, 3277–3297. [Google Scholar]


| DC53 Chemical Specifications | DC53 Characteristics [29,30,31] | |||
|---|---|---|---|---|
| Element | Wt (%) | Name | Unit | Value |
| Carbon (C) | 1.10 | Modulus of elasticity | GPa | 150 |
| Chromium (Cr) | 8.50 | Modulus of rigidity | GPa | 58.5 |
| Molybdenum (Mo) | 2.00 | Rockwell hardness | HRC | 64 |
| Silicon (Si) | 0.90 | Poisson’s ratio | - | 0.28 |
| Vanadium (V) | 0.30 | Thermal conductivity (at room temperature) | W/m-K | 23.86 |
| Manganese (Mn) | 0.35 | Coefficient of thermal expansion | 1/°C | 13 × 10−6 |
| Phosphorous (P) | 0.03 | Density | kg/m3 | 7.85 × 10³ |
| Sulphur (S) | 0.03 | - | - | - |
| Iron (Fe) | BAL | - | - | - |
| Process Variables | Symbol | Unit | Level | Output Responses | Symbol | Unit | Constant Parameters | Unit | Value | ||
|---|---|---|---|---|---|---|---|---|---|---|---|
| 1 | 2 | 3 | |||||||||
| Wire feed | WF | mm/s | 5 | 8 | Kerf width | KW | µm | Pulse off-duration | µs | 25 | |
| Pulse on-duration | Pon | µs | 4 | 5 | 6 | Surface roughness | SR | µm | Resistivity of dielectric | kg-Ω-cm | 50–70 |
| Open voltage | OV | volt | 80 | 90 | 100 | Material removal rate | MRR | mm3/min | Wire tension | gms-f | 1390 |
| Servo voltage | SV | volt | 40 | 50 | 60 | Recast layer thickness | RLT | µm | Arc on time | µs | 2 |
| Sr No. | Output Responses | p Value Variables | Percentage Contribution (PCR) | R-Sq (%) | R-Sq (Adj) (%) | ||||||
|---|---|---|---|---|---|---|---|---|---|---|---|
| WF | Pon | OV | SV | WF | Pon | OV | SV | ||||
| 1 | Kerf width (KW) | <0.001 | <0.001 | 0.08 | 0.02 | 45.64 | 41.56 | 1.95 | 3.77 | 92.95% | 90.78% |
| 2 | Surface roughness (SR) | <0.001 | <0.001 | 0.016 | 0.06 | 8.32 | 84.83 | 2.10 | 1.15 | 96.42% | 95.31% |
| 3 | Material removal rate (MRR) | 0.001 | <0.001 | <0.001 | 0.41 | 10.51 | 32.81 | 49.07 | 0.39 | 92.80% | 90.58% |
| 4 | Recast layer thickness (RLT) | 0.593 | <0.001 | <0.001 | 0.56 | 0.17 | 40.00 | 52.06 | 0.20 | 92.45% | 90.13% |
| Sr. No. | Process Parameters | Response Indicators | ||||||
|---|---|---|---|---|---|---|---|---|
| WF (mm/s) | Pon (µs) | OV (V) | SV (V) | SR (µm) | MRR (mm3/min) | KW (mm) | RLT (µm) | |
| 1 | 8 | 4 | 80 | 56 | 1.709 | 10.307 | 0.327 | 10.093 |
| 2 | 8 | 4 | 80 | 56 | 1.703 | 10.299 | 0.326 | 10.256 |
| 3 | 8 | 4 | 80 | 56 | 1.719 | 10.496 | 0.330 | 10.980 |
| Avg. experimental value | 1.710 | 10.367 | 0.327 | 10.443 | ||||
| Standard deviation | 0.006 | 0.091 | 0.001 | 0.385 | ||||
| Predicted value | 1.711 | 10.554 | 0.326 | 10.191 | ||||
| Error % | 0.64 | 1.77 | 0.31 | 2.47 | ||||
Publisher’s Note: MDPI stays neutral with regard to jurisdictional claims in published maps and institutional affiliations. |
© 2021 by the authors. Licensee MDPI, Basel, Switzerland. This article is an open access article distributed under the terms and conditions of the Creative Commons Attribution (CC BY) license (https://creativecommons.org/licenses/by/4.0/).
Share and Cite
Khan, S.A.; Rehman, M.; Farooq, M.U.; Ali, M.A.; Naveed, R.; Pruncu, C.I.; Ahmad, W. A Detailed Machinability Assessment of DC53 Steel for Die and Mold Industry through Wire Electric Discharge Machining. Metals 2021, 11, 816. https://doi.org/10.3390/met11050816
Khan SA, Rehman M, Farooq MU, Ali MA, Naveed R, Pruncu CI, Ahmad W. A Detailed Machinability Assessment of DC53 Steel for Die and Mold Industry through Wire Electric Discharge Machining. Metals. 2021; 11(5):816. https://doi.org/10.3390/met11050816
Chicago/Turabian StyleKhan, Sarmad Ali, Mudassar Rehman, Muhammad Umar Farooq, Muhammad Asad Ali, Rakhshanda Naveed, Catalin I. Pruncu, and Waheed Ahmad. 2021. "A Detailed Machinability Assessment of DC53 Steel for Die and Mold Industry through Wire Electric Discharge Machining" Metals 11, no. 5: 816. https://doi.org/10.3390/met11050816