Recent Advances in EBSD Characterization of Metals


1
DEMM, Department of Metallurgical and Materials Engineering, University of Porto, R. Dr Roberto Frias, 4200-465 Porto, Portugal
2
LAETA/INEGI—Institute of Science and Innovation in Mechanical and Industrial Engineering, R. Dr Roberto Frias, 4200-465 Porto, Portugal
*
Author to whom correspondence should be addressed.
Metals 2020, 10(8), 1097; https://doi.org/10.3390/met10081097
Submission received: 10 July 2020
/
Revised: 29 July 2020
/
Accepted: 11 August 2020
/
Published: 13 August 2020
(This article belongs to the Special Issue Advances in Microstructural Characterization of Metals by EBSD)
Abstract
:Electron backscatter diffraction (EBSD) has been attracting enormous interest in the microstructural characterization of metals in recent years. This characterization technique has several advantages over conventional ones, since it allows obtaining a wide range of characterization possibilities in a single method, which is not possible in others. The grain size, crystallographic orientation, texture, and grain boundary character distribution can be obtained by EBSD analysis. Despite the limited resolution of this technique (20–50 nm), EBSD is powerful, even for nanostructured materials. Through this technique, the microstructure can be characterized at different scales and levels with a high number of microstructural characteristics. It is known that the mechanical properties are strongly related to several microstructural aspects such as the size, shape, and distribution of grains, the presence of texture, grain boundaries character, and also the grain boundary plane distribution. In this context, this work aims to describe and discuss the possibilities of microstructural characterization, recent advances, the challenges in sample preparation, and the application of the EBSD in the characterization of metals.
1. Introduction
Electron backscatter diffraction (EBSD) is a microstructural characterization technique that provides crystallographic information in the scanning electron microscopy (SEM). The diffraction patterns obtained are used to determine the crystal orientation, grain size, phase identification, texture, grain boundary character, and strain. The quality of the diffraction patterns, which influences the confidence of the indexing, strongly depends on the sample preparation. The preparation for EBSD is very challenging and time-consuming, since the samples must be perfectly flat and without damage at the surface to obtain high-quality Kikuchi patterns.
Regarding the resolution of this technique, it depends on several factors, namely the sample preparation, the SEM equipment to be used, and the type of material to be analyzed. For instance, the spatial resolution of EBSD has a limit to approximately 20 nm for dense materials and up to 50 nm for lightweight materials such as aluminum [1,2,3]. Additionally, EBSD samples are typically tilted toward the detector by 70°, as can be seen in Figure 1, and the resolution down the tilted surface is approximately three times worse.
The use of EBSD in the characterization of materials has undergone rapid acceptance. In recent years, this use has increased due to the total availability of SEM, the high speed of data acquisition, and the access to complementary information about the microstructure on the submicron scale [4,5]. The EBSD technique has been applied in several areas of investigation, increasing the knowledge and implementation of processes related to metallic materials. In manufacturing processes, such as joining processes [6,7,8,9,10,11,12,13,14,15,16,17,18,19,20,21,22,23,24,25], deformation processes [26,27,28,29,30,31,32,33,34,35,36,37,38,39,40,41], powder metallurgy routes [42,43,44,45,46,47,48,49,50], and additive manufacturing (AM) [51,52,53,54,55,56,57,58,59], it has been a powerful technique to characterize and evaluate the influence of parameters and various stages of production on the final microstructure of the component. For example, in AM processes, EBSD presents itself as a technique that can be used in the determination and implementation of the production conditions. Besides, the EBSD technique has also been widely used to evaluate and characterize the effect of surface treatments [60,61,62,63], in-situ mechanically tested samples [64,65,66,67,68,69], or even to study processes related to the dynamic recrystallization [70,71,72,73,74,75,76,77,78,79,80,81,82] of metallic materials.
The measurement of characteristics such as crystal lattice, crystallographic orientation, or domain/grain dimensions at the nanoscale is a primary key for the nanomaterials research development. As is well known, the characterization of nanomaterials is essential for the development and application of these materials with unique properties. However, the microstructural and mechanical characterization methods of these materials are quite challenging. Thorough knowledge of the structure of these materials makes it possible to understand their mechanical properties better. EBSD in the SEM is one of the techniques that provide the best chances for generating precise quantitative information about crystallographic orientation, crystal structure, or strain from ultrafine domains. However, the lateral spatial resolution did not allow the evaluation of isolated nanoscale volumes such as nanoparticles or single grains in ultrathin films. Transmission Kikuchi diffraction (TKD), also known as transmission EBSD (t-EBSD), can significantly improve the spatial resolution limited of the conventional EBSD [83]. The critical difference between TKD and EBSD is that the sample is electron-transparent and mounted horizontally or back tilted away from the EBSD detector. This geometry results in the diffraction pattern originating from the sample bottom surface and a smaller diffraction source volume.
This review’s main objective is to describe the potential of the EBSD technique in the advanced microstructural characterization of metallic materials. The basic concepts of the technique will be included, as well as the type of analysis possible. A more detailed presentation will be made in the recent application of the EBSD in several research areas of characterization of metals.
2. EBSD Analysis
EBSD or orientation imaging microscopy (OIM) provides information on the image quality, grain orientation, microstructure, and texture of polycrystalline materials. These datasets allow the researchers to construct some important maps such as the inverse pole figure (IPF), the grain orientation spread (GOS), kernel average misorientation (KAM), grain reference orientation deviation (GROD), and the grain average image quality (IQ). These maps allow the determination of the grain orientation for the different phases, grain misorientation, dislocation density, and strain or deformation in the crystal lattice structure. In addition to maps, it is possible to obtain EBSD information on pole figures, histograms, and Kikuchi patterns.
It is known that the mechanical properties are strongly related to the size, shape, and distribution of the grains. Grain size maps are an excellent EBSD tool for the characterization of metallic materials. These maps are made up of different colors that are related to the grain size. Grain and sub-grain size distributions (equivalent circle diameter) can be easily obtained using these maps. As grains are identified by defining a critical angle of misorientation and grain boundaries, these are also crucial to characterization. IPF maps provide information on grain orientation, where each color is related to the crystallographic orientation. For each map, a reference sample direction is selected, and the color assignment is made based on the determination of the crystal orientation and the selected viewing direction [1,5,84].
Phase identification is also another possibility of EBSD analysis. This can be performed using the indexation of the Kikuchi pattern point to point in small areas, or it is also possible to achieve the phase map distribution. The first has the advantage of being able to analyze areas that by energy-dispersive X-ray spectroscopy (EDS) is not possible due to the interaction volume being higher than the dimension of the evaluated area. In this case, a local analysis can be made in order to identify the phase. However, it is also possible to obtain maps with the phase distribution, but this is a more global analysis. It is also possible to use the combination of EBSD and EDS to distinguish the phases during the acquisition [1,5,84].
Grain boundary engineering (GBE) can be performed in order to improve the properties of the materials. The grain boundaries strongly influence the properties of the materials, such as the corrosion resistance, creep, or even deformation behavior. Many reports of GBE materials cite an enhanced proportion of low-Σ coincidence site lattice (CSL) boundaries, where Σ is the reciprocal density of coinciding sites, as the factor responsible for property improvements. The EBSD allows the observation and identification of the different types of grain boundaries. Several possibilities can be performed in order to study the grain boundaries of the material. Maps with the identification of the grain boundaries (low and high-angle grain boundaries and CSL boundaries), the distribution of the character of the grain boundaries, or even the grain boundary plane distribution, can be done. The grain boundary distribution can be expressed in terms of five parameters, including three parameters of lattice misorientation and two parameters of the grain-boundary plane normal. This is crucial for further understanding of the mechanisms of GBE that require a more in-depth knowledge of grain boundary structure [1,84].
The pole figures (PF) are used to present 3D orientation information in two dimensions to show the orientations of specific crystallographic planes and directions within a sample. The projected position of a specific set of crystallographic planes, in which the normal or poles were projected in a sphere and then in a circle, is shown in a pole figure. The two techniques for doing this are equal-area projection and stereographic projection. The existence of texture means that the material has a preferential crystallographic orientation. If a polycrystalline material (that is, a material composed of many different crystals or grains, similar to most metals, ceramics, or minerals) has texture, it means that the crystals axes are not randomly distributed. To obtain a PF, it is necessary to choose a specific crystal direction (for example, the normal plane for the plane (100)), which is called the pole, for each crystal concerning a set of directions in the material. The complete determination of the texture requires the plotting of two PF corresponding to planes that are not parallel and do not have the same diffraction angle (different interplanar distances) [1,84].
For the recrystallization and deformation behavior, the evaluation of the degree of plastic strain and the associated stored energy is crucial for the establishment and understanding of the mechanisms that play a vital role in these processes. The EBSD data can be an essential tool for studying the strain and deformation of metallic materials. For instance, changes in the IQ value and local orientation have been used to study the strain and stored energy. The quality and the change in the diffraction bandwidths of the Kikuchi patterns can be used to evaluate the distortion degree of crystal lattices induce by elastic strain and, at the same time, the plastic strain that promotes the degradation of the quality of the diffraction patterns. Besides, the maps that show the misorientation can also be used since dislocations form in the material; the residual strain is manifest as local variations in lattice orientation. KAM, grain average misorientation (GAM), and local average misorientation (LAM) maps can be used to study the local grain misorientation and thus of the strain present in the material. The GOS and GROD maps can also be used to investigate the strain of the materials but are an essential tool to study the recovery and recrystallization processes of the materials [1,5,84,85].
3. Sample Preparation
The preparation of samples for EBSD, although some methods are indicated by EBSD manufacturers such as EDAX-TSL (AMETEK® Materials Analysis Division, Mahwah, NJ, EUA) and EBSD Oxford instruments (Oxford Intruments Plc, Abingdon, UK), are not yet fully established in detail. This preparation strongly depends on the type of material to be characterized. In general, almost all samples for EBSD observation need to be mechanically polished carefully to avoid surface damage. For the softer material, less grinding/polishing force needs to be applied. There are three main methods (silica polishing, electropolishing, and ion milling) for the final polishing of EBSD samples to obtain good quality Kikuchi patterns.
Colloidal silica preparation may be the most straightforward, most economical, and universal process for preparing samples for EBSD. Colloidal silica is a commercially available solution that consists of negatively charged particles of silicon dioxide (SiO2). The sample surface is slightly etched, and therefore, deformation layer during mechanical polishing is removed using this solution. This method may require several hours of preparation [4,5]. However, the polishing time depends on the material. For instance, Gee et al. [64] finished the WC/Co hard metal sample preparation for EBSD with a colloidal silica polish for 30 min. At the same time, Shamanian et al. [6] prepared L-605 Co-based superalloy joints for EBSD analysis by the colloidal silica during 6 h, and Singh et al. [71] performed the final polishing of TiAl using a dilute solution of water and non-crystalline colloidal silica (0.05 mm) for 12 to 18 h.
Electropolishing is a popular polishing method for the final step of EBSD preparation. This method can be used when it is important to remove some plastic deformation due to the production process or for materials that easy to oxidize. EBSD observation should be done immediately, followed by electropolishing due to the easy oxidation on the free surface. The polished surface’s quality is controlled by some parameters, such as voltage, temperature, flow rate, and polishing time. However, for some materials such as Mg alloys, this method is not the most appropriate. The other limitation of this process involves selecting the electrolyte as there is no universal electrolyte working for all materials, and the non-conductive materials cannot be prepared by electropolishing [4,5]. Hurley and Humphreys [27] have shown that cold-rolled single-phase aluminum alloy can be mechanically ground and polished and then electropolished in a solution containing 30% nitric acid in methanol, at −30 °C and a voltage of 12 V for EBSD analyses.
4. Application of EBSD on the Microstructural Characterization of Metals
In recent studies in the most diverse research areas, the EBSD technique has been widely used in the microstructural characterization of metallic materials. This technique provided the characterization of numerous microstructural features that allowed the development, optimization, and implementation of new manufacturing processes, approaches to conventional methods, or even in the development of new advanced materials. In addition, with in-situ and ex-situ tests, it is also possible to distinguish and study the effect of mechanical tests or heat treatments on the materials’ microstructure. EBSD has also proved to be a technique with clear advantages in GBE materials and also, despite its limitation in terms of resolution, for ultrafine or nanostructured materials. The following sections aim to describe and highlight the different research areas involving metallic materials, where the EBSD technique is used to performed and improve the advanced characterization of metals or metal matrix composites.
4.1. Joining Processes
In the evaluation of a new process or a new approach in the joining of metallic materials, the EBSD technique is a powerful technique to determine the effectiveness of the process and the processing conditions and also to evaluate the microstructure of the interface or the changes promoted to the base material during the process [6,7,8,9,10,11,12,13,14,15,16,17,18,19,20,21,22,23,24,25]. For instance, Shamanian et al. [6] used the EBSD for the characterization of the L-605 Co-based alloy welds processed by pulsed Nd:YAG (neodymium-doped yttrium aluminum garnet; Nd: Y3Al5O12) laser welding. The authors started with the microstructural characterization of the base material that was performed through grain size maps, IPF maps, phase distribution maps, and grain boundary character investigations. The texture was considered by PF and IPF. Based on these results, they observed the presence of some second phase in the austenite grains that was identified as (W,Cr)7C3 phase. The evaluation of the grain boundary character revealed that most of the grain boundaries observed at the base metal are high-angle grain boundaries (HAGBs), and the CSL boundaries had Σ3 character due to the formation of twin boundaries. The base material did not exhibit texture based on the observation of the PF images. This initial characterization aimed to evaluate the effect of the bonding process on the base material’s microstructure. Figure 2 shows the IPF and phase maps, pole figures, and distribution of grain boundaries of the interface between the base material and the welded zone. The authors found that the grain size of the metal base was not affected by the fusion welding process, since the average grain size is similar to the one measure for the initial base metal. According to the phase maps, Figure 2d, the heat-affected zones had some (W, Cr)7C3 phase in the austenite matrix similar to the base metal. Based on the boundaries’ analysis, most of the boundaries formed in the heat-affected zones had a HAGB character. Besides, the quantitative analysis of the CSL boundaries formed in the heat-affected zones revealed that similar to the base metal, a significant number of CSL boundaries had the Σ3 character, corresponding to the twin boundaries. The PF and IPF of the heat-affected zone showed the presence of a strong transversal direction (TD) || 〈1 0 0〉 relationship and a weak welding direction (WD) || 〈1 0 0〉 relationship in the weld metal. When the welding conditions are changed in order to decrease the heat input, similar microstructures are obtained. However, this change has an influence on the texture austenite grains, showing a strong TD || 〈1 0 0〉 and a weak WD || 〈1 0 0〉 relationship.
Norouzi et al. [7] studied the diffusion brazing of Ti6Al4V to AISI 304 stainless steel by EBSD. The combination of EBSD with EDS results and Ti–Cu and Fe–Ti phase diagrams allowed the identification of the phases that composed the interface. The IPF map revealed that the interface is composed of larger equiaxed grains. Fe–Ti and Ti–Cu intermetallic compounds are present in the reaction layers. The same microstructural characterization was conducted for the joint produced for 80 min. The EBSD results revealed that the amount of Ti–Cu intermetallics decrease with the increasing of the brazing time.
Sun et al. [8] investigated the diffusion bonded interface between Ti6Al4V (TC4) to Ti–5Al–2Sn 2Zr–4Mo–4Cr (TC17) by EBSD. In addition to allowing the characterization of the interface microstructure, EBSD also allowed the study of recrystallization during the bonding process. The microstructural characterization by EBSD and confirmed by transmission electron microscopy (TEM) indicated that the bonding interface is composed of a α(TC4)/β(TC17) phase boundary (PB). The LAGBs and HAGBs are observed in the equiaxed β sub-grains and β grains that formed near the α(TC4)/β(TC17) PB. HAGBs are not observed in the β phase of the as-received base materials. In addition, the β grains found at the interface exhibit larger misorientation than the β phase of TC17. This is an indication that the dynamic recrystallization that occurs near α(TC4)/β(TC17) PB.
Jing et al. [9] studied the Zr amount effects in Ti–Zr–Cu–Ni brazing filler for brazing Ti–6Al–4V alloy by EBSD. The microstructure of the joint interfaces was evaluated by grain orientation, grain, and phase morphology distribution. Figure 3 shows the results obtained for joints produced with three brazing alloys with different amount of Zr. All interfaces are defect-free. Strong preferential oriented grains are observed for joint produced with 18% Zr. Regarding the grain size, as the Zr content level increases, more coarse grains are formed in the brazing joints. This grain analyses can explain the brittle fracture that the joint produced with 37.5% Zr that occurred during the tensile test. A larger grain size could lower the ductility of the material.
Phase identification at the joint interface is essential to understand the mechanism associated with the bonding process and to be able to correlate with the mechanical properties. Due to the small interaction volume of the EBSD analysis, this technique is crucial for the crystallographic characterization of the phases of thin reaction layers (with a smaller dimension than the interaction volume of the EDS). Simões et al. [12] show the importance of the Kikuchi pattern indexing in the characterization of diffusion bonded of TiAl to steel through Ni/Ti reactive nanolayers. In contrast, Wang et al. [13] show the application of the grain maps in the characterization of multilayered interfaces obtained by diffusion bonding, as shown in Figure 4.
4.2. Deformation Processes
For components produced by deformation processes such as extrusion, forging, and rolling, it is crucial to understand the behaviour of the components after the processing and predict the work hardening and the annealing behavior during the application [26,27,28,29,30,31,32,33,34,35,36,37,38,39,40,41]. Using the EBSD, it is possible to characterize a deformed sample to clarify these models. The grain size orientation and the mechanism of subdivision of the grains during the deformation are essential. Some works [26,29] demonstrated the models for the development of substructure with strain by TEM studies. TEM is a technique that also allows investigating and understanding the rearrangement of fine-scale dislocation structures introduced by plastic deformation. However, this technique’s limitation arises on a small scale used in this type of characterization. EBSD overcomes this limitation by allowing characterizing and quantifying these structural units and the relationships between them on a larger scale to provide a better foundation for understanding mechanical behavior, work hardening, texture evolution, and annealing behavior.
Hurley and Humphreys [27] studied by EBSD the substructural development in the cold-rolled single-phase aluminium alloy. The authors had already carried out several studies through TEM, but the EBSD allowed them to acquire new knowledge about the formation of substructures during deformation. The EBSD comprised the TEM results but with the advantages of data that are statistically very sound. Figure 5 shows the Euler orientation map and a PF image. The microstructure is characterized by the presence of small cells or subgrains. Parallel bands of elongated dislocation cells of alternating misorientation, aligned at approximately 35–40° to the rolling direction (RD) were observed at a rolling reduction of 20% and above. After 50% rolling, microshear bands consisting of fine-scale cells linked up to form thin two-dimensional planar structures within grains are formed. These are persistent features of the microstructure that rotate toward the rolling plane during further straining and develop large misorientations.
More recently, Zribi et al. [32] have been used the EBSD for the study of the deformation behavior of an Al-7wt%Si alloy processed by equal channel angular extrusion (ECAE). The microstructure of the as-cast alloy is characterized by the presence of Al dendrites and eutectic zones. Figure 6 shows the EBSD results for the samples processed by ECAE at 20 and 160 °C. Rectangles show eutectic colonies, while ellipses and star-shaped symbols present aluminum grains. Aluminum grains elongated are observed for the sample deformed at 20 °C (Figure 6a). When ECAE is realized at 160 °C, the aluminum grains remain almost equiaxial (Figure 6d). The dislocation density ρ calculated from KAM, XRD, and strain rate sensitivity (SRS) experiments revealed a partial recovery at 160 °C. EBSD imaging shows that the dislocations concentrate counter to the silicon crystals. The magnifications in Figure 6c,f show that a high GND density is stored when ECAE is performed at 20 °C.
Kumar et al. [34] investigated the microstructure of AA3003 aluminum alloy subjected to hot and cold rolling and compared with the as-casting and annealed microstructures by EBSD. The as-cast sample exhibits a very different microstructure composed of large grains and Al–Fe–Si particles along the grain boundaries. The rolling processes induce the fragmentation of these particles and an enrichment of Fe, Mn, and Si is observed. The microstructure of the samples was characterized by a banded structure composed of elongated grains in the rolling direction. The annealing will promote the formation of a microstructure with uniform grain size. Regarding texture, the rolling samples exhibit a strong texture that is not observed for as-casting and annealing samples.
The EBSD can also be used to evaluate the microstructural evolution of heat-treated samples produced by deformation processes. Kamali et al. [31] observed the microstructure evolution of a cold-rolled ordered Fe–50Co–10V alloy using EBSD. The EBSD maps as KAM and GOS with grain boundary misorientation and grain size distributions allow understanding the ferrite recrystallization during heat treatments. The KAM maps, as shown in Figure 7, revealed that the fraction of high-strain areas significantly decreases with the temperature of heat treatment. However, even for the sample heat-treated at 750 °C for 2 h, the fraction of the high-strain areas is 18%, which means that the recrystallization is not completed. Similar results can be observed by the observation of GOS maps. Based on these results, the authors estimated a 97% recrystallization for heat treatment at 750 °C during 5 h and 99% for 10 h. Grain boundary analysis shows that the samples are characterized by LAGBs, and the fraction of these boundaries of ferrite recrystallized grains increases.
4.3. Metal Matrix Composites and Nanocomposites
The use of EBSD in the characterization of metal matrix composites is also proving to be an essential technique with significant advantages that no other technique can offer in an automatic and simplified way. Through the use of this technique, it is possible to assess whether the manufacturing process suitably produces the composites and also allows not only to perform the microstructural characterization but also to identify some reinforcement mechanisms as well as the effect of the reinforcement on the matrix microstructure. Although nanocomposites may have ultrafine structures and even nanometer reinforcements, the EBSD allows the evaluation of the effect of reinforcement in the composite matrix, which is crucial for identifying strengthening mechanisms and for understanding the mechanical behavior of these materials [43,44,45,46,88,89].
Falodun et al. [44] characterized by EBSD a titanium alloy reinforced by TiN nanoparticles produced by spark plasma sintering. The authors performed the EBSD analysis of the nanocomposite and also of the titanium alloy without the reinforcement processed under the same conditions for comparing purposes. Figure 8 shows the EBSD results for the nanocomposite. Based on these observations, it is clear that the addition of the reinforcement induces a decrease in the α-Ti and β-Ti grains that can be explained due to the grain growth restriction during sintering by the reinforced structure. The microstructure of the matrix is strongly affected by the TiN particles since a change from a lamellar into a bimodal structure is observed for the nanocomposites.
Cavaliere et al. [43] investigated the microstructure of the Al matrix nanocomposites produced by spark plasma sintering by EBSD. The nanocomposites did not exhibit preferential grain orientation; however, some texture components are observed for different amounts of the reinforcement. These changes are associated with different rates of recovery, recrystallization, and grain growth progresses that occurs during sintering.
Chen et al. [51] also investigated the grain orientation by EBSD of in-situ TiC/Inconel 625 nanocomposites produced by selective laser melting. The increasing of the TiC amount induced a significant grain refinement of the nanocomposites. The grain refinement promotes the formation of a large number of sub-grain boundaries, which hinder the dislocation movement.
Carneiro et al. [45,46] characterized the carbon nanotubes reinforcement nickel matrix produced by powder metallurgy through EBSD. In these studies, the EBSD results permit consolidating knowledge about how reinforcement influences the matrix microstructure and which strengthening mechanisms promote the best properties. The authors used IPF, KAM, GOS maps, and grain boundary character distribution to evaluate the effect of processing conditions on the final microstructure of the nanocomposite. They observed that the dispersion/mixture promotes an increase in the density of dislocation on the powders, which is more significant when using ball milling in this step instead of ultrasonication. The dislocation structures produced in those initial steps are partially eliminated in the sintering process due to the activation of recovery and recrystallization mechanisms. However, the presence of carbon nanotubes (CNTs) in the matrix has a significant effect on the dislocation annihilation, thus reducing the recovery of the dislocation structures.
Wei et al. [89] performed the microstructural evaluation by EBSD of Ti–Al3Ti laminated composites. The EBSD results revealed that at the interface of Ti/Al3Ti, grain refinement occurs, and the number of the LAGBs decrease, while for the Al/Al3Ti interface, the grain coarsens, and the LAGBs increase. The grain orientation is different for Al3Ti and the interface of these phases with Ti and Al. This occurs due to the dynamic recrystallization that is different for the different zones of the composites.
4.4. Metal Additive Manufacturing
Additive manufacturing (AM) has been a considerable focus of interest in the scientific community due to the advantages presented in the production of materials with ultrafine grains, complex shapes, and chemical compositions. However, the development and implementation of these processes require extensive microstructural characterization to be able to be related to the properties of the materials and to be able to establish the best manufacturing parameters. The EBSD technique, as in other fields, then allows the realization of a complete microstructural characterization that will enable the development of these AM processes [52,53,54,55,56,57,58,59].
Selective laser melting (SLM) is one of the metal additive manufacturing techniques that consists in the use of a laser to produced layer by layer the metallic part. Niu et al. [52] characterized by EBSD a CoCrFeMnNi high-entropy alloy produced by SLM. The microstructural characterization allows establishing a relationship between the influence of the SLM volumetric energy density (VED) on the formation of cracks and the mechanical properties with the crystalline orientation, grain size, misorientation, and texture. Figure 9 shows the IPF, grain boundary, and grain size distribution for samples produced with different VED.
The grains are columnar, and the grain growth occurred along the building direction. The increase of the VED induced the presence of columnar grains extends over more building layers due to the higher temperature in the center of the melt pool for higher VED. The average grain size gradually increases with the VED, since the higher VED results in the higher energy into the metal powder. All SLM samples are composed of HAGBs, whether the VED is high or low owing to the specifics of the SLM process. LAGBs are also found in EBSD figures. Under the rapid movement of the laser beam, the re-melting time of the previously solidified layer is short; thus, the recrystallization is not completed with the formation of residual LAGBs. Based on these results, the GOS and GROD values gradually increase with the VED, owing to the high-temperature gradient and more considerable residual stress due to the higher cooling rate and the more significant thermal stress. The misorientation peak is shifted to a higher angle with the increase of VED because this peak is related to the recrystallized grains during the SLM processing. The crystal orientation is also highly affected with the VED, and the preferred orientation of the sample follows the transition 〈2 3 3〉 → 〈0 0 1〉 → 〈2 0 3〉 → 〈1 0 1〉 with the increase of VED.
Wang et al. [53] also investigated the grain structure and texture of 316 L stainless steel produced by SLM single track throughout the EBSD technique. Figure 10 shows the SEM images and IPF maps of the samples provided with three scanning speeds. The change in the processing parameters promotes a significant difference in the microstructure. The increase of scanning speed leads to a change of the columnar grains from curved to straight. The texture is also affected by the scanning speed, and all samples exhibit different preferential crystallographic orientation from the substrate.
Yang et al. [54] investigated EBSD’s microstructural evolution of Inconel 718 produced by SLM with different laser power. Figure 11 shows the cross-section macrostructures of samples produced under different laser powers (500 W to 2000 W). IPF maps revealed that directional solidification forms in all the SLM states, as a large number of columnar grains growing along the building direction can be seen clearly. However, there is a noticeable change in the morphology and size of the columnar grains with the laser power increasing from 500 to 2000 W. While the columnar grains in the sample at 500 W have the largest length and width (Figure 11(a1)), the columnar grains in the sample at 800 W are interspersed with some equiaxed grains (Figure 11(b1)). The aspect ratio of the columnar grain is shown in Figure 11h, and the largest aspect ratio (6.3) is observed for the sample at 500 W. The sample at 800 W has the smallest aspect ratio (2.9), where grains tend to be more equiaxial. The average area of columnar grains under different laser powers can also be observed at this figure, from which it can be seen that the average area of the columnar grain decreases from approximately 800 to 250 μm2 with the laser power increasing from 500 to 1800 W. The texture is influenced by the laser powers used in the SLM of the Inconel 718. For instance, the lower laser power promotes a strong <001> texture, while the other samples exhibit a weaker <001> texture.
Alam et al. [55] studied the microstructure by EBSD of the laser-based additive manufacturing process of AISI 420 martensitic stainless steel. The IPF maps presented in Figure 12 revealed that the interface region adjacent to the dilution zone exhibits columnar grains. In contrast, equiaxed and columnar grains are observed in the center of the bed and dilution zone. The residual strains/stress was evaluated by GOS and IQ maps. The authors present this EBSD characterization of the laser-based additive manufacturing of martensitic stainless streels to be a technique that allowed obtaining complete information about the microstructure of the material, and that could help establish the best conditions of production of this type of material with this type of AM technique.
4.5. Ultrafine and Nanostructured Materials
In the last few years, the processing of ultrafine and nanostructured materials has attracted several investigations. The microstructural characterization is fundamental to validating the processes for the fabrication of these materials and obtaining the properties’ improvement. Improvements in nanostructured metal components’ properties and performance motivate a complete characterization of the microstructures and crystallographic orientations of nanostructured metals with nanoscale spatial resolution. The advantage of using EBSD mainly consists of the higher possibility of investigating several microstructural characteristics with high resolution. For nanostructured materials, a detailed microstructural characterization such as grain boundary character distribution, local texture, and the grain orientation is crucial for the continuous development in this field [87,90,91,92,93,94,95,96]. For instance, Bastos et al. [87] reported the use of the EBSD for the characterization of a nanostructured NiCo alloy with 20 at.% Ni produced by electrodeposition. The microstructure evaluation was conducted by texture, phase distribution, grain size, and grain boundary character distributions. Based on the EBSD results, the authors observed the shape and size of the grains and determined the amount of LAGBs and HAGBs. The thickness of the deposits had a strong influence on the amount of the twins that decrease with the increasing of the thickness. The samples are also characterized by the presence of a strong (11–20)//ND texture. Despite the resolution’s limit, the use of the EBSD method enables probing large sample areas, which is important owing to the three-dimensional heterogeneity of the microstructure of nanostructured NiCo.
In a review of Wu et al. [90], the use of the EBSD for a 2D orientation mapping technique for structural and orientational characterizations of nanostructured metals is described. In recent years, the investigation of nanostructured materials produced by plastic deformation processes has increased. The use of processes that involve plastic deformation promotes the formation of a very complex structure. For instance, gradient nanostructures at a metal surface can be produced using friction sliding deformation, high-pressure surface rolling, or surface mechanical grinding treatments. Using EBSD, it is possible to investigate and characterize these complex microstructures in grain size and texture. These EBSD results revealed that the process induces characteristic microstructural and textural gradients. Despite significant technological development in recent years, the EBSD signal source volume is still limited to a resolution in the order of 20–50 nm, which is insufficient to measure orientations of nanograins in the topmost layer of gradient nanostructured metals accurately. For the nanostructured materials, the EBSD is a powerful technique that needs to be combined with TEM or transmission Kikuchi diffraction (TKD) characterization.
The TKD technique has been used to characterize nanostructure materials or to study characteristics at the nanoscale of microcrystalline samples [92,93,94,95,96]. For instance, Naghdy et al. [92] studied the geometrically necessary dislocation (GND) of severely deformed aluminium by TKD, and Liang et al. [93] used the TKD to quantify also GND in duplex stainless steel at the nanoscale. These investigations demonstrate that the GND density can be performed through the analyses of the character of the grain boundaries, phase maps, and KAM maps. Figure 13 show the TKD results showing a higher density of GND close to a Cr2N precipitate. Other investigations [44,94,95] have shown the crucial importance of TKD in the identification of the nanoprecipitates. The orientation distribution of the variously identified nanoprecipitates in a 9% Cr Eurofer-97 alloy with the composition Fe–9.14Cr–0.1C–0.54Mn–0.2V–0.04N–1.11W–0.12Ta–0.025Si (wt%) is shown in the IPF image of Figure 14.
4.6. Surface Treatment Processes
The characterization of the materials’ surface is also essential, especially for the components subjected to surface treatment processes. The EBSD can also be used to evaluate the surface treatment conditions on the microstructure of the surface of the materials [60,61,62,63]. Dai et al. [60] studied the effect of surface-treated by a pulsed laser of a hot-rolled Ti6Al4V sheet on the microstructure by EBSD. The results showed that this surface treatment induces the formation of two zones: a melted zone composed of fine martensitic plates with nanotwins, as can be seen in Figure 15, and a heat-affected zone that presents mixed structures of β particles, martensitic plates, and untransformed bulk α grains. The increase of the laser power promotes the increase of both zones and simultaneously refines plate structures.
Lu et al. [61] studied the effects of massive laser shock peening (LSP) treatment, with different pulse energies on the surface roughness and microstructural evolution of AISI 304 stainless steel by EBSD. The EBSD results (Figure 16) show that the initial microstructure of the as-received sample consists of equiaxed austenitic grains, with an average size of the coarse grain up to 30 μm. For the LSPed samples, IPF maps revealed that the samples exhibit a higher fraction of larger grains. For the sample with a pulse energy of 6 J, more homogeneous and fine grains are observed than the sample with a pulse energy of 3 J. Differences in misorientation is observed that are attributed to the recrystallization that can occur during surface modification.
Mineta [62] also used the EBSD to study the surface modification of an Mg–Li-based alloys processed by severe plastic deformation. IPF and KAM results revealed that the high strength of this alloy is attributed to the combination of Hall–Petch relationship and Bailey–Hirsch relationship. The EBSD analysis allowed understanding the mechanisms that are crucial for future improvements in various properties for Mg–Li-based alloys.
4.7. Dynamic Recrystallization (DRX)
The study of the dynamic recrystallization mechanism unique for high-entropy alloys is crucial for applying these alloys. Recovery and recrystallization processes control the restoration of the materials with increasing temperature. This process involves the rearrangement of the dislocation structures.
Haghdadi et al. [70] investigated the effect of the addition of 0.6 and 0.9 M Al to a CoCrFeNi alloy on the microstructure and hot deformation/dynamic restoration by EBSD. The results show that the two samples exhibit very different microstructure: The Al0.6CoCrFeNi alloy has an face-centered cubic lattice (FCC) matrix with dispersed BCC particles and surrounded by an interdendritic body-centered cubic lattice (BCC) phase, while the Al0.9CoCrFeNi alloy has a BCC matrix with allotriomorphic and intragranular dispersed FCC particles. Regarding dynamic recrystallization, the strain incompatibility at the interphase boundary in both alloys increases the localized deformation, which results in faster kinetics of discontinuous (Al0.6 alloy) and continuous (Al0.9 alloy) dynamic recrystallization mechanisms, because Al0.6 alloy mainly occurs at the interphase boundary mantle regions through the formation of Σ3 boundaries. Sub-grain coalescence occurs within the grains far from the interfaces. In the Al0.9 alloy, the BCC matrix softens through the continuous dynamic recrystallization (CDRX) mechanism. It is characterized by a progressive conversion of low-misoriented sub-grains into (sub)grains delineated partly by LAGBs and partly by HAGBs.
Understanding the dynamic recrystallization mechanisms is also crucial for alloys, such as TiAl alloys. TiAl alloys with high Nb (5 to 10 at.%) amounts exhibit high resistance to creep and oxidation, which makes them highly interested in high-temperature applications of these alloys [97,98]. However, the low hot workability has remained a significant setback for high Nb-based γ-TiAl alloys [99,100]. Some studies indicated that the occurrence of dynamic recrystallization could improve the workability due to the considerable grain refinement observed. Therefore, the understanding of the microstructural evolution during the dynamic recrystallization phenomenon and its kinetic aspects assume more considerable significance in the microstructural control of these alloys.
Several studies were conducted in the EBSD investigation of the dynamic recrystallization of the TiAl alloys [71,72,73,74,75]. Singh et al. [71] demonstrated the use of the EBSD for the study of the dynamic recrystallization of γ-TiAl alloy. The microstructural evolution during dynamic restoration processes as a function of temperature and strain rate is shown through the IPF maps obtained by EBSD. Figure 17 shows the results obtained.
The DRX fraction increases with increasing temperature and decreasing strain rate. Development of very fine DRX grains can be further noticed along the prior lamellar colony boundaries resembling a “necklace”-structure at high strain rate (0.5 s−1) and lower deformation temperatures (from 1000 to 1100 °C). On the contrary, well developed and coarse DRX grains with a relatively large spread of grain size distribution are observed at the deformation conditions with low strain rate (0.005 s−1) and higher temperatures (from 1100 to 1200 °C). It is also accompanied by coarsening and fragmentation of the remnant γ + α2 colonies. At high strain rates, the kinking/bending of lamellar structures predominates. Such kinked lamellar structures act as nucleation sites for dynamic recrystallization, as observed in the earlier studies of a range of γ-TiAl-based alloys. To evaluate the Zener–Hollomon parameter (Z) effect on the dynamic restoration behavior, the orientation, grain boundary character, and misorientation distribution by KAM and GOS maps were performed for different deformation conditions with high Z (1000 °C, 0.5 s−1), medium Z (1100 °C, 0.05 s−1), and low Z (1200 °C, 0.5 s−1). It has been shown that discontinuous dynamic recrystallization (DDRX) dominates at the high Z condition, resulting in a fine and homogeneous recrystallized grain structure. On the other hand, at lower Z conditions, a broad spectrum of recrystallized grain size distribution is developed due to a combination of DDRX and CDRX processes. The latter process is prevalent toward higher strains.
For other titanium alloys such as Ti6Al4V [76], nickel-based superalloys [77,78,79], aluminum alloys [80], high-strength low-alloy (HSLA) steel [81], or even magnesium alloys (ZK30) [82], hot-working is an important step in their manufacture. Therefore, it is essential to know the effect of this processing on the resulting microstructure. For excellent hot workability, uniform DRX of the microstructure is required, without the onset of instability; the material is deformed in a deformation regime characterized by high strain rate sensitivity.
4.8. Mechanical Testing Characterization
The understanding of the mechanical behavior at the microstructure scale is a critical factor for the material’s macroscopic behavior understanding. EBSD can also be used to observe the samples’ behavior during mechanical testing. This characterization can be performed through in-situ SEM or even in the samples before being subjected to mechanical tests. This will allow the development and understanding of the mechanism that plays a role in the mechanical tests. The EBSD results can provide information about the degree of plastic deformation due to the possibility of analyzing the crystallographic orientation.
Gee et al. [64] showed the application of EBSD in the evaluation of plastic deformation in the mechanical testing of tungsten carbide-cobalt (WC/Co) hard metal. The mechanical tests performed were compression fatigue tests on notched bars and model scratch tests on polished samples. The EBSD results revealed that this technique effectively evaluates the plastic deformation of the samples. The IPF maps revealed that there is no preferred orientation in either the unworn or worn WC grains. The local misorientation images show that local misorientation is restricted almost entirely to the scratches. A reduction in band contrast and indexing with the number of scratch passes was verified. The results of the examination of the fatigue sample results imply that yield through fatigue is mostly in the Co binder and just beginning to be transmitted to the WC skeleton regions adjacent to Co, where the constraint from the WC is least.
Kozmel et al. [65] studied the application of EBSD on the characterization of Al–Cu-based alloys subjected to high strain rate shear–compression tests. Microstructural characterization revealed a formation of shear bands with impaired mechanical properties after a critical strain level was reached. Figure 18 presents the IPF and LAM maps for the different alloys and subject to different shear rates. The strain promoted the rotation and refinement of grains as the deformation increased. Shear bands occurred without preferential crystallographic orientation, as IPF and Schmid analysis showed. Besides, the microstructure of the increased alloying is characterized by an increased level of local misorientation. For higher shear areas, dynamic grain refinement was observed.
Rui et al. [101] showed the application of EBSD on the study of creep damage of austenitic stainless steel. The authors estimated the creep strain by the grain lattice distortion parameter through GROD maps. Figure 19 shows the IPF and GROD maps for samples-tested specimens under various creep conditions (σ0, T) and creep strain (elongations).
In-situ EBSD can also be performed to evaluate the microstructural changes during mechanical tests. Djouda et al. [66] performed in-situ tensile tests in SEM/EBSD equipment to characterize nanoscale strains at the 316 L austenitic stainless steel surface. Figure 20 shows the EBSD results of samples carried out at three loading levels. The first EBSD acquisition (EBSD_0) was made until the elastoplastic transition, the second (EBSD_1) was made at the elasto-plastic transition, and the third one (EBSD_2) was made in the plastic domain. Based on these results, the authors presented the microstructural evolution during the tensile tests. At the vicinities of the twins, the appearance of the strains that are followed by the arising of slips at the surface of the grains was visible. The increase of deformation induces the multiplication of slips. Most of the grains exhibit slips on their surface, some of which have cross slips that indicate the activation of two distinct slip systems on the same grain. These twinning and slipping activities result in significant work hardening. When the macroscopic loading becomes very important, the heterogeneities of strains within the microstructure are very significant. They occur in different strain gradients on the surface of the same grain. Continuity of the deformations between grains is observed; it takes place through the grain boundaries and the slips. Then, it becomes difficult to distinguish the boundaries of grains. Cracks are also seen at the surface of the sample.
Li et al. [67] evaluated the deformation behavior of dual-phase steel during uniaxial tensile tests by EBSD. The results show that the fracture starts in ferrite grains close to the martensite grain, as in these grains, the plastic deformation concentration is observed. As expected, the LAGBs fraction increased with the increase of the strain. Rotation occurred in some grains, which were subdivided into different regions due to the activation of different slip systems to ensure a compatible deformation of the adjacent grains. Lattice rotation within one single grain differs from region to region.
Wu et al. [68] used a combination of an in-situ tensile technique and EBSD to investigate the changes in microstructure and texture during the plastic deformation of nickel with a high cubic texture. It was found that except for tiny grains and twins, most of the recrystallized grains tended toward the <001> pole. The only difference was that grains with a soft orientation fluently joined in the activation of the slip system, with the movement of dislocations playing a significant role in these grains. Contrariwise, the hard-orientation grains maintained the coordination of plastic deformation employing rotation. As strain increases, the fraction of LAGBs increases gradually due to the movement of dislocations. In contrast, the incidence of HAGBs decreases. The number of total grain boundaries also increases as a result of the formation of deformation-induced grain boundaries.
Gussev et al. [69] conducted in-situ mechanical tensile tests coupled with EBSD analysis of 304 L steels. IPF and KAM maps were used to evaluate the formation of the twins for the steel with a higher amount of Ni and the martensitic transformation in steel with 8% of Ni. Deformation twins observed in the in-situ tests were similar to the results found in the ex-situ experiments. The authors also revealed that the potential sensitivity of the acting deformation mechanisms to the beam current value should be considered during in-situ SEM–EBSD testing.
Table 1 shows a summary of the microstructural characteristics of metals that can be characterized by EBSD. It can be seen that the EBSD technique is a very versatile technique that allows obtaining information and distinguishing a very high number of microstructural characteristics of various pure metals and their alloys. The information obtained is crucial in the development and implementation of new advanced materials and new manufacturing technologies.
5. Conclusions
In the last five years, the microstructural characterization of metals has evolved significantly due to the increased use of the EBSD technique. This interest is due to the fact that this technique allows obtaining information on a high number of microstructural characteristics from obtaining diffraction patterns and data treatment into diverse maps, figures, and histograms. The diffraction patterns obtained are used to measure the crystal orientation, grain boundary misorientations, grain size, phase identification, texture, and strain. EBSD is a powerful technique even for nanostructured materials, despite the limited resolution of this technique (20–50 nm). The great challenge of this technique consists in the preparation of the sample that has to be adjusted, depending on the material under study. However, after this challenge has been overcome, this technique allows characterizing different materials, such as titanium alloys, steels, Ni-based superalloys, aluminum alloys, copper alloys, Co-based alloy, ordered Fe–50Co–10V alloy, metal matrix composites and nanocomposites, and CoCrFeMnNi high-entropy alloy, among others metallic materials. The EBSD technique is versatile in the materials it can characterize, and furthermore, it enhances microstructural characterization in the most diverse research areas. EBSD can be useful and extremely advantageous in the joining processes of metallic materials, characterizing the example of the weld, heat-affected zone, and base material on deformation processes where the technique can, for example, identify regions with higher dislocations cells. This technique, besides pure metals and alloys, is equally useful for composites and nanocomposites characterization by identifying reinforcement mechanisms or reinforcing materials on the matrix microstructure. The metal additive manufacturing is a research field that can also benefit from EBSD to analyze the influence of the laser used on the sample microstructure, besides helping adjust the production parameters and relate them with the final microstructure. Despite the resolution limit, with EBSD, it possible to study ultrafine and nanostructured materials using the detailed characterization of critical features as grain boundary distribution. Since some maps, such as GOS, provide valuable information about the recovery and recrystallization process of the microstructure and dislocation cells and grain formation, this technique is frequently used to study the dynamic recrystallization of high entropy alloys. Another advantage of EBSD is the possibility of being used in-situ, making the microstructural characterization possible while mechanically testing the material, which is crucial to understand the deformation process and influence the microstructure. For these reasons, EBSD is revealing to be unique and essential for an in-depth study of metallic materials.
Funding
Íris Carneiro: was supported by a PhD grant for scientific research from the Portuguese Foundation for Science and Technology (FCT), reference PD/BD/143030/2018.
Conflicts of Interest
The authors declare no conflict of interest.
References
- Schwartz, A.J.; Kumar, M.; Adams, B.L.; Field, D.P. Electron Backscatter Diffraction in Materials Science; Springer: Boston, MA, USA, 2009; Volume 2, ISBN 978-0-387-88136-2. [Google Scholar]
- Dingley, D. Progressive steps in the development of electron backscatter diffraction and orientation imaging microscopy. J. Microsc. 2004, 213, 214–224. [Google Scholar] [CrossRef] [Green Version]
- Chen, D.; Kuo, J.-C.; Wu, W.-T. Effect of microscopic parameters on EBSD spatial resolution. Ultramicroscopy 2011, 111, 1488–1494. [Google Scholar] [CrossRef] [PubMed]
- Sneddon, G.; Trimby, P.; Cairney, J.M. Transmission Kikuchi diffraction in a scanning electron microscope: A review. Mater. Sci. Eng. R Rep. 2016, 110, 1–12. [Google Scholar] [CrossRef]
- Chen, Y.-J.; Hjelen, J.; Roven, H.J. Application of EBSD technique to ultrafine grained and nanostructured materials processed by severe plastic deformation: Sample preparation, parameters optimization and analysis. Trans. Nonferrous Met. Soc. China 2012, 22, 1801–1809. [Google Scholar] [CrossRef] [Green Version]
- Shamanian, M.; Valehi, M.; Kangazian, J.; Szpunar, J.A. EBSD characterization of the L-605 Co-based alloy welds processed by pulsed Nd: YAG laser welding. Opt. Laser Technol. 2020, 128, 106256. [Google Scholar] [CrossRef]
- Norouzi, E.; Shamanian, M.; Atapour, M.; Khosravi, B. Diffusion brazing of Ti–6Al–4V and AISI 304: An EBSD study and mechanical properties. J. Mater. Sci. 2017, 52, 12467–12475. [Google Scholar] [CrossRef]
- Sun, L.; Li, M.Q.; Li, H. Interface characteristics and recrystallization mechanism of dissimilar titanium bonds. J. Mater. Sci. 2018, 53, 5380–5388. [Google Scholar] [CrossRef]
- Jing, Y.; Gao, X.; Su, D.; Zhao, C.; Jiang, J. The effects of Zr level in Ti-Zr-Cu-Ni brazing fillers for brazing Ti-6Al-4V. J. Manuf. Process. 2018, 31, 124–130. [Google Scholar] [CrossRef] [Green Version]
- Liu, D.; Tang, Y.; Shen, M.-X.; Hu, Y.; Zhao, L.-Z. Analysis of Weak Zones in Friction Stir Welded Magnesium Alloys from the Viewpoint of Local Texture: A Short Review. Metals 2018, 8, 970. [Google Scholar] [CrossRef] [Green Version]
- Sun, J.; Ren, W.; Nie, P.; Huang, J.; Zhang, K.; Li, Z. Study on the weldability, microstructure and mechanical properties of thick Inconel 617 plate using narrow gap laser welding method. Mater. Des. 2019, 175, 107823. [Google Scholar] [CrossRef]
- Simões, S.; Ramos, A.S.; Viana, F.; Vieira, M.T.; Vieira, M.F. Joining of TiAl to Steel by Diffusion Bonding with Ni/Ti Reactive Multilayers. Metals 2016, 6, 96. [Google Scholar] [CrossRef]
- Wang, Q.; Chen, G.; Wang, K.; Fu, X.-S.; Zhou, W.-L. Microstructural evolution and growth kinetics of interfacial compounds in TiAl/Ti3SiC2 diffusion bonding joints. Mater. Sci. Eng. A 2019, 756, 149–155. [Google Scholar] [CrossRef]
- Shamanian, M.; Mostaan, H.; Safari, M.; Szpunar, J.A. Friction stir modification of GTA 7075-T6 Al alloy weld joints: EBSD study and microstructural evolutions. Arch. Civ. Mech. Eng. 2017, 17, 574–585. [Google Scholar] [CrossRef]
- Chu, Y.; Li, J.; Zhu, L.; Tang, B.; Kou, H. Characterization of the interfacial-microstructure evolution and void shrinkage of Ti-22Al-25Nb orthorhombic alloy with different surface roughness during diffusion bonding. Intermetallics 2017, 90, 119–127. [Google Scholar] [CrossRef]
- Heidarzadeh, A. Tensile behavior, microstructure, and substructure of the friction stir welded 70/30 brass joints: RSM, EBSD, and TEM study. Arch. Civ. Mech. Eng. 2019, 19, 137–146. [Google Scholar] [CrossRef]
- Heidarzadeh, A.; Motalleb-Nejad, P.; Barenji, R.V.; Khalili, V.; Güleryüz, G. The origin of the maximum hardness of the friction stir welded single-phase Cu-Zn plates: RSM, EBSD, and TEM investigation. Mater. Chem. Phys. 2019, 223, 9–15. [Google Scholar] [CrossRef]
- Sun, L.; Chen, M.-H.; Zhang, L. Microstructure evolution and grain orientation of IMC in Cu-Sn TLP bonding solder joints. J. Alloy. Compd. 2019, 786, 677–687. [Google Scholar] [CrossRef]
- Wu, H.; Peng, H.; Li, X.; Chen, J. Effect of hydrogen addition on diffusion bonding behavior of Ti-55 alloy. Mater. Sci. Eng. A 2019, 739, 244–253. [Google Scholar] [CrossRef]
- Jayashree, P.; Basu, R.; Sharma, S.S. An electron backscattered diffraction (EBSD) approach to study the role of microstructure on the mechanical behavior of welded joints in aluminum metal matrix composites. Mater. Today Proc. 2020, in press. [Google Scholar] [CrossRef]
- Paul, H.; Chulist, R.; Mania, I. Structural Properties of Interfacial Layers in Tantalum to Stainless Steel Clad with Copper Interlayer Produced by Explosive Welding. Metals 2020, 10, 969. [Google Scholar] [CrossRef]
- Liu, B.P.-H.; Chung, T.-F.; Yang, J.-R.; Fu, J.-X.; Chen, C.-Y.; Wang, S.-H.; Tsai, M.-C.; Huang, C.-Y. Microstructure Characterization of Massive Ferrite in Laser-Weldments of Interstitial-Free Steels. Metals 2020, 10, 898. [Google Scholar] [CrossRef]
- Han, C.; Cai, Z.; Fan, M.; Liu, X.; Li, K.; Pan, J. Microstructure Characterization of SAW and TIG Welded 25Cr2Ni2MoV Rotor Steel Metal. Metals 2020, 10, 603. [Google Scholar] [CrossRef]
- Zhang, J.Y.; Xu, B.; Tariq, N.U.H.; Sun, M.-Y.; Li, D.Z.; Li, Y.Y. Microstructure evolutions and interfacial bonding behavior of Ni-based superalloys during solid state plastic deformation bonding. J. Mater. Sci. Technol. 2020, 46, 1–11. [Google Scholar] [CrossRef]
- Yan, G.; Bhowmik, A.; Nagarajan, B.; Song, X.; Tan, S.C.; Tan, M.J. Post-bond heat treatment effects on the wide gap transient liquid phase bonding of Inconel 718 with BNi-2 paste filler metal. Mater. Sci. Eng. A 2019, 766, 138167. [Google Scholar] [CrossRef]
- Nandedkar, V.M.; Samajdar, I.; Narasimhan, K. Development of Grain Interior Strain Localizations during Plane Strain Deformation of a Deep Drawing Quality Sheet Steel. ISIJ Int. 2001, 41, 1517–1523. [Google Scholar] [CrossRef] [Green Version]
- Hurley, P.; Humphreys, F. The application of EBSD to the study of substructural development in a cold rolled single-phase aluminium alloy. Acta Mater. 2003, 51, 1087–1102. [Google Scholar] [CrossRef]
- Gazder, A.A.; Cao, W.; Davies, C.; Pereloma, E.V. An EBSD investigation of interstitial-free steel subjected to equal channel angular extrusion. Mater. Sci. Eng. A 2008, 497, 341–352. [Google Scholar] [CrossRef] [Green Version]
- Gray, G.T. High-Strain-Rate Deformation: Mechanical Behavior and Deformation Substructures Induced. Annu. Rev. Mater. Res. 2012, 42, 285–303. [Google Scholar] [CrossRef]
- Nagarajan, B.; Kumar, D.; Fan, Z.; Castagne, S. Effect of deep cold rolling on mechanical properties and microstructure of nickel-based superalloys. Mater. Sci. Eng. A 2018, 728, 196–207. [Google Scholar] [CrossRef]
- Kamali, M.R.; Karjalainen, L.; Mashregi, A.R.; Hasani, S.; Javaheri, V.; Kömi, J. Reobservations of ferrite recrystallization in a cold-rolled ordered Fe-50Co-10V alloy using the EBSD method. Mater. Charact. 2019, 158, 109962. [Google Scholar] [CrossRef]
- Zribi, Z.; Ktari, H.H.; Herbst, F.; Optasanu, V.; Njah, N. EBSD, XRD and SRS characterization of a casting Al-7wt%Si alloy processed by equal channel angular extrusion: Dislocation density evaluation. Mater. Charact. 2019, 153, 190–198. [Google Scholar] [CrossRef]
- Lee, J.; Jeong, H.; Park, S. Effect of extrusion ratios on microstructural evolution, textural evolution, and grain boundary character distributions of pure copper tubes during hydrostatic extrusion. Mater. Charact. 2019, 158, 109941. [Google Scholar] [CrossRef]
- Kumar, R.; Gupta, A.; Dandekar, T.; Khatirkar, R.K. Microstructure and texture development in AA3003 aluminium alloy. Mater. Today Commun. 2020, 24, 100965. [Google Scholar] [CrossRef]
- Amagadzie, M.Y.; Bishop, D.P. Effect of asymmetric rolling on the microstructure and mechanical properties of wrought 6061 aluminum. Mater. Today Commun. 2020, 25, 101283. [Google Scholar] [CrossRef]
- Jiang, C.; Gao, Q.; Zhang, H.; Liu, Z.; Li, H. Microstructure and Mechanical Properties of 4Al Alumina-Forming Austenitic Steel after Cold-Rolling Deformation and Annealing. Materials 2020, 13, 2767. [Google Scholar] [CrossRef]
- Wang, X.; Xu, W.; Xu, P.; Zhou, H.; Kong, F.; Chen, Y. High Nb–TiAl Intermetallic Blades Fabricated by Isothermal Die Forging Process at Low Temperature. Metals 2020, 10, 757. [Google Scholar] [CrossRef]
- Prochazka, R.; Sláma, P.; Dlouhý, J.; Konopík, P.; Trojanová, Z. Local Mechanical Properties and Microstructure of EN AW 6082 Aluminium Alloy Processed via ECAP-Conform Technique. Materials 2020, 13, 2572. [Google Scholar] [CrossRef]
- Cao, L.; Liao, B.; Wu, X.; Li, C.; Huang, G.; Cheng, N. Hot Deformation Behavior and Microstructure Characterization of an Al-Cu-Li-Mg-Ag Alloy. Crystals 2020, 10, 416. [Google Scholar] [CrossRef]
- Zhilyaev, A.P.; Torres, M.J.; Cadena, H.D.; Rodriguez, S.L.; Calvo, J.; Cabrera, J.-M. The Effect of Pre-Annealing on the Evolution of the Microstructure and Mechanical Behavior of Aluminum Processed by a Novel SPD Method. Materials 2020, 13, 2361. [Google Scholar] [CrossRef]
- Milyutin, V.A.; Gervasyeva, I.; Volkova, E.; Alexandrov, A.; Cheverikin, V.; Mansouri, Y.; Palacheva, V.; Golovin, I. Texture formation in FeGa alloy at cold hydrostatic extrusion and primary recrystallization. J. Alloy. Compd. 2020, 816, 153283. [Google Scholar] [CrossRef]
- Wu, M.-W.; Cai, W.-Z. Phase identification in boron-containing powder metallurgy steel using EBSD in combination with EPMA. Mater. Charact. 2016, 113, 90–97. [Google Scholar] [CrossRef]
- Cavaliere, P.; Jahantigh, F.; Shabani, A.; Sadeghi, B. Influence of SiO2 nanoparticles on the microstructure and mechanical properties of Al matrix nanocomposites fabricated by spark plasma sintering. Compos. Part B Eng. 2018, 146, 60–68. [Google Scholar] [CrossRef]
- Falodun, O.E.; Obadele, B.A.; Oke, S.R.; Olubambi, P.A.; Westraadt, J.E. Characterization of spark plasma sintered TiN nanoparticle strengthened titanium alloy using EBSD and TKD. Mater. Res. Bull. 2019, 117, 90–95. [Google Scholar] [CrossRef]
- Carneiro, Í.; Viana, F.; Vieira, M.F.; Fernandes, J.V.; Simões, S. EBSD Analysis of Metal Matrix Nanocomposite Microstructure Produced by Powder Metallurgy. Nanomaterials 2019, 9, 878. [Google Scholar] [CrossRef] [Green Version]
- Carneiro, Í.; Viana, F.; Vieira, M.F.; Fernandes, J.V.; Simões, S. Characterization of Ni-CNTs Nanocomposites Produced by Ball-Milling. Metals 2019, 10, 2. [Google Scholar] [CrossRef] [Green Version]
- Li, X.; Zhou, Y.; Ebel, T.; Liu, L.; Shen, X.; Yu, P. The influence of heat treatment processing on microstructure and mechanical properties of Ti-24Nb-4Zr-8Sn alloy by powder metallurgy. Materialia 2020, 13, 100803. [Google Scholar] [CrossRef]
- Zhao, L.; Zhang, M.; Yu, Z.; Ma, G.; Ma, B.; Jin, P. Abnormal twinning behaviors in ZK60 alloy by powder metallurgy process. Mater. Sci. Eng. A 2020, 779, 139145. [Google Scholar] [CrossRef]
- Umeda, J.; Ishizaka, H.; Li, S.; AlHazaa, A.; Kondoh, K. Comparison study on mechanical properties of powder metallurgy titanium materials with nitrogen solutes and TiN dispersoids. J. Alloy. Compd. 2020, 846, 156455. [Google Scholar] [CrossRef]
- Paramore, J.D.; Butler, B.G.; Dunstan, M.; Rhee, H.; El Kadiri, H.; Whittington, W.R.; Mujahid, S. The role of microstructure and strain rate on the mechanical behavior of Ti-6Al-4V produced by powder metallurgy. Int. J. Refract. Met. Hard Mater. 2020, 92, 105268. [Google Scholar] [CrossRef]
- Chen, L.; Sun, Y.; Li, L.; Ren, Y.; Ren, X. In situ TiC/Inconel 625 nanocomposites fabricated by selective laser melting: Densification behavior, microstructure evolution, and wear properties. Appl. Surf. Sci. 2020, 518, 145981. [Google Scholar] [CrossRef]
- Niu, P.; Li, R.; Zhu, S.; Wang, M.; Chen, C.; Yuan, T. Hot cracking, crystal orientation and compressive strength of an equimolar CoCrFeMnNi high-entropy alloy printed by selective laser melting. Opt. Laser Technol. 2020, 127, 106147. [Google Scholar] [CrossRef]
- Wang, Y.; Yu, C.; Xing, L.; Li, K.; Chen, J.; Liu, W.; Ma, J.; Shen, Z. Grain structure and texture of the SLM single track. J. Mater. Process. Technol. 2020, 281, 116591. [Google Scholar] [CrossRef]
- Yang, H.; Meng, L.; Luo, S.; Wang, Z. Microstructural evolution and mechanical performances of selective laser melting Inconel 718 from low to high laser power. J. Alloy. Compd. 2020, 828, 154473. [Google Scholar] [CrossRef]
- Alam, M.K.; Mehdi, M.; Urbanic, R.J.; Edrisy, A. Electron Backscatter Diffraction (EBSD) analysis of laser-cladded AISI 420 martensitic stainless steel. Mater. Charact. 2020, 161, 110138. [Google Scholar] [CrossRef]
- Maimaitiyili, T.; Mosur, K.; Kurzynowski, T.; Casati, N.P.M.; Van Swygenhoven, H. Phase Studies of Additively Manufactured Near Beta Titanium Alloy-Ti55511. Materials 2020, 13, 1723. [Google Scholar] [CrossRef] [PubMed] [Green Version]
- Biffi, C.A.; Bassani, P.; Fiocchi, J.; Tuissi, A. Microstructural and Mechanical Response of NiTi Lattice 3D Structure Produced by Selective Laser Melting. Metals 2020, 10, 814. [Google Scholar] [CrossRef]
- Sarswat, P.; Smith, T.; Sarkar, S.; Murali, A.; Free, M.L. Design and Fabrication of New High Entropy Alloys for Evaluating Titanium Replacements in Additive Manufacturing. Materials 2020, 13, 3001. [Google Scholar] [CrossRef] [PubMed]
- Donik, Č.; Kraner, J.; Paulin, I.; Godec, M. Influence of the Energy Density for Selective Laser Melting on the Microstructure and Mechanical Properties of Stainless Steel. Metals 2020, 10, 919. [Google Scholar] [CrossRef]
- Dai, J.; Wang, T.; Chai, L.; Hu, X.; Zhang, L.; Guo, N. Characterization and correlation of microstructure and hardness of Ti–6Al–4V sheet surface-treated by pulsed laser. J. Alloy. Compd. 2020, 826, 154243. [Google Scholar] [CrossRef]
- Lu, J.; Deng, W.; Luo, K.; Wu, L.; Lu, H. Surface EBSD analysis and strengthening mechanism of AISI304 stainless steel subjected to massive LSP treatment with different pulse energies. Mater. Charact. 2017, 125, 99–107. [Google Scholar] [CrossRef] [Green Version]
- Mineta, T. Surface treatment and electron backscatter diffraction (EBSD) analysis of the body-centered cubic phase in Mg-Li based alloys processed by severe plastic deformation. Micron 2020, 137, 102914. [Google Scholar] [CrossRef] [PubMed]
- Zhang, Z.; Lin, M.; Seng, D.H.L.; Teo, S.L.; Wei, F.; Tan, H.R.; Cheong, A.K.H.; Lim, S.H.; Wang, S.; Pan, J. Fatigue Life Enhancement in Alpha/Beta Ti-6Al-4V after Shot Peening: An EBSD and TEM Crystallographic Orientation Mapping Study of Surface Layer. Materialia 2020, 12, 100813. [Google Scholar] [CrossRef]
- Gee, M.; Mingard, K.; Roebuck, B. Application of EBSD to the evaluation of plastic deformation in the mechanical testing of WC/Co hardmetal. Int. J. Refract. Met. Hard Mater. 2009, 27, 300–312. [Google Scholar] [CrossRef]
- Kozmel, T.; Vural, M.; Tin, S. EBSD analysis of high strain rate application Al–Cu based alloys. Mater. Sci. Eng. A 2015, 630, 99–106. [Google Scholar] [CrossRef]
- Djouda, J.M.; Madi, Y.; Gaslain, F.; Beal, J.; Crépin, J.; Montay, G.; Le Joncour, L.; Récho, N.; Panicaud, B.; Maurer, T. Investigation of nanoscale strains at the austenitic stainless steel 316L surface: Coupling between nanogauges gratings and EBSD technique during in situ tensile test. Mater. Sci. Eng. A 2019, 315–335. [Google Scholar] [CrossRef]
- Li, S.; Guo, C.; Hao, L.; Kang, Y.; An, Y. In-situ EBSD study of deformation behaviour of 600 MPa grade dual phase steel during uniaxial tensile tests. Mater. Sci. Eng. A 2019, 759, 624–632. [Google Scholar] [CrossRef]
- Wu, X.; Suo, H.; Ji, Y.; Li, J.; Ma, L.; Liu, M.; Zhang, Z.; Wang, Q. Systematical analysis on the grain orientation evolution of pure nickel under plastic deformation by using in-situ EBSD. Mater. Sci. Eng. A 2020, 792, 139722. [Google Scholar] [CrossRef]
- Gussev, M.N.; Edmondson, P.; Leonard, K. Beam current effect as a potential challenge in SEM-EBSD in situ tensile testing. Mater. Charact. 2018, 146, 25–34. [Google Scholar] [CrossRef]
- Haghdadi, N.; Primig, S.; Annasamy, M.; Cizek, P.; Hodgson, P.; Fabijanic, D. Dynamic recrystallization in AlXCoCrFeNi duplex high entropy alloys. J. Alloy. Compd. 2020, 830, 154720. [Google Scholar] [CrossRef]
- Singh, V.; Mondal, C.; Sarkar, R.; Bhattacharjee, P.; Ghosal, P. Dynamic recrystallization of a β(B2)-Stabilized γ-TiAl based Ti–45Al–8Nb–2Cr-0.2B alloy: The contributions of constituent phases and Zener-Hollomon parameter modulated recrystallization mechanisms. J. Alloy. Compd. 2020, 828, 154386. [Google Scholar] [CrossRef]
- Wan, Z.-P.; Sun, Y.; Hu, L.; Yu, H. Experimental study and numerical simulation of dynamic recrystallization behavior of TiAl-based alloy. Mater. Des. 2017, 122, 11–20. [Google Scholar] [CrossRef]
- Xiang, L.; Tang, B.; Xue, X.; Kou, H.; Li, J. Microstructural characteristics and dynamic recrystallization behavior of β-γ TiAl based alloy during high temperature deformation. Intermetallics 2018, 97, 52–57. [Google Scholar] [CrossRef]
- Tian, S.; Jiang, H.; Guo, W.; Zhang, G.; Zeng, S. Hot deformation and dynamic recrystallization behavior of TiAl-based alloy. Intermetallics 2019, 112, 106521. [Google Scholar] [CrossRef]
- Xu, R.; Li, H.; Li, M. Dynamic recrystallization mechanism of γ and α phases during the isothermal compression of γ-TiAl alloy with duplex structure. J. Alloy. Compd. 2020, 844, 156089. [Google Scholar] [CrossRef]
- Souza, P.M.; Hodgson, P.D.; Rolfe, B.; Singh, R.P.; Beladi, H. Effect of initial microstructure and beta phase evolution on dynamic recrystallization behaviour of Ti6Al4V alloy—An EBSD based investigation. J. Alloy. Compd. 2019, 793, 467–479. [Google Scholar] [CrossRef]
- Lin, Y.; He, D.-G.; Chen, M.-S.; Chen, X.-M.; Zhao, C.-Y.; Ma, X.; Long, Z.-L. EBSD analysis of evolution of dynamic recrystallization grains and δ phase in a nickel-based superalloy during hot compressive deformation. Mater. Des. 2016, 97, 13–24. [Google Scholar] [CrossRef]
- Nicolaÿ, A.; Fiorucci, G.; Franchet, J.; Cormier, J.; Bozzolo, N. Influence of strain rate on subsolvus dynamic and post-dynamic recrystallization kinetics of Inconel. Acta Mater. 2019, 174, 406–417. [Google Scholar] [CrossRef]
- Singh, J.; Verma, A.; Thota, M.; Kapoor, R. Dynamic recrystallization during hot-deformation of a newly developed Alloy. Mater. Charact. 2020, 167, 110529. [Google Scholar] [CrossRef]
- Hu, D.; Wang, L.; Wang, H.-J. Dynamic Recrystallization Behavior and Processing Map of the 6082 Aluminum Alloy. Materials 2020, 13, 1042. [Google Scholar] [CrossRef] [Green Version]
- Li, N.; Kingkam, W.; Han, R.; Tang, M.; Zhang, H.; Zhao, C. Effect of Dynamic Recrystallization on the Transformed Ferrite Microstructures in HSLA Steel. Metals 2020, 10, 817. [Google Scholar] [CrossRef]
- You, J.; Huang, Y.; Liu, C.; Zhan, H.; Huang, L.; Zeng, G.H. Microstructural Study of a Mg–Zn–Zr Alloy Hot Compressed at a High Strain Rate. Materials 2020, 13, 2348. [Google Scholar] [CrossRef] [PubMed]
- Keller, R.; Geiss, R. Transmission EBSD from 10 nm domains in a scanning electron microscope. J. Microsc. 2012, 245, 245–251. [Google Scholar] [CrossRef]
- Humphreys, F.J. Review Grain and subgrain characterisation by electron backscatter diffraction. J. Mater. Sci. 2001, 36, 3833–3854. [Google Scholar] [CrossRef]
- Wright, S.I.; Nowell, M.M.; Field, D. A Review of Strain Analysis Using Electron Backscatter Diffraction. Microsc. Microanal. 2011, 17, 316–329. [Google Scholar] [CrossRef]
- Xu, W.; Ferry, M.; Mateescu, N.; Cairney, J.M.; Humphreys, F. Techniques for generating 3-D EBSD microstructures by FIB tomography. Mater. Charact. 2007, 58, 961–967. [Google Scholar] [CrossRef]
- Bastos, A.; Zaefferer, S.; Raabe, D.; Schuh, C. Characterization of the microstructure and texture of nanostructured electrodeposited NiCo using electron backscatter diffraction (EBSD). Acta Mater. 2006, 54, 2451–2462. [Google Scholar] [CrossRef]
- Kim, Y.K.; Hong, S.I. Effect of Intermetallic Compound Layer on Peel Strength and Crack Propagation Behavior in Cu/Al/Cu Clad Composites. Metals 2019, 9, 1155. [Google Scholar] [CrossRef] [Green Version]
- Wei, Z.; Yuan, M.; Shen, X.; Han, F.; Yao, Y.; Xin, L.; Yao, L. EBSD investigation on the interface microstructure evolution of Ti-Al3Ti laminated composites during the preparation process. Mater. Charact. 2020, 165, 110374. [Google Scholar] [CrossRef]
- Wu, G.; Zhu, W.; He, Q.; Feng, Z.; Huang, T.; Zhang, L.; Schmidt, S.; Godfrey, A.; Huang, X. 2D and 3D orientation mapping in nanostructured metals: A review. Nano Mater. Sci. 2020, 2, 50–57. [Google Scholar] [CrossRef]
- Guo, T.; Tai, X.; Wei, S.; Wang, J.; Jia, Z.; Ding, Y. Microstructure and Properties of Bulk Ultrafine-Grained Cu1.5Cr0.1Si Alloy through ECAP by Route C and Aging Treatment. Crystals 2020, 10, 207. [Google Scholar] [CrossRef] [Green Version]
- Naghdy, S.; Verleysen, P.; Petrov, R.; Kestens, L. Resolving the geometrically necessary dislocation content in severely deformed aluminum by transmission Kikuchi diffraction. Mater. Charact. 2018, 140, 225–232. [Google Scholar] [CrossRef]
- Liang, X.; Dodge, M.; Jiang, J.; Dong, H. Using transmission Kikuchi diffraction in a scanning electron microscope to quantify geometrically necessary dislocation density at the nanoscale. Ultramicroscopy 2019, 197, 39–45. [Google Scholar] [CrossRef]
- Saleh, A.A.; Casillas, G.; Pereloma, E.V.; Carpenter, K.R.; Killmore, C.R.; Gazder, A.A. A transmission Kikuchi diffraction study of cementite in a quenched and tempered steel. Mater. Charact. 2016, 114, 146–150. [Google Scholar] [CrossRef]
- Bhattacharya, A.; Parish, C.M.; Henry, J.; Katoh, Y. High throughput crystal structure and composition mapping of crystalline nanoprecipitates in alloys by transmission Kikuchi diffraction and analytical electron microscopy. Ultramicroscopy 2019, 202, 33–43. [Google Scholar] [CrossRef] [PubMed]
- Cayron, C. What EBSD and TKD Tell Us about the Crystallography of the Martensitic B2-B19′ Transformation in NiTi Shape Memory Alloys. Crystals 2020, 10, 562. [Google Scholar] [CrossRef]
- Kothari, K.; Radhakrishnan, R.; Wereley, N.M. Advances in gamma titanium aluminides and their manufacturing techniques. Prog. Aerosp. Sci. 2012, 55, 1–16. [Google Scholar] [CrossRef]
- Kim, Y.-W. Intermetallic alloys based on gamma titanium aluminide. JOM 1989, 41, 24–30. [Google Scholar] [CrossRef]
- Tetsui, T.; Shindo, K.; Kaji, S.; Kobayashi, S.; Takeyama, M. Fabrication of TiAl components by means of hot forging and machining. Intermetallics 2005, 13, 971–978. [Google Scholar] [CrossRef]
- Appel, F.; Paul, J.D.H.; Oehring, M. Gamma Titanium Aluminide Alloys: Science and Technology; Wiley-VCH Verlag GmbH & Co.: Weinheim, Germany, 2011; ISBN 9783527636204. [Google Scholar]
- Rui, S.-S.; Shang, Y.-B.; Fan, Y.-N.; Han, Q.-N.; Niu, L.-S.; Shi, H.-J.; Hashimoto, K.; Komai, N. EBSD analysis of creep deformation induced grain lattice distortion: A new method for creep damage evaluation of austenitic stainless steels. Mater. Sci. Eng. A 2018, 733, 329–337. [Google Scholar] [CrossRef]
Figure 1.
Schematic illustration showing the experimental setup for electron backscatter diffraction (EBSD) analyses.
Figure 1.
Schematic illustration showing the experimental setup for electron backscatter diffraction (EBSD) analyses.

Figure 2.
EBSD results for the single welded sample: (a) Image quality (IQ) map, (b) high-angle boundaries (HAGBs) and low-angle boundaries (LAGBs) distribution map, (c) coincidence site lattice (CSL) boundaries map, (d) phase map, (e) welding direction (WD) inverse pole figure color map, (f) inverse pole figures of the weld zone, (g) inverse pole figures of the heat-affected zone, (h) pole figures of the weld zone, and (i) pole figures of the heat-affected zone. Reproduced from [6] with permission from Elsevier, 2020.

Figure 3.
Inverse pole figures (IPF) and SEM images of the interface of a brazed Ti6Al4V using Ti–Zr–Cu–Ni with: (a,b) 10% of Zr, (c,d) 18% of Zr, and (e,f) 37.5% of Zr. Reproduced from [9] with permission from Elsevier, 2018.
Figure 3.
Inverse pole figures (IPF) and SEM images of the interface of a brazed Ti6Al4V using Ti–Zr–Cu–Ni with: (a,b) 10% of Zr, (c,d) 18% of Zr, and (e,f) 37.5% of Zr. Reproduced from [9] with permission from Elsevier, 2018.

Figure 4.
Phase maps of the TiAl/Ti3SiC2 joints bonded at (a) 900 °C/15 min and (b) 950 °C/64 h. Reproduced from [13] with permission from Elsevier, 2019.
Figure 4.
Phase maps of the TiAl/Ti3SiC2 joints bonded at (a) 900 °C/15 min and (b) 950 °C/64 h. Reproduced from [13] with permission from Elsevier, 2019.

Figure 5.
(a) EBSD relative Euler orientation map; (b) 0.5° boundaries superimposed; (c) {111} pole figures (PF) showing orientation of matrix region (green), and microshear bands (blue). Reproduced from [27] with permission from Elsevier, 2003.
Figure 5.
(a) EBSD relative Euler orientation map; (b) 0.5° boundaries superimposed; (c) {111} pole figures (PF) showing orientation of matrix region (green), and microshear bands (blue). Reproduced from [27] with permission from Elsevier, 2003.

Figure 6.
Microstructures of the as-cast Al-7wt%Si alloy after equal channel angular extrusion (ECAE) for N = 3 at 20 °C (a–c) and 160 °C (d–f). (a,d) IPF maps; (b,e) geometrically necessary dislocation (GND) density mapping as calculated from kernel average misorientation (KAM); (c,f): Magnifications of (b,e) respectively (ellipses and asterisks denote aluminum; rectangles denote eutectic zones). Reproduced from [32] with permission from Elsevier, 2019.

Figure 7.
KAM maps for Fe–50Co–10V alloy annealed at various temperatures showing high-strain (green) and low-strain (blue) areas. Reproduced from [31] with permission from Elsevier, 2019.
Figure 7.
KAM maps for Fe–50Co–10V alloy annealed at various temperatures showing high-strain (green) and low-strain (blue) areas. Reproduced from [31] with permission from Elsevier, 2019.

Figure 8.
Microstructure of sintered Ti6Al4V alloy with the addition of 4 vol.% TiN: (a) SEM image, (b) phase map, (c) IPF, and (d) index maps. Reproduced from [44] with permission from Elsevier, 2019.
Figure 8.
Microstructure of sintered Ti6Al4V alloy with the addition of 4 vol.% TiN: (a) SEM image, (b) phase map, (c) IPF, and (d) index maps. Reproduced from [44] with permission from Elsevier, 2019.

Figure 9.
The selective laser melting (SLM) samples of CoCrFeMnNi produced with different volumetric energy density (VED): (a) IPF images; (b) and (d) grain boundary angle distribution; (c) grain size distribution. Reproduced from [52] with permission from Elsevier, 2020.
Figure 9.
The selective laser melting (SLM) samples of CoCrFeMnNi produced with different volumetric energy density (VED): (a) IPF images; (b) and (d) grain boundary angle distribution; (c) grain size distribution. Reproduced from [52] with permission from Elsevier, 2020.

Figure 10.
Morphology and microstructure of transverse cross-sections of the single tracks of 316 L stainless steel with scanning speeds of (a,d) 0.75, (b,e) 0.5, and (c,f) 0.25 ms−1. The boundary of the melting pool is marked by the black dot line. The grain is colored according to the legend in the subplot. Reproduced from [53] with permission from Elsevier, 2020.

Figure 11.
Macrostructure and IPF of cross-section of the SLM-fabricated Inconel 718 samples at the laser power of 500 W (a,a1), 800 W (b,b1), 1200 W (c,c1), 1500 W (d,d1), 1800 W (e,e1), and 2000 W (f,f1); (g) evolution of the size of the molten pool with the increase of laser power; (h) aspect ratio of the columnar grain at various laser powers; (i) size of columnar grain at different laser powers; (yellow lines represent the molten pool boundary). Reproduced from [54] with permission from Elsevier, 2020.

Figure 12.
Inverse pole figure (IPF) maps showing martensite grain orientation in the cross-section of (a) bead zone (BZ, center), (b) dilution zone (DZ, center), (c) interface zone (IZ) between the dilution zone (DZ, interface) and heat-affected zone (HAZ, substrate); (d) stereographic triangle of IPF color map. Reproduced from [55] with permission from Elsevier, 2020.

Figure 13.
Transmission Kikuchi diffraction (TKD) result of Cr2N precipitates at a ferrite–ferrite grain boundary in the HAZ of a super duplex stainless steel weldment: (a) Phase map; (b) Grain boundary (GB) map; (c–e) are KAM maps using 1st and 2nd-order scheme, respectively; (f,g) are GND maps using 1st and 2nd-order schemes, respectively. Reproduced from [93] with permission from Elsevier, 2019.

Figure 14.
IPF orientation distribution of the various nanoprecipitates detected by TKD. (a) M23C6 (b) M2X (c) M7C3 (d) MX, and (e) IPF color distribution of the nanoprecipitates where M is metallic elements and X interstitial elements C or N. Reproduced from [95] with permission from Elsevier, 2019.

Figure 15.
EBSD characterization of a hot-rolled Ti6Al4V sheet surface-treated by pulsed laser: (a) band contrast (BC) and (c) IPF maps of the 100 W specimen; (b) BC and (d) IPF maps of the 200 W specimen; (e,f) misorientation angle and rotation axis distributions corresponding to (c,d), respectively. Reproduced from [60] with permission from Elsevier, 2020.

Figure 16.
EBSD inverse pole figures and histograms of misorientation angle between neighboring grains of AISI 304SS (a,b) as-received, (c,d) laser shock peening (LSP)ed sample with 3 J and (e,f) LSPed sample with 6 J. Reproduced from [61] with permission from Elsevier, 2017.
Figure 16.
EBSD inverse pole figures and histograms of misorientation angle between neighboring grains of AISI 304SS (a,b) as-received, (c,d) laser shock peening (LSP)ed sample with 3 J and (e,f) LSPed sample with 6 J. Reproduced from [61] with permission from Elsevier, 2017.

Figure 17.
EBSD microstructural characterization of the sample with high Z (1000 °C, 0.5s−1) condition: (a) HAGBs overlayed band contrast map, (b) phase map, and (c) KAM maps; (d) HAGBs and LAGBs overlaid band contrast map, (e) misorientation graphs, and (f) dynamic recrystallization (DRX)-partitioned IPF map of γ-phase. (g) HAGBs and LAGBs overlaid band contrast map, (h) misorientation graphs and (i) DRX-partitioned IPF map of α2-phase; and (j) HAGBs and LAGBs overlaid band contrast map, (k) misorientation graphs, and (l) DRX-partitioned IPF map of β-phase. Adapted from [71] with permission from Elsevier, 2020.

Figure 18.
IPF maps and local average misorientation (LAM) maps of (a) Al–Cu after an equivalent plastic strain of 0.34, (b) Al–Cu after an equivalent strain of 0.42, (c) Al–Cu–Mn–Mg after an equivalent strain of 0.30, (d) Al–Cu–Mn–Mg after an equivalent strain of 0.47, (e) after an equivalent strain of 0.11, and (f) after an equivalent strain of 0.22. Adapted from [65] with permission from Elsevier, 2015.

Figure 19.
IPF and grain reference orientation deviation (GROD) maps of interrupted type 25Cr–20Ni–Nb–N and 18Cr–9Ni– 3Cu–Nb–N austenitic stainless steel specimens under various creep conditions (σ0, T) and creep strain (elongations). Reproduced from [67] with permission from Elsevier, 2019.
Figure 19.
IPF and grain reference orientation deviation (GROD) maps of interrupted type 25Cr–20Ni–Nb–N and 18Cr–9Ni– 3Cu–Nb–N austenitic stainless steel specimens under various creep conditions (σ0, T) and creep strain (elongations). Reproduced from [67] with permission from Elsevier, 2019.

Figure 20.
IPF obtained from the three EBSD acquisitions, (a) EBSD_0, (b) EBSD_1, and (c) EBSD_2, (d) the microstructure at the initial step, and (e) the strain map εxx. Reproduced from [68] with permission from Elsevier, 2019.
Figure 20.
IPF obtained from the three EBSD acquisitions, (a) EBSD_0, (b) EBSD_1, and (c) EBSD_2, (d) the microstructure at the initial step, and (e) the strain map εxx. Reproduced from [68] with permission from Elsevier, 2019.


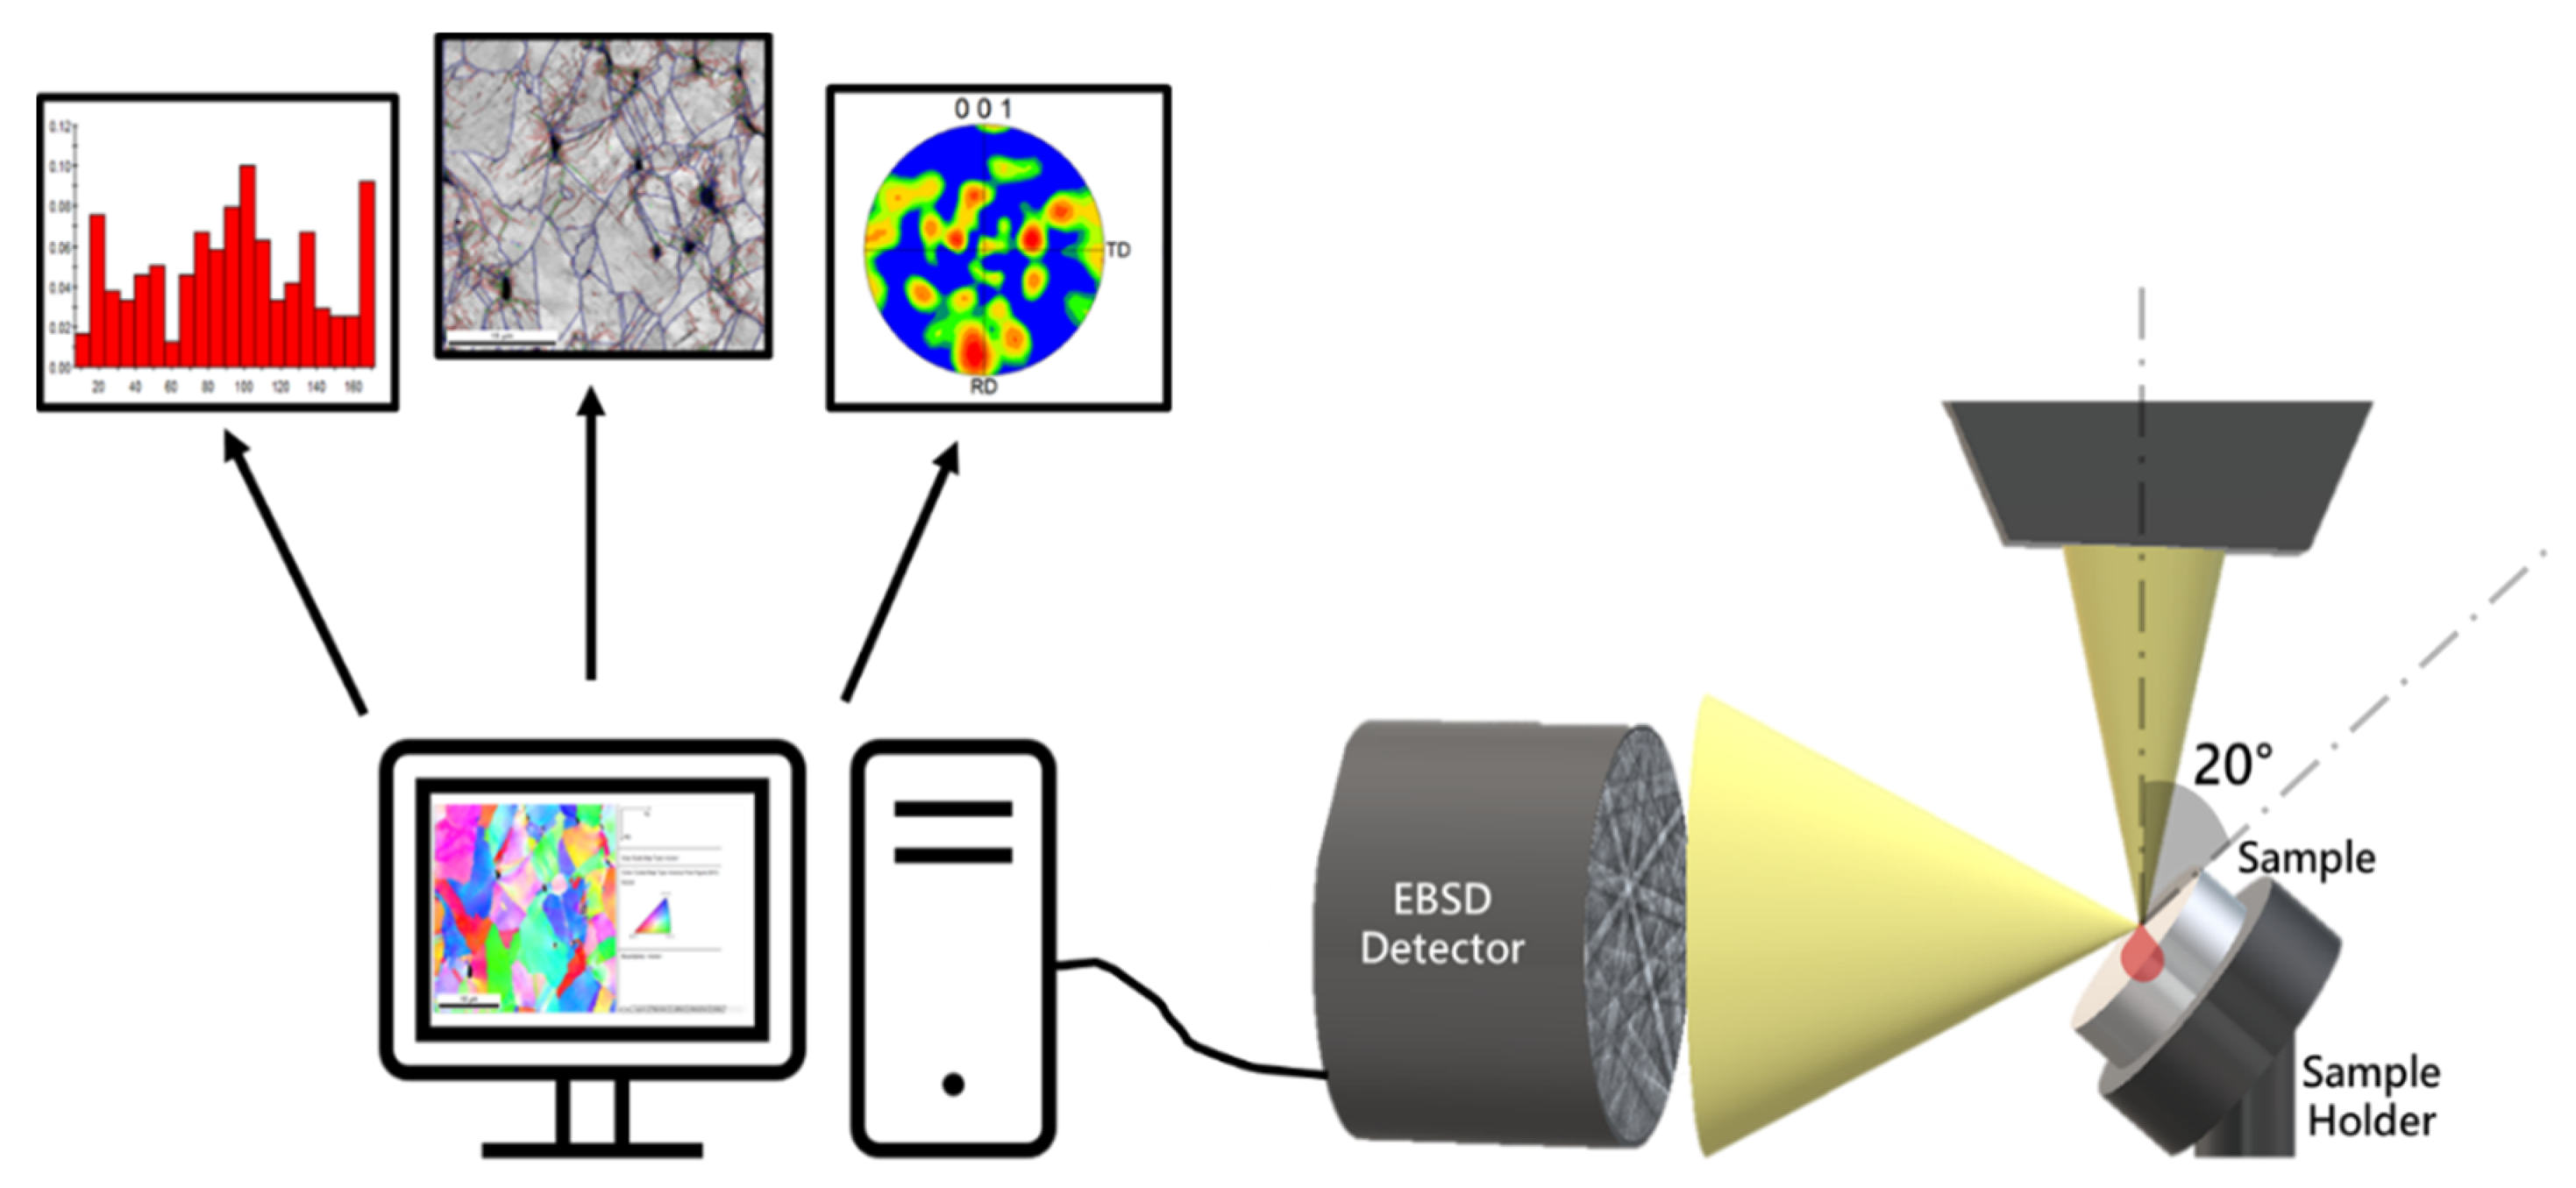
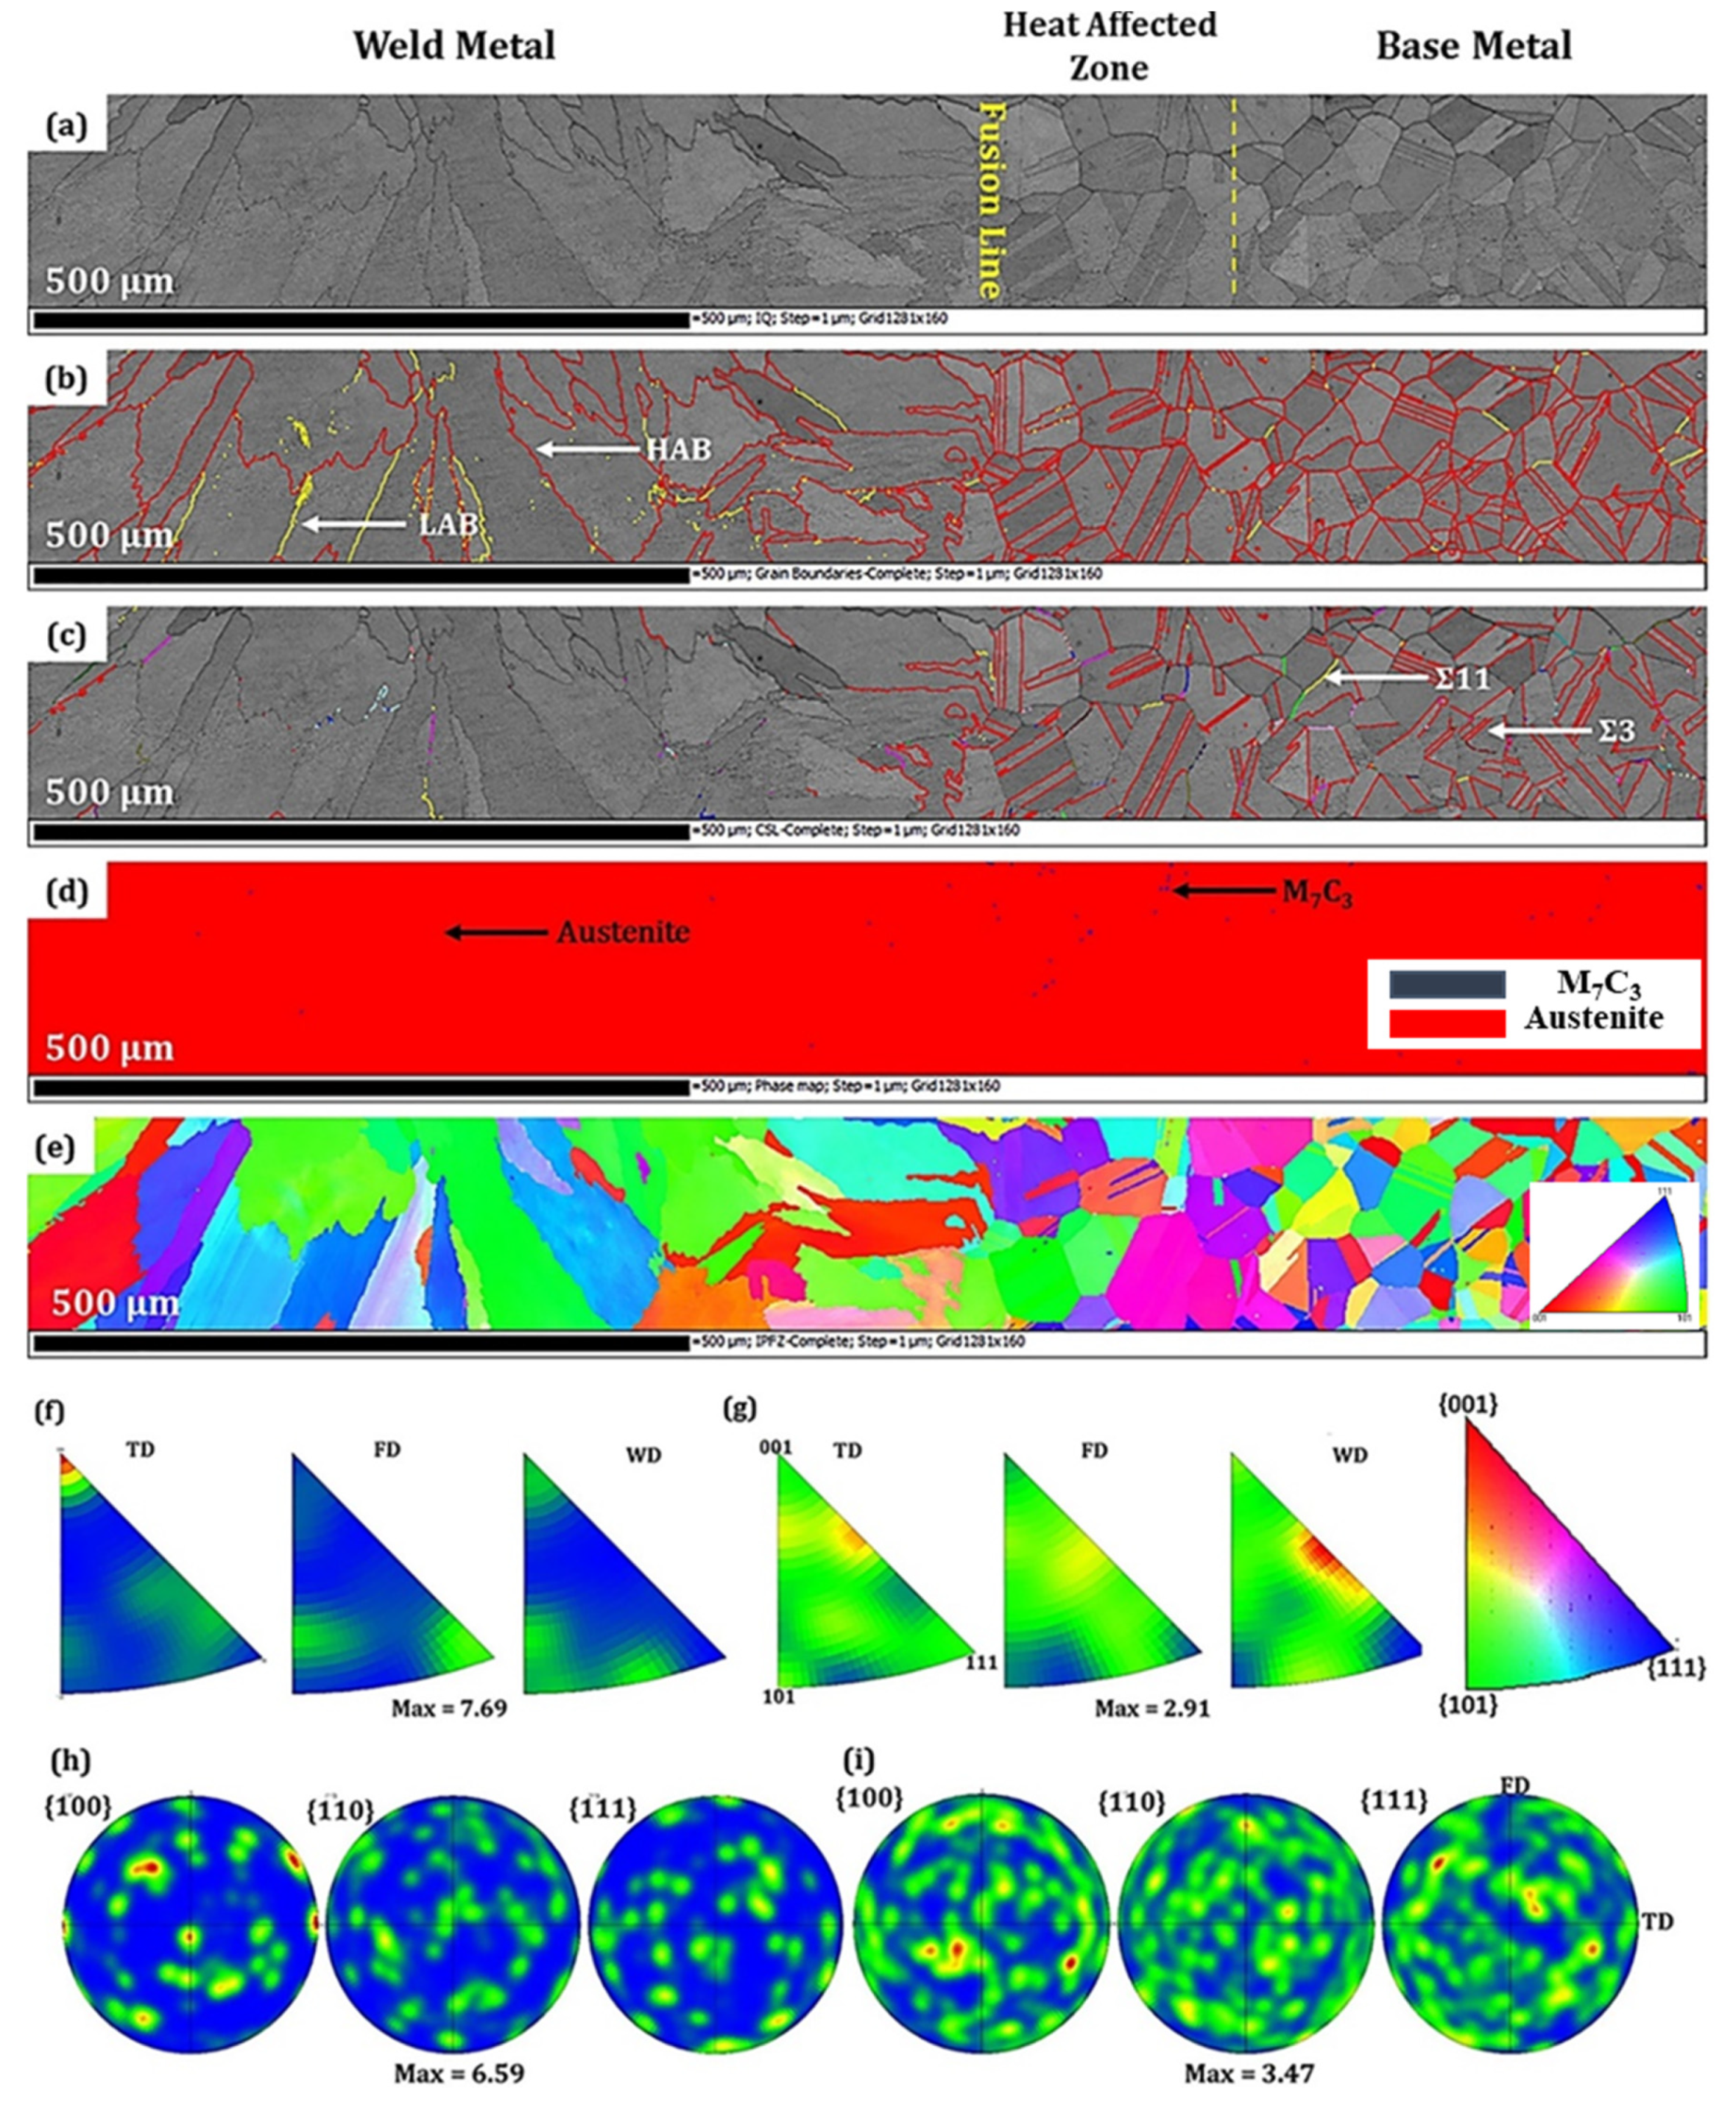
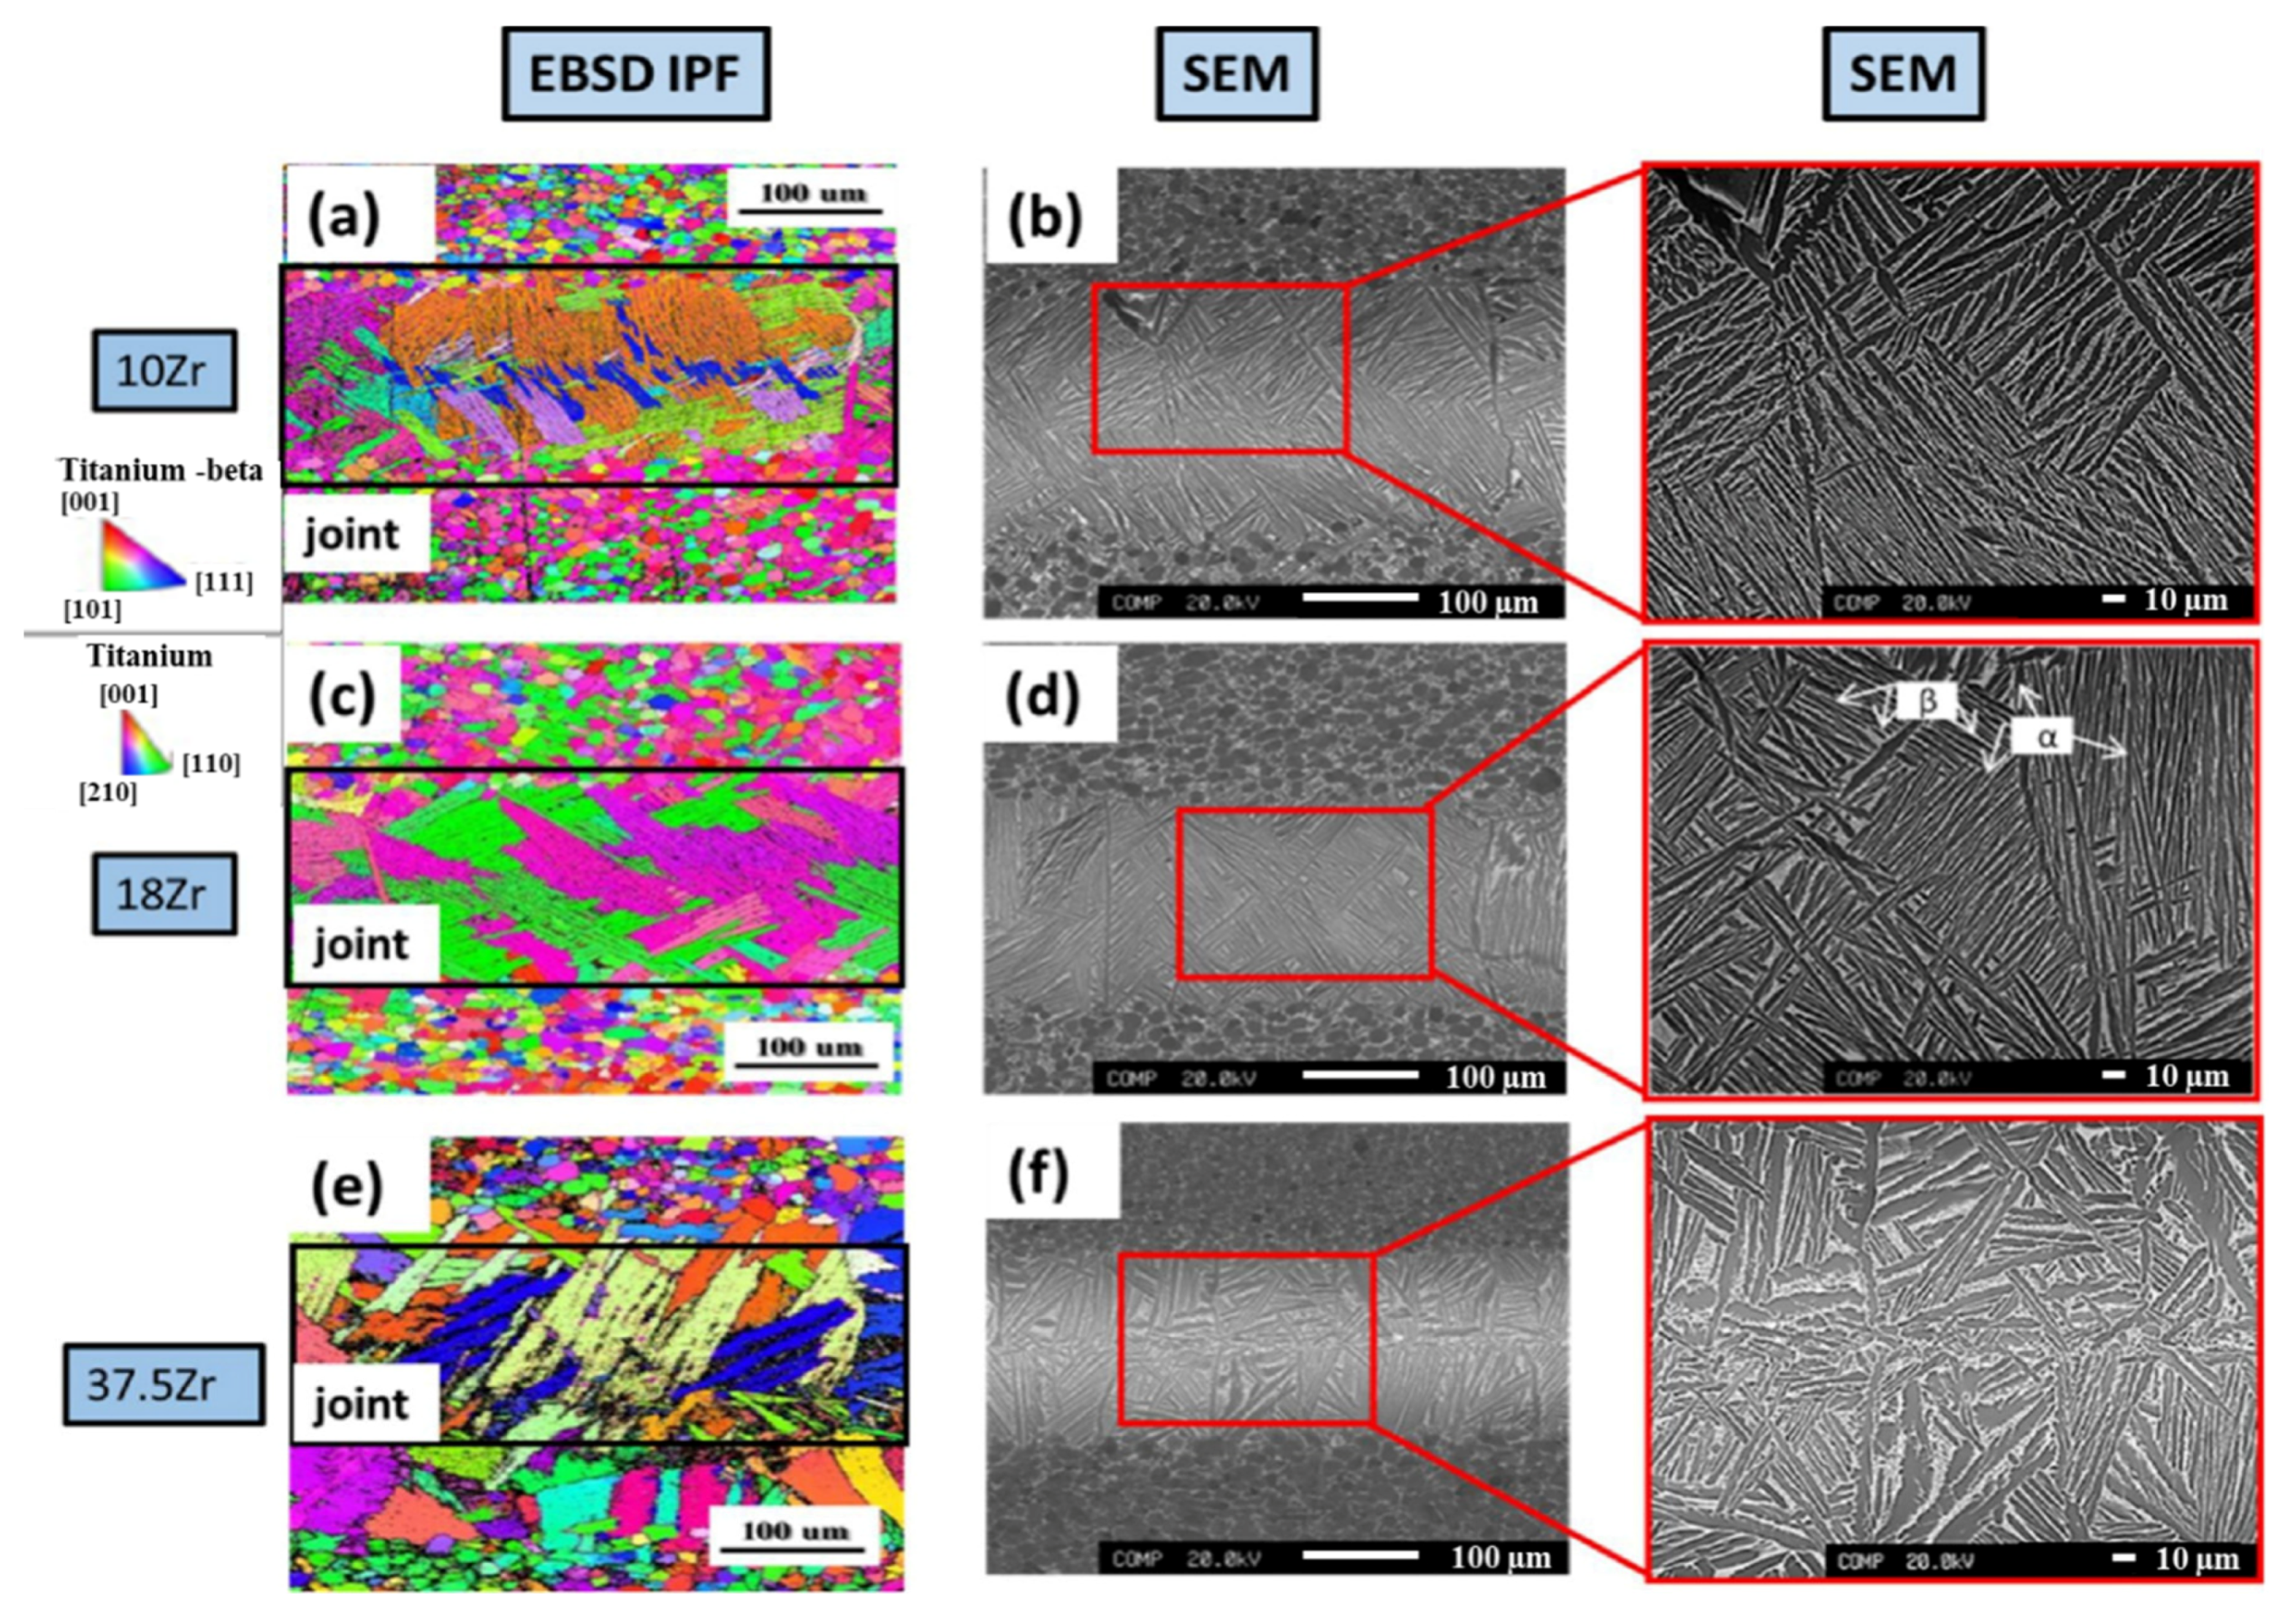
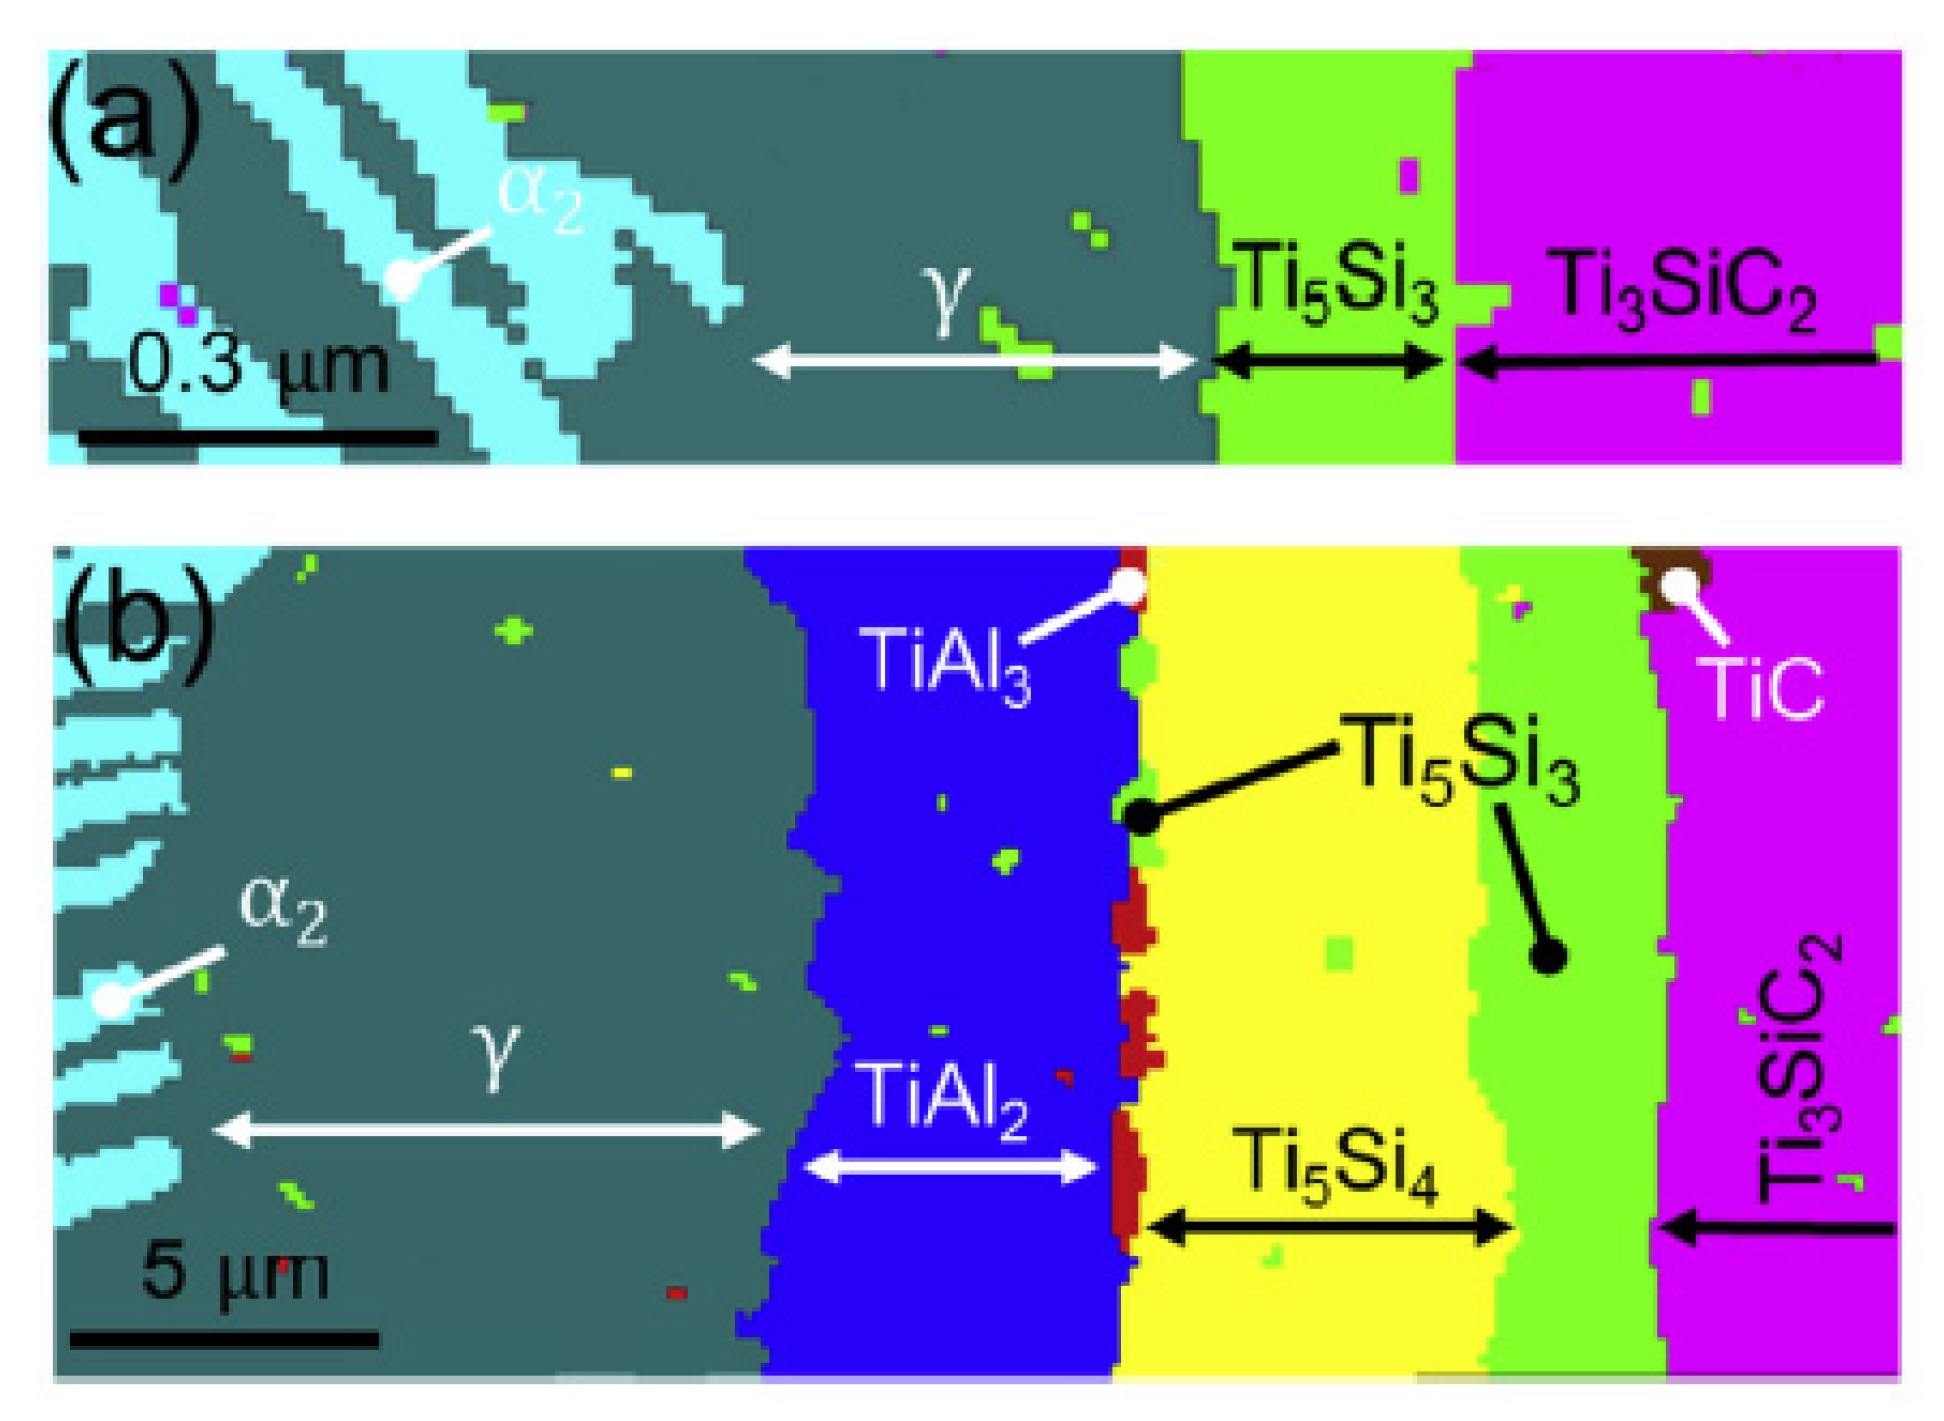
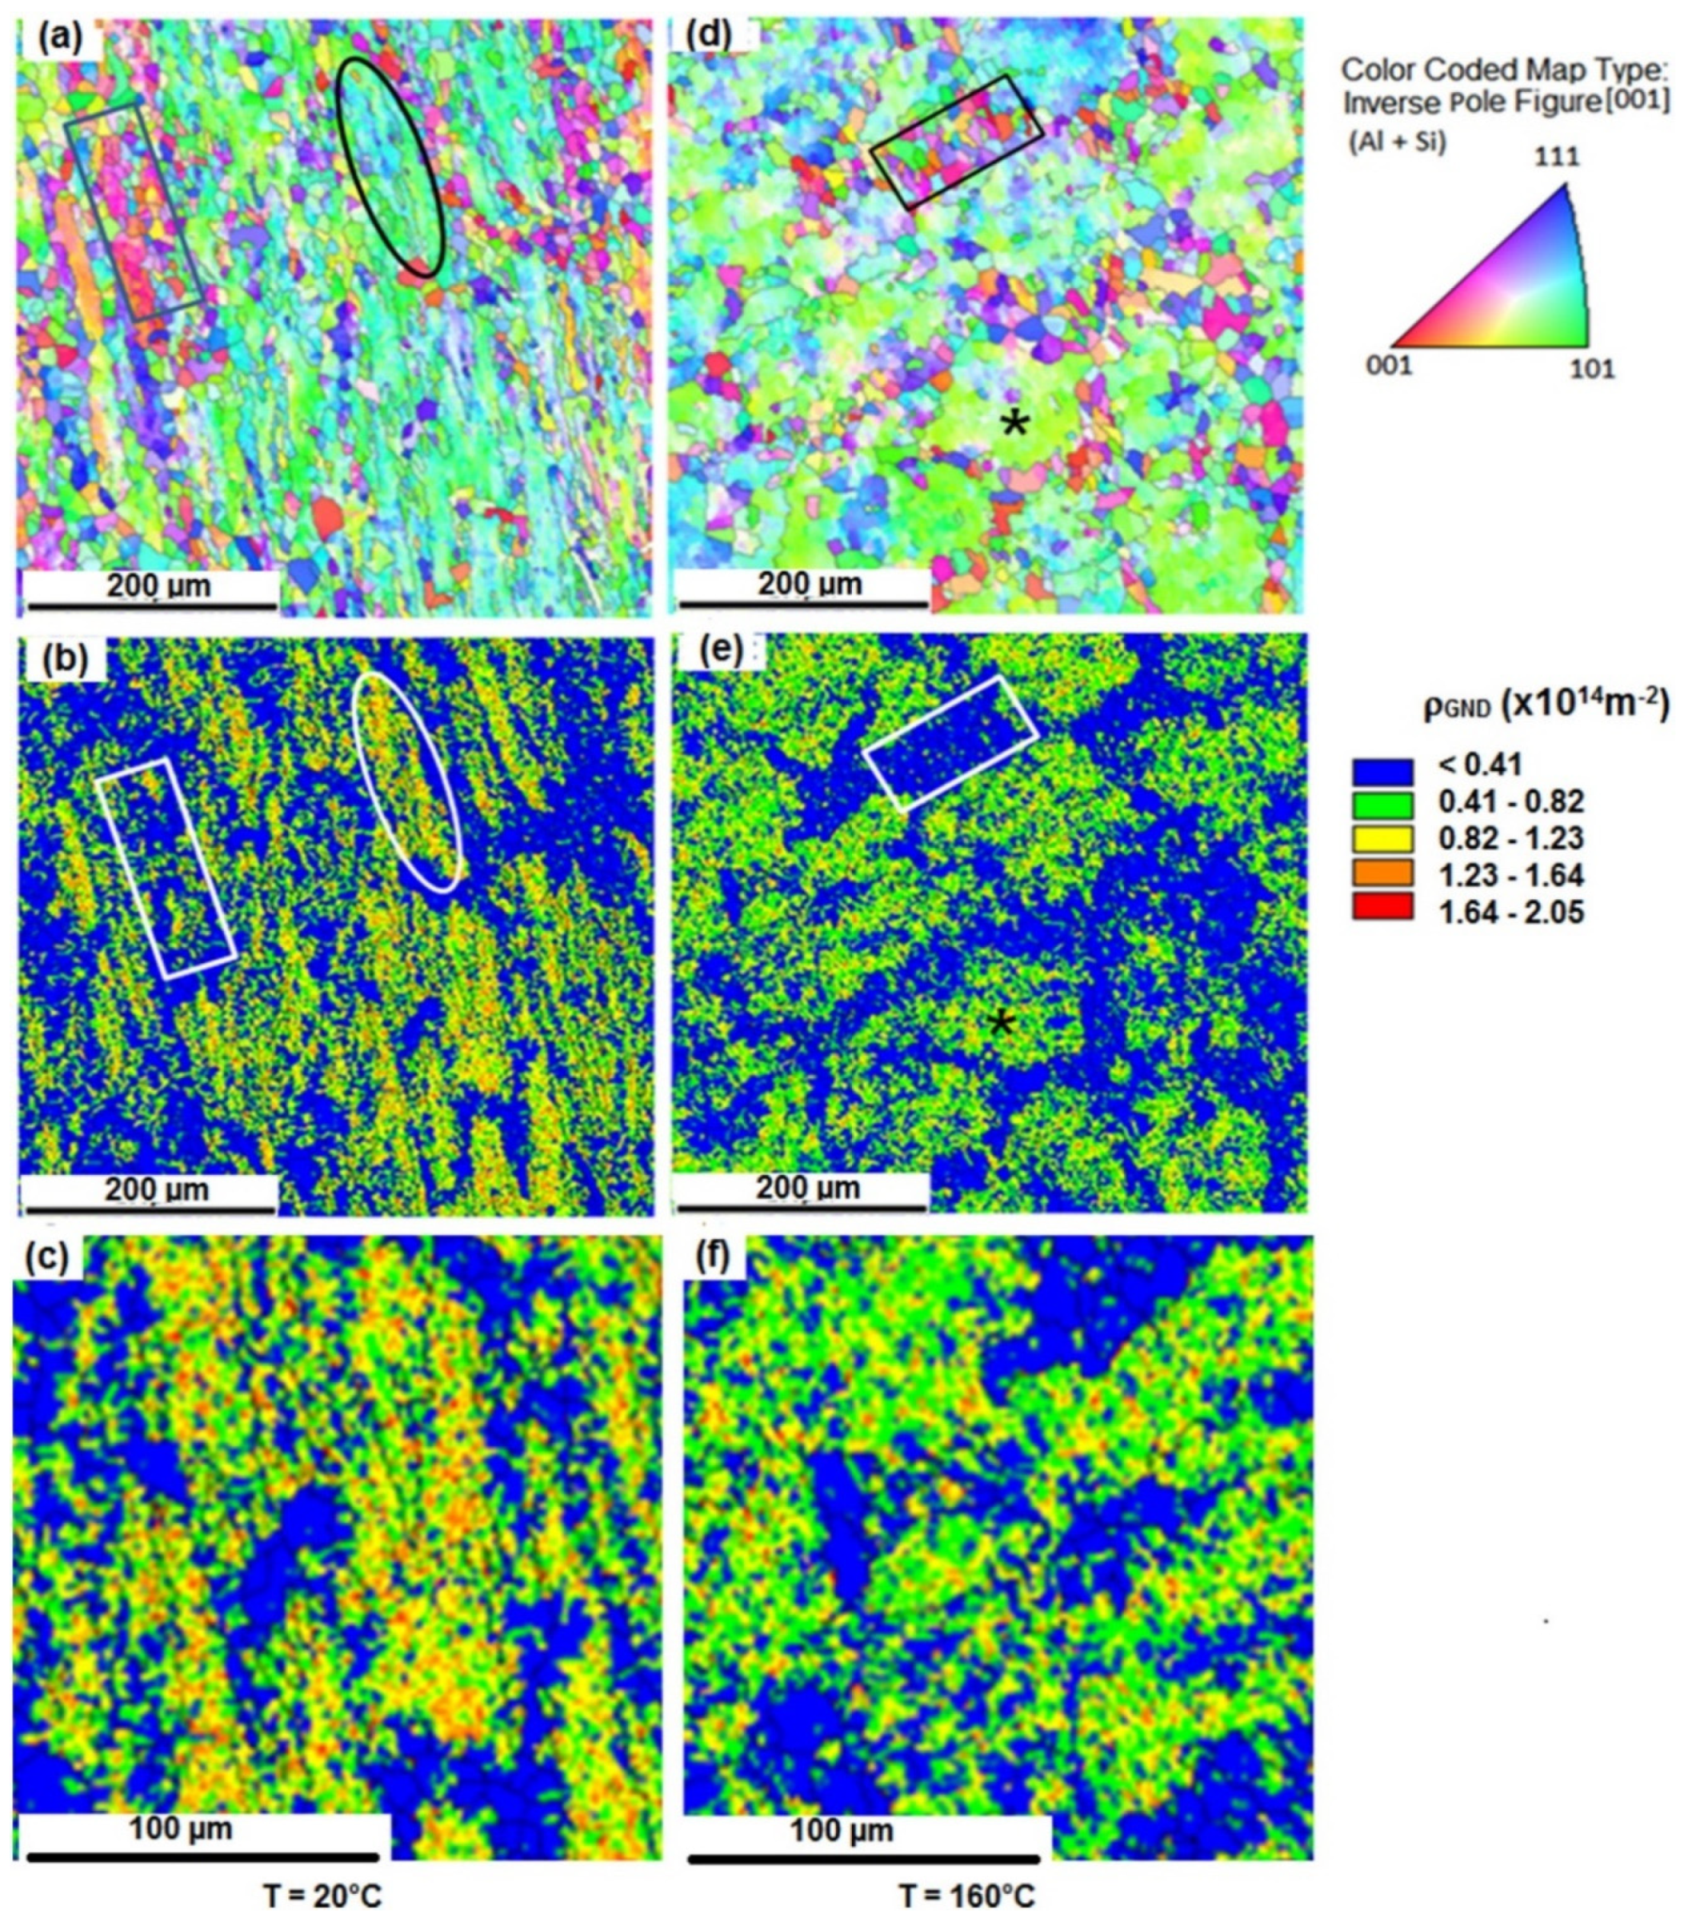
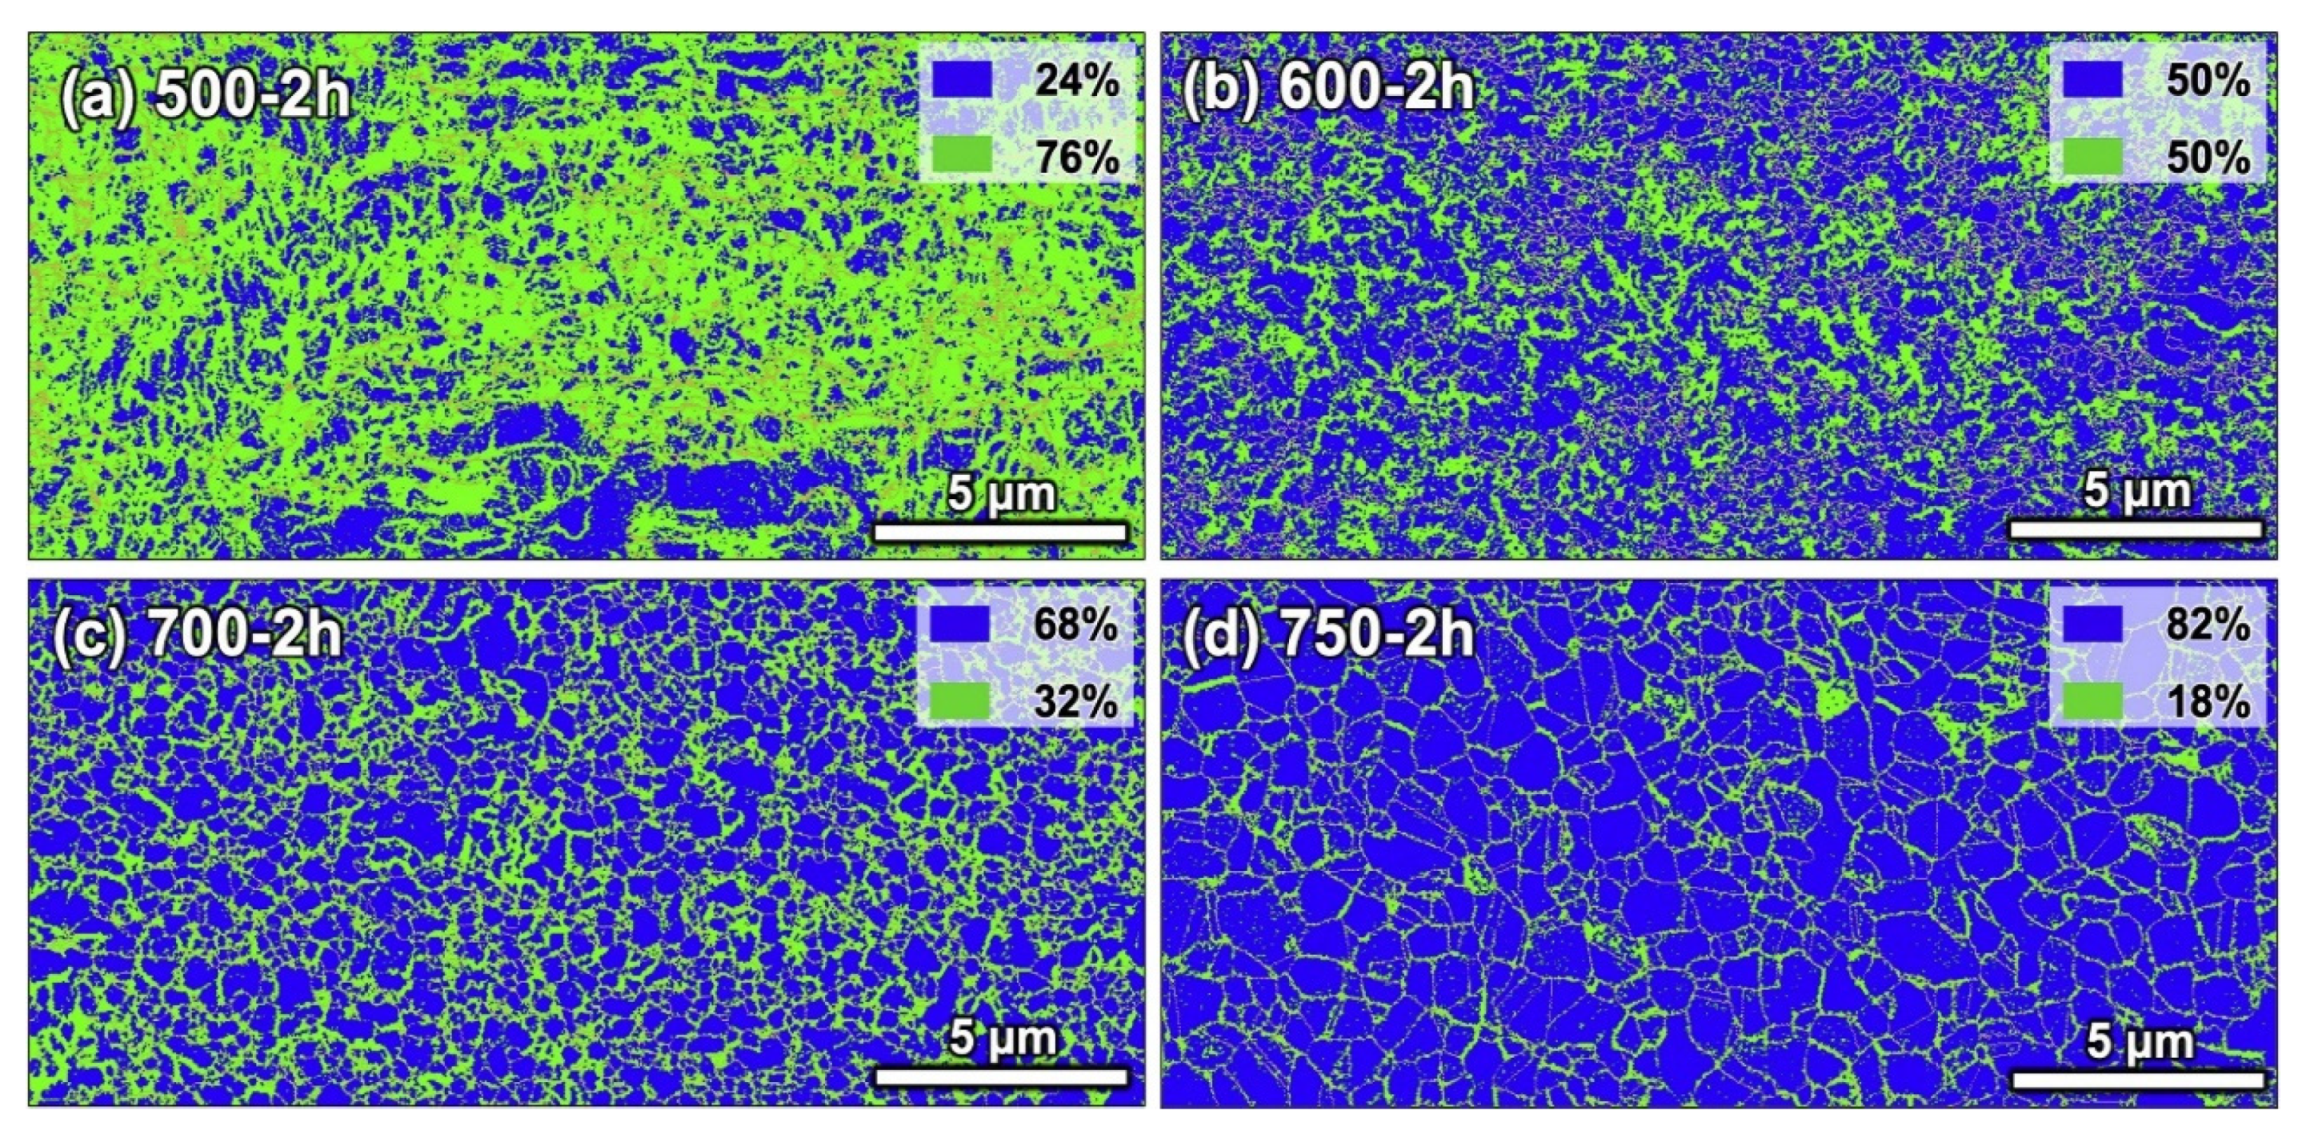
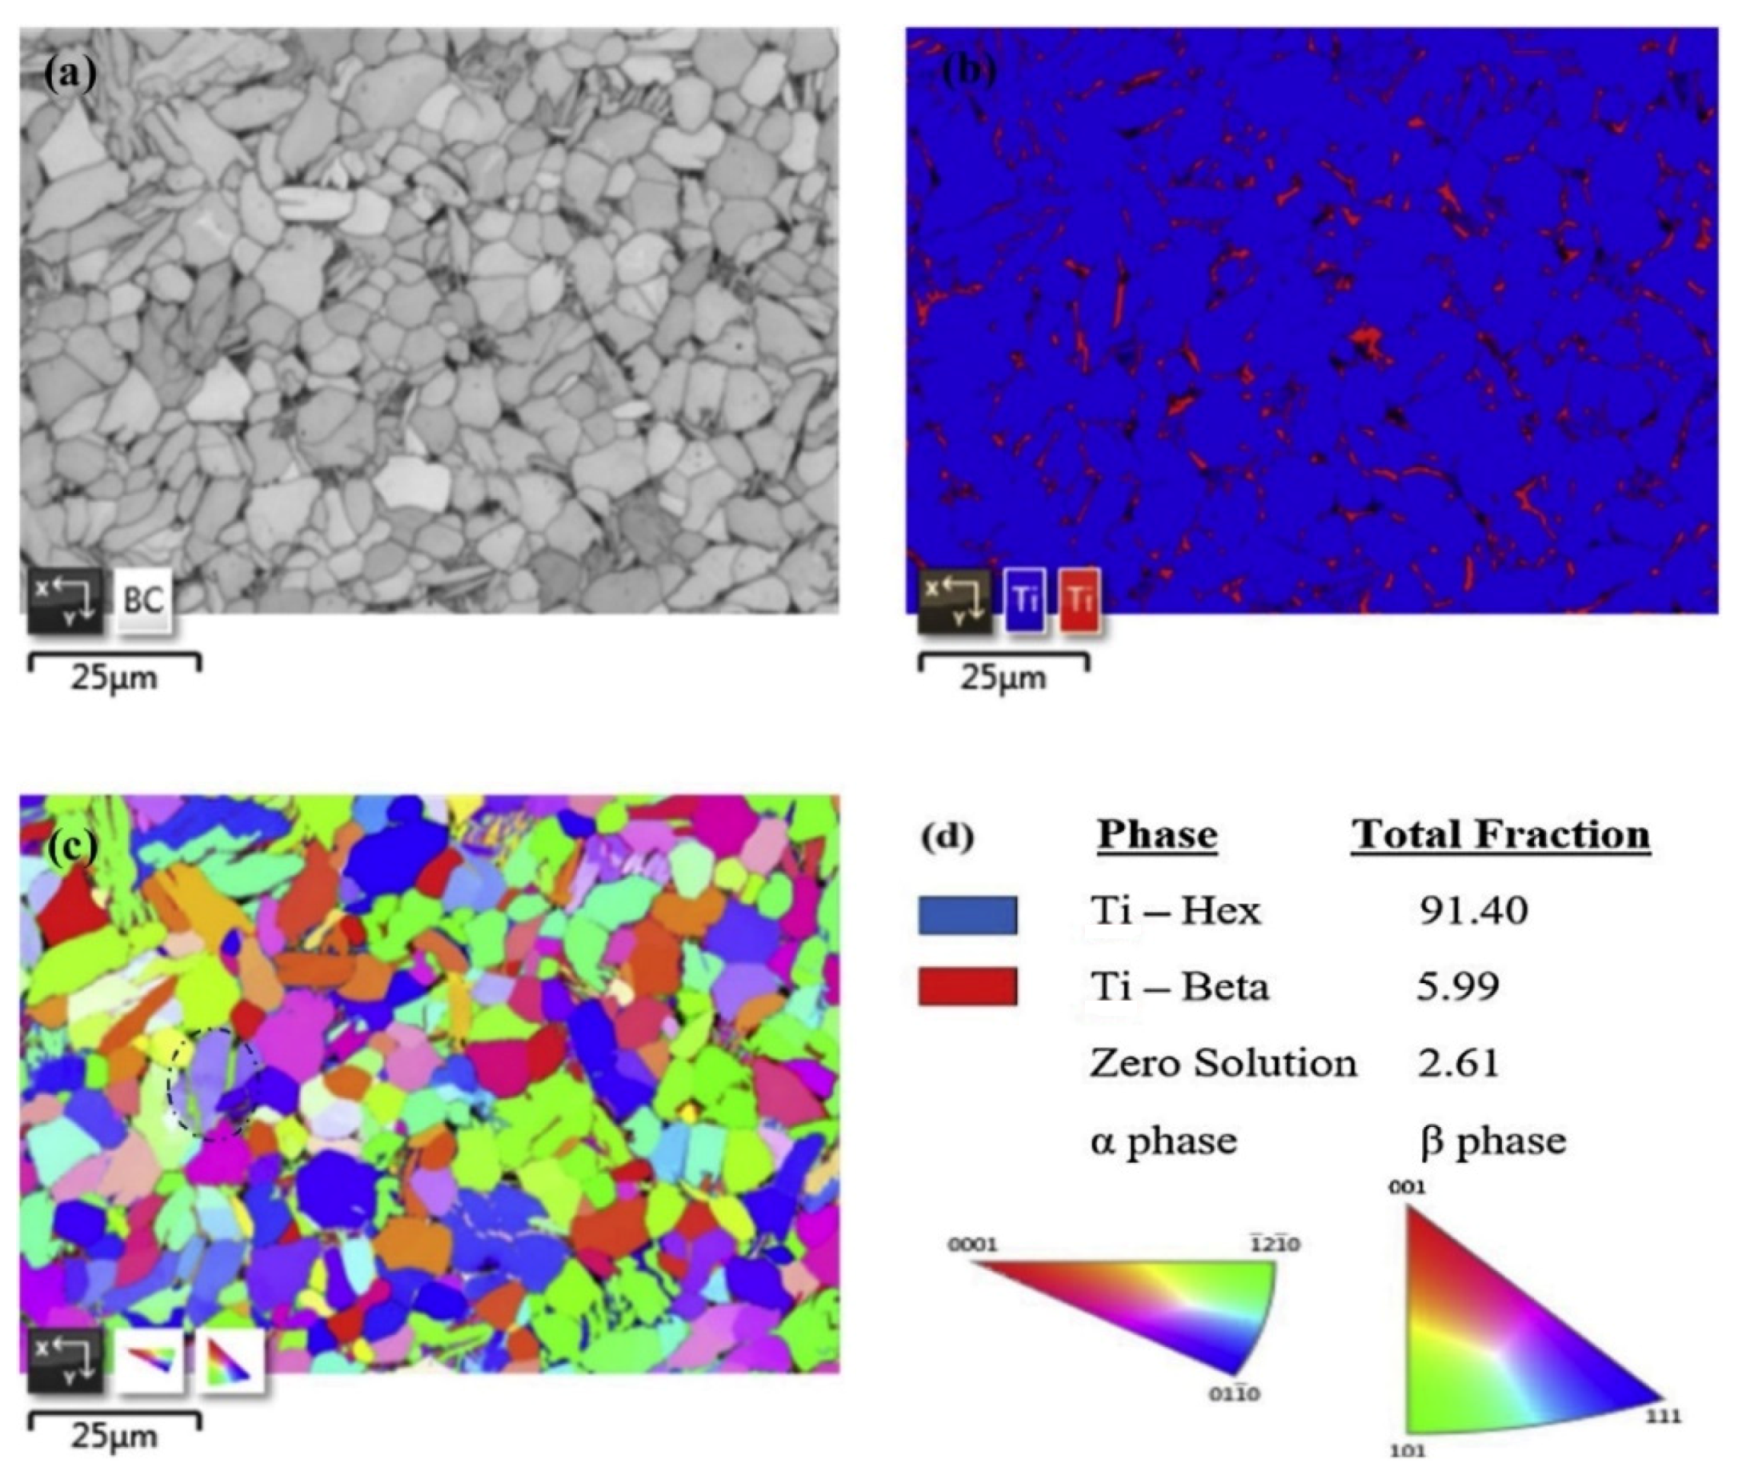
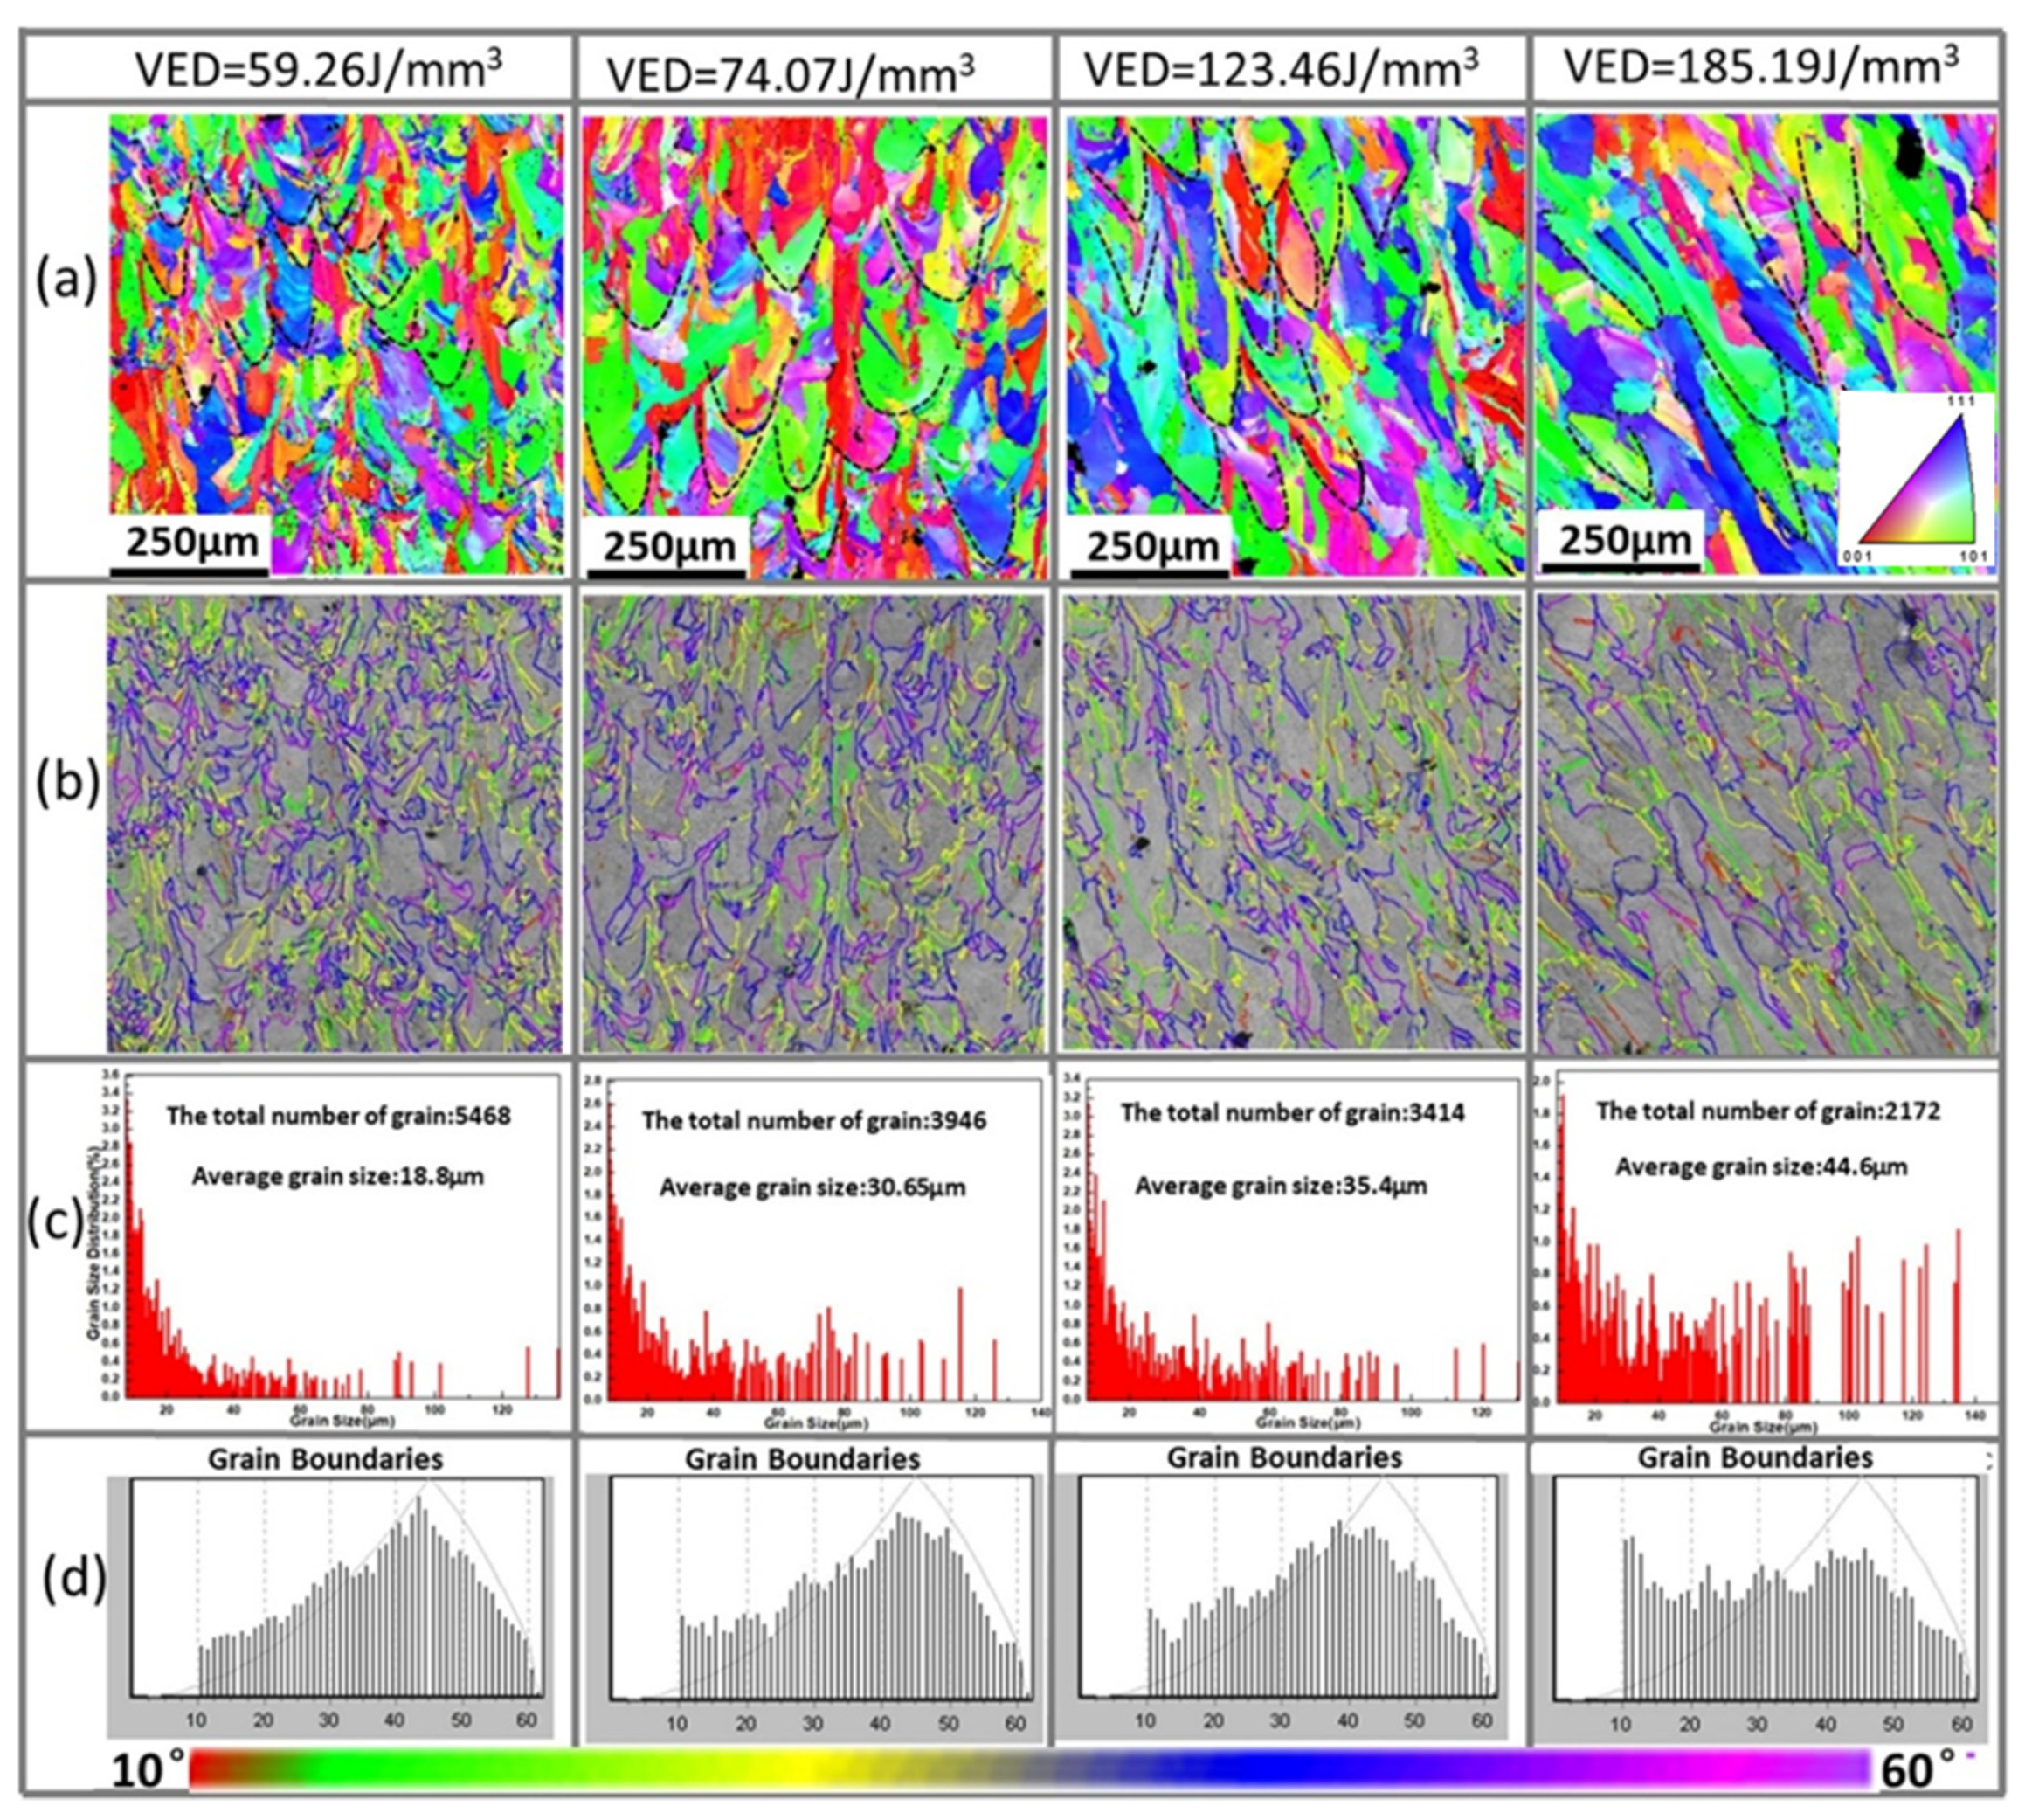
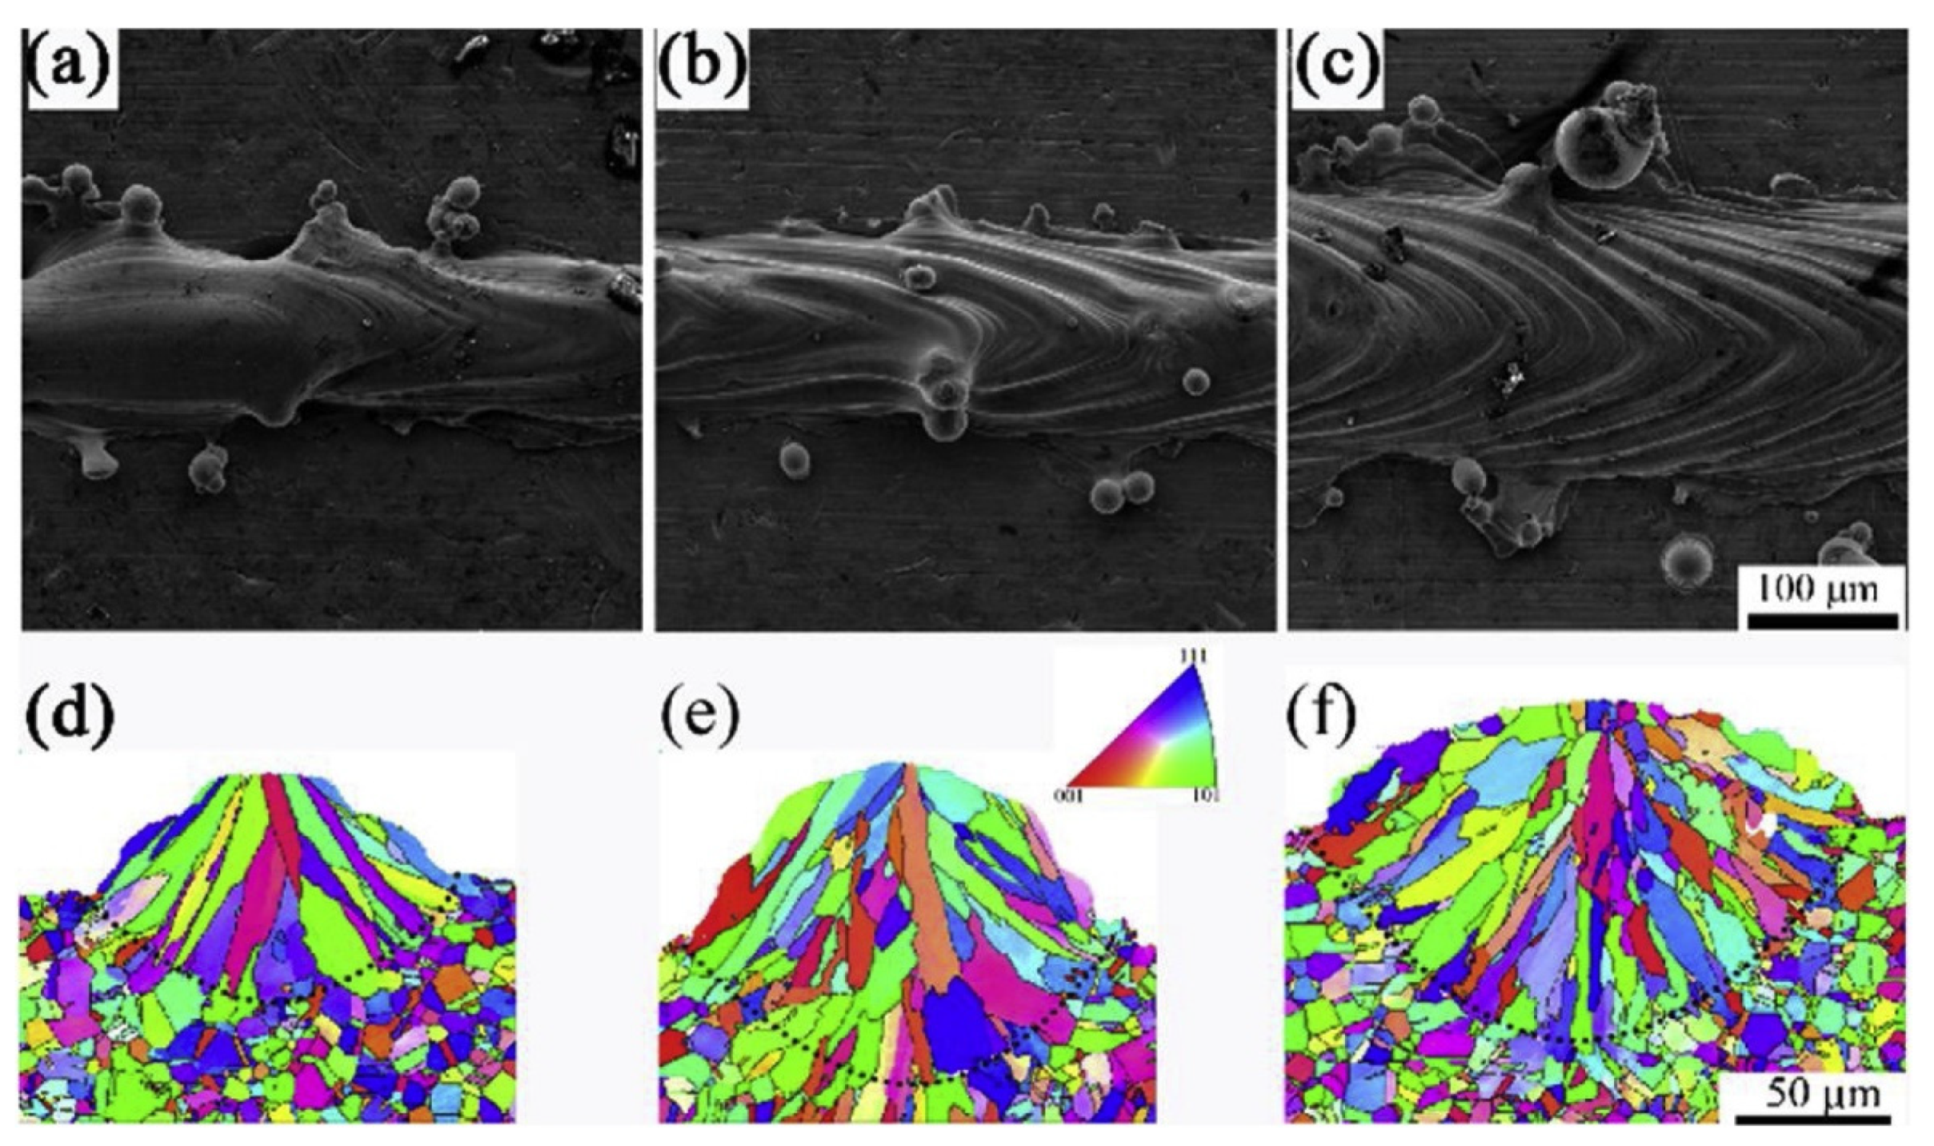
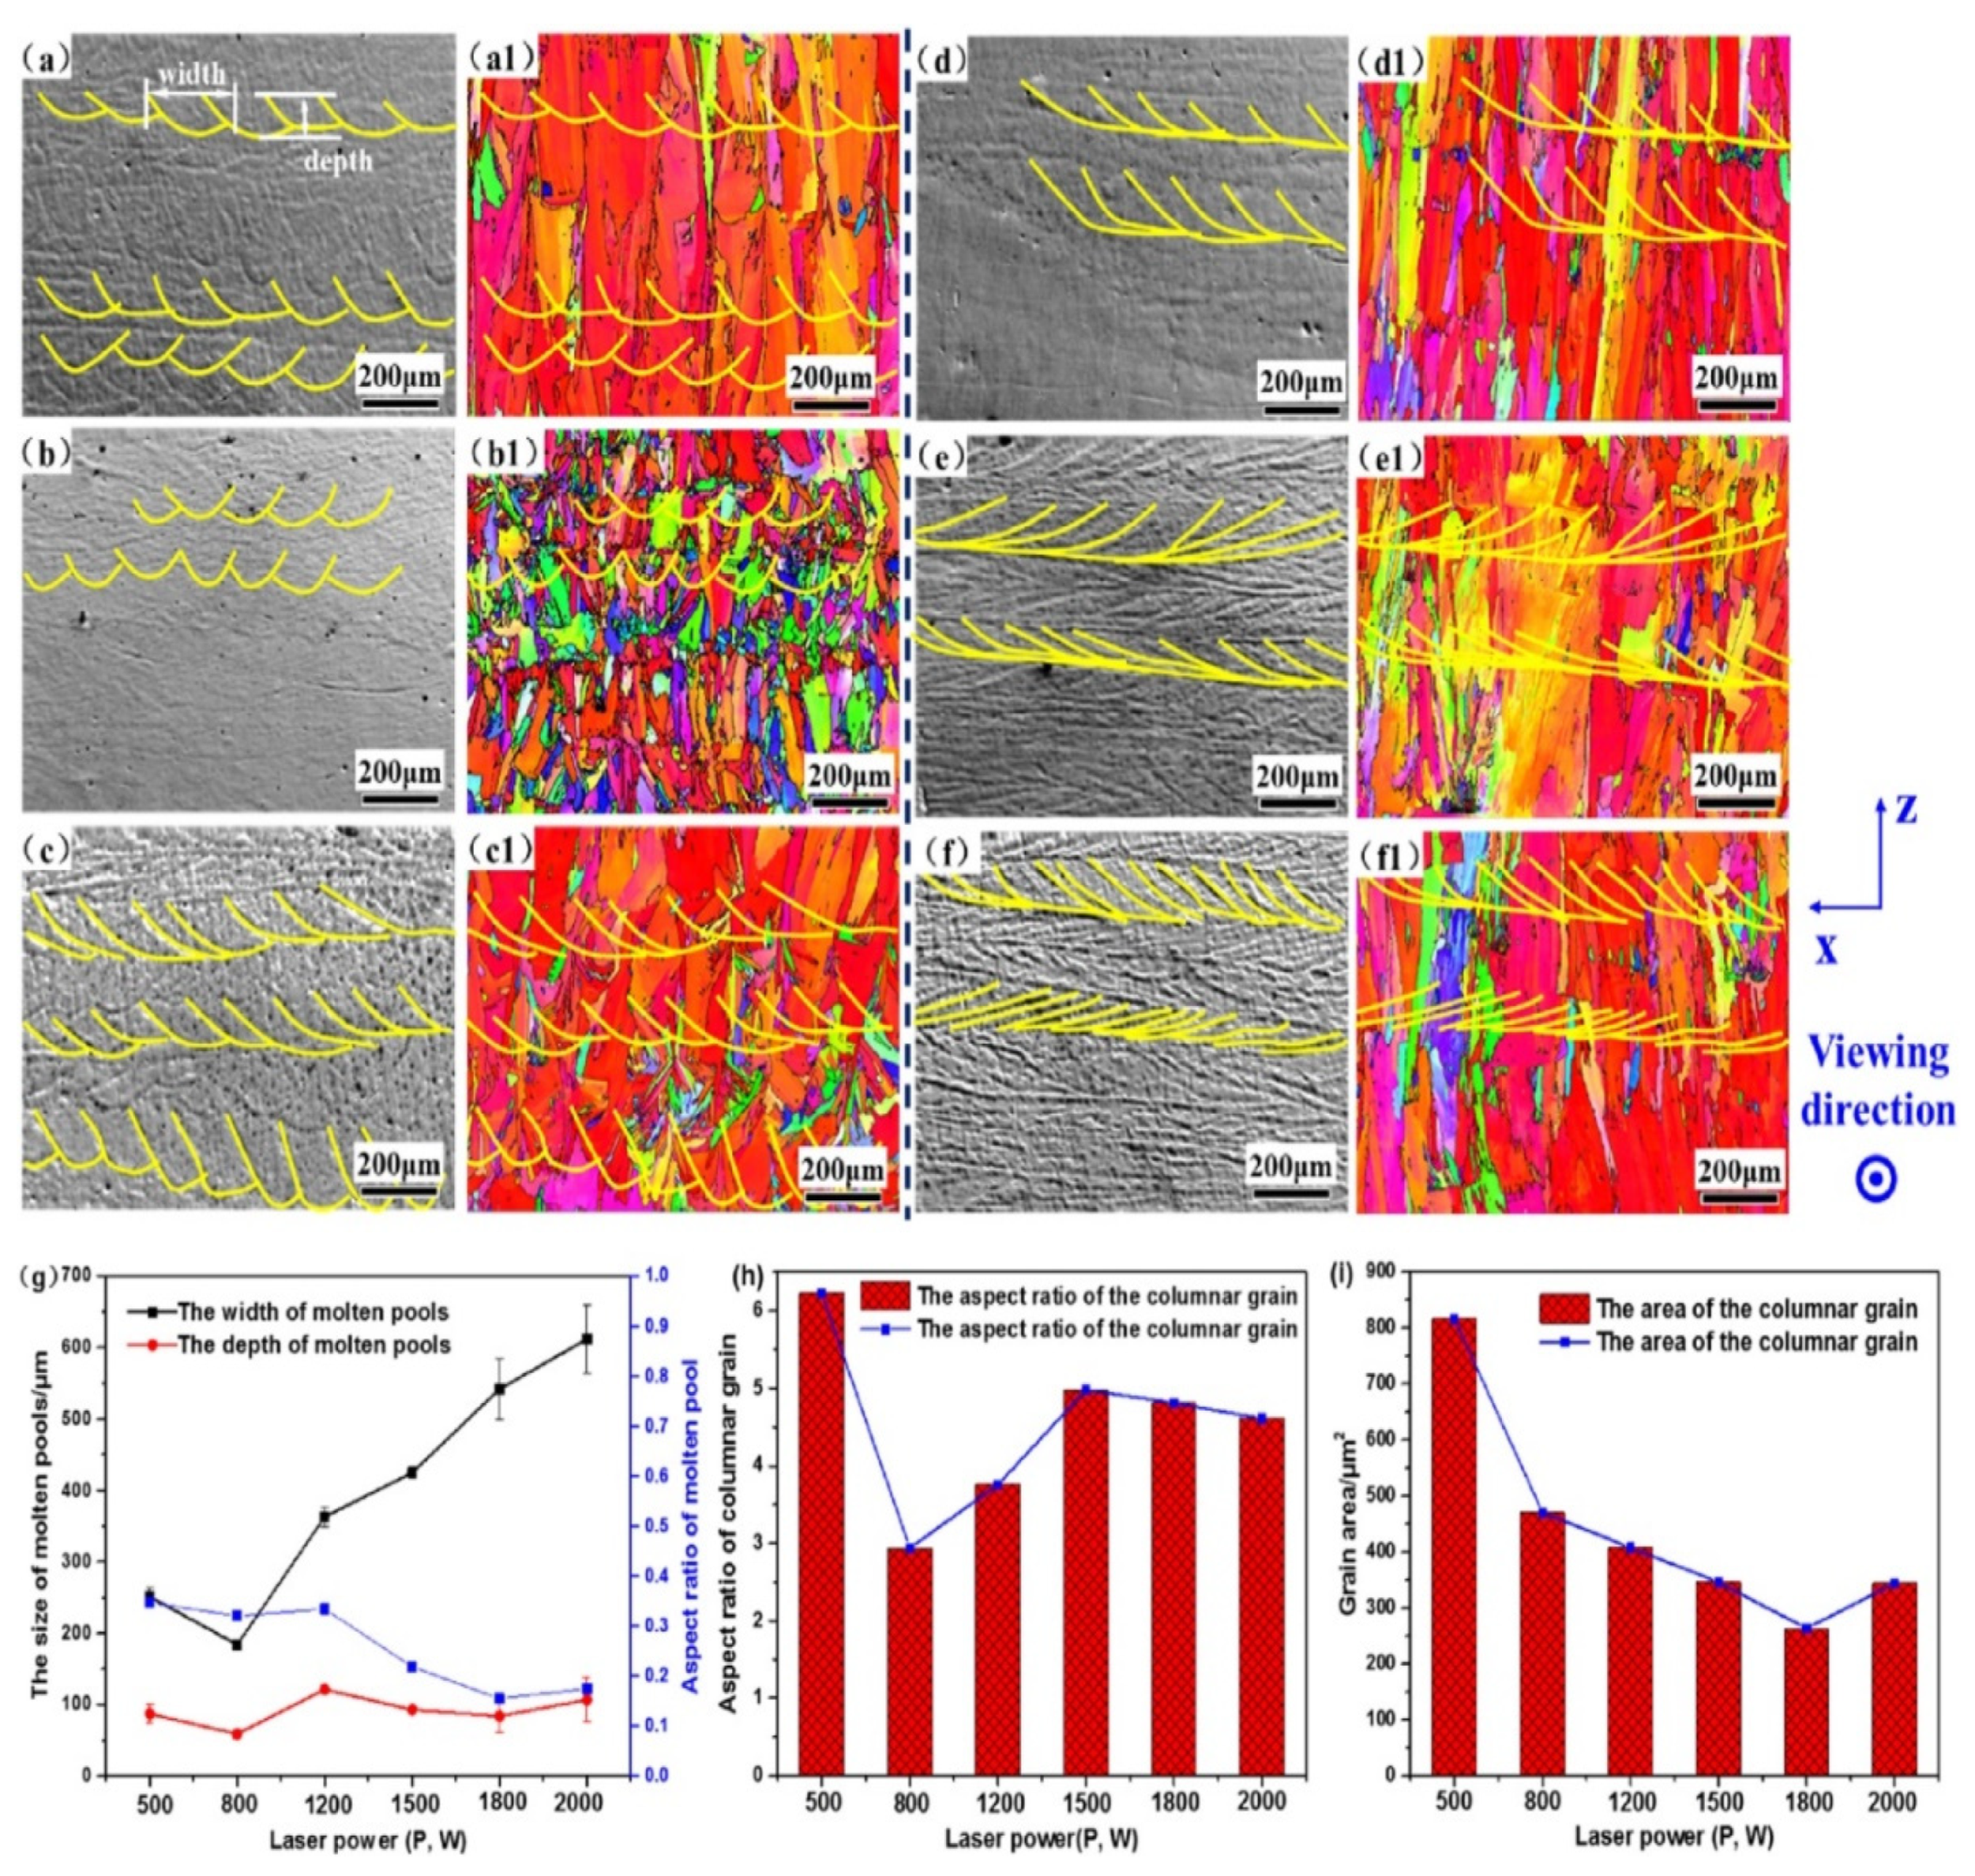
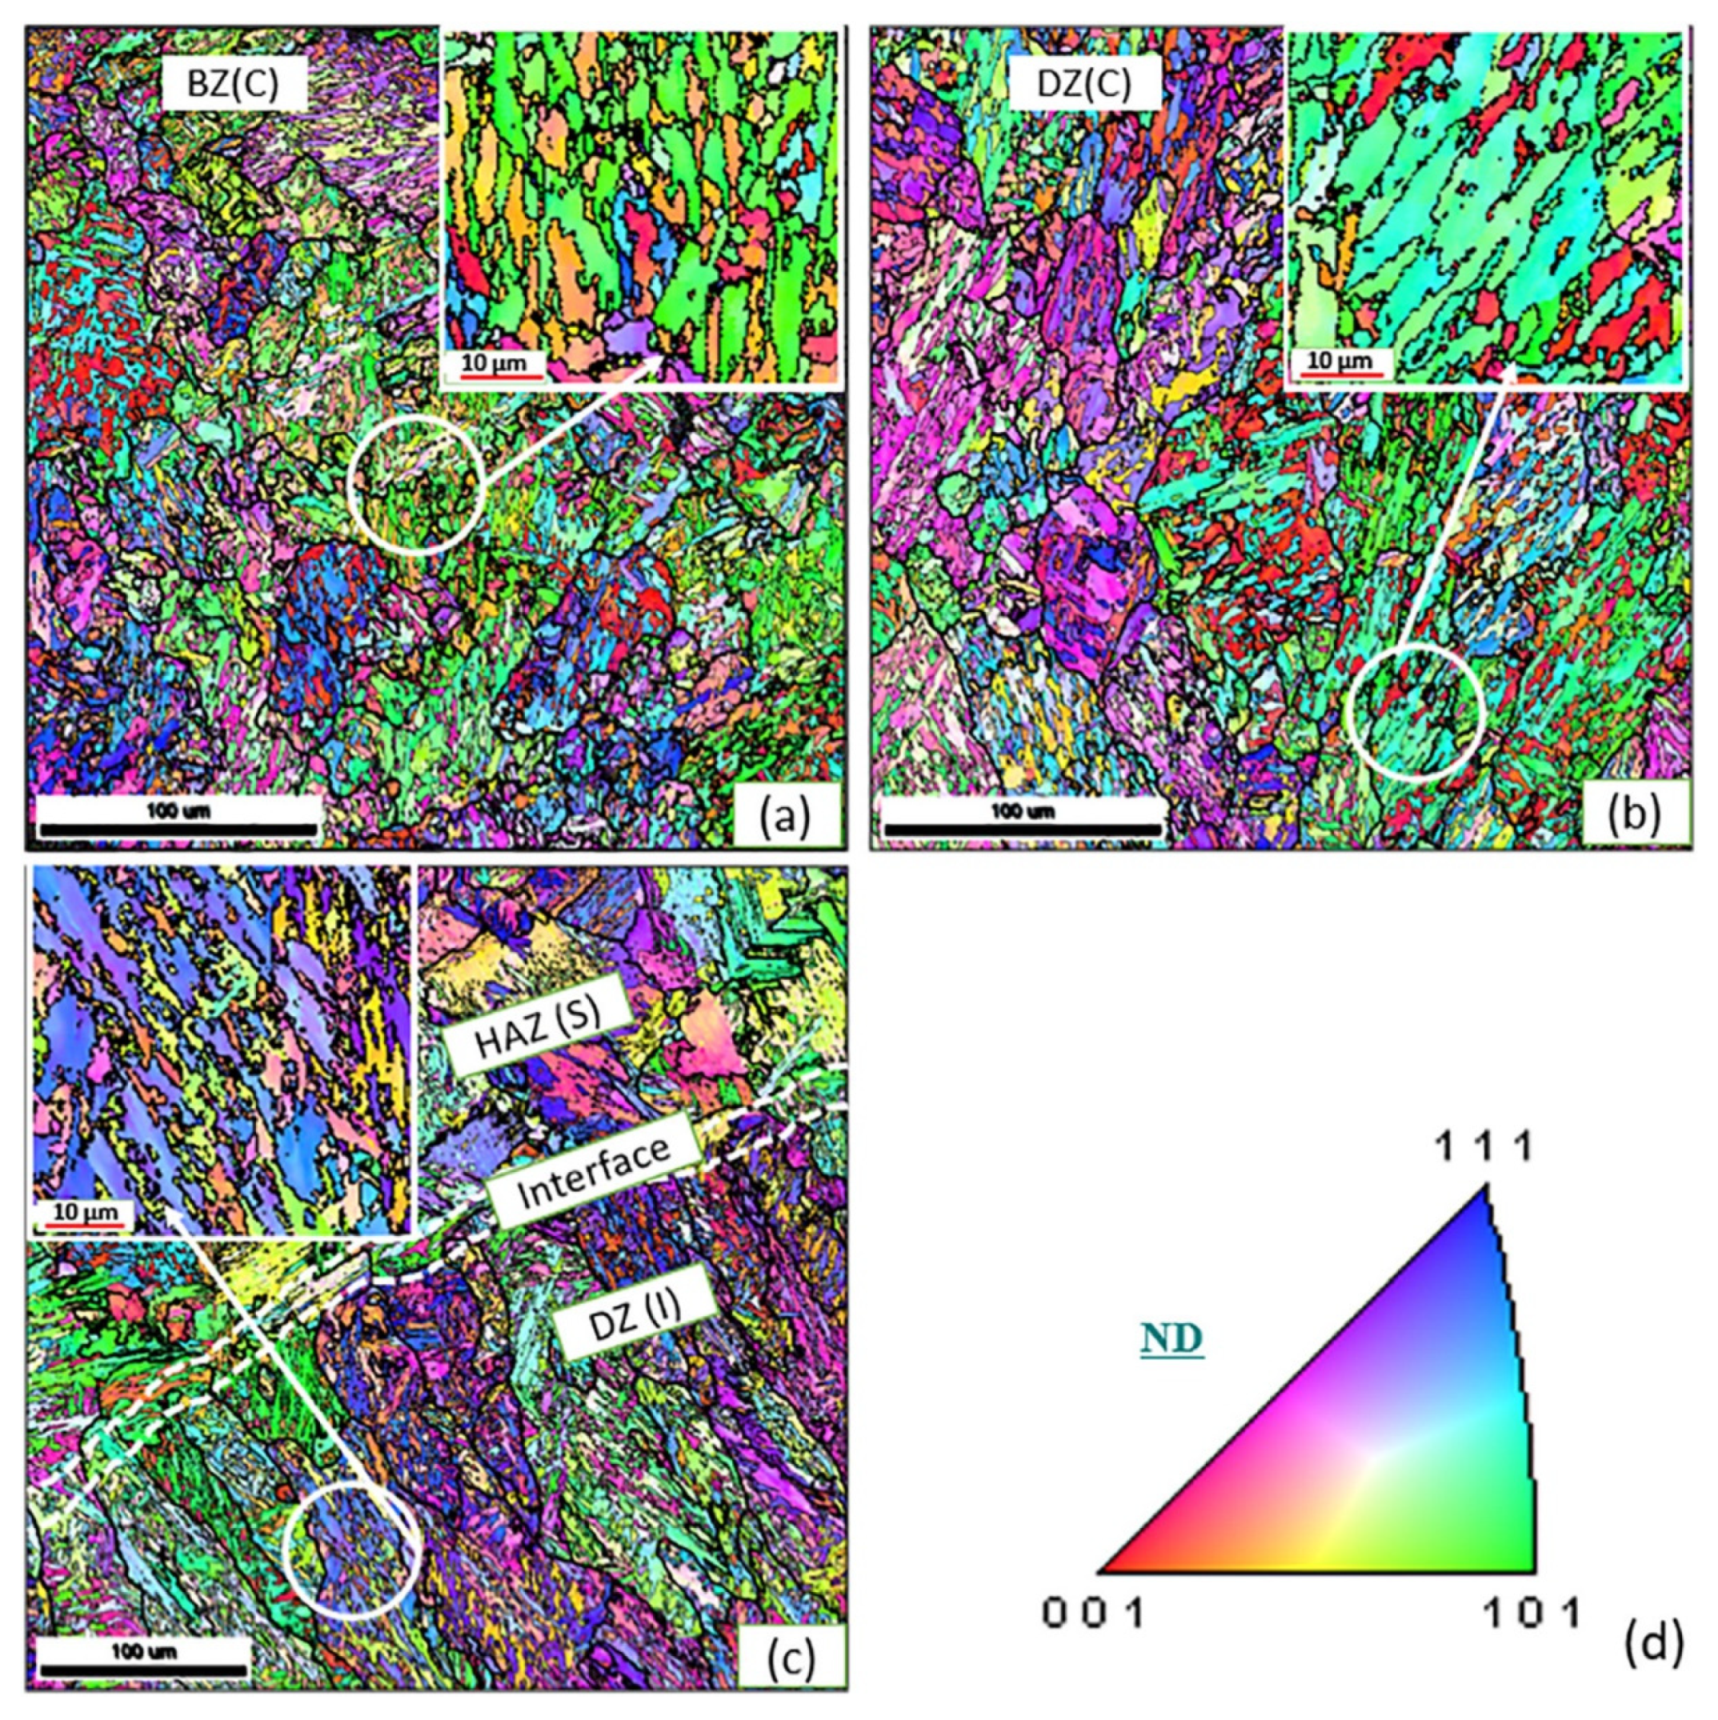
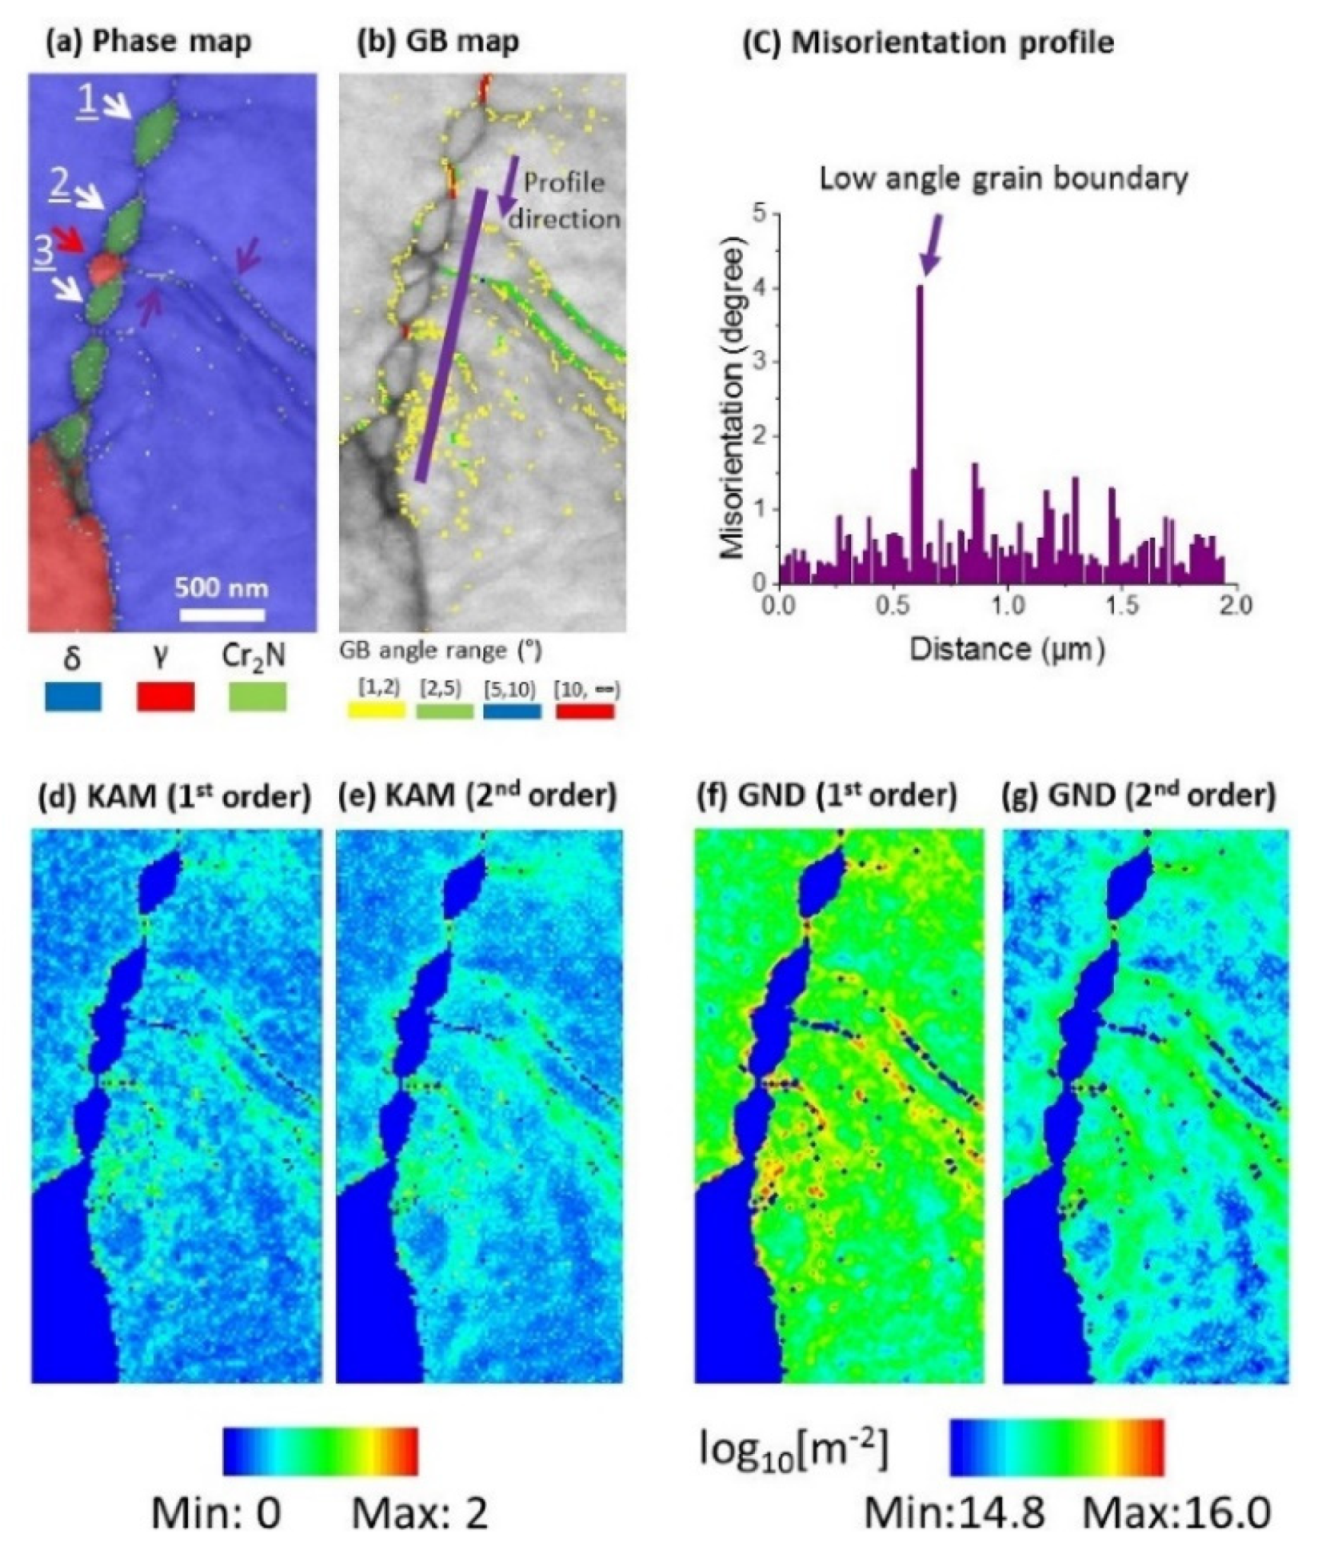
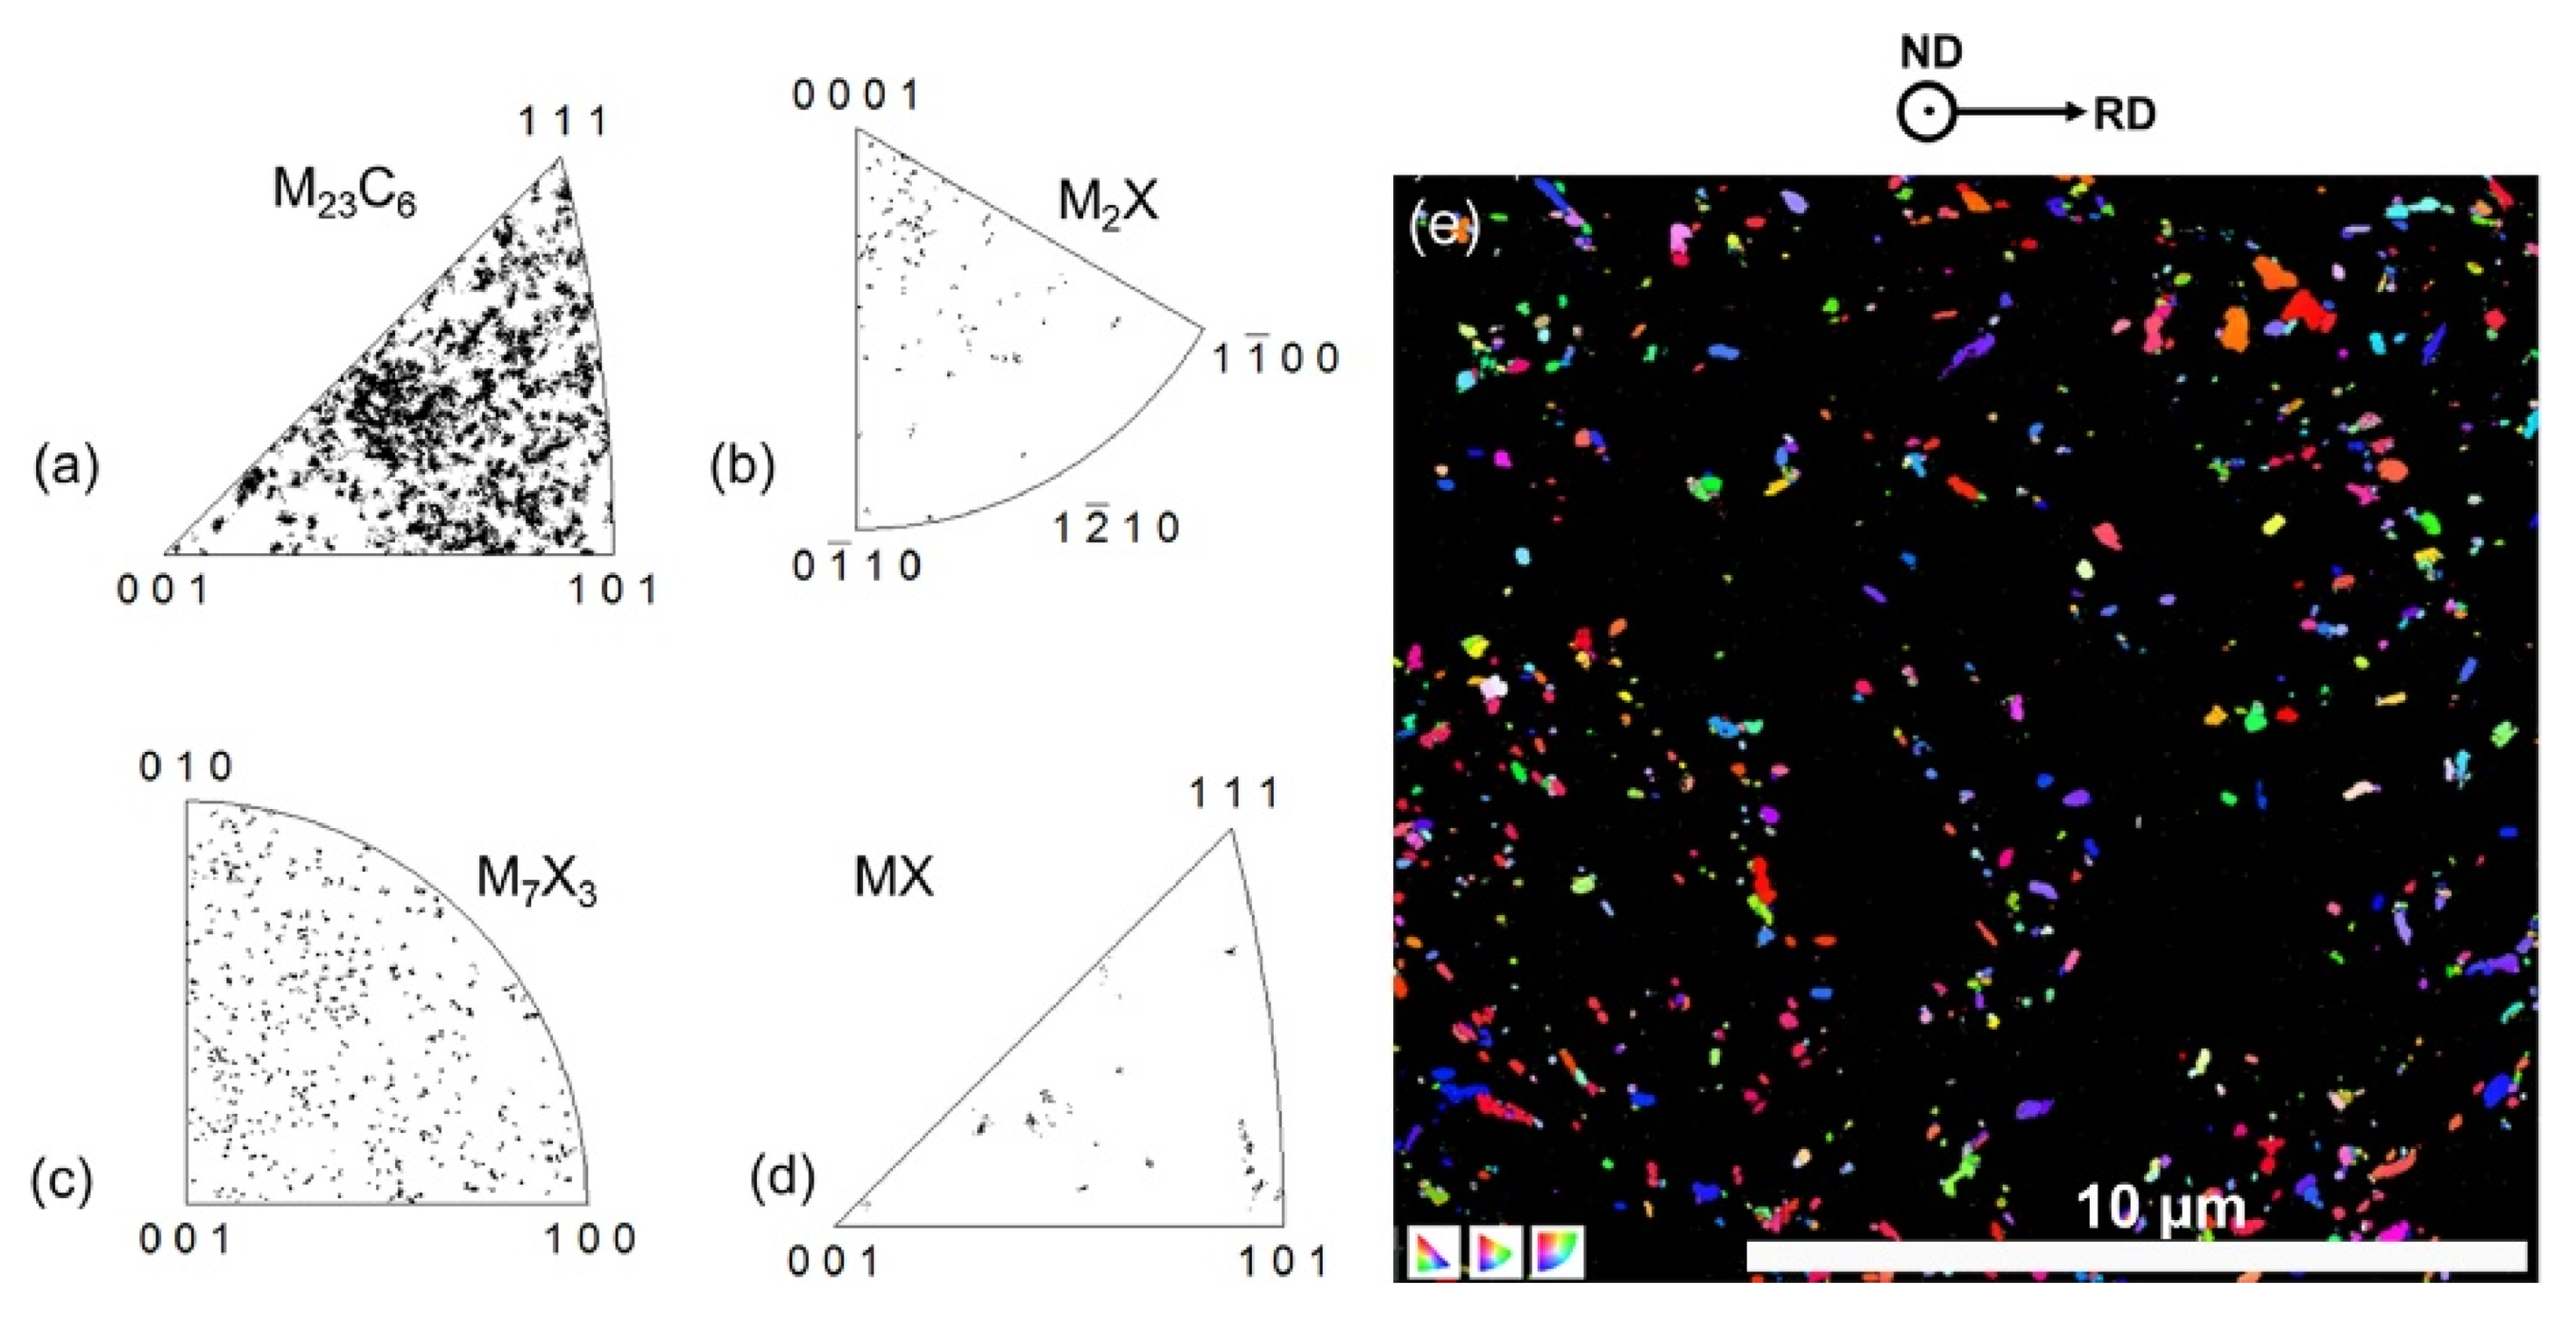
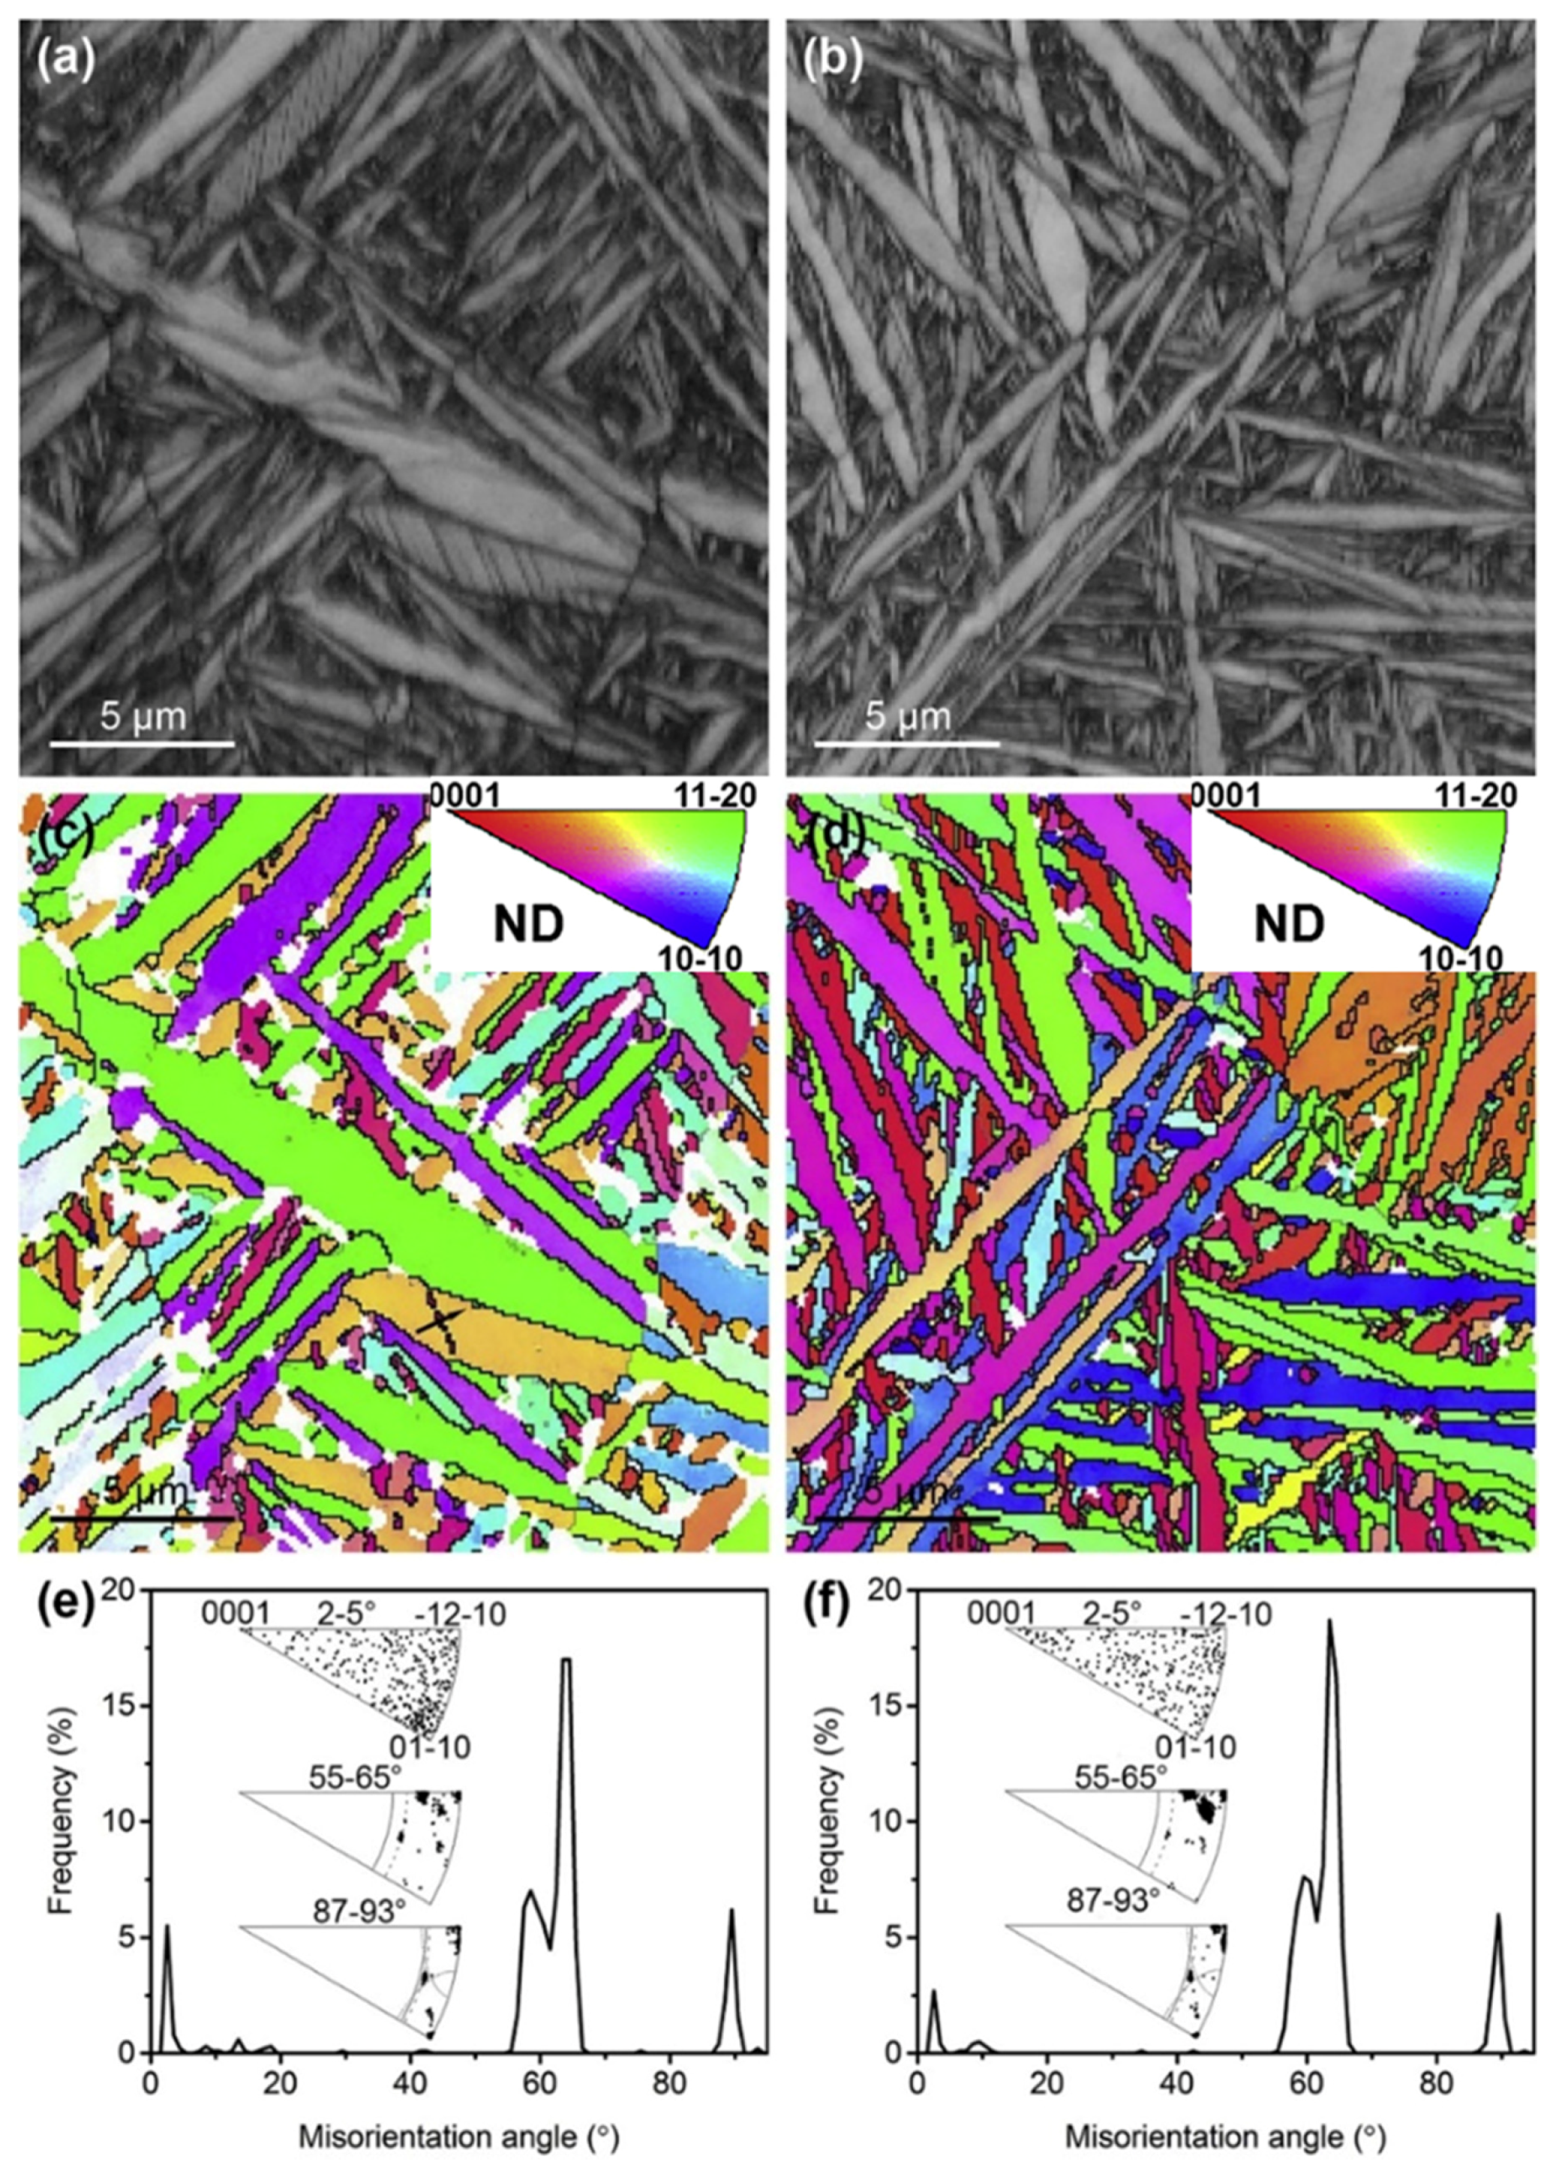
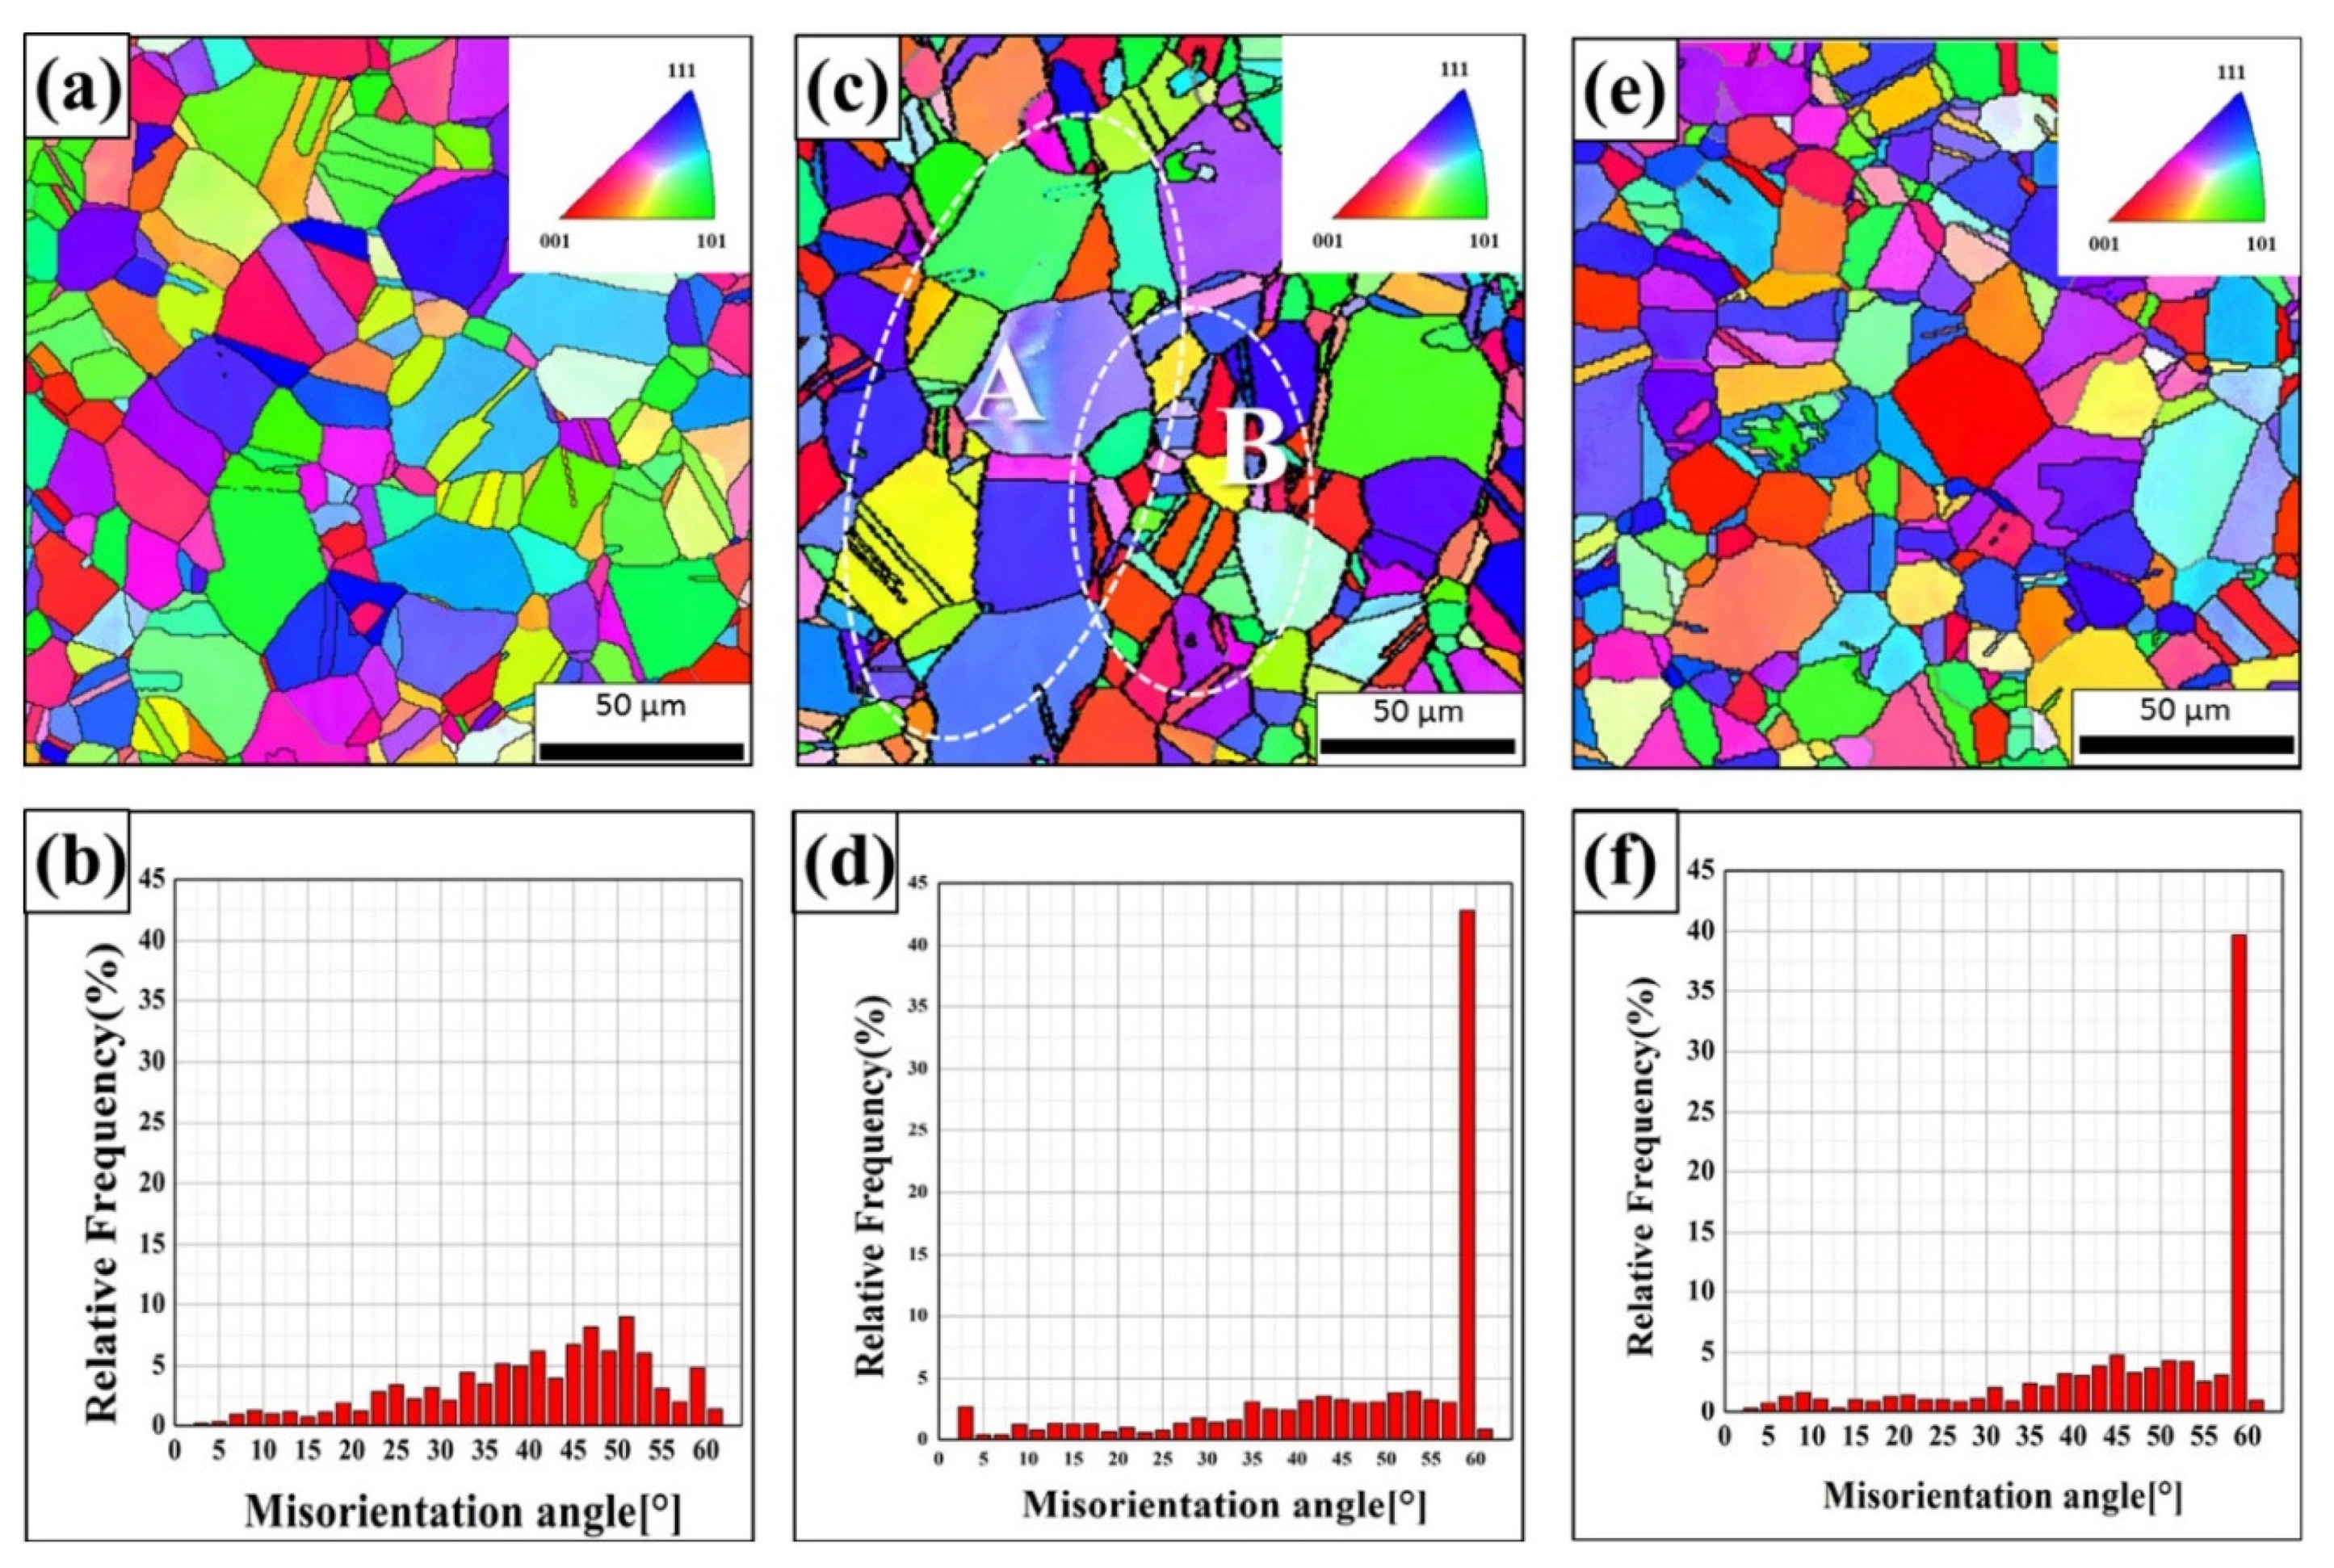
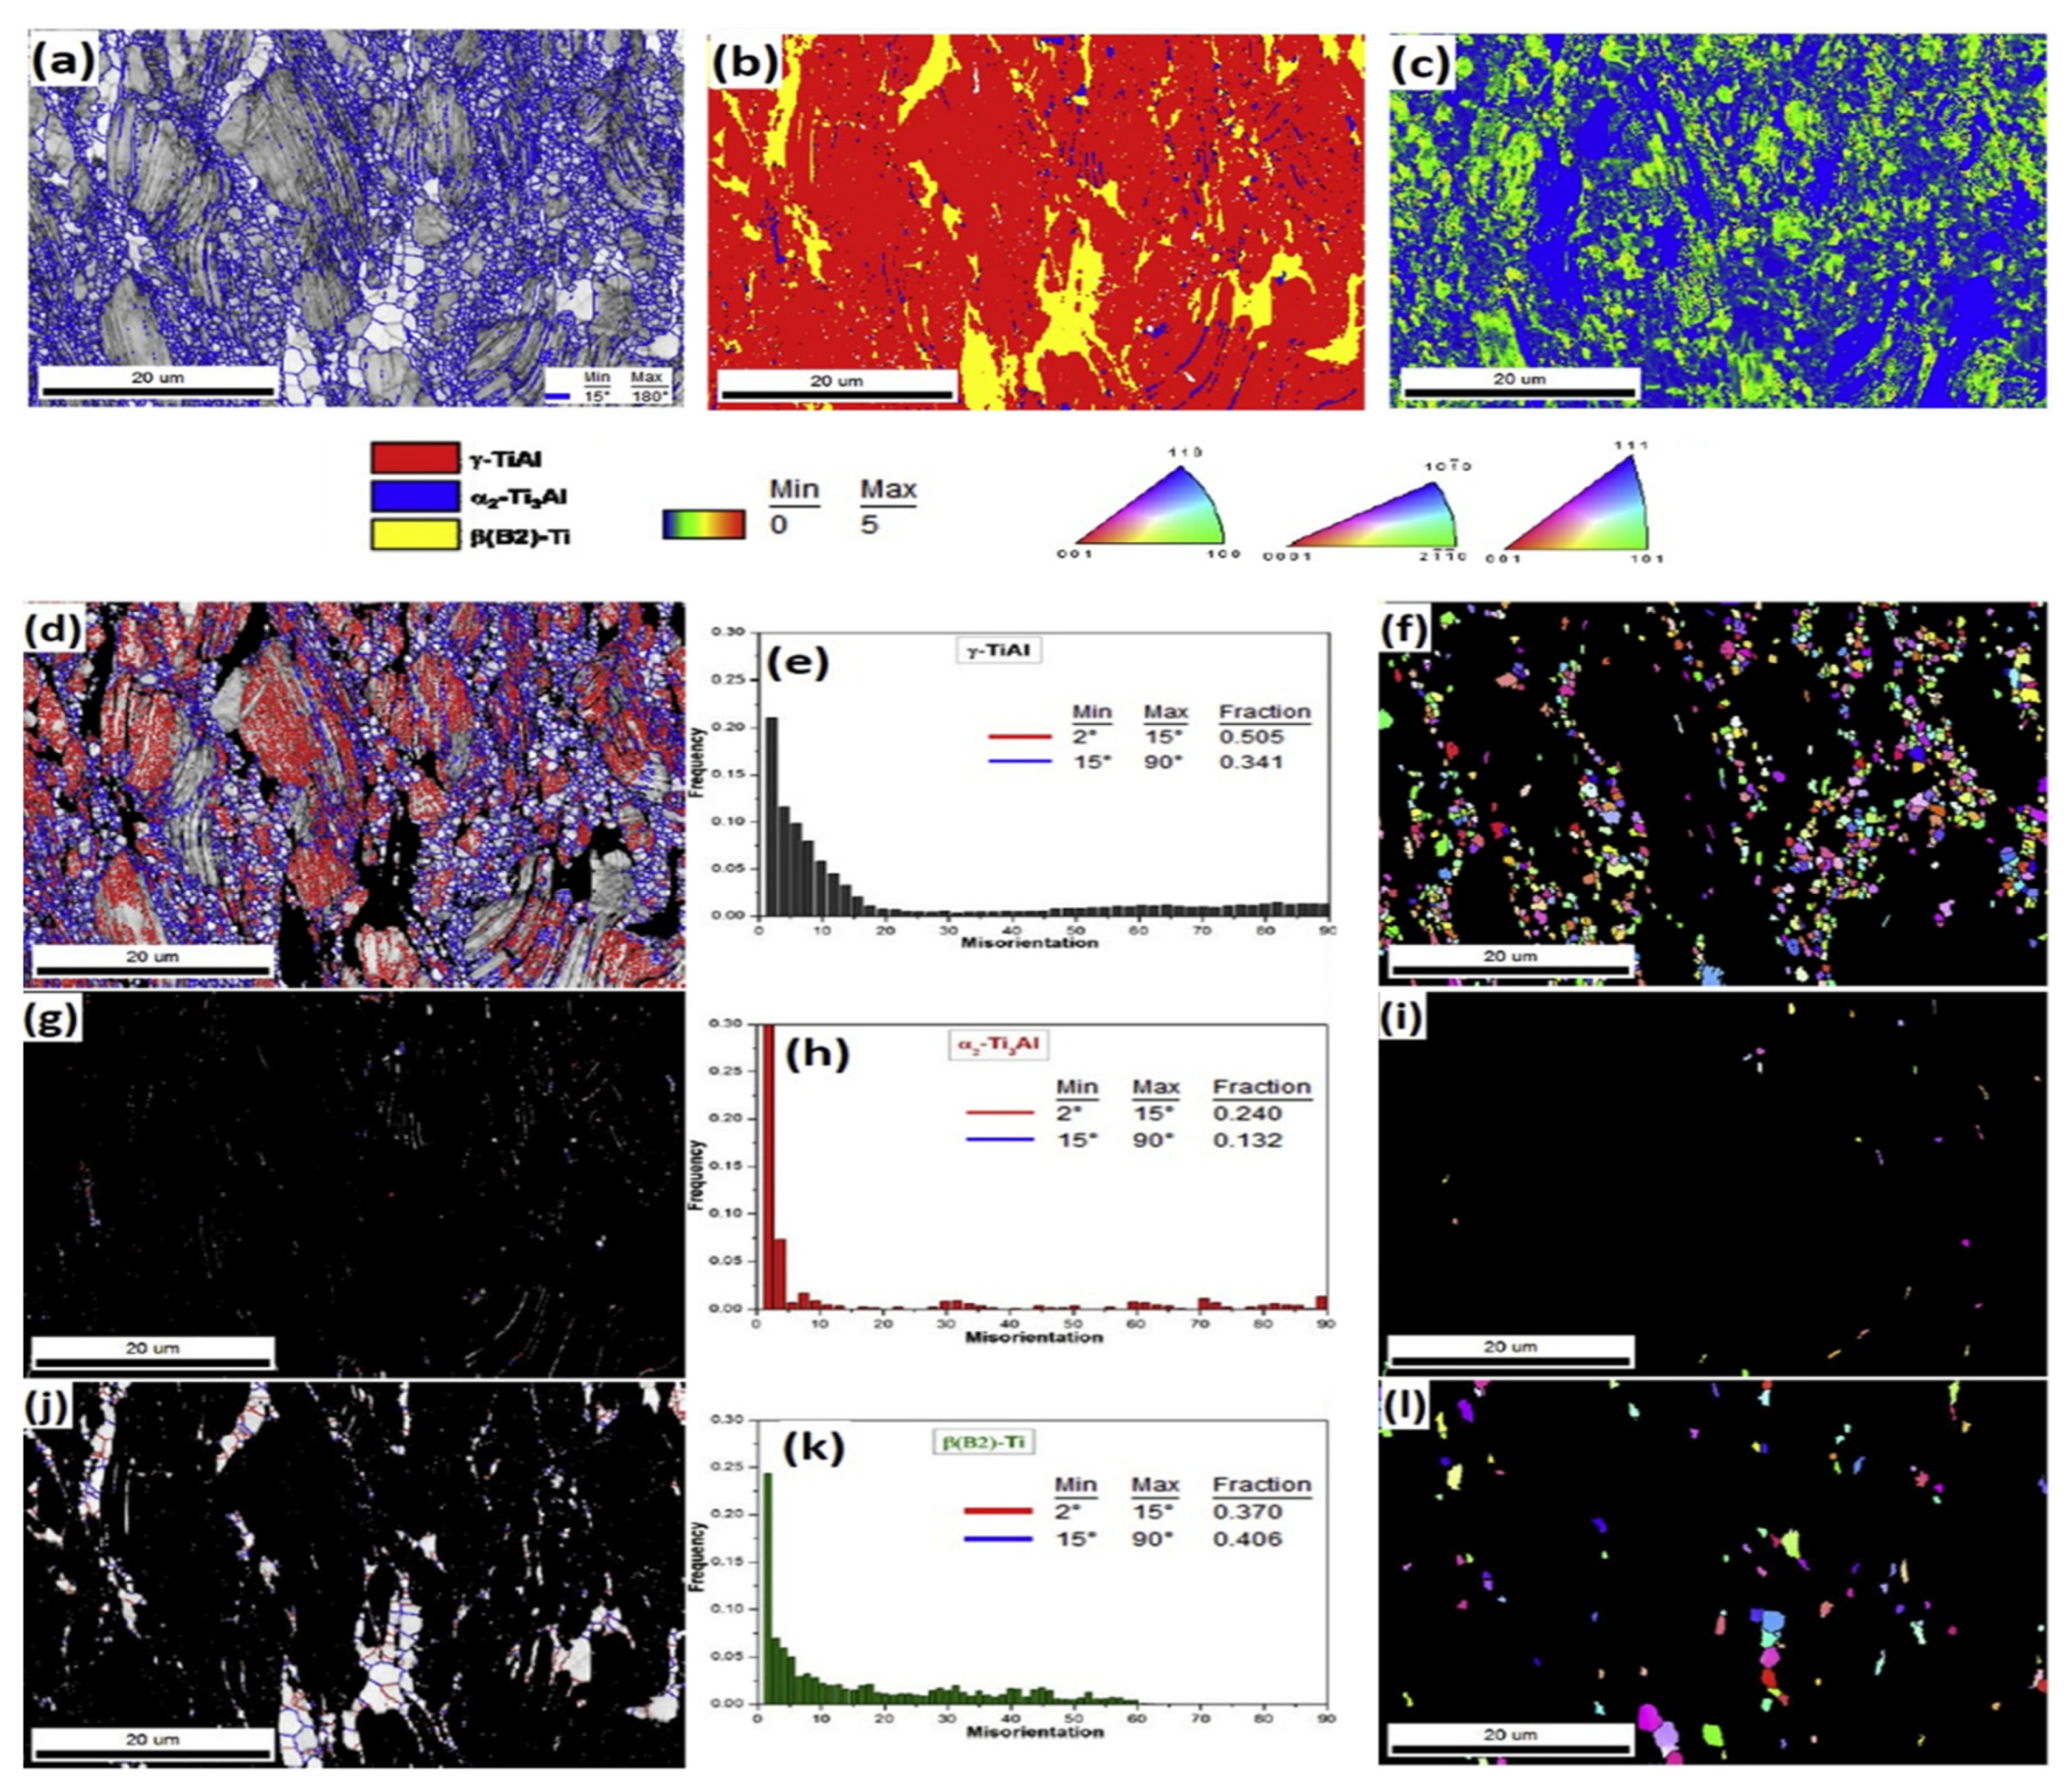
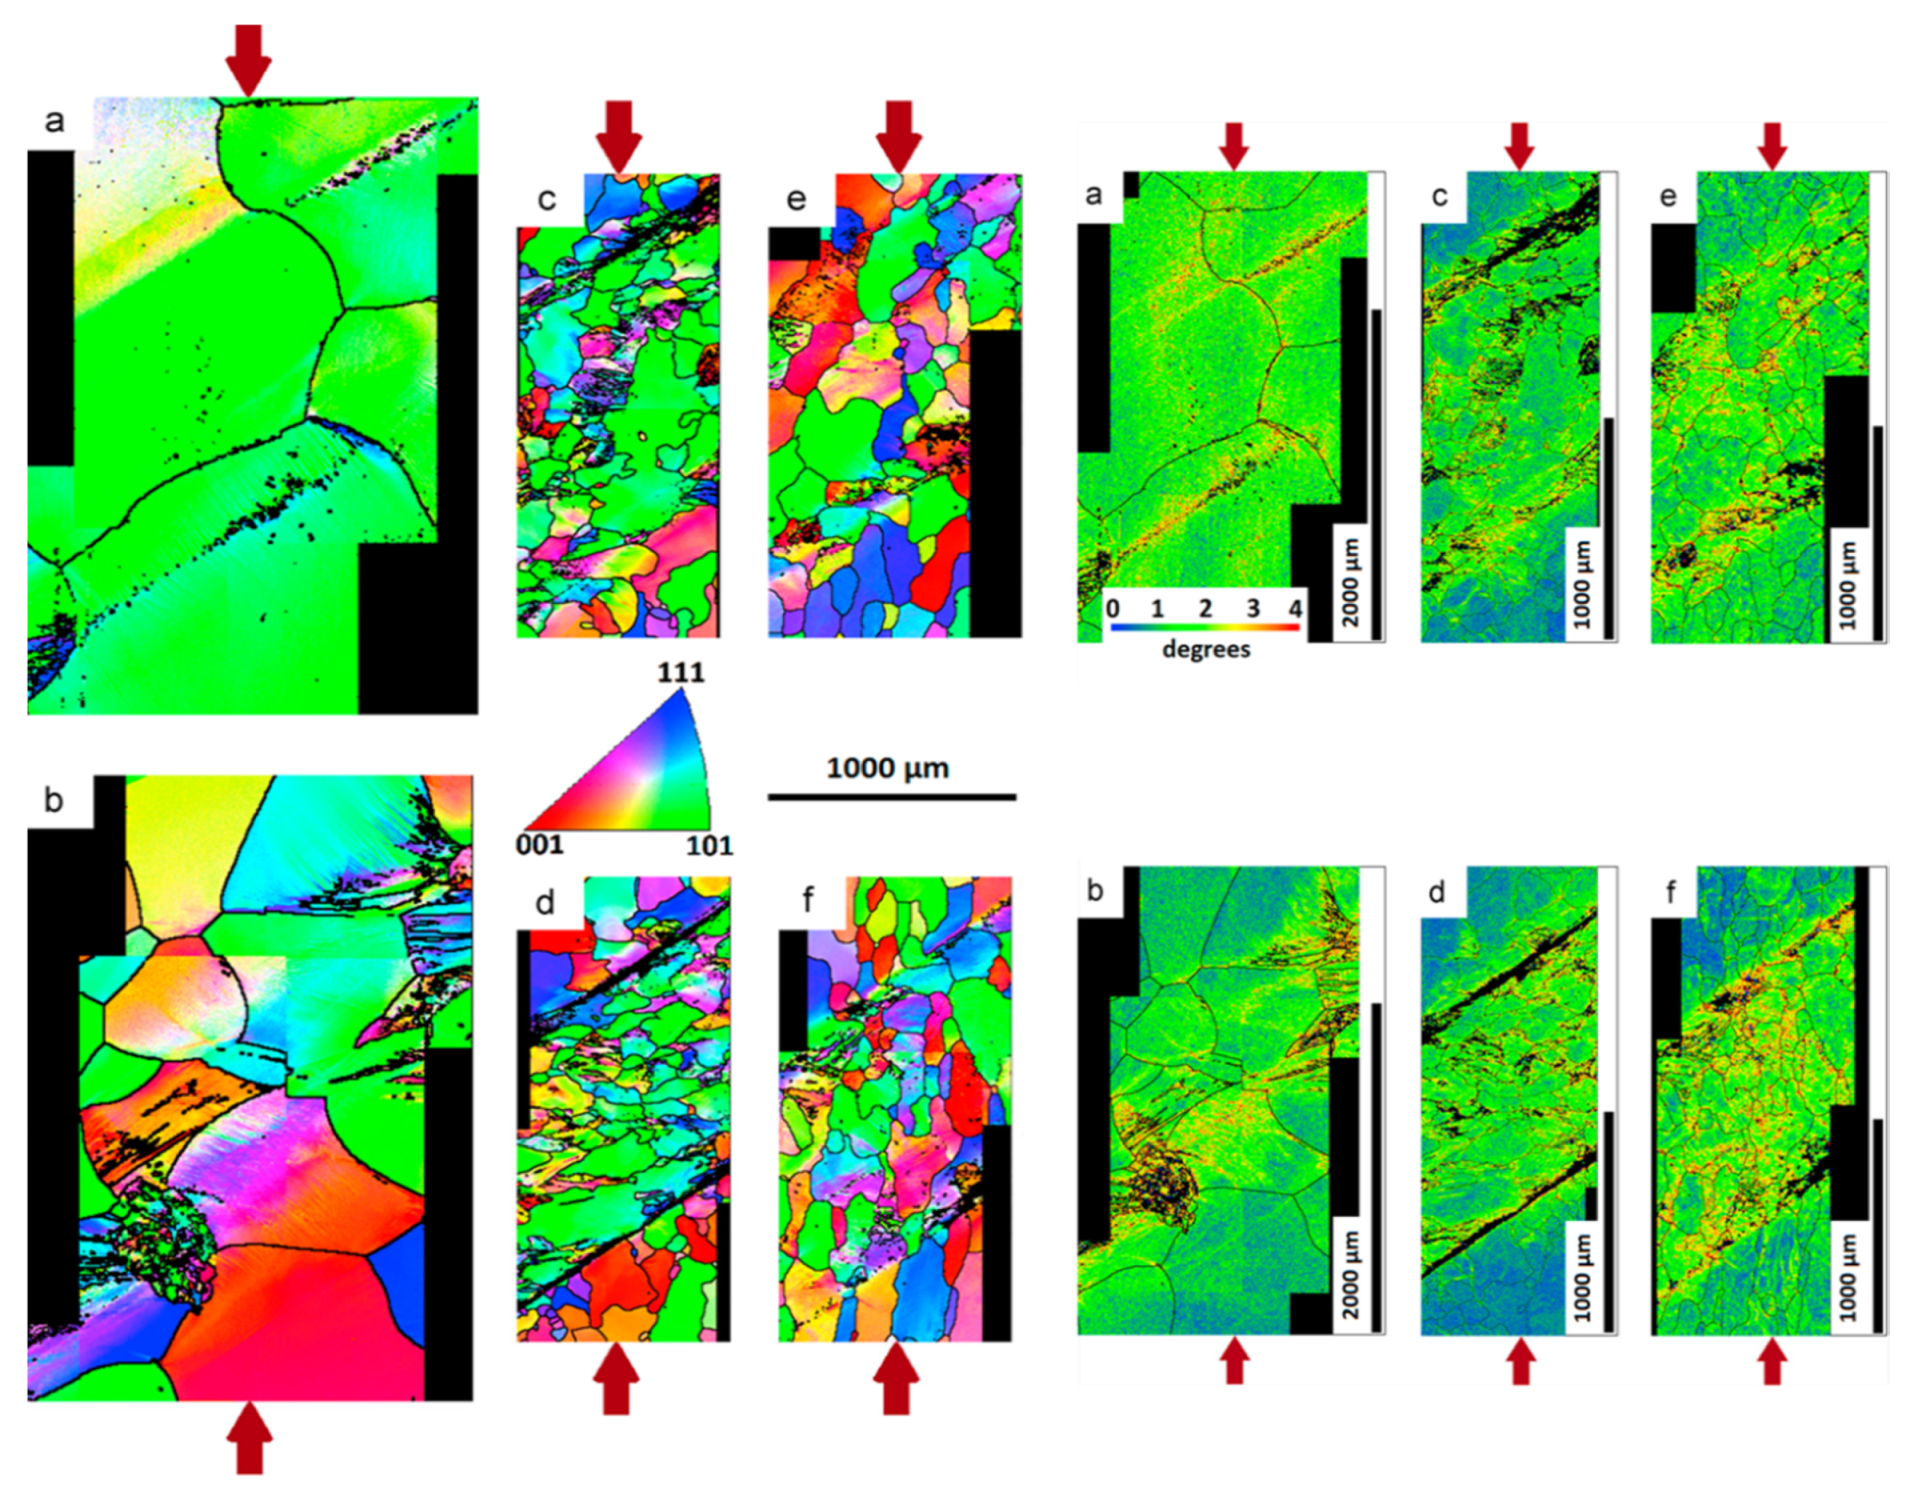
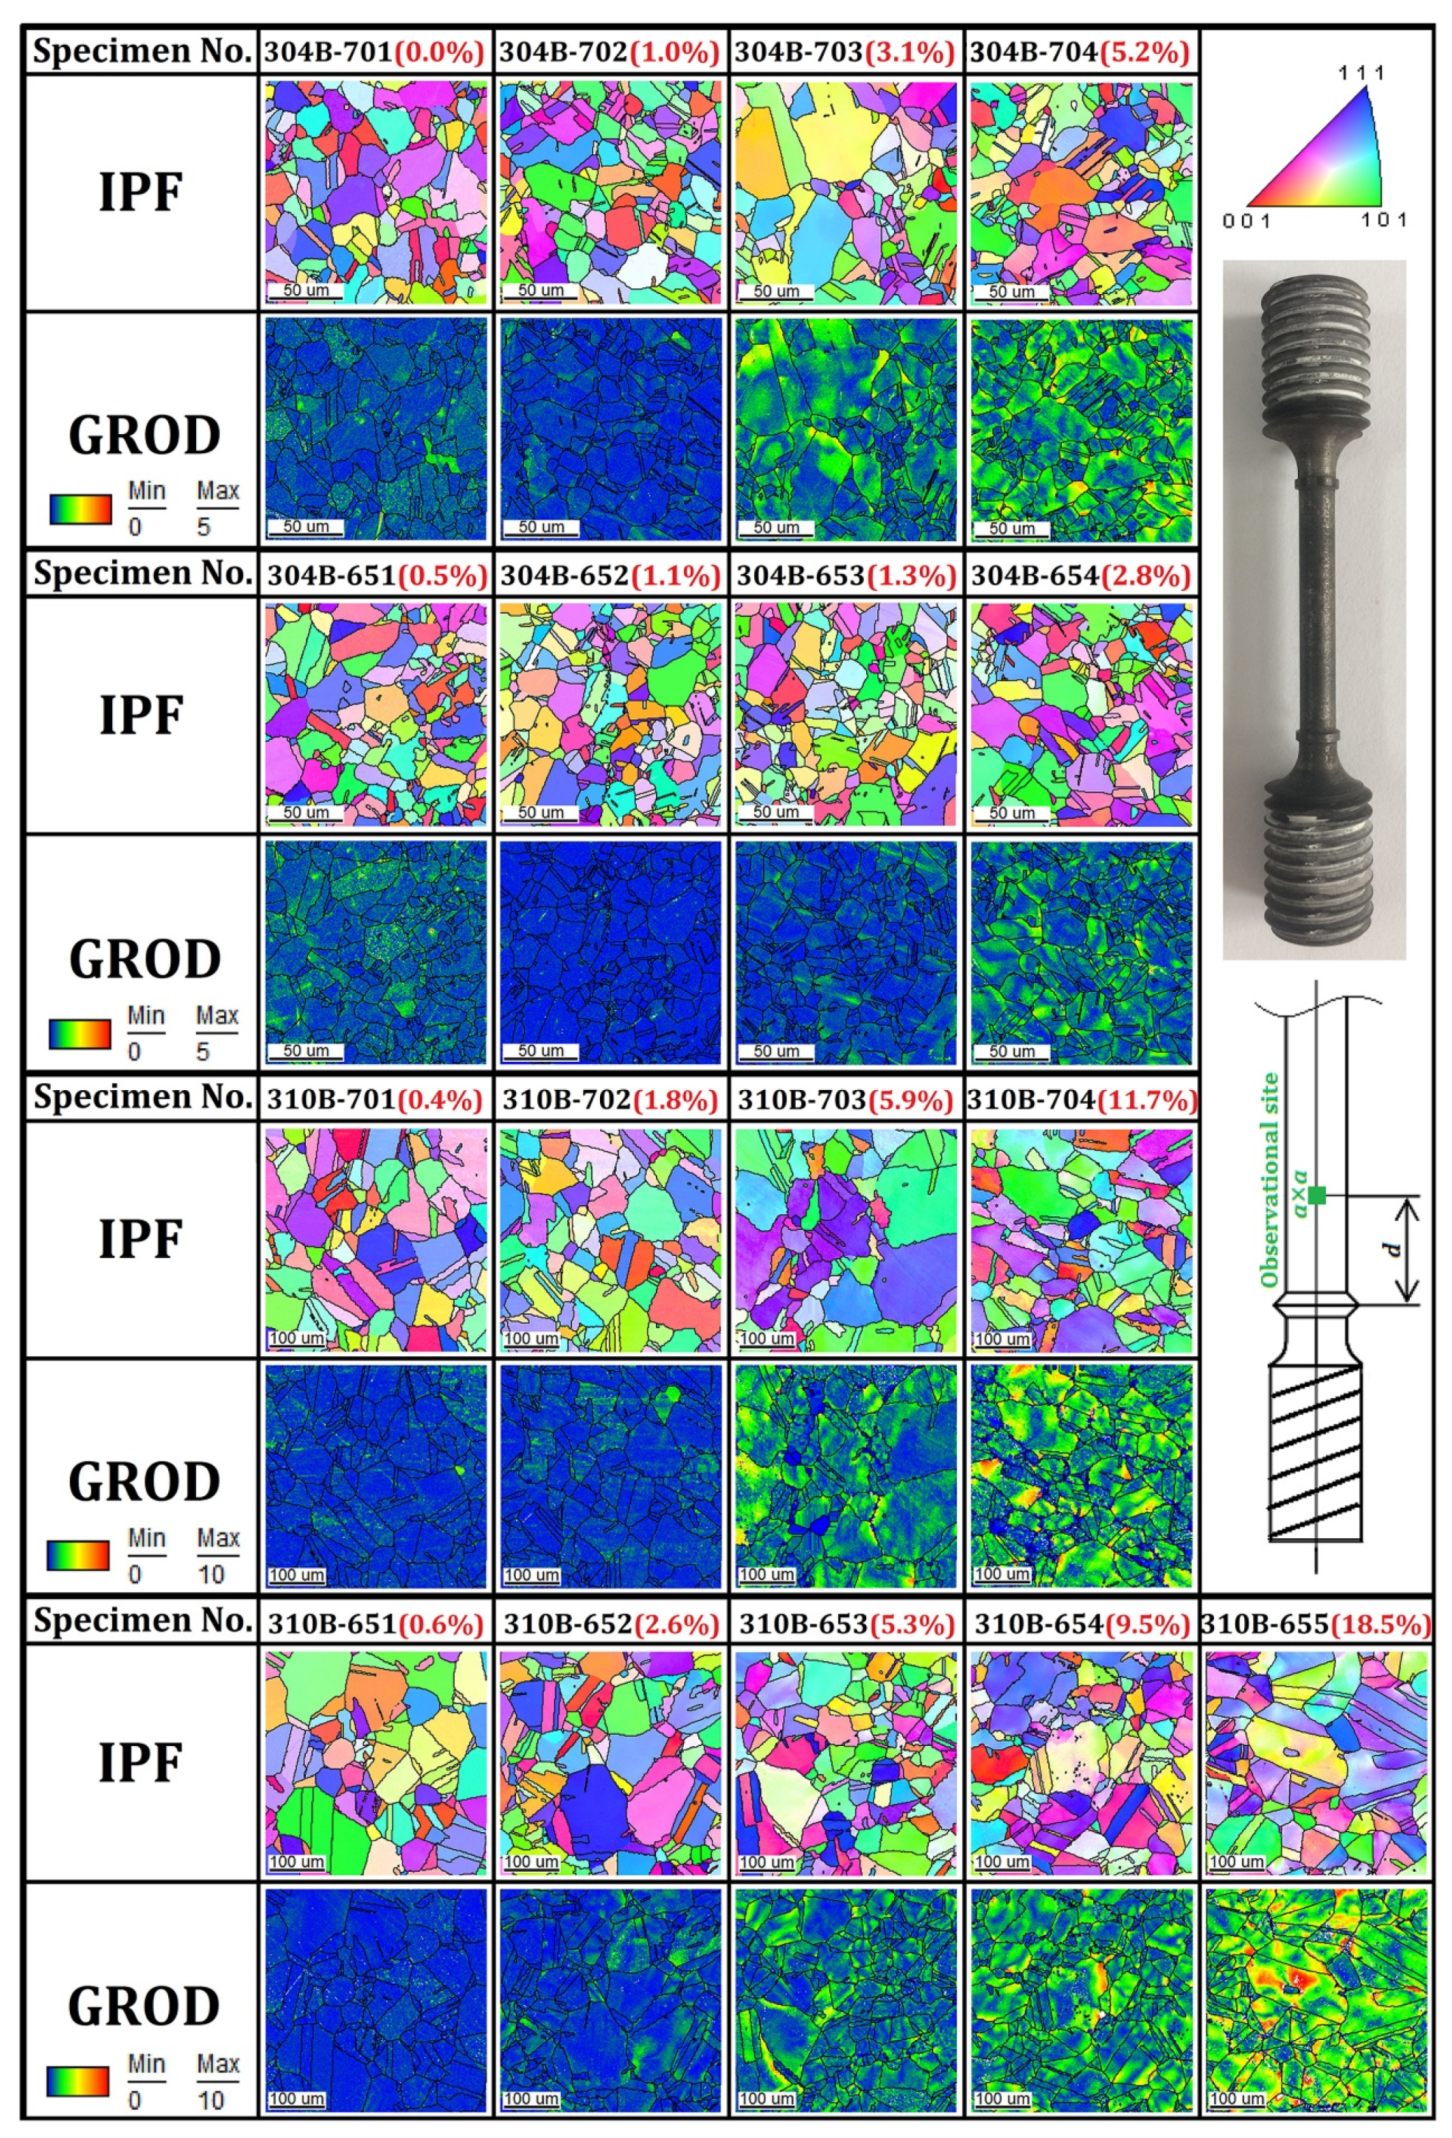
Table 1.
Microstructural characteristics of metals that can be characterized by EBSD. GOS: grain orientation spread.
Table 1.
Microstructural characteristics of metals that can be characterized by EBSD. GOS: grain orientation spread.
| EBSD Results | Microstructural Features |
|---|---|
| Phase maps | Phase distribution [6,15,29,30,31,42,56,71,72,73,74,75,89] |
| Grain size maps | Average grain size, grain size distribution [6,37,39,51,59,77,81,87] |
| IPF and PF figures | Orientation and texture [6,8,15,17,20,29,51,52,57,59,64,73,76,82,87] |
| PF figures | Orientation and microshear bands [27] |
| IPF maps | Grain structure and orientation [6,8,14,15,16,17,18,19,20,21,22,23,30,39,40,48,52,56,57,58,59,60,64,65,66,67,70,71,76,78,79,80,81,82] |
| Grain boundary character distribution | LAGBs, HAGBs, and CSL [6,14,17,19,24,31,37,38,39,40,45,46,68,70,72,73,75,76,77,79,80,81,87,94] |
| Image quality | Coherence of grains [13] and residual stress [89] |
| KAM maps | GND dislocation density, deformation and strain gradients, grain misorientation [14,22,31,32,45,46,60,68,71,73,78] |
| GOS maps | Recrystallized grains [12,45,46] |
| GOS and GROD maps | Deformed and recrystallized grains [37,52,71,74,79,89] |
| GROD maps | Study and estimate the creep strain [74] |
| Internal average misorientation angle | Recrystallized grains and deformed regions [51] |
| GND maps | Deformation-induced grain boundaries and twins [68] |
| LAM maps | Quantify the ability of the microstructures to accumulate deformation [36,76,94] |
| Band contrast texture maps | Texture relative to the compressive loading axis [76,77,94] |
| Schmid factor maps and histograms | Plastic strain levels [94] |
| Taylor and Schmid factors | Yield strength of different grains [36,67,76] |
© 2020 by the authors. Licensee MDPI, Basel, Switzerland. This article is an open access article distributed under the terms and conditions of the Creative Commons Attribution (CC BY) license (http://creativecommons.org/licenses/by/4.0/).
Share and Cite
MDPI and ACS Style
Carneiro, Í.; Simões, S. Recent Advances in EBSD Characterization of Metals. Metals 2020, 10, 1097. https://doi.org/10.3390/met10081097
AMA Style
Carneiro Í, Simões S. Recent Advances in EBSD Characterization of Metals. Metals. 2020; 10(8):1097. https://doi.org/10.3390/met10081097
Chicago/Turabian StyleCarneiro, Íris, and Sónia Simões. 2020. "Recent Advances in EBSD Characterization of Metals" Metals 10, no. 8: 1097. https://doi.org/10.3390/met10081097
Note that from the first issue of 2016, this journal uses article numbers instead of page numbers. See further details here.