Review

Electrochemical Impedance Spectroscopy for the Measurement of the Corrosion Rate of Magnesium Alloys: Brief Review and Challenges

by
Sebastián Feliu, Jr.
Surface Engineering, Corrosion and Durability Department, Centro Nacional de Investigaciones Metalúrgicas (CENIM-CSIC), 28040 Madrid, Spain
Metals 2020, 10(6), 775; https://doi.org/10.3390/met10060775
Submission received: 18 May 2020 / Revised: 5 June 2020 / Accepted: 9 June 2020 / Published: 10 June 2020
(This article belongs to the Special Issue Surface Chemistry and Corrosion of Light Alloys)

Abstract

:
From a technological point of view, measurement of the corrosion rate of magnesium (Mg) and its alloys is critical for lifetime predictions of Mg-based structures and for comparative assessments of their corrosion protection ability. Whilst weight loss, hydrogen evolution, and polarization curves methods are frequently used for measuring the corrosion rate, the determination of values by electrochemical impedance spectroscopy (EIS) is relatively scarce and has only been realized recently. This technique seems to be the most suitable for monitoring corrosion rate values due to its “non-destructive” character, its reproducibility, and its reliable determination of small corrosion rates, much lower than those measured by other techniques. This review aims to picture the state-of-the-art technique of using EIS for measuring the corrosion rate of Mg. This paper starts by introducing some fundamental aspects of the most widely used methods for monitoring the corrosion rate of Mg/Mg alloy and continues by briefly explaining some of the fundamental concepts surrounding EIS, which are essential for the user to be able to understand how to interpret the EIS spectra. Lastly, these concepts are applied, and different approaches that have been proposed to obtain quantitative values of corrosion rate since the 1990s are discussed.

1. Introduction

Magnesium (Mg) and its alloys, which have aroused great scientific and technological interest during the last two decades, were chosen as the object of study. From a practical point of view, Mg is the lightest structural metal, with a weight density of 1.74 g cm−3, which is approximately two-thirds that of aluminum (Al) and one-quarter that of iron (Fe). This makes its use very attractive for the automotive and aerospace industries, where weight is important, to reduce fuel consumption and greenhouse gas emissions [1]. Additionally, Mg/Mg alloys are commonly used as biodegradable implants for clinical applications in an attempt to avoid long-term complications caused by permanent implants [1,2,3]. Mg is biocompatible and is an important element in hundreds of metabolic processes [4,5]. However, since Mg is the most chemically active of the various structural metals, its resistance to corrosion is one of the key factors limiting, or even preventing, its use under real-life service conditions, where exposure to aggressive environments cannot be avoided (especially environments containing H2O and Cl). Consequently, a more precise understanding of Mg corrosion mechanisms and the factors that affect its corrosion is considered essential for its widespread application [6].
In a review covering several aspects of Mg alloy corrosion, Song [7] pointed out that the corrosion rate is a critical parameter for design engineers and corrosion experts when developing this type of material. From a technological point of view, the establishment of reliable corrosion rate values is an essential step for the estimation of the service life of structures based on Mg materials, the comparative evaluation of the durability of different alloys, and the control of the effectiveness of protective methods [7]. As mentioned by Lorenz et al. [8], having accurate and rapid methods for the measurement of corrosion rates is of tremendous importance for practical applications. From a scientific point of view, this is an issue of great current relevance, as was shown by a simple search with the terms “corrosion rate and magnesium” in the scientific database ISI Web of Knowledge (2018), which identified three publications [5,9,10] classified as “Article highly cited”. In a recent paper, Abbot [11] stated that the issue of accurate measurement of Mg alloy corrosion rates using electrochemical methods is one of the three grand challenges in the context of corrosion of Mg. However, accurate assessment of the corrosion rate of Mg/Mg alloys by electrochemical methods remains an ambiguous subject that is under active debate within the research community [12,13,14].
In the literature, the corrosion behavior of Mg alloys has been frequently evaluated using the initial corrosion rate value obtained using short-term methods (usually, polarization curves or impedance measurements immediately after immersion of the specimen in the electrolyte) [5,9]. For reliable prediction of the long-term corrosion rates of Mg alloy structures, it is desirable to take the evolution of the corrosion rate values during the entire exposure into account; the assumption that corrosion occurs at a constant rate throughout immersion may, in fact, not be true, since there are many cases in which the rate tends to change significantly with time until it reaches a steady state [2,9,15,16,17]. For example, in a recent study [17], we observed that the corrosion rate of AZ31 alloy (3 wt % Al) was similar with (AZ31-4Al) or without Al surface enrichment (AZ31-3Al) after 1 h of immersion in 0.6 M NaCl. However, the values for the Al-enriched AZ31 alloy were eight times lower than those of the non-enriched specimen after 4 days due to the formation of a protective layer of corrosion products, which may imply that an estimate of the corrosion behavior based on initial corrosion rate values would have an approximate error of one order of magnitude (Figure 1).
Non-electrochemical methods, such as weight loss or hydrogen evolution measurements, are, in general, limited by the resolution of the measuring device and restricted to systems that do not form protective surface films or coatings. The electrochemical impedance spectroscopy (EIS) technique offers the advantage that low corrosion of the system does not affect the measurement accuracy in the manner discussed above for non-electrochemical methods. Given the electrochemical nature of the corrosion process, electrochemical techniques represent a powerful method for determining the corrosion rate of Mg/Mg alloys [1,8,18]. Whilst polarization curves have been extensively used for measuring the corrosion rate in the past few decades [1], the application of the EIS technique for these purposes has only been implemented much more recently [8]. The investigations by King et al. [9] and Curioni et al. [19] on pure Mg in NaCl solutions have stimulated interest in the use of impedance techniques for the determination of the corrosion rate. At the same time, the interpretation of impedance data in terms of the corrosion rate remains controversial despite the recent studies carried out. The present review was carried out to further evaluate the usefulness of impedance techniques for corrosion monitoring and to determine the correlations between corrosion rate values from the EIS technique and non-electrochemical methods. This paper intends to encourage corrosion scientists and electrochemists to use the EIS technique as a valuable tool to determine the corrosion rate in Mg/Mg alloys.

2. Common Methods for the Estimation of the Corrosion Rate in Mg Alloys

Most of the reported corrosion rate values of Mg alloys in the literature involve measurement by the weight loss method, hydrogen gas collection, or polarization curves [1,4]. The weight loss method is considered by some to be the “gold standard” of corrosion testing, and it stands out due to its simplicity [1,20]. In this method, the corrosion layers formed on the surfaces of the specimens after the immersion test are dissolved with an aqueous solution of chromic acid, and the weight loss is calculated from the difference in weight of the specimen before and after removal of the corrosion products [1,21] (Figure 2). It is an evident experimental disadvantage that the weight loss determinations provide only a single measurement for all exposure times [22]. The results are not reliable when the measured values are smaller than the resolution of the gravimetric device (typically 0.1 mg) [5,20]. In addition, experimental errors are likely to be introduced into the final weight loss results, such as incomplete or excessive removal of corrosion product [7,18].
One of the simplest and most reliable methods for monitoring changes in the corrosion rates of Mg/Mg alloys is the hydrogen evolution technique. In this method, evolved hydrogen is collected in a burette above an inverted funnel placed centrally above a specimen completely immersed in a beaker with the test solution. In the Mg corrosion process, the oxidation of a magnesium atom results in the generation of a hydrogen molecule [10,19]. Therefore, in the absence of any other cathodic reaction, the hydrogen evolution rate is equivalent to the corrosion rate of magnesium. For Mg corrosion, there is an excellent correlation between the corrosion rate as determined from the hydrogen evolution and that measured by the weight loss (Figure 3) [7,23]. However, this method has limitations, including an underestimation of the corrosion rate, as some molecular hydrogen resulting from Mg corrosion is dissolved in the solution or absorbed into the Mg specimen. In addition, the results are not too reliable when the measured values are very small [1,5,24].
Polarization curves are an electrochemical technique that is commonly successfully used to determine the corrosion current density (and, therefore, the instantaneous corrosion rate) by Tafel extrapolation of cathodic and anodic polarization branches. [7,24]. This method is quick and easy, and it is the only technique that provides mechanistic information on anodic and cathodic reactions [5,9]. Unlike iron, aluminum and copper alloys [25], the reliability and consistency of the measurement of the corrosion rate of Mg alloys using polarization curves must be seriously questioned [1,7,10,26,27,28,29], and the values may be various orders of magnitude less than the real ones (for weight loss or hydrogen evolution techniques) [7,10,26,27,28,29]. This significant difference might be due to (a) the increase in the hydrogen evolution rate observed during anodic polarization (often termed the “negative difference effect” or NDE), resulting in the absence of a sufficient linear Tafel region in the polarization curves (Figure 4) [30]; (b) the partial disintegration of specimens into fine metallic particles; (c) participation of unstable Mg+ intermediates during anodic dissolution; and (d) a significant difference in the instantaneous corrosion rate determined by the potentiodynamic polarization method compared with the steady-state corrosion rate [12,31]. Furthermore, the method is destructive in nature and may change or damage the specimen surface for subsequent analysis (for example, by means of scanning electron microscopy (SEM)) [5].

3. Electrochemical Impedance Spectroscopy (EIS)
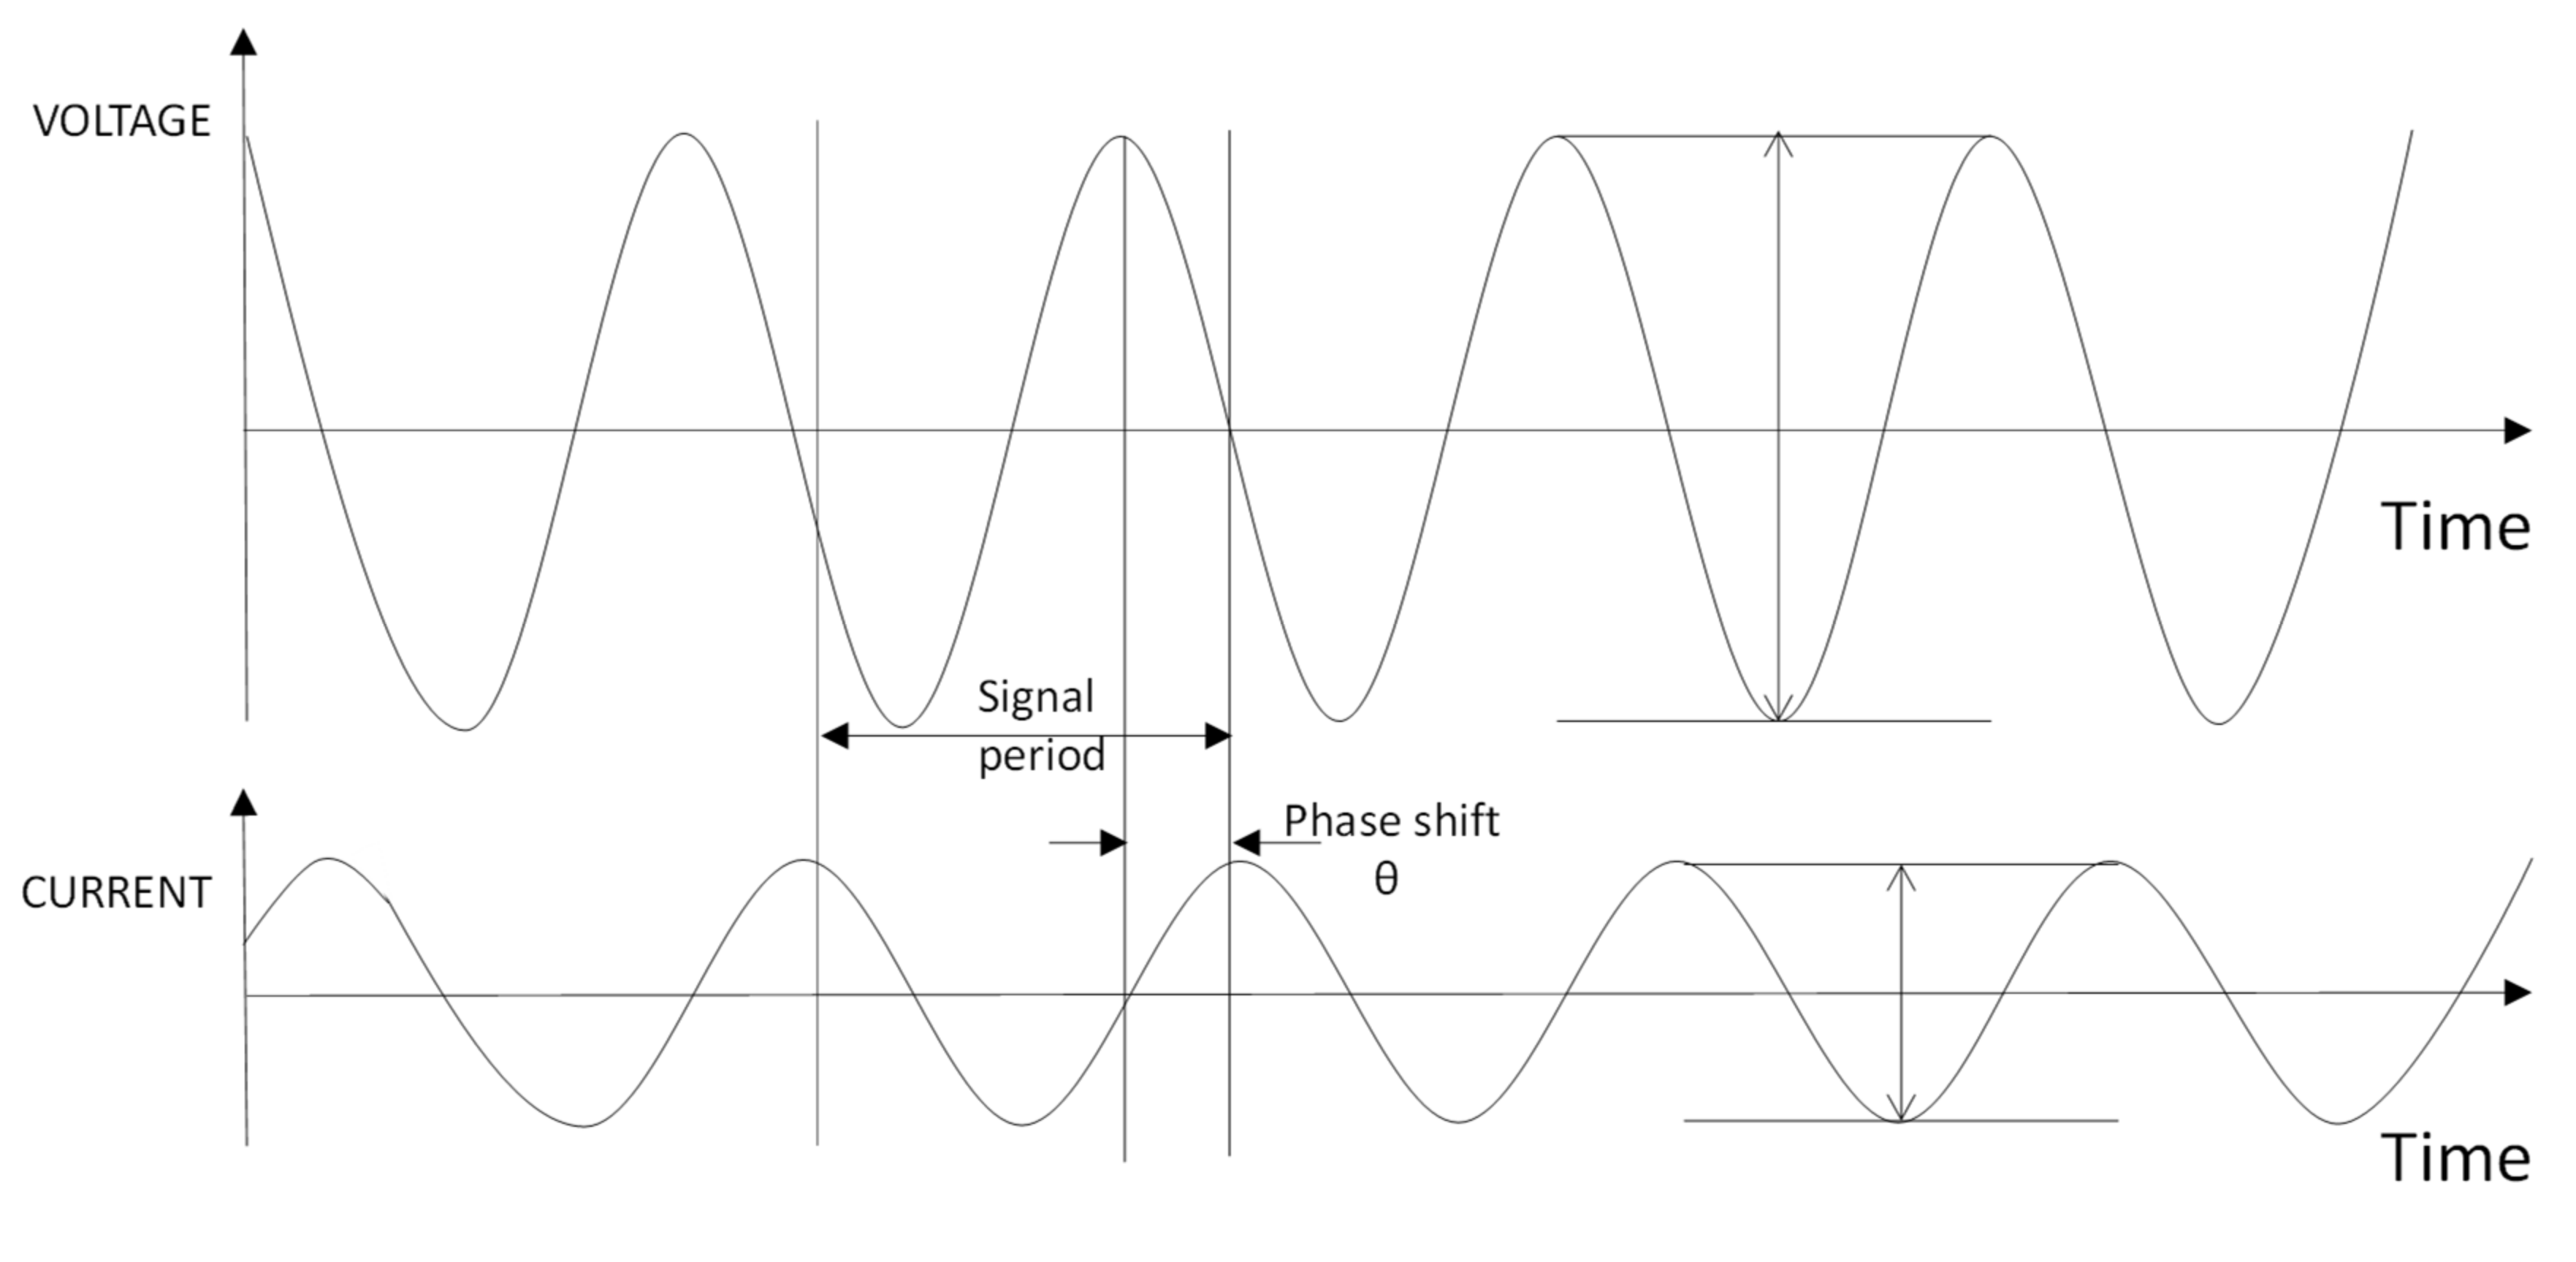
3.1. Basics

EIS is an essential method for monitoring electrochemical changes of a system in situ with the immersion time, because it provides kinetic and mechanistic information about the corrosion process in the case of passive and active protection or a combination of both [32,33]. Crucially, it provides quantitative information about the processes taking place within the system [34].
This technique is based on the application of a small-amplitude sinusoidal potential perturbation (typically in the range of 5–10 mV) to the working electrode over an extended frequency range (typically, 100 kHz to 10 mHz) using a conventional three-electrode electrochemical cell [35,36]. The current response is a sinusoidal signal of the same frequency but with a different phase and amplitude with respect to the perturbation (Figure 5) [32,33,34,37,38]. The real (Zre) and imaginary (Zim) components (or modulus |Z| and phase shift θ) of the impedance (Z) are calculated as the complex ratio between the applied potential sinewave (V) and the response current (I) [32,34,38].
Z(jω)=V(jω)/I(jω)
where j is the imaginary unit that equals (−1)1/2 and ω is the angular frequency.
The EIS data are typically presented as a Nyquist plot, where the imaginary impedance component (Z″) is plotted against the real impedance component (Z′) at each excitation frequency, and the Bode plots display the logarithm of the impedance modulus |Z| and phase angle (θ) as a function of the logarithm of the applied frequency range [36,39]. Note that Nyquist plots are referred to in this review more extensively than Bode plots.
In order to convert frequency response data to corrosion properties (e.g., resistance and impedance), EIS results are modeled by fitting them to an equivalent electrical circuit consisting of resistors (R), capacitors (C) or constant phase elements (CPE), inductors (L) and Warburg impedance (W) connected either in series or in parallel [5,35,38]. Commercial software, for example ZView software (3.0a Scribner Associates, Inc., Southern Pines, NC, USA), may be used for fitting the impedance spectra to the equivalent circuit [40]. The quality of fitting is often evaluated by the chi-squared (χ2) error value [37]. To be useful, the elements in the equivalent electrical circuit should correlate with the different corrosion processes taking place in the system under investigation.
One of the requirements before impedance analyses is the validation of the EIS data [41]. The application of Kramers–Kronig (K–K) transforms could provide a possible solution to verify electrochemical impedance data with respect to the conditions of the causality, linearity, stability and finity value and the acceptable agreement between the sets of experimental and transformed data confirmed that the system fulfills these conditions.

3.2. Advantages of EIS

There are several advantages of EIS compared with other methods that are more commonly used for monitoring the corrosion rate, including the following:
  • Frequency-resolved EIS can distinguish among several electrochemical reactions in corrosion science based on their own relaxation times and provide detailed information on their respective kinetics in the form of corrosion rates [40]. In the frequency domain, fast processes, such as the formation of the double electric layer, the presence of ohmic resistance, and charge transfer resistance of electrochemical reactions, occur at high frequencies, while slow processes, such as the formation of adsorbed layers by intermediates of complex electrochemical reactions or diffusion (transport phenomena) in solutions, occur at low frequencies [40,41]. This can be used to calculate the corrosion resistance (i.e., inversely proportional to the corrosion rate), analyze the formation of corrosion or passivation layers on the surface of Mg, indicating whether the corrosive process occurs by activation, concentration, adsorption, or diffusion [5,14,42,43]. Furthermore, it provides information regarding the double layer at the metal/electrolyte and the dielectric properties of the surface oxides [44].
  • Compared to polarization curves, EIS uses a small excitation amplitude, causing only minimal perturbation to the corrosion potential. The non-destructive nature of EIS allows real-time measurements of corrosion rates in situ over long periods of immersion [5,42,43] and reduces the number of samples required for measurements.
  • EIS allows the determination of much lower corrosion rate values than those measured by non-electrochemical techniques (weight loss or hydrogen evolution).
  • The use of EIS gives a reliable and repeatable estimation of the instantaneous corrosion rate of Mg/Mg alloys [13].
  • The EIS technique has the ability to study high-impedance systems, such as coatings and linings, high-purity water, and organic coating/metal systems or corrosion in a low-conductive solution [45].

3.3. Limitations of EIS

In spite of the obvious advantages of using EIS, there are certain limitations of the technique including the following:
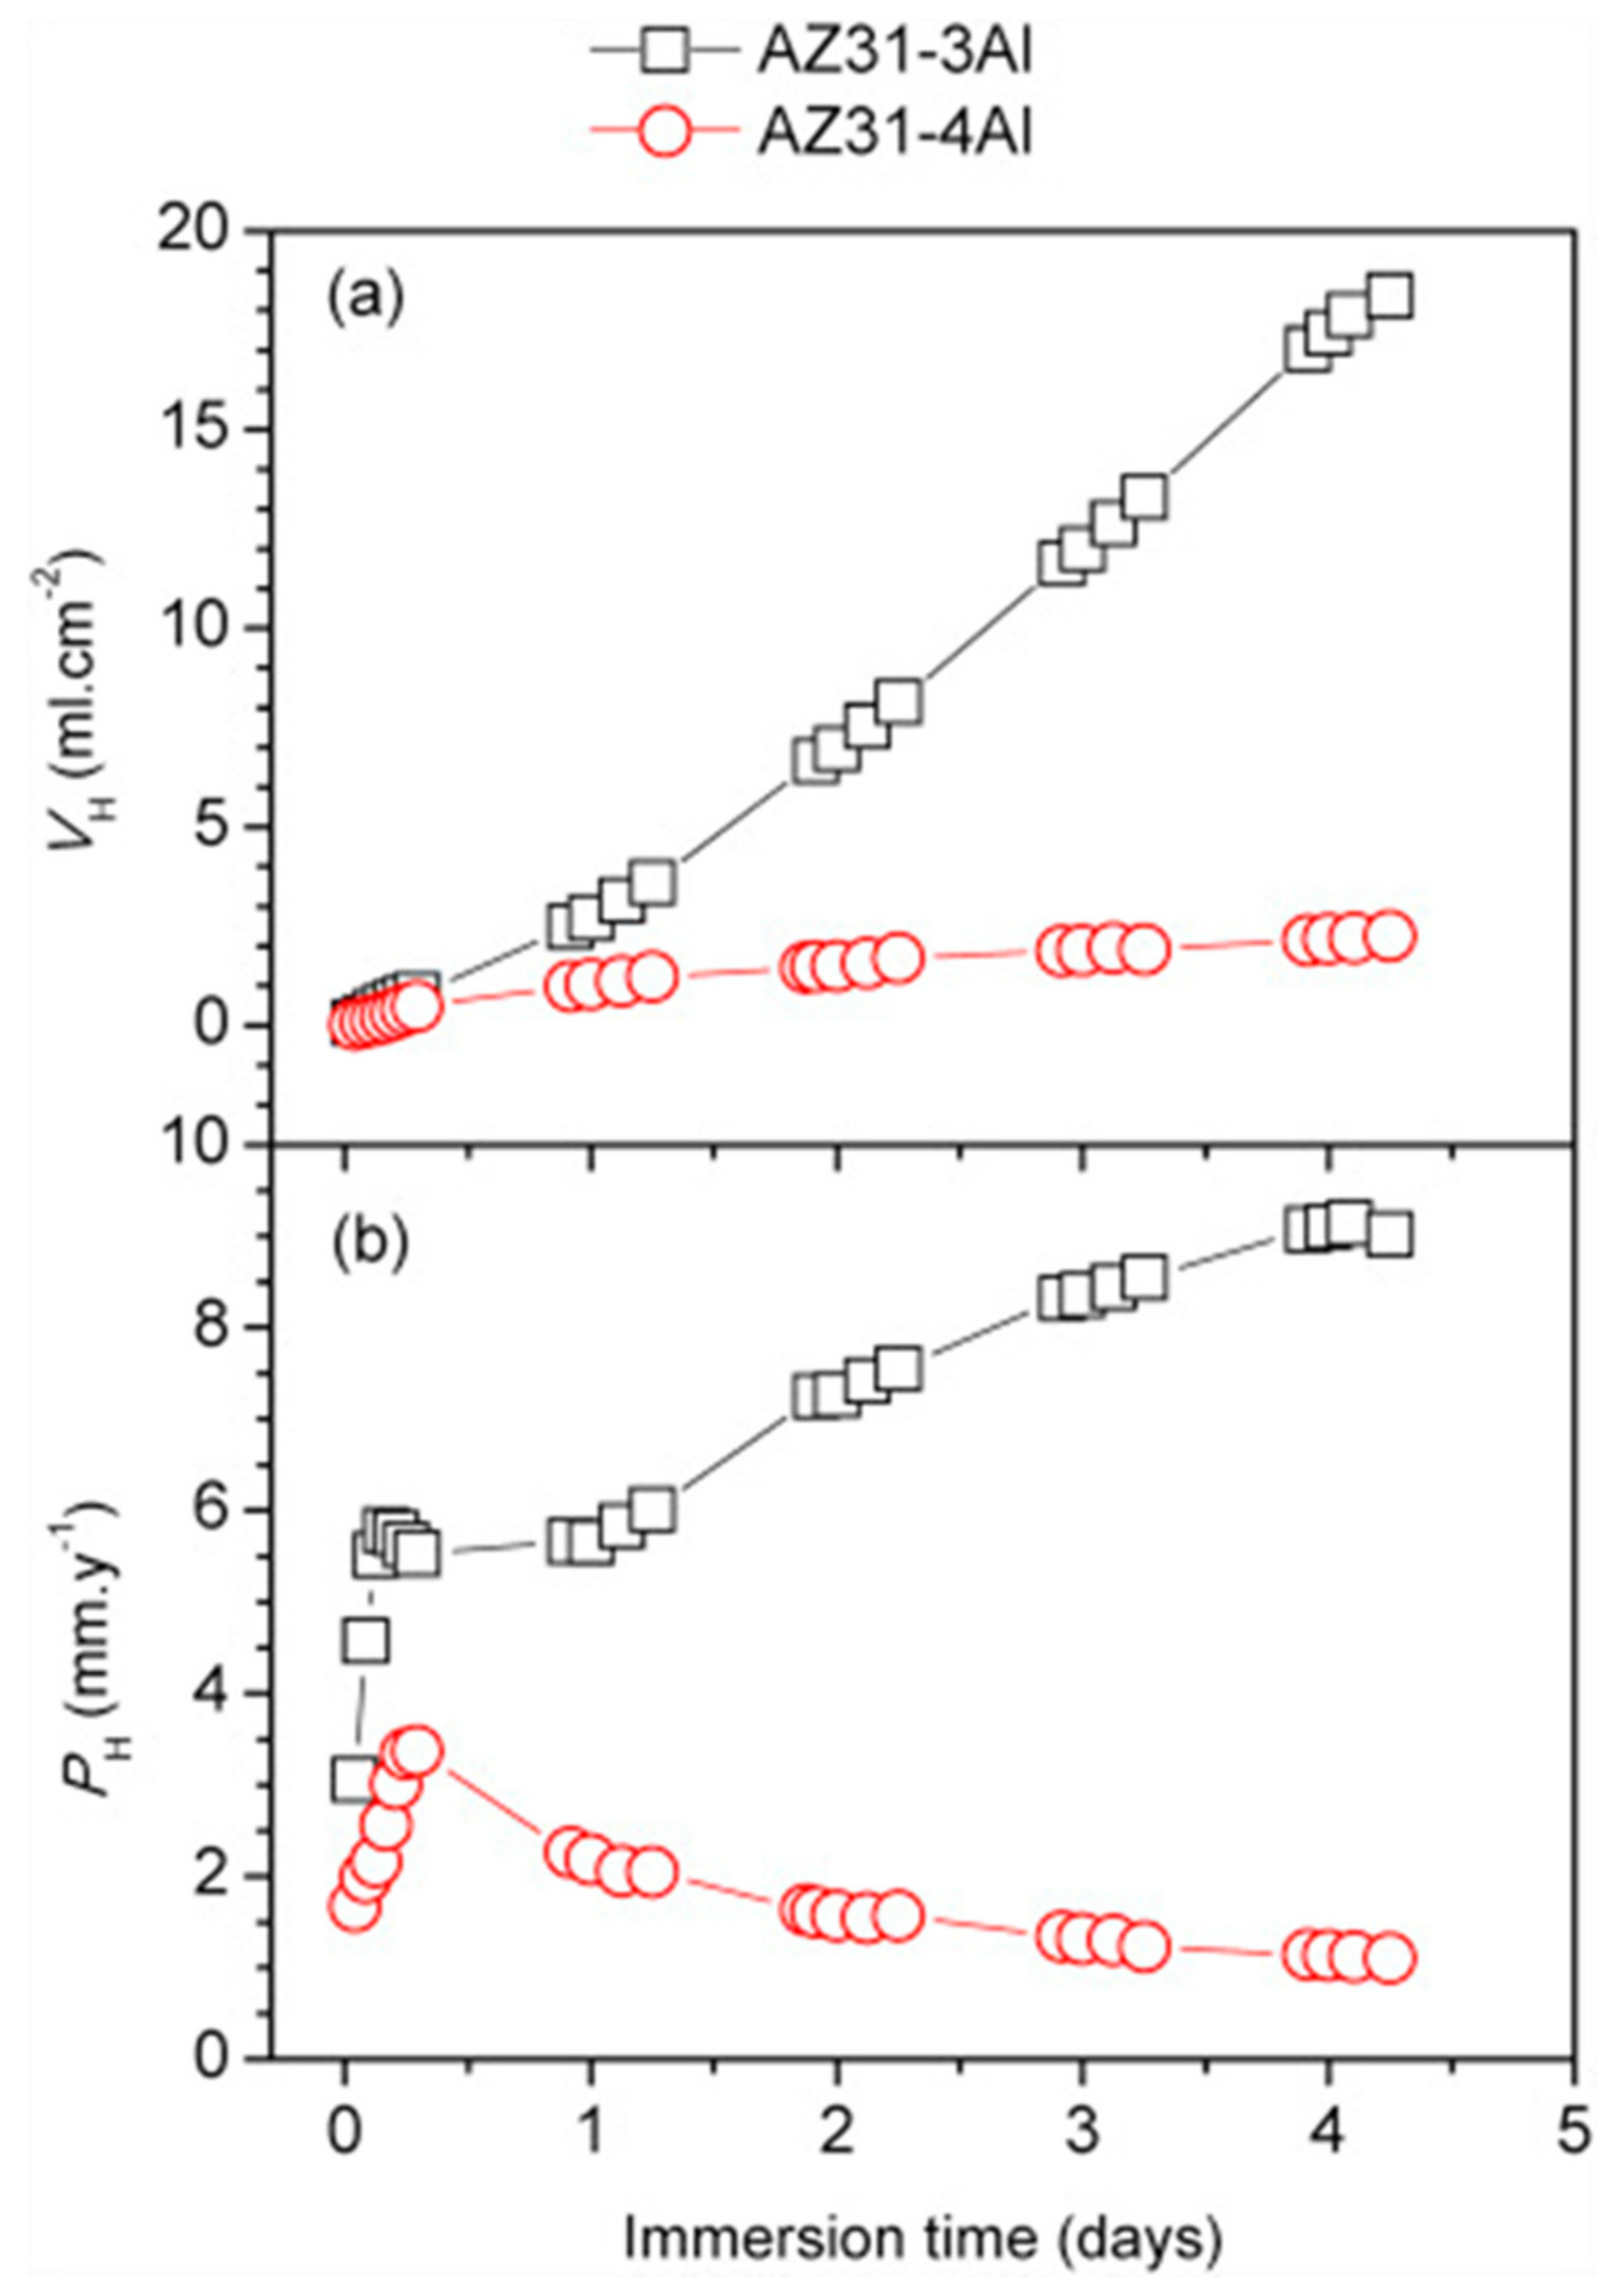
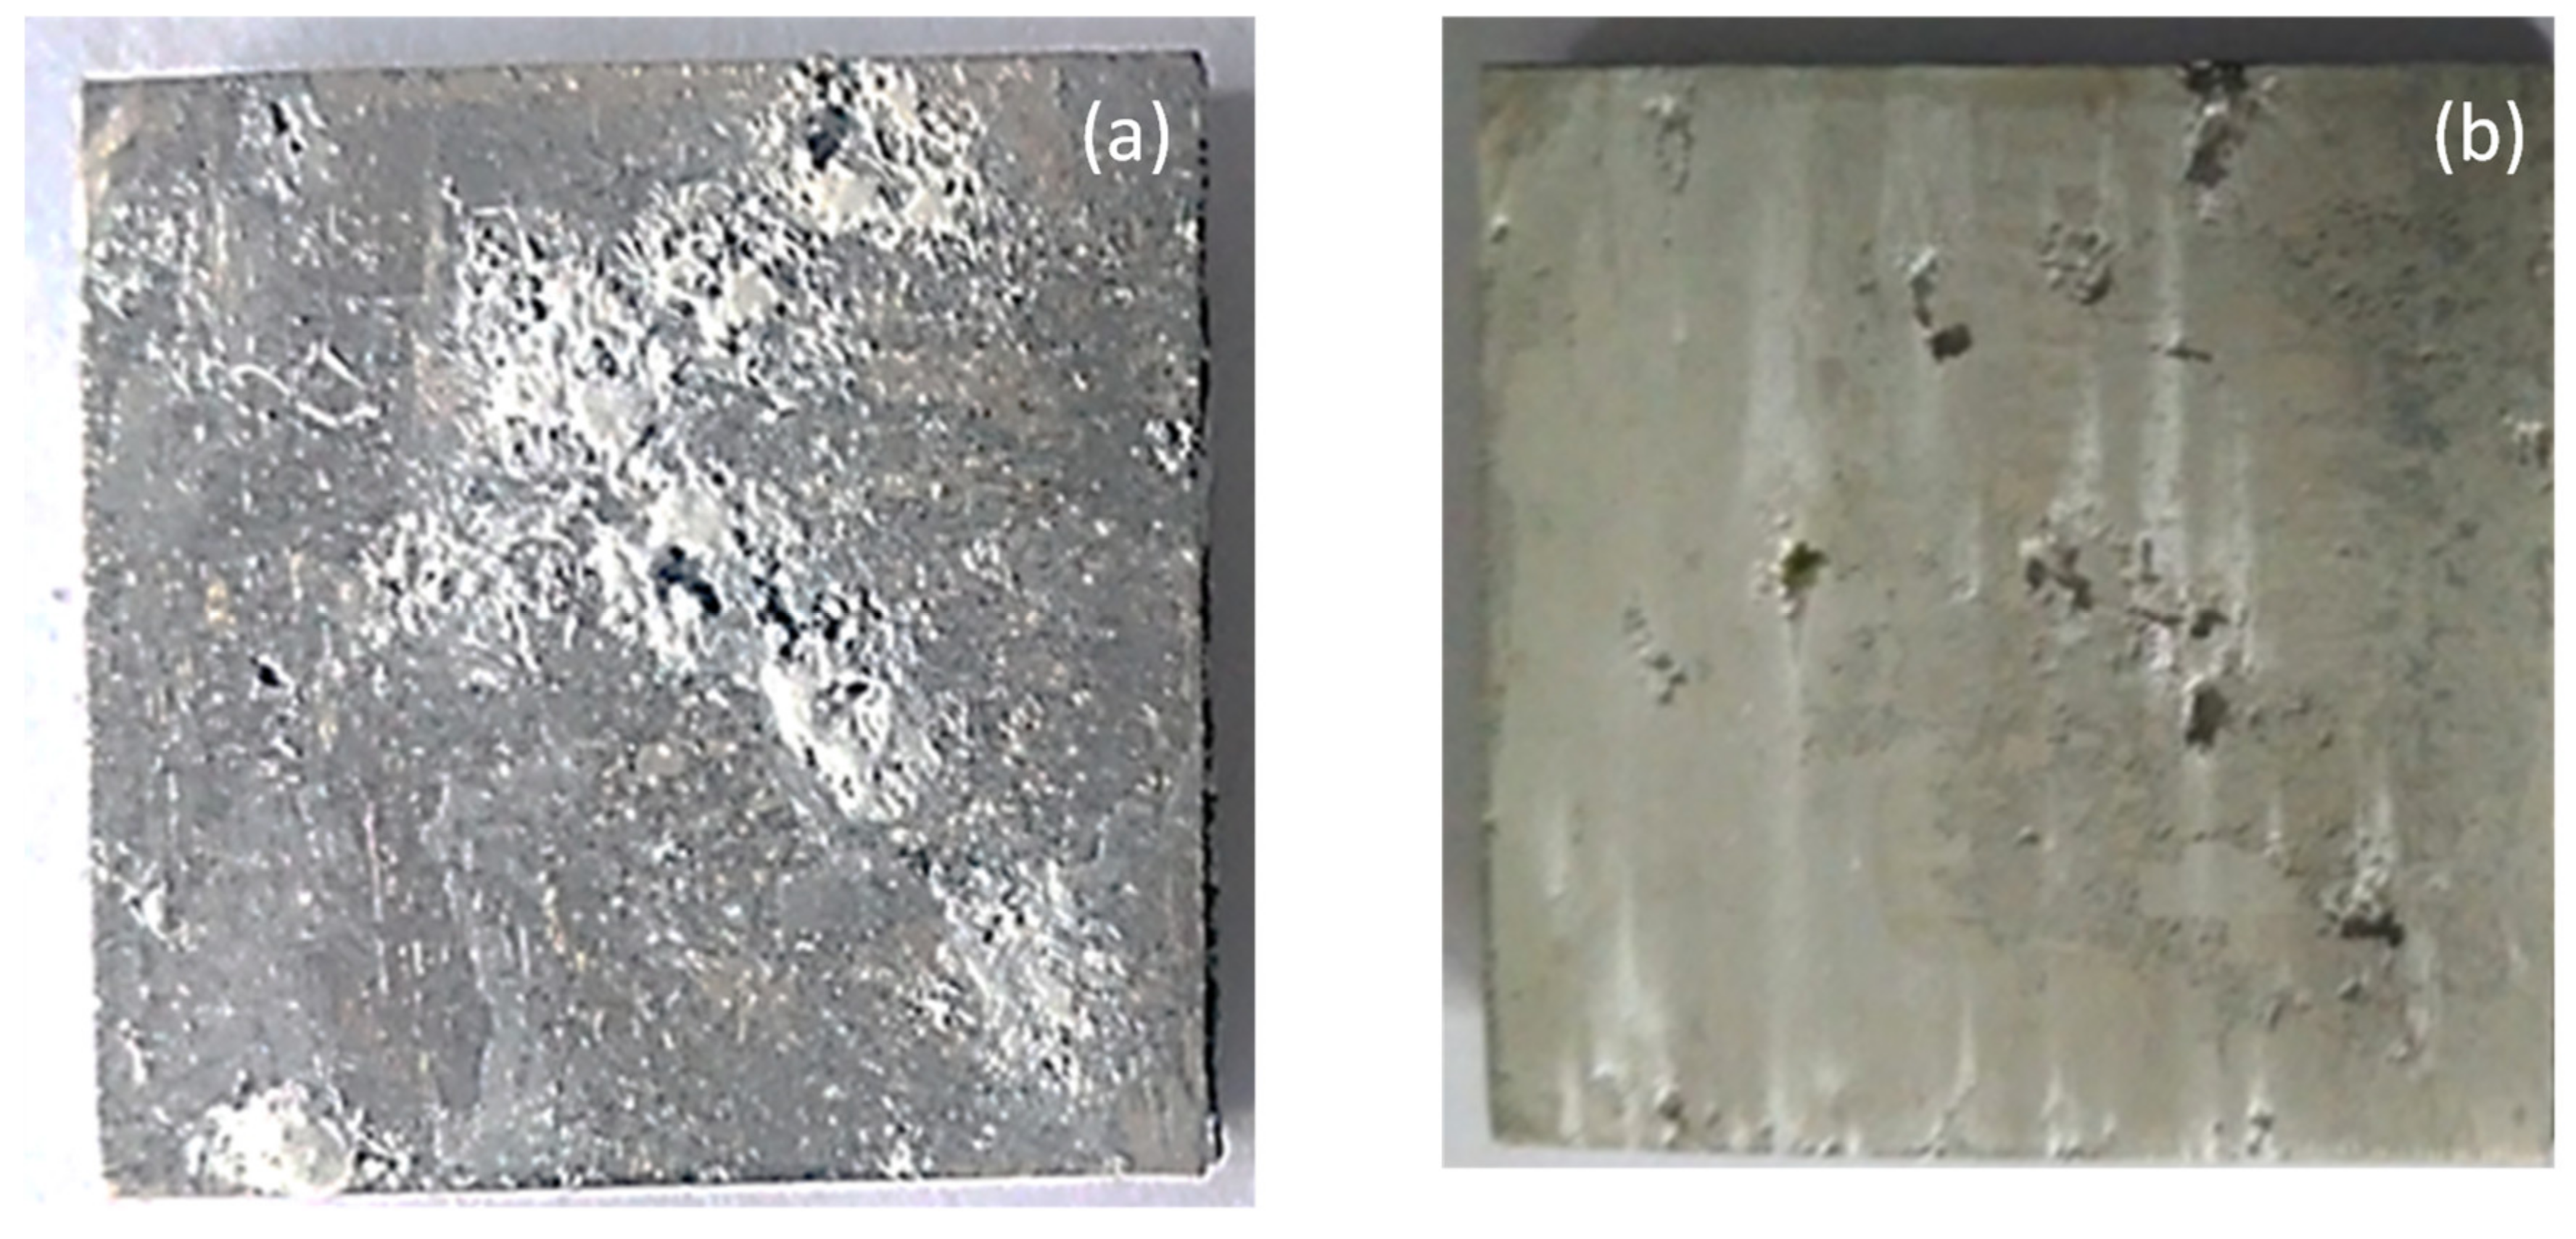
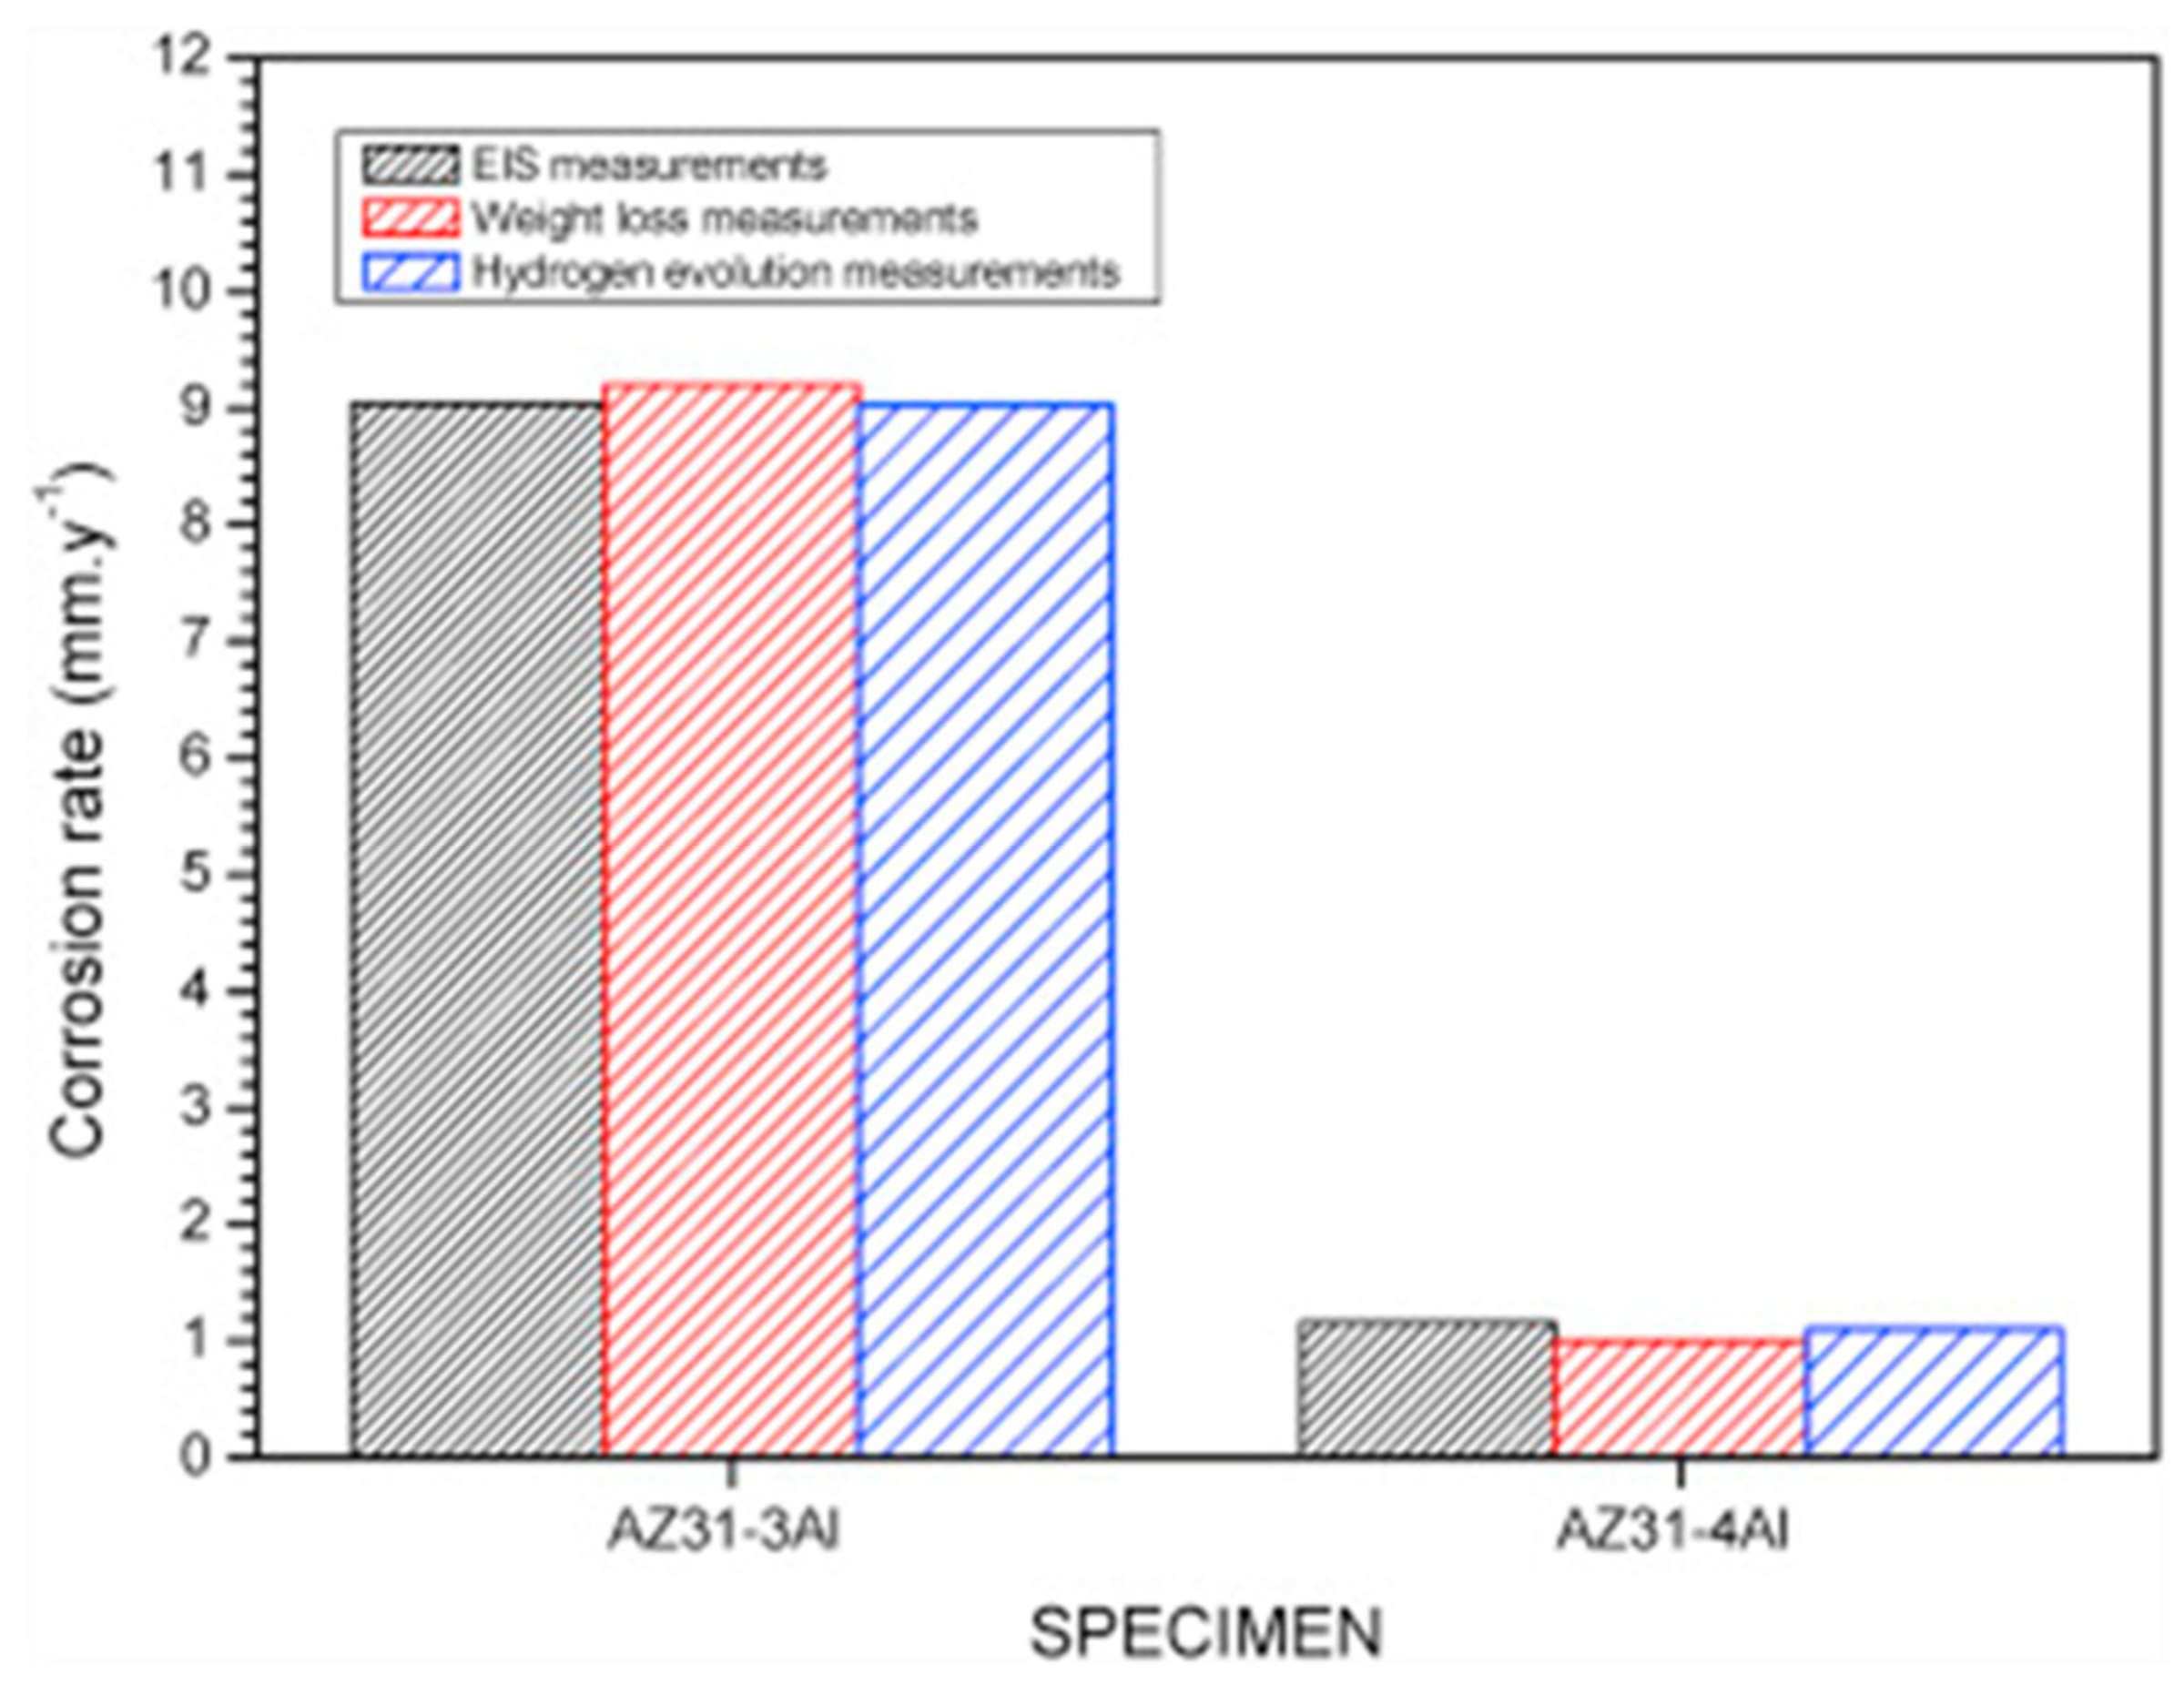
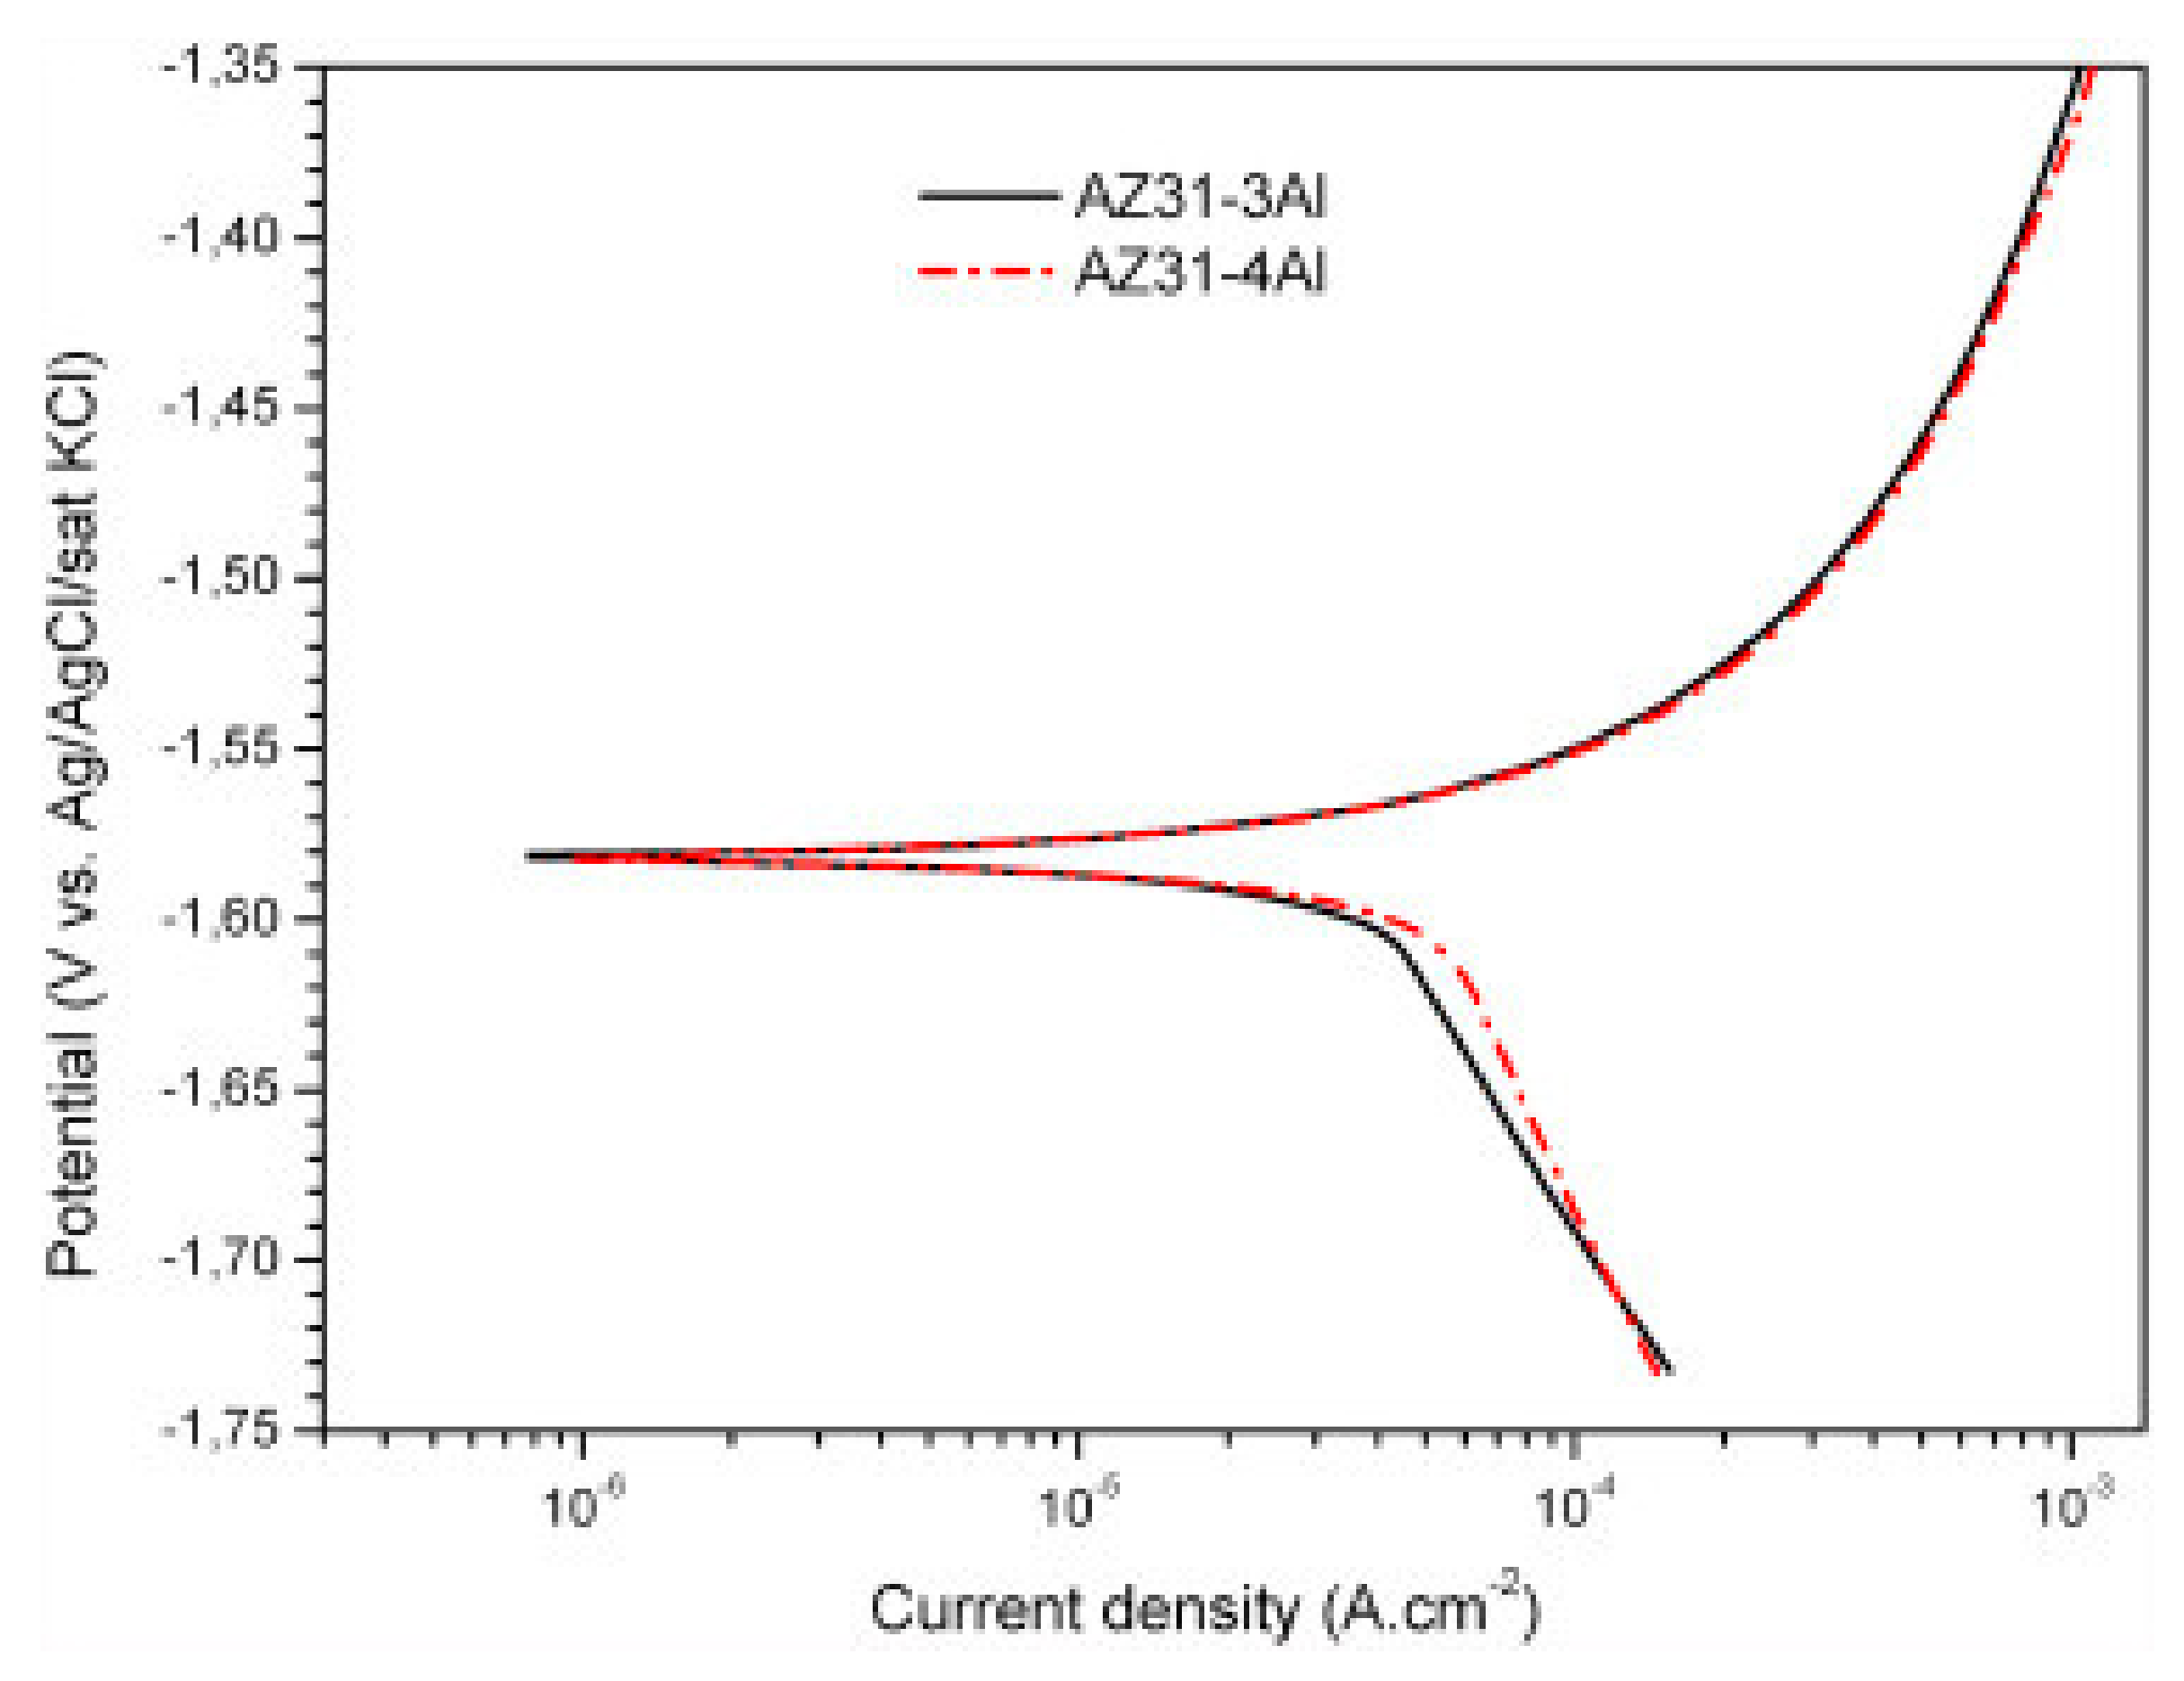
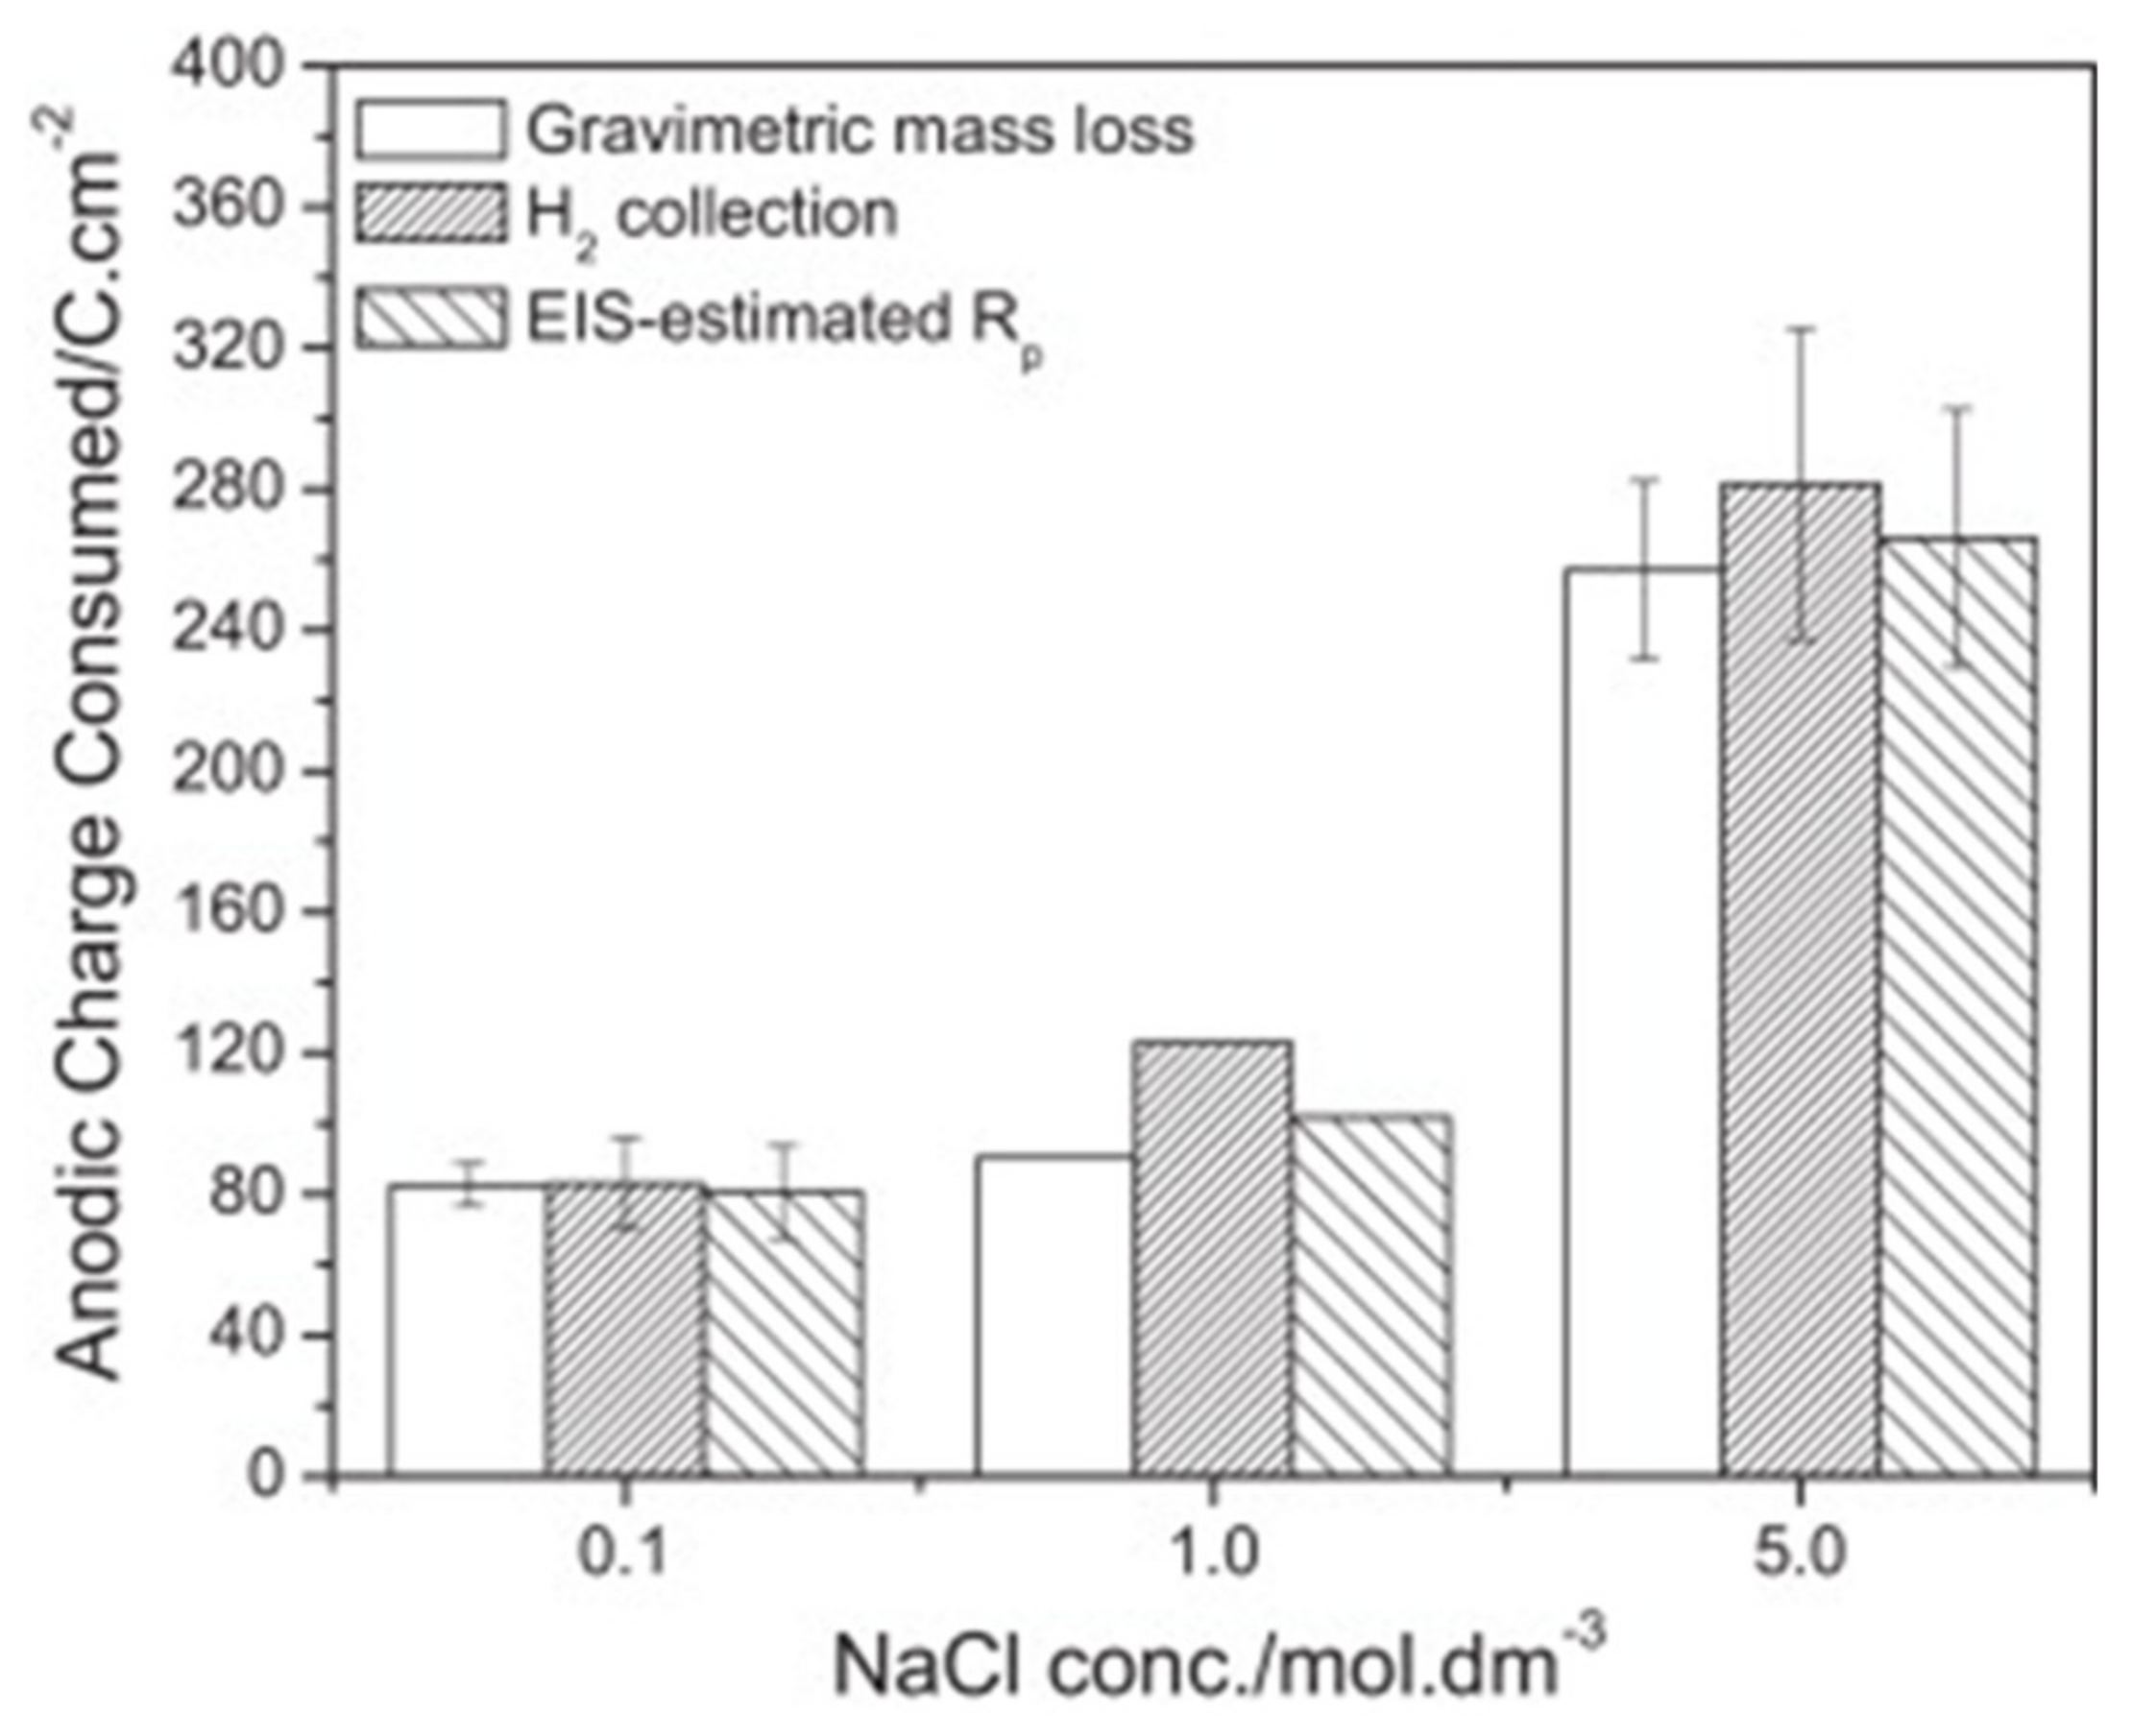
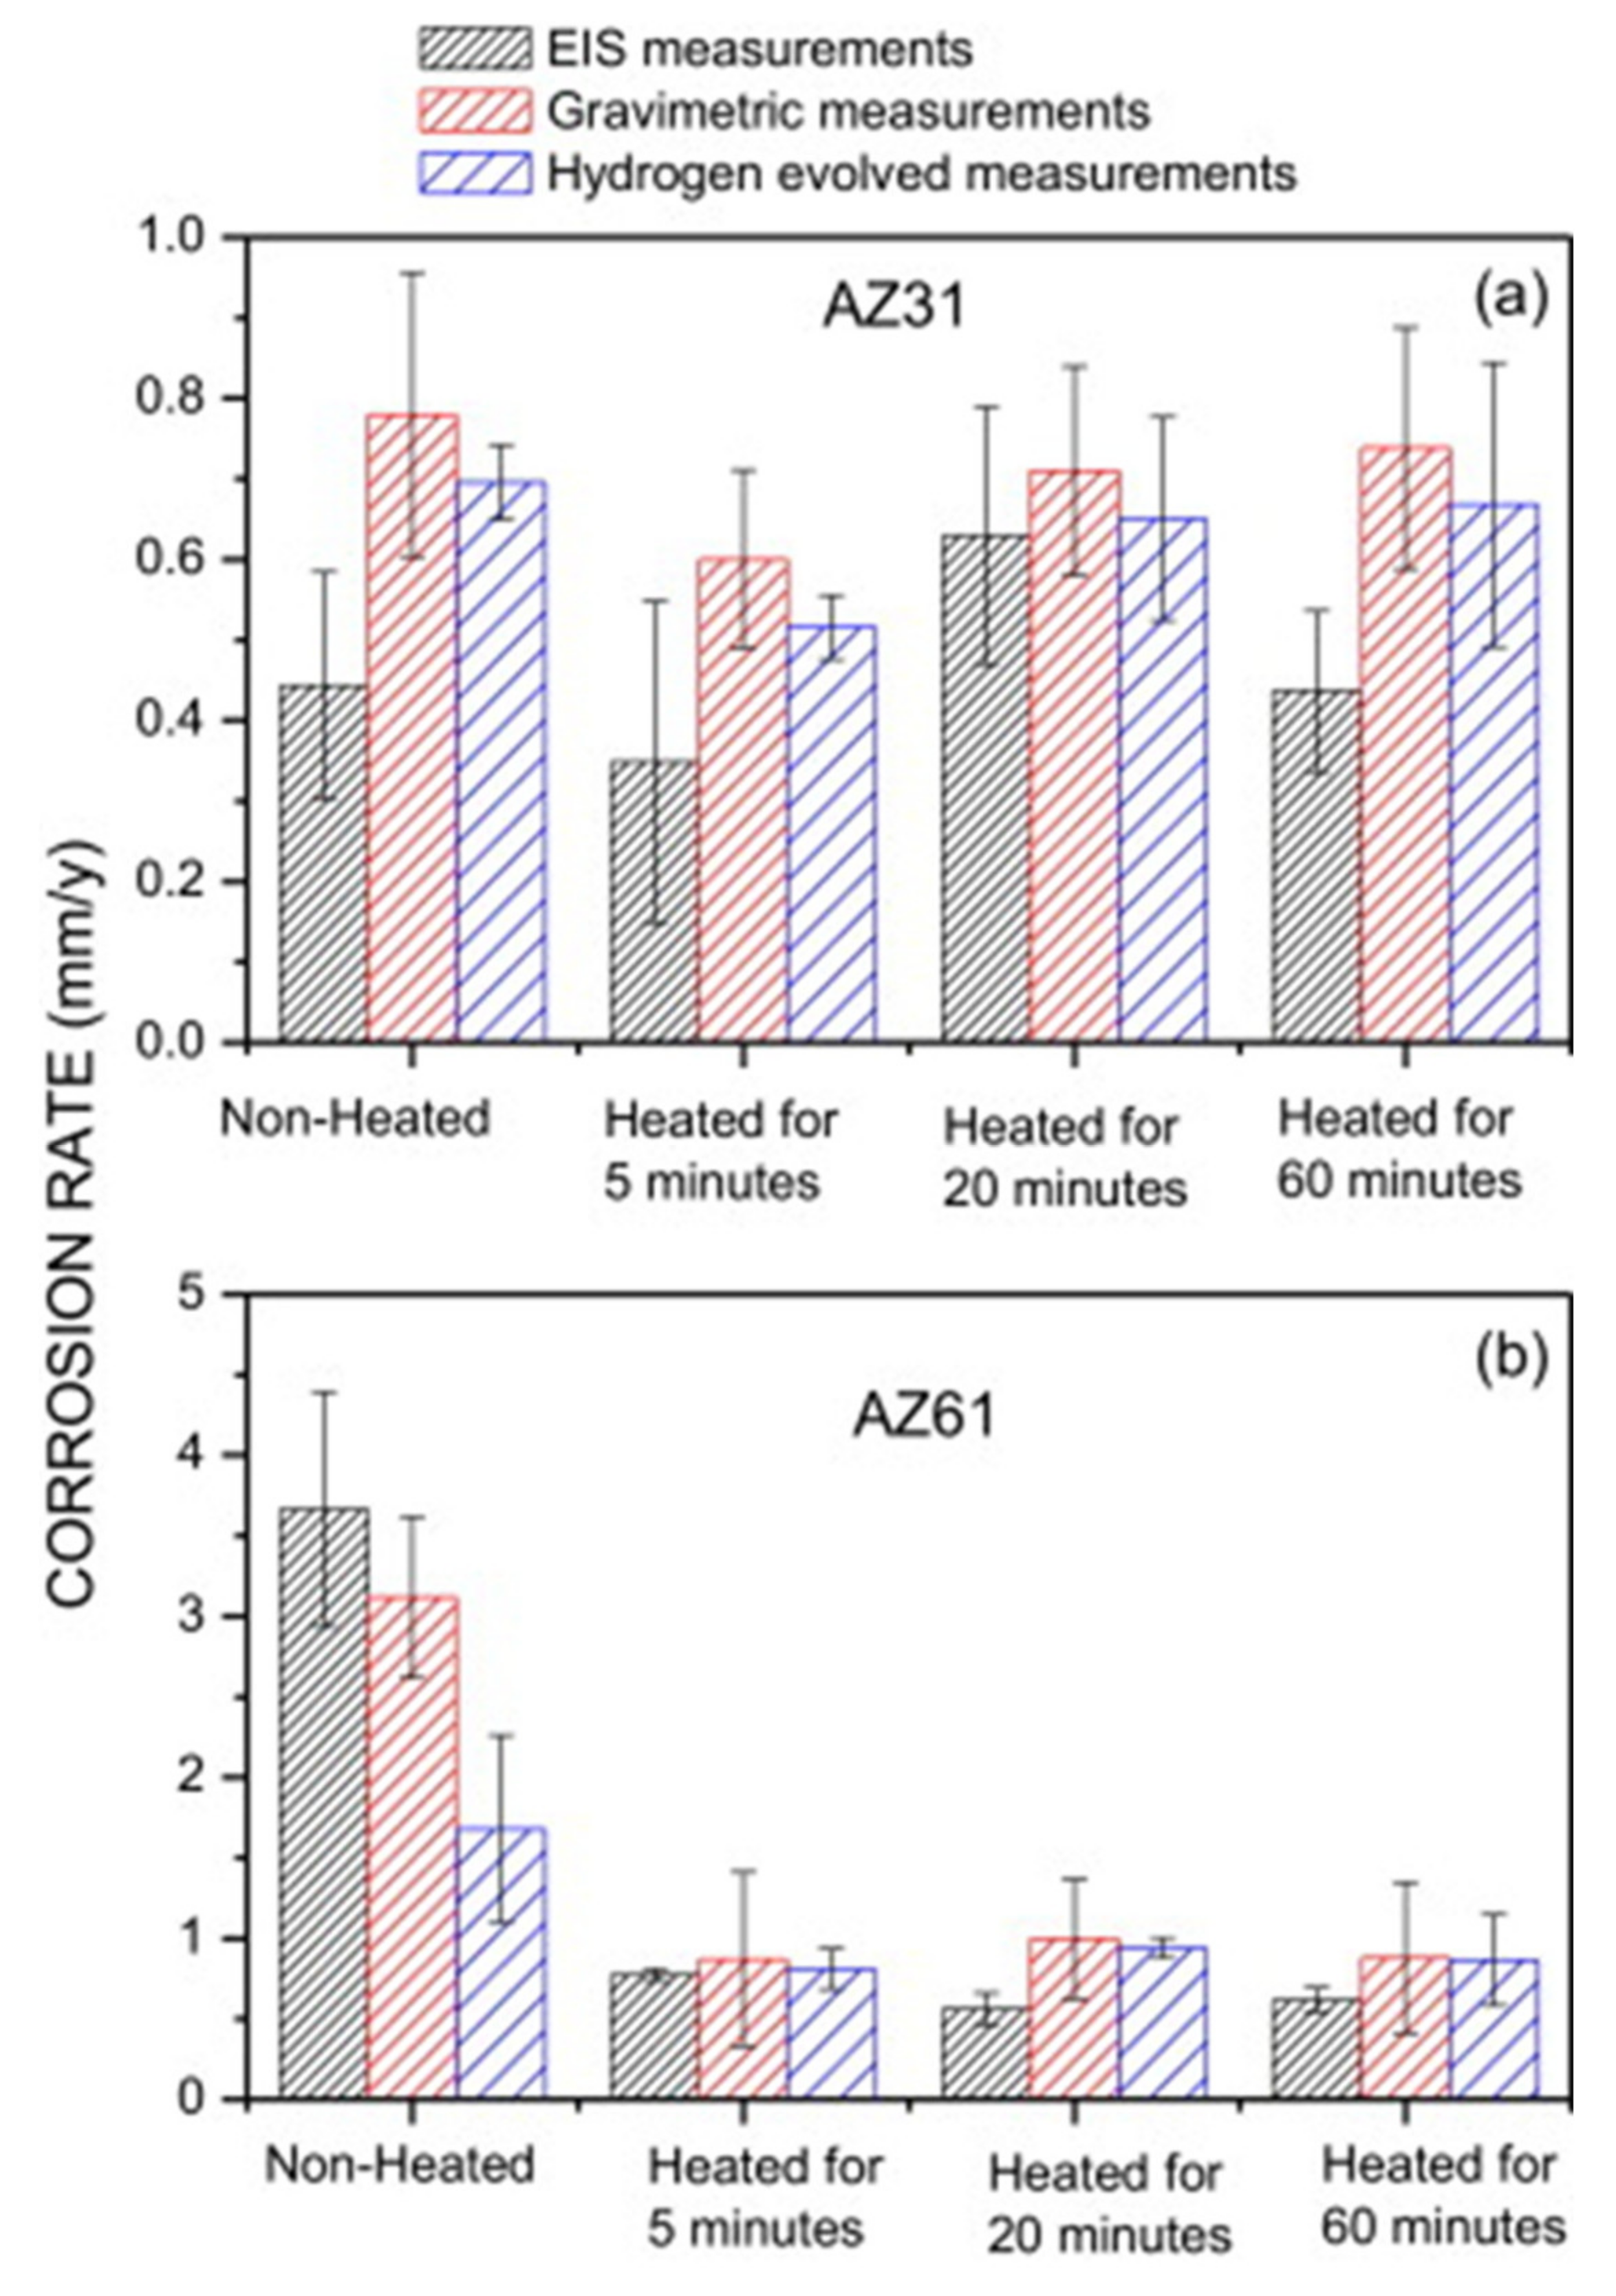
  • The major problem with EIS analysis is that, often, different equivalent circuit models all giving low chi-squared (χ2) error values can be used to fit the same EIS data [5,35,41]. Resistance and capacitance data rely on the correct choice of electric model. Thus, the construction of a proper equivalent circuit requires a deep understanding of the corrosion mechanisms of the system, the use of complementary characterization techniques such as surface, optical, and/or physical chemical analysis, and support by models from published works [5,34,35,39,41]. For instance, Delgado et al. [17] validated their proposed equivalent circuits by comparing the corrosion rates obtained from EIS for AZ31 specimens with those obtained from weight loss and hydrogen evolution methods. However, this is not a common practice.
  • Another major limitation of global EIS measurements is its poor lateral resolution, as the impedance is averaged over the whole macroscopic electrode surface [46]. This makes it more difficult to study localized electrochemical corrosion reactions in which the specific electrochemical parameters of the micro-defect are averaged from those of the entire electrode surface [40].
  • A major disadvantage of AC impedance measurements is that it is not possible to convert the polarization resistance into a corrosion rate without prior knowledge of the Tafel slopes values and the Stern–Geary coefficient [8].
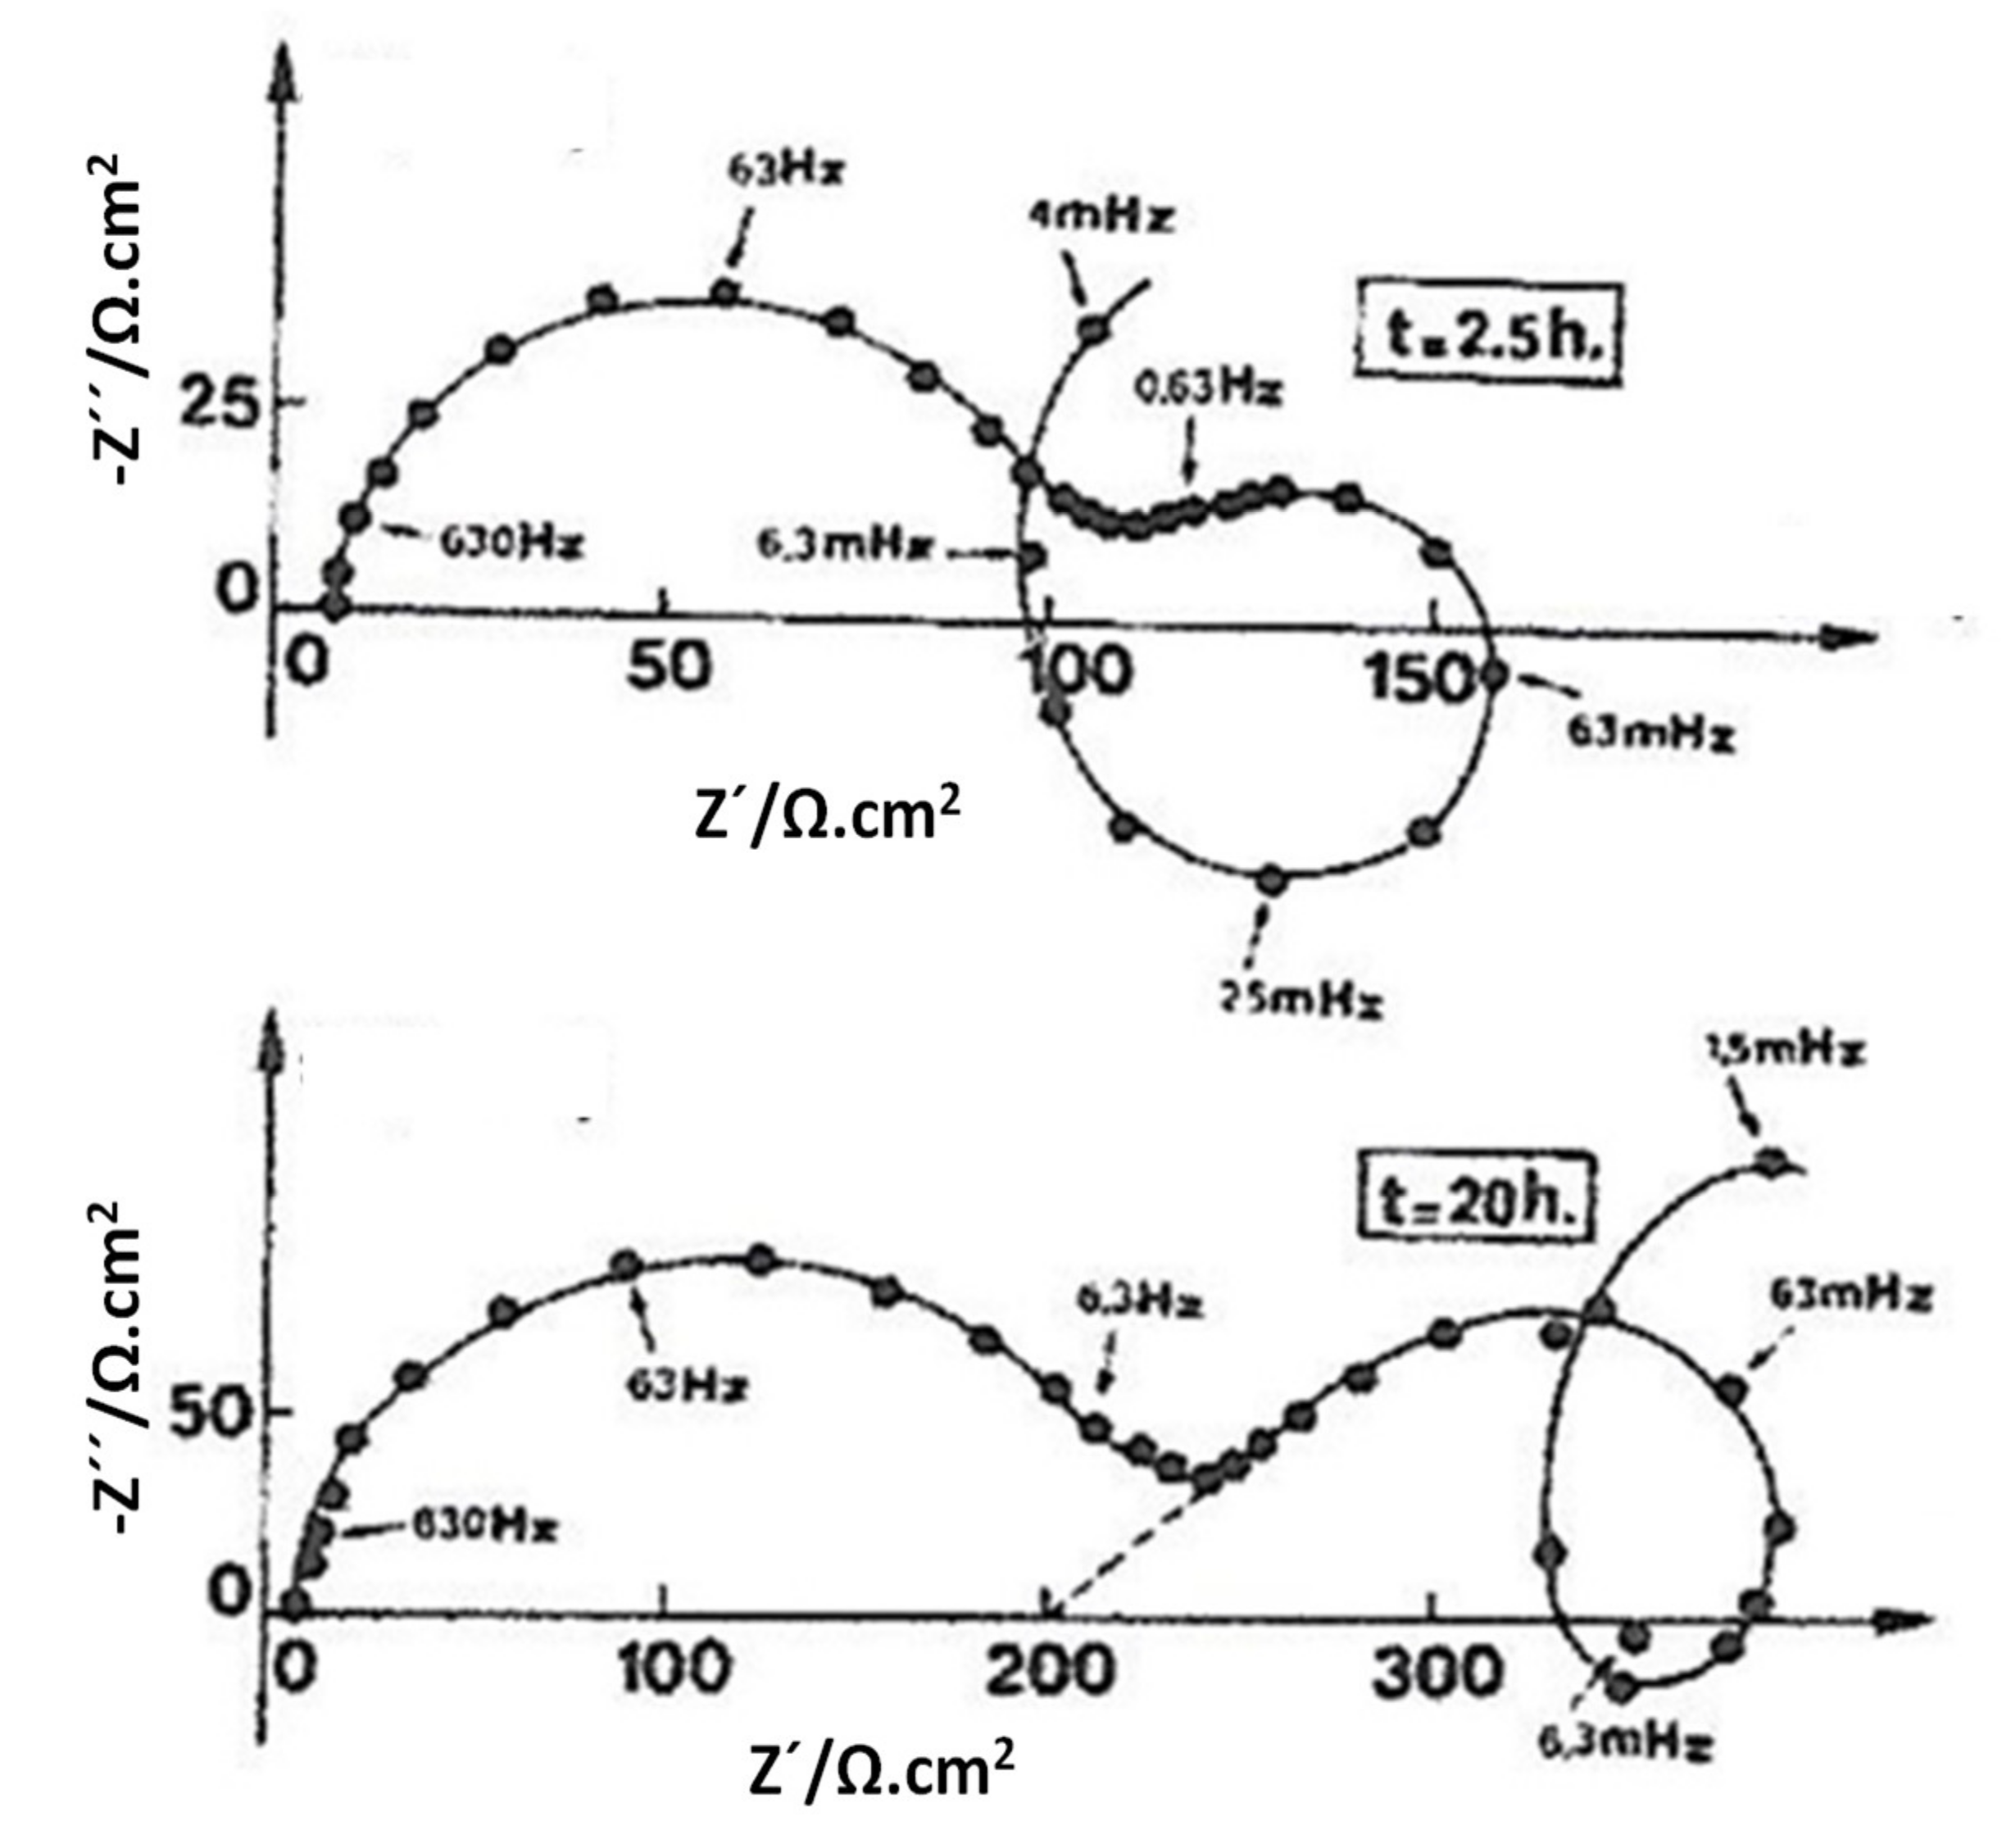
  • Instabilities in the Mg corrosion process for Mg, such as relaxation of adsorbed species or pitting corrosion, can induce dispersion in the impedance values recorded at low frequency.
  • Finally, unlike polarization curves, EIS cannot determine changes in corrosion potentials and relative anodic and cathodic reaction kinetics caused by different alloying elements, microstructural features (e.g., secondary phases), or solutions [5,42].

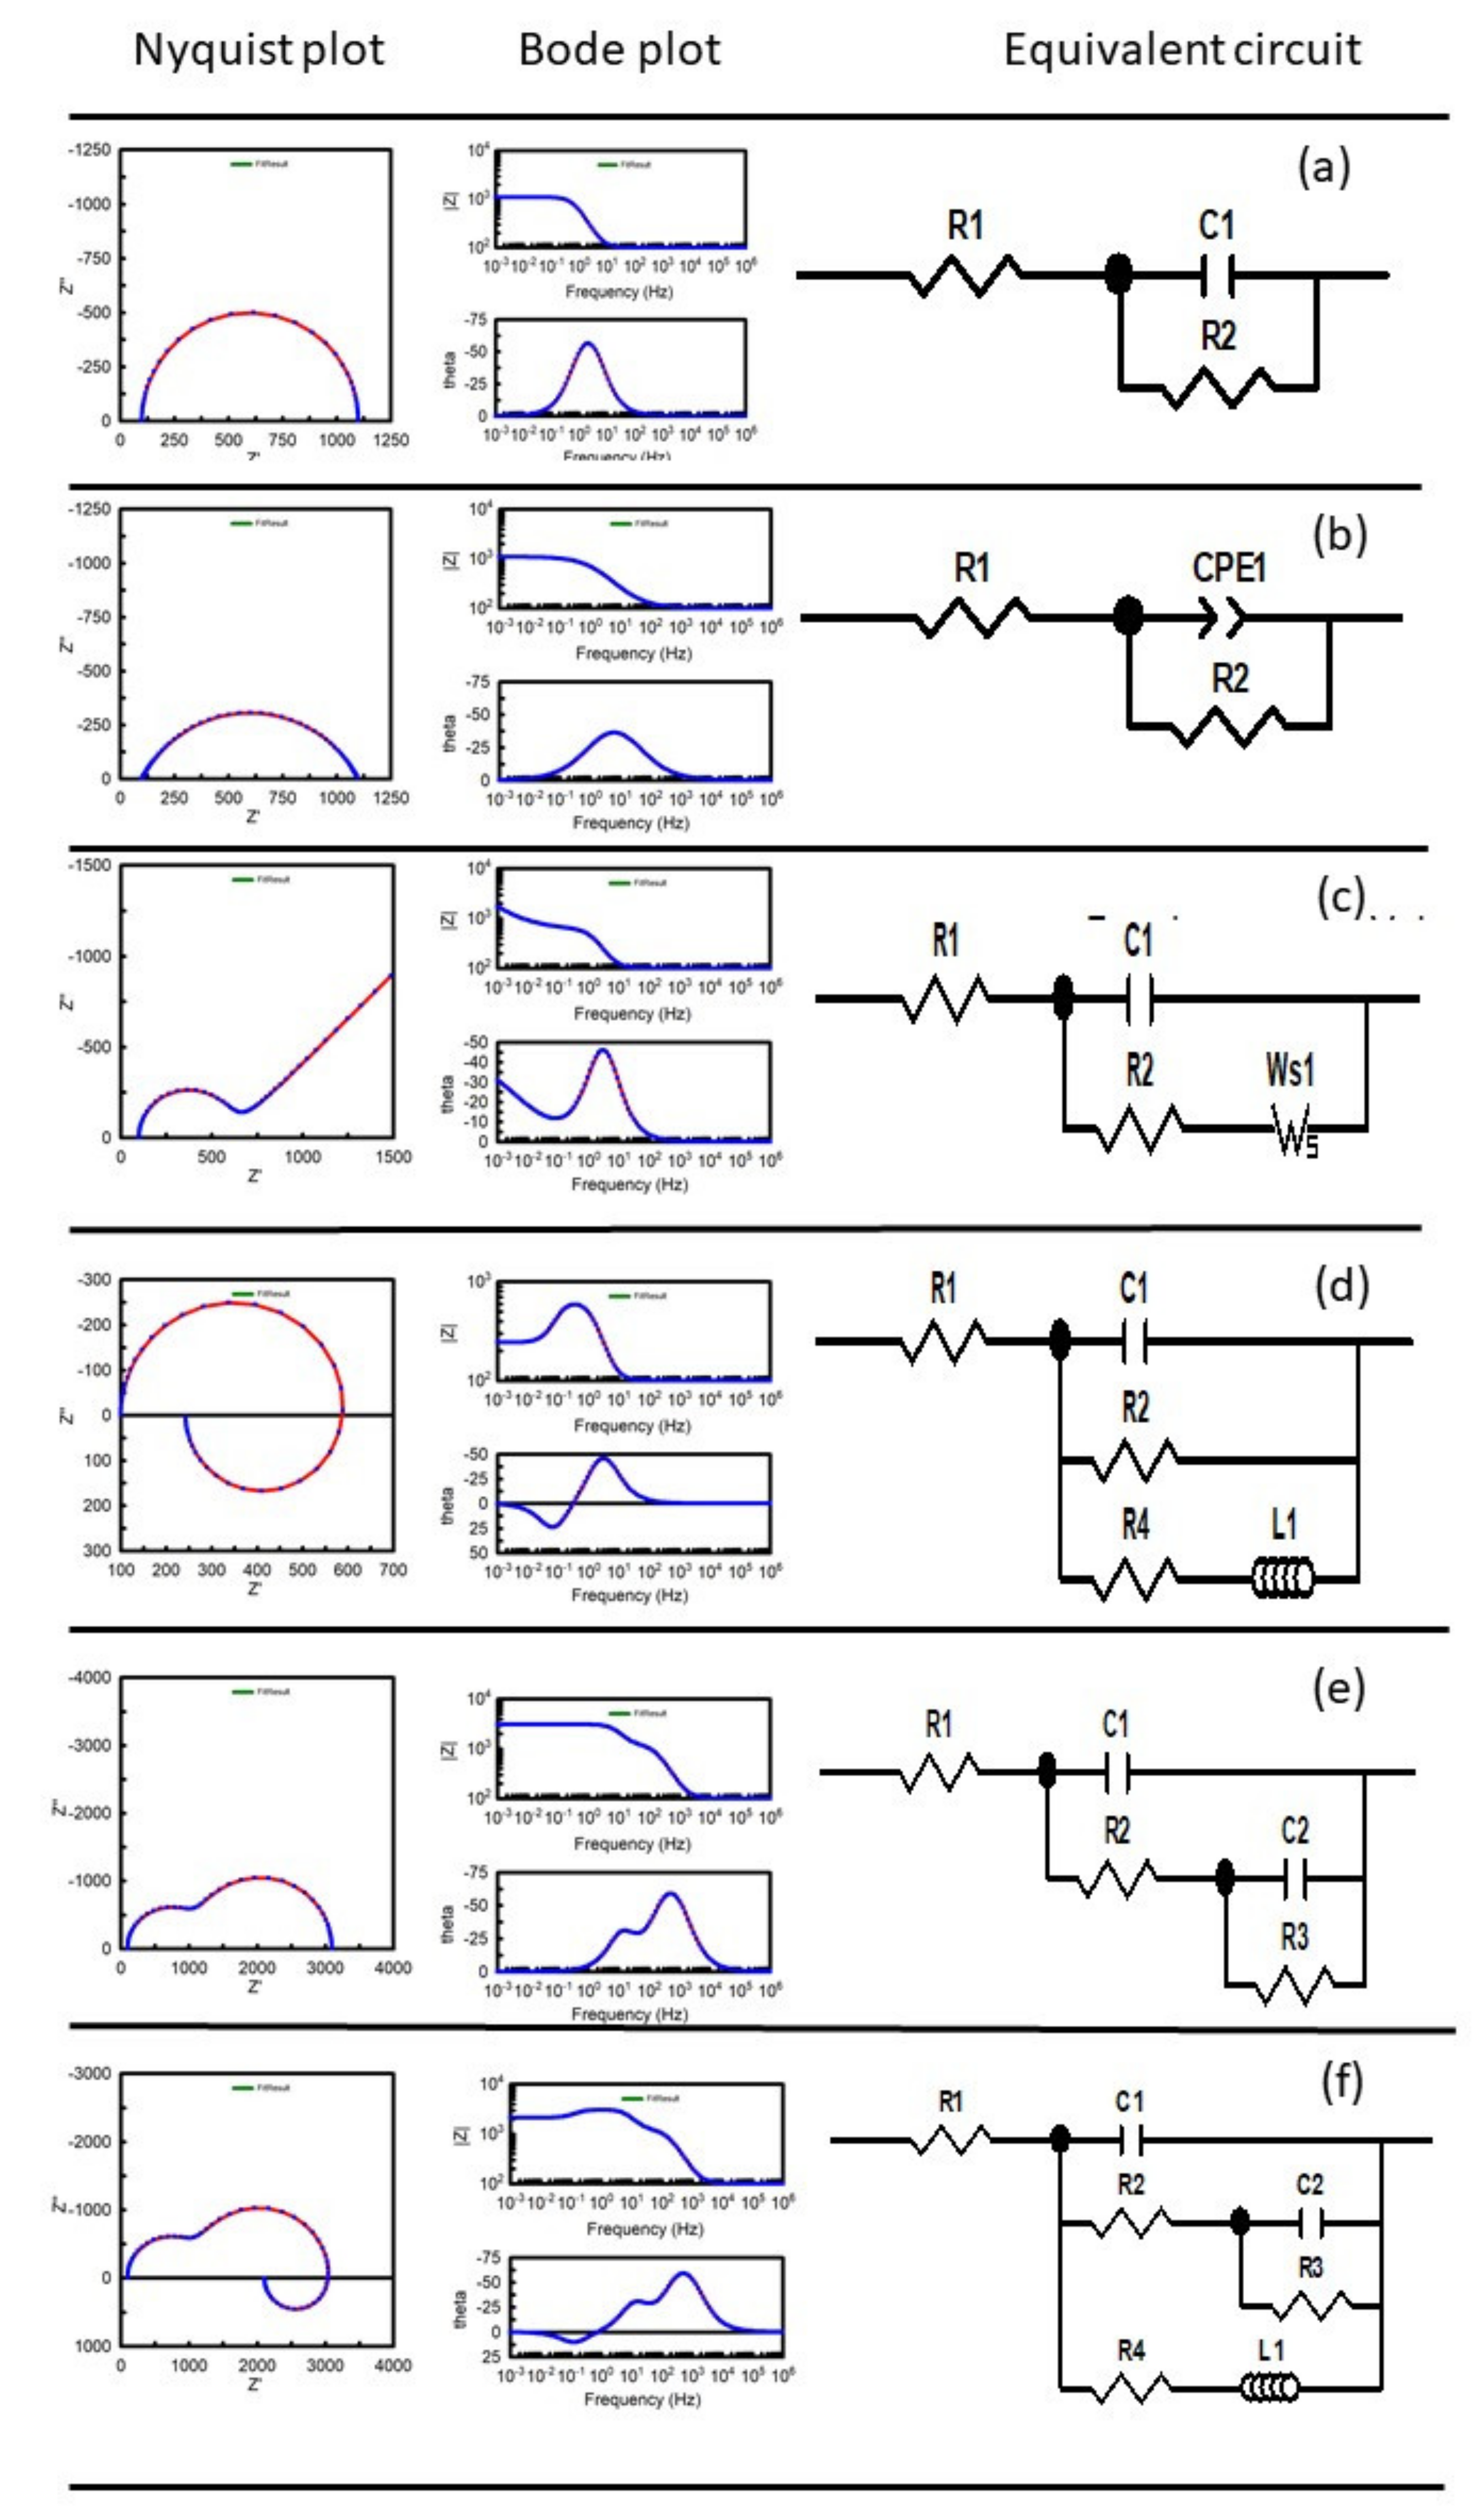
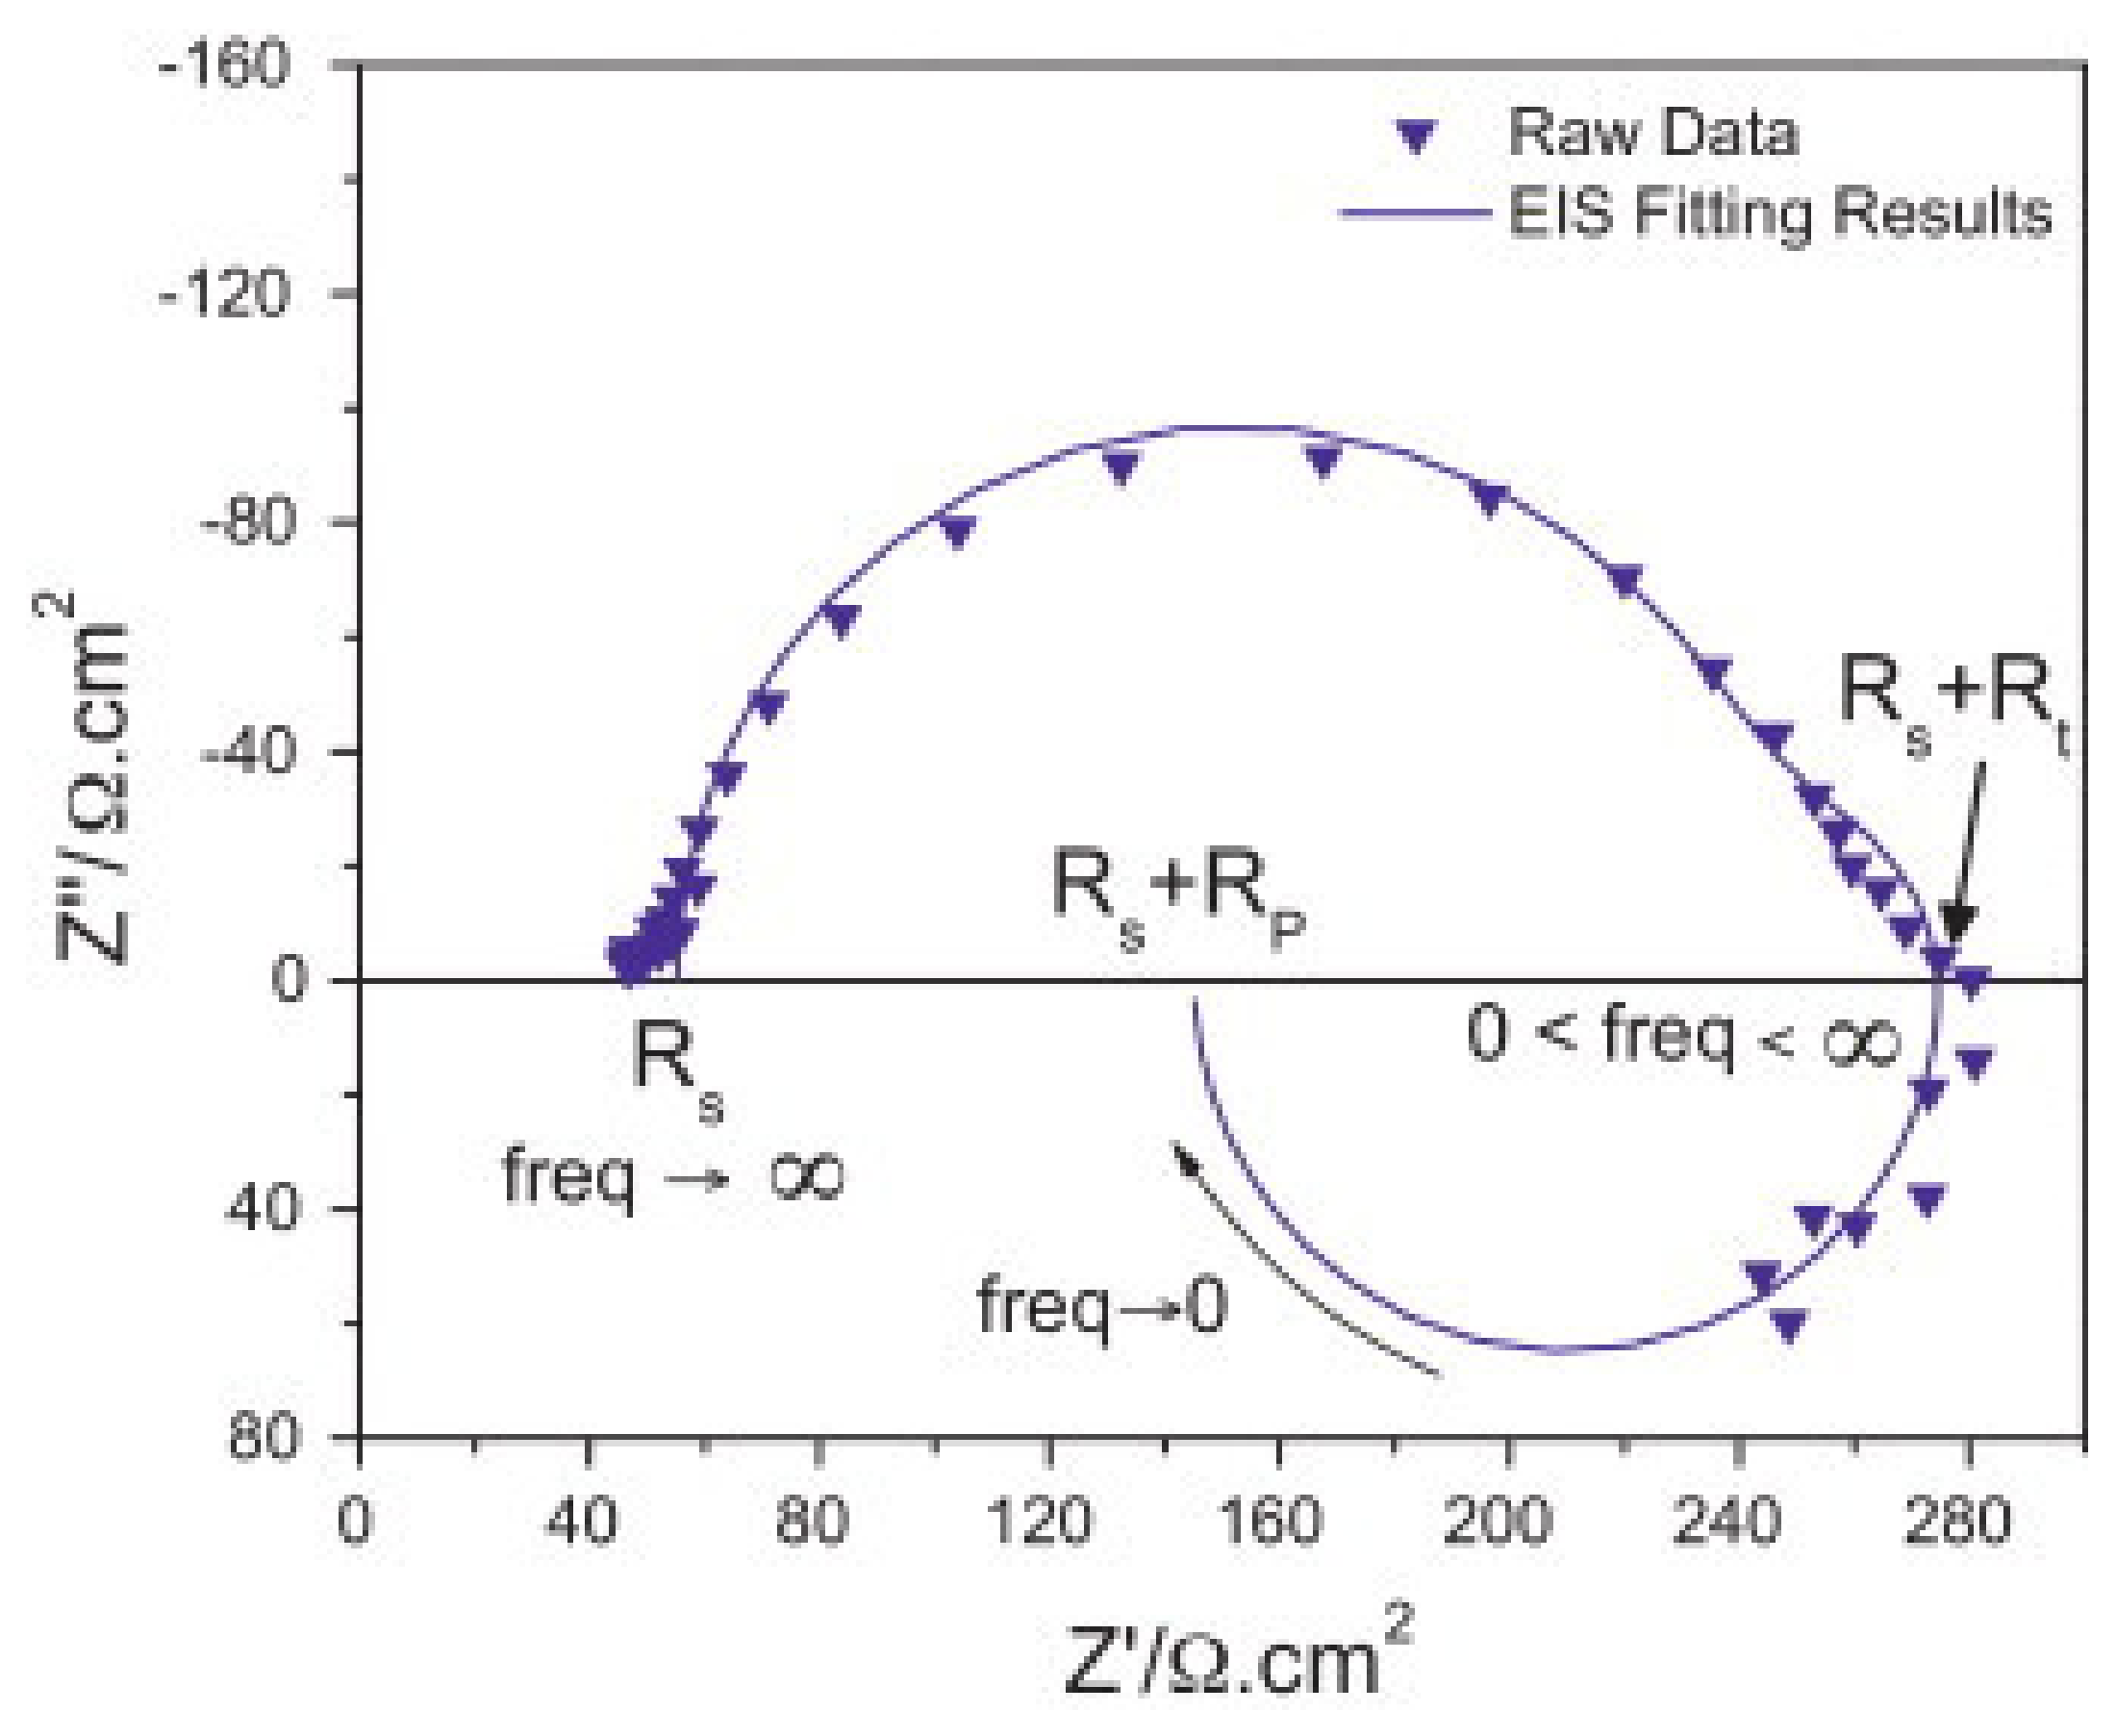
3.4. Typical Spectra and Equivalent Circuits

The typical impedance spectra of Mg/Mg alloys and the equivalent circuit used to fit the EIS experimental data are shown in Figure 6. The simplest Nyquist plot reveals one semicircle (Figure 6a), which may correspond to a corrosion process under activation control [45]. For analysis, the capacitive arc was simulated by a simple Randles equivalent circuit, consisting of the charge transfer resistance (R2) in parallel with the double layer or oxide film capacitance (C1) in series with the solution resistance (R1) [47,48] (Figure 6a). The diameter of the semicircle is associated with the charge-transfer resistance (R2) [47,48]. In theory, the value of R2 can be used for measuring the corrosion rate of Mg alloys using the Stern–Geary relationship. From the capacitance value, the thickness of the thin MgO surface film may be estimated using:
d = εε0S/C1
where S is the exposed area, ε is the relative dielectric constant of magnesium oxide (ε = 10), and ε0 is the vacuum permittivity (ε0 = 8.85 10−14 F/cm) [2,49]. This classic model, which is very common for the metal/oxide layer/electrolyte of electrochemical systems, typically gives valuable information regarding the reaction across the interface [50,51,52].
However, the use of this equivalent circuit for the quantitative measurement of the corrosion rate of Mg alloys with more complex electrochemical behavior than predicted by this model presents limitations and complications when trying to interpret and understand most impedance spectra [38]. For example, the real electrochemical interface on the microscopic level is not the often-presumed smooth, uniform, and non-defective surface that is typical for a pure capacitator [40]. It contains a large number of structural features such as porosity, surface inhomogeneities, and surface roughness [53]. Consequently, in the Nyquist plot, the semicircle becomes flattened (Figure 6b). Owing to the non-uniform distribution of current flow arising from surface inhomogeneity, constant phase elements (CPE1) are chosen to replace the double-layer capacitance (and other capacitances) in the equivalent circuits (Figure 6b). The impedance of the CPE is defined as
ZCPE = 1/Y(jω)α
where Y is a parameter related to the electrode capacitance and α is a coefficient between 0 and 1.
When the corrosion mechanism is controlled not only by a charge-transfer process but also by the diffusion of charged species through the corrosion products, a straight line with a slope of 45° is observed at the lower frequencies in the Nyquist plot [54,55] (Figure 6c). Therefore, a modified Randles-type equivalent circuit with a semi-infinite Warburg diffusional impedance element (Ws1) is used to simulate the EIS results [56,57], as shown in Figure 6c. These low-frequency tails might be expected to bear a close relation with the diffusion coefficient of the electroactive species through the corrosion layers [58].
To the author’s knowledge, there have been relatively few EIS studies about the corrosion of Mg alloys that have reported Nyquist plots characterized by a single capacitive loop at a high frequency and one inductive loop at a low frequency [17,59,60,61,62,63,64] (Figure 6d). The reason for the presence of the inductive loop can be pitting corrosion and linked to adsorption/desorption of intermediates on the electrode surface [50,65,66] or because of accelerated anodic dissolution [9]. The inductive loop could disappear when corrosion protective layer is formed on the surface [67,68,69], whereas larger inductive loops indicate more severe pitting corrosion [64]. Considering the inductive response observed at low frequencies, a resistance (R3) and an inductor (L) were incorporated into the simple Randle circuit [64] (Figure 6d).
Electrochemical impedance experiments can often detect the formation of protective corrosion product layers or the presence of coatings on the surface of Mg [5]. In such cases, the EIS spectra comprise of two capacitive loops in the high- and low-frequency ranges, and there is no inductive loop (Figure 6e). In the equivalent circuit, R1 and C1 represent the resistance and capacitance components of the protective corrosion layer or coating, R2 is the charge transfer resistance, and C2 characterizes the capacitance of the electric double layer [70,71] (Figure 6e).
In the literature that describes the use of the EIS technique to study the corrosion of Mg alloys, it is normal to find impedance diagrams that are rather complex, showing a capacitive arc at high frequencies (HFs), a second capacitive arc at medium frequencies (MFs), and an inductive loop at the lowest frequencies [12,29,50,72,73,74,75,76,77,78,79,80,81] (Figure 6f). However, the interpretation of the two HF and MF capacitive arcs is a controversial and uncertain subject [28,72]. Some works suggest that the HF capacitive arc can be ascribed to charge transfer processes and the capacity effect of the electrochemical double layer, while the MF capacitive arc can be associated with mass transport processes related to the diffusion of Mg2+ ions through the layer of corrosion products [12,29,50,73,75,76,77,78,79,80,82]. In contrast, other works attribute the HF capacitive arc to the resistance of passivating films [81,83,84,85,86,87,88] or to the layers of corrosion products [89,90], while the MF capacitive arc has been related to the charge transfer reaction [9,19,81,82,83,84,85,86,87,88,89,90,91,92,93].
In most studies on Mg alloys using the EIS technique, a deductive approach is used, and the numerical value of electrical parameters is calculated from the fit of experimental impedance diagrams to equivalent electrical circuits based on the kinetics of a hypothetical reaction or a set of electrochemical reactions taking place in the system [69,73,75]. However, it should be noted that electrochemical reactions involved in both the corrosion of Mg and the physical explanation of the electrical components used in electrical circuits are not fully understood, despite large discussions on the subject [9,19,69,73,75,94]. Today, there is significant controversy over the corrosion mechanisms of Mg [94]. Some works [69,73,75] have suggested the formation of uni-positive Mg+ ions as reaction intermediates on the surface of Mg alloys during the corrosion process, and other recent works [9] have questioned its existence.

4. Corrosion Rate Values Determined by EIS

The EIS technique has been widely used to obtain qualitative information on the reactions and mechanisms of the electrochemical deterioration of Mg alloys [48,49,50,52,53,54,56,57,65,67,69,72,73,76,83,95,96]. In addition, it has been used for qualitative evaluation and comparison of the corrosion resistance of this material [17,84,97]. Much less common are papers presenting quantitative values of the corrosion rate obtained from the impedance diagrams [6,9,16,19,28,29,55,87,88,91,92,94,98,99,100,101]. However, the use of this technique for the quantitative measurement of the corrosion rate of Mg alloys, which have more complex electrochemical behavior than most other metals [1], presents a high degree of uncertainty regarding the interpretation of the different arcs and the value of the resistance deduced from the impedance diagram that is most directly related to the corrosion rate of Mg alloys [9,19].
In 1938, Wagner and Traud [102] showed that, when the reactions in a corrosion cell are under activation control, the corrosion current density (icorr) and polarization resistance (Rp) are inversely proportional. Later, Stern and Geary [103] emphasized the practical applicability of this relationship, as indicated in Equation (4), for determining the instantaneous corrosion rate:
icorr = B/Rp
where B depends on the anodic Tafel slope (βa) and cathodic Tafel slope (βa and βc) [9,104,105].
A common method used to determine parameter B is to use the slope of the linear Tafel region (activation control) of anodic and cathodic potentiodynamic polarization curves. Atrens et al. [2] commented that accurate determination of the corrosion rate for Mg/Mg alloys using the Stern–Geary equation critically depends on the values of the Tafel slopes obtained from the polarization curves. While the polarization curves of Mg/Mg alloys have well-defined cathodic branches and the βc can be measured relatively easily [106,107], oftentimes, there is no reasonable linearity of the anodic parts of the polarization curves [9,19]. In the case of Mg alloys, the substantial hydrogen evolution (negative difference effect) during Mg anodic dissolution and local alkalization produces a large ohmic potential drop in the proximity of the electrode surface, often leading to non-linear regions on semi-logarithmic plots of the anodic polarization curve [108]. Curioni et al. [19] commented that attempting to estimate the anodic Tafel coefficient proved unsuccessful. Large uncertainty in the βa values from the polarization curves may cause large errors in the estimated values of corrosion rates [2]. In addition, it is worthwhile noting that potentiodynamic polarization is an instantaneous electrochemical test [9], and corrosion mechanisms and Tafel slopes can significantly change with the exposure time until steady-state corrosion is reached [91].
When polarization curves do not exhibit linear Tafel behavior, an alternative approach is to determine the so-called ‘‘apparent’’ Stern–Geary coefficient (B′) empirically from the correlation between values of resistances extracted from electrochemical techniques and corrosion rates obtained by hydrogen evolution and/or weight loss for the same material [9,19,34,99,106,109,110]. In general, B′ varies among different corrosion systems with different alloys, solutions, immersion times, and other factors that influence the corrosion kinetics [111].
Finally, the resistance obtained from EIS data, which is more intimately correlated with the corrosion rate, has been considerably debated in the literature. Some authors propose that the corrosion rate is mainly determined by the Rt value obtained from the diameter of the HF capacitive arc [100,101] or the MF capacitive arc, while others suggest that it is mainly related to resistance polarization (Rp), defined as (i) the sum of the diameters of both capacitive arcs [76,112], (ii) as the value of the real part of impedance at the lowest frequency [29], or (iii) as an extrapolation of the inductive tail to the real axis of impedance diagrams at zero frequency [9,91,92].

5. Comparison of Mg Corrosion Rates Calculated Using EIS and Non-Electrochemical Methods

Over the last three decades, some researchers have attempted to establish possible relationships between the evolution of the values extracted from the fit of the impedance diagrams and the actual corrosion rate obtained by non-electrochemical methods over time as a tool for the interpretation of impedance diagrams and to understand the mechanism of Mg corrosion.

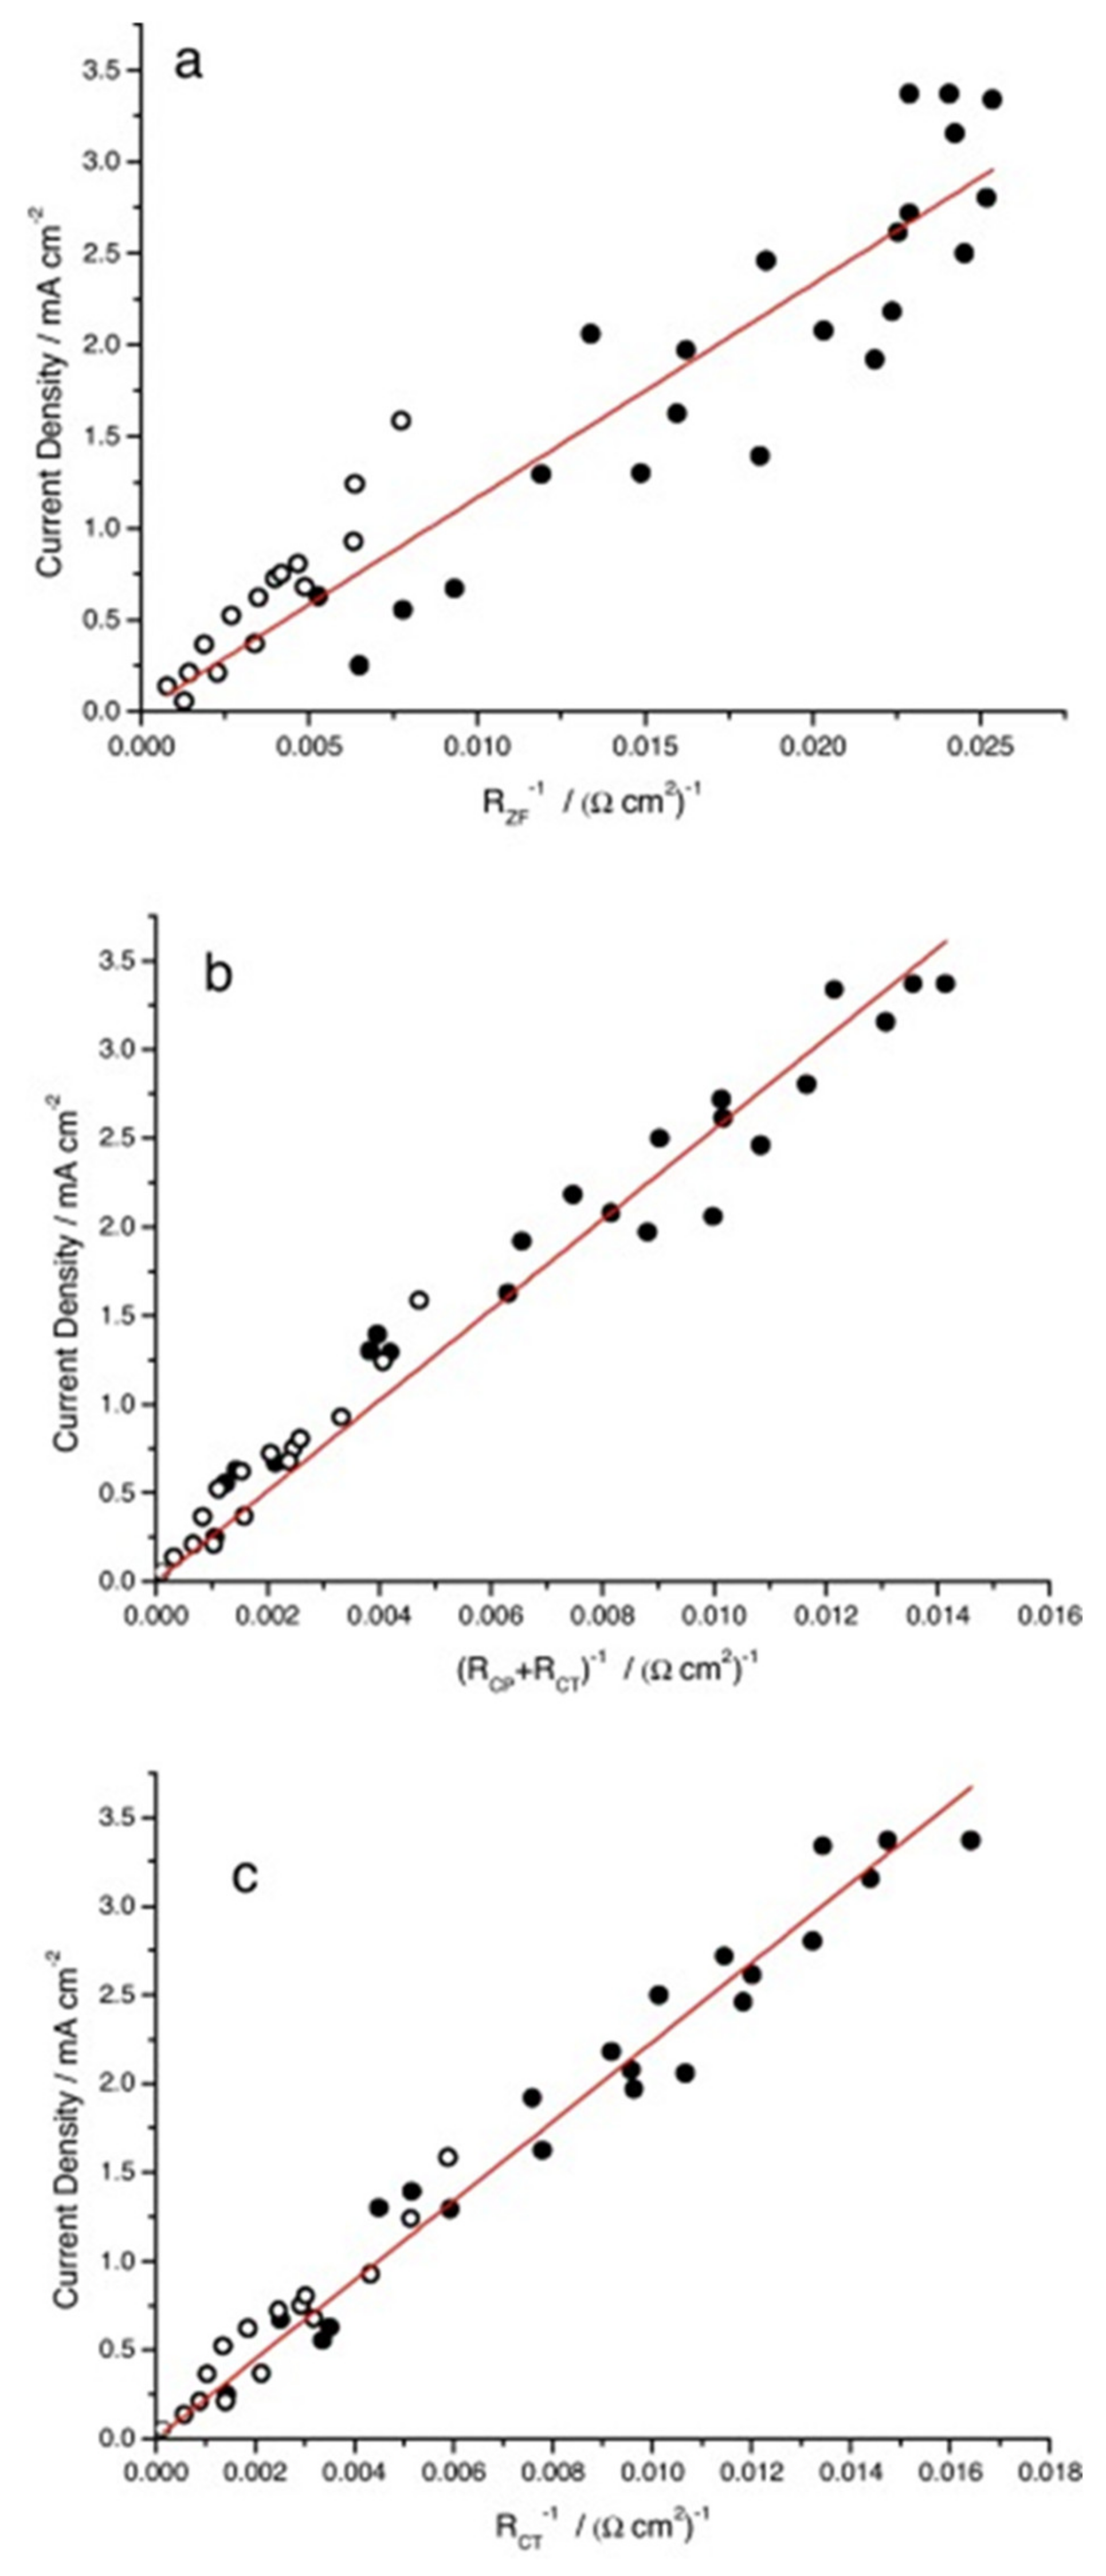
5.1. Use of the Charge Transfer Resistance, Rt, Determined from EIS Data for the Determination of the Magnesium Alloy Corrosion Rate

In 1990, Makar and Kruger [101] compared corrosion rates calculated by EIS with those obtained by weight loss for five binary rapidly solidified (RS) Mg alloys after several days of immersion in pH 9.2, 0.05 M sodium borate. The magnesium-based materials were pure Mg, commercial alloy AZ61, high-purity Mg–30Al, an Mg–A1–Zn–Y alloy, and an Mg–A1–Zn–Nd alloy. Nyquist plots for most of the Mg alloys were characterized by one capacitive semicircle at a high frequency followed by a more or less well-defined arc or tail at a lower frequency. The HF semicircle was attributed to the influence of charge transfer resistance. Using the Stern–Geary expression and assuming B approximately 0.017 V (βa approximately 60 mV and βc approximately 120 mV), these authors found that the corrosion rates calculated from the diameter of the high-frequency capacitive semicircle matched the weight loss data very well for a wide range of magnesium alloys (Table 1).
Additionally, in the early 1990s, Pébère et al. [100] investigated the electrochemical behavior of pure magnesium in a 0.5 M Na2S04 solution of pH 10 by measuring the electrochemical impedance. The impedance diagrams (Figure 7) showed two well-defined capacitive semi-circles followed by an inductive loop. The higher frequency capacitive loop resulted from both charge transfer resistance and oxide film capacitance. The lower frequency capacitive loop was attributed to mass transport relaxation (probably Mg+) in the corrosion products layer. The inductive loop may have resulted from relaxation processes of adsorbed species on the electrode surface, such as Mg(OH)ads + or Mg(OH)2. These authors obtained values of βa approximately 208 mV and βc approximately 280 mV (B = 0.052 V) from the polarization curves. Pébère et al. [100] found that the corrosion rates determined from the Stern and Geary relationship using the charge transfer resistance value (diameter of the high-frequency loop in the impedance diagram) were in good agreement with those obtained by direct measurement of the atomic absorption of magnesium in solution (Table 2).
In a recent study [94], a perfect agreement was obtained between the corrosion rates determined from atomic absorption measurements and those calculated from the electrochemical data, assuming an average Mg oxidation number of 1.5 (due to the existence of monovalent and divalent ions in the same proportions in the mechanisms of Mg corrosion) and using Faraday′s law.

5.2. Use of the Polarization Resistance, Rp, Determined from the EIS Data for Determination of the Corrosion Rate

Over the last decade, several studies have been performed by Atrens and coworkers [6,28,29,87,88] to explore EIS measurements of the corrosion rate for Mg alloys. In general, these studies have used the polarization resistance, Rp, defined as the real part of the impedance at the lowest frequency, in the Stern–Geary equation. The corrosion rates evaluated by EIS were consistently lower than those produced using the hydrogen evolution and weight loss methods. The authors [6,28,29,87,88] suggested that the underestimation of the corrosion rate by EIS is linked to a mechanism of Mg corrosion involving the uni-positive Mg+ ion, in which part of the reaction is chemical rather than electrochemical. This experimental evidence tends to suggest that EIS data do not provide accurate measurements of the corrosion rate [6,28,29,87,88] (Figure 8).
Recently, Scully and coworkers [9,91,92] studied possible correlations between the “real” corrosion rate (determined from gravimetric mass loss, H2 collection, or chemical analysis techniques) and impedance measurements for commercially pure Mg and a broad range of Mg–Al alloys. Two capacitive loops and an inductive loop were observed in the Nyquist plots of Mg/Mg alloys in various chloride-containing environments, similar to the diagram reported earlier for Mg in sulfate [100]. The impedance spectra were fitted with the equivalent circuit shown earlier in Figure 6f. Scully and coworkers showed the corrosion rate calculated from EIS data using the polarization resistance, Rp, determined as the frequency approached zero by the extrapolation of the impedance data (Figure 9). Their results revealed an excellent correlation with non-electrochemical evaluations of the corrosion rates (Figure 10). These authors [9] critically addressed previous studies that used the charge transfer resistance, Rt, measured at an intermediate frequency, neglecting the inductive behavior, stating that they may have underestimated the magnesium corrosion rate; in most cases by a factor of two or more.

5.3. Use of Apparent Stern–Geary Coefficients (B′)

As mentioned above (Section 4), because the polarization curves for pure Mg/Mg alloy often do not exhibit linear Tafel regions, especially in the anodic branch, the determination of Tafel slopes is not accurate [1]. For this reason, some investigations have recently been conducted with the aim of estimating the B constant from the correlation between EIS and non-electrochemical evaluations of the corrosion rates [19,34,109,110].
In our previous study of AZ31 and AZ61 alloys’ corrosion, empirical determination of B′ from the correlation between EIS-estimated Rt values and gravimetric measurements yielded values of approximately 65 mV for the AZ31 specimen and 120 mV for the AZ61 specimens [110]. In more recent studies, we obtained a good agreement between the corrosion rates measured by weight loss and hydrogen collection and those calculated from EIS measurements (Figure 11) assuming these B′ values [16,97,113,114]. Overall, we observed that B′ is specific to the system studied and can vary substantially depending on the composition of the alloy and the corrosive medium [17,99,109].
As commented earlier, King et al. [9] measured the corrosion current by mass loss and hydrogen collection methods and estimated Rp values from EIS data for high-purity magnesium in NaCl 0.6 M, obtaining an “apparent” Stern–Geary coefficient (B′) of 36 mV. This work was continued by Bland et al. [91,92] for several Mg–Al alloys (AZ31, AM50, AM60, and AZ91) in 0.6 M NaCl, who presented a B′ value of 36 mV, similar to that previously reported by King et al. [9].
Finally, Curioni and coworkers [19,55] observed a linear relationship between the corrosion current measured by hydrogen collection and/or weight loss and the reciprocal of the Rt value estimated by EIS in NaCl solutions for pure Mg/Mg alloys (Figure 12) The experimentally measured proportionality constant provided a B′ value of 253 mV for Mg in NaCl solutions and 85 mV for Mg-1Ca in simulated body fluid (SBF) [19,55].

6. Conclusions

A brief review of the EIS technique was given, which can provide kinetics in the form of corrosion rates and mechanistic information of Mg corrosion processes. The basics of EIS measurements, their advantages and disadvantages, and the typical spectra and equivalent circuits used for interpretation of EIS data of Mg were described and discussed. Electrochemical evaluation of the corrosion rate is considered a key requirement to evaluate the corrosion performance of new Mg-based materials. The EIS technique has been demonstrated to be a powerful tool for continuous quantitative assessments of the corrosion rate of Mg/Mg alloys in real time due to its “non-destructive” nature and its ability to detect minute variations in the corrosion rate, which are significantly smaller than in other non-electrochemical methods, such as weight loss or hydrogen evolution. Furthermore, EIS provides qualitative information on the mechanism of Mg corrosion. However, the use of this technique for the quantitative measurement of the corrosion rate of Mg/Mg alloys, which have more complex electrochemical behavior than most other metals, presents limitations and complications when trying to interpret the multiple capacitive and inductive loops drawn on the impedance diagrams and the evolution of the electrochemical parameters that are deduced from them as a function of time. Though much insight has been now gained on the application of EIS to assess the corrosion rate of Mg alloys, some controversies regarding the use of the Stern–Geary relationship have not been settled beyond doubt. It is expected that the next decade will shed more light on the capabilities of EIS for addressing Mg/Mg alloys’ corrosion phenomena. Comparative studies using surface, optical, and/or physical chemical analysis and EIS data need to be carried out in order to interpret the impedance diagrams obtained in this complex electrochemical system correctly. As has been shown in this review, a good agreement has been observed between “electrochemical” and “non-electrochemical” methods for measuring the corrosion rate of Mg alloys. The use of “apparent” Stern–Geary coefficients is an interesting approach to circumvent the problem of accurate determination of Tafel slopes of Mg/Mg alloys, but the quantity of the results published using this approach is still small, and diverse to make this a real alternative.

Funding

This research was funded by the Spanish Ministry of Economy and Competitiveness (project MAT2015-65445-C2-1-R).

Conflicts of Interest

The author declares no conflict of interest.

References

  1. Esmaily, M.; Svensson, J.E.; Fajardo, S.; Birbilis, N.; Frankel, G.S.; Virtanen, S.; Arrabal, R.; Thomas, S.; Johansson, L.G. Fundamentals and advances in magnesium alloy corrosion. Prog. Mater. Sci. 2017, 89, 92–193. [Google Scholar] [CrossRef]
  2. Atrens, A.; Song, G.L.; Liu, M.; Shi, Z.; Cao, F.; Dargusch, M.S. Review of recent developments in the field of magnesium corrosion. Adv. Eng. Mater. 2015, 17, 400–453. [Google Scholar] [CrossRef]
  3. Zhang, X.B.; Dai, J.W.; Zhang, R.F.; Ba, Z.X.; Birbilis, N. Corrosion behavior of Mg-3Gd-1Zn-0.4Zr alloy with and without stacking faults. J. Magnes. Alloys 2019, 7, 240–248. [Google Scholar] [CrossRef]
  4. Sanchez, A.H.M.; Luthringer, B.J.; Feyerabend, F.; Willumeit, R. Mg and mg alloys: How comparable are in vitro and in vivo corrosion rates? A review. Acta Biomater. 2015, 13, 16–31. [Google Scholar] [CrossRef] [PubMed] [Green Version]
  5. Kirkland, N.T.; Birbilis, N.; Staiger, M.P. Assessing the corrosion of biodegradable magnesium implants: A critical review of current methodologies and their limitations. Acta Biomater. 2012, 8, 925–936. [Google Scholar] [CrossRef]
  6. Cao, F.; Shi, Z.; Song, G.L.; Liu, M.; Dargusch, M.S.; Atrens, A. Influence of casting porosity on the corrosion behaviour of Mg0.1Si. Corros. Sci. 2014, 88, 255–269. [Google Scholar] [CrossRef]
  7. Song, G. Recent Progress in Corrosion and Protection of Magnesium Alloys. Adv. Eng. Mater. 2005, 7, 563–586. [Google Scholar] [CrossRef]
  8. Lorenz, W.J.; Mansfeld, F. Determination of corrosion rates by electrochemical DC and AC methods. Corros. Sci. 1981, 21, 647–672. [Google Scholar] [CrossRef]
  9. King, A.D.; Birbilis, N.; Scully, J.R. Accurate electrochemical measurement of magnesium corrosion rates: A combined impedance, mass-loss and hydrogen collection study. Electrochem. Acta 2014, 121, 394–406. [Google Scholar] [CrossRef]
  10. Shi, Z.; Liu, M.; Atrens, A. Measurement of the corrosion rate of magnesium alloys using Tafel extrapolation. Corros. Sci. 2010, 52, 579–588. [Google Scholar] [CrossRef]
  11. Abott, T.B. Magnesium: Industrial and research developments over the last 15 years. Corrosion 2015, 71, 120–127. [Google Scholar] [CrossRef]
  12. Dinodi, N.; Nityananda, S. Alkyl carboxylates as efficient and green inhibitors of magnesium alloy ZE41 corrosion in aqueous salt solution. Corros. Sci. 2014, 85, 411–427. [Google Scholar] [CrossRef]
  13. Bland, L.G.; Gusieva, K.; Scully, J.R. Effect of crystallographic orientation on the corrosion of magnesium: Comparison of film forming and bare crystal facets using electrochemical impedance and Raman spectroscopy. Electrochim. Acta 2017, 227, 136–151. [Google Scholar] [CrossRef] [Green Version]
  14. Jemimah, W.; Shaylin, S.; Woodfield, T.B.F.; Staiger, M.P.; Dias, G.J. Magnesium biomaterials for orthopedic application: A review from a biological perspective. J. Biomed. Mater. Res. Part. B Appl. Biomater. 2014, 102, 1316–1331. [Google Scholar]
  15. Samaniego, A.; Llorente, I.; Feliu, S., Jr. Combined effect of composition and surface condition on corrosion behavior of magnesium alloys AZ31 and AZ61. Corros. Sci. 2013, 68, 66–71. [Google Scholar] [CrossRef] [Green Version]
  16. Feliu, S.; Llorente, I. Corrosion product layers on magnesium alloys AZ31 and AZ61: Surface chemistry and protective ability. Appl. Surf. Sci. 2015, 347, 736–746. [Google Scholar] [CrossRef]
  17. Delgado, M.C.; Garcia-Galvan, F.R.; Llorente, I.; Perez, P.; Adeva, P.; Feliu, S., Jr. Influence of aluminum enrichment in the near-surface region of commercial twin-roll cast AZ31 alloys on their corrosion behavior. Corros. Sci. 2017, 123, 182–196. [Google Scholar] [CrossRef]
  18. Fajardo, S.; Garcia-Galvan, F.R.; Barranco, V.; Galvan, J.C.; Feliu, S., Jr. A critical review of the application of electrochemical techniques for studying corrosion of Mg and Mg-alloys; opportunities and challenges. In Magnesium Alloys—Selected Issue; Tański, T., Borek, W., Król, M., Eds.; Intech: Rijeka, Croatia, 2018; pp. 694–738. [Google Scholar]
  19. Curioni, M.; Scenini, F.; Monetta, T.; Bellucci, F. Correlation between electrochemical impedance measurements and corrosion rate of magnesium investigated by real-time hydrogen measurement and optical imaging. Electrochim. Acta 2015, 166, 372–384. [Google Scholar] [CrossRef]
  20. Haldhar, R.; Prasad, D.; Saxena, A.; Kumar, R. Experimental and theoretical studies of Ficus religiosa as green corrosion inhibitor for mild steel in 0.5 M H2SO4 solution. Sustain. Chem. Pharm. 2018, 9, 95–105. [Google Scholar]
  21. Xu, L.; Zhang, E.; Yin, D.; Zeng, S.; Yang, K. In vitro corrosion behaviour of Mg alloys in a phosphate buffered solution for bone implant application. J. Mater. Sci. 2007, 19, 1017–1025. [Google Scholar] [CrossRef]
  22. Barranco, V.; Feliu, S., Jr.; Feliu, S. EIS study of the corrosion behaviour of zinc-based coatings on steel in quiescent 3% NaCl solution. Part 1: Directly exposed coatings. Corros. Sci. 2004, 46, 2203–2220. [Google Scholar] [CrossRef]
  23. Cao, F.; Song, G.-L.; Atrens, A. Corrosion and passivation of magnesium alloys. Corros. Sci. 2016, 111, 835–845. [Google Scholar] [CrossRef] [Green Version]
  24. Jamali, S.S.; Moulton, S.E.; Tallman, D.E.; Forsyth, M.; Wallace, G.G. Evaluating the corrosion behaviour of Magnesium alloy in simulated biological fluid by using SECM to detect hydrogen evolution. Electrochim. Acta 2015, 152, 294–301. [Google Scholar] [CrossRef]
  25. Ismail, A.; Irshad, H.M.; Zeino, A.; Toor, I.H. Electrochemical corrosion performance of aromatic functionalized imidazole inhibitor under hydrodynamic conditions on API X65 carbon steel in 1 M HCl solution. Arab. J. Sci. Eng. 2019, 44, 5877–5888. [Google Scholar] [CrossRef]
  26. Song, G.L.; Atrens, A. Corrosion mechanisms of magnesium alloys. Adv. Eng. Mater. 1999, 1, 11–33. [Google Scholar] [CrossRef]
  27. Song, G.; Atrens, A. Understanding magnesium corrosion—A framework for improved alloy performance. Adv. Eng. Mater. 2003, 5, 837–858. [Google Scholar] [CrossRef]
  28. Cao, F.; Shi, Z.; Hofstetter, J.; Uggowitzed, P.J.; Song, G.; Liu, M.; Atrens, A. Corrosion of ultra-high-purity Mg in 3.5% NaCl solution saturated with Mg(OH)2. Corros. Sci. 2013, 75, 78–99. [Google Scholar] [CrossRef]
  29. Liu, M.; Schmutz, P.; Uggowitzer, P.J.; Song, G.; Atrens, A. The influence of yttrium (Y) on the corrosion of Mg-Y binary alloys. Corros. Sci. 2010, 52, 3687–3701. [Google Scholar] [CrossRef]
  30. Zhou, M.; Liu, C.; Xu, S.; Gao, Y.; Jiang, S. Accelerated degradation rate of AZ31 magnesium alloy by copper additions. Mater. Corros. 2018, 69, 760–769. [Google Scholar] [CrossRef]
  31. Choi, H.Y.; Kim, W.J. The improvement of corrosion resistance of AZ91 magnesium alloy through development of dense and tight network structure of Al-rich α phase by addition of a trace amount of Ti. J. Alloys Compd. 2017, 696, 736–745. [Google Scholar] [CrossRef]
  32. Peng, H.; Zhang, L.; Soeller, C.; Travas-Sejdic, J. Conducting polymers for electrochemical DNA sensing. Biomaterials 2009, 30, 2132–2148. [Google Scholar] [CrossRef]
  33. Aparicio, M.; Mosa, J. Electrochemical characterization of sol–gel coatings for corrosion protection of metal substrates. J. Sol.-Gel. Sci. Technol. 2018, 88, 77–89. [Google Scholar] [CrossRef]
  34. Gonzalez-Garcia, Y.; Garcia, S.J.; Mol, J.M.C. Electrochemical techniques for the study of self healing coatings. In Active Protective Coatings: New-Generation Coatings for Metals; Hughes, E.A., Mol, M.C.J., Zheludkevich, L.M., Buchheit, G.R., Eds.; Springer: Dordrecht, The Netherlands, 2016; pp. 203–240. [Google Scholar]
  35. Jia, R.; Unsal, T.; Xu, D.K.; Lekbach, Y.; Gu, T.Y. Microbiologically influenced corrosion and current mitigation strategies: A state of the art review. Int. Biodeterior. Biodegrad. 2018, 125, 116–124. [Google Scholar] [CrossRef]
  36. Cano, E.; Lafuente, D.; Bastidas, D.M. Use of EIS for the evaluation of the protective properties of coatings for metallic cultural heritage: A review. J. Solid State Electrochem. 2010, 14, 381–391. [Google Scholar] [CrossRef] [Green Version]
  37. Orazem, M.E.; Tribollet, B. Electrochemical Impedance Spectroscopy; John Wiley & Sons: Hoboken, NJ, USA, 2008. [Google Scholar]
  38. Durán, A.; Castro, Y.; Conde, A.; de Damborenea, J.J. Sol–gel protective coatings for metals. In Handbook of Sol.-Gel Science and Technology; Klein, L., Aparicio, M., Jitianu, A., Eds.; Springer International Publishing: Cham, Switzerland, 2016; pp. 1–65. [Google Scholar]
  39. Walczak, M.; Pineda, F.; Fernández, Á.G.; Mata-Torres, C.; Escobar, R.A. Materials corrosion for thermal energy storage systems in concentrated solar power plants. Renew. Sustain. Energy Rev. 2018, 86, 22–44. [Google Scholar] [CrossRef]
  40. Cesiulis, H.; Tsyntsaru, N.; Ramanavicius, A.; Ragoisha, G. The study of thin films by electrochemical impedance spectroscopy. In Nanostructures and Thin Films for Multifunctional Applications; Tiginyanu, I., Topala, P., Ursaki, V., Eds.; Springer International Publishing: Cham, Switzerland, 2016; pp. 3–42. [Google Scholar]
  41. Amirudin, A.; Thierry, D. Application of electrochemical impedance spectroscopy to study the degradation of polymer-coated metals. Prog. Org. Coat. 1995, 26, 1–28. [Google Scholar] [CrossRef]
  42. Kirkland, N.T.; Birbilis, N. Magnesium Biomaterials: Design, Testing, and Best Practice; Springer: New York, NY, USA, 2014; pp. 40–43. [Google Scholar]
  43. Jamesh, M.; Kumar, S.; Narayanan, T.S.N.S. Corrosion behavior of commercially pure Mg and ZM21 Mg alloy in Ringer’s solution-Long term evaluation by EIS. Corros. Sci. 2011, 53, 645–654. [Google Scholar] [CrossRef]
  44. De Siquiera, R.; Brasil, S.L.D.C.; de Carvalho, L.J.; Limaverde, A.M.; Pereira, C. Assessment of the antifouling effect of exopolysaccharides incorporated into copper oxide-based organic paint. Int. J. Electrochem. Sci. 2016, 11, 7750–7763. [Google Scholar] [CrossRef]
  45. Berradja, A. Electrochemical techniques for corrosion and tribocorrosion monitoring: Methods for the assessment of corrosion rates. In Corrosion Inhibitors; Singh, A., Ed.; Intech: Rijeka, Croatia, 2019; pp. 1–27. [Google Scholar]
  46. Moreto, J.A.; Marino, C.E.B.; Filho, W.W.B.; Rocha, L.A.; Fernandes, J.C.S. SVET, SKP and EIS study of the corrosion behaviour of high strength Al and Al-Li alloys used in aircraft fabrication. Corros. Sci. 2014, 84, 30–41. [Google Scholar] [CrossRef]
  47. Song, D.; Ma, A.B.; Jiang, J.H.; Lin, P.H.; Yang, D.H.; Fan, J.F. Corrosion behaviour of bulk ultra-fine grained AZ91D magnesium alloy fabricated by equal-channel angular pressing. Corros. Sci. 2011, 53, 362–373. [Google Scholar] [CrossRef]
  48. Feliu, S.; Maffiotte, C.; Galván, J.C.; Barranco, V. Atmospheric corrosion of magnesium alloys AZ31 and AZ61 under continuous condensation conditions. Corros. Sci. 2011, 53, 1865–1872. [Google Scholar] [CrossRef] [Green Version]
  49. Baril, G.; Galicia, G.; Deslouis, C.; Pébère, N.; Tribollet, B.; Vivier, V. An impedance investigation of the mechanism of pure magnesium corrosion in sodium sulfate solutions. J. Electrochem. Soc. 2007, 154, C108–C113. [Google Scholar] [CrossRef] [Green Version]
  50. Coy, A.E.; Viejo, F.; Garcia-Garcia, F.J.; Liu, Z.; Skeldon, P.; Thompson, G.E. Effect of excimer laser surface melting on the microstructure and corrosion performance of the die cast AZ91D magnesium alloy. Corros. Sci. 2010, 52, 387–397. [Google Scholar] [CrossRef]
  51. Pardo, A.; Merino, M.C.; Coy, A.E.; Viejo, F.; Arrabal, R.; Feliú, S. Influence of microstructure and composition on the corrosion behaviour of Mg/Al alloys in chloride media. Electrochim. Acta 2008, 53, 7890–7902. [Google Scholar] [CrossRef]
  52. Chang, J.W.; Fu, P.H.; Guo, X.W.; Peng, L.M.; Ding, W.J. The effects of heat treatment and zirconium on the corrosion behaviour of Mg–3Nd–0.2Zn–0.4Zr (wt.%) alloy. Corros. Sci. 2007, 49, 2612–2627. [Google Scholar] [CrossRef]
  53. Morończyk, B.; Ura-Bińczyk, E.; Kuroda, S.; Jaroszewicz, J.; Molak, R.M. Microstructure and corrosion resistance of warm sprayed titanium coatings with polymer sealing for corrosion protection of AZ91E magnesium alloy. Surf. Coat. Technol. 2019, 363, 142–151. [Google Scholar] [CrossRef]
  54. Fekry, A.M.; Fatayerji, M.Z. Electrochemical corrosion behavior of AZ91D alloy in ethylene glycol. Electrochim. Acta 2009, 54, 6522–6528. [Google Scholar] [CrossRef]
  55. Liu, Y.X.; Curioni, M.; Liu, Z. Correlation between electrochemical impedance measurements and corrosion rates of Mg-1Ca alloy in simulated body fluid. Electrochim. Acta 2018, 264, 101–108. [Google Scholar] [CrossRef]
  56. Gao, Y.; Yerokhin, A.; Matthews, A. DC plasma electrolytic oxidation of biodegradable cp-Mg: In-vitro corrosion studies. Surf. Coat. Technol. 2013, 234, 132–142. [Google Scholar] [CrossRef]
  57. Heakal, F.E.-T.; Fekry, A.; Jibril, M.A.E.-B. Electrochemical behaviour of the Mg alloy AZ91D in borate solutions. Corros. Sci. 2011, 53, 1174–1185. [Google Scholar] [CrossRef]
  58. Feliu, S., Jr.; Barajas, R.; Bastidas, J.M.; Morcillo, M.; Feliu, S. Study of protection mechanisms of zinc-rich paints by electrochemical impedance spectroscopy. In Electrochemical Impedance: Analysis and Interpretation; Scully, J.R., Silverman, D.C., Kendig, M.W., Eds.; ASTM: Philadelphia, PA, USA, 1993; pp. 438–449. [Google Scholar]
  59. Qu, Q.; Li, S.; Li, L.; Zuo, L.; Ran, X.; Qu, Y.; Zhu, B. Adsorption and corrosion behaviour of Trichoderma harzianum for AZ31B magnesium alloy in artificial seawater. Corros. Sci. 2017, 118, 12–23. [Google Scholar] [CrossRef]
  60. Zhao, J.; Xie, X.; Zhang, C. Effect of the graphene oxide additive on the corrosion resistance of the plasma electrolytic oxidation coating of the AZ31 magnesium alloy. Corros. Sci. 2017, 114, 146–155. [Google Scholar] [CrossRef]
  61. Qu, Q.; Wang, L.; Li, L.; He, Y.; Yang, M.; Ding, Z. Effect of the fungus, Aspergillus niger, on the corrosion behaviour of AZ31B magnesium alloy in artificial seawater. Corros. Sci. 2015, 98, 249–259. [Google Scholar] [CrossRef]
  62. Cui, L.-Y.; Gao, S.-D.; Li, P.-P.; Zeng, R.-C.; Zhang, F.; Li, S.-Q.; Han, E.-H. Corrosion resistance of a self-healing micro-arc oxidation/polymethyltrimethoxysilane composite coating on magnesium alloy AZ31. Corros. Sci. 2017, 118, 84–95. [Google Scholar] [CrossRef]
  63. Gnedenkov, S.V.; Sinebryukhov, S.L.; Mashtalyar, D.V.; Nadaraia, K.V.; Gnedenkov, A.S.; Bouznik, V.M. Composite fluoropolymer coatings on the MA8 magnesium alloy surface. Corros. Sci. 2016, 111, 175–185. [Google Scholar] [CrossRef]
  64. Sun, M.; Yerokhin, A.; Bychkova, M.Y.; Shtansky, D.V.; Levashov, E.A.; Matthews, A. Self-healing plasma electrolytic oxidation coatings doped with benzotriazole loaded halloysite nanotubes on AM50 magnesium alloy. Corros. Sci. 2016, 111, 753–769. [Google Scholar] [CrossRef]
  65. Brett, C.M.A.; Dias, L.; Trindade, B.; Fischer, R.; Mies, S. Characterisation by EIS of ternary Mg alloys synthesised by mechanical alloying. Electrochim. Acta 2006, 51, 1752–1760. [Google Scholar] [CrossRef] [Green Version]
  66. Chang, J.W.; Guo, X.W.; Fu, P.H.; Peng, L.M.; Ding, W.J. Effect of heat treatment on corrosion and electrochemical behaviour of Mg-3Nd-0.2Zn-0.4Zr (wt. %) alloy. Electrochim. Acta 2007, 52, 3160–3167. [Google Scholar] [CrossRef]
  67. Anik, M.; Celikten, G. Analysis of the electrochemical reaction behavior of alloy AZ91 by EIS technique in H3PO4/KOH buffered K2SO4 solutions. Corros. Sci. 2007, 49, 1878–1894. [Google Scholar] [CrossRef]
  68. Arrabal, R.; Pardo, A.; Merino, M.C.; Mohedano, M.; Casajús, P.; Paucar, K.; Garcés, G. Effect of Nd on the corrosion behaviour of AM50 and AZ91D magnesium alloys in 3.5 wt. % NaCl solution. Corros. Sci. 2012, 55, 301–312. [Google Scholar] [CrossRef] [Green Version]
  69. Baril, G.; Blanc, C.; Pébère, N. AC impedance spectroscopy in characterizing time-dependent corrosion of AZ91 and AM50 magnesium alloys—Characterization with respect to their microstructures. J. Electrochem. Soc. 2001, 148, B489–B496. [Google Scholar] [CrossRef]
  70. Man, C.; Dong, C.; Wang, L.; Kong, D.; Li, X. Long-term corrosion kinetics and mechanism of magnesium alloy AZ31 exposed to a dry tropical desert environment. Corros. Sci. 2020, 164, 108274. [Google Scholar] [CrossRef]
  71. Hou, R.Q.; Zhang, F.; Jiang, P.L.; Dong, S.G.; Lin, C.J. Corrosion inhibition of pre-formed mussel adhesive protein (Mefp-1) film to magnesium alloy. Corros. Sci. 2020, 164, 108309. [Google Scholar] [CrossRef]
  72. Pinto, R.; Ferreira, M.G.S.; Carmezim, M.J.; Montemor, M.F. The corrosion behaviour of rare-earth containing magnesium alloys in borate buffer solution. Electrochim. Acta 2011, 56, 1535–1545. [Google Scholar] [CrossRef]
  73. Galicia, G.; Pébère, N.; Tribollet, B.; Vivier, V. Local and global electrochemical impedances applied to the corrosion behaviour of an AZ91 magnesium alloy. Corros. Sci. 2009, 51, 1789–1794. [Google Scholar]
  74. Ardelean, H.; Frateur, I.; Zanna, S.; Atrens, A.; Marcus, P. Corrosion protection of AZ91 magnesium alloy by anodizing in niobium and zirconium-containing electrolytes. Corros. Sci. 2009, 51, 3030–3038. [Google Scholar] [CrossRef]
  75. Baril, G.; Pébère, N. The corrosion of pure magnesium in aerated and deaerated sodium sulphate solutions. Corros. Sci. 2001, 43, 471–484. [Google Scholar] [CrossRef]
  76. Liao, J.; Hotta, M. Corrosion products of field-exposed Mg-Al series magnesium alloys. Corros. Sci. 2016, 112, 276–288. [Google Scholar] [CrossRef]
  77. Li, J.; Jiang, Q.; Sun, H.; Li, Y. Effect of heat treatment on corrosion behavior of AZ63 magnesium alloy in 3.5 wt % sodium chloride solution. Corros. Sci. 2016, 111, 288–301. [Google Scholar] [CrossRef] [Green Version]
  78. Jian, S.Y.; Chu, Y.R.; Lin, C.S. Permanganate conversion coating on AZ31 magnesium alloys with enhanced corrosion resistance. Corros. Sci. 2015, 93, 301–309. [Google Scholar] [CrossRef]
  79. Srinivasan, A.; Ranjani, P.; Rajendran, N. Electrochemical polymerization of pyrrole over AZ31 Mg alloy for biomedical applications. Electrochim. Acta 2013, 88, 310–321. [Google Scholar] [CrossRef]
  80. Wang, N.; Wang, R.; Peng, C.; Peng, B.; Feng, Y.; Hu, C. Discharge behaviour of Mg-Al-Pb and Mg-Al-Pb-In alloys as anodes for Mg-air battery. Electrochim. Acta 2014, 149, 193–205. [Google Scholar] [CrossRef]
  81. Miao, H.; Huang, H.; Shi, Y.; Zhang, H.; Pei, J.; Yuan, G. Effects of solution treatment before extrusion on the microstructure, mechanical properties and corrosion of Mg–Zn–Gd alloy in vitro. Corros. Sci. 2017, 122, 90–99. [Google Scholar] [CrossRef]
  82. Song, G.L.; Shi, Z. Corrosion mechanism and evaluation of anodized magnesium alloys. Corros. Sci. 2014, 85, 126–140. [Google Scholar] [CrossRef] [Green Version]
  83. Pinto, R.; Ferreira, M.G.S.; Carmezim, M.J.; Montemor, M.F. Passive behavior of magnesium alloys (Mg–Zr) containing rare-earth elements in alkaline media. Electrochim. Acta 2010, 55, 2482–2489. [Google Scholar] [CrossRef]
  84. Zidoune, M.; Grosjean, M.H.; Roué, L.; Huot, J.; Schulz, R. Comparative study on the corrosion behavior of milled and unmilled magnesium by electrochemical impedance spectroscopy. Corros. Sci. 2004, 46, 3041–3055. [Google Scholar] [CrossRef]
  85. Hu, J.; Huang, D.; Zhang, G.; Song, G.L.; Guo, X. Research on the inhibition mechanism of tetraphenylporphyrin on AZ91D magnesium alloy. Corros. Sci. 2012, 63, 367–378. [Google Scholar] [CrossRef]
  86. Huang, D.; Hu, J.; Song, G.L.; Guo, X. Inhibition effect of inorganic and organic inhibitors on the corrosion of Mg–10Gd–3Y–0.5Zr alloy in an ethylene glycol solution at ambient and elevated temperatures. Electrochim. Acta 2011, 56, 10166–10178. [Google Scholar] [CrossRef]
  87. Shi, Z.; Cao, F.; Song, G.-L.; Liu, M.; Atrens, A. Corrosion behaviour in salt spray and in 3.5% NaCl solution saturated with Mg(OH)2 of as-cast and solution heat-treated binary Mg–RE alloys: RE = Ce, La, Nd, Y, Gd. Corros. Sci. 2013, 76, 98–118. [Google Scholar] [CrossRef]
  88. Cao, F.Y.; Shi, Z.M.; Song, G.L.; Liu, M.; Atrens, A. Corrosion behaviour in salt spray and in 3.5% NaCl solution saturated with Mg(OH)2 of as-cast and solution heat-treated binary Mg-X alloys: X = Mn, Sn, Ca, Zn, Al, Zr, Si, Sr. Corros. Sci. 2013, 76, 60–97. [Google Scholar] [CrossRef]
  89. Liu, W.J.; Cao, F.H.; Chen, A.N.; Chang, L.R.; Zhang, J.Q.; Cao, C.A. Corrosion behaviour of AM60 magnesium alloys containing Ce or La under thin electrolyte layers. Part 1: Microstructural characterization and electrochemical behaviour. Corros. Sci. 2010, 52, 627–638. [Google Scholar] [CrossRef]
  90. Jamesh, M.I.; Wu, G.S.; Zhao, Y.; Chu, P.K. Effects of silicon plasma ion implantation on electrochemical corrosion behavior of biodegradable Mg–Y–RE Alloy. Corros. Sci. 2013, 69, 158–163. [Google Scholar] [CrossRef]
  91. Bland, L.G.; King, A.D.; Birbilis, N.; Scully, J.R. Assessing the corrosion of commercially pure magnesium and commercial AZ31B by electrochemical impedance, mass-loss, hydrogen collection and inductively coupled plasma optical emission spectrometry solution analysis. Corrosion 2015, 71, 128–145. [Google Scholar] [CrossRef]
  92. Bland, L.G.; Scully, L.C.; Scully, J.R. Assessing the corrosion of multi-phase Mg-Al alloys with high Al content by electrochemical impedance, mass loss, hydrogen collection and inductively coupled plasma optical emission spectrometry solution analysis. Corrosion 2017, 73, 526–543. [Google Scholar] [CrossRef]
  93. Nam, N.D.; Kim, W.C.; Kim, J.G.; Shin, K.S.; Jung, H.C. Effect of mischmetal on the corrosion properties of Mg–5Al alloy. Corros. Sci. 2009, 51, 2942–2949. [Google Scholar] [CrossRef]
  94. Leleu, S.; Rives, B.; Causse, N.; Pébère, N. Corrosion rate determination of rare-earth Mg alloys in a Na2SO4 solution by electrochemical measurements and inductive coupled plasma-optical emission spectroscopy. J. Magnes. Alloys 2019, 7, 47–57. [Google Scholar] [CrossRef]
  95. Ascencio, M.; Pekguleryuz, M.; Omanovic, S. An investigation of the corrosion mechanisms of WE43 Mg alloy in a modified simulated body fluid solution: The influence of immersion time. Corros. Sci. 2014, 87, 489–503. [Google Scholar] [CrossRef]
  96. Feliu, S., Jr.; Maffiotte, C.; Samaniego, A.; Galvan, J.C.; Barranco, V. Effect of naturally formed oxide films and other variables in the early stages of Mg-alloy corrosion in NaCl solution. Electrochim. Acta 2011, 56, 4454–4565. [Google Scholar] [CrossRef] [Green Version]
  97. Miao, J.; Ye, B.; Wang, Q.; Peng, T. Mechanical properties and corrosion resistance of Mg–10Gd–2Y–0.5Zr alloy by hot extrusion solid-state recycling. J. Alloys Compd. 2013, 561, 184–192. [Google Scholar] [CrossRef]
  98. Feliu, S., Jr.; Garcia-Galvan, F.R.; Llorente, I.; Diaz, L.; Simancas, J. Influence of hydrogen bubbles adhering to the exposed surface on the corrosion rate of magnesium alloys AZ31 and AZ61 in sodium chloride solution. Mater. Corros. 2017, 68, 651–663. [Google Scholar] [CrossRef]
  99. Delgado, M.C.; Garcia-Galvan, F.R.; Barranco, V.; Feliu, S., Jr. A measuring approach to assess the corrosion rate of magnesium alloys using electrochemical impedance measurements. In Magnesium Alloys; Aliofkhazraei, M., Ed.; Intech: Rijeka, Croatia, 2017; pp. 129–159. [Google Scholar]
  100. Pébère, N.; Riera, C.; Dabosi, F. Investigation of magnesium corrosion in aerated sodium-sulfate solution by electrochemical impedance spectroscopy. Electrochim. Acta 1990, 35, 555–561. [Google Scholar] [CrossRef]
  101. Makar, G.L.; Kruger, J. Corrosion studies of rapidly solidified Magnesium alloys. J. Electrochem. Soc. 1990, 137, 414–421. [Google Scholar] [CrossRef]
  102. Wagner, C.; Traud, W.E. The analysis of corrosion procedures through the interaction of electrochemical partial procedures and on the potential difference of mixed electrodes. Z. ElektroChem. Angew. Phys. Chem. 1938, 44, 391–402. [Google Scholar]
  103. Stern, M.; Geary, A.L. Electrochemical polarization, No. 1 theoretical analysis of the shape of polarization curves. J. Electrochem. Soc. 1957, 104, 56–57. [Google Scholar] [CrossRef]
  104. Feliu, S., Jr.; Galván, J.C.; Pardo, A.; Merino, M.C. Estimation of the corrosion rate in circumstances of difficult implementation of the common methods for electrochemical measurements. In Applied Electrochemistry (Chemistry Research and Applications) 2009; Singh, V.G., Ed.; Nova Science Publishers: Hauppauge, NY, USA, 2009; pp. 387–403. [Google Scholar]
  105. Pardo, A.; Feliu, S., Jr.; Merino, M.C.; Arrabal, R.; Matykina, E. Electrochemical estimation of the corrosion rate of Magnesium/Aluminium alloys. Int. J. Corros. 2010, 2010, 953850. [Google Scholar] [CrossRef]
  106. Hsieh, M.K.; Dzombak, D.A.; Vidie, R.D. Bridging gravimetric and electrochemical approaches to determine the corrosion rate of metals and metal alloys in cooling systems: Bench scale evaluation method. Ind. Eng. Chem. Res. 2010, 49, 9117–9123. [Google Scholar] [CrossRef]
  107. Poursaee, A. Potentiostatic transient technique, a simple approach to estimate the corrosion current density and Stern–Geary constant of reinforcing steel in concrete. Cem. Concr. Res. 2010, 40, 1451–1458. [Google Scholar] [CrossRef]
  108. Fajardo, S.; Glover, C.F.; Williams, G.; Frankel, G.S. The source of anodic hydrogen evolution on ultra high purity magnesium. Electrochim. Acta 2016, 212, 510–521. [Google Scholar] [CrossRef] [Green Version]
  109. Veleva, L.; Fernandez-Olaya, M.G.; Feliu, S. Initial stages of AZ31B magnesium alloy degradation in ringer’s solution: Interpretation of EIS, mass loss, hydrogen evolution data and scanning electron microscopy observations. Metals 2018, 8, 933. [Google Scholar] [CrossRef] [Green Version]
  110. Feliu, S., Jr.; Maffiotte, C.; Samaniego, A.; Galván, J.C.; Barranco, V. Effect of the chemistry and structure of the native oxide surface film on the corrosion properties of commercial AZ31 and AZ61 alloys. Appl. Surf. Sci. 2011, 257, 8558–8568. [Google Scholar] [CrossRef] [Green Version]
  111. Liu, Y. Corrosion Behaviour of Biodegradable Mg-1Ca Alloy in Simulated Body Fluid. Ph.D. Thesis, The University of Manchester, Manchester, UK, March 2018. [Google Scholar]
  112. Pan, H.; Pang, K.; Cui, F.; Ge, F.; Cui, Z. Effect of alloyed Sr on the microstructure and corrosion behavior of biodegradable Mg-Zn-Mn alloy in Hanks’ solution. Corros. Sci. 2019, 157, 420–437. [Google Scholar] [CrossRef]
  113. Feliu, S.; Samaniego, A.; Barranco, V.; El-Hadad, A.A.; Llorente, I.; Serra, C.; Galván, J.C. A study on the relationships between corrosion properties and chemistry of thermally oxidised surface films formed on polished commercial magnesium alloys AZ31 and AZ61. Appl. Surf. Sci. 2014, 295, 219–230. [Google Scholar] [CrossRef] [Green Version]
  114. Feliu, S.; Samaniego, A.; Barranco, V.; El-Hadad, A.A.; Llorente, I.; Adeva, P. The effect of low temperature heat treatment on surface chemistry and corrosion resistance of commercial magnesium alloys AZ31 and AZ61 in 0.6 M NaCl solution. Corros. Sci. 2014, 80, 461–472. [Google Scholar] [CrossRef] [Green Version]
Figure 1. Variations in corrosion as a function of aluminium content in the near-surface region of AZ31 specimens and immersion time: (a) H2 evolution volume values and (b) corresponding corrosion rates, PH. Reprinted with permission from [17]; 2017, Elsevier.
Metals 10 00775 g001
Figure 2. Corrosion morphologies of the AZ31 alloy with (a) and without corrosion products (b) after immersion in phosphate buffered solution for 4 days.
Metals 10 00775 g002
Figure 3. Comparison of corrosion rates (mm y−1) obtained from electrochemical impedance spectroscopy (EIS) with hydrogen evolution and weight loss measurements after 4 days immersion in 0.6 M NaCl at 20 °C. Reprinted with permission from [17]; 2017, Elsevier.
Metals 10 00775 g003
Figure 4. Variation of polarization curves for AZ31l specimens in 0.6 M NaCl. Reprinted with permission from [17]; 2017, Elsevier.
Metals 10 00775 g004
Figure 5. Graphic representation of the current and voltage as a function of time.
Metals 10 00775 g005
Figure 6. Typical shapes of Nyquist and Bode plots and often used equivalent circuits to describe Mg corrosion processes.(a) Simple Randles equivalent circuit, (b) Randles equivalent circuit modified with a constant phase element, (c) Randles equivalent circuit modified with a semi-infinite Warburg diffusional impedance element, (d) Randles equivalent circuit modified with an inductor and a resistance, (e) equivalent circuit with two time constants (f) equivalent circuit with three time constants.
Metals 10 00775 g006
Figure 7. Electrochemical impedance diagrams for pure Mg after immersion in a 0.1 M Na2SO4 solution and recorded in galvanostatic mode after two different hold times at R= 1000 rpm: (a) 2.5 and (b) 20 h. Reprinted with permission from [100]; 1990, Elsevier.
Metals 10 00775 g007
Figure 8. Comparison of the corrosion rates evaluated from weight loss, hydrogen evolution, and the corrosion current density from cathodic polarization curves and EIS, during immersion testing at the open circuit potential (OCP) in 3.5% NaCl solution saturated with Mg(OH)2 for 7 days at 25 ± 2 °C for as-cast HP Mg and as-cast Mg–X alloys: Mg0.3Ca, Mg1Mn, Mg0.1Sr, Mg6Al, Mg5Sn, Mg0.3Si, Mg5Zn, and Mg0.1Zr [88]. Reprinted with permission from [88]; 2013, Elsevier.
Metals 10 00775 g008
Figure 9. EIS measurement (scatter plot) and model fit (solid lines) of high purity Mg after 24 hrs of immersion at open circuit in quiescent 0.1 M NaCl displaying low frequency inductance. Rt defined as the value corresponding to Z’ when –Z” = 0, whilst RP is defined as the zero frequency impedance at –Z” = 0. Reprinted with permission from [9]; 2014, Elsevier.
Metals 10 00775 g009
Figure 10. Anodic Mg charge consumed during 24 h full immersion in ambiently aerated, quiescent 0.1, 1.0, and 5.0 M NaCl solution at open circuit as estimated by gravimetric mass loss, H2 collection, and EIS-estimated RP. Reprinted with permission from [9]; 2014, Elsevier.
Metals 10 00775 g010
Figure 11. Comparison of corrosion rates (mm/y) obtained from EIS with weight loss and hydrogen evolution measurements for (a) AZ31 and (b) AZ61 alloys after 14 days immersion in 0.6 M NaCl. Reprinted with permission from [113]; 2014, Elsevier.
Metals 10 00775 g011
Figure 12. Corrosion current as a function of (a) the reciprocal of the zero-frequency resistance (RA in parallel with the series of RCP and RCT), (b) the reciprocal of the series of RCP and RCT and (c) the reciprocal of the series of RCT. The slope of the fitting line provides direct estimation of the ‘apparent’ Stern–Geary coefficients. Filled symbols are obtained from measurement 3.5% NaCl, empty symbols from measurement in 0.35% NaCl [19].
Metals 10 00775 g012
Table 1. Corrosion rate (mm/y), for Mg alloys exposed 4–8 days in pH 9.2 sodium borate measured using EIS, PEIS, and weight loss, PW.
AlloyPEISPWPW/PEIS
AZ613.32.70.81
Mg–30Al0.851.21.4
Mg–Al–Zn–Y3.03.11.0
Mg–Al–Zn–Nd3.42.40.71
Table 2. Corrosion currents (µA·cm−2), for Mg alloys exposed 15 h in 0.5 M Na2SO4 at two rotation speeds calculated from impedance, Icorr(imp), and atomic absorption, Icorr(abs), measurements.
Ω/rpmIcorr(imp)Icorr(abs)Icorr(abs)/Icorr(imp)
6003304001.2
24004608501.8

