
Between-Session Reliability of Strength- and Power-Related Variables Obtained during Isometric Leg Press and Countermovement Jump in Elite Female Ice Hockey Players

Abstract
:1. Introduction
2. Materials and Methods
2.1. Experimental Design
2.2. Participants
2.3. Test Protocols
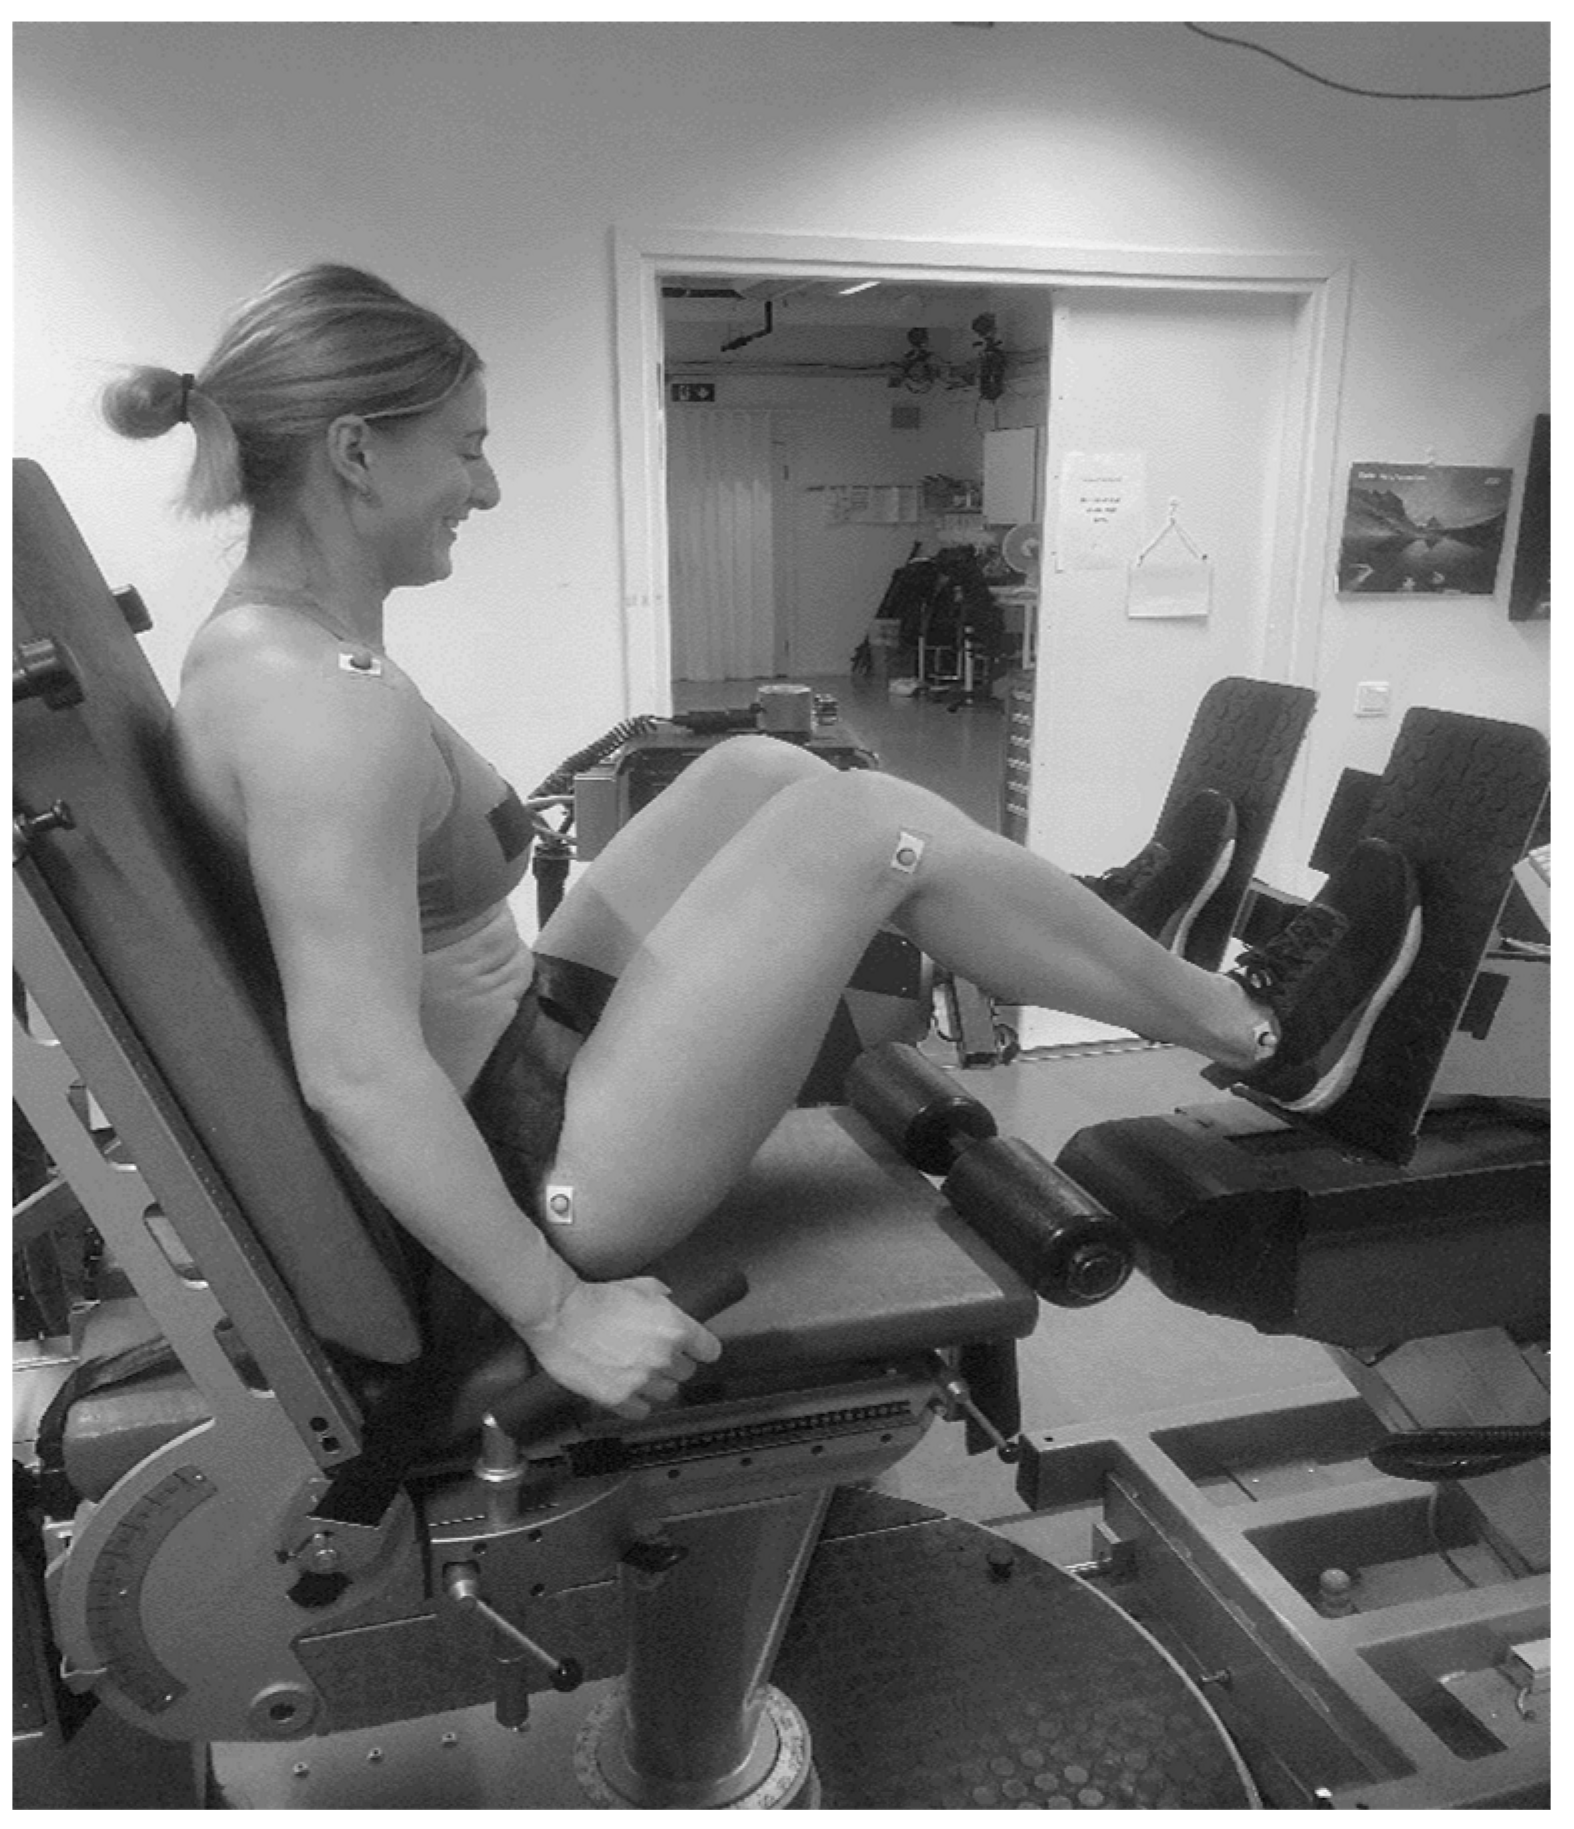
2.3.1. Isometric Leg Press
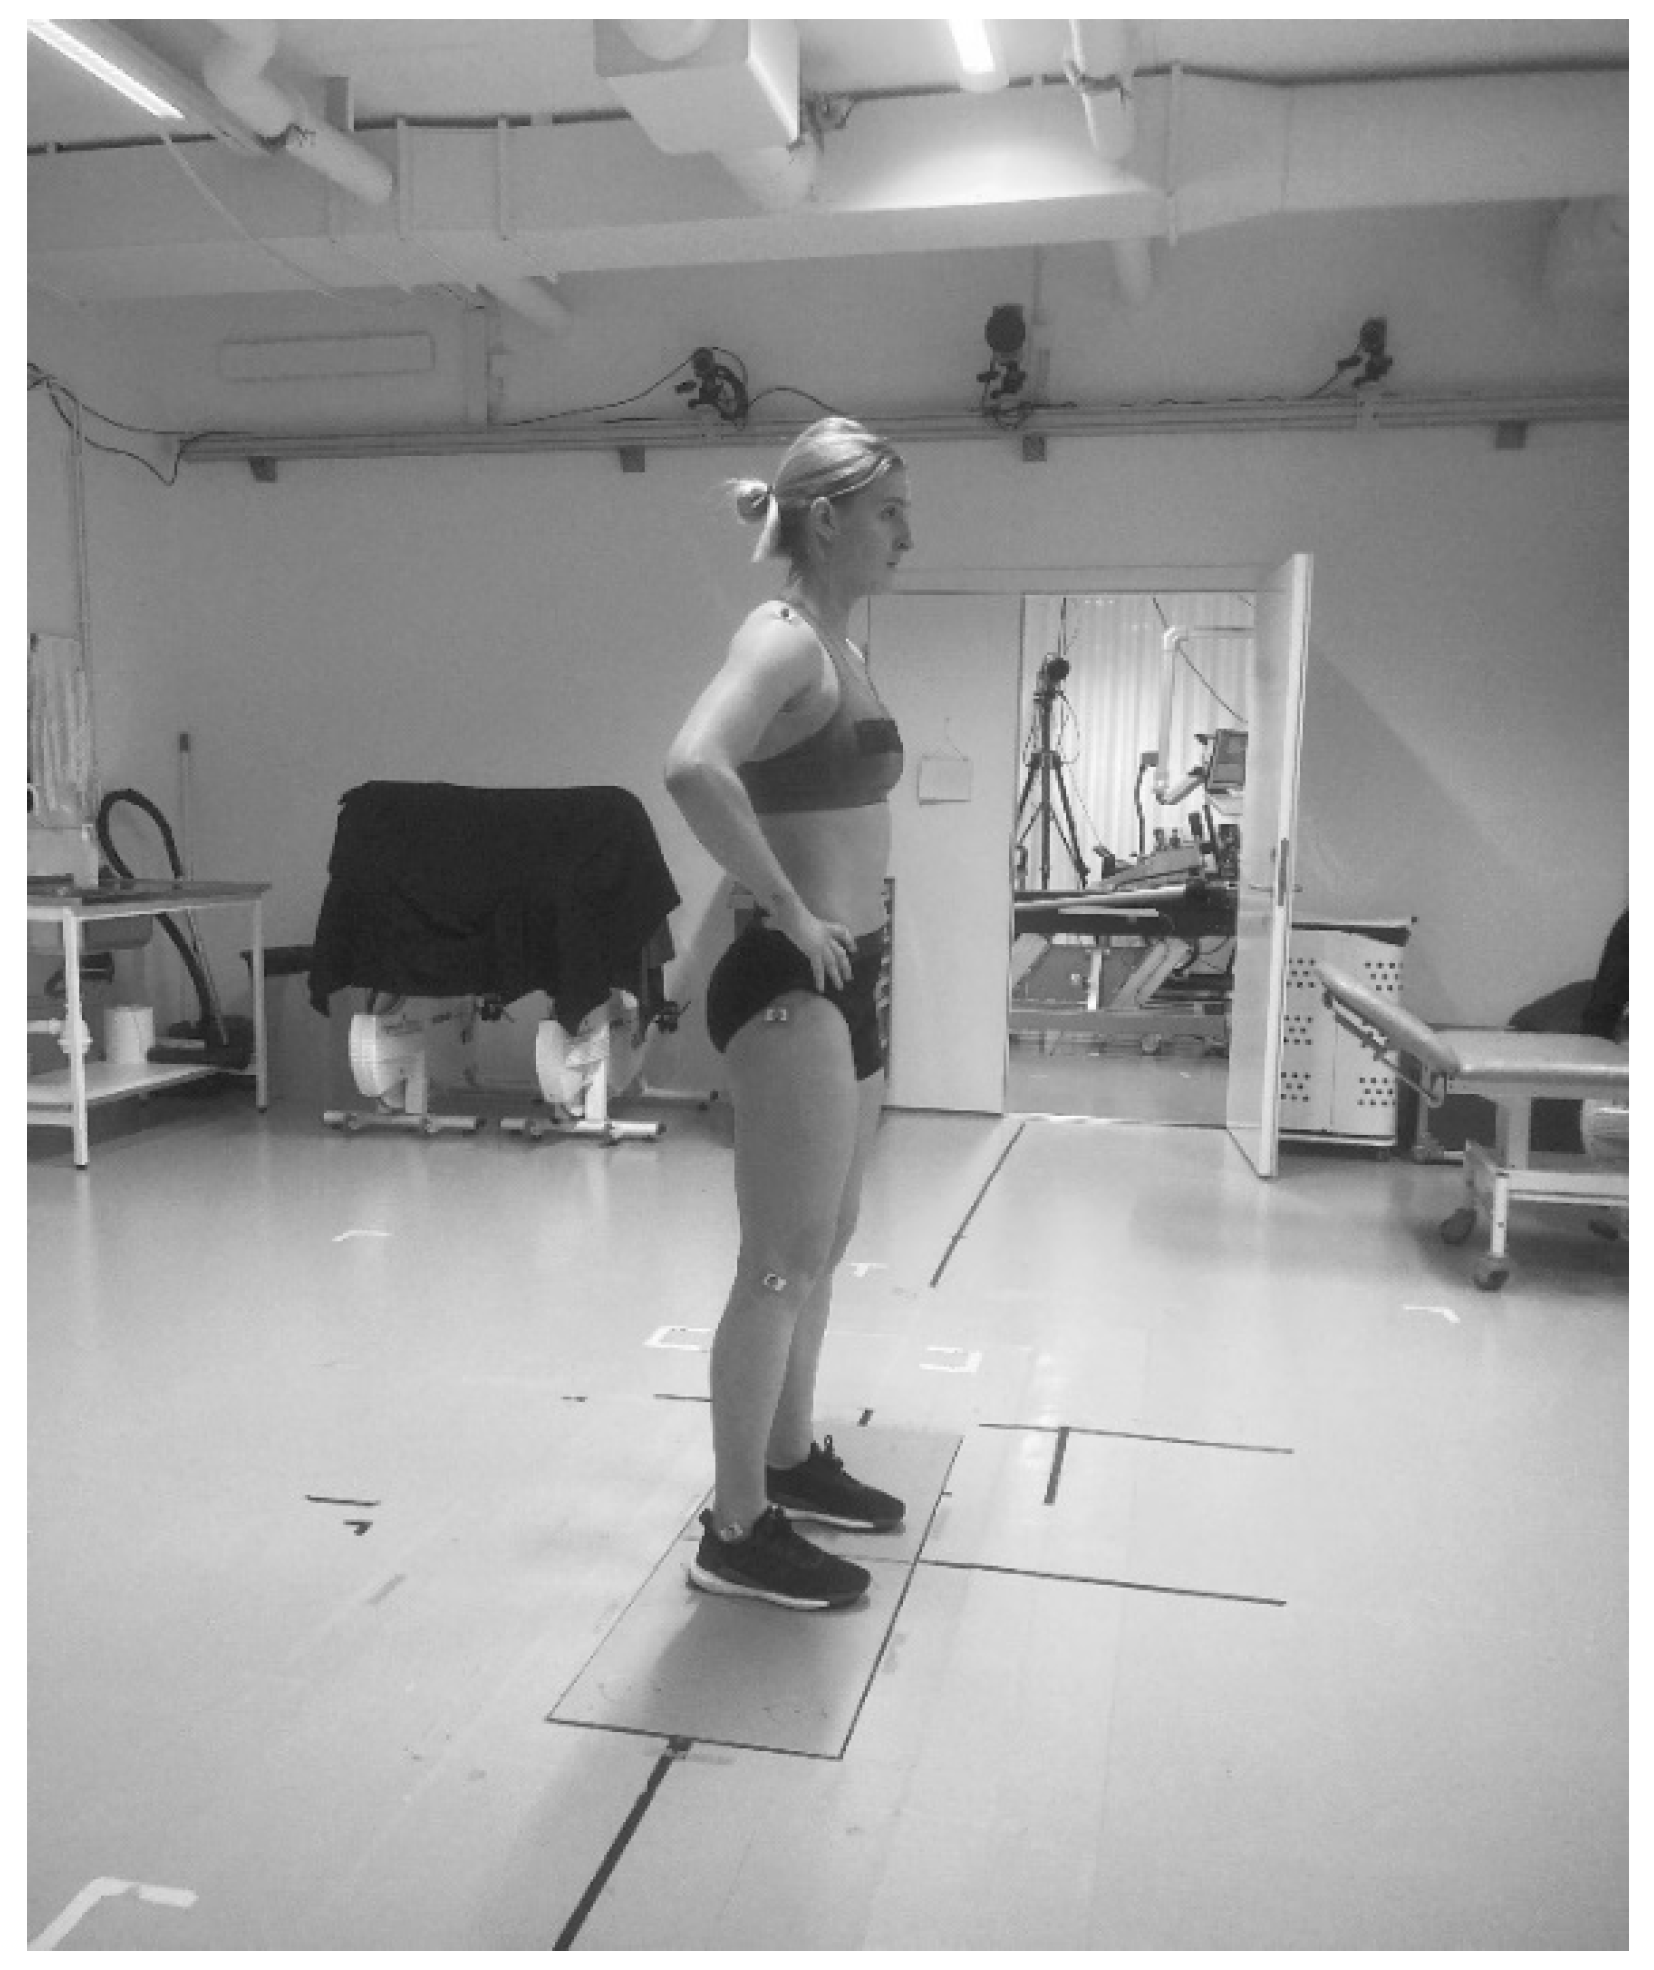
2.3.2. Countermovement Jump
2.4. Statistical Analyses
3. Results
4. Discussion
Practical Applications
5. Conclusions
Author Contributions
Funding
Institutional Review Board Statement
Informed Consent Statement
Data Availability Statement
Conflicts of Interest
References
- Newman, A.B.; Kupelian, V.; Visser, M.; Simonsick, E.M.; Goodpaster, B.H.; Kritchevsky, S.B.; Tylavsky, F.A.; Rubin, S.M.; Harris, T.B. Strength, but not muscle mass, is associated with mortality in the health, aging and body composition study cohort. J. Gerontol. A Biol. Sci. Med. Sci. 2006, 61, 72–77. [Google Scholar] [CrossRef] [Green Version]
- Casas-Herrero, A.; Cadore, E.L.; Zambom-Ferraresi, F.; Idoate, F.; Millor, N.; Martínez-Ramirez, A.; Gómez, M.; Rodriguez-Mañas, L.; Marcellán, T.; de Gordoa, A.R.; et al. Functional capacity, muscle fat infiltration, power output, and cognitive impairment in institutionalized frail oldest old. Rejuven. Res. 2013, 16, 396–403. [Google Scholar] [CrossRef] [PubMed]
- de la Motte, S.J.; Lisman, P.; Gribbin, T.C.; Murphy, K.; Deuster, P.A. Systematic Review of the Association Between Physical Fitness and Musculoskeletal Injury Risk: Part 3-Flexibility, Power, Speed, Balance, and Agility. J. Strength Cond. Res. 2019, 33, 1723–1735. [Google Scholar] [CrossRef] [PubMed]
- Suchomel, T.J.; Nimphius, S.; Stone, M.H. The Importance of Muscular Strength in Athletic Performance. Sport. Med. 2016, 46, 1419–1449. [Google Scholar] [CrossRef] [PubMed]
- Bishop, C.; Jordan, M.; Torres-Ronda, L.; Loturco, I.; Harry, J.; Virgile, A.; Mundy, P.; Turner, A.; Comfort, P. Selecting Metrics That Matter: Comparing the Use of the Countermovement Jump for Performance Profiling, Neuromuscular Fatigue Monitoring, and Injury Rehabilitation Testing. Publish Ahead of Print. Strength Cond. J. 2022, 10-1519. [Google Scholar] [CrossRef]
- Hopkins, W.G. Measures of reliability in sports medicine and science. Sport. Med. 2000, 30, 1402–1412. [Google Scholar] [CrossRef]
- Laffaye, G.; Wagner, P.P.; Tombleson, T.I. Countermovement jump height: Gender and sport-specific differences in the force-time variables. J. Strength Cond. Res. 2014, 28, 1096–1105. [Google Scholar] [CrossRef]
- Vigh-Larsen, J.F.; Mohr, M. The Physiology of Ice Hockey Performance: An Update. Scand. J. Med. Sci. Sport. 2022. [Google Scholar] [CrossRef]
- Ransdell, L.B.; Murray, T. A physical profile of elite female ice hockey players from the USA. J. Strength Cond. Res. 2011, 25, 2358–2363. [Google Scholar] [CrossRef]
- Boland, M.; Delude, K.; Miele, E.M. Relationship Between Physiological Off-Ice Testing, On-Ice Skating, and Game Performance in Division I Female Ice Hockey Players. J. Strength Cond. Res. 2019, 33, 1619–1628. [Google Scholar] [CrossRef]
- Gilenstam, K.M.; Thorsen, K.; Henriksson-Larsén, K.B. Physiological correlates of skating performance in women’s and men’s ice hockey. J. Strength Cond. Res. 2011, 25, 2133–2142. [Google Scholar] [CrossRef] [PubMed] [Green Version]
- Farlinger, C.M.; Kruisselbrink, L.D.; Fowles, J.R. Relationships to skating performance in competitive hockey players. J. Strength Cond. Res. 2007, 21, 915–922. [Google Scholar] [CrossRef] [PubMed] [Green Version]
- Runner, A.R.; Lehnhard, R.A.; Butterfield, S.A.; Tu, S.; O’Neill, T. Predictors of Speed Using Off-Ice Measures of College Hockey Players. J. Strength Cond. Res. 2016, 30, 1626–1632. [Google Scholar] [CrossRef] [PubMed]
- Delisle-Houde, P.; Chiarlitti, N.A.; Reid, R.E.R.; Andersen, R.E. Predicting On-Ice Skating Using Laboratory- and Field-Based Assessments in College Ice Hockey Players. Int. J. Sport. Physiol. Perform. 2019, 9, 1184–1189. [Google Scholar] [CrossRef] [PubMed]
- Gaspari, V.; Bogdanis, G.C.; Panidi, I.; Giannakopoulou, G.; Terzis, G.; Kotsala, H.; Donti, A.; Donti, O. Force-Time Characteristics of Dynamic and Isometric Muscle Actions: Association with Muscle Architecture in Female Athletes. Appl. Sci.-Basel 2021, 11, 5272. [Google Scholar] [CrossRef]
- Ioakimidis, P.; Gerodimos, V.; Kellis, E.; Kellis, S. Reliability of maximum isometric force-time parameters during a leg press test in pubertal basketball players. Pediatr. Exerc. Sci. 2002, 14, 193–201. [Google Scholar] [CrossRef]
- Thomas, C.; Dos’Santos, T.; Comfort, P.; Jones, P.A. Between-Session Reliability of Common Strength- and Power-Related Measures in Adolescent Athletes. Sports 2017, 5, 15. [Google Scholar] [CrossRef] [Green Version]
- Sheppard, J.M.; Cormack, S.; Taylor, K.L.; McGuigan, M.R.; Newton, R.U. Assessing the force-velocity characteristics of the leg extensors in well-trained athletes: The incremental load power profile. J. Strength Cond. Res. 2008, 22, 1320–1326. [Google Scholar] [CrossRef] [Green Version]
- Cormack, S.J.; Newton, R.U.; McGuigan, M.R.; Doyle, T.L. Reliability of measures obtained during single and repeated countermovement jumps. Int. J. Sport. Physiol. Perform. 2008, 3, 131–144. [Google Scholar] [CrossRef] [Green Version]
- Claudino, J.G.; Cronin, J.; Mezêncio, B.; McMaster, D.T.; McGuigan, M.; Tricoli, V.; Amadio, A.C.; Serrão, J.C. The countermovement jump to monitor neuromuscular status: A meta-analysis. J. Sci. Med. Sport. 2017, 20, 397–402. [Google Scholar] [CrossRef]
- Peltonen, H.; Mikkonen-Taipale, R.; Uimonen, T.; Walker, S.; Hackney, A.C.; Valtonen, M.; Kyröläinen, H.; Ihalainen, J.K. Power Loading-Induced Fatigue Is Influenced by Menstrual Cycle Phase. Med. Sci. Sport. Exerc. 2022, 54, 1190–1198. [Google Scholar] [CrossRef]
- Haff, G.G.; Ruben, R.P.; Lider, J.; Twine, C.; Cormie, P. A comparison of methods for determining the rate of force development during isometric midthigh clean pulls. J. Strength Cond. Res. 2015, 29, 386–395. [Google Scholar] [CrossRef]
- Aagaard, P.; Simonsen, E.B.; Andersen, J.L.; Magnusson, P.; Dyhre-Poulsen, P. Increased rate of force development and neural drive of human skeletal muscle following resistance training. J. Appl. Physiol. 2002, 93, 1318–1326. [Google Scholar] [CrossRef] [PubMed]
- Linthorne, N.P. Analysis of standing vertical jumps using a force platform. Am. Journal. Phys. 2001, 69, 1198–2004. [Google Scholar] [CrossRef] [Green Version]
- Sainani, K.L. Reliability Statistics. PM & R 2017, 9, 622–628. [Google Scholar] [CrossRef]
- Riemann, B.L.; Lininger, M.R. Statistical Primer for Athletic Trainers: The Essentials of Understanding Measures of Reliability and Minimal Important Change. J. Athl. Train. 2018, 53, 98–103. [Google Scholar] [CrossRef] [PubMed] [Green Version]
- Koo, T.K.; Li, M.Y. A Guideline of Selecting and Reporting Intraclass Correlation Coefficients for Reliability Research. J. Chiropr. Med. 2016, 15, 155–163. [Google Scholar] [CrossRef] [Green Version]
- Weir, J.P. Quantifying test-retest reliability using the intraclass correlation coefficient and the SEM. J. Strength Cond. Res. 2005, 19, 231–240. [Google Scholar] [CrossRef] [Green Version]
- Atkinson, G.; Nevill, A.M. Statistical methods for assessing measurement error (reliability) in variables relevant to sports medicine. Sport. Med. 1998, 26, 217–238. [Google Scholar] [CrossRef]
- Geithner, C.A.; Lee, A.M.; Bracko, M.R. Physical and performance differences among forwards, defensemen, and goalies in elite women’s ice hockey. J. Strength Cond. Res. 2006, 20, 500–505. [Google Scholar] [CrossRef]
- Lauber, B.; Keller, M.; Gollhofer, A.; Müller, E.; Taube, W. Spinal reflex plasticity in response to alpine skiing in the elderly. Scand. J. Med. Sci. Sport. 2011, 21 (Suppl. 1), 62–68. [Google Scholar] [CrossRef] [PubMed] [Green Version]
- Hahn, D.; Seiberl, W.; Schmidt, S.; Schweizer, K.; Schwirtz, A. Evidence of residual force enhancement for multi-joint leg extension. J. Biomech. 2010, 43, 1503–1508. [Google Scholar] [CrossRef] [PubMed]
- Müller, E.; Gimpl, M.; Kirchner, S.; Kröll, J.; Jahnel, R.; Niebauer, J.; Niederseer, D.; Scheiber, P. Salzburg Skiing for the Elderly Study: Influence of alpine skiing on aerobic capacity, strength, power, and balance. Scand. J. Med. Sci. Sport. 2011, 21 (Suppl. 1), 9–22. [Google Scholar] [CrossRef]
- Hahn, D.; Olvermann, M.; Richtberg, J.; Seiberl, W.; Schwirtz, A. Knee and ankle joint torque-angle relationships of multi-joint leg extension. J. Biomech. 2011, 44, 2059–2065. [Google Scholar] [CrossRef]
- Hébert-Losier, K.; Beaven, C.M. The MARS for squat, countermovement, and standing long jump performance analyses: Are measures reproducible? J. Strength Cond. Res. 2014, 28, 1849–1857. [Google Scholar] [CrossRef] [PubMed]
- Ditroilo, M.; Forte, R.; McKeown, D.; Boreham, C.; De Vito, G. Intra- and inter-session reliability of vertical jump performance in healthy middle-aged and older men and women. J. Sport. Sci. 2011, 29, 1675–1682. [Google Scholar] [CrossRef]
- Ansdell, P.; Brownstein, C.G.; Škarabot, J.; Hicks, K.M.; Simoes, D.C.M.; Thomas, K.; Howatson, G.; Hunter, S.K.; Goodall, S. Menstrual cycle-associated modulations in neuromuscular function and fatigability of the knee extensors in eumenorrheic women. J. Appl. Physiol. 2019, 126, 1701–1712. [Google Scholar] [CrossRef]


| Variable | Session 1 | Session 2 | Change | p | ICC (95% CI) | CV% (95% CI) | |||||
|---|---|---|---|---|---|---|---|---|---|---|---|
| Mean | SD | Mean | SD | Mean | SD | ||||||
| ILP | |||||||||||
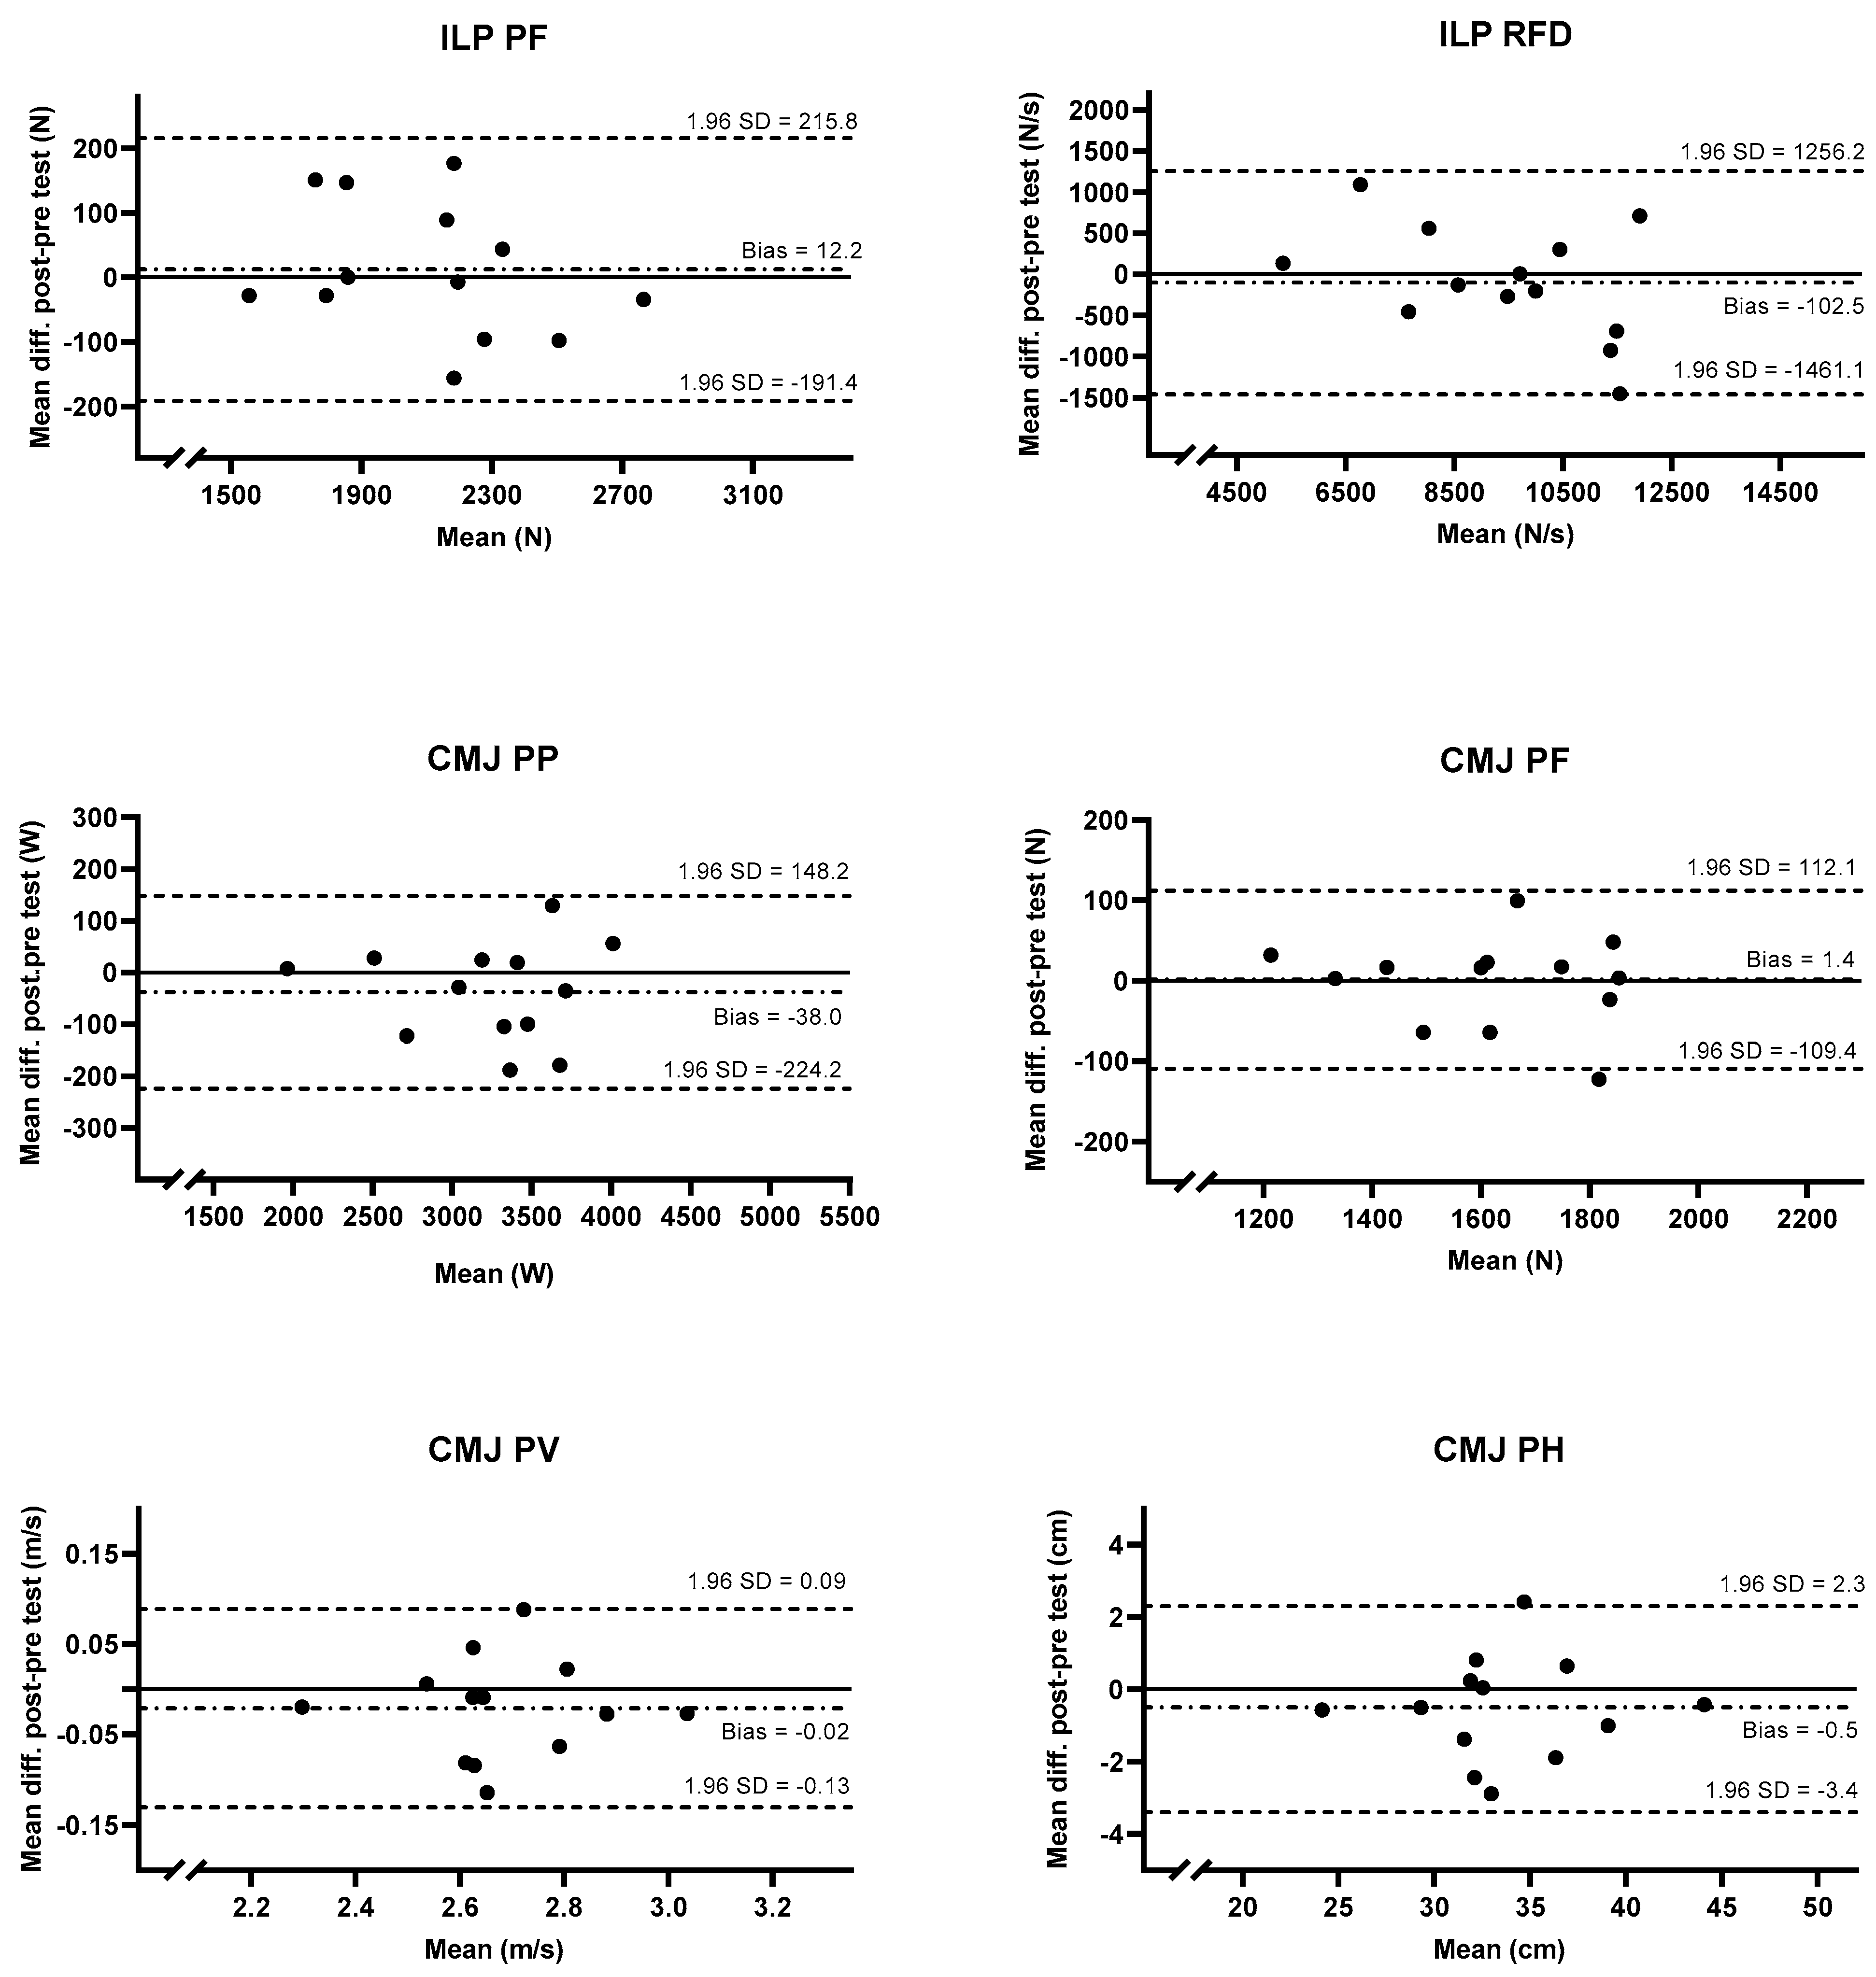
| Peak force max (N) | 2104 | 354.2 | 2116 | 322.6 | 12.2 | 104 | 0.68 | 0.98 | (0.93–0.99) | 3.48 | (−3.34–10.31) |
| Peak force mean 2 (N) | 2080 | 353.0 | 2076 | 309.8 | −3.72 | 99.4 | 0.90 | 0.98 | (0.93–0.99) | 3.38 | (−3.25–10.01) |
| Peak force mean 3 (N) | 2042 | 347.3 | 2050 | 304.7 | 8.30 | 97.2 | 0.76 | 0.98 | (0.93–0.99) | 3.36 | (−3.23–9.94) |
| Peak RFD max (N/s) | 9415 | 2035 | 9312 | 1828 | −103 | 693 | 0.60 | 0.97 | (0.90–0.99) | 5.23 | (−5.03–15.50) |
| Peak RFD mean 2 (N/s) | 9177 | 1987 | 9103 | 1764 | −73.5 | 578 | 0.66 | 0.98 | (0.93–0.99) | 4.47 | (−4.29–13.24) |
| Peak RFD mean 3 (N/s) | 8881 | 1902 | 8906 | 1725 | 25.3 | 459 | 0.85 | 0.99 | (0.95–0.99) | 3.65 | (−3.51–10.81) |
| CMJ | |||||||||||
| Peak power max (W) | 3252 | 562.5 | 3214 | 559.7 | −38.0 | 95.0 | 0.18 | 0.99 | (0.98–0.99) | 2.08 | (−1.99–6.15) |
| Peak power mean 2 (W) | 3229 | 560.2 | 3194 | 564.0 | −35.7 | 78.6 | 0.13 | 0.99 | (0.98–0.99) | 1.73 | (−1.66–5.12) |
| Peak power mean 3 (W) | 3207 | 554.4 | 3170 | 561.5 | −37.2 | 81.7 | 0.13 | 0.99 | (0.98–0.99) | 1.81 | (−1.74–5.36) |
| Peak force max (N) | 1620 | 204.3 | 1621 | 212.3 | 1.37 | 56.5 | 0.93 | 0.98 | (0.94–0.99) | 2.47 | (−2.37–7.30) |
| Peak force mean 2 (N) | 1605 | 207.4 | 1608 | 210.8 | 2.72 | 57.3 | 0.15 | 0.98 | (0.94–0.99) | 2.52 | (−2.42–7.46) |
| Peak force mean 3 (N) | 1594 | 204.7 | 1598 | 207.9 | 4.29 | 58.2 | 0.14 | 0.98 | (0.94–0.99) | 2.58 | (−2.48–7.64) |
| Peak Velocity max (m s −1) | 2.69 | 0.18 | 2.67 | 0.18 | −0.02 | 0.06 | 0.20 | 0.97 | (0.92–0.99) | 1.47 | (−1.42–4.36) |
| Peak Velocity mean 2 (m s −1) | 2.68 | 0.18 | 2.66 | 0.18 | −0.02 | 0.06 | 0.16 | 0.97 | (0.92–0.99) | 1.47 | (−1.41–4.34) |
| Peak Velocity mean 3 (m s −1) | 2.67 | 0.18 | 2.65 | 0.19 | −0.03 | 0.06 | 0.12 | 0.97 | (0.91–0.99) | 1.51 | (−1.45–4.46) |
| Peak height max (cm) | 34.0 | 4.9 | 33.4 | 4.9 | −0.5 | 1.4 | 0.21 | 0.98 | (0.93–0.99) | 3.02 | (−2.90–8.94) |
| Peak height mean 2 (cm) | 33.7 | 4.9 | 33.1 | 5.0 | −0.7 | 1.5 | 0.87 | 0.97 | (0.91–0.99) | 3.20 | (−3.07–9.47) |
| Peak height mean 3 (cm) | 33.4 | 4.8 | 32.8 | 5.0 | −0.7 | 0.2 | 0.80 | 0.97 | (0.91–0.99) | 3.24 | (−3.11–9.60) |
Disclaimer/Publisher’s Note: The statements, opinions and data contained in all publications are solely those of the individual author(s) and contributor(s) and not of MDPI and/or the editor(s). MDPI and/or the editor(s) disclaim responsibility for any injury to people or property resulting from any ideas, methods, instructions or products referred to in the content. |
© 2023 by the authors. Licensee MDPI, Basel, Switzerland. This article is an open access article distributed under the terms and conditions of the Creative Commons Attribution (CC BY) license (https://creativecommons.org/licenses/by/4.0/).
Share and Cite
Petré, H.; Psilander, N.; Rosdahl, H. Between-Session Reliability of Strength- and Power-Related Variables Obtained during Isometric Leg Press and Countermovement Jump in Elite Female Ice Hockey Players. Sports 2023, 11, 96. https://doi.org/10.3390/sports11050096
Petré H, Psilander N, Rosdahl H. Between-Session Reliability of Strength- and Power-Related Variables Obtained during Isometric Leg Press and Countermovement Jump in Elite Female Ice Hockey Players. Sports. 2023; 11(5):96. https://doi.org/10.3390/sports11050096
Chicago/Turabian StylePetré, Henrik, Niklas Psilander, and Hans Rosdahl. 2023. "Between-Session Reliability of Strength- and Power-Related Variables Obtained during Isometric Leg Press and Countermovement Jump in Elite Female Ice Hockey Players" Sports 11, no. 5: 96. https://doi.org/10.3390/sports11050096