
SNCA Gene Methylation in Parkinson’s Disease and Multiple System Atrophy
Abstract
:1. Introduction
2. Results
3. Discussion
4. Materials and Methods
Author Contributions
Funding
Institutional Review Board Statement
Informed Consent Statement
Data Availability Statement
Conflicts of Interest
Appendix A

| Sites | Nucleotides following the Methylated Cytosine | Location of Cytosine (GRCh38.p13chr4) (NC_000004.12) |
|---|---|---|
| non-CpG-2K | mCCG | chr4: 89,838,054 |
| CpG-3 | mCG | chr4: 89,838,053 |
| non-CpG-3A | mCTA | chr4: 89,838,046 |
| non-CpG-3B | mCAC | chr4: 89,838,040 |
| CpG-4 | mCG | chr4: 89,838,038 |
| non-CpG-4A | mCTG | chr4: 89,838,036 |
| non-CpG-4B | mCTC | chr4: 89,838,026 |
| non-CpG-4C | mCCC | chr4: 89,838,024 |
| non-CpG-4D | mCCA | chr4: 89,838,023 |
| non-CpG-4E | mCAG | chr4: 89,838,022 |
| non-CpG-4F | mCTG | chr4: 89,838,007 |
| non-CpG-4G | mCAA | chr4: 89,838,004 |
| non-CpG-4I | mCCC | chr4: 89,837,994 |
| non-CpG-4J | mCCA | chr4: 89,837,993 |
| non-CpG-4K | mCAT | chr4: 89,837,992 |
| non-CpG-4L | mCTA | chr4: 89,837,987 |
| CpG-5 | mCG | chr4: 89,837,981 |
| non-CpG-5A | mCCT | chr4: 89,837,974 |
| non-CpG-5B | mCTT | chr4: 89,837,973 |
| non-CpG-5C | mCCG | chr4: 89,837,966 |
| CpG-6 | mCG | chr4: 89,837,965 |
| non-CpG-6A | mCTT | chr4: 89,837,963 |
| CpG-7 | mCG | chr4: 89,837,952 |
| non-CpG-7A | mCTG | chr4: 89,837,949 |
| non-CpG-7B | mCCT | chr4: 89,837,933 |
| non-CpG-7C | mCTT | chr4: 89,837,932 |
| non-CpG-7D | mCCA | chr4: 89,837,926 |
| non-CpG-7E | mCAC | chr4: 89,837,925 |
| non-CpG-7F | mCTG | chr4: 89,837,923 |
| non-CpG-7G | mCAG | chr4: 89,837,910 |
| CpG-8 | mCG | chr4: 89,837,907 |
| non-CpG-8A | mCTG | chr4: 89,837,904 |
| non-CpG-8B | mCAG | chr4: 89,837,900 |
| CpG-9 | mCG | chr4: 89,837,896 |
| non-CpG-9A | mCTG | chr4: 89,837,894 |
Appendix B
| Sites | Location of cytosine (GRCh38.p13chr4) (NC_000004.12) |
|---|---|
| intron 1 CpG-21 | chr4: 89,836,561 |
| intron 1 CpG-22 | chr4: 89,836,505 |
| intron 1 CpG-23 | chr4: 89,836,498 |
| intron 1 CpG-24 | chr4: 89,836,488 |
| intron 1 CpG-25 | chr4: 89,836,481 |
| intron 1 CpG-26 | chr4: 89,836,479 |
| intron 1 CpG-27 | chr4: 89,836,461 |
| intron 1 CpG-28 | chr4: 89,836,420 |
| intron 1 CpG-29 | chr4: 89,836,383 |
| intron 1 CpG-30 | chr4: 89,836,329 |
| intron 1 CpG-31 | chr4: 89,836,311 |
| intron 1 CpG-32 | chr4: 89,836,309 |
| intron 1 CpG-33 | chr4: 89,836,302 |
| intron 1 CpG-34 | chr4: 89,836,281 |
| intron 1 CpG-35 | chr4: 89,836,273 |
| intron 1 CpG-36 | chr4: 89,836,262 |
| intron 1 CpG-37 | chr4: 89,836,260 |
| intron 1 CpG-38 | chr4: 89,836,248 |
| intron 1 CpG-39 | chr4: 89,836,243 |
| intron 1 CpG-40 | chr4: 89,836,241 |
| intron 1 CpG-41 | chr4: 89,836,231 |
| intron 1 CpG-42 | chr4: 89,836,228 |
| intron 1 CpG-43 | chr4: 89,836,201 |
| intron 1 CpG-44 | chr4: 89,836,129 |
| intron 1 CpG-45 | chr4: 89,836,102 |
| intron 1 CpG-46 | chr4: 89,835,989 |
| intron 1 CpG-47 | chr4: 89,835,904 |
| intron 1 CpG-48 | chr4: 89,835,730 |
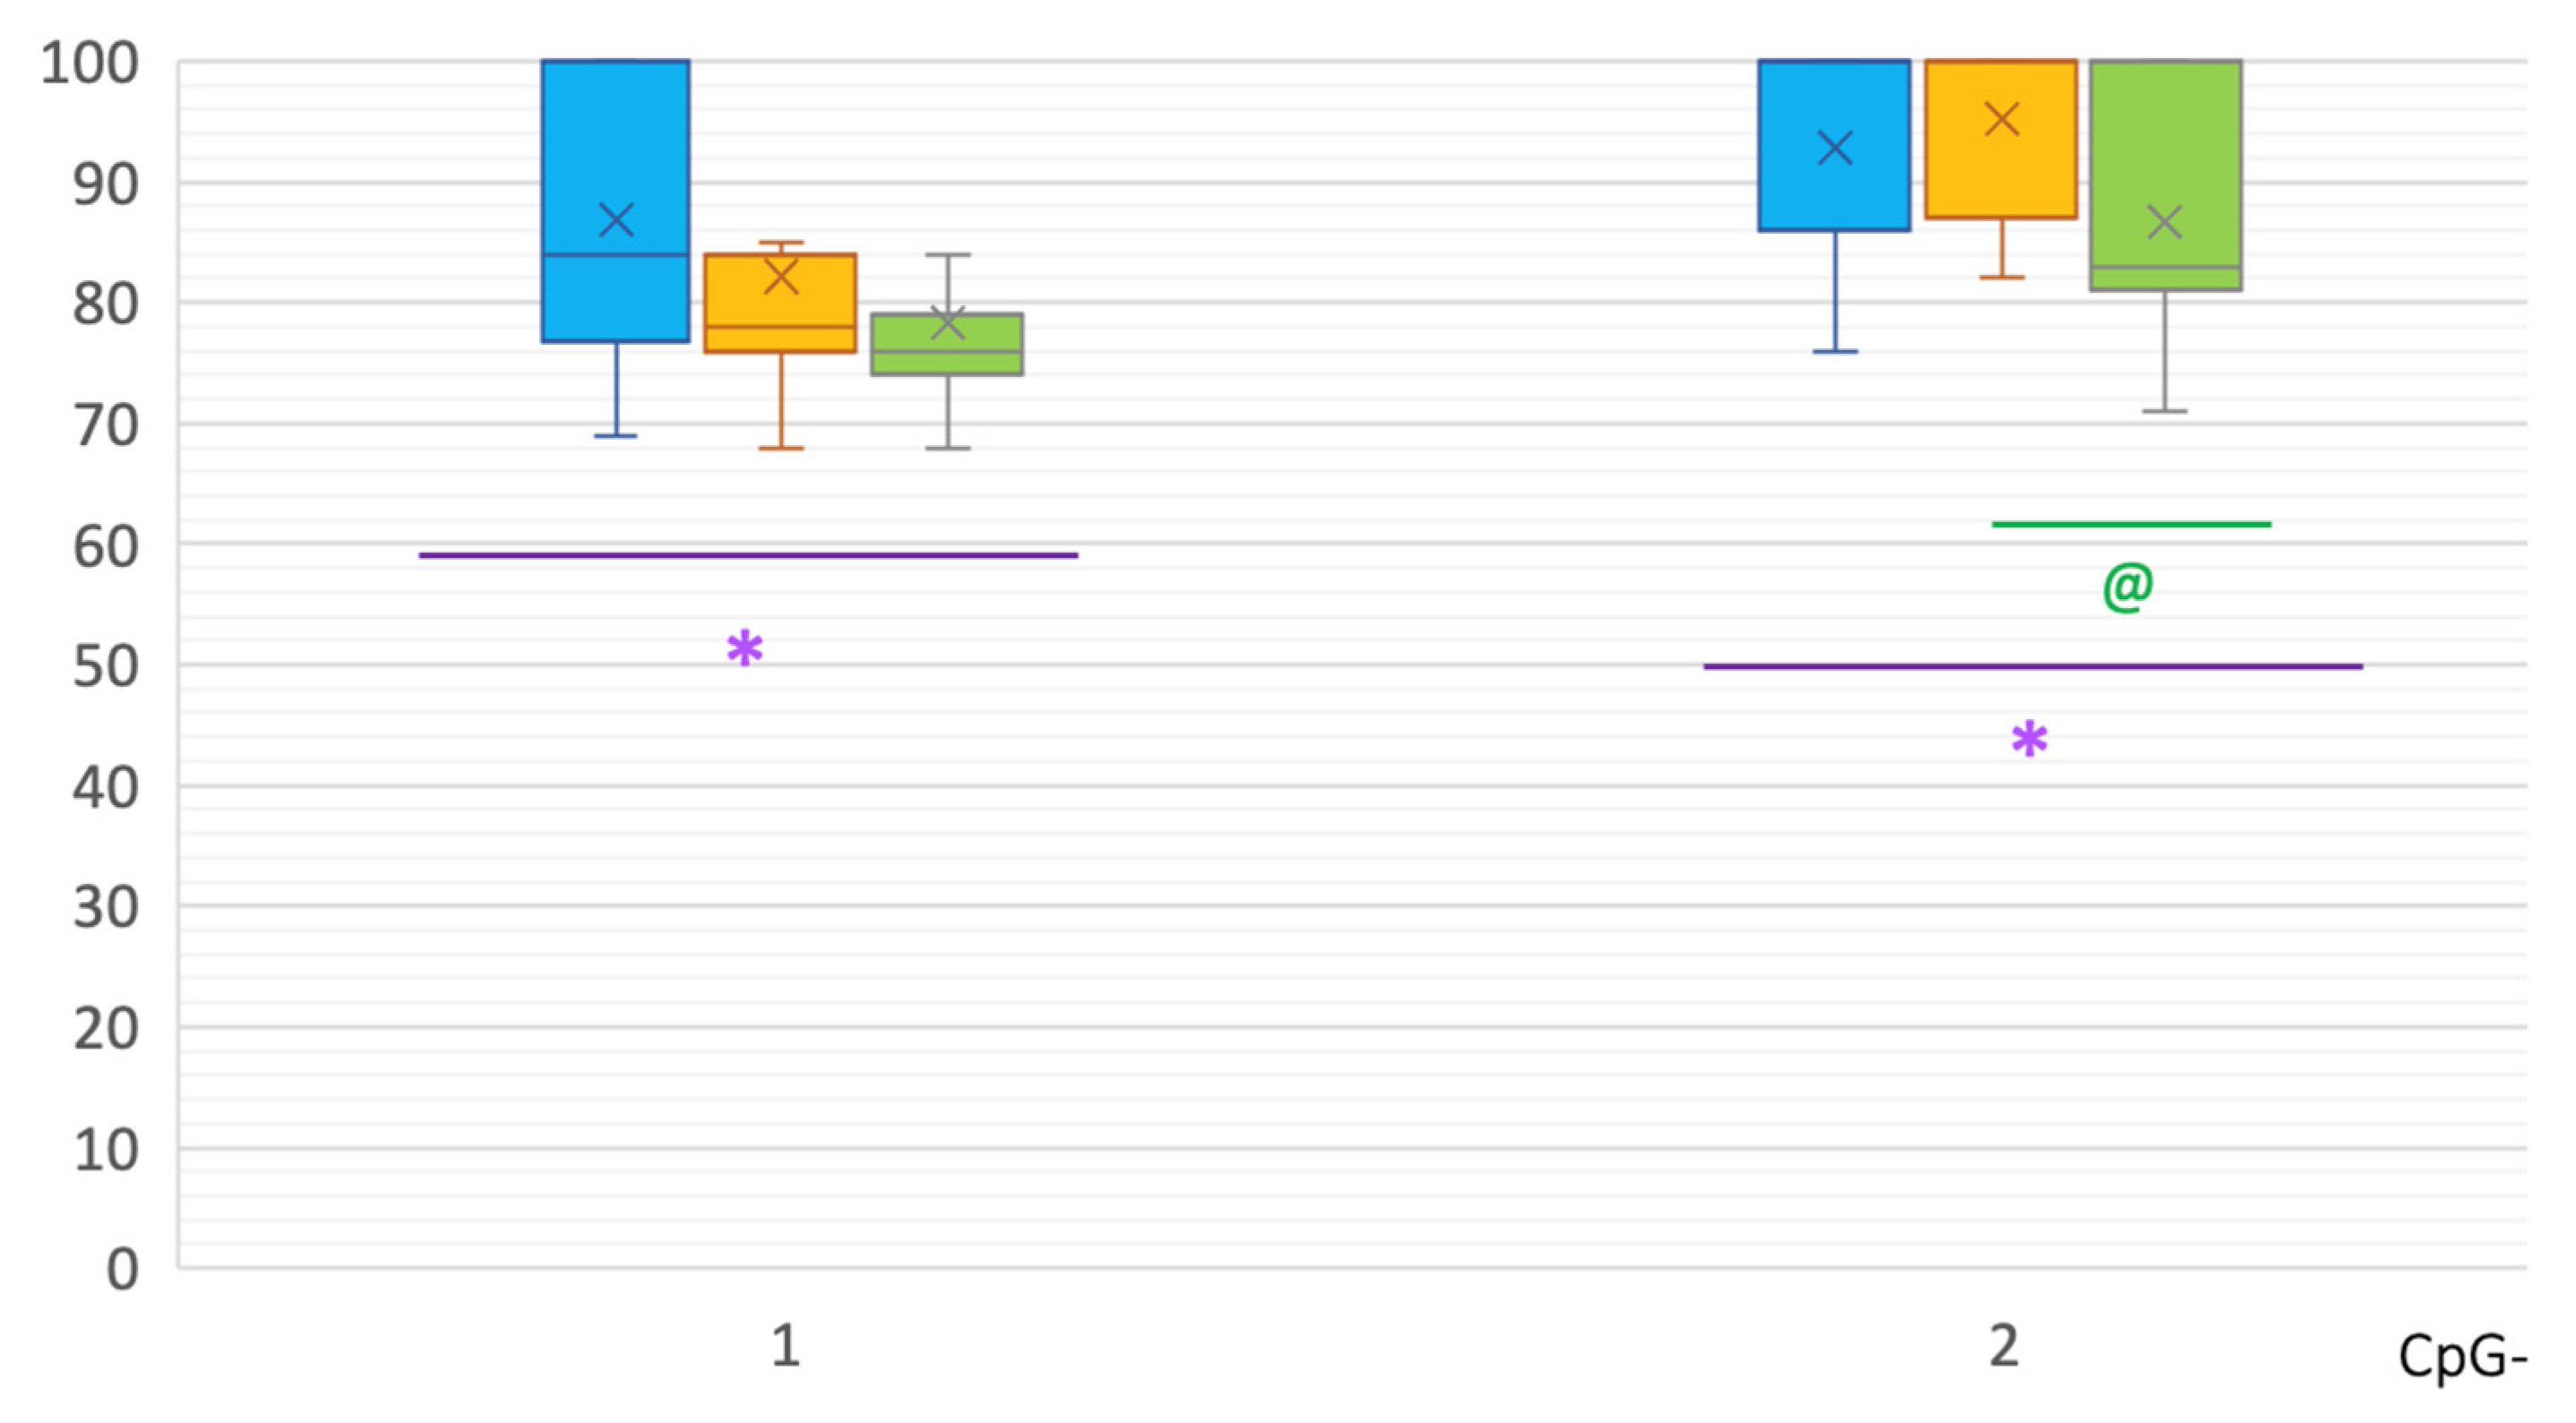
| intron 2 CpG-1 | chr4: 89,835,383 |
| intron 2 CpG-2 | chr4: 89,835,353 |
References
- Kovacs, G.G. Molecular pathological classification of neurodegenerative diseases: Turning towards precision medicine. Int. J. Mol. Sci. 2016, 17, 189. [Google Scholar] [CrossRef] [PubMed]
- McCann, H.; Stevens, C.H.; Cartwright, H.; Halliday, G.M. α-Synucleinopathy phenotypes. Park. Relat. Disord. 2014, 20 (Suppl. S1), S62–S67. [Google Scholar] [CrossRef]
- Hirtz, D.; Thurman, D.; Gwinn-Hardy, K.; Mohamed, M.; Chaudhuri, A.R.; Zalutsky, R. How common are the “common” neurologic disorders. Neurology 2007, 68, 326–337. [Google Scholar] [CrossRef] [PubMed]
- Ascherio, A.; Schwarzschild, M.A. The epidemiology of Parkinson’s disease: Risk factors and prevention. Lancet Neurol. 2016, 15, 1257–1272. [Google Scholar] [CrossRef]
- Hirsch, L.; Jette, N.; Frolkis, A.; Steeves, T.; Pringsheim, T. The incidence of Parkinson’s disease: A systematic review and meta-analysis. Neuroepidemiology 2016, 46, 292–300. [Google Scholar] [CrossRef] [PubMed]
- Elbaz, A.; Carcaillon, L.; Kab, S.; Moisan, F. Epidemiology of Parkinson’s disease. Rev. Neurol. (Paris) 2016, 172, 14–26. [Google Scholar] [CrossRef] [PubMed]
- Jankovic, J. Parkinson’s disease: Clinical features and diagnosis. J. Neurol. Neurosurg. Psychiatry 2008, 79, 368–376. [Google Scholar] [CrossRef] [PubMed]
- Dickson, D.W. Parkinson’s disease and parkinsonism: Neuropathology. Cold Spring Harb. Perspect. Med. 2012, 2, a009258. [Google Scholar] [CrossRef] [PubMed]
- Surguchov, A. Biomarkers in Parkinson’s Disease. In Neurodegenerative Diseases Biomarkers; Neuromethods; Peplow, P.V., Martinez, B., Gennarelli, T.A., Eds.; Humana: New York, NY, USA, 2022; Volume 173, pp. 155–180. [Google Scholar] [CrossRef]
- Bonifati, V. Genetics of Parkinson’s disease- state of the art, 2013. Park. Relat. Disord. 2014, 20 (Suppl. S1), S23–S28. [Google Scholar] [CrossRef]
- Gasser, T. Mendelian forms of Parkinson’s disease. Biochim. Biophys. Acta 2009, 1792, 587–596. [Google Scholar] [CrossRef]
- Kalia, L.V.; Lang, A.E. Parkinson’s disease. Lancet 2015, 386, 896–912. [Google Scholar] [CrossRef] [PubMed]
- Jankovic, J.; Tan, E.K. Parkinson’s disease: Etiopathogenesis and treatment. J. Neurol. Neurosurg. Psychiatry 2020, 91, 795–808. [Google Scholar] [CrossRef] [PubMed]
- Wong, Y.C.; Luk, K.; Purtell, K.; Burke Nanni, S.; Stoessl, A.J.; Trudeau, L.E.; Yue, Z.; Krainc, D.; Oertel, W.; Obeso, J.A.; et al. Neuronal vulnerability in Parkinson disease: Should the focus be on axons and synaptic terminals? Mov. Disord. 2019, 34, 1406–1422. [Google Scholar] [CrossRef] [PubMed]
- Giguère, N.; Burke Nanni, S.; Trudeau, L.E. On cell loss and selective vulnerability of neuronal populations in Parkinson’s disease. Front. Neurol. 2018, 19, 455. [Google Scholar] [CrossRef] [PubMed]
- Murthy, M.; Cheng, Y.Y.; Holton, J.L.; Bettencourt, C. Neurodegenerative movement disorders: An epigenetics perspective and promise for the future. Neuropathol. Appl. Neurobiol. 2021, 47, 897–909. [Google Scholar] [CrossRef]
- Wenning, G.K.; Stankovic, I.; Vignatelli, L.; Fanciulli, A.; Calandra-Buonaura, G.; Seppi, K.; Palma, J.A.; Meissner, W.G.; Krismer, F.; Berg, D.; et al. The Movement Disorder Society criteria for the diagnosis of multiple system atrophy. Mov. Disord. 2022, 37, 1131–1148. [Google Scholar] [CrossRef]
- Koga, S.; Dickson, D.W. Recent advances in neuropathology, biomarkers and therapeutic approach of multiple system atrophy. J. Neurol. Neurosurg. Psychiatry 2018, 89, 175–184. [Google Scholar] [CrossRef]
- Ozawa, T.; Paviour, D.; Quinn, N.P.; Josephs, K.A.; Sangha, H.; Kilford, L.; Healy, D.G.; Wood, N.W.; Lees, A.J.; Holton, J.L.; et al. The spectrum of pathological involvement of the striatonigral and olivopontocerebellar systems in multiple system atrophy: Clinicopathological correlations. Brain J. Neurol. 2004, 127, 2657–2671. [Google Scholar] [CrossRef]
- Scholz, S.W.; Houlden, H.; Schulte, C.; Sharma, M.; Li, A.; Berg, D.; Melchers, A.; Paudel, R.; Gibbs, J.R.; Simon-Sanchez, J.; et al. SNCA variants are associated with increased risk for multiple system atrophy. Ann. Neurol. 2009, 65, 610–614. [Google Scholar] [CrossRef]
- Vilariño-Güell, C.; Soto-Ortolaza, A.I.; Rajput, A.; Mash, D.C.; Papapetropoulos, S.; Pahwa, R.; Lyons, K.E.; Uitti, R.J.; Wszolek, Z.K.; Dickson, D.W.; et al. MAPT H1 haplotype is a risk factor for essential tremor and multiple system atrophy. Neurology 2011, 76, 670–672. [Google Scholar] [CrossRef]
- Mitsui, J.; Matsukawa, T.; Ishiura, H.; Fukuda, Y.; Ichikawa, Y.; Date, H.; Ahsan, B.; Nakahara, Y.; Momose, Y.; Takahashi, Y.; et al. Multiple-System Atrophy Research Collaboration. Mutations in COQ2 in familial and sporadic multiple-system atrophy. N. Engl. J. Med. 2013, 369, 233–244. [Google Scholar] [CrossRef]
- Sailer, A.; Scholz, S.W.; Nalls, M.A.; Schulte, C.; Federoff, M.; Price, T.R.; Lees, A.; Ross, O.A.; Dickson, D.W.; Mok, K.; et al. European Multiple System Atrophy Study Group and the UK Multiple System Atrophy Study Group. A genome-wide association study in multiple system atrophy. Neurology 2016, 87, 1591–1598. [Google Scholar] [CrossRef] [PubMed]
- Lardenoije, R.; Iatrou, A.; Kenis, G.; Kompotis, K.; Steinbusch, H.W.M.; Mastroeni, D.; Coleman, P.; Lemere, C.A.; Hof, P.R.; van den Hove, D.L.A.; et al. The epigenetics of aging and neurodegeneration. Prog. Neurobiol. 2015, 131, 21–64. [Google Scholar] [CrossRef] [PubMed]
- Maroteaux, L.; Campanelli, J.T.; Scheller, R.H. Synuclein: A neuron-specific protein localized to the nucleus and presynaptic nerve terminal. J. Neurosci. 1988, 8, 2804–2815. [Google Scholar] [CrossRef] [PubMed]
- Jowaed, A.; Schmitt, I.; Kaut, O.; Wullner, U. Methylation regulates alpha-synuclein expression and is decreased in Parkinson’s disease patients’ brains. J. Neurosci. 2010, 30, 6355–6359. [Google Scholar] [CrossRef]
- Matsumoto, L.; Takuma, H.; Tamaoka, A.; Kurisaki, H.; Date, H.; Tsuji, S.; Iwata, A. CpG demethylation enhances alpha-synuclein expression and affects the pathogenesis of Parkinson’s disease. PLoS ONE 2010, 5, e15522. [Google Scholar] [CrossRef]
- Ai, S.X.; Xu, Q.; Hu, Y.C.; Song, C.Y.; Guo, J.F.; Shen, L.; Wang, C.R.; Yu, R.L.; Yan, X.X.; Tang, B.S. Hypomethylation of SNCA in blood of patients with sporadic Parkinson’s disease. J. Neurol. Sci. 2014, 337, 123–128. [Google Scholar] [CrossRef]
- Tan, Y.Y.; Wu, L.; Zhao, Z.B.; Wang, Y.; Xiao, Q.; Liu, J.; Wang, G.; Ma, J.F.; Chen, S.D. Methylation of α-synuclein and leucine-rich repeat kinase 2 in leukocyte DNA of Parkinson’s disease patients. Park. Relat. Disord. 2014, 20, 308–313. [Google Scholar] [CrossRef]
- Pihlstrom, L.; Berge, V.; Rengmark, A.; Toft, M. Parkinson’s disease correlates with promoter methylation in the α-synuclein gene. Mov. Disord. 2015, 30, 577–580. [Google Scholar] [CrossRef]
- Schmitt, I.; Kaut, O.; Khazneh, H.; deBoni, L.; Ahmad, A.; Berg, D.; Klein, C.; Fröhlich, H.; Wüllner, U. L-dopa increases α-synuclein DNA methylation in Parkinson’s disease patients in vivo and in vitro. Mov. Disord. 2015, 30, 1794–1801. [Google Scholar] [CrossRef]
- Richter, J.; Appenzeller, S.; Ammerpohl, O.; Deuschl, G.; Paschen, S.; Brüggemann, N.; Klein, C.; Kuhlenbäumer, G. No evidence for differential methylation of alpha-synuclein in leukocyte DNA of Parkinson’s disease patients. Mov. Disord. 2012, 27, 590–591. [Google Scholar] [CrossRef] [PubMed]
- Song, Y.; Ding, H.; Yang, J.; Lin, Q.; Xue, J.; Zhang, Y.; Chan, P.; Cai, Y. Pyrosequencing analysis of SNCA methylation levels in leukocytes from Parkinson’s disease patients. Neurosci. Lett. 2014, 569, 85–88. [Google Scholar] [CrossRef] [PubMed]
- Guhathakurta, S.; Evangelista, B.A.; Ghosh, S.; Basu, S.; Kim, Y.S. Hypomethylation of intron1 of α-synuclein gene does not correlate with Parkinson’s disease. Mol. Brain 2017, 10, 6. [Google Scholar] [CrossRef] [PubMed]
- Bettencourt, C.; Foti, S.C.; Miki, Y.; Botia, J.; Chatterjee, A.; Warner, T.T.; Revesz, T.; Lashley, T.; Balazs, R.; Viré, E.; et al. White matter DNA methylation profiling reveals deregulation of HIP1, LMAN2, MOBP, and other loci in multiple system atrophy. Acta Neuropathol. 2020, 139, 135–156. [Google Scholar] [CrossRef] [PubMed]
- Masliah, E.; Dumaop, W.; Galasko, D.; Desplats, P. Distinctive patterns of DNA methylation associated with Parkinson disease: Identification of concordant epigenetic changes in brain and peripheral blood leukocytes. Epigenetics 2013, 10, 1030–1038. [Google Scholar] [CrossRef] [PubMed]
- Clough, R.L.; Dermentzaki, G.; Stefanis, L. Functional dissection of the alpha-synuclein promoter: Transcriptional regulation by ZSCAN21 and ZNF219. J. Neurochem. 2009, 110, 1479–1490. [Google Scholar] [CrossRef] [PubMed]
- Scherzer, C.R.; Grass, J.A.; Liao, Z.; Pepivani, I.; Zheng, B.; Eklund, A.C.; Ney, P.A.; Ng, J.; McGoldrick, M.; Mollenhauer, B.; et al. GATA transcription factors directly regulate the Parkinson’s disease-linked gene alpha-synuclein. Proc. Natl. Acad. Sci. USA 2008, 105, 10907–10912. [Google Scholar] [CrossRef]
- Marras, C.; Alcalay, R.N.; Caspell-Garcia, C.; Coffey, C.; Chan, P.; Duda, J.E.; Facheris, M.F.; Fernández-Santiago, R.; Ruíz-Martínez, J.; Mestre, T.; et al. LRRK2 Cohort Consortium. Motor and nonmotor heterogeneity of LRRK2-related and idiopathic Parkinson’s disease. Mov. Disord. 2016, 31, 1192–1202. [Google Scholar] [CrossRef]
- Davis, M.Y.; Johnson, C.O.; Leverenz, J.B.; Weintraub, D.; Trojanowski, J.Q.; Chen-Plotkin, A.; Van Deerlin, V.M.; Quinn, J.F.; Chung, K.A.; Peterson-Hiller, A.L.; et al. Association of GBA mutations and the E326K polymorphism with motor and cognitive progression in Parkinson disease. JAMA Neurol. 2016, 73, 1217–1224. [Google Scholar] [CrossRef]
- Jang, H.S.; Shin, W.J.; Lee, J.E.; Do, J.T. CpG and Non-CpG Methylation in Epigenetic Gene Regulation and Brain Function. Genes 2017, 8, 148. [Google Scholar] [CrossRef]
- Patil, V.; Ward, R.; Hesson, L. The evidence for functional non-CpG methylation in mammalian cells. Epigenetics 2014, 9, 823–828. [Google Scholar] [CrossRef] [PubMed]
- Chiba-Falek, O. Structural variants in SNCA gene and the implication to synucleinopathies. Curr. Opin. Genet. Dev. 2017, 44, 110–116. [Google Scholar] [CrossRef] [PubMed]
- Postuma, R.B.; Berg, D.; Stern, M.; Poewe, W.; Olanow, C.W.; Oertel, W.; Obeso, J.; Marek, K.; Litvan, I.; Lang, A.E.; et al. MDS clinical diagnostic criteria for Parkinson’s disease. Mov. Disord. 2015, 30, 1591–1601. [Google Scholar] [CrossRef] [PubMed]
- Tanas, A.S.; Simonova, O.A.; Abramycheva, N.Y.; Strelnikov, V.V. Improving the analysis of DNA Sanger sequencing results: SeqBase computer program. Med. Genet. 2021, 20, 33–39. (In Russian) [Google Scholar] [CrossRef]


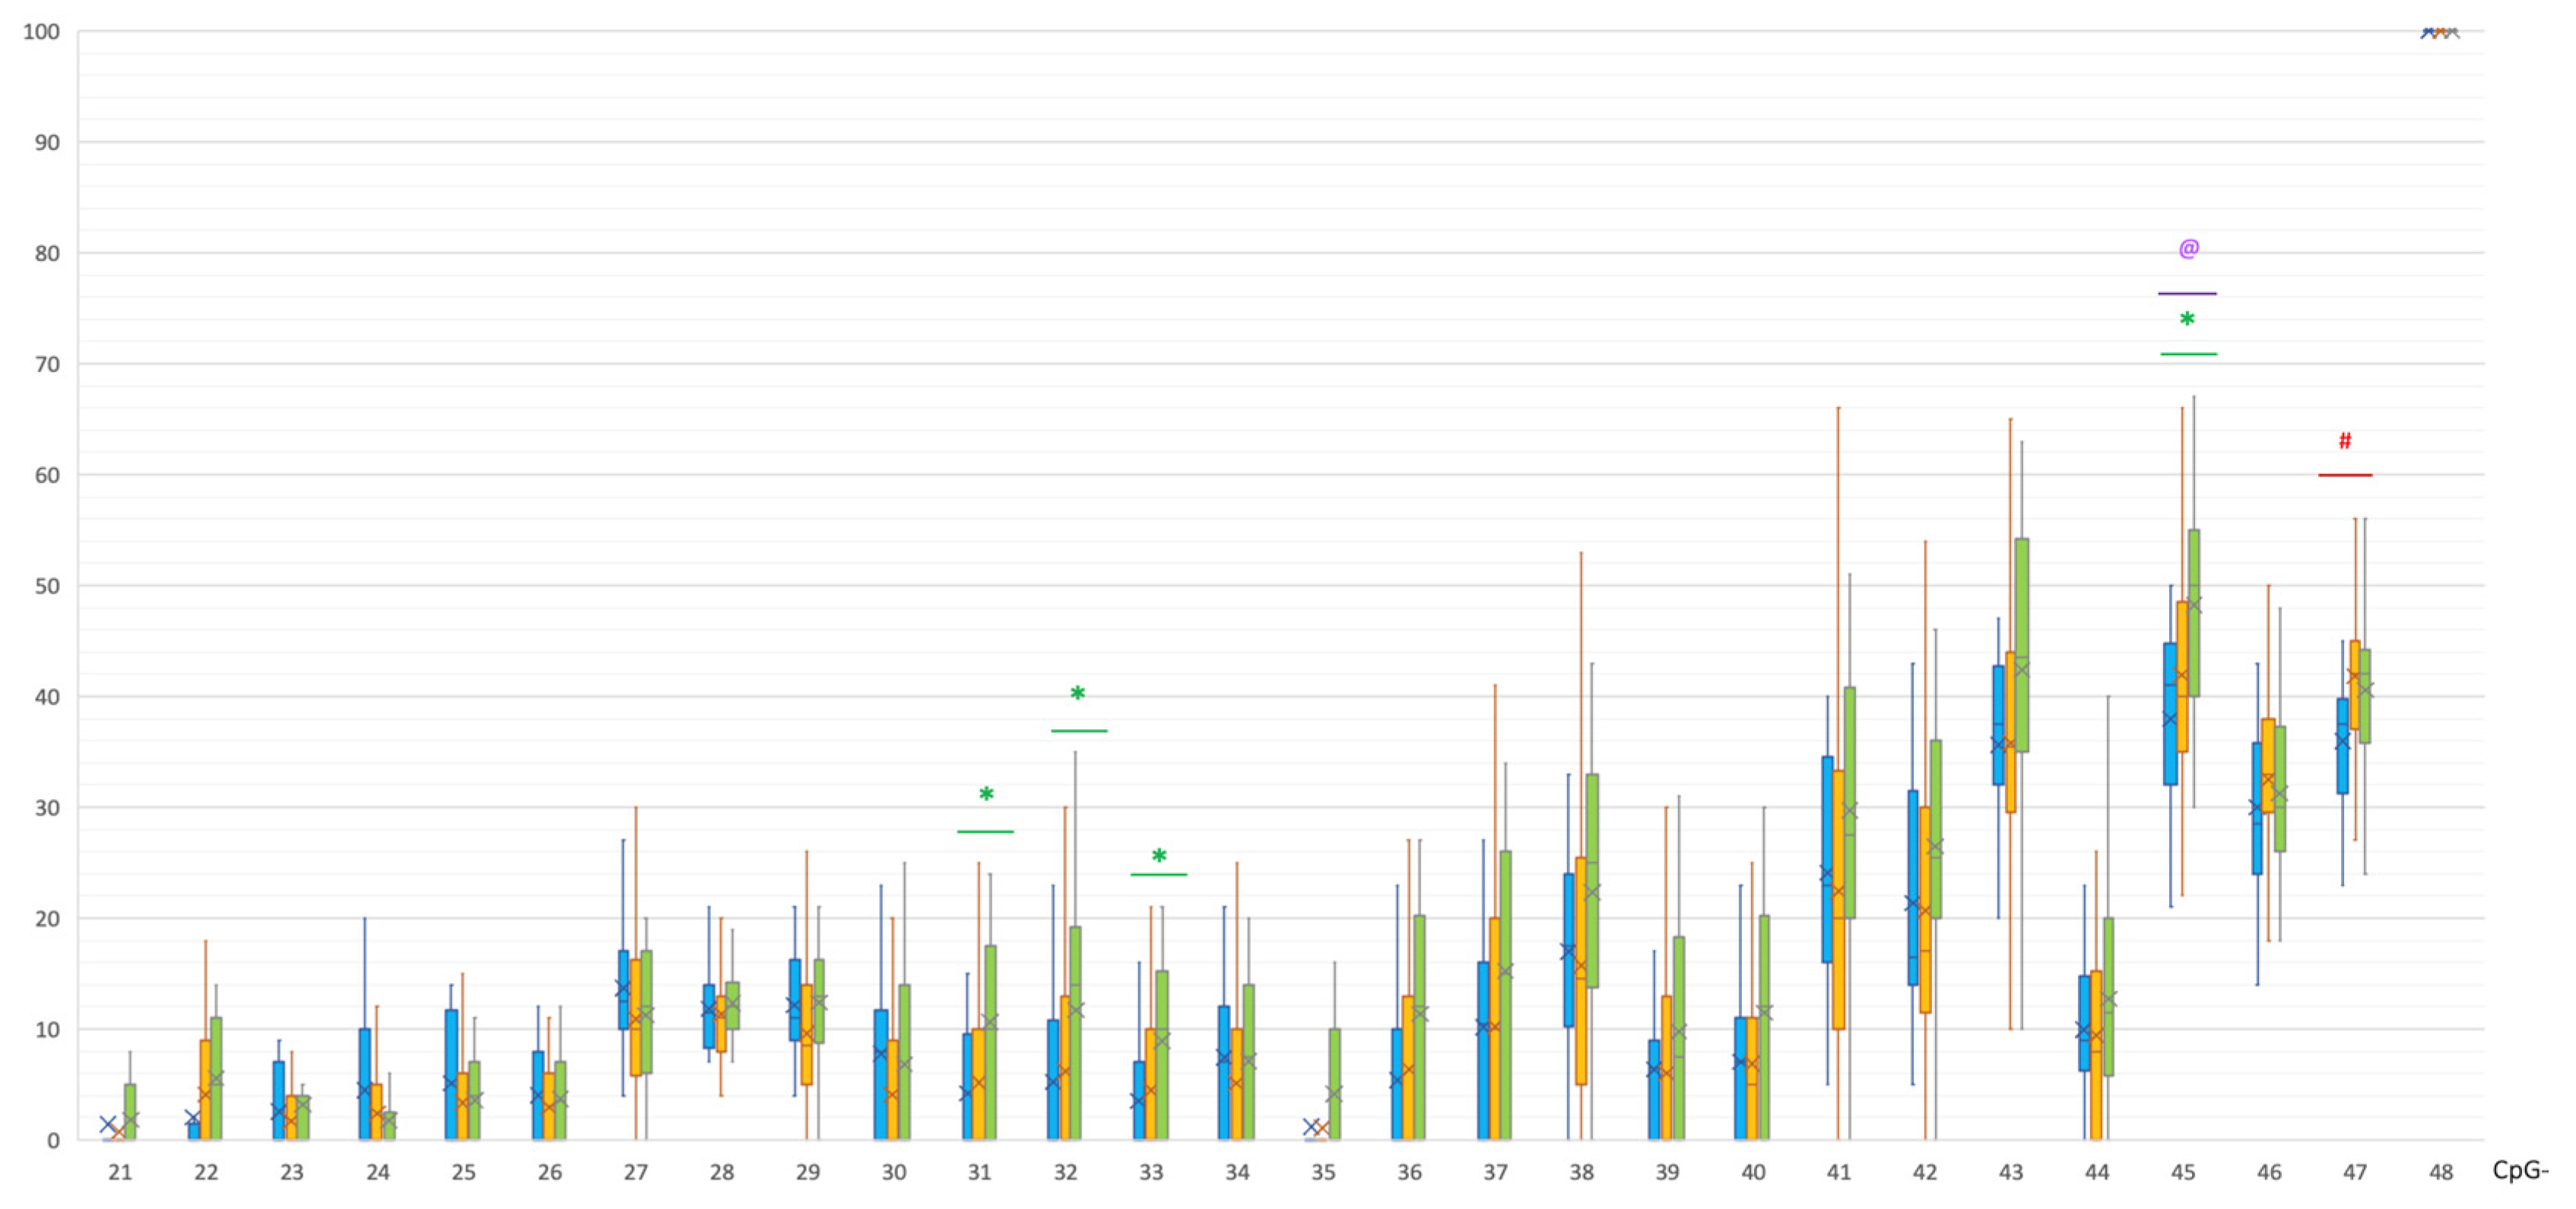
| CpG | PD | C | p(U) * |
|---|---|---|---|
| 31 | 0 [0; 10] | 10 [0; 17] | 0.000221 |
| 32 | 0 [0; 12.25] | 14 [0; 19] | 0.000627 |
| 33 | 0 [0; 9.5] | 10 [0; 15] | 0.000683 |
| 45 | 40 [35; 48] | 50 [40; 55] | 0.000935 |
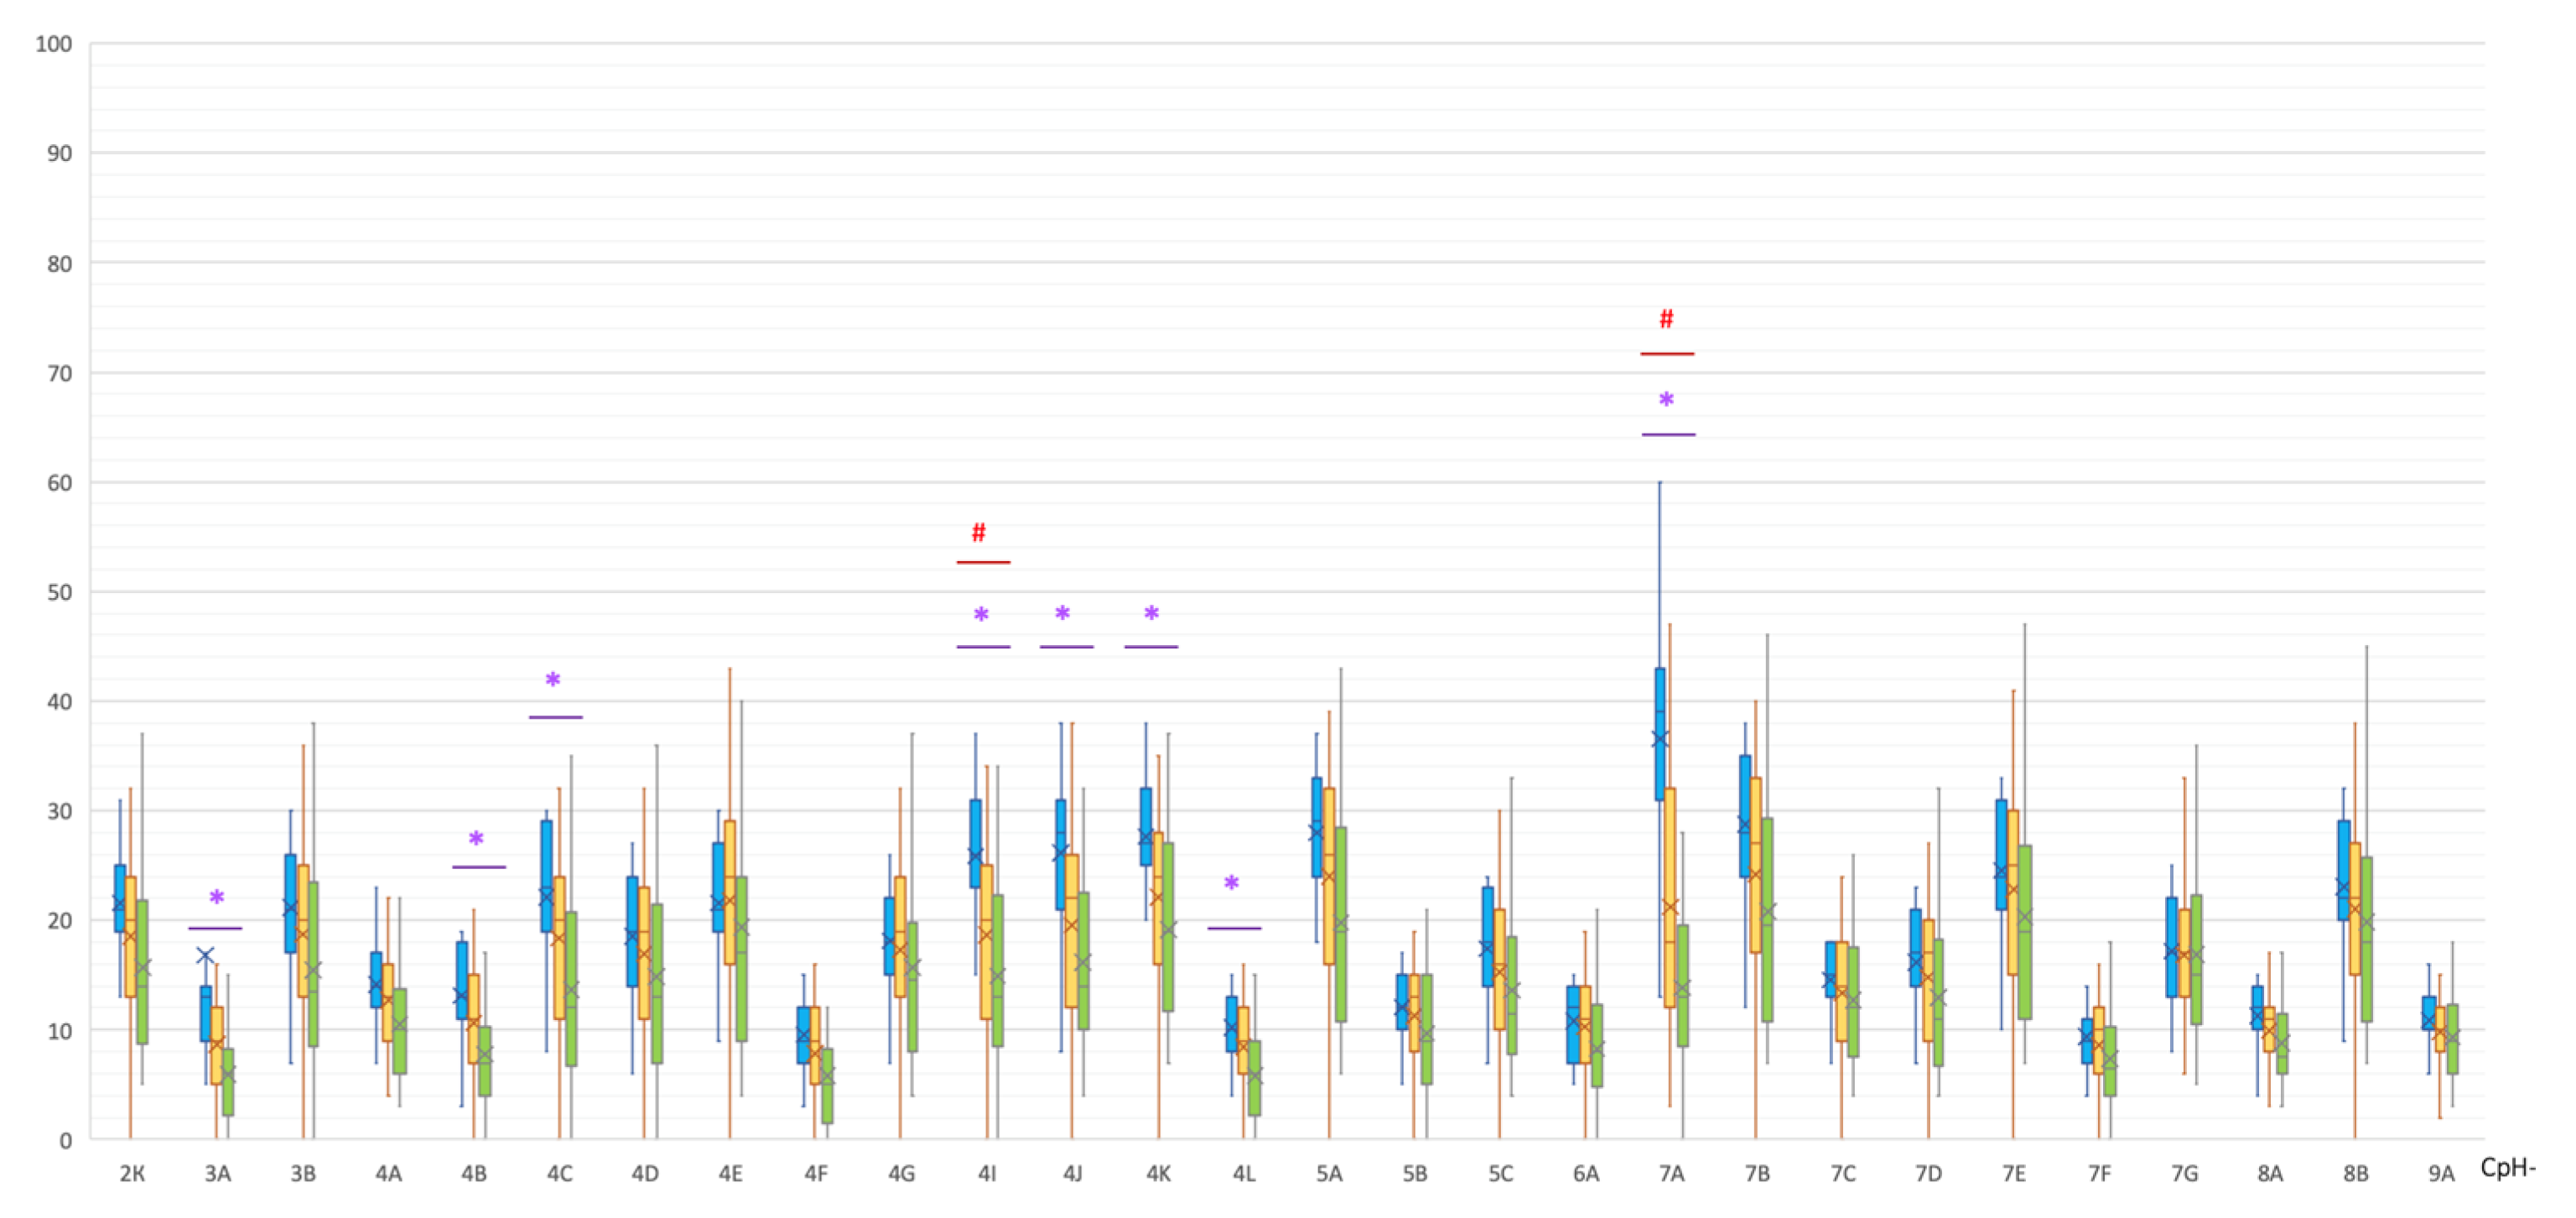
| Non-CpG | MSA | C | p(U) * |
|---|---|---|---|
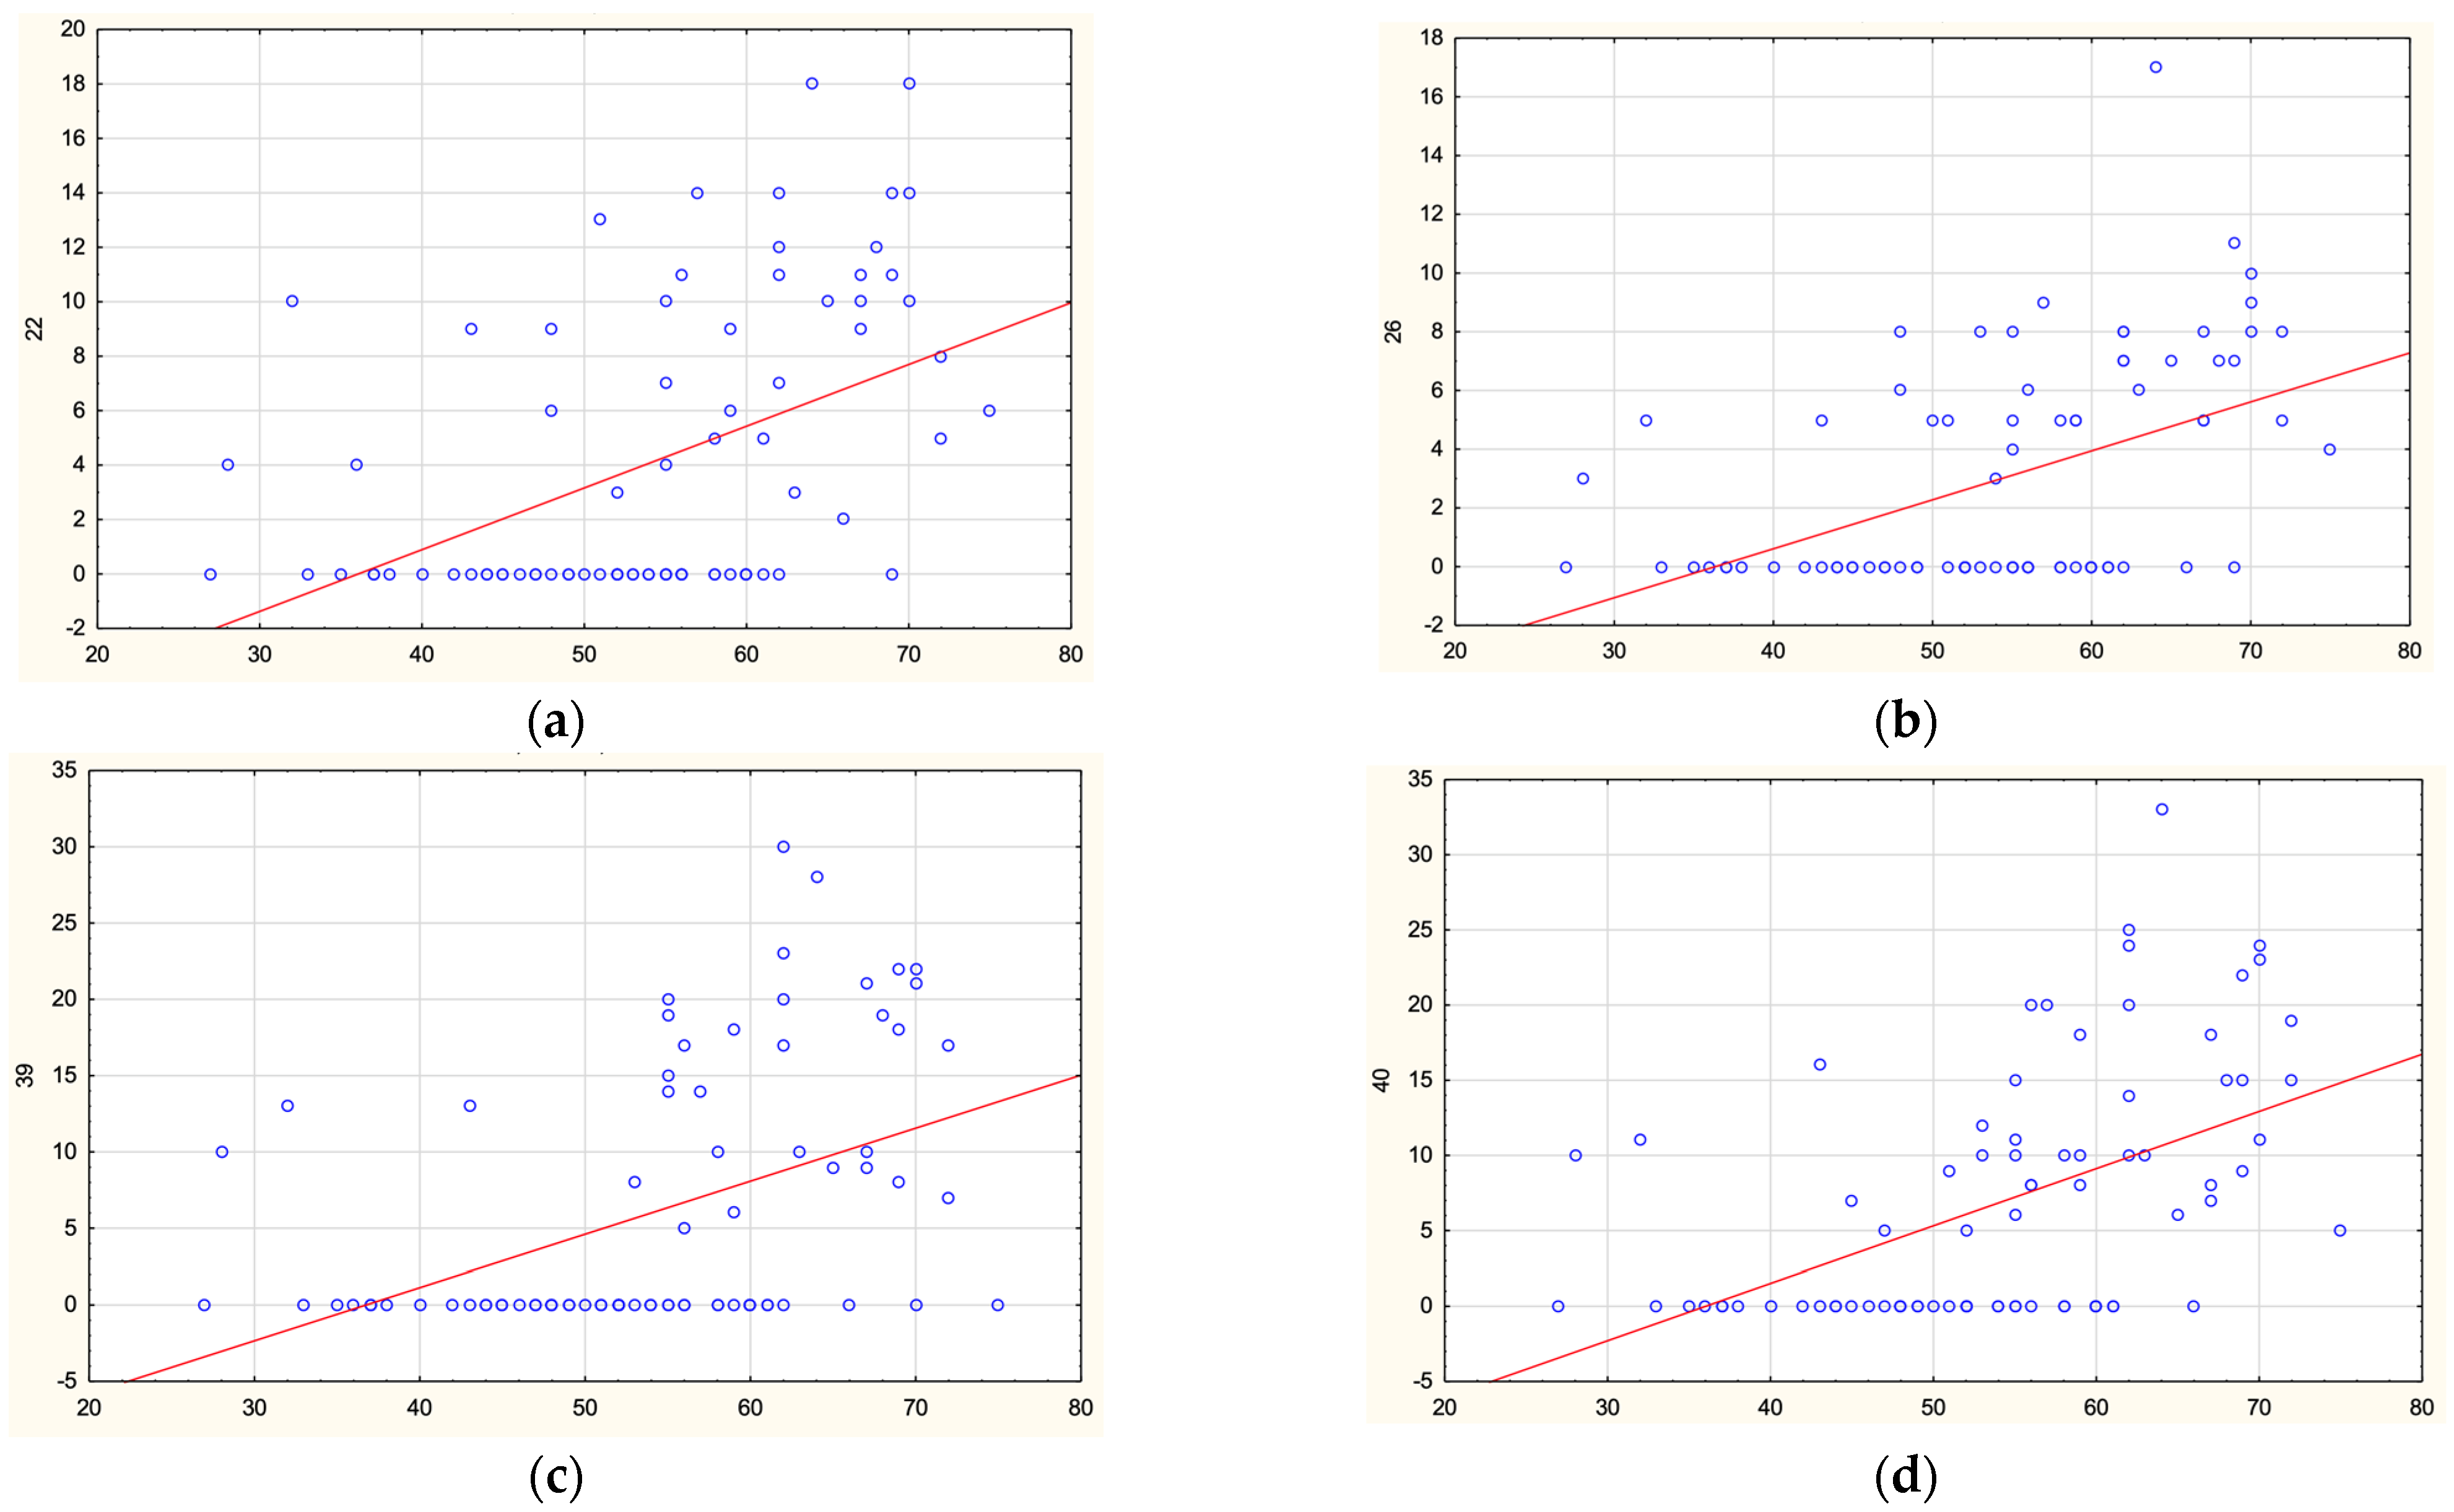
| 3A | 13 [9.5; 14] | 6 [3.25; 8] | 0.000055 |
| 4B | 13 [11; 17.5] | 7 [4.25; 10] | 0.000730 |
| 4C | 23 [19.5; 28] | 12 [7; 19] | 0.000898 |
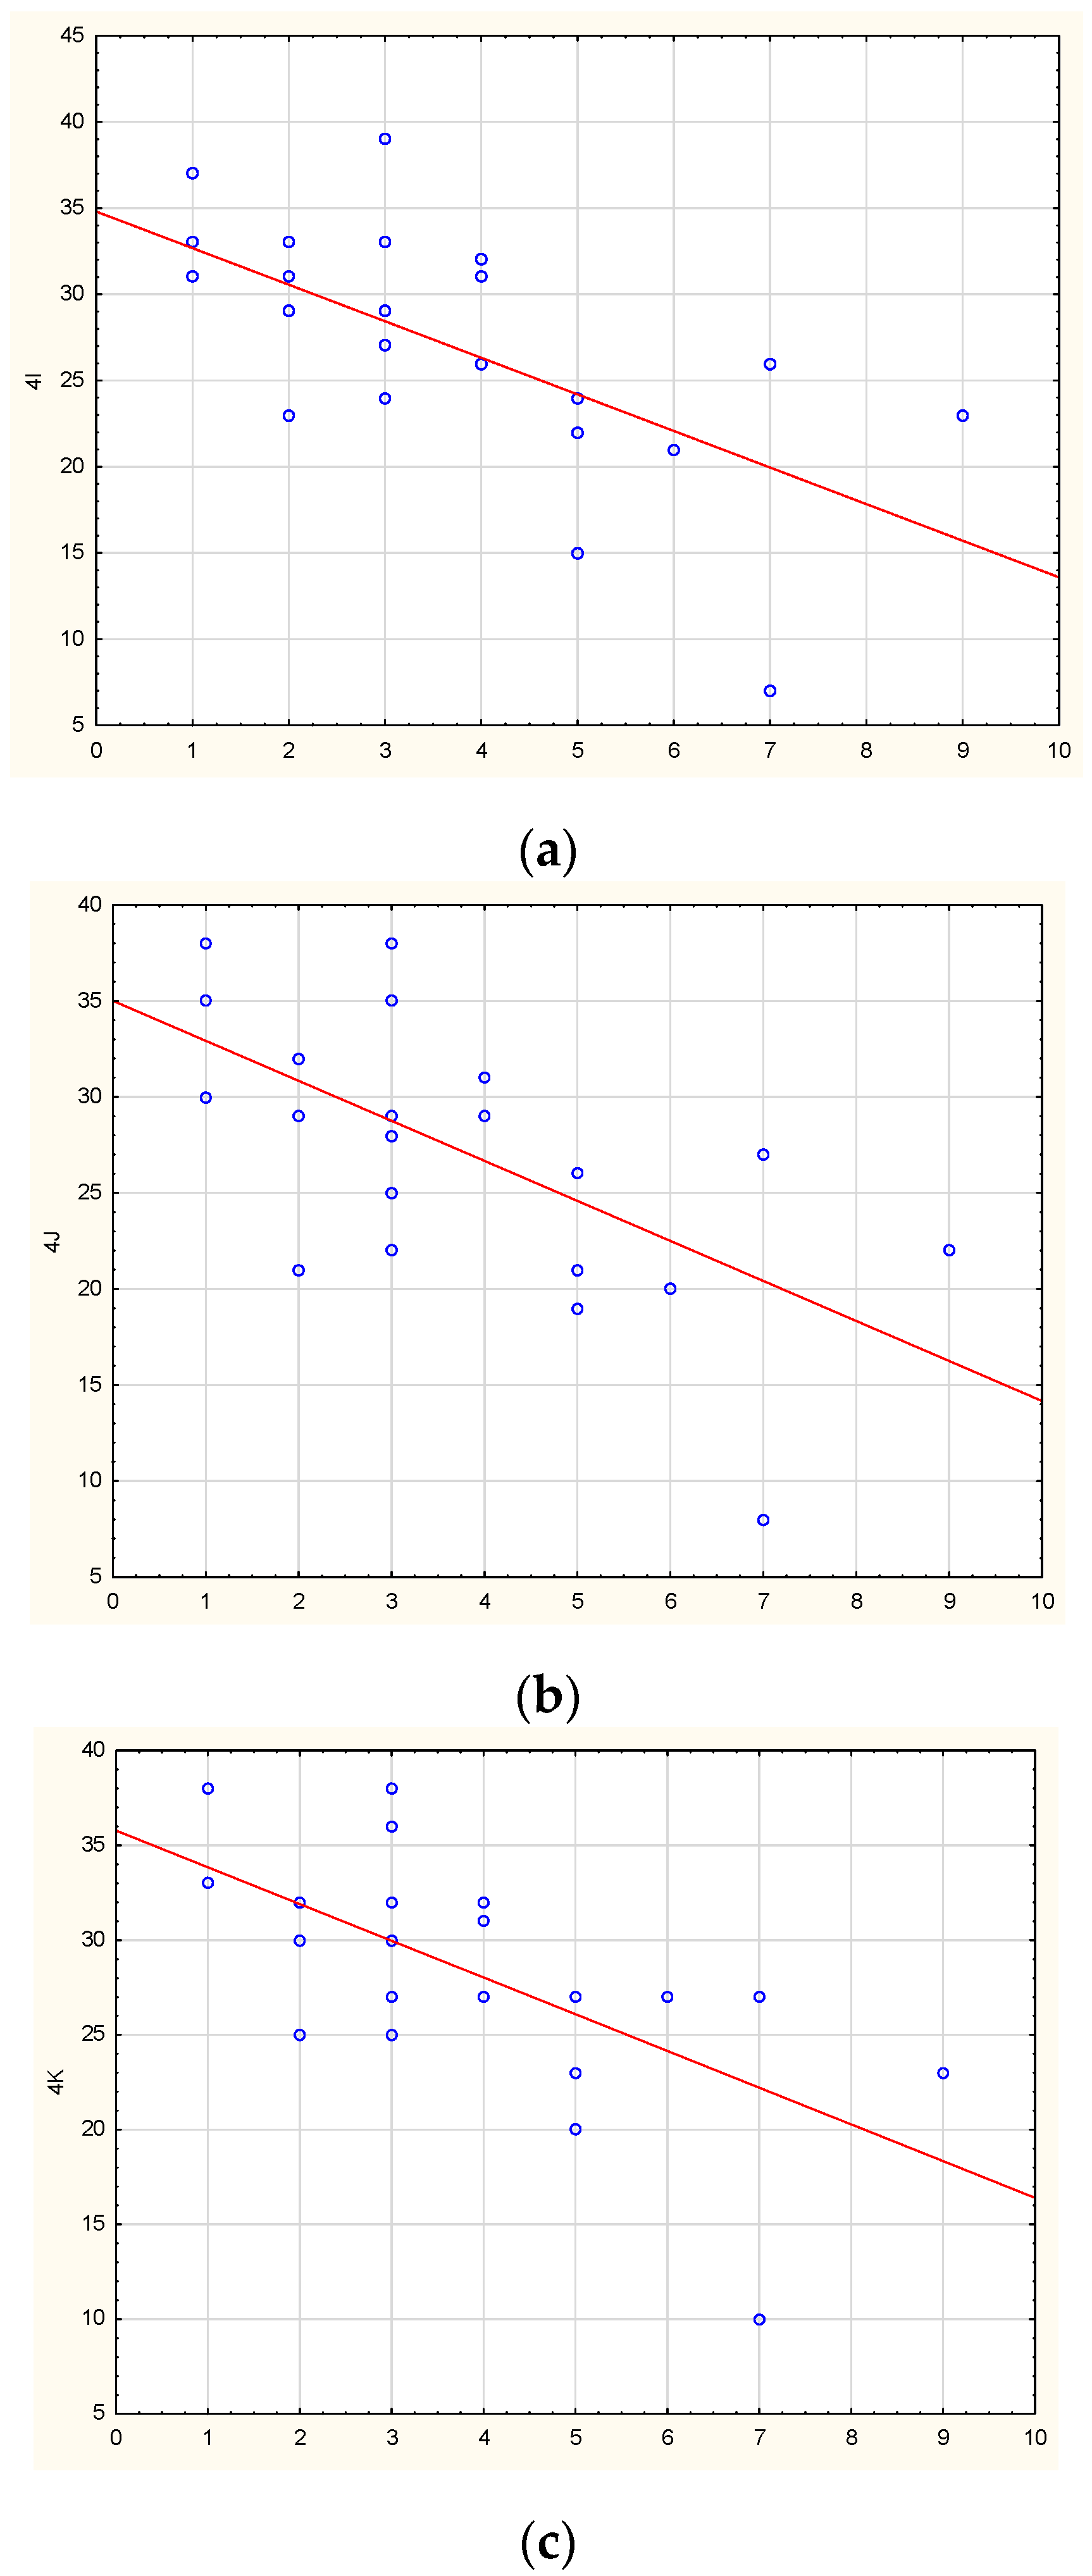
| 4I | 26 [23; 31] | 13 [9.5; 21.25] | 0.000150 |
| 4J | 28 [21.5; 30.5] | 14 [10.75; 21.5] | 0.000180 |
| 4K | 27 [25; 32] | 19 [12.75; 26] | 0.001016 |
| 4L | 10 [8; 13] | 6 [3.25; 9] | 0.000936 |
| 7A | 39 [32; 43] | 13 [9; 19] | 0.0000001 |
| Region | Forward Primer | Reverse Primer | |
|---|---|---|---|
| promoter | TAGAAGGGGTTGAAGAAGAAAATTG | AAACTCAACAAATCCTCTTTCCA | |
| intron 1 | (1) | GTTTAAGGAAAGAGATTTGATTTGG | TTACCACCTATTAACTTAACCTC |
| intron 1 | (2) | GAGGTTAAGTTAATAGGTGGTAA | AAATATCCTTAACATAAATCCCAAAA |
| intron 1 | (3) | TTTTGGGATTTATGTTAAGGATATTT | ATAACTAATAAATTCCTTTACACCAC |
| intron 2 | GTTTGTTAAAAAGGTGGATTGAGT | CTTTATACACATCACAAAAACATATC | |
Disclaimer/Publisher’s Note: The statements, opinions and data contained in all publications are solely those of the individual author(s) and contributor(s) and not of MDPI and/or the editor(s). MDPI and/or the editor(s) disclaim responsibility for any injury to people or property resulting from any ideas, methods, instructions or products referred to in the content. |
© 2023 by the authors. Licensee MDPI, Basel, Switzerland. This article is an open access article distributed under the terms and conditions of the Creative Commons Attribution (CC BY) license (https://creativecommons.org/licenses/by/4.0/).
Share and Cite
Fedotova, E.Y.; Iakovenko, E.V.; Abramycheva, N.Y.; Illarioshkin, S.N. SNCA Gene Methylation in Parkinson’s Disease and Multiple System Atrophy. Epigenomes 2023, 7, 5. https://doi.org/10.3390/epigenomes7010005
Fedotova EY, Iakovenko EV, Abramycheva NY, Illarioshkin SN. SNCA Gene Methylation in Parkinson’s Disease and Multiple System Atrophy. Epigenomes. 2023; 7(1):5. https://doi.org/10.3390/epigenomes7010005
Chicago/Turabian StyleFedotova, Ekaterina Yu., Elena V. Iakovenko, Natalia Yu. Abramycheva, and Sergey N. Illarioshkin. 2023. "SNCA Gene Methylation in Parkinson’s Disease and Multiple System Atrophy" Epigenomes 7, no. 1: 5. https://doi.org/10.3390/epigenomes7010005