
DNA Methylation Is a Potential Biomarker for Cardiometabolic Health in Mexican Children and Adolescents
 ,
,  , , , , , and
Abstract
:1. Introduction
2. Results
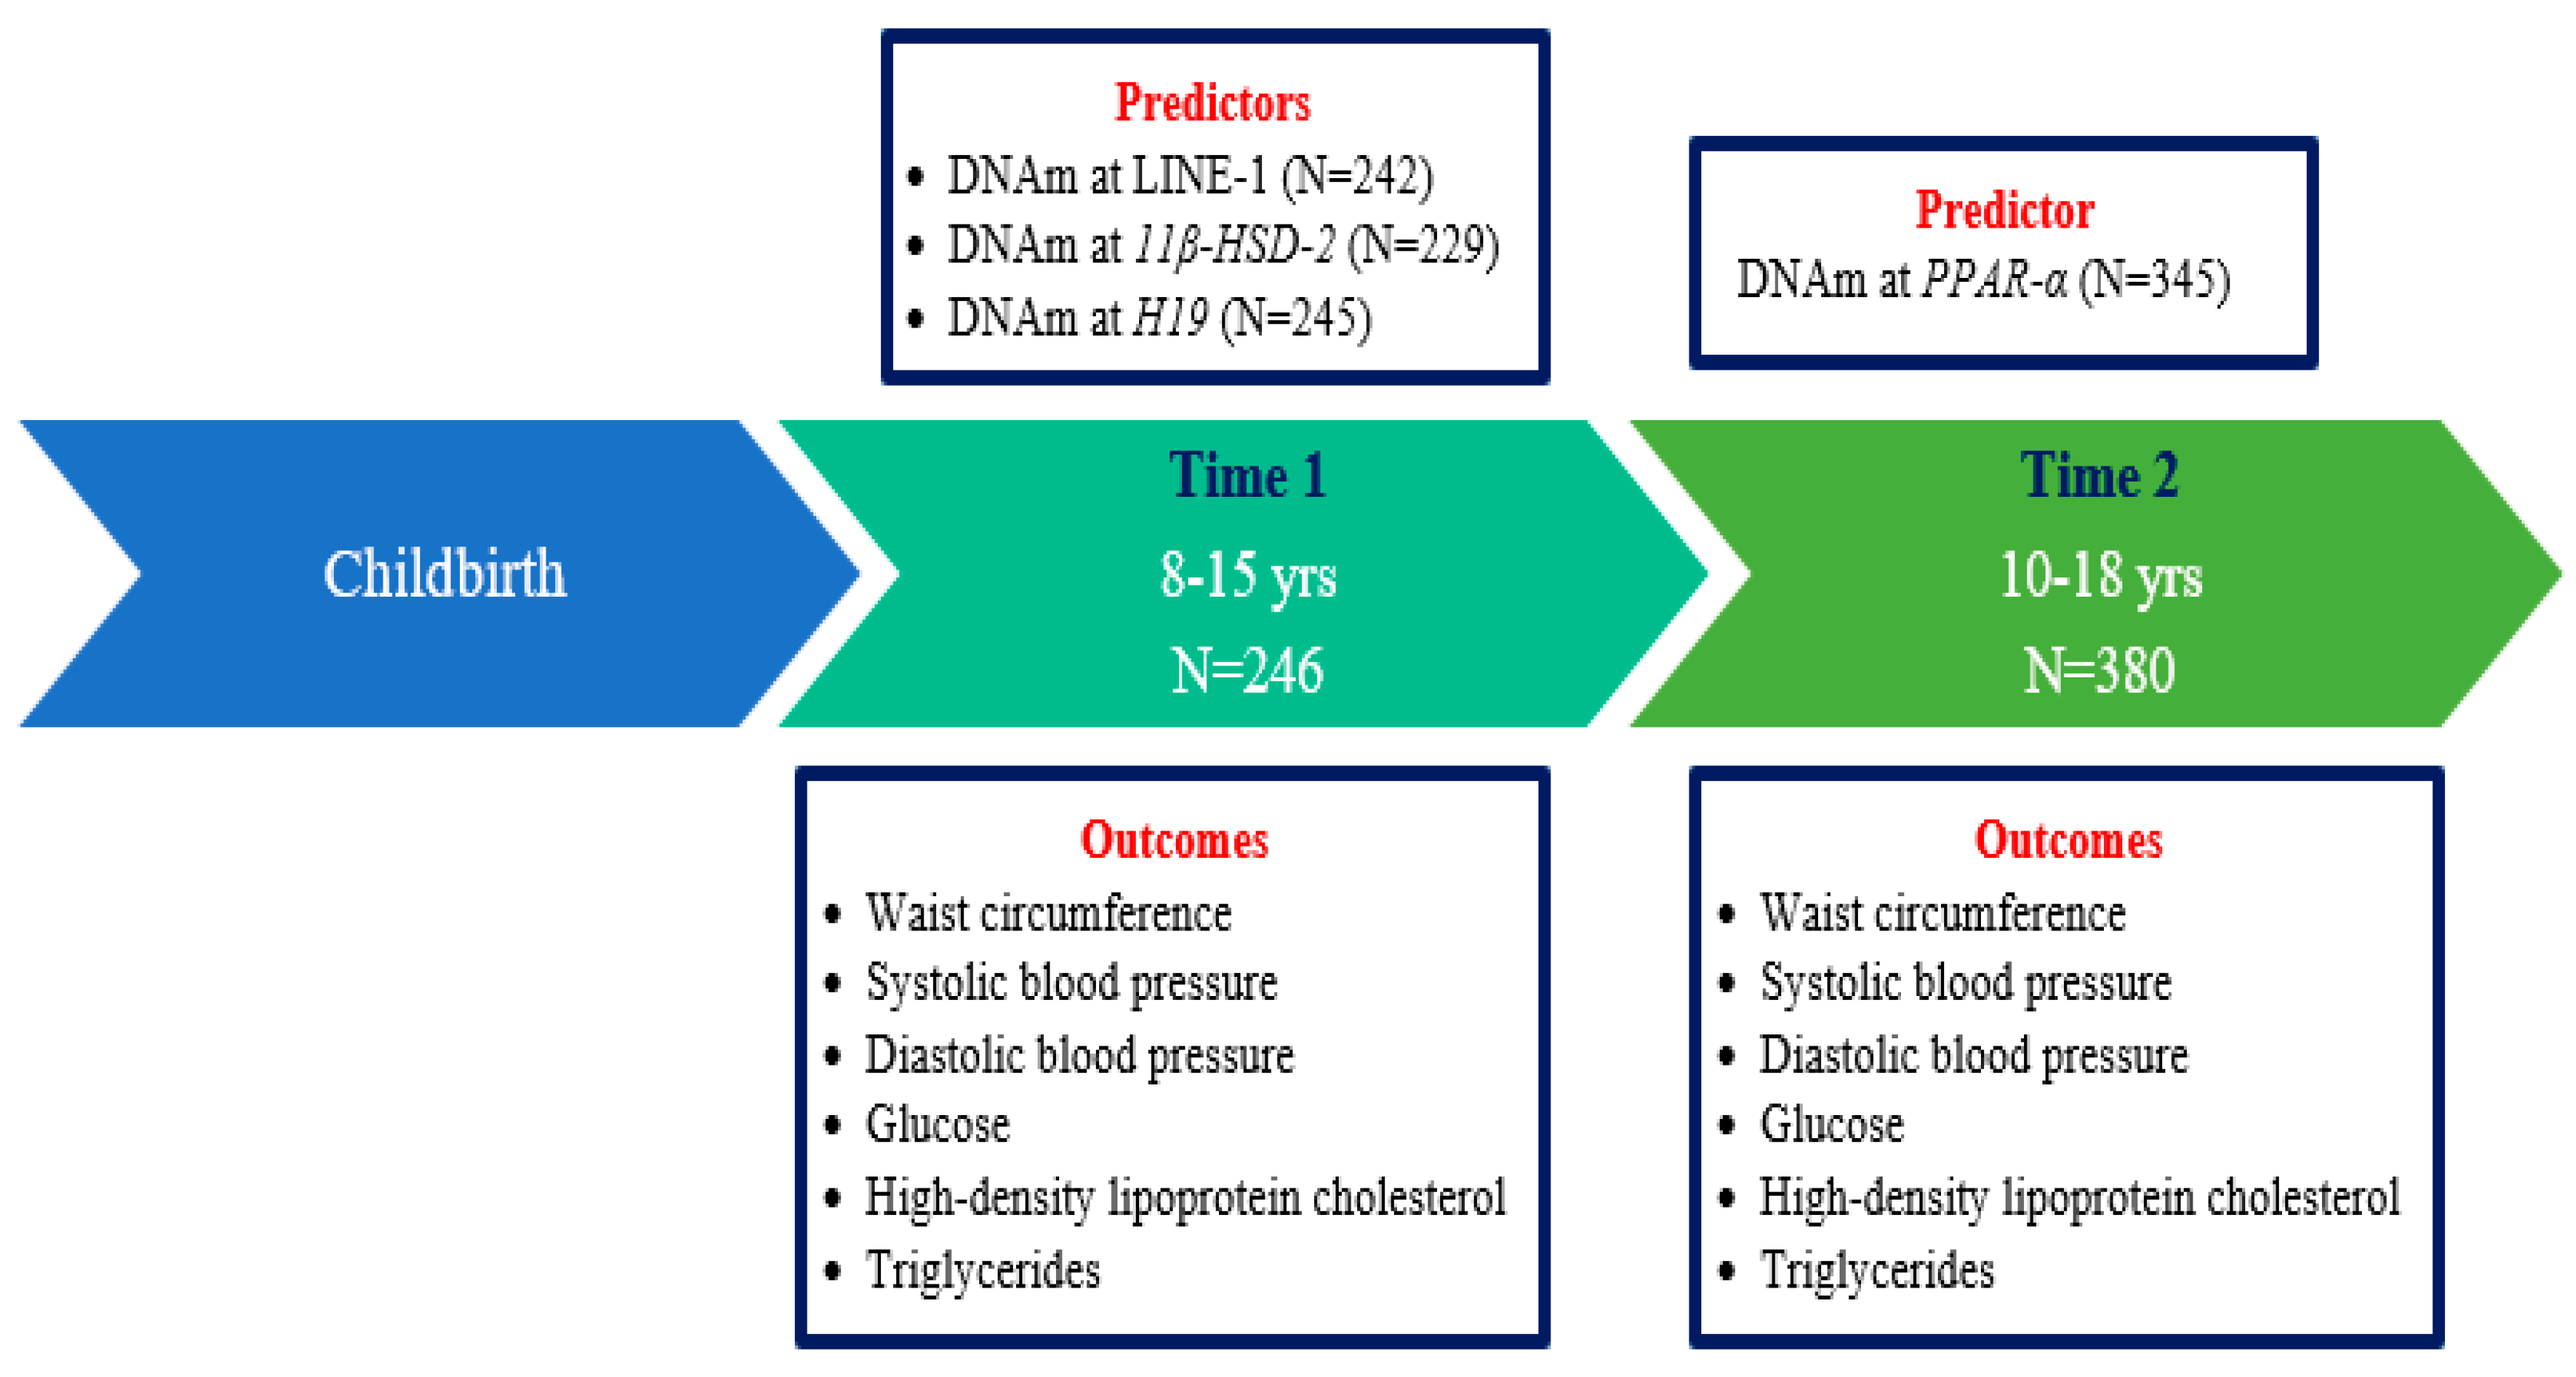
2.1. Associations between the DNAm z-Score at LINE-1 and Repeated Measures of Cardiometabolic Risk Factors
2.2. Associations between the DNAm z-Score at 11β-HSD-2 and Repeated Measures of Cardiometabolic Risk Factors
2.3. Associations between the DNAm z-Score at H19 and Repeated Measures of Cardiometabolic Risk Factors
2.4. Cross-Sectional Associations between the DNAm z-Score at PPAR-α and Cardiometabolic Risk Factors
3. Discussion
4. Materials and Methods
4.1. Study Population
4.2. Laboratory Measurements and Outcomes
4.2.1. DNA Methylation Analysis
4.2.2. Cardiometabolic Risk Factors
Anthropometric Measures
Blood Pressure Measurements
Fasting Biomarkers
4.3. Covariates
4.4. Statistical Analysis
5. Conclusions
Supplementary Materials
Author Contributions
Funding
Institutional Review Board Statement
Informed Consent Statement
Data Availability Statement
Acknowledgments
Conflicts of Interest
References
- Di Cesare, M.; Soric, M.; Bovet, P.; Miranda, J.J.; Bhutta, Z.; Stevens, G.A.; Laxmaiah, A.; Kengne, A.P.; Bentham, J. The epidemiological burden of obesity in childhood: A worldwide epidemic requiring urgent action. BMC Med. 2019, 17, 212. [Google Scholar] [CrossRef] [PubMed]
- Tavares Giannini, D.; Caetano Kuschnir, M.C.; Szklo, M. Metabolic syndrome in overweight and obese adolescents: A comparison of two different diagnostic criteria. Ann. Nutr. Metab. 2014, 64, 71–79. [Google Scholar] [CrossRef] [PubMed]
- Reinehr, T.; de Sousa, G.; Toschke, A.M.; Andler, W. Comparison of metabolic syndrome prevalence using eight different definitions: A critical approach. Arch. Dis. Child. 2007, 92, 1067–1072. [Google Scholar] [CrossRef] [PubMed]
- Flouris, A.D.; Bouziotas, C.; Christodoulos, A.D.; Koutedakis, Y. Longitudinal preventive-screening cutoffs for metabolic syndrome in adolescents. Int. J. Obes. 2008, 32, 1506–1512. [Google Scholar] [CrossRef] [PubMed]
- Alberti, K.G.; Eckel, R.H.; Grundy, S.M.; Zimmet, P.Z.; Cleeman, J.I.; Donato, K.A.; Fruchart, J.C.; James, W.P.; Loria, C.M.; Smith, S.C., Jr.; et al. Harmonizing the metabolic syndrome: A joint interim statement of the International Diabetes Federation Task Force on Epidemiology and Prevention; National Heart, Lung, and Blood Institute; American Heart Association; World Heart Federation; International Atherosclerosis Society; and International Association for the Study of Obesity. Circulation 2009, 120, 1640–1645. [Google Scholar] [CrossRef]
- Handelsman, Y. Metabolic syndrome pathophysiology and clinical presentation. Toxicol. Pathol. 2009, 37, 18–20. [Google Scholar] [CrossRef]
- Galassi, A.; Reynolds, K.; He, J. Metabolic syndrome and risk of cardiovascular disease: A meta-analysis. Am. J. Med. 2006, 119, 812–819. [Google Scholar] [CrossRef] [PubMed]
- Gami, A.S.; Witt, B.J.; Howard, D.E.; Erwin, P.J.; Gami, L.A.; Somers, V.K.; Montori, V.M. Metabolic syndrome and risk of incident cardiovascular events and death: A systematic review and meta-analysis of longitudinal studies. J. Am. Coll. Cardiol. 2007, 49, 403–414. [Google Scholar] [CrossRef]
- Ford, E.S. Risks for all-cause mortality, cardiovascular disease, and diabetes associated with the metabolic syndrome: A summary of the evidence. Diabetes Care 2005, 28, 1769–1778. [Google Scholar] [CrossRef]
- Stocks, T.; Bjorge, T.; Ulmer, H.; Manjer, J.; Haggstrom, C.; Nagel, G.; Engeland, A.; Johansen, D.; Hallmans, G.; Selmer, R.; et al. Metabolic risk score and cancer risk: Pooled analysis of seven cohorts. Int. J. Epidemiol. 2015, 44, 1353–1363. [Google Scholar] [CrossRef] [Green Version]
- Zimmet, P.; Magliano, D.; Matsuzawa, Y.; Alberti, G.; Shaw, J. The metabolic syndrome: A global public health problem and a new definition. J. Atheroscler. Thromb. 2005, 12, 295–300. [Google Scholar] [CrossRef] [PubMed]
- Hong, Y.M. Atherosclerotic cardiovascular disease beginning in childhood. Korean Circ. J. 2010, 40, 1–9. [Google Scholar] [CrossRef] [PubMed]
- Berenson, G.S.; Srinivasan, S.R.; Bao, W.; Newman, W.P., 3rd; Tracy, R.E.; Wattigney, W.A. Association between multiple cardiovascular risk factors and atherosclerosis in children and young adults. The Bogalusa Heart Study. N. Engl. J. Med. 1998, 338, 1650–1656. [Google Scholar] [CrossRef] [PubMed]
- Sinha, R.; Fisch, G.; Teague, B.; Tamborlane, W.V.; Banyas, B.; Allen, K.; Savoye, M.; Rieger, V.; Taksali, S.; Barbetta, G.; et al. Prevalence of impaired glucose tolerance among children and adolescents with marked obesity. N. Engl. J. Med. 2002, 346, 802–810. [Google Scholar] [CrossRef] [PubMed]
- Marcovecchio, M.L.; Patricelli, L.; Zito, M.; Capanna, R.; Ciampani, M.; Chiarelli, F.; Mohn, A. Ambulatory blood pressure monitoring in obese children: Role of insulin resistance. J. Hypertens. 2006, 24, 2431–2436. [Google Scholar] [CrossRef] [PubMed]
- D’Adamo, E.; Impicciatore, M.; Capanna, R.; Loredana Marcovecchio, M.; Masuccio, F.G.; Chiarelli, F.; Mohn, A.A. Liver steatosis in obese prepubertal children: A possible role of insulin resistance. Obesity (Silver Spring) 2008, 16, 677–683. [Google Scholar] [CrossRef]
- Giannini, C.; Diesse, L.; D’Adamo, E.; Chiavaroli, V.; de Giorgis, T.; Di Iorio, C.; Chiarelli, F.; Mohn, A. Influence of the Mediterranean diet on carotid intima-media thickness in hypercholesterolaemic children: A 12-month intervention study. Nutr. Metab. Cardiovasc. Dis. 2014, 24, 75–82. [Google Scholar] [CrossRef]
- Nicklas, T.A.; von Duvillard, S.P.; Berenson, G.S. Tracking of serum lipids and lipoproteins from childhood to dyslipidemia in adults: The Bogalusa Heart Study. Int. J. Sports Med. 2002, 23 (Suppl. 1), S39–S43. [Google Scholar] [CrossRef]
- Morrison, J.A.; Friedman, L.A.; Wang, P.; Glueck, C.J. Metabolic syndrome in childhood predicts adult metabolic syndrome and type 2 diabetes mellitus 25 to 30 years later. J. Pediatr. 2008, 152, 201–206. [Google Scholar] [CrossRef]
- Eloranta, A.M.; Schwab, U.; Venalainen, T.; Kiiskinen, S.; Lakka, H.M.; Laaksonen, D.E.; Lakka, T.A.; Lindi, V. Dietary quality indices in relation to cardiometabolic risk among Finnish children aged 6–8 years—The PANIC study. Nutr. Metab. Cardiovasc. Dis. 2016, 26, 833–841. [Google Scholar] [CrossRef]
- Izquierdo, A.G.; Crujeiras, A.B. Epigenetic biomarkers in metabolic syndrome and obesity. In Prognostic Epigenetics; Sharma, S., Ed.; Elsevier: Amsterdam, The Netherlands, 2019; pp. 269–287. [Google Scholar]
- Zhang, Y.; Zeng, C. Role of DNA methylation in cardiovascular diseases. Clin. Exp. Hypertens. 2016, 38, 261–267. [Google Scholar] [CrossRef]
- Costantino, S.; Libby, P.; Kishore, R.; Tardif, J.C.; El-Osta, A.; Paneni, F. Epigenetics and precision medicine in cardiovascular patients: From basic concepts to the clinical arena. Eur. Heart J. 2018, 39, 4150–4158. [Google Scholar] [CrossRef]
- Prasher, D.; Greenway, S.C.; Singh, R.B. The impact of epigenetics on cardiovascular disease. Biochem. Cell Biol. 2020, 98, 12–22. [Google Scholar] [CrossRef] [PubMed]
- Agha, G.; Mendelson, M.M.; Ward-Caviness, C.K.; Joehanes, R.; Huan, T.; Gondalia, R.; Salfati, E.; Brody, J.A.; Fiorito, G.; Bressler, J. Blood leukocyte DNA methylation predicts risk of future myocardial infarction and coronary heart disease: A longitudinal study of 11 461 participants from population-based cohorts. Circulation 2019, 140, 645–657. [Google Scholar] [CrossRef] [PubMed]
- Duan, L.; Liu, C.; Hu, J.; Liu, Y.; Wang, J.; Chen, G.; Li, Z.; Chen, H. Epigenetic mechanisms in coronary artery disease: The current state and prospects. Trends Cardiovasc. Med. 2018, 28, 311–319. [Google Scholar] [CrossRef] [PubMed]
- van der Harst, P.; de Windt, L.J.; Chambers, J.C. Translational Perspective on Epigenetics in Cardiovascular Disease. J. Am. Coll. Cardiol. 2017, 70, 590–606. [Google Scholar] [CrossRef]
- Samblas, M.; Milagro, F.I.; Martinez, A. DNA methylation markers in obesity, metabolic syndrome, and weight loss. Epigenetics 2019, 14, 421–444. [Google Scholar] [CrossRef]
- Soler-Botija, C.; Galvez-Monton, C.; Bayes-Genis, A. Epigenetic Biomarkers in Cardiovascular Diseases. Front. Genet. 2019, 10, 950. [Google Scholar] [CrossRef]
- Chen, J.; Sun, H.; Tang, W.; Zhou, L.; Xie, X.; Qu, Z.; Chen, M.; Wang, S.; Yang, T.; Dai, Y.; et al. DNA methylation biomarkers in stool for early screening of colorectal cancer. J. Cancer 2019, 10, 5264–5271. [Google Scholar] [CrossRef]
- Crujeiras, A.B.; Diaz-Lagares, A. DNA methylation in obesity and associated diseases. In Epigenetic Biomarkers and Diagnostics; Elsevier: Amsterdam, The Netherlands, 2016; pp. 313–329. [Google Scholar]
- Kim, M.; Long, T.I.; Arakawa, K.; Wang, R.; Yu, M.C.; Laird, P.W. DNA methylation as a biomarker for cardiovascular disease risk. PLoS ONE 2010, 5, e9692. [Google Scholar] [CrossRef] [Green Version]
- Westerman, K.; Sebastiani, P.; Jacques, P.; Liu, S.; DeMeo, D.; Ordovas, J.M. DNA methylation modules associate with incident cardiovascular disease and cumulative risk factor exposure. Clin. Epigenetics 2019, 11, 142. [Google Scholar] [CrossRef] [PubMed]
- Antoun, E.; Issarapu, P.; di Gravio, C.; Shrestha, S.; Betts, M.; Saffari, A.; Sahariah, S.A.; Sankareswaran, A.; Arumalla, M.; Prentice, A.M.; et al. DNA methylation signatures associated with cardiometabolic risk factors in children from India and The Gambia: Results from the EMPHASIS study. Clin. Epigenetics 2022, 14, 6. [Google Scholar] [CrossRef]
- Day, S.E.; Coletta, R.L.; Kim, J.Y.; Garcia, L.A.; Campbell, L.E.; Benjamin, T.R.; Roust, L.R.; De Filippis, E.A.; Mandarino, L.J.; Coletta, D.K. Potential epigenetic biomarkers of obesity-related insulin resistance in human whole-blood. Epigenetics 2017, 12, 254–263. [Google Scholar] [CrossRef]
- Costantino, S.; Mohammed, S.A.; Ambrosini, S.; Paneni, F. Epigenetic processing in cardiometabolic disease. Atherosclerosis 2019, 281, 150–158. [Google Scholar] [CrossRef] [PubMed]
- Li, E.; Zhang, Y. DNA methylation in mammals. Cold Spring Harb. Perspect. Biol. 2014, 6, a019133. [Google Scholar] [CrossRef]
- Han, L.; Zhang, H.; Kaushal, A.; Rezwan, F.I.; Kadalayil, L.; Karmaus, W.; Henderson, A.J.; Relton, C.L.; Ring, S.; Arshad, S.H.; et al. Changes in DNA methylation from pre- to post-adolescence are associated with pubertal exposures. Clin. Epigenetics 2019, 11, 176. [Google Scholar] [CrossRef] [PubMed]
- Wu, Y.; Peterson, K.E.; Sanchez, B.N.; Dolinoy, D.C.; Mercado-Garcia, A.; Tellez-Rojo, M.M.; Goodrich, J.M. Association of blood leukocyte DNA methylation at LINE-1 and growth-related candidate genes with pubertal onset and progression. Epigenetics 2018, 13, 1222–1233. [Google Scholar] [CrossRef]
- Goran, M.I.; Gower, B.A. Longitudinal study on pubertal insulin resistance. Diabetes 2001, 50, 2444–2450. [Google Scholar] [CrossRef]
- Magge, S.N.; Goodman, E.; Armstrong, S.C.; Committee On, N.; Section On, E.; Section On, O. The Metabolic Syndrome in Children and Adolescents: Shifting the Focus to Cardiometabolic Risk Factor Clustering. Pediatrics 2017, 140, e20171603. [Google Scholar] [CrossRef]
- Ardeljan, D.; Taylor, M.S.; Ting, D.T.; Burns, K.H. The Human Long Interspersed Element-1 Retrotransposon: An Emerging Biomarker of Neoplasia. Clin. Chem. 2017, 63, 816–822. [Google Scholar] [CrossRef] [Green Version]
- Beck, C.R.; Garcia-Perez, J.L.; Badge, R.M.; Moran, J.V. LINE-1 elements in structural variation and disease. Annu. Rev. Genom. Hum. Genet. 2011, 12, 187–215. [Google Scholar] [CrossRef] [PubMed]
- Sant, K.E.; Goodrich, J.M. Methods for Analysis of DNA Methylation. In Toxicoepigenetics; McCullough, S.D., Dolinoy, D.C., Eds.; Elsevier: Amsterdam, The Netherlands, 2019; pp. 347–377. [Google Scholar]
- Muka, T.; Koromani, F.; Portilla, E.; O’Connor, A.; Bramer, W.M.; Troup, J.; Chowdhury, R.; Dehghan, A.; Franco, O.H. The role of epigenetic modifications in cardiovascular disease: A systematic review. Int. J. Cardiol. 2016, 212, 174–183. [Google Scholar] [CrossRef] [PubMed]
- Lai, S.; Du, K.; Shi, Y.; Li, C.; Wang, G.; Hu, S.; Jia, X.; Wang, J.; Chen, S. Long Non-Coding RNAs in Brown Adipose Tissue. Diabetes Metab. Syndr. Obes. 2020, 13, 3193–3204. [Google Scholar] [CrossRef] [PubMed]
- Schmidt, E.; Dhaouadi, I.; Gaziano, I.; Oliverio, M.; Klemm, P.; Awazawa, M.; Mitterer, G.; Fernandez-Rebollo, E.; Pradas-Juni, M.; Wagner, W.; et al. LincRNA H19 protects from dietary obesity by constraining expression of monoallelic genes in brown fat. Nat. Commun. 2018, 9, 3622. [Google Scholar] [CrossRef] [PubMed]
- Huang, R.C.; Galati, J.C.; Burrows, S.; Beilin, L.J.; Li, X.; Pennell, C.E.; van Eekelen, J.; Mori, T.A.; Adams, L.A.; Craig, J.M. DNA methylation of the IGF2/H19 imprinting control region and adiposity distribution in young adults. Clin. Epigenetics 2012, 4, 21. [Google Scholar] [CrossRef]
- Bowman, A.; Peterson, K.E.; Dolinoy, D.C.; Meeker, J.D.; Sanchez, B.N.; Mercado-Garcia, A.; Tellez-Rojo, M.M.; Goodrich, J.M. Phthalate Exposures, DNA Methylation and Adiposity in Mexican Children Through Adolescence. Front. Public Health 2019, 7, 162. [Google Scholar] [CrossRef]
- Bray, G.A.; Heisel, W.E.; Afshin, A.; Jensen, M.D.; Dietz, W.H.; Long, M.; Kushner, R.F.; Daniels, S.R.; Wadden, T.A.; Tsai, A.G.; et al. The Science of Obesity Management: An Endocrine Society Scientific Statement. Endocr. Rev. 2018, 39, 79–132. [Google Scholar] [CrossRef]
- Patel, H.; Dhangar, K.; Sonawane, Y.; Surana, S.; Karpoormath, R.; Thapliyal, N.; Shaikh, M.; Noolvi, M.; Jagtap, R. In search of selective 11β-HSD type 1 inhibitors without nephrotoxicity: An approach to resolve the metabolic syndrome by virtual based screening. Arab. J. Chem. 2018, 11, 221–232. [Google Scholar] [CrossRef]
- Hintzpeter, J.; Stapelfeld, C.; Loerz, C.; Martin, H.J.; Maser, E. Green tea and one of its constituents, Epigallocatechine-3-gallate, are potent inhibitors of human 11beta-hydroxysteroid dehydrogenase type 1. PLoS ONE 2014, 9, e84468. [Google Scholar] [CrossRef]
- Friso, S.; Pizzolo, F.; Choi, S.W.; Guarini, P.; Castagna, A.; Ravagnani, V.; Carletto, A.; Pattini, P.; Corrocher, R.; Olivieri, O. Epigenetic control of 11 beta-hydroxysteroid dehydrogenase 2 gene promoter is related to human hypertension. Atherosclerosis 2008, 199, 323–327. [Google Scholar] [CrossRef]
- Drake, A.J.; McPherson, R.C.; Godfrey, K.M.; Cooper, C.; Lillycrop, K.A.; Hanson, M.A.; Meehan, R.R.; Seckl, J.R.; Reynolds, R.M. An unbalanced maternal diet in pregnancy associates with offspring epigenetic changes in genes controlling glucocorticoid action and foetal growth. Clin. Endocrinol. 2012, 77, 808–815. [Google Scholar] [CrossRef] [PubMed]
- Krupp, D.; Shi, L.; Maser-Gluth, C.; Pietzarka, M.; Remer, T. 11beta Hydroxysteroid dehydrogenase type 2 and dietary acid load are independently associated with blood pressure in healthy children and adolescents. Am. J. Clin. Nutr. 2013, 97, 612–620. [Google Scholar] [CrossRef]
- Mussig, K.; Remer, T.; Haupt, A.; Gallwitz, B.; Fritsche, A.; Haring, H.U.; Maser-Gluth, C. 11beta-hydroxysteroid dehydrogenase 2 activity is elevated in severe obesity and negatively associated with insulin sensitivity. Obesity (Silver Spring) 2008, 16, 1256–1260. [Google Scholar] [CrossRef]
- Jang, C.; Obeyesekere, V.R.; Dilley, R.J.; Krozowski, Z.; Inder, W.J.; Alford, F.P. Altered activity of 11beta-hydroxysteroid dehydrogenase types 1 and 2 in skeletal muscle confers metabolic protection in subjects with type 2 diabetes. J. Clin. Endocrinol. Metab. 2007, 92, 3314–3320. [Google Scholar] [CrossRef]
- Barbosa-Cortes, L.; Villasis-Keever, M.A.; Del Prado-Manriquez, M.; Lopez-Alarcon, M. Adiposity and Insulin Resistance in Children from a Rural Community in Mexico. Arch. Med. Res. 2015, 46, 214–220. [Google Scholar] [CrossRef] [PubMed]
- Bougarne, N.; Weyers, B.; Desmet, S.J.; Deckers, J.; Ray, D.W.; Staels, B.; De Bosscher, K. Molecular Actions of PPARalpha in Lipid Metabolism and Inflammation. Endocr. Rev. 2018, 39, 760–802. [Google Scholar] [CrossRef]
- Burri, L.; Thoresen, G.H.; Berge, R.K. The Role of PPARalpha Activation in Liver and Muscle. PPAR Res. 2010, 2010, 542359. [Google Scholar] [CrossRef]
- Castellano-Castillo, D.; Moreno-Indias, I.; Sanchez-Alcoholado, L.; Ramos-Molina, B.; Alcaide-Torres, J.; Morcillo, S.; Ocana-Wilhelmi, L.; Tinahones, F.; Queipo-Ortuno, M.I.; Cardona, F. Altered Adipose Tissue DNA Methylation Status in Metabolic Syndrome: Relationships Between Global DNA Methylation and Specific Methylation at Adipogenic, Lipid Metabolism and Inflammatory Candidate Genes and Metabolic Variables. J. Clin. Med. 2019, 8, 87. [Google Scholar] [CrossRef] [PubMed]
- Contreras, A.V.; Torres, N.; Tovar, A.R. PPAR-alpha as a key nutritional and environmental sensor for metabolic adaptation. Adv. Nutr. 2013, 4, 439–452. [Google Scholar] [CrossRef]
- Guarrera, S.; Fiorito, G.; Onland-Moret, N.C.; Russo, A.; Agnoli, C.; Allione, A.; Di Gaetano, C.; Mattiello, A.; Ricceri, F.; Chiodini, P.; et al. Gene-specific DNA methylation profiles and LINE-1 hypomethylation are associated with myocardial infarction risk. Clin. Epigenetics 2015, 7, 133. [Google Scholar] [CrossRef] [Green Version]
- Wei, L.; Liu, S.; Su, Z.; Cheng, R.; Bai, X.; Li, X. LINE-1 hypomethylation is associated with the risk of coronary heart disease in Chinese population. Arq. Bras. Cardiol. 2014, 102, 481–488. [Google Scholar] [CrossRef]
- Baccarelli, A.; Wright, R.; Bollati, V.; Litonjua, A.; Zanobetti, A.; Tarantini, L.; Sparrow, D.; Vokonas, P.; Schwartz, J. Ischemic heart disease and stroke in relation to blood DNA methylation. Epidemiology 2010, 21, 819–828. [Google Scholar] [CrossRef] [PubMed]
- María Martín-Núñez, G.; Rubio-Martín, E.; Cabrera-Mulero, R.; Rojo-Martínez, G.; Olveira, G.; Valdés, S.; Soriguer, F.; Castano, L.; Morcillo, S. Type 2 diabetes mellitus in relation to global LINE-1 DNA methylation in peripheral blood: A cohort study. Epigenetics 2014, 9, 1322–1328. [Google Scholar] [CrossRef] [PubMed]
- Turcot, V.; Tchernof, A.; Deshaies, Y.; Perusse, L.; Belisle, A.; Marceau, S.; Biron, S.; Lescelleur, O.; Biertho, L.; Vohl, M.C. LINE-1 methylation in visceral adipose tissue of severely obese individuals is associated with metabolic syndrome status and related phenotypes. Clin. Epigenetics 2012, 4, 10. [Google Scholar] [CrossRef] [PubMed]
- Perng, W.; Mora-Plazas, M.; Marin, C.; Rozek, L.S.; Baylin, A.; Villamor, E. A prospective study of LINE-1DNA methylation and development of adiposity in school-age children. PLoS ONE 2013, 8, e62587. [Google Scholar] [CrossRef]
- Dunstan, J.; Bressler, J.P.; Moran, T.H.; Pollak, J.S.; Hirsch, A.G.; Bailey-Davis, L.; Glass, T.A.; Schwartz, B.S. Associations of LEP, CRH, ICAM-1, and LINE-1 methylation, measured in saliva, with waist circumference, body mass index, and percent body fat in mid-childhood. Clin. Epigenetics 2017, 9, 29. [Google Scholar] [CrossRef]
- Rezaei, M.; Andrieu, T.; Neuenschwander, S.; Bruggmann, R.; Mordasini, D.; Frey, F.J.; Vogt, B.; Frey, B.M. Regulation of 11beta-hydroxysteroid dehydrogenase type 2 by microRNA. Hypertension 2014, 64, 860–866. [Google Scholar] [CrossRef]
- Campino, C.; Martinez-Aguayo, A.; Baudrand, R.; Carvajal, C.A.; Aglony, M.; Garcia, H.; Padilla, O.; Kalergis, A.M.; Fardella, C.E. Age-related changes in 11beta-hydroxysteroid dehydrogenase type 2 activity in normotensive subjects. Am. J. Hypertens. 2013, 26, 481–487. [Google Scholar] [CrossRef]
- Kargl, C.; Arshad, M.; Salman, F.; Schurman, R.C.; Del Corral, P. 11beta-hydroxysteroid dehydrogenase type-II activity is affected by grapefruit juice and intense muscular work. Arch. Endocrinol. Metab. 2017, 61, 556–561. [Google Scholar] [CrossRef] [PubMed]
- Huang, Y.; Pastor, W.A.; Shen, Y.; Tahiliani, M.; Liu, D.R.; Rao, A. The behaviour of 5-hydroxymethylcytosine in bisulfite sequencing. PLoS ONE 2010, 5, e8888. [Google Scholar] [CrossRef] [Green Version]
- Breton, C.V.; Marsit, C.J.; Faustman, E.; Nadeau, K.; Goodrich, J.M.; Dolinoy, D.C.; Herbstman, J.; Holland, N.; LaSalle, J.M.; Schmidt, R.; et al. Small-Magnitude Effect Sizes in Epigenetic End Points are Important in Children’s Environmental Health Studies: The Children’s Environmental Health and Disease Prevention Research Center’s Epigenetics Working Group. Environ. Health Perspect. 2017, 125, 511–526. [Google Scholar] [CrossRef] [PubMed]
- Perng, W.; Tamayo-Ortiz, M.; Tang, L.; Sanchez, B.N.; Cantoral, A.; Meeker, J.D.; Dolinoy, D.C.; Roberts, E.F.; Martinez-Mier, E.A.; Lamadrid-Figueroa, H.; et al. Early Life Exposure in Mexico to ENvironmental Toxicants (ELEMENT) Project. BMJ Open 2019, 9, e030427. [Google Scholar] [CrossRef]
- Wu, Y.; Goodrich, J.M.; Dolinoy, D.C.; Sanchez, B.N.; Ruiz-Narvaez, E.A.; Banker, M.; Cantoral, A.; Mercado-Garcia, A.; Tellez-Rojo, M.M.; Peterson, K.E. Accelerometer-measured Physical Activity, Reproductive Hormones, and DNA Methylation. Med. Sci. Sports Exerc. 2020, 52, 598–607. [Google Scholar] [CrossRef] [PubMed]
- Grunau, C.; Clark, S.J.; Rosenthal, A. Bisulfite genomic sequencing: Systematic investigation of critical experimental parameters. Nucleic Acids Res. 2001, 29, e65. [Google Scholar] [CrossRef]
- Goodrich, J.M.; Sanchez, B.N.; Dolinoy, D.C.; Zhang, Z.; Hernandez-Avila, M.; Hu, H.; Peterson, K.E.; Tellez-Rojo, M.M. Quality control and statistical modeling for environmental epigenetics: A study on in utero lead exposure and DNA methylation at birth. Epigenetics 2015, 10, 19–30. [Google Scholar] [CrossRef] [PubMed]
- Virani, S.; Dolinoy, D.C.; Halubai, S.; Jones, T.R.; Domino, S.E.; Rozek, L.S.; Nahar, M.S.; Padmanabhan, V. Delivery type not associated with global methylation at birth. Clin. Epigenetics 2012, 4, 8. [Google Scholar] [CrossRef] [PubMed]
- Hoyo, C.; Murtha, A.P.; Schildkraut, J.M.; Jirtle, R.L.; Demark-Wahnefried, W.; Forman, M.R.; Iversen, E.S.; Kurtzberg, J.; Overcash, F.; Huang, Z.; et al. Methylation variation at IGF2 differentially methylated regions and maternal folic acid use before and during pregnancy. Epigenetics 2011, 6, 928–936. [Google Scholar] [CrossRef]
- Goodrich, J.M.; Dolinoy, D.C.; Sanchez, B.N.; Zhang, Z.; Meeker, J.D.; Mercado-Garcia, A.; Solano-Gonzalez, M.; Hu, H.; Tellez-Rojo, M.M.; Peterson, K.E. Adolescent epigenetic profiles and environmental exposures from early life through peri-adolescence. Environ. Epigenet. 2016, 2, dvw018. [Google Scholar] [CrossRef]
- Jansen, E.C.; Dolinoy, D.; Peterson, K.E.; O’Brien, L.M.; Chervin, R.D.; Cantoral, A.; Tellez-Rojo, M.M.; Solano-Gonzalez, M.; Goodrich, J. Adolescent sleep timing and dietary patterns in relation to DNA methylation of core circadian genes: A pilot study of Mexican youth. Epigenetics 2021, 16, 894–907. [Google Scholar] [CrossRef]
- Betanzos-Robledo, L.; Rodriguez-Carmona, Y.; Contreras-Manzano, A.; Lamadrid-Figueroa, H.; Jansen, E.; Tellez-Rojo, M.M.; Perng, W.; Peterson, K.; Hebert, J.R.; Shivappa, N.; et al. Greater cumulative exposure to a pro-inflammatory diet is associated with higher metabolic syndrome score and blood pressure in young Mexican adults. Nutr. Res. 2020, 81, 81–89. [Google Scholar] [CrossRef]
- Perng, W.; Fernandez, C.; Peterson, K.E.; Zhang, Z.; Cantoral, A.; Sanchez, B.N.; Solano-Gonzalez, M.; Tellez-Rojo, M.M.; Baylin, A. Dietary Patterns Exhibit Sex-Specific Associations with Adiposity and Metabolic Risk in a Cross-Sectional Study in Urban Mexican Adolescents. J. Nutr. 2017, 147, 1977–1985. [Google Scholar] [CrossRef]
- Kasper, N.; Peterson, K.E.; Zhang, Z.; Ferguson, K.K.; Sanchez, B.N.; Cantoral, A.; Meeker, J.D.; Tellez-Rojo, M.M.; Pawlowski, C.M.; Ettinger, A.S. Association of Bisphenol A Exposure with Breastfeeding and Perceived Insufficient Milk Supply in Mexican Women. Matern. Child Health J. 2016, 20, 1713–1719. [Google Scholar] [CrossRef]
- Ettinger, A.S.; Lamadrid-Figueroa, H.; Mercado-Garcia, A.; Kordas, K.; Wood, R.J.; Peterson, K.E.; Hu, H.; Hernandez-Avila, M.; Tellez-Rojo, M.M. Effect of calcium supplementation on bone resorption in pregnancy and the early postpartum: A randomized controlled trial in Mexican women. Nutr. J. 2014, 13, 116. [Google Scholar] [CrossRef]
- Rodriguez-Ramirez, S.; Mundo-Rosas, V.; Jimenez-Aguilar, A.; Shamah-Levy, T. Methodology for the analysis of dietary data from the Mexican National Health and Nutrition Survey 2006. Salud Publica Mex. 2009, 51 (Suppl. 4), S523–S529. [Google Scholar] [CrossRef] [PubMed]
- Ramírez Silva, I.; Barragán-Vázquez, S.; Rodríguez-Ramírez, S.; Rivera-Dommarco, J.A.; Mejía-Rodríguez, F.; Barquera-Cervera, S.; Tolentino-Mayo, L.; Flores-Aldana, M.; Villalpando-Hernández, S.; Ancira-Moreno, M. Base de Alimentos de México (BAM): Compilación de la Composición de los Alimentos Frecuentemente Consumidos en el país, Version 18.1.1. 2021. Available online: https://insp.mx/informacion-relevante/bam-bienvenida (accessed on 1 January 2023).
- Hernández, B.; Gortmaker, S.L.; Laird, N.M.; Colditz, G.A.; Parra-Cabrera, S.; Peterson, K.E. Validez y reproducibilidad de un cuestionario de actividad e inactividad física para escolares de la ciudad de México. Salud Pública México 2000, 42, 315–323. [Google Scholar] [CrossRef]
- Ainsworth, B.E.; Haskell, W.L.; Whitt, M.C.; Irwin, M.L.; Swartz, A.M.; Strath, S.J.; O’Brien, W.L.; Bassett, D.R., Jr.; Schmitz, K.H.; Emplaincourt, P.O.; et al. Compendium of physical activities: An update of activity codes and MET intensities. Med. Sci. Sports Exerc. 2000, 32, S498–S504. [Google Scholar] [CrossRef] [PubMed]
- Marshall, W.A.; Tanner, J.M. Variations in pattern of pubertal changes in girls. Arch. Dis. Child. 1969, 44, 291–303. [Google Scholar] [CrossRef]
- Marshall, W.A.; Tanner, J.M. Variations in the pattern of pubertal changes in boys. Arch. Dis. Child. 1970, 45, 13–23. [Google Scholar] [CrossRef]
- Chavarro, J.E.; Watkins, D.J.; Afeiche, M.C.; Zhang, Z.; Sanchez, B.N.; Cantonwine, D.; Mercado-Garcia, A.; Blank-Goldenberg, C.; Meeker, J.D.; Tellez-Rojo, M.M.; et al. Validity of Self-Assessed Sexual Maturation Against Physician Assessments and Hormone Levels. J. Pediatr. 2017, 186, 172–178.e173. [Google Scholar] [CrossRef]
- LaBarre, J.L.; Peterson, K.E.; Kachman, M.T.; Perng, W.; Tang, L.; Hao, W.; Zhou, L.; Karnovsky, A.; Cantoral, A.; Tellez-Rojo, M.M.; et al. Mitochondrial Nutrient Utilization Underlying the Association Between Metabolites and Insulin Resistance in Adolescents. J. Clin. Endocrinol. Metab. 2020, 105, 2442–2455. [Google Scholar] [CrossRef]
- Aljahdali, A.A.; Peterson, K.E.; Cantoral, A.; Ruiz-Narvaez, E.; Tellez-Rojo, M.M.; Kim, H.M.; Hebert, J.R.; Wirth, M.D.; Torres-Olascoaga, L.A.; Shivappa, N.; et al. Diet Quality Scores and Cardiometabolic Risk Factors in Mexican Children and Adolescents: A Longitudinal Analysis. Nutrients 2022, 14, 896. [Google Scholar] [CrossRef] [PubMed]
- Aljahdali, A.A.; Baylin, A.; Ruiz-Narvaez, E.A.; Kim, H.M.; Cantoral, A.; Tellez-Rojo, M.M.; Banker, M.; Peterson, K.E. Sedentary patterns and cardiometabolic risk factors in Mexican children and adolescents: Analysis of longitudinal data. Int. J. Behav. Nutr. Phys. Act. 2022, 19, 143. [Google Scholar] [CrossRef] [PubMed]
- Needham, B.L.; Smith, J.A.; Zhao, W.; Wang, X.; Mukherjee, B.; Kardia, S.L.; Shively, C.A.; Seeman, T.E.; Liu, Y.; Diez Roux, A.V. Life course socioeconomic status and DNA methylation in genes related to stress reactivity and inflammation: The multi-ethnic study of atherosclerosis. Epigenetics 2015, 10, 958–969. [Google Scholar] [CrossRef] [PubMed]
- Smith, J.A.; Zhao, W.; Wang, X.; Ratliff, S.M.; Mukherjee, B.; Kardia, S.L.R.; Liu, Y.; Roux, A.V.D.; Needham, B.L. Neighborhood characteristics influence DNA methylation of genes involved in stress response and inflammation: The Multi-Ethnic Study of Atherosclerosis. Epigenetics 2017, 12, 662–673. [Google Scholar] [CrossRef] [PubMed] [Green Version]


| Time 1 n = 246 | Time 2 n = 380 | |
|---|---|---|
| Maternal Characteristics (At Time of Child’s Birth) | ||
| Years of education, % | ||
| <12 years | 121 (49.19) 1 | 196 (51.58) 2 |
| 12 years | 90 (36.59) 1 | 131 (34.47) 2 |
| >12 years | 34 (13.82) 1 | 52 (13.68) 2 |
| Age at childbirth, (years) | 26.86 (5.64) 1 | 26.47 (5.46) 2 |
| Parity, % | ||
| 1 | 90 (36.59) 1 | 144 (37.89) 2 |
| 2 | 89 (36.18) 1 | 135 (35.53) 2 |
| ≥3 | 66 (26.83) 1 | 100 (26.32) 2 |
| Marital status, % | ||
| Married | 175 (71.14) 1 | 274 (72.11) 2 |
| Other | 70 (28.46) 1 | 105 (27.63) 2 |
| Enrollment in calcium supplementation study, % | ||
| Not enrolled | 152 (61.79) 1 | 257 (67.63) 2 |
| Enrolled | 93 (37.80) 1 | 122 (32.11) 2 |
| Child Characteristics (At birth) | ||
| Female, % | 131 (53.25) | 195 (51.32) |
| Gestation age, (weeks) | 38.85 (1.49) 3 | 38.79 (1.61) 4 |
| Mode of delivery, % | ||
| Vaginal delivery | 140 (56.91) 5 | 220 (57.89) 6 |
| C-Section | 103 (41.87) 5 | 158 (41.58) 6 |
| Birth weight, (kg) | 3.15 (0.45) 7 | 3.15 (0.48) 6 |
| Breastfeeding duration, (months) | 8.15 (5.91) 1 | 8.09 (6.07) 2 |
| Child Characteristics (At follow-up visits) | ||
| Age, (years) | 10.34 (1.67) | 14.08 (2.03) |
| Body mass index Z-score for age | 0.85 (1.24) | 0.53 (1.26) 6 |
| Metabolic equivalents, (METs/week) | 31.38 (19.97) | 60.63 (38.76) |
| Total caloric intake, (kcal/day) | 2636.32 (839.83) | 2371.62 (936.82) |
| Pubertal onset, % | 103 (41.87) | 350 (92.11) 8 |
| Cardiometabolic risk factors (Outcomes) | ||
| Waist circumference, (cm) | 70.81 (10.71) | 79.14 (11.42) |
| Systolic blood pressure, (mmHg) | 102.74 (10.24) | 97.23 (9.62) |
| Diastolic blood pressure, (mmHg) | 65.58 (7.31) | 62.24 (6.71) |
| Fasting glucose, (mg/dL) | 86.98 (9.38) | 77.48 (7.05) 9 |
| High-density lipoprotein cholesterol, (mg/dL) | 58.76 (11.92) | 42.95 (8.87) 9 |
| Triglycerides, (mg/dL) | 87.89 (44.40) | 105.81 (57.47) 9 |
| DNAm (Predictors) | ||
| LINE-1 DNAm, % (averaged across 4 CpG sites) | 78.49 (2.31) 5 | N/A |
| 11β-HSD-2 DNAm, % (averaged across 5 CpG sites) a | −0.85 (1.34) | N/A |
| H19 DNAm, % (averaged across 4 CpG sites) | 58.31 (5.16) 1 | N/A |
| PPAR-α DNAm, % (averaged across 2 CpG sites) | N/A | 10.62 (2.09) 10 |
| LINE-1 z-Score at Site 1 | LINE-1 z-Score at Site 2 | LINE-1 z-Score at Site 3 | LINE-1 z-Score at Site 4 | |||||
|---|---|---|---|---|---|---|---|---|
| Estimate (SE) | p-Value | Estimate (SE) | p-Value | Estimate (SE) | p-Value | Estimate (SE) | p-Value | |
| Waist circumference (cm) (Total number of observations = 441, of which 43 (17.77%) subjects had one measurement and 199 (82.23%) subjects had two measurements) | ||||||||
| Model 1 | −0.5960 (1.0435) | 0.5684 | 1.1418 (1.4217) | 0.4227 | −0.4783 (1.1510) | 0.6781 | 0.2997 (0.9013) | 0.7398 |
| Model 2 | 0.5615 (1.0072) | 0.5777 | 0.9837 (1.3686) | 0.4730 | −1.7757 (1.1106) | 0.1111 | 0.3214 (0.8710) | 0.7124 |
| Systolic blood pressure (mmHg) (Total number of observations = 441, of which 43 (17.77%) subjects had one measurement and 199 (82.23%) subjects had two measurements) | ||||||||
| Model 1 | −0.4560 (0.8541) | 0.5939 | −0.1855 (1.1698) | 0.8741 | 0.1632 (0.9435) | 0.8628 | 0.9703 (0.7361) | 0.1887 |
| Model 2 | −0.9634 (0.8928) | 0.2817 | −0.00023 (1.2181) | 0.9999 | 0.4640 (0.9898) | 0.6397 | 0.8922 (0.7676) | 0.2464 |
| Diastolic blood pressure (mmHg) (Total number of observations = 441, of which 43 (17.77%) subjects had one measurement and 199 (82.23%) subjects had two measurements) | ||||||||
| Model 1 | −0.5185 (0.5769) | 0.3697 | −0.1316 (0.7927) | 0.8682 | 0.2271 (0.6379) | 0.7221 | 0.3619 (0.4966) | 0.4669 |
| Model 2 | −0.6759 (0.5947) | 0.2570 | −0.04549 (0.8136) | 0.9555 | 0.3404 (0.6613) | 0.6072 | 0.3674 (0.5094) | 0.4716 |
| Log-transformed fasting glucose (mg/dL) (Total number of observations = 438, of which 46 (19.01%) subjects had one measurement and 196 (80.99%) subjects had two measurements) | ||||||||
| Model 1 | −0.01570 (0.007838) | 0.0463 | 0.02427 (0.01086) | 0.0263 | −0.00357 (0.008708) | 0.6825 | −0.00361 (0.006726) | 0.5917 |
| Model 2 | −0.02864 (0.008211) | 0.0006 * | 0.02729 (0.01124) | 0.0160 | 0.01135 (0.009149) | 0.2162 | −0.00142 (0.007028) | 0.8402 |
| Log-transformed high-density lipoprotein cholesterol (mg/dL) (Total number of observations = 438, of which 46 (19.01%) subjects had one measurement and 196 (80.99%) subjects had two measurements) | ||||||||
| Model 1 | 0.02078 (0.01893) | 0.2733 | −0.02664 (0.02610) | 0.3083 | 0.01023 (0.02099) | 0.6265 | −0.01677 (0.01627) | 0.3039 |
| Model 2 | −0.01466 (0.02111) | 0.4881 | −0.02801 (0.02873) | 0.3306 | 0.06331 (0.02334) | 0.0072 * | −0.00571 (0.01822) | 0.7543 |
| Log-transformed triglycerides (mg/dL) (Total number of observations = 438, of which 46 (19.01%) subjects had one measurement and 196 (80.99%) subjects had two measurements | ||||||||
| Model 1 | −0.05170 (0.04055) | 0.2035 | −0.03424 (0.05541) | 0.5372 | 0.05445 (0.04481) | 0.2255 | −0.00392 (0.03498) | 0.9109 |
| Model 2 | −0.02698 (0.03945) | 0.4947 | −0.04343 (0.05383) | 0.4205 | 0.05072 (0.04378) | 0.2477 | 0.009633 (0.03392) | 0.7766 |
| 11β-HSD-2 z-Score at Site 1 | 11β-HSD-2 z-Score at Site 2 | 11β-HSD-2 z-Score at Site 3 | 11β-HSD-2 z-Score at Site 4 | 11β-HSD-2 z-Score at Site 5 | ||||||
|---|---|---|---|---|---|---|---|---|---|---|
| Estimate (SE) | p-Value | Estimate (SE) | p-Value | Estimate (SE) | p-Value | Estimate (SE) | p-Value | Estimate (SE) | p-Value | |
| Waist circumference (cm) (Total number of observations = 415, of which 43 (18.78%) subjects had one measurement and 186 (81.22%) subjects had two measurements) | ||||||||||
| Model 1 | −0.3822 (1.0424) | 0.7142 | −0.08657 (0.7980) | 0.9137 | 0.2635 (0.9701) | 0.7862 | 0.5264 (0.7690) | 0.4943 | 0.2132 (0.7252) | 0.7690 |
| Model 2 | −1.1319 (1.0012) | 0.2595 | 0.2204 (0.7707) | 0.7751 | 0.6173 (0.9303) | 0.5076 | 0.5578 (0.7361) | 0.4493 | −0.1382 (0.6969) | 0.8430 |
| Systolic blood pressure (mmHg) (Total number of observations = 415, of which 43 (18.78%) subjects had one measurement and 186 (81.22%) subjects had two measurements) | ||||||||||
| Model 1 | −1.6096 (0.8326) | 0.0545 | −0.7568 (0.6372) | 0.2362 | 1.2770 (0.7754) | 0.1010 | 0.3766 (0.6161) | 0.5416 | −0.4901 (0.5780) | 0.3974 |
| Model 2 | −1.4026 (0.8695) | 0.1083 | −0.7320 (0.6688) | 0.2751 | 1.1599 (0.8074) | 0.1524 | 0.3305 (0.6404) | 0.6064 | −0.3520 (0.6029) | 0.5600 |
| Diastolic blood pressure (mmHg) (Total number of observations = 415, of which 43 (18.78%) subjects had one measurement and 186 (81.22%) subjects had two measurements) | ||||||||||
| Model 1 | −0.9251 (0.5519) | 0.0951 | −0.8601 (0.4222) | 0.0428 | 0.3540 (0.5143) | 0.4920 | 0.4535 (0.4092) | 0.2690 | −0.01360 (0.3827) | 0.9717 |
| Model 2 | −0.8686 (0.5624) | 0.1240 | −0.8775 (0.4322) | 0.0436 | 0.3201 (0.5221) | 0.5404 | 0.4519 (0.4148) | 0.2771 | 0.01427 (0.3888) | 0.9708 |
| Log-transformed fasting glucose(mg/dL) (Total number of observations = 412, of which 46 (20.09%) subjects had one measurement and 183 (79.91%) subjects had two measurements) | ||||||||||
| Model 1 | −0.00076 (0.007513) | 0.9193 | 0.001955 (0.005764) | 0.7348 | 0.006329 (0.006998) | 0.3668 | −0.01869 (0.005586) | 0.0010 * | 0.002692 (0.005216) | 0.6064 |
| Model 2 | 0.009223 (0.007893) | 0.2440 | −0.00184 (0.006079) | 0.7624 | 0.001102 (0.007320) | 0.8805 | −0.01837 (0.005817) | 0.0018 * | 0.007427 (0.005472) | 0.1762 |
| Log-transformed high-density lipoprotein cholesterol (mg/dL) (Total number of observations = 412, of which 46 (20.09%) subjects had one measurement and 183 (79.91%) subjects had two measurements) | ||||||||||
| Model 1 | 0.002550 (0.01874) | 0.8919 | −0.00550 (0.01438) | 0.7026 | −0.00829 (0.01745) | 0.6351 | −0.01132 (0.01390) | 0.4161 | 0.005434 (0.01303) | 0.6770 |
| Model 2 | 0.02693 (0.02073) | 0.1952 | −0.02151 (0.01596) | 0.1793 | −0.02199 (0.01925) | 0.2545 | −0.01714 (0.01524) | 0.2620 | 0.01880 (0.01442) | 0.1938 |
| Log-transformed triglycerides (mg/dL) (Total number of observations = 412, of which 46 (20.09%) subjects had one measurement and 183 (79.91%) subjects had measurements) | ||||||||||
| Model 1 | 0.02425 (0.04126) | 0.5572 | 0.03580 (0.03163) | 0.2588 | 0.004623 (0.03838) | 0.9042 | 0.01794 (0.03047) | 0.5566 | −0.00972 (0.02872) | 0.7354 |
| Model 2 | 0.01469 (0.04003) | 0.7140 | 0.03065 (0.03084) | 0.3212 | 0.01000 (0.03715) | 0.7880 | 0.01977 (0.02946) | 0.5029 | −0.01685 (0.02782) | 0.5453 |
| PPAR-α z-Score at Site 1 | PPAR-α z-Score at Site 2 | |||
|---|---|---|---|---|
| Estimate (SE) | p-Value | Estimate (SE) | p-Value | |
| Waist circumference (cm) (n = 345) | ||||
| Model 1 | 0.71915 (0.71474) | 0.3150 | −1.70941 (0.65445) | 0.0094 |
| Model 2 | 0.99917 (0.70529) | 0.1575 | −1.68127 (0.64618) | 0.0097 |
| Systolic blood pressure (mmHg) (n = 345) | ||||
| Model 1 | 0.58582 (0.60305) | 0.3320 | −1.02922 (0.55218) | 0.0632 |
| Model 2 | 0.49623 (0.57982) | 0.3927 | −0.66490 (0.53123) | 0.2116 |
| Diastolic blood pressure (mmHg) (n = 345) | ||||
| Model 1 | 0.58530 (0.42242) | 0.1668 | −0.57466 (0.38679) | 0.1383 |
| Model 2 | 0.58072 (0.40724) | 0.1548 | −0.34026 (0.37311) | 0.3624 |
| Log-transformed fasting glucose (mg/dL) (n = 310) | ||||
| Model 1 | 0.00598 (0.00614) | 0.3305 | 0.00016627 (0.00600) | 0.9779 |
| Model 2 | 0.00282 (0.00609) | 0.6443 | 0.00159 (0.00596) | 0.7900 |
| Log-transformed high-density lipoprotein cholesterol (mg/dL) (n = 310) | ||||
| Model 1 | −0.00813 (0.01303) | 0.5329 | 0.01206 (0.01273) | 0.3445 |
| Model 2 | −0.00419 (0.01309) | 0.7490 | 0.00857 (0.01280) | 0.5035 |
| Log-transformed triglycerides (mg/dL) (n = 310) | ||||
| Model 1 | 0.01232 (0.03058) | 0.6873 | 0.00118 (0.02989) | 0.9684 |
| Model 2 | 0.02086 (0.03057) | 0.4956 | −0.01116 (0.02989) | 0.7092 |
Disclaimer/Publisher’s Note: The statements, opinions and data contained in all publications are solely those of the individual author(s) and contributor(s) and not of MDPI and/or the editor(s). MDPI and/or the editor(s) disclaim responsibility for any injury to people or property resulting from any ideas, methods, instructions or products referred to in the content. |
© 2023 by the authors. Licensee MDPI, Basel, Switzerland. This article is an open access article distributed under the terms and conditions of the Creative Commons Attribution (CC BY) license (https://creativecommons.org/licenses/by/4.0/).
Share and Cite
Aljahdali, A.A.; Goodrich, J.M.; Dolinoy, D.C.; Kim, H.M.; Ruiz-Narváez, E.A.; Baylin, A.; Cantoral, A.; Torres-Olascoaga, L.A.; Téllez-Rojo, M.M.; Peterson, K.E. DNA Methylation Is a Potential Biomarker for Cardiometabolic Health in Mexican Children and Adolescents. Epigenomes 2023, 7, 4. https://doi.org/10.3390/epigenomes7010004
Aljahdali AA, Goodrich JM, Dolinoy DC, Kim HM, Ruiz-Narváez EA, Baylin A, Cantoral A, Torres-Olascoaga LA, Téllez-Rojo MM, Peterson KE. DNA Methylation Is a Potential Biomarker for Cardiometabolic Health in Mexican Children and Adolescents. Epigenomes. 2023; 7(1):4. https://doi.org/10.3390/epigenomes7010004
Chicago/Turabian StyleAljahdali, Abeer A., Jaclyn M. Goodrich, Dana C. Dolinoy, Hyungjin M. Kim, Edward A. Ruiz-Narváez, Ana Baylin, Alejandra Cantoral, Libni A. Torres-Olascoaga, Martha M. Téllez-Rojo, and Karen E. Peterson. 2023. "DNA Methylation Is a Potential Biomarker for Cardiometabolic Health in Mexican Children and Adolescents" Epigenomes 7, no. 1: 4. https://doi.org/10.3390/epigenomes7010004