Article

Economic Benefits from Managing Coffee Berry Borer (Hypothenemus hampei) in Hawaii

1
College of Tropical Agriculture and Human Resources, University of Hawaii at Manoa, Honolulu, HI 96822, USA
2
Daniel K. Inouye US Pacific Basin Agricultural Research Center, United States Department of Agriculture—Agricultural Research Service, Hilo, HI 96720, USA
3
Synergistic Hawaii Agriculture Council, Hilo, HI 96720, USA
*
Author to whom correspondence should be addressed.
Insects 2023, 14(4), 350; https://doi.org/10.3390/insects14040350
Submission received: 10 March 2023 / Revised: 31 March 2023 / Accepted: 31 March 2023 / Published: 1 April 2023

Abstract

:

Simple Summary

Since its introduction to Hawaii in 2010, coffee berry borer (CBB) has dramatically reduced the quality and yield of coffee produced in the islands. We assessed the economic benefits of managing CBB based on three strategies that emerged in Hawaii over the last decade: (1) the use of the entomopathogenic fungus Beauveria bassiana alone, (2) early integrated pest management (IPM), which combined monitoring and sanitation with spraying B. bassiana, and (3) research-based IPM, which focused on CBB biology in Hawaii, optimization of monitoring, B. bassiana applications, and cultural controls. From 2011 to 2021, the economic benefits from managing CBB were USD 52 million using B. bassiana alone, USD 69 million from early IPM, and USD 130 million from research-based IPM, for a total of USD 251 million from all management. This suggests that all types of management provide economic benefits to Hawaii growers, but management strategies based on Hawaii-specific research have provided the greatest gains in coffee yield, price, and revenue. Our findings demonstrate that both research and outreach are critical for developing and implementing effective IPM strategies.

Abstract

Coffee berry borer (CBB) is considered the most damaging insect pest of coffee worldwide. CBB was first detected on Hawai‘i Island in 2010, and quickly spread throughout the state’s coffee-growing regions. With the introduction of this pest, Hawaii’s small yet economically important coffee industry was changed forever with growers facing significantly higher production and labor costs, as well as decreased yield and coffee quality. We assessed the economic benefits of managing CBB based on three strategies that emerged in Hawaii over the last decade: (1) the use of the entomopathogenic fungus Beauveria bassiana alone, (2) early integrated pest management (IPM), which combined monitoring and sanitation with spraying B. bassiana, and (3) research-based IPM, which focused on CBB biology in Hawaii, optimization of monitoring, B. bassiana applications, and cultural controls. From 2011 to 2021, the economic benefits from managing CBB were USD 52 million using B. bassiana alone, USD 69 million from early IPM, and USD 130 million from research-based IPM, for a total of USD 251 million from all management. Our findings suggest that all types of management provide economic benefits to Hawaii growers, but management strategies based on Hawaii-specific research have provided the greatest gains in coffee yield, price, and revenue.

1. Introduction

Coffee is the second most valuable agricultural commodity in Hawaii, with an estimated value of USD 113 million for green coffee and USD 161 million for roasted coffee in 2022 [1]. Although the state’s coffee industry is relatively small compared to other producing regions, the high quality and unique origin of Hawaiian-grown coffee commands premium prices on the world specialty market. For the 2021–2022 growing season, bearing acreage totaled 7100 acres, with 2022 utilized production estimated at 26.7 million pounds (cherry basis) [1]. Most farms in Hawaii are small (<5 acres), family-run operations with annual sales ranging from USD 10,000 to USD 250,000 [2]. While most commercial coffee farms are profitable overall, some lifestyle farms may have a low output-input ratio with negative net profits [3]. Hawaii is unique relative to other coffee-producing regions in that growers have several avenues of distribution and can choose how far to refine their product along the supply chain based on whether they intend to sell to an exporter, a roaster, or directly to consumers.
There are just under 1000 coffee growers in Hawaii [2], and thousands of workers are hired each year to manage and harvest this labor-intensive crop. In 2014, labor accounted for the highest percentage of the production costs for coffee grown in Hawaii at 39%, followed by fertilizers and chemicals (14%) [3]. All coffee grown on Hawai‘i Island is harvested by hand due to the rough terrain and narrow spacing of trees, although there are large plantations on Kaua‘i, O‘ahu, Maui and Moloka‘i that utilize mechanical harvesting. Coffee in Hawaii is cultivated under extremely variable climatic conditions from ~200–800 m elevation on volcanic soils that vary greatly in terms of age and nutrient composition [4]. Almost daily cloud cover in the afternoons provides natural shade during the hottest part of the day, such that most coffee in Hawaii is grown without shade trees, although some farms in Kona have various fruit (avocado, mango, citrus, breadfruit, banana) and nut trees (macadamia) inter-planted with the coffee.
Coffee berry borer (CBB, Hypothenemus hampei Ferrari) (Coleoptera: Curculionidae) is widely considered the most damaging insect pest of coffee worldwide [5,6,7]. Hawaii was one of the last coffee-growing regions in the world without an established population of CBB until it was detected in the Kona district of Hawai‘i Island in September 2010 [8]. The tiny beetle rapidly spread across Hawai‘i Island and was detected in the other major growing district of Ka‘ū in May 2011. CBB was later confirmed on the neighboring islands of O‘ahu (2014), Maui (2016), Kaua‘i (2020), and Lāna‘i (2020) [9]. Although it remains unknown exactly how CBB was introduced to the islands, it may have been brought in the clothing or equipment of migrant workers, through improperly fumigated shipments, or by air passengers [10,11,12]. Adult female CBB bore into the coffee fruit (“berry”) and excavate tunnels within the seed (“bean”) to lay their eggs. The developing larvae feed on the endosperm tissue, causing direct damage to the bean. Male and female siblings mate, and the mated females emerge to fly in search of a new berry to infest. The entire life cycle of the CBB is completed within the fruit, making it very difficult to control since the female is only vulnerable to insecticide sprays when it leaves the natal fruit.
The arrival of this global pest completely changed Hawaii’s coffee industry forever. Infestation in poorly managed farms reached as high as 95% [13]. The yield and quality of Hawaiian coffee decreased, and significant declines in “Fancy” and “Extra fancy” grades of coffee beans were seen in the years that followed [14,15]. Large processors implemented quality assessments for each bag of cherry delivered, with the grower receiving 10–15 cent reductions for infestation above 10%. Production and labor costs increased due to the need to conduct strict sanitation practices and to apply insecticides to minimize losses [14,15]. For the 2011/12 and 2012/13 seasons, the impact from CBB was estimated at USD 25.7 M in lost sales, USD 12.7 M in crop loss, USD 7.6 M in lost household earnings, and a loss of more than 380 jobs [16].
When CBB was first reported in Hawaii, information from other coffee producing countries was identified for incorporation into an integrated pest management (IPM) program. The key components of this program include monitoring, cultural control practices, and the use of biological control agents [17,18,19,20]. The first major milestone in the development of a Hawaii-specific IPM came in 2011, when the GHA strain of Beauveria bassiana (Basl. Criv.) Vuill. (Hypocreales: Cordycipitaceae) was approved for use on Hawaiian coffee (sold commercially as BotaniGard® ES and Mycotrol® ESO; Lam International Corporation, Butte, MT, USA). This entomopathogenic fungus is one of most important natural enemies of CBB and can result in mortality levels of up to 70% [6,14].
A second important milestone was introduction of the 30-tree sampling method [17] in 2012 for CBB monitoring. This allowed growers to estimate infestation percentage, determine CBB position within the berry, and locate hotspots of CBB activity, all of which are used to inform spray decisions [14,15,21]. The following year (2013) several organizations (University of Hawaii at Manoa (UHM) College of Tropical Agriculture and Human Resources (CTAHR), Synergistic Hawaii Agricultural Center (SHAC), Hawaii Department of Agriculture (HDOA), United States Department of Agriculture–Agricultural Research Service (USDA–ARS), and numerous coffee grower associations) came together to participate in a CBB summit, with the purpose of developing IPM recommendations for controlling CBB in Hawaii. The resulting document provided growers with information on best practices for monitoring, pruning, spraying B. bassiana, harvesting, and strip-picking [22]. We term this combination of practices the “early IPM” for CBB in Hawaii for the purposes of this study. A second CBB summit in 2014 further solidified early IPM recommendations and updated guidelines [23].
The last major milestone in the success of the early IPM was establishment of a B. bassiana subsidy program funded by HDOA, SHAC, and USDA-FAS. This program reimbursed growers for up to 75% of the costs associated with spraying approved B. bassiana products (up to USD 9000 per farmer/year) from 2014 to 2016. The program was extended several times, with the most recent programs (2018–2026) reimbursing growers for up to 50% of costs or up to USD 6000 per farmer/year. Since the inception of the subsidy program, the use of commercial B. bassiana products on Hawaii coffee farms increased from 80% of farms in 2013, to 85% of farms in 2015, and 95% of farms in 2016. Among surveyed farmers, ~95% found B. bassiana to be effective. Approximately 30% of surveyed farmers responded that without the subsidy, they would stop growing coffee or strongly consider terminating it as a crop [24].
Although the early IPM provided a starting point for CBB management in Hawaii, there were many unknowns regarding the basic biology of CBB under Hawaii’s unique environmental and agroecological conditions. In addition, the high production and labor costs and severe shortage of labor created major challenges for managing this new pest in a way that was economically feasible for growers. Several federal and state agencies, as well as farmer associations and coffee industry professionals worked together to address these issues and improve upon the early IPM based on scientific data collected in the islands. These studies resulted in a better understanding of CBB infestation patterns and flight activity [13,25,26], development times [27], post-harvest CBB reservoirs [28], efficacy of cultural control practices [15,29,30], simplification of monitoring strategies [21,31,32], identification of potential biocontrols [33,34], and efficacy and optimization of B. bassiana applications [35,36,37,38,39]. New information from these studies was incorporated into updated IPM guidelines beginning in 2016 [40,41], which we refer to as “research-based IPM” for CBB in Hawaii.
In the present study, our aim was to estimate the economic benefits of managing CBB in Hawaii under three scenarios: (1) the use of B. bassiana alone; (2) the implementation of early IPM, which combined monitoring and sanitation with spraying B. bassiana; and (3) the use of research-based IPM, which provided insights into CBB development, flight behavior, infestation patterns, monitoring techniques, and spray optimization. Findings from this study support the continued development and adoption of IPM strategies, which will increase yields, quality, and revenue to improve the livelihoods of coffee growers in Hawaii.

2. Methods

To estimate economic benefits under the three scenarios, we first estimated the statewide and regional coffee-bearing acreage from 2006 to 2021 and then used CBB detection dates for each growing region to estimate the infested acreage over time. The rate at which CBB management recommendations were adopted by farmers in Hawaii was then estimated using Rogers’ theory of technology adoption [42]. We then modeled the impact of CBB infestation and management on coffee production and coffee prices. Lastly, to quantify the economic benefits from CBB research and management, we estimated and compared average gains in statewide coffee yield, price, and revenue with and without CBB management.

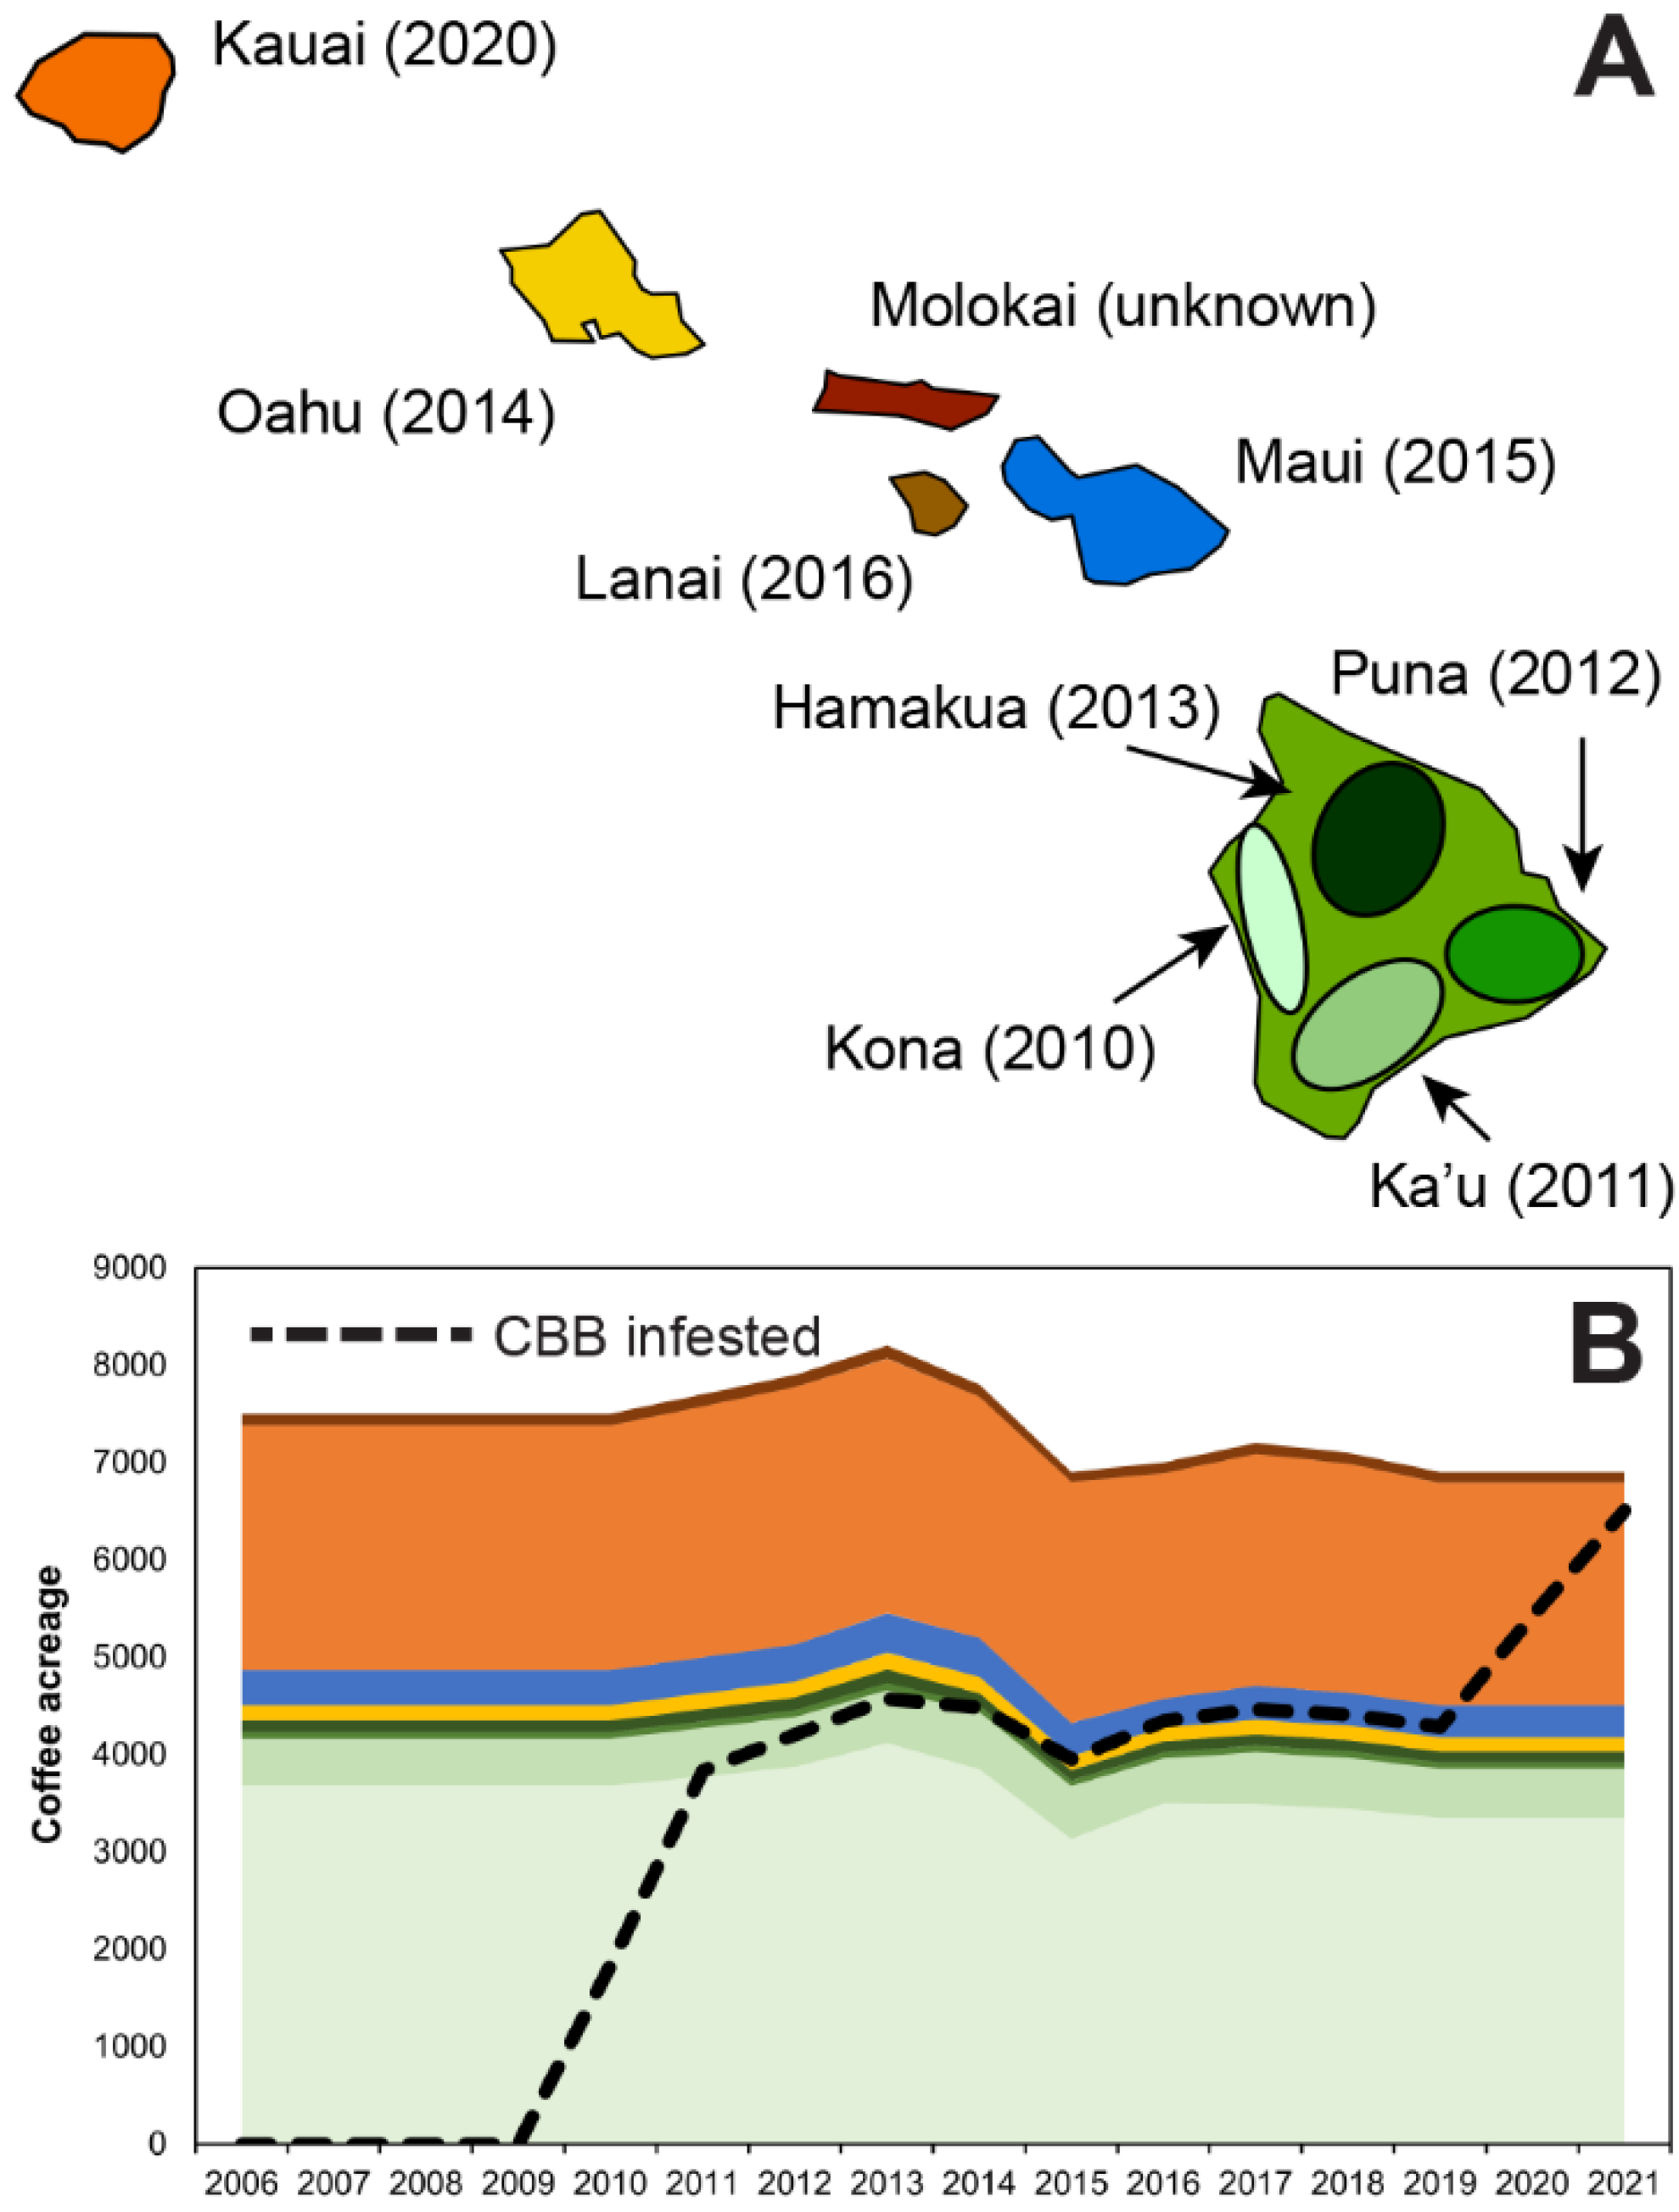
2.1. Hawaii Coffee Acreage (2006–2021) and Infestation (2010–2021)

2.1.1. Statewide and Regional Coffee Acreage

Statewide bearing coffee acreage in Hawaii has been reported annually by the USDA National Agriculture Statistics Service since 1946. However, the State of Hawaii does not routinely report regional coffee acreage and has not previously attempted to measure CBB infested acreage. To model CBB spread, we developed a procedure to estimate both regional acreage and statewide infested acreage over time. From 2013 to 2016, the state reported regional bearing coffee acreage for most of the nine regions, but not every region and not every year. For our 16-year time-period (2006–2021) and nine growing regions (Kona, Ka‘ū, Puna, Hāmākua, Oah‘u, Maui, Lāna‘i, Kaua‘i, Moloka‘i; see Figure 1A), there were 19 acreage observations and hence 109 missing data points (Table S1).
Statewide coffee acreage was relatively steady during this time-period and not trending. This allowed us to confidently estimate the missing data points by extrapolating backwards to 2010, forwards to 2021, and interpolating where missing values were between years when acreage was reported. In this way, we generated a first approximation of regional bearing coffee acreage, a’ht, for each region h = Kona, Ka‘ū, Puna, Hāmākua, Oah‘u, Mau‘i, Lana‘i, Kaua‘i, and Moloka‘i, for years t = 2010 to 2021(see Table S2; Figure 1B).
We then summed a’ht over all regions to obtain A’t:
A’t = Σh a’ht
We compared the value of A’t to official statewide acres, At, and as expected, A’t ≠ At. To make the correction, we generated a calibration factor φt for each year t:
φt = At/A’t
We multiplied the calibration factor φt by a’t to obtain estimated regional acreage aht:
aht = φt a’ht
Summing aht over h yielded A”t:
A”t = Σh aht
We compared A”t and At and verified that:
A”t = At
Meaning that our estimated values of regional coffee acreage aht sum to reported statewide coffee acreage At:
At = Σh aht
Estimates of regional coffee acreage over time are shown in Figure 1B and Table S2.

2.1.2. Regional CBB Infested Acreage—CBB Spread over Time

With estimated regional coffee acreage and the dates when CBB was detected in each region, we can begin to estimate infested acreage over time. First, we define τh to be the year CBB was detected in region h, as shown in Figure 1A. During the first year of detection, we assume 50% of the acreage is infested. During the second year we assume 95% of the acreage is infested. This approximation was provided by our expert panel comprised of Hawaii coffee growers (T. Greenwell, S. Shriner, and M. Bondera), coffee processors (T. Greenwell and S. Shriner), extension experts (L. Aristizábal, M. Bondera, and S. Shriner), and CBB researchers (M. Johnson and L. Aristizábal). Estimates mimic a fast exponential rate of spread, which is consistent with expert panel observations. The proportion of infested acreage in region h at time t is given by αht = 50% for t = τh and αht = 95% for t > τh+1. Using the values for α and regional acreage aht we can compute CBB infested acreage iht:
iht = αht aht
We sum iht over all h to obtain statewide infested acres It:
It = Σh iht = Σh αht aht
Our estimate of regional infested acres appears in Figure 1B and Table S3.

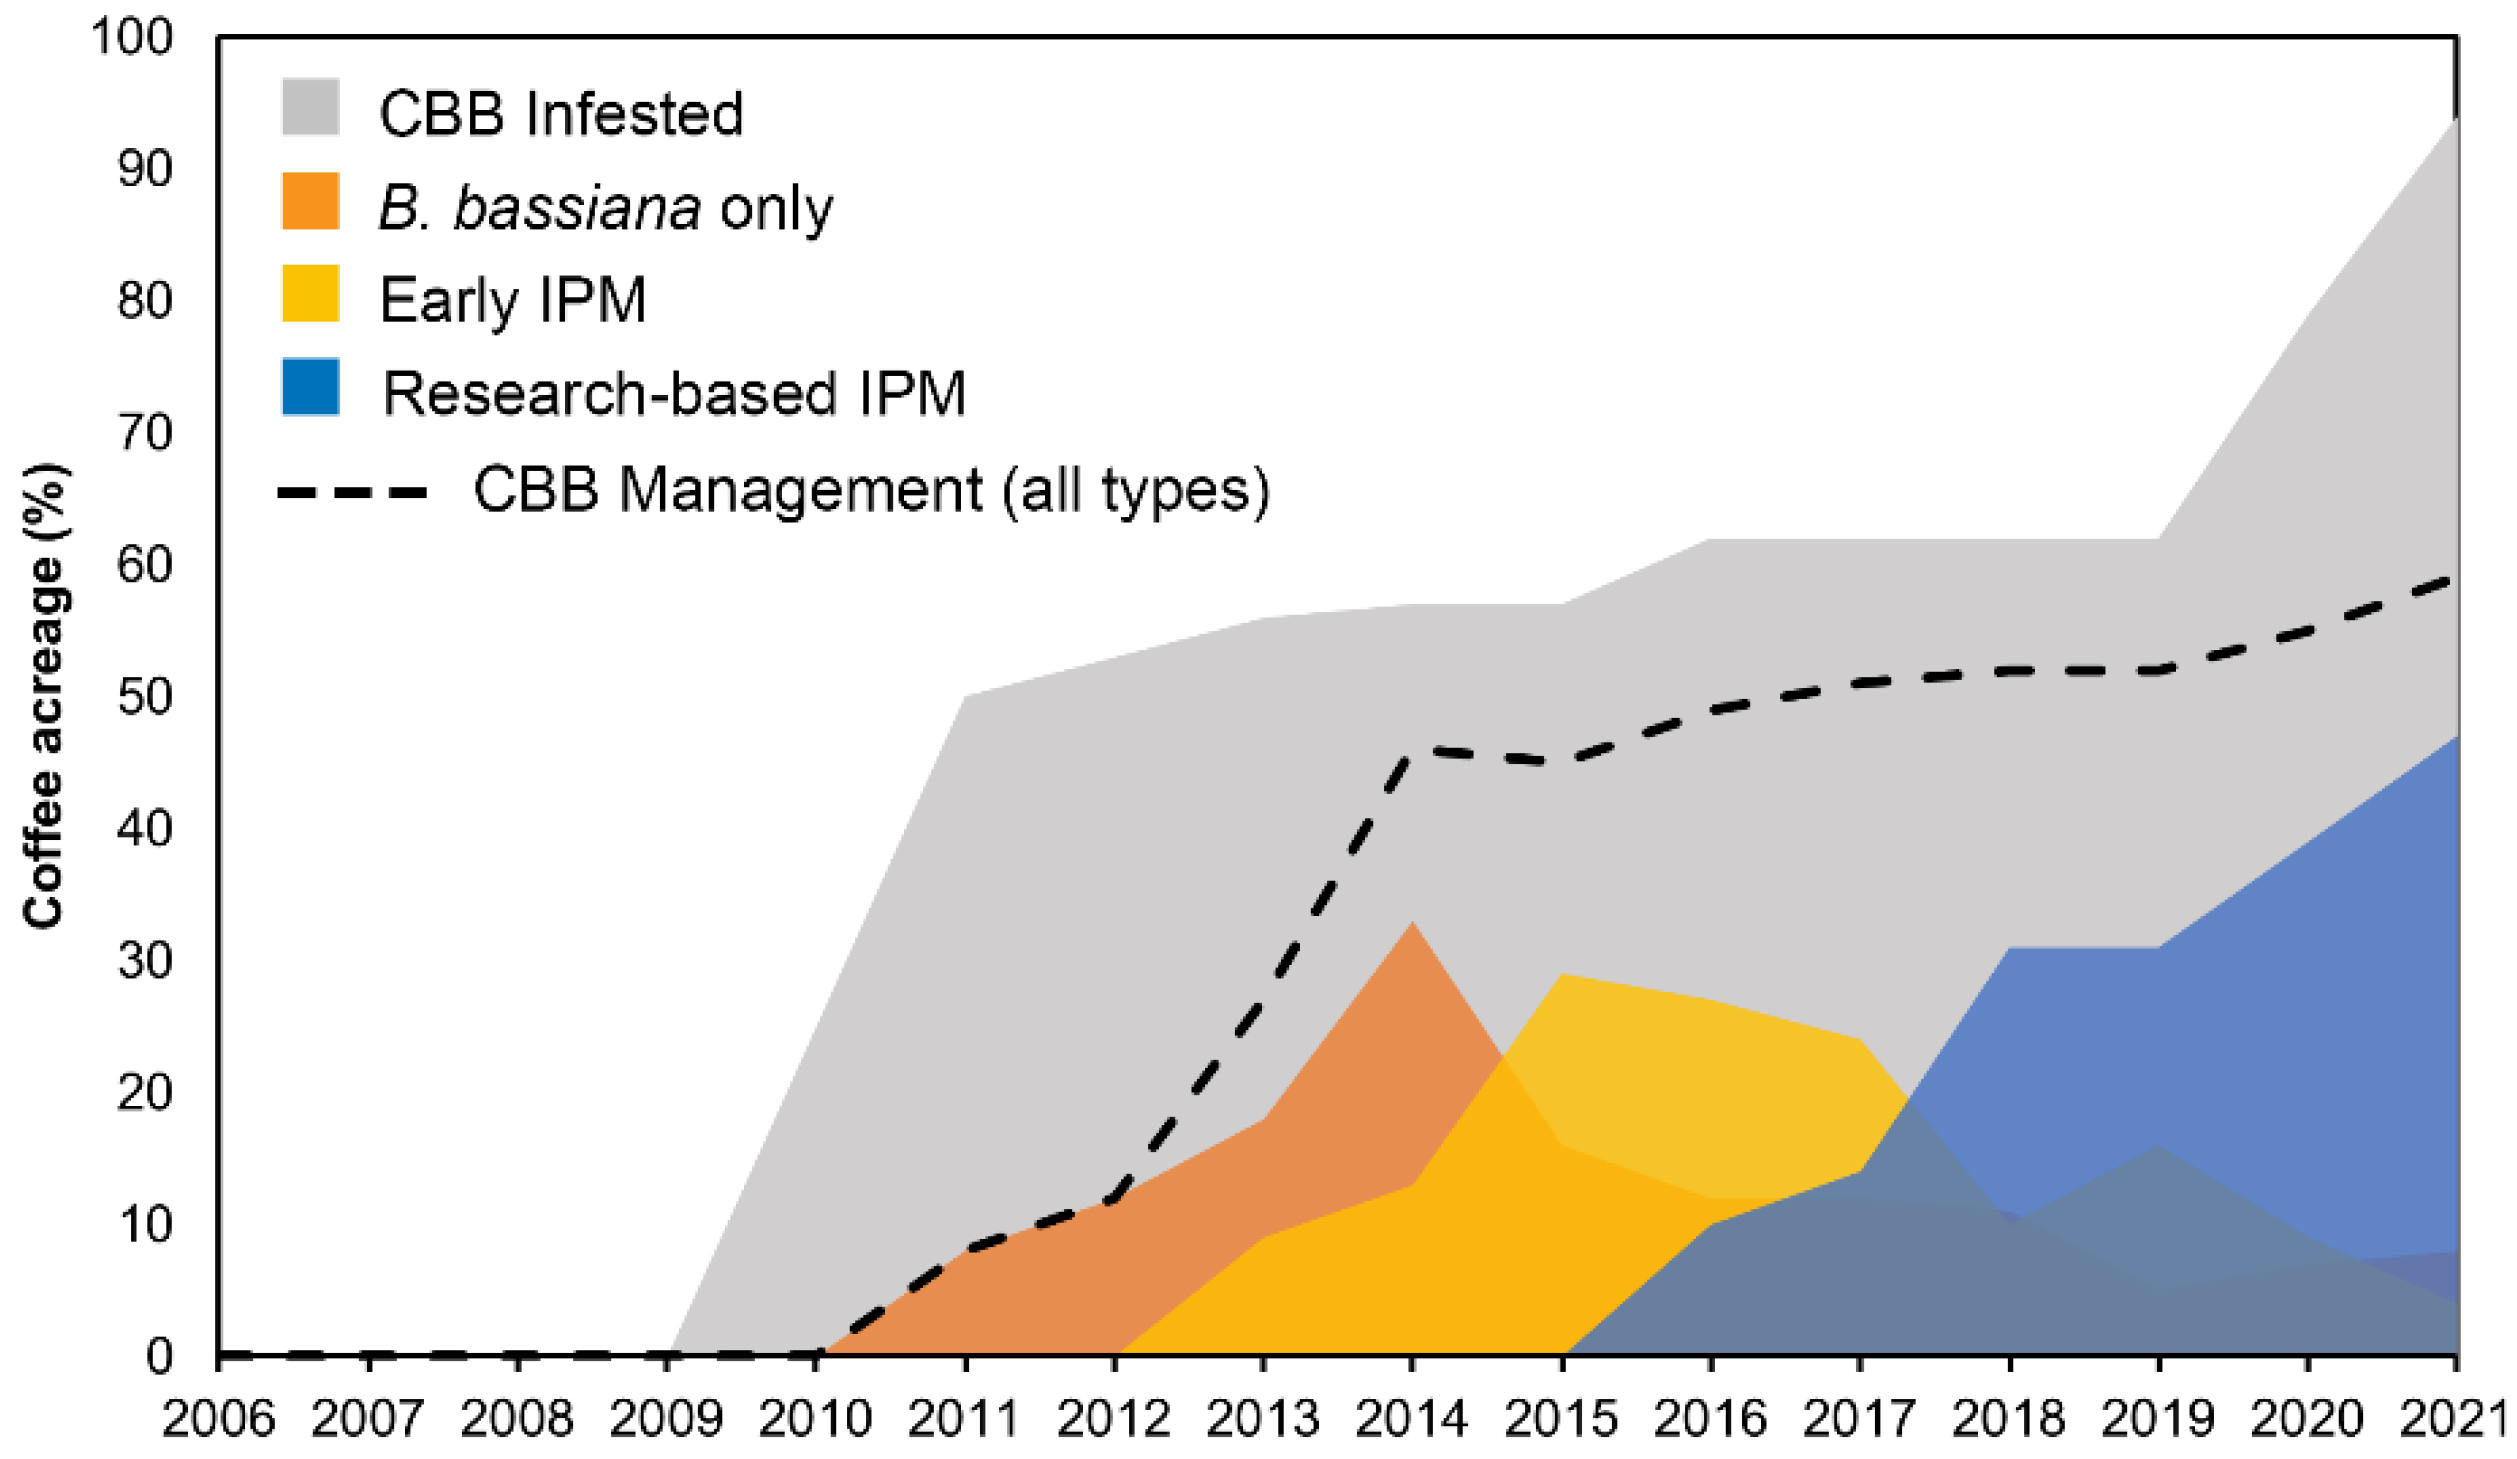
2.2. Technology Adoption

2.2.1. Applying Rogers’ Technology Adoption Theory to CBB Management

To estimate the rate at which CBB management recommendations were adopted by farmers in Hawaii, we applied Rogers’ theory of technology adoption [42] which divides the population of any group into innovators, early adopters, early majority, late majority, and laggards, where the innovators (0.025) and early adopters (0.135) are the first to undertake any new technology, followed by early majority and late majority. The laggards (0.16) may never adopt the new technology. Here, we define μht to be the proportion of CBB infested acres in region h that is managed. As defined previously, τh is the year CBB was first detected in region h. For t < τh management is not needed so μht = 0. For t = τh innovators and early adopters begin managing for CBB, therefore μht = 0.16. Each year, more farmers adopt CBB management practices up through year three when 84% of the infested acreage is managed. Parameter values for μht are as follows: for t < τh, μht is zero; at t = τh, μht = 0.16; at t = τh + 1, μht = 0.23; at t = τh + 2, μht = 0.50; at t = τh + 3, μht = 0.84; and at t > τh + 3, μht = 0.84. With μht we can compute regional managed infested acreage mht as follows:
mht = μht iht
Summing mht over h gives us statewide managed infested acres Mt:
Mt = Σh mht

2.2.2. Managed and Unmanaged Infested Acres over Time—By Management Type

To capture the evolving management technology, we define j to be the type of management applied, where j = B, C, D, E, F. Here, B refers to the use of B. bassiana alone to control CBB, C represents early IPM management following recommendations that came out in 2013–2015, D represents management that follows research-based IPM recommendations that came out in 2016–2021, E represents no management of infested acreage, and F represents no management of uninfested acreage.
Recall that total statewide infested acreage is It and total managed infested acres is Mt. We introduce a new term υjt to be the proportion of infested acres It managed by each type j = B, C, D. For the first three years, 2010–2012, we assume all managed acreage are using B. bassiana only (type B). During 2013–2015, we apply Rogers’ theory of technology adoption assuming the adoption rate for early IPM (type C) to be 0.16 in the first year, 0.23 in the second year, and 0.50 in the third year. During 2016–2018, we apply Rogers’ theory of technology adoption assuming the adoption rate for research-based IPM (type D) to be 0.16 in the first year, 0.23 in the second year, 0.50 in the third year and so on. For years 2016–2019, we computed values of B. bassiana-only usage from survey data collected as part of the HDOA B. bassiana subsidy program (M. Bondera, pers. comm.) as 0.19, 0.20, 0.18, and 0.086. The remaining values for υjt for j = B, C, D were computed as 1 = υBtCt + υDt (see Table S4). The numerical results for acreage by management type j as a proportion υjt of infested acres It are shown in Figure 2 and Table S5.

2.2.3. All Coffee Acreage—Infested and Uninfested, Managed and Unmanaged

Coffee acreage At is either infested It or uninfested Ut:
At = It + Ut
Infested acres It are either managed Mt or unmanaged Nt:
It = Mt + Nt
where υBt, υCt, and υDt are the proportion of infested acres under each management type then It can be written as:
It = (υBt, υCt, and υDt) It + Nt
At can be written as:
At = (υBt, υCt, and υDt) It + Nt + Ut
In addition, At can be rewritten as:
At = (υjt It + υjt It+ υjt It) + Nt + Ut
Dividing both sides of the previous equation by At gives us:
1 = [(υjt It + υjt It+ υjt It) + Nt + Ut]/At
or
1 = υjt It/At + υjt It/At + υjt It/At + Nt/At + Ut/At
which we can write as:
1 = ωBt + ωCtDtEtFt
where ωjt is the proportion of acreage At for j = B, C, D, E, F. Computation of values for ωjt are displayed in Table S6.

2.3. Economic Approach: Impact of Infestation and Management on Coffee Yield and Price

2.3.1. Production and Economics

Here we model the impact of CBB infestation on coffee production and coffee prices. We assume that higher infestation levels cause a reduction in yields and price. To ascertain the relationships between infestation, yields, and coffee prices, we again consulted our expert panel (see above). We further assume that management reduces infestation and helps to improve yields and prices, and the more effective the management, the lower the infestation level.

2.3.2. Economic Model Scenarios

The economic model to evaluate the impact of infestation levels on yield and price are basic production and price functions between acreage, yield, prices, and management type. The baseline model replicates observed production and available management types. To generate the baseline, we used estimated regional acreage, estimated infested acreage, and rate of adoption for the three management types. Yields and prices were based on infestation and management type. Total production was based on acreage and yields. Total revenue was based on production and prices.

2.3.3. Coffee Acreage At

Estimates of coffee acreage ajt for each management type j and time t were calculated using:
ajt = ωjt At
Using the equation above, the values in Table S5 for At and values in Table S6 for ωjt we obtain the distribution of acreage for uninfested, infested, managed, and unmanaged acres (Table S5).

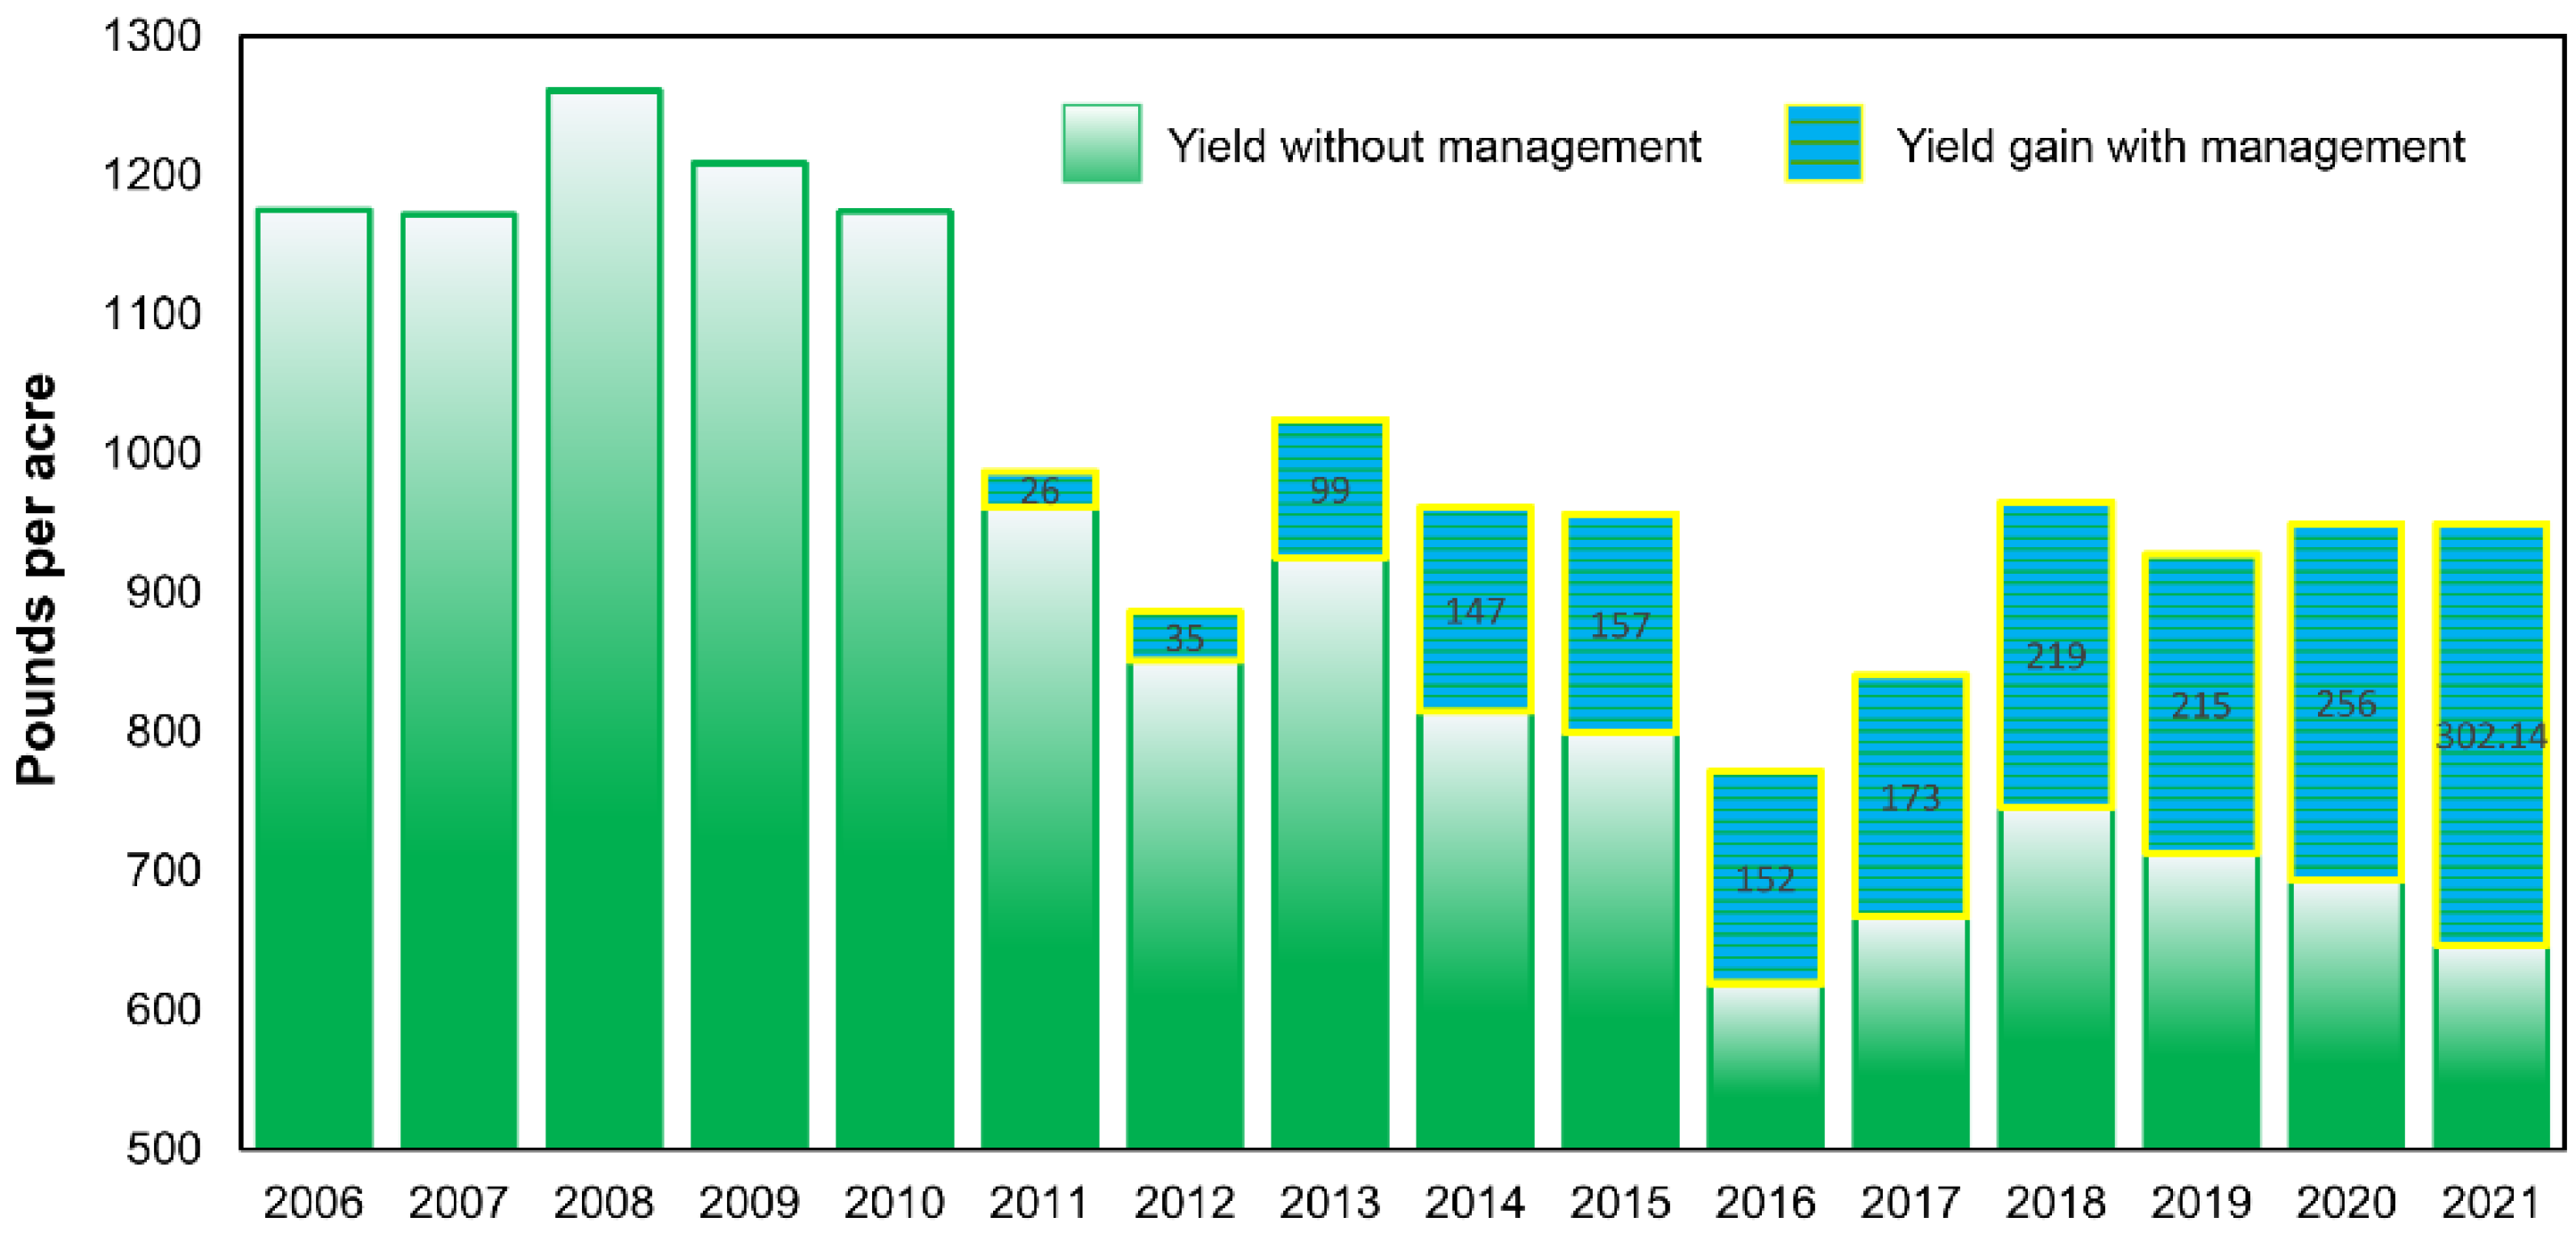
2.3.4. Coffee Yield Yt

Official reported statewide yields are based on total production and estimated acreage. However, across the landscape actual farm yields vary widely depending on several factors. For this analysis, we focus on yield variation as a function of CBB infestation. On average, coffee yields diminish with rising CBB infestation and increase with improved CBB management. More effective management practices help to preserve yields. While we cannot directly observe CBB infestation levels statewide, we relied on opinion from our expert panel to calculate implied relative yields. We define yjt to be the average yield per acre under each management type j at time t and define ψj to be a parameter that captures relative yield.
yjt = jij yFt
Here yFt is the coffee yield from uninfested acreage and yjt is yield for all other j. From our expert panel, values for ψj are as follows: infested (ψF) =1, infested unmanaged (ψE) = 0.5, managed by B. bassiana only (ψB) = 0.75, managed by early IPM (ψC) = 0.85, and managed by research-based IPM (ψD) = 0.95. Recall that ωjt represents the proportion of total coffee acreage that is infested, uninfested, managed, and unmanaged. We can derive the value of yFt as follows:
We write coffee yield, Yt, as the proportion of acreage, ωjt, multiplied by average yield, yjt, for j = B, C, D, E, F:
Yt = ωBt yBt + ωCt yCt + ωDt yDt + ωEt yEt + ωFt yFt
Into Equation (21), we substitute yjt = ψj yFt for all yjt (see Equation (19)):
Yt = ωBtψB yFt + ωCtψC yFt + ωDt ψD yFt + ωEt ψE yFt + ωFtψF yFt
We rearrange Equation (22) to solve for coffee yield from uninfested acreage, yFt:
yFt = Yt/(ψB ωBt + ψC ωCt + ψD ωDt + ψE ωEt + ψF ωFt)
We can compute yFt using ωBt in Table S6, ψj as described in the previous paragraph, and Yt in Table 1. Then we calculate all other average yield per acre under each management type j at time t, yjt, using:
yjt = ψj yFt
This method for calibrating yields preserves reported statewide yields since the weighted average of the calibrated yields equals statewide reported yields. Computed baseline yield values yjt are displayed in Table 1.

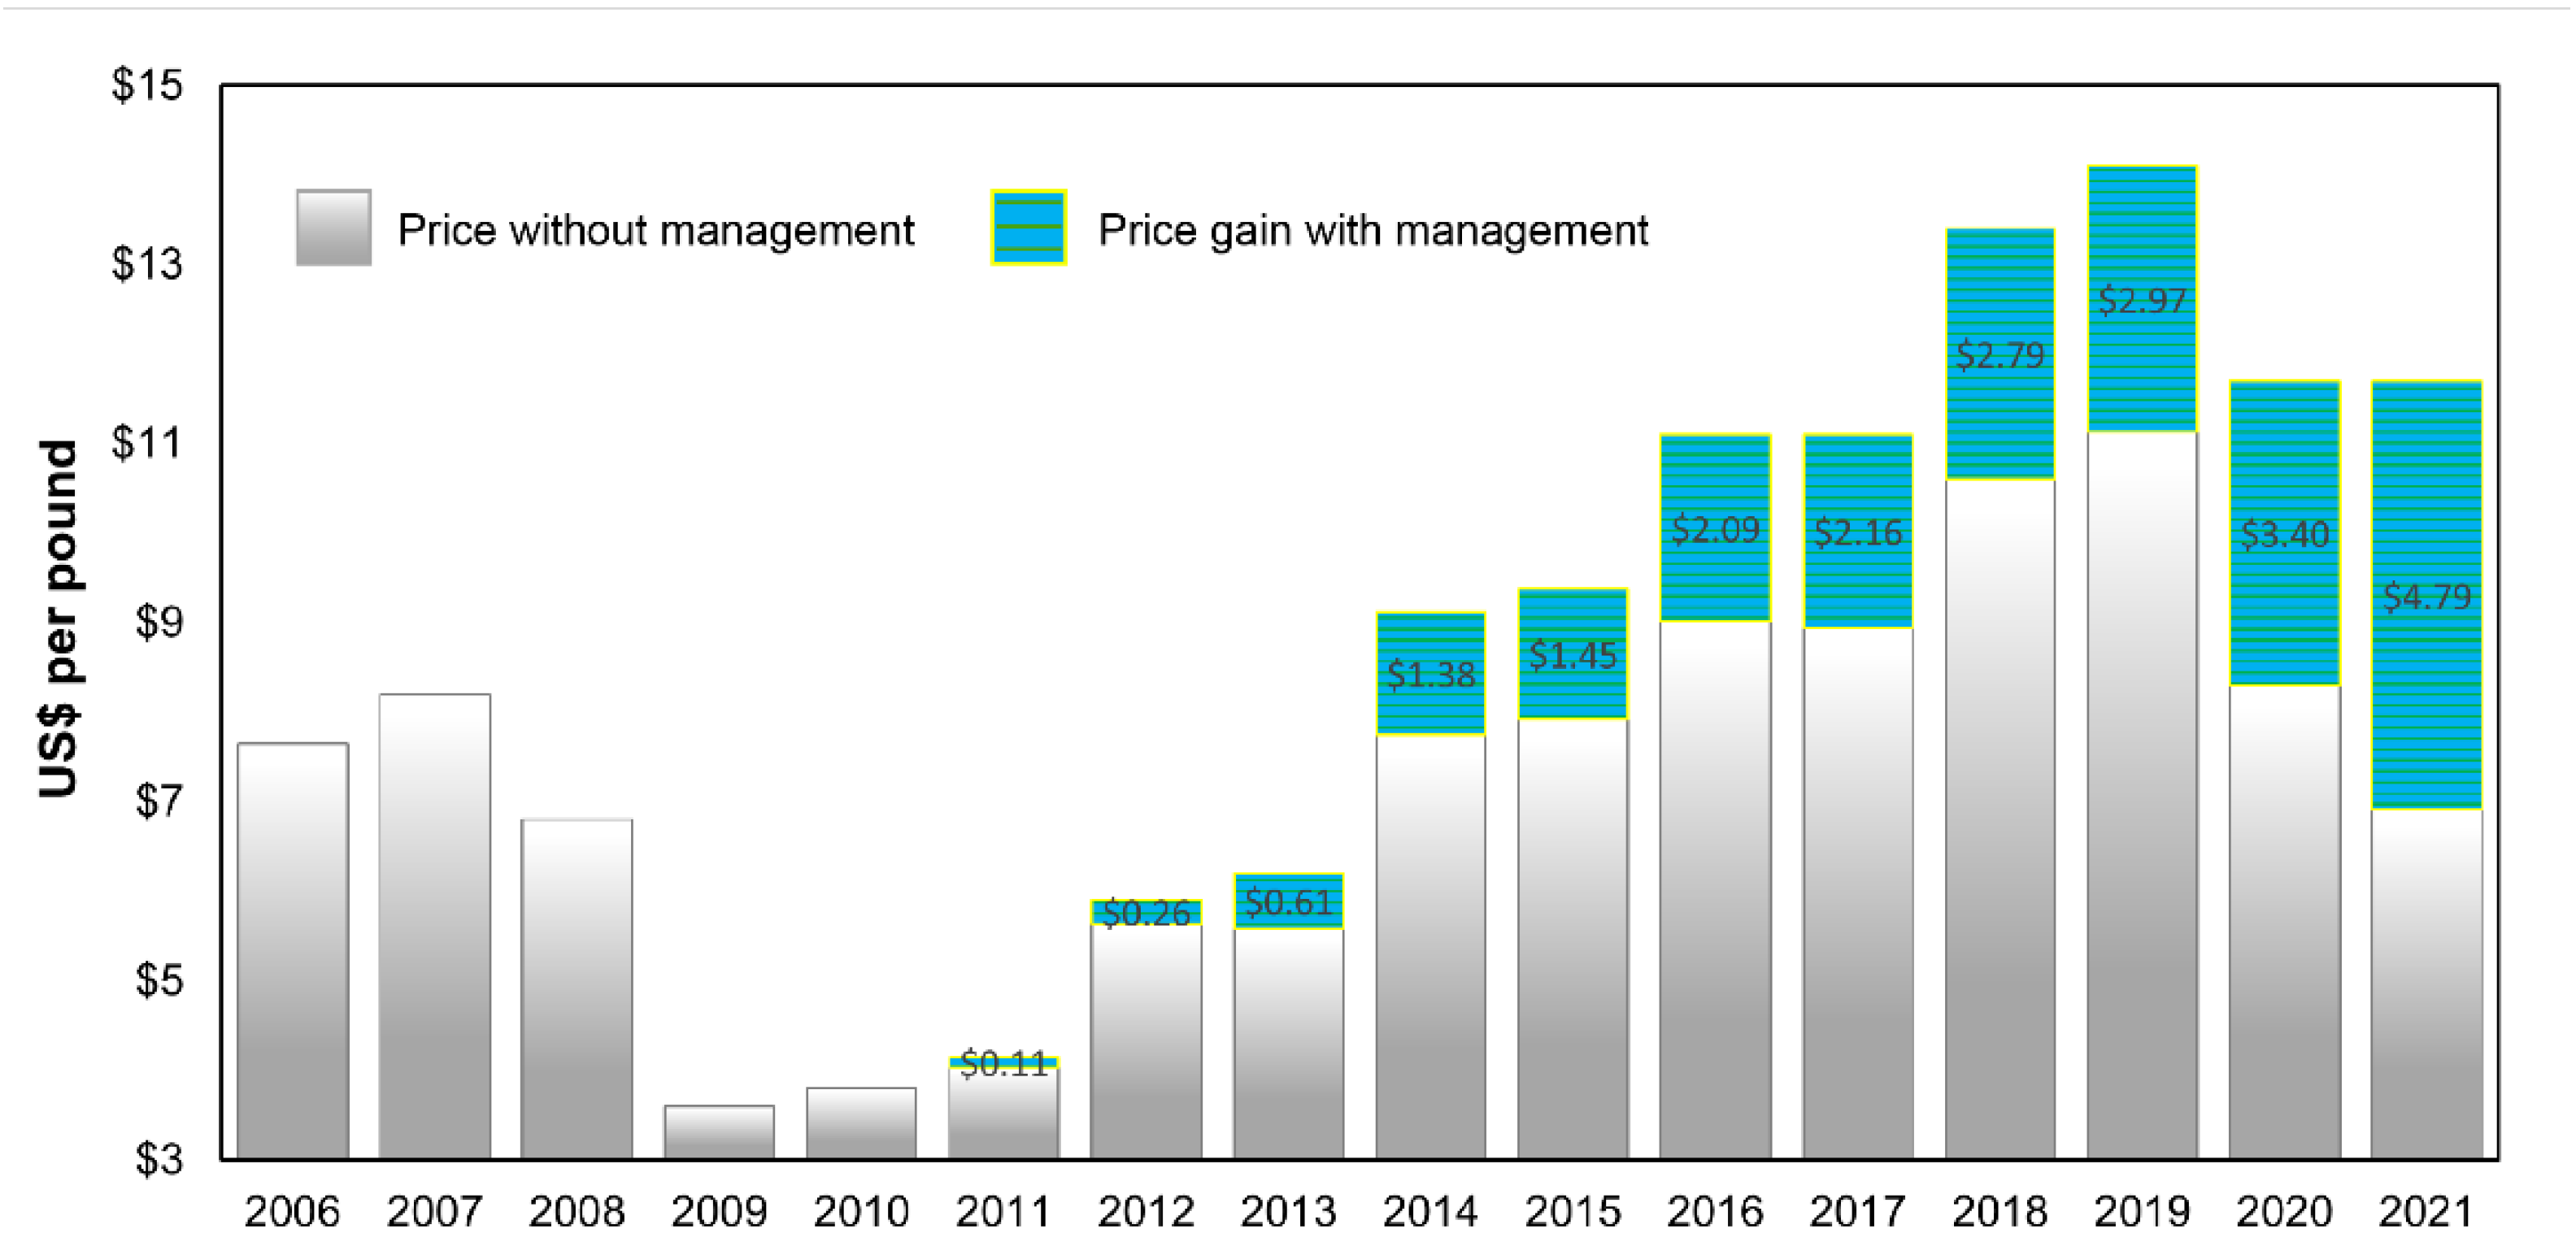
2.3.5. Coffee Price Pt

Average coffee prices are reported annually by the USDA-NASS based on total revenue and total production. Actual prices received by farmers for their crops vary widely depending on coffee quality, supply, and demand. For this analysis, we assumed price decreases with increasing level of CBB infestation. While we do not observe CBB infestation of the coffee sold, we know CBB management reduces infestation [13,15], which in turn, results in higher prices. Here we define pjt to be price per pound of parchment received under management status j and ρjt to be the relative price parameter such that:
pjt = ρj pFt
Here pFt is the premium price received per pound for uninfested parchment. Values of ρjt are ρBt =87%, ρCt =93%, ρDt =100%, ρEt = 45%, and ρFt =100%. We know that revenue is:
Pt Qt = Σj pjt qjt = pBt qBt + pCt qCt + pDt qDt + pEt qEt + pFt qFt
Here Pt is reported price, Qt is reported production, values for qjt are computed (qjt = yjtajt) using values of average yield yjt (Table 1) and estimated regional acreage ajt (Table S5).
Into the equation above, we substitute Equation (24), and obtain the expression:
Pt Qt = ρB pFt qBt + ρC pFt qCt + ρD pFt qDt + ρE pFt qEt + ρF pFt qFt
We can rewrite the above equation to solve for pFt:
pFt = Pt Qt/(ρB qBt + ρC qCt + ρD qDt + ρE qEt + ρF qFt)
We compute premium price per pound for uninfested parchment, pFt, and the corresponding values of pjt = ρjt pFt for the remaining j. This calibration method preserves reported statewide prices since the weighted average of the calibrated price equals the statewide reported price. Computed baseline price values are displayed in Table 2.

2.4. Hypothetical Scenario for Benefits Estimation

To quantify the value of CBB research, extension, and management, we developed a hypothetical scenario following the arrival of CBB in Hawaii in 2010. In the hypothetical scenario, there are no statewide efforts or responses from the government, coffee associations, or the university to help farmers manage the crop pest. Outreach, recommendations, subsidies, research, and strategy development are all absent.

2.4.1. Scenario Assumptions

We assumed that CBB arrived in Hawaii and spread across the islands at the same rate as in the baseline (observed). This is a simplifying and conservative assumption as some management recommendations include measures designed to slow the rate of spread within a farm, across farms, and across regions. In the absence of management, it is possible that CBB might have spread faster. However, we feel this is a reasonable assumption given the relatively small (16%) rate of technology adoption in the first year of infestation and fast observed rate of CBB spread even with management. We assume yields for uninfested (yF) and infested (yE) coffee are the same as the values computed for the baseline, that is infested coffee yield is 50% of uninfested yield (i.e., ψE = 0.50 and yE = ψE yF). We feel this is a reasonable assumption based on expert panel observations. We assume price for uninfested (pF) and infested (pE) coffee are the same as the values computed for the baseline, that is price for infested coffee is 45% of uninfested coffee i.e., ρE = 0.45 and ρE = ρEρF. This is a simplifying assumption and under this scenario, the price for infested and uninfested coffee could be higher or lower. Roasters may be willing to pay more for both low- and high-quality coffee if the high-quality coffee is in short supply. In addition, the price for low-quality coffee might be relatively closer to the price of high-quality coffee in which case for any given year in the past, the benefit from management could be slightly less than estimated. We assume bearing acreage At remains the same as in the baseline. Uninfested acreage Ut and infested acreage It are as shown in Table S5. Acreage continues to be in flux, but we assume the acreage that goes in and out of production each year is as observed (Table S5). Our estimate is conservative in that our model does not simulate an increase in land going out of production due to unmanaged infestation, reduced yields, and reduced quality. Instead, we assume revenues cover long-term costs, and total acreage remains the same.

2.4.2. Coffee Yield

In our hypothetical “no management” scenario beginning in 2010, yields on uninfested acreage averaged 1155 lbs per acre ranging from a high of 1337 lbs per acre in 2010 to a low of 897 in 2016. Hypothetical yields on infested acreage averaged 578 lbs per acre, with a high of 669 lbs per acre in 2010 and a low of 449 lbs per acre in 2016. Annual coffee yields in the hypothetical scenario are displayed in Table 1.

2.4.3. Coffee Price

In our hypothetical “no management” scenario beginning in 2010, the price for uninfested coffee ranges from a high of USD 14.78 per lb in 2019 to a low of USD 3.60 per pound in 2009. For infested coffee, the price ranges from a high of USD 6.65 per lb in 2019 to a low of USD 1.85 per lb in 2010. Annual average prices in the hypothetical scenario are displayed in Table S7.

2.4.4. Benefits Estimation

To quantify the benefits from CBB management, we estimated and compared average gains in statewide coffee yield, price, and revenue with and without each of the three types of CBB management. Average gain in yield per acre across all coffee farms was computed as follows:
Yield Gain (t) = Yt − (yFt Ut + yEt It)/At
% Yield Gain (t) = Yield gain (t)/Yt
Average gain in price per pound across all coffee farms was computed as follows:
Price Gain (t) = Pt − (pFt Ut + pEt It)/At
% Price Gain (t) = Price Gain (t)/Pt
Average gain in revenue per acre across all coffee farms was computed as follows:
Average Revenue Gain (t) = PtYt − (pFt yFt Ut + pEt yEt It)/At
% Average Revenue Gain (t) = Revenue Gain (t)/PtYt
Annual statewide revenue gain across all coffee farms was computed as follows:
Total Revenue Gain (t) = Pt Yt At − (pFt yFt Ut + pEt yEt It)
% Total Revenue Gain (t) = Total Revenue Gain (t)/Pt Yt At

3. Results

From 2006 to 2021, statewide bearing coffee acreage in Hawaii ranged from a low of 6300 acres in 2006 to a high of 8200 acres in 2013 (Table S5; Figure 1B). From 2010 to 2011, CBB spread rapidly throughout Hawaii Island’s two main growing regions of Kona and Ka’u, which together account for ~50% of the coffee acreage in the state (Table S3; Figure 1B). A second large increase in infested acreage was estimated in 2020 (Table S3; Table S5) following the detection of CBB on Kauai, which has more than 3000 acres of commercially grown coffee (Figure 1A,B).
During the first two years of the invasion, 8–12% of the infested acreage was managed using B. bassiana alone while the remaining ~40% of infested acreage went unmanaged (Figure 2). In 2013, 18% of infested coffee was managed using B. bassiana alone and 9% was managed using the newly introduced early IPM (Figure 2). Management of CBB using only B. bassiana peaked at 33% in 2014, while the use of early IPM strategies peaked at 29% in 2015. Research-based IPM began to be implemented by growers in 2016, with the use of these science-backed strategies increasing steadily over the next five years. By 2021, 47% of infested acreage was managed using research-based IPM compared to only 8% using B. bassiana alone and 4% using early IPM (Figure 2).
From 2006 to 2021, coffee yields ranged from a high of 1261 pounds of parchment per acre in 2008 to a low of 771 pounds per acre in 2016 (Figure 3; Table 1). Average yield during the five-year period prior to CBB introduction was 1198 lbs/acre, compared to an average of 963 lbs/acre the first five years after CBB was introduced (20% reduction). Average yield gains due to CBB management increased from 26 lbs/acre (2.6% increase) in 2011 to 302 lbs/acre (31.8% increase) in 2021 (Figure 3; Table S8).
Over the 16-year sampling period, coffee prices ranged from a low of USD 3.60 per pound in 2009 to a high of USD 14.10 per pound of parchment in 2019 (Figure 4; Table S9). Prior to the CBB invasion, the observed average price per pound for parchment coffee was USD 6.01, compared to an average of USD 6.95 per pound in the five years post-invasion (16% increase). Our results showed average price gains from all CBB management combined rising from USD 0.11 per pound (2.7% increase) in 2011 to USD 4.79 per pound (41% increase) in 2021 (Figure 4; Table S9).
From 2006 to 2021, coffee revenue ranged from a high of USD 13,078 per acre in 2019 to a low of USD 4096 per acre in 2011 (Figure 5; Table S10). In the five years prior to the CBB invasion the observed average revenue was USD 7196 per acre, compared to an average of USD 6683 per acre in the five years post-invasion (7% decrease). Revenue gains rose from USD 216 per acre (5% increase) in 2011 to USD 6637 per acre (60% increase) in 2021 (Figure 5; Table S10).
Lastly, during the 16-year sampling period the observed annual statewide revenue from coffee ranged from a low of USD 27.41 M in 2009 to a high of USD 91.79 M in 2018 (Figure 6; Table S11). Prior to the CBB invasion the observed average statewide revenue was USD 47.63 M annually, compared to an average of USD 51.05 M annually in the five years post-invasion (7% increase). Annual total revenue gains rose from USD 1.66 M per year (5.3% increase) in 2011 to USD 45.79 M per year (59.8% increase) in 2021 (Figure 6; Table S11).
Gains to farmers from using B. bassiana products only ranged from ~USD 2–13 M between 2011 and 2021, with the highest gains observed in 2013 (Figure 7). Similarly, gains to farmers adopting early IPM recommendations from 2013 to 2021 ranged from ~USD 3–13 M, with the highest gains observed in 2015 (Figure 7). From 2016 to 2021, farmers adopting research-based IPM recommendations enjoyed gains of USD 5–39 M per year, with the highest gains observed in 2021 (Figure 7). During this same period (2016–2021), farmers continuing to follow early IPM recommendations had annual gains of USD 3–12 M, while farmers continuing to use only B. bassiana had marginal annual gains of USD 2–5 M (Figure 7; Table S12).

4. Discussion

This study estimated the economic benefits from CBB management in Hawaii over the last 11 years (2011 to 2021) through a collaboration between coffee growers, industry representatives, scientists, extension educators, and economists. We used reported data on coffee acreage in combination with detection dates and expert knowledge to estimate CBB spread across the Hawaiian Islands and to inform model assumptions. Then, adoption rates of management types were based on Roger’s theory of technology adoption. These management types included: (1) the use of the entomopathogenic fungus B. bassiana alone, starting in 2011; (2) early IPM that combined monitoring and sanitation with spraying B. bassiana, starting in 2013; and (3) the use of research-based IPM that focused on improving monitoring techniques, optimizing sprays of B. bassiana, and assessing the impact and feasibility of cultural controls, starting in 2016. Finally, adjustments in yield and prices were based on management effectiveness and bean quality.
Over a 10-year period, management of CBB-infested acreage in Hawaii has increased from 8% in 2011 to 59% in 2021. During this same period, coffee yields increased by 32%, the price per pound increased by 41%, and revenue per acre increased by 60% due to the improvement of CBB management technology. From 2011 to 2021, the cumulative gain in revenue was USD 251 M with the highest benefit coming from research-based IPM at USD 130 M, followed by early IPM at USD 69 M, and B. bassiana at USD 50 M. Annually, when all three management types are adopted, the highest return is from research-based IPM.
Findings from Hawaii-specific studies on CBB management were first incorporated into the 2016 IPM guidelines, marking the beginning of research-based IPM strategies for CBB in Hawaii. This was followed by the initiation of a five-year area-wide IPM grant in 2017, with the aim of developing, testing, and implementing suites of control measures that were specifically tailored to Hawaii’s unique and highly variable coffee-growing landscape. Under this grant, multiple research projects were initiated to simplify monitoring strategies, gain knowledge of CBB biology under varying environmental conditions, determine the feasibility of cultural controls such as frequent and efficient harvesting and strip-picking in different growing regions, optimize the use of B. bassiana, and compare the economics of various control strategies. Collectively, this project produced >25 peer-reviewed journal articles and six cooperative extension publications and demonstration videos. The findings were shared at multiple in-person and virtual conferences, newsletters, as well as an extension website.
As a result, an improved location-specific research-based IPM was developed and implemented over the years that followed. IPM adoption in Hawaii was facilitated by grower associations and industry to provide long-term funding and extension support. Briefly, the research-based CBB IPM program is defined by four major practices: (1) field sanitation including pruning, weed removal, strip-picking, and stumping by blocks; (2) monitoring CBB populations using traps and/or a simplified method of surveying for berry infestation, (3) applying B. bassiana early in the season during peak CBB flight activity, and (4) frequent and efficient harvesting [41]. Our findings demonstrate that both research and outreach are critical for developing and implementing effective IPM strategies. Scientists play a key role in anticipating and identifying pest problems, developing preventative and curative strategies, and driving technological developments by identifying new management tools and performing preliminary investigations. Scientists and extension educators must then work together to change grower perspectives on traditional methods of pest control by demonstrating the value of new strategies and technologies. The implementation of IPM strategies can be facilitated by grower associations and industry representatives to effectively disseminate this information through traditional and modern communication tools and strategies.

Supplementary Materials

The following supporting information can be downloaded at: https://www.mdpi.com/article/10.3390/insects14040350/s1, Table S1: Regional Hawaii coffee acreage (values reported in blue vs. all other values missing); Table S2: Estimated and calibrated regional Hawaii bearing coffee acreage (aht). Values highlighted in blue represent those for which regional estimates were available (see Table S1 for comparison); Table S3: Hawaii regional CBB infested acres (iht) from 2006 to 2021 (for each region (h) the year of CBB introduction (τh) is shown in parentheses); Table S4: Parameter values for the proportion of coffee berry borer infested acres managed (υjt) over time using Beauveria bassiana only, early IPM, and research-based IPM; Table S5: Baseline coffee acreage (ajt) distribution in Hawaii from 2006 to 2021 (total bearing acreage is the sum of all infested and uninfested acres, managed acres is the sum of the three IPM scenarios, and infested acres is the sum of managed and unmanaged acres); Table S6: Proportion of total coffee acreage (ωJt) that is infested (It), uninfested (Ut), managed (B. bassiana only = υBt, early IPM = υCt, and research-based IPM = υDt) and unmanaged (Nt); Table S7: Coffee prices per pound (USD) under the hypothetical scenario without CBB management; Table S8: Observed coffee yield (parchment pounds per acre), yield without any CBB management, and the gain in yield due to all combined types of CBB management; Table S9: Observed price for coffee (USD per pound of parchment), price without CBB management, and price gain due to CBB management; Table S10: Observed average revenue (USD per acre) for Hawaii-grown coffee, average revenue without CBB management, and gain in average revenue due to CBB management; Table S11: Hawaii statewide observed average revenue (USD million per year), average revenue without CBB management, and gain in revenue due to CBB management. Table S12: Observed average Hawaii statewide coffee revenue (USD million per year), revenue without CBB management, and revenue gain from CBB management by management type.

Author Contributions

Conceptualization, S.S. and M.W.; Methodology, D.L. and C.C.; Software, D.L.; Validation, D.L., L.F.A. and M.A.J.; Formal Analysis, D.L.; Investigation, D.L.; Resources, S.S., C.C., S.M. and M.W.; Data Curation, D.L. and M.A.J.; Writing—Original Draft Preparation, D.L., M.A.J. and L.F.A.; Writing—Review & Editing, M.A.J., L.F.A. and C.C.; Visualization, D.L. and M.A.J.; Supervision, M.W., S.S., S.M. and C.C.; Project Administration, S.S. and M.W.; Funding Acquisition, S.S. and M.W. All authors have read and agreed to the published version of the manuscript.

Funding

This study was supported by the USDA-ARS Area-Wide Integrated Pest Management Program for Coffee Berry Borer in Hawaii 2016-2022 (Project Number: 2040-22430-027-27-S, Project Type: Non-Assistance Cooperative Agreement) and the USDA Technical Assistance for Specialty Crops Program (agreement # 2014-08).

Data Availability Statement

Data supporting this article will be deposited in the USDA National Agriculture Library upon acceptance.

Acknowledgments

We thank Melanie Bondera (HDOA) and Tom Greenwell (Greenwell Farms) for providing information used to develop the models, Stuart Nakamoto (UH CTAHR) for offering insight and guidance, and Roseann Leiner (UH CTAHR) for assisting with project management. Mention of a proprietary product does not constitute an endorsement or a recommendation by the USDA for its use. Opinions, findings, conclusions, or recommendations expressed in this publication are those of the authors and do not necessarily reflect the views of the USDA. The USDA is an equal opportunity employer and provider.

Conflicts of Interest

The authors declare no conflict of interest.

References

  1. USDA National Agricultural Statistics Service. Coffee. 2022. Available online: https://www.nass.usda.gov/Statistics_by_State/Hawaii/Publications/Fruits_and_Nuts/Coffee%20Data%20Release%202022.pdf (accessed on 26 June 2022).
  2. Stewart, K.; Manfredi, C.; Steiman, S.; Damitz, B.; Meza, M.; Gaston, R.; Obra, J.; Burden, J.; DTL Hawaii. Grown with Aloha: A Guide to Hawaii’s Coffee Industry Yesterday, Today & Tomorrow; Hawaii Coffee Association, Hawaii Department of Agriculture: Honolulu, HI, USA, 2018; pp. 1–24. Available online: https://hca.wildapricot.org/resources/Documents/DOA-HICoffeeAssoc-Booklet.v4_print.pdf (accessed on 19 August 2022).
  3. Woodill, A.J.; Hemachandra, D.; Nakamoto, S.T.; Leung, P. The Economics of Coffee Production in Hawai‘i. Econ. Issues 2014, 25, 1–9. [Google Scholar]
  4. Bittenbender, H.C.; Smith, V.E. Growing Coffee in Hawaii; College of Tropical Agriculture and Human Resources, University of Hawai’i at Manoa: Honolulu, HI, USA, 2008; Available online: https://www.hawaiicoffeeed.com/growing-coffee-in-hawaii.html (accessed on 6 May 2022).
  5. Damon, A.A. Review of the biology and control of the coffee berry borer, Hypothenemus hampei (Coleoptera: Scolytidae). Bull. Entomol. Res. 2000, 90, 453–465. [Google Scholar] [CrossRef] [PubMed] [Green Version]
  6. Vega, F.E.; Infante, F.; Johnson, A.J. The genus Hypothenemus, with emphasis on H. hampei, the coffee berry borer. In Bark Beetles: Biology and Ecology of Native and Invasive Species, 1st ed.; Vega, F.E., Hofstetter, R.W., Eds.; Elsevier: London, UK, 2015. [Google Scholar]
  7. Johnson, M.A.; Ruiz-Diaz, C.P.; Manoukis, N.C.; Rodrigues, J.C.V. Coffee berry borer (Hypothenemus hampei), a global pest of coffee: Perspectives from historical and recent invasions, and future priorities. Insects 2020, 11, 882. [Google Scholar] [CrossRef] [PubMed]
  8. Burbano, E.; Wright, M.; Bright, D.E.; Vega, F.E. New record for the coffee berry borer, Hypothenemus hampei, in Hawaii. J. Insect. Sci. 2011, 11, 117. [Google Scholar] [CrossRef] [PubMed] [Green Version]
  9. Gillett, C.; Honsberger, D.; Bogner, K.K.; Sprague, R.S.; Matsunaga, J.N.; Rubinoff, D. First record of the coffee berry borer, Hypothenemus hampei (Ferrari, 1867), on the Hawaiian Island of Lanai (Coleoptera: Curculionidae: Scolytinae). Proc. Hawaiian Entomol. Soc. 2020, 52, 59–66. [Google Scholar]
  10. Messing, R.H. The coffee berry borer (Hypothenemus hampei) invades Hawaii: Preliminary investigations of traps response and alternate hosts. Insects 2012, 3, 640–652. [Google Scholar] [CrossRef] [Green Version]
  11. Chapman, E.G.; Messing, R.H.; Harwood, J.D. Determining the origin of the coffee berry borer invasion of Hawaii. Ann. Entomol. Soc. Am. 2015, 108, 585–592. [Google Scholar] [CrossRef]
  12. Takeuchi, Y.; Benavides, P.; Johnson, M.A.; Follett, P.A.; Hossain, M.K.; Navarro, L.; Giraldo, G. Pathway analysis: Likelihood of coffee berry borer (Hypothenemus hampei Ferrari) introduction into the Hawaiian Islands by air passenger travel. Proc. Hawaiian Entomol. Soc. 2022, 54, 1–20. [Google Scholar]
  13. Johnson, M.A.; Manoukis, N.C. Abundance of coffee berry borer in feral, abandoned, and managed coffee on Hawai’i Island. J. Appl. Entomol. 2020, 144, 920–928. [Google Scholar] [CrossRef]
  14. Aristizábal, L.F.; Bustillo, A.E.; Arthurs, S.P. Integrated pest management of coffee berry borer: Strategies from Latin America that could be useful for coffee farmers in Hawaii. Insects 2016, 7, 6. [Google Scholar] [CrossRef] [Green Version]
  15. Aristizábal, L.F.; Johnson, M.; Shriner, S.; Hollingsworth, R.; Manoukis, N.; Myers, R.; Bayman, P.; Arthurs, S.P. Integrated pest management of coffee berry borer in Hawaii and Puerto Rico: Current status and prospects. Insects 2017, 8, 123. [Google Scholar] [CrossRef] [PubMed] [Green Version]
  16. Leung, P.S.; Kawabata, A.M.; Nakamoto, S.T. Estimated Economywide Impact of CBB for the Crop Years 2011/12 and 2012/13; Brief Report at Request of Hawaii Congressional Delegation. 2014. Available online: https://www.hawaiicoffeeed.com/uploads/2/6/7/7/26772370/estimated_economic_impact_of_cbb_in_hawaii.pdf (accessed on 6 May 2022).
  17. Bustillo, A.E.; Cardenas, M.R.; Villalba, D.; Orozco, J.; Benavides, M.P.; Posada, F.J. Manejo Integrado de la Broca del Café Hypothenemus hampei (Ferrari) en Colombia; Cenicafé: Chinchiná, Colombia, 1998; Available online: https://www.researchgate.net/publication/298431657_Manejo_integrado_de_la_broca_del_cafe_Hypothenemus_hampei_Ferrari_en_Colombia (accessed on 6 May 2022).
  18. Baker, P.S. The Coffee Berry Borer in Colombia. Final Report of the DFID—Cenicafé CABI Bioscience IPM for Coffee Project; Commodities Press: Chinchiná, Colombia, 1999; Available online: https://www.researchgate.net/publication/274456049_The_Coffee_Berry_Borer_in_Colombia_Final_report_of_the_DFID-Cenicafe-CABI_Bioscience_IPM_for_coffee_project (accessed on 10 May 2022).
  19. Vega, F.E.; Infante, F.; Castillo, A.; Jaramillo, J. The coffee berry borer, Hypothenemus hampei ((Ferrari) (Coleoptera: Curculionidae): A short review, with recent finding and future research directions. Terr. Arthropod Rev. 2009, 2, 129–147. [Google Scholar] [CrossRef]
  20. Aristizábal, L.F.; Lara, O.; Arthurs, S.P. Implementing an integrated pest management program for coffee berry borer in a specialty coffee plantation in Colombia. J. Integr. Pest Manag. 2012, 3, G1–G5. [Google Scholar] [CrossRef]
  21. Johnson, M.A.; Hollingsworth, R.; Fortna, S.; Aristizábal, L.F.; Manoukis, N.C. The Hawaii protocol for scientific monitoring of coffee berry borer: A model for coffee agroecosystems worldwide. J. Vis. Exp. 2018, 133, 57204. [Google Scholar] [CrossRef] [PubMed] [Green Version]
  22. Kawabata, A.M.; Nakamoto, S.T.; Curtiss, R.T. Recommendations for Coffee Berry Borer Integrated Pest Management in Hawai’i 2013; Publication # IP-31; University of Hawaii Manoa: Honolulu, HI, USA, 2013. [Google Scholar]
  23. Kawabata, A.M.; Nakamoto, S.T.; Curtiss, R.T. Recommendations for Coffee Berry Borer Integrated Pest Management in Hawai’i 2015; Publication # IP-33; University of Hawaii Manoa: Honolulu, HI, USA, 2015. [Google Scholar]
  24. Bittenbender, H.C.; Hicks, G.; Kawabata, A.M.; Curtiss, R.T.; Nakamoto, S.T. How are we doing in the war with CBB? In Comparing CBB Surveys 2016 and 2015; College of Tropical Agriculture and Human Resources, University of Hawai’i at Manoa, Hawaii Department of Agriculture: Honolulu, HI, USA, 2017; Available online: https://www.hawaiicoffeeed.com/uploads/2/6/7/7/26772370/cbb_survey_2016_compared_to_2015.pdf (accessed on 15 June 2022).
  25. Aristizábal, L.F.; Shriner, S.; Hollingsworth, R.; Arthurs, S.P. Flight activity and field infestation relationships for coffee berry borer Hypothenemus hampei (Ferrari) in commercial coffee plantations in Kona and Kau Districts, Hawaii. J. Econ. Entomol. 2017, 110, 2421–2427. [Google Scholar] [CrossRef] [PubMed]
  26. Johnson, M.A.; Manoukis, N.C. Influence of seasonal and climatic variables on coffee berry borer (Hypothenemus hampei Ferrari) flight activity in Hawaii. PLoS ONE 2021, 16, e0257861. [Google Scholar] [CrossRef] [PubMed]
  27. Hamilton, L.J.; Hollingsworth, R.G.; Sabado-Halpern, M.; Manoukis, N.C.; Follett, P.A.; Johnson, M.A. Coffee berry borer (Hypothenemus hampei) (Coleoptera: Curculionidade) development across an elevational gradient on Hawaii Island: Applying laboratory degree day predictions to natural field populations. PLoS ONE 2019, 14, e0218321. [Google Scholar] [CrossRef] [Green Version]
  28. Johnson, M.A.; Fortna, S.; Hollingsworth, R.G.; Manoukis, N.C. Postharvest population reservoirs of coffee berry borer (Coleoptera: Curculionidae) on Hawai’i Island. J. Econ. Entomol. 2019, 112, 2833–2841. [Google Scholar] [CrossRef] [Green Version]
  29. Aristizábal, L.F. Challenges faced by coffee growers establishing an integrated pest management for coffee berry borer in Hawaii. Agric. Res. Technol. 2018, 14, 555919. [Google Scholar] [CrossRef]
  30. Aristizábal, L.F. Controlling the Coffee Berry Borer through Integrated Pest Management: A Practical Manual for Coffee Growers and Field Workers in Hawaii; Steuben Press: Kailua-Kona, HI, USA, 2018. [Google Scholar]
  31. Aristizábal, L.F.; Shriner, S.; Hollingsworth, R.; Mascarin, G.M.; Chaves, B.; Matsumoto, T.; Arthurs, S.P. Field sampling strategies for coffee berry borer (Coleoptera: Curculionidae: Scolytinae) infesting berries in coffee farms in Hawaii. Int. J. Trop. Insect. Sci. 2018, 38, 418–426. [Google Scholar] [CrossRef]
  32. Pulakkatu-thodi, I.; Gutierrez-Coarite, R.; Wright, M.G. Dispersion and optimization of sequential sampling plans for coffee berry borer (Coleoptera: Curculionidae) infestations in Hawaii. Environ. Entomol. 2018, 47, 1306–1313. [Google Scholar] [CrossRef] [PubMed]
  33. Follett, P.A.; Kawabata, A.; Nelson, R.; Asmus, G.; Burt, J.; Goschke, K.; Ewing, C.; Gaertner, J.; Brill, E.; Geib, S. Predation by flat bark beetles (Coleoptera: Silvanidae and Laemophloeidae) on coffee berry borer (Coleoptera: Curculionidae) in Hawaii coffee. Biol. Control 2016, 101, 152–158. [Google Scholar] [CrossRef] [Green Version]
  34. Yousuf, F.; Follett, P.; Gillett, C.; Honsberger, D.; Chamorro, L.; Johnson, M.T.; Giraldo-Jaramillo, M.; Benevides-Machado, P.; Wright, M. Limited host range in the idiobiont parasitoid Phymastichus coffea, a prospective biological control agent of the coffee pest Hypothenemus hampei in Hawaii. J. Pest Sci. 2021, 94, 1183–1195. [Google Scholar] [CrossRef]
  35. Greco, B.E.; Wright, M.G.; Burgueño, J.; Jaronski, S.T. Efficacy of Beauveria bassiana applications on coffee berry borer across an elevation gradient in Hawaii. Biocontrol Sci. Technol. 2018, 28, 995–1013. [Google Scholar] [CrossRef]
  36. Hollingsworth, R.G.; Aristizábal, L.F.; Shriner, S.; Mascarin, G.M.; Moral, R.D.A.; Arthurs, S.P. Incorporating Beauveria bassiana into an integrated pest management plan for Coffee Berry Borer in Hawaii. Front. Sustain. Food Syst. 2020, 4, 22. [Google Scholar] [CrossRef] [Green Version]
  37. Wraight, S.P.; Galaini-Wraight, S.; Howes, R.L.; Castrillo, L.A.; Griggs, M.H.; Carruthers, R.I.; Smith, R.H.; Matsumoto, T.K.; Keith, L.M. Efficacy of Beauveria bassiana strain GHA spray applications against coffee berry borer Hypothenemus hampei on Hawaii Island. Biol. Control 2021, 161, 104587. [Google Scholar] [CrossRef]
  38. Woodill, A.J.; Nakamoto, S.T.; Kawabata, A.M.; Leung, P. To spray or not to spray: A decision analysis of coffee berry borer in Hawaii. Insects 2017, 8, 116. [Google Scholar] [CrossRef] [Green Version]
  39. Woodill, A.J.; Nakamoto, S.T.; Kawabata, A.M.; Leung, P. Optimal spraying strategy to combat the coffee berry borer: A dynamic approach. J. Agric. Food Res. 2021, 4, 100125. [Google Scholar] [CrossRef]
  40. Kawabata, A.M.; Nakamoto, S.T.; Curtiss, R.T. Recommendations for Coffee Berry Borer Integrated Pest Management in Hawai’i 2016; Publication # IP-41; University of Hawaii Manoa: Honolulu, HI, USA, 2016. [Google Scholar]
  41. Kawabata, A.M.; Nakamoto, S.T.; Miyahira, M.; Curtiss, R.T. Recommendations for Coffee Berry Borer Integrated Pest Management in Hawai’i 2020; Publication # IP-47; University of Hawaii Manoa: Honolulu, HI, USA, 2020; Available online: https://www.researchgate.net/publication/350772055_Recommendations_for_Coffee_Berry_Borer_Integrated_Pest_Management_in_Hawai’i_2020 (accessed on 15 June 2022).
  42. Rogers, E.M. Diffusion of Innovations, 4th ed.; The Free Press: New York, NY, USA, 1995. [Google Scholar]
Figure 1. (A) Map of Hawaiian Islands showing initial coffee berry borer (CBB) infestation dates (τh) in each coffee-growing region (h), and (B) Hawaii statewide and regional coffee acreage from 2006 to 2021, and CBB infested acreage following its introduction in 2010. Colors correspond to regions shown on the map. Note that Lanai primarily has wild coffee and no significant commercial coffee farms, and is thus not shown in B.
Insects 14 00350 g001
Figure 2. Coffee berry borer (CBB) infested acreage as a proportion of all coffee acreage in Hawaii (gray), acreage for each of the three management types (B. bassiana only, Early IPM, and Research-based IPM) as a proportion of infested acreage, and total CBB managed acreage as a combination of all three management types (dashed line).
Insects 14 00350 g002
Figure 3. Average coffee yield (pounds of parchment coffee per acre) across all Hawaii farms from 2006 to 2021 and gain in yield due to all combined CBB management beginning in 2011.
Insects 14 00350 g003
Figure 4. Average price per pound (USD) of parchment coffee without CBB management in Hawaii from 2006 to 2021 and gain in price due to all combined CBB management beginning in 2011.
Insects 14 00350 g004
Figure 5. Average revenue (USD per acre) for Hawaii-grown coffee without CBB management from 2006 to 2021 and gain in revenue due to all combined CBB management beginning in 2011.
Insects 14 00350 g005
Figure 6. Average statewide revenue (USD million per year) for Hawaii-grown coffee without CBB management from 2006 to 2021 and gain in statewide revenue due to all combined CBB management beginning in 2011.
Insects 14 00350 g006
Figure 7. Gain in statewide revenue (USD millions) for Hawaii-grown coffee using three CBB management strategies: B. bassiana only (introduced in 2011), early IPM (introduced in 2013), and research-based IPM (introduced in 2016).
Insects 14 00350 g007
Table 1. Observed statewide average coffee yield (parchment pounds per acre) from 2006 to 2021, and statewide yield based on various management scenarios.
Year (t)Statewide Average Yield (Yt)
Beauveria bassiana Only (yBt)Early IPM (yCt)Research-Based IPM (yDt)Infested
Unmanaged (yEt)
Uninfested (yFt)
20061175 1175
20071172 1172
20081261 1261
20091208 1208
20101173 6691337
2011987960 6401280
2012886869 5791159
201310249621090 6411282
2014962857971 5711143
2015957840952 5601120
2016771673763853449897
2017840726822919484967
201896581191910275411082
20199287758789815171033
2020 194985797110855711142
2021 1949918104111636121224
1 Hawaii data source: Coffee 01/26/2021 (usda.gov (accessed on 1 December 2021)).
Table 2. Hawaii statewide average coffee price (USD) per pound for parchment coffee from 2008 to 2021, and statewide price based on various management scenarios.
Year
(t)
Statewide Average Price (Pt)B. bassiana Only (pBt)Early IPM (pCt)Research-Based IPM (pDt)Infested Unmanaged (pEt)Uninfested (pFt)
20086.80 6.80
20093.60 3.60
20103.80 1.854.12
20114.154.30 2.224.94
20125.906.14 3.177.05
20136.206.186.62 3.197.10
20149.128.669.29 4.489.95
20159.388.859.49 4.5810.17
201611.1010.4211.1711.975.3911.97
201711.1010.3411.0911.885.3511.88
201813.4012.2713.1514.096.3414.09
201914.1012.8713.7914.786.6514.78
202011.70 111.2312.0312.905.8012.90
202111.70 111.8012.6513.566.1013.56
1 Hawaii data source: Coffee 01/26/2021 usda.gov. (USDA-NASS online reports a different value) (accessed on 1 December 2021).
Disclaimer/Publisher’s Note: The statements, opinions and data contained in all publications are solely those of the individual author(s) and contributor(s) and not of MDPI and/or the editor(s). MDPI and/or the editor(s) disclaim responsibility for any injury to people or property resulting from any ideas, methods, instructions or products referred to in the content.

