

Population Genetic Structure of a Rare Butterfly in a Fragmented South Florida Ecosystem
 , , and
Abstract
:Simple Summary
Abstract
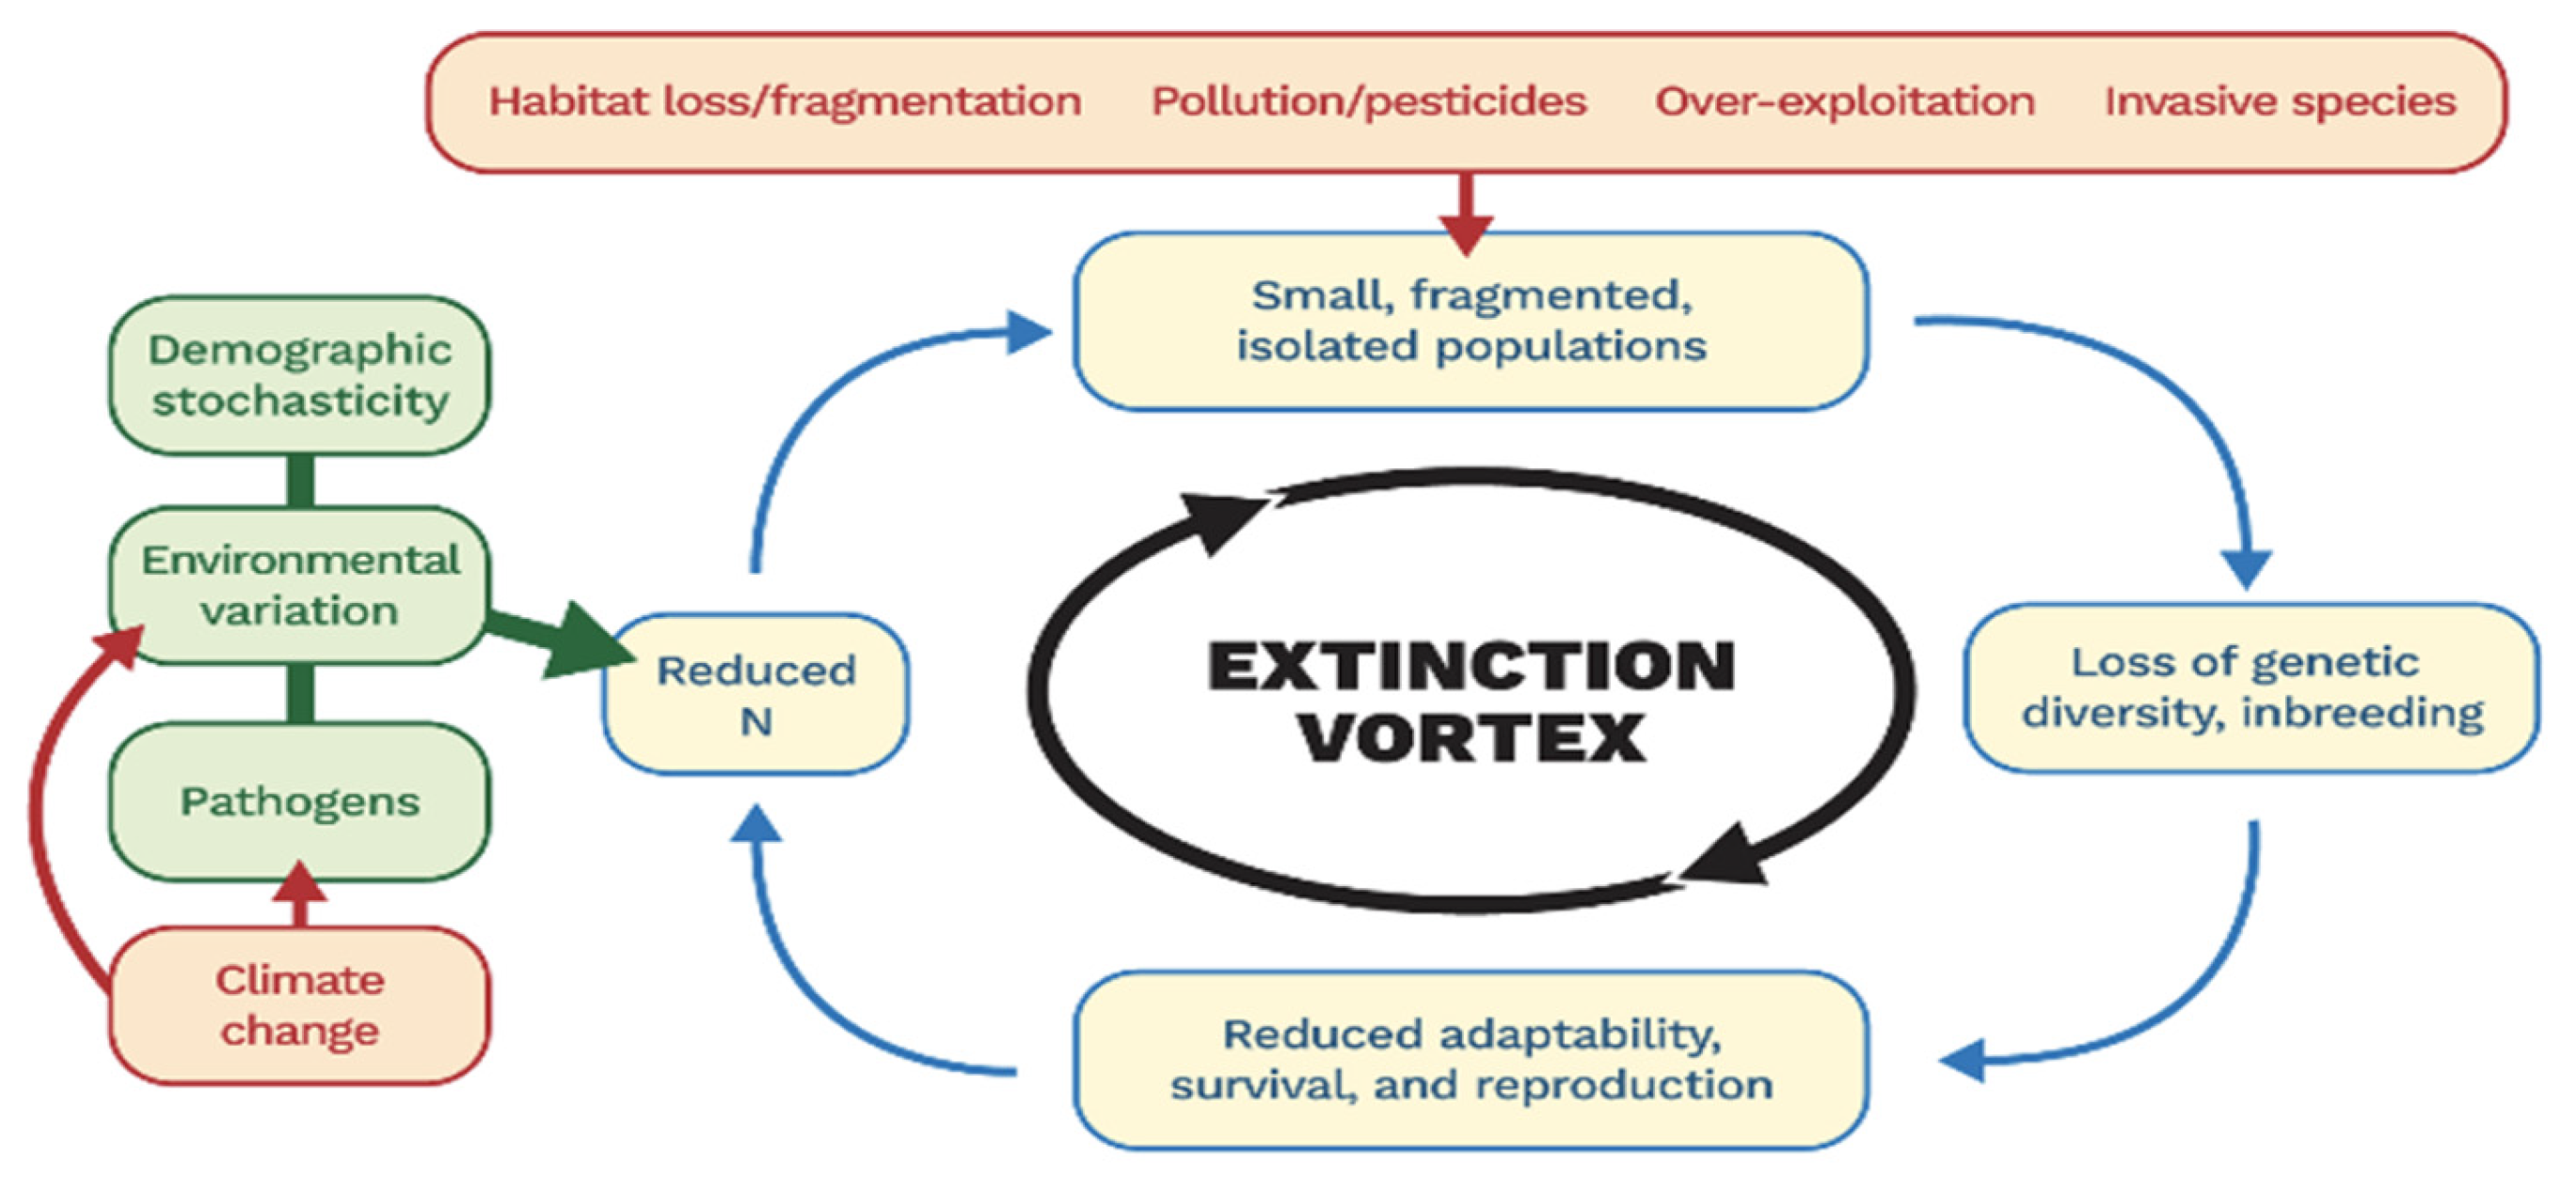
1. Introduction
2. Materials and Methods
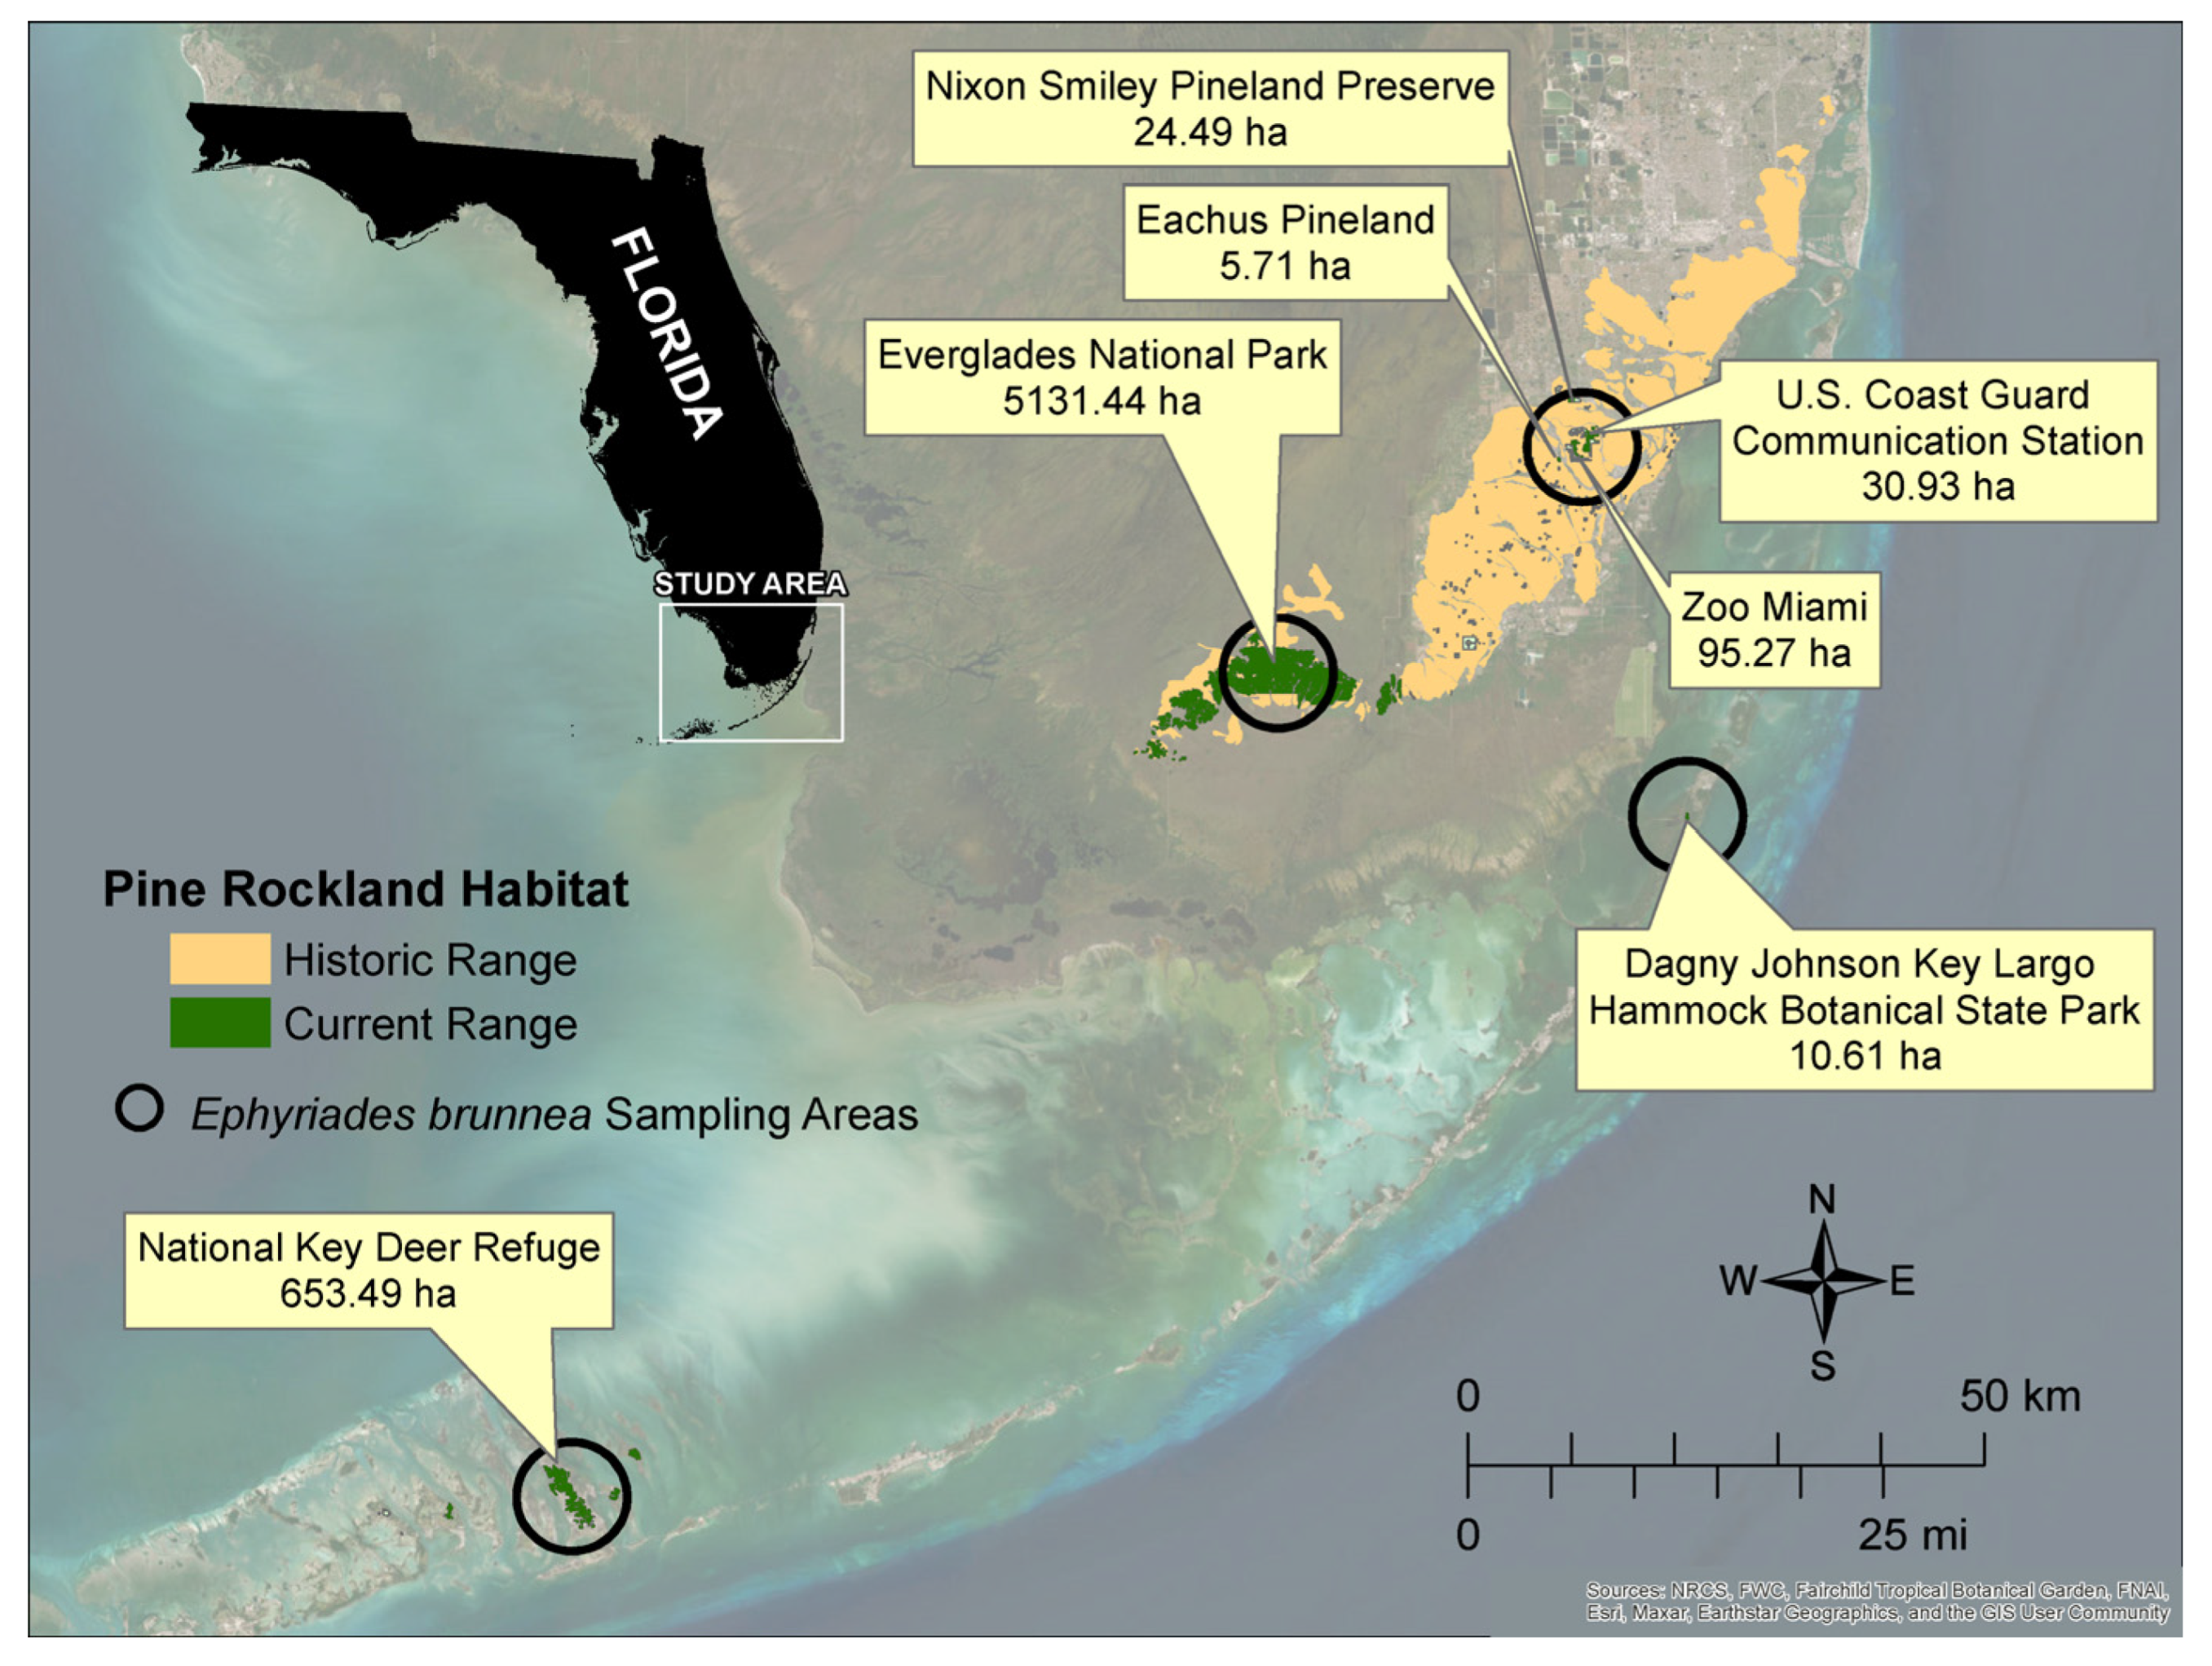
2.1. Study Area
2.2. Site Selection
2.3. Sample Collection and DNA Extraction
2.4. Microsatellite Marker Development and Analyses
2.5. PCR Processing
2.6. Statistical Analyses
2.7. Wolbachia Screening
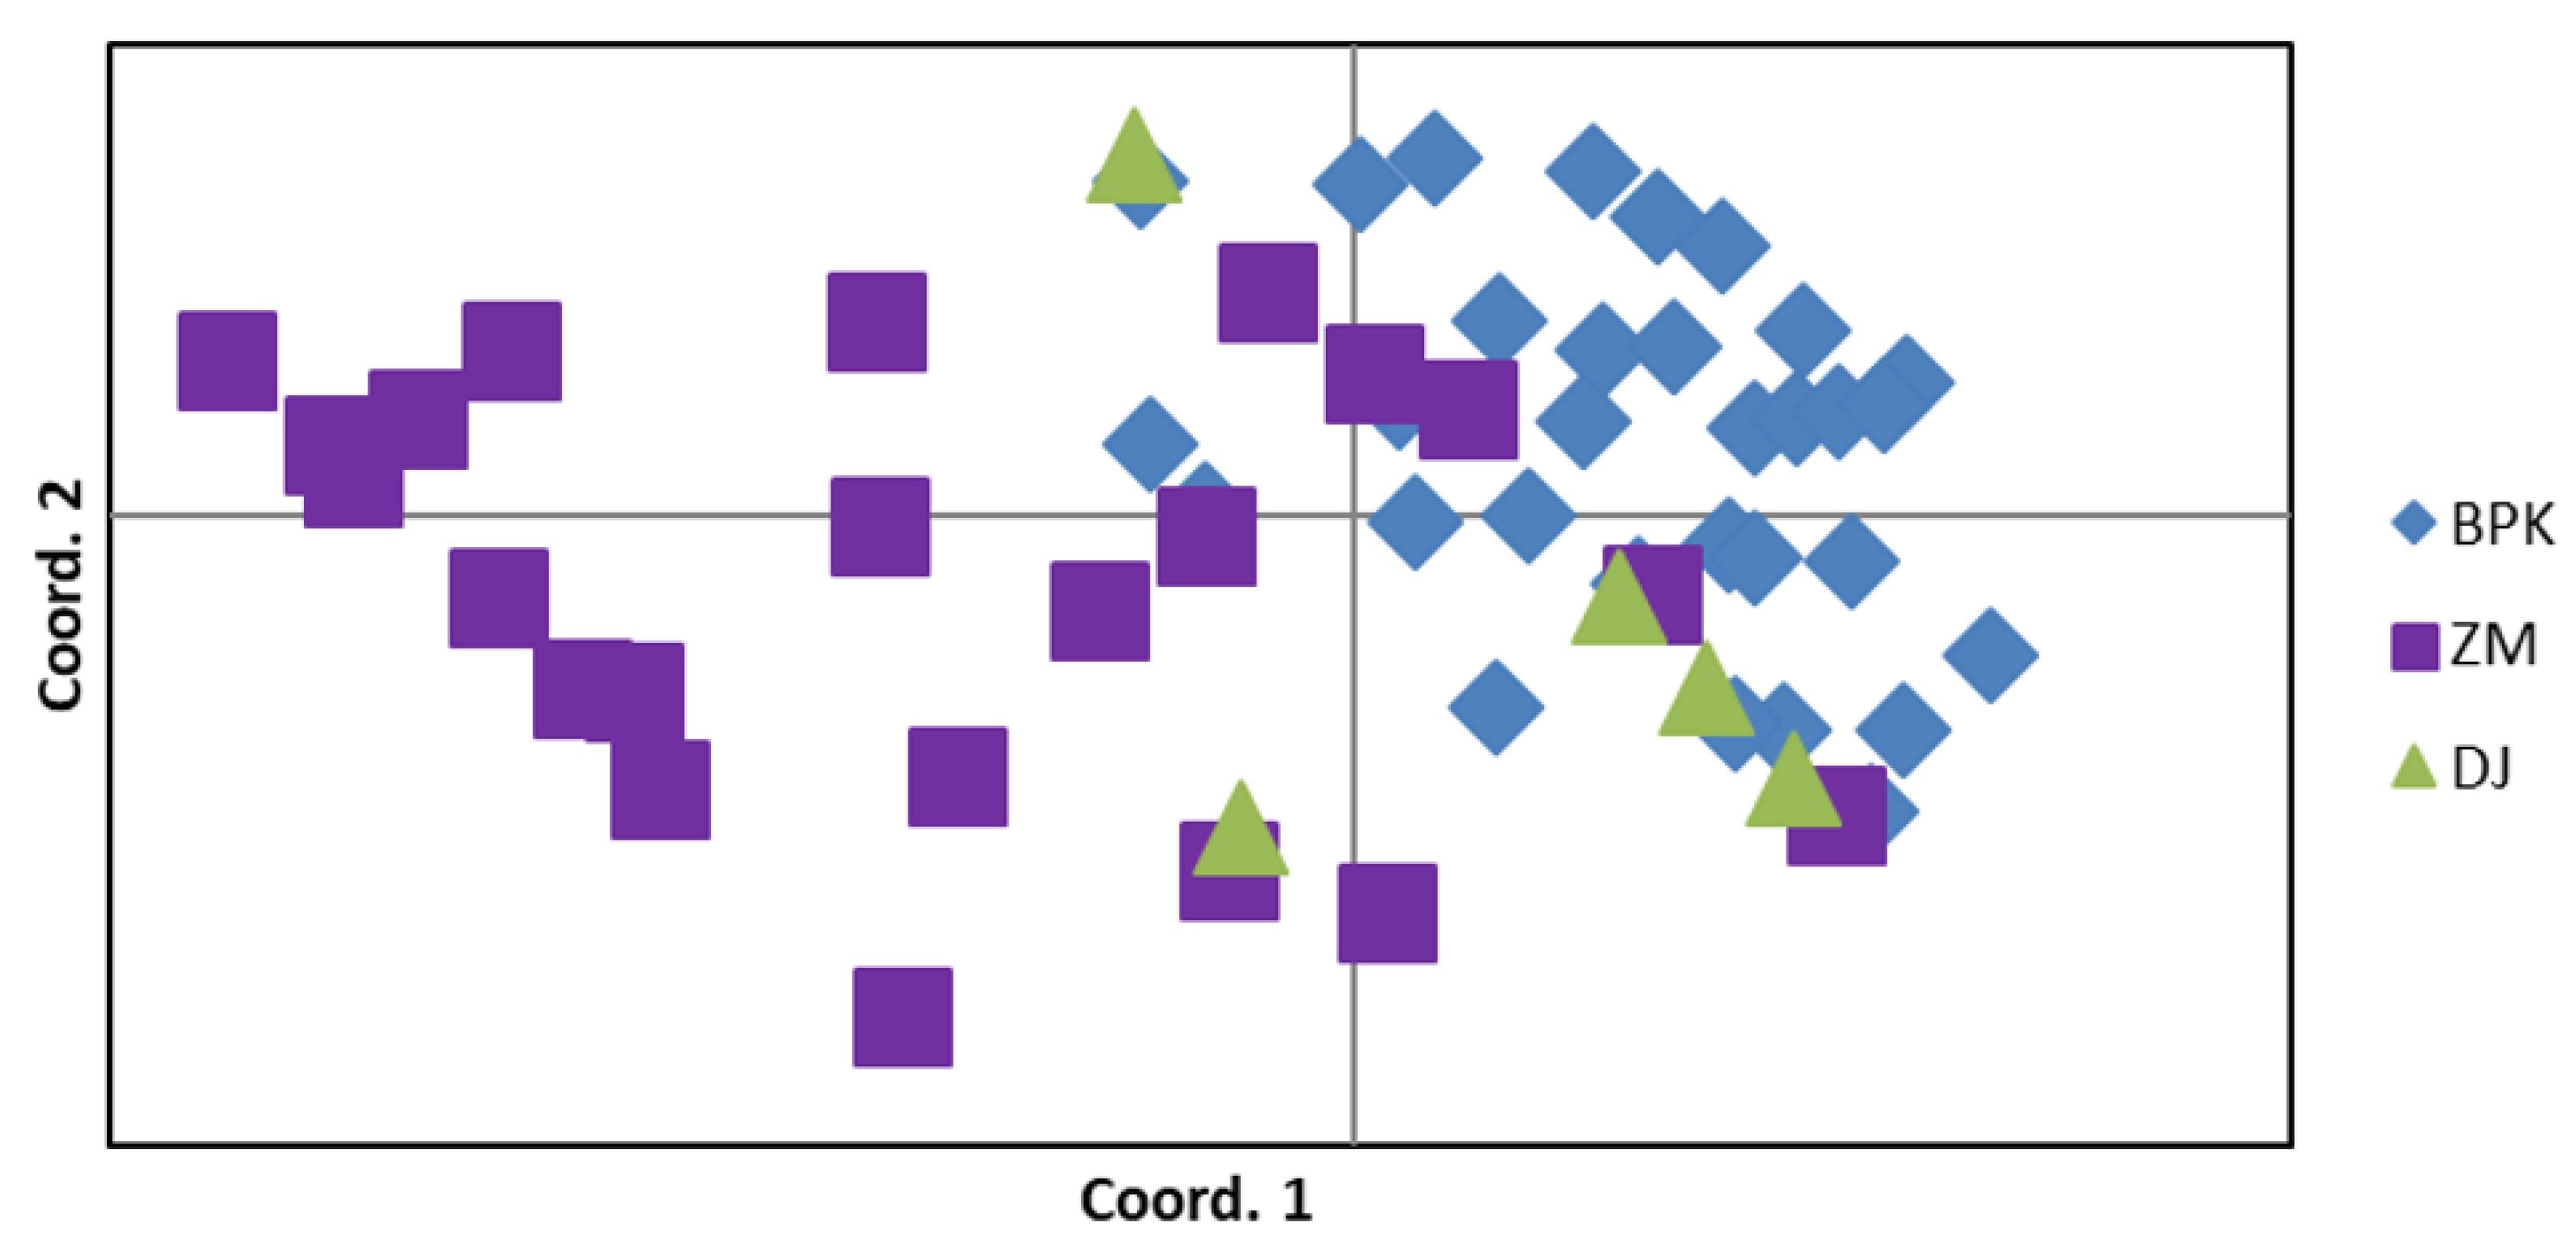
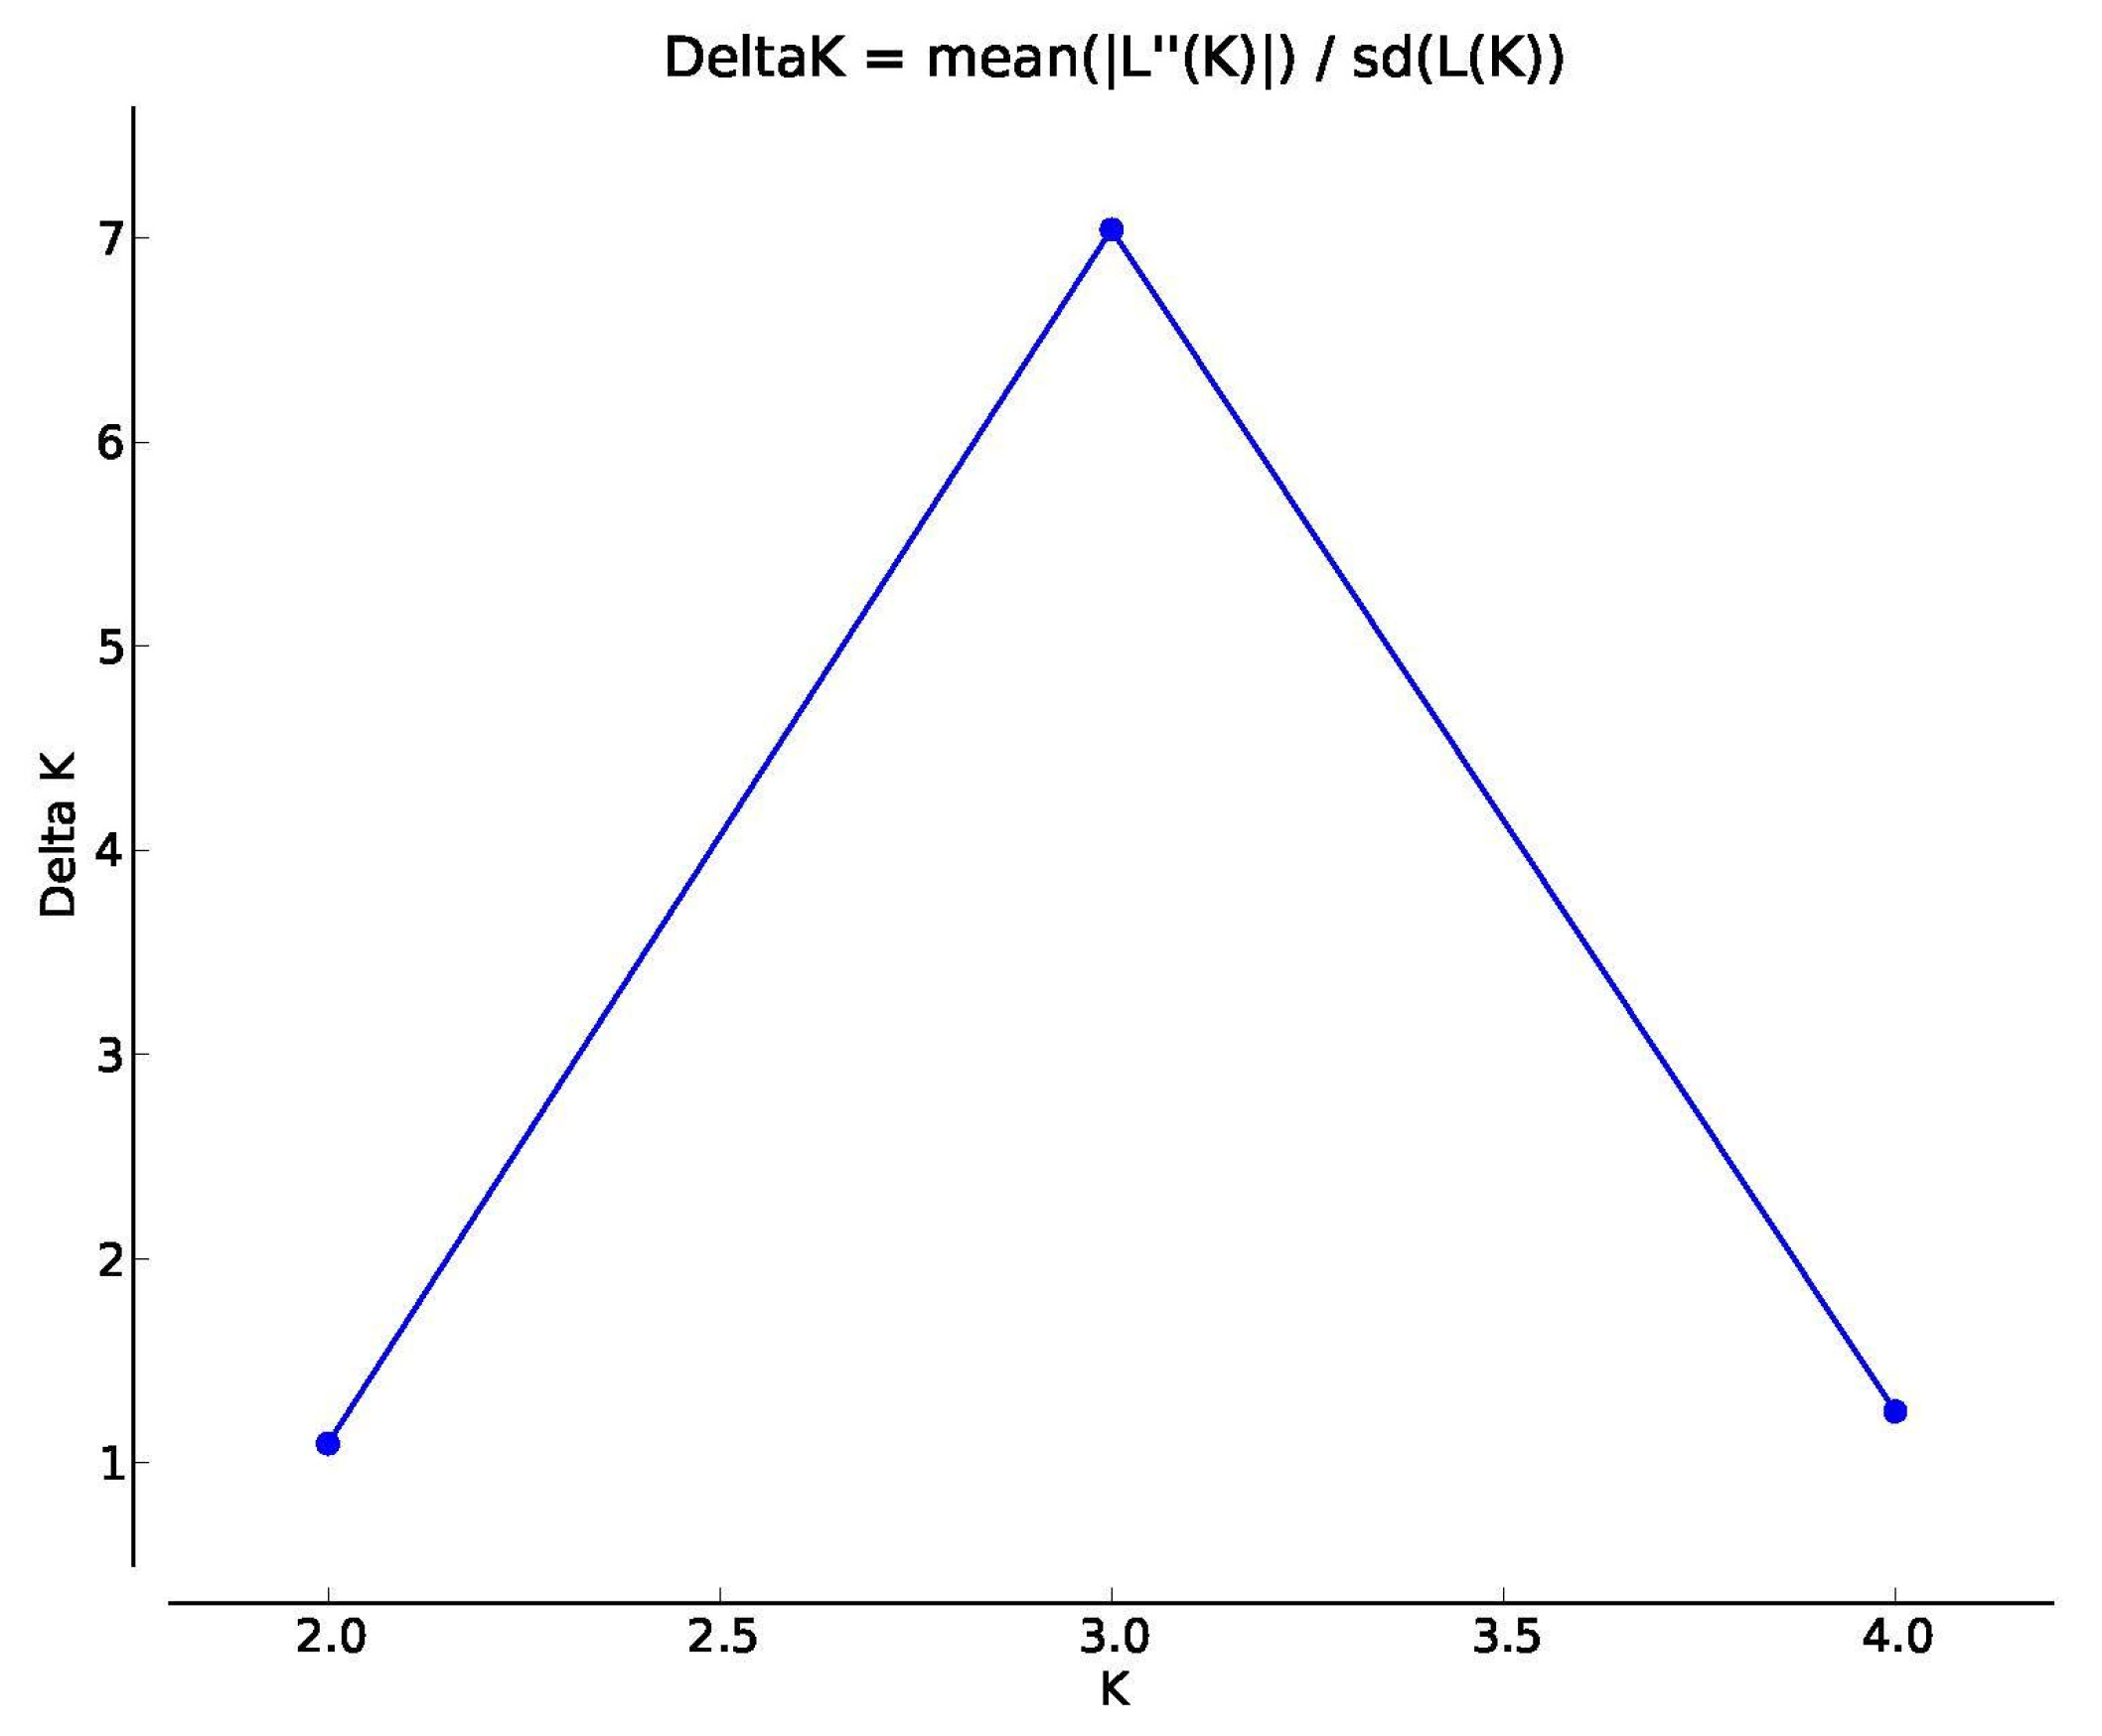
3. Results
3.1. Microsatellite Marker Development and Analyses
3.2. Wolbachia Screening Results
4. Discussion
5. Conclusions
Supplementary Materials
Author Contributions
Funding
Data Availability Statement
Acknowledgments
Conflicts of Interest
References
- Dirzo, R.; Young, H.S.; Galetti, M.; Ceballos, G.; Isaac, N.J.B.; Collen, B. Defaunation in the Anthropocene. Science 2014, 25, 401–406. [Google Scholar] [CrossRef] [PubMed]
- Johnson, C.N.; Balmford, A.; Brook, B.W.; Buettel, J.C.; Galetti, M.; Guangchun, L.; Wilmshurst, J.M. Biodiversity losses and conservation responses in the Anthropocene. Science 2017, 21, 270–275. [Google Scholar] [CrossRef]
- Wagner, D.L.; Granes, E.M.; Forester, M.L.; Berenbaum, M.R.; Stopak, D. Insect decline in the Anthropocene: Death by a thousand cuts. Proc. Natl. Acad. Sci. USA 2021, 118, e2023989118. [Google Scholar] [CrossRef] [PubMed]
- Warren, M.S.; Maes, D.; van Swaay, C.A.M.; Goffart, P.; Van Dyck, H.; Bourn, N.A.D.; Wynhoff, I.; Hoare, D.; Ellis, S. The decline of butterflies in Europe: Problems, significance, and possible solutions. Proc. Natl. Acad. Sci. USA 2021, 118, e2002551117. [Google Scholar] [CrossRef]
- Newbold, T.; Hudson, L.N.; Hill, S.L.L.; Contu, S.; Lysenko, I.; Senior, R.A.; Börger, L.; Bennett, D.J.; Choimes, A.; Collen, B.; et al. Global effects of land use on local terrestrial biodiversity. Nature 2015, 520, 45–50. [Google Scholar] [CrossRef] [Green Version]
- Gilpin, M.E.; Soule, M.E. Minimum viable populations: Processes of species extinction. In Conservation Biology: The Science of Scarcity and Diversity; Soule, M.E., Ed.; Sinauer: Sunderland, MA, USA, 1986; pp. 19–34. [Google Scholar]
- Caughley, G. Directions in conservation biology. J. Anim. Ecol. 1994, 63, 215–244. [Google Scholar] [CrossRef]
- Wootton, T.J.; Pfister, C.A. Experimental separation of genetic and demographic factors on extinction risk in wild populations. Ecology 2013, 94, 2117–2123. [Google Scholar] [CrossRef] [Green Version]
- Kyriazis, C.C.; Wayne, R.K.; Lohmueller, K.E. Strongly deleterious mutations are a primary determinant of extinction risk due to inbreeding depression. Evol. Lett. 2020, 5, 33–47. [Google Scholar] [CrossRef] [PubMed]
- Finger, A.; Schmitt, T.; Zachos, F.E.; Meyer, M.; Assmann, T.; Habel, J.C. The genetic status of the violet copper Lycaena helle—A relict of the cold past in times of global warming. Ecography 2009, 32, 382–390. [Google Scholar] [CrossRef]
- Frankham, R.; Ballou, J.D.; Briscoe, D.A. Introduction to Conservation Genetics; Cambridge University Press: Cambridge, UK, 2002. [Google Scholar]
- Snyder, J.R.; Herndon, A.; Robertson, W.B., Jr. South Florida rockland. In Ecosystems of Florida; Myers, R.L., Ewel, J.J., Eds.; University of Central Florida Press: Orlando, FL, USA, 1990; pp. 230–280. [Google Scholar]
- Florida Fish and Wildlife Conservation Commission (FWC). Florida’s Wildlife Legacy Initiative: Florida’s State Wildlife Action Plan; Florida Fish and Wildlife Conservation Commission: Tallahassee, FL, USA, 2019. [Google Scholar]
- Reece, S.J.; Noss, R.F.; Oetting, J.; Hoctor, T.; Volk, M. A vulnerability assessment of 300 species in Florida: Threats from sea level rise, land use, and climate change. PLoS ONE 2013, 8, e80658. [Google Scholar] [CrossRef] [Green Version]
- Werren, J.H.; Baldo, L.; Clark, M.E. Wolbachia: Master manipulators of invertebrate biology. Nat. Rev. Microb. 2008, 6, 741–751. [Google Scholar] [CrossRef] [PubMed]
- Hamm, C.A.; Aggarwal, D.; Landis, D.A. Evaluating the impact of non-lethal DNA sampling on two butterflies, Vanessa cardui and Satyrodes eurydice. J. Insect Conserv. 2010, 14, 11–18. [Google Scholar] [CrossRef]
- Koscinski, D.; Crawford, L.A.; Keller, H.A.; Keyghobadi, N. Effects of different methods of non-lethal tissue sampling on butterflies. Ecol. Ent. 2011, 36, 301–308. [Google Scholar] [CrossRef]
- Saarinen, E.V.; Reilly, P.F.; Austin, J.D.; Packer, L. Conservation genetics of an endangered grassland butterfly (Oarisma poweshiek) reveals historically high gene flow despite recent and rapid range loss. Insect Conserv. Divers. 2016, 9, 517–528. [Google Scholar] [CrossRef]
- You, F.M.; Huo, N.; Gu, Y.Q.; Lou, M.; Ma, Y.; Hane, D.; Lazo, G.R.; Dvorak, J.; Anderson, O.D. BatchPrimer3: A high throughput web application for PCR and sequencing primer design. BMC Bioinform. 2008, 9, 253. [Google Scholar] [CrossRef] [Green Version]
- Saarinen, E.V.; Austin, J.D. When technology meets conservation: Increased microsatellite marker production using 454 genome sequencing on the endangered Okaloosa darter (Etheostoma okaloosae). J. Hered. 2010, 101, 784–788. [Google Scholar] [CrossRef] [PubMed]
- Altschul, S.; Gish, W.; Miller, W.; Myers, E.; Lipman, D. Basic local alignment search tool. J. Mol. Biol. 1990, 215, 403–410. [Google Scholar] [CrossRef]
- Abdelkrim, J.; Robertson, B.; Stanton, J.A.; Gemmell, N. Fast, cost-effective development of species-specific microsatellite markers by genomic sequencing. BioTechniques 2009, 46, 185–192. [Google Scholar] [CrossRef]
- Hulce, D.; Li, X.; Snyder-Leiby, T.; Johathan Liu, C.S. GeneMarker® Genotyping Software: Tools to Increase the Statistical Power of DNA Fragment Analysis. J. Biomol. Tech. 2011, 22, S35–S36. [Google Scholar]
- Excoffier, L.; Lischer, H.E. Arlequin suite ver 3.5: A new series of programs to perform population genetics analyses under Linux and Windows. Mol. Ecol. Resour. 2010, 10, 564–567. [Google Scholar] [CrossRef]
- Rice, W.R. Analyzing tables of statistical tests. Evolution 1989, 43, 223–225. [Google Scholar] [CrossRef]
- Peakall, R.; Smous, P.E. GenAlEx 6.5: Genetic analysis in Excel. Population genetic software for teaching and research—An update. Bioinform 2012, 28, 2537–2539. [Google Scholar] [CrossRef] [Green Version]
- Merimans, P.G.; Hedrick, P.W. Assessing Population Structure: FST and Related Measures. Mol. Ecol. Resor. 2011, 11, 5–18. [Google Scholar] [CrossRef] [PubMed]
- Pritchard, J.K.; Stephens, P.; Donnelly, P. Inference of population structure using multilocus genotype data. Genetics 2010, 155, 945–959. [Google Scholar] [CrossRef]
- Earl, D.A.; Vonholdt, B.M. Structure Harvester: A website and program for visualizing Structure output and implementing the Evanno method. Conserv. Gen. Resour. 2012, 4, 359–361. [Google Scholar] [CrossRef]
- Evanno, G.; Regnaut, S.; Goudet, J. Detecting the number of clusters of individuals using the software STRUCTURE: A simulation study. Mol. Ecol. 2005, 14, 2611–2620. [Google Scholar] [CrossRef] [PubMed] [Green Version]
- Jakobsson, M.; Rosenberg, N.A. CLUMPP: A cluster matching and permutation program for dealing with label switching and multimodality in analysis of population structure. Bioinformatics 2007, 23, 1801–1806. [Google Scholar] [CrossRef] [Green Version]
- Rosenberg, N.A. DISTRUCT: A program for the graphical display of population structure. Mol. Ecol. 2004, 4, 137–138. [Google Scholar] [CrossRef]
- Nice, C.C.; Gompert, Z.; Forister, M.L.; Fordyce, F.A. An unseen foe in arthropod conservation efforts: The case of Wolbachia infections in the Karner blue butterfly. Biol. Conserv. 2009, 142, 3137–3146. [Google Scholar] [CrossRef]
- Sucháčková Bartoňová, A.; Konvička, M.; Marešová, J.; Wiemers, M.; Ignatev, N.; Wahlberg, N.; Schmitt, T.; Fric, Z.F. Wolbachia affects mitochondrial population structure in two systems of closely related Palaearctic blue butterflies. Sci. Rep. 2021, 11, 3019. [Google Scholar] [CrossRef]


| Population | N | Na | Ne | Ho | He | F |
|---|---|---|---|---|---|---|
| BPK | 31 | 6.600 | 4.604 | 0.497 | 0.660 | 0.254 |
| ZooMiami | 22 | 5.200 | 3.949 | 0.523 | 0.608 | 0.169 |
| DagnyJohnson | 5 | 1.800 | 1.557 | 0.160 | 0.320 | 0.583 |
| NixonSmiley | 3 | 1.600 | 1.477 | 0.467 | 0.256 | −0.733 |
| CoastGuard | 7 | 2.800 | 2.234 | 0.373 | 0.528 | 0.345 |
| EachusPineland | 3 | 2.600 | 2.357 | 0.467 | 0.522 | 0.068 |
| ENP | 10 | 3.400 | 2.534 | 0.582 | 0.513 | −0.142 |
| K | Mean LnP(K) | Stdev LnP(K) | Ln′(K) | [Ln″(K)] | DeltaK |
|---|---|---|---|---|---|
| 1 | −792.850 | 0.416 | – | – | – |
| 2 | −832.895 | 57.481 | −40.045 | 62.955 | 1.095 |
| 3 | −809.985 | 12.901 | 22.910 | 90.845 | 7.042 |
| 4 | −877.920 | 47.633 | −67.935 | 59.680 | 1.253 |
| 5 | −886.175 | 24.719 | −8.255 | – | – |
Disclaimer/Publisher’s Note: The statements, opinions and data contained in all publications are solely those of the individual author(s) and contributor(s) and not of MDPI and/or the editor(s). MDPI and/or the editor(s) disclaim responsibility for any injury to people or property resulting from any ideas, methods, instructions or products referred to in the content. |
© 2023 by the authors. Licensee MDPI, Basel, Switzerland. This article is an open access article distributed under the terms and conditions of the Creative Commons Attribution (CC BY) license (https://creativecommons.org/licenses/by/4.0/).
Share and Cite
Heffernan, E.; Markee, A.; Truglio, M.R.; Barkdull, M.; Steele Cabrera, S.; Daniels, J. Population Genetic Structure of a Rare Butterfly in a Fragmented South Florida Ecosystem. Insects 2023, 14, 321. https://doi.org/10.3390/insects14040321
Heffernan E, Markee A, Truglio MR, Barkdull M, Steele Cabrera S, Daniels J. Population Genetic Structure of a Rare Butterfly in a Fragmented South Florida Ecosystem. Insects. 2023; 14(4):321. https://doi.org/10.3390/insects14040321
Chicago/Turabian StyleHeffernan, Emily, Amanda Markee, Mary R. Truglio, Megan Barkdull, Sarah Steele Cabrera, and Jaret Daniels. 2023. "Population Genetic Structure of a Rare Butterfly in a Fragmented South Florida Ecosystem" Insects 14, no. 4: 321. https://doi.org/10.3390/insects14040321