Article

Global Distribution of Aedes aegypti and Aedes albopictus in a Climate Change Scenario of Regional Rivalry

by
Gabriel Z. Laporta
1,*,
Alexander M. Potter
2,3,4,
Janeide F. A. Oliveira
1,5,
Brian P. Bourke
2,3,4,
David B. Pecor
2,3,4 and
Yvonne-Marie Linton
2,3,4
1
Graduate Research and Innovation Program, Centro Universitario FMABC, Santo André 09060-870, SP, Brazil
2
One Health Branch, Walter Reed Army Institute of Research, Silver Spring, MD 20910, USA
3
Walter Reed Biosystematics Unit, Smithsonian Museum Support Center, Suitland, MD 20746, USA
4
Department of Entomology, Smithsonian Institution—National Museum of Natural History (NMNH), Washington, DC 20560, USA
5
Department of Civil Engineering, School of Engineering, Campus Crajubar, Universidade Regional do Cariri, Crato 63105-010, CE, Brazil
*
Author to whom correspondence should be addressed.
Insects 2023, 14(1), 49; https://doi.org/10.3390/insects14010049
Submission received: 18 November 2022 / Revised: 17 December 2022 / Accepted: 30 December 2022 / Published: 3 January 2023
(This article belongs to the Special Issue Vector-Borne Diseases in a Changing World)

Abstract

:

Simple Summary

Aedes aegypti and Aedes albopictus mosquitos pose threats of arboviral disease emergence to humans in future climates. Unique mosquito georeferenced data from VectorMap and comprehensive environmental data from WorldClim v. 2.1 were herein used to analyze a global scenario of climate change under a socioeconomic pathway of regional rivalry. Results showed that this shared socioeconomic pathway is likely to affect vector-borne diseases. Climate changes on both vector species distributions will surely have major impacts on public health decision making.

Abstract

Arboviral mosquito vectors are key targets for the surveillance and control of vector-borne diseases worldwide. In recent years, changes to the global distributions of these species have been a major research focus, aimed at predicting outbreaks of arboviral diseases. In this study, we analyzed a global scenario of climate change under regional rivalry to predict changes to these species’ distributions over the next century. Using occurrence data from VectorMap and environmental variables (temperature and precipitation) from WorldClim v. 2.1, we first built fundamental niche models for both species with the boosted regression tree modelling approach. A scenario of climate change on their fundamental niche was then analyzed. The shared socioeconomic pathway scenario 3 (regional rivalry) and the global climate model Geophysical Fluid Dynamics Laboratory Earth System Model v. 4.1 (GFDL-ESM4.1; gfdl.noaa.gov) were utilized for all analyses, in the following time periods: 2021–2040, 2041–2060, 2061–2080, and 2081–2100. Outcomes from these analyses showed that future climate change will affect Ae. aegypti and Ae. albopictus distributions in different ways across the globe. The Northern Hemisphere will have extended Ae. aegypti and Ae. albopictus distributions in future climate change scenarios, whereas the Southern Hemisphere will have the opposite outcomes. Europe will become more suitable for both species and their related vector-borne diseases. Loss of suitability in the Brazilian Amazon region further indicated that this tropical rainforest biome will have lower levels of precipitation to support these species in the future. Our models provide possible future scenarios to help identify locations for resource allocation and surveillance efforts before a significant threat to human health emerges.

1. Introduction

Aedes aegypti (Linnaeus, 1762) and Ae. albopictus (Skuse, 1895) are two of the most prolific mosquito vector species in the world. Both species are found on every continent—except the Antarctic—and have played major roles in various vector-borne disease outbreaks over the last century [1,2,3]. They are known vectors of the viruses that cause yellow fever (YFV), dengue (DENV), chikungunya (CHIKV) and Zika (ZIKV) [4,5,6,7,8]. The distribution of these species is also changing, driven in part by global climate change [9]. Distribution modelling studies have demonstrated that the distribution of these species are expected to dramatically change during the next century as habitats that have previously been inhospitable become favorable [10,11]. These changes in distribution patterns will represent significant challenges to public health, as mosquito surveillance and control strategies will not be able to rely on historical population trends. In short, the predicted magnitude and pace of climate change will render our historical experience obsolete [12]. Both species have successfully spread across the globe in part because of their close association with humans, but also because the eggs of both species can become desiccated for long periods of time and still be viable once exposed to water [13]. Resistance to desiccation facilitates passive transportation of eggs through global trade, thereby triggering Aedes invasion into new locations [14]. One key example of this passive dispersal is the repeated migration events led by the used-tire shipping industry [14].
VectorMap—a product of the Walter Reed Biosystematics Unit (WRBU)—is the world’s largest and most comprehensive web-based repository for arthropod vector collection data [15]. The VectorMap project has captured vector surveillance data for all key vector taxa, but the greatest number of records belong to Ae. albopictus and Ae. aegypti. The dataset includes the most significant publication of surveillance data for these two species in recent years [2]. In addition to data extracted from the literature, VectorMap also contains numerous specimen records from the United States National Museum (USNM) collection and numerous WRBU collaborators who have submitted their data to be included in the VectorMap database.
Currently, Ae. aegypti is established in 167 countries [16]. Aedes aegypti is human-centered, as it shows multiple events of synanthropic adaptation worldwide [17,18]. It is this close association with humans that has made this species such an important vector of pathogens to humans. Aedes aegypti environmental suitability has expanded globally by as much as 1.5% per decade since 1950 and this trend is expected to accelerate over the next century [9]. In Latin America and the Caribbean, extreme events of above-average temperatures are causing Ae. aegypti populations to adapt to new habitats including underground oviposition and resting sites [19]. Even areas that are expected to receive far less rainfall may be at risk [20]. In East Africa, increased use of water storage containers by humans in response to drought conditions has led to a rise in CHIKV cases as Ae. aegypti will readily lay eggs, and immatures can raise, in these containers [20].
Originally native to southeast Asia, Ae. albopictus is now known to occur in 126 countries world-wide [16]. It’s range is also expected to expand as temperatures rise [21]. Both winter and summer temperatures are the most significant factors currently limiting Ae. albopictus distribution in southern Europe and preventing its expansion to northern and western Europe [21]. Aedes albopictus will readily exploit artificial containers for immature development, and can exist in sympatry with Ae. aegypti immatures. This species will also utilize a wide variety of natural environments which may give them an edge when competing against other species. There is also evidence that Ae. albopictus is much more resilient than Ae. aegypti in areas that experience frequent temperature changes, such as more temperate areas [22]. This flexibility may allow Ae. albopictus to outcompete Ae. aegypti in certain areas, further complicating our knowledge and predictions of species distributions.
Several species distribution models (SDMs) have been developed for these important mosquito species in recent years [1,9,23,24,25,26]. However, previous models are limited to specific geographic regions and incorporate a limited number of surveillance records. Here, we present SDMs predicting the global distribution of Ae. aegypti and Ae. albopictus, developed using the most comprehensive database of occurrences ever assembled. We have developed global SDMs using environmental layers (temperature, precipitation), future climate projections through to the year 2100 in twenty-year spans, and a database of occurrence data.
It is our main goal to present global distributions of Ae. aegypti and Ae. albopictus in a climate change scenario of regional rivalry. The Intergovernmental Panel on Climate Change (IPCC) proposed five Shared Socioeconomic Pathway (SSP) scenarios in the 2021 report [27]. The first is SSP1 (+1.9 W/m2), that represents the most optimistic scenario because it assumes a global warming below 1.5 °C by 2100 and a lower frequency of extreme events in the century [27]. At the opposite end, SSP5 (+8.5 W/m2) is the most pessimistic, assuming the highest warming of future greenhouse gas emissions [27]. At intermediate positions, SSP2-4.5 and SSP1-2.6 are scenarios with stronger mitigation of greenhouse gas emissions and thus lower future warming levels [27]. Lastly, SSP3-7.0 is the regional rivalry scenario and is characterized by increasing levels of CO2 emissions that are assumed to double by 2100 [27]. More importantly, the SSP3-7.0 scenario assumes that mitigation of greenhouse gas emissions and adaptation for socio-economic challenges will be undermined by regional rivalry [28]. Evidence of regional rivalry has been seen with the reemergence of right-wing extremism in Brazil and elsewhere (US and Europe), which raises uneasiness about resolving issues of global concern, including Amazonian conservation, pandemics and climate change [29].

2. Materials and Methods

2.1. Data Description

Occurrence data for Ae. aegypti and Ae. albopictus were downloaded from VectorMap (vectormap.si.edu), developed and maintained by the Walter Reed Biosystematics Unit (WRBU). Data were compiled from three sources: (1) peer-reviewed literature, (2) museum specimen records, and (3) publicly available mosquito surveillance records. VectorMap documents 93 fields of information for each record, including taxonomy, location site description, and collection method. Collection sites are georeferenced using the point radius method using coordinates reported by authors/data submitters and named places were assigned coordinates from an online gazetteer [30,31]. A search of the VectorMap mosquito map service was carried out on January 12th, 2022. The use of Species = “aegypti” returned 32,251 total records, while Species = “albopictus” returned 43,987 total records. Literature offered the greatest number of presence records with data generated from 29 articles. Additional records were sourced from USNM mosquito specimen records digitized and uploaded to VectorMap by WRBU. Finally, data were also sourced from surveillance records submitted to VectorMap by the Armed Forces Health Surveillance Division-Global Emerging Infections Surveillance (AFHSD-GEIS) global network.

2.2. Data Preparation

The crude data were imported into the R v. 4.0.4 program (The R Foundation for Statistical Computing, Vienna, Austria) using tidyverse v. 1.3.1 (tidyverse.org) by selecting three columns (‘Species’, ‘Decimal Latitude’, and ‘Decimal Longitude’) and by filtering the species type (Ae. aegypti or Ae. albopictus) to generate a species occurrence data per each species.
Two procedures for the preparation of data were further applied on the species occurrence data. The first procedure removed all duplicates, i.e., specimens captured in the same location, to guarantee that each point coordinate had a unique value of latitude and longitude. This procedure was undertaken by using the R function duplicated in the base package. A map of world country administrative boundaries with oceans in the maptools package was overlapped by the remaining point coordinates. All point coordinates were checked and any landing in the ocean were removed. The final species occurrence data for Ae. aegypti (N = 9735) and Ae. albopictus (N = 13,093) were free of duplicated and non-land georeferenced latitudes and longitudes.

2.3. Environmental Data

Global climate data for 1970–2000 and future climate data for 2021–2100 were obtained from WorldClim v. 2.1 (worldclim.org). Thirty-six environmental layers with spatial resolution of ~4 × 4 km2 were selected, as follows: (layers 1–12) average minimum temperature (°C) January–December; (layers 13–24) average maximum temperature (°C) January–December and (layers 25–36) total precipitation (mm) January–December. These variables were selected because of their strong link with the ecological niche of both species, thereby having a combined relative contribution as high as 77.6% and 74.3% among all covariates on Ae. aegypti and Ae. albopictus global distribution, respectively [1]. They were employed to build a fundamental niche model and then estimate future potential distributions.
The SSP3 (+7.0 W/m2) was the scenario chosen for the projections of future climate data [28]. This was selected because it represents a likely scenario for this century. The emergence of right-wing extremism in Brazil and in other liberal countries (e.g., USA) can yield regional rivalry. Regional conflicts, including the current war in Ukraine, will push global issues (e.g., control of greenhouse gas emissions) into the background and tropical rainforests will be disproportionately impacted. This scenario is already occurring in the Brazilian Amazon [29].
The Global Climate Model (GCM) herein selected in WorldClim v. 2.1 had been downscaled from the Coupled Model Intercomparison Project phase 6 (CMIP6). The GCM selected here was the Geophysical Fluid Dynamics Laboratory Earth System Model v. 4.1 (GFDL-ESM4.1; gfdl.noaa.gov) of the National Oceanic and Atmospheric Administration (NOAA). This 4th generation of an earth system model contains future outcomes of temperature and precipitation based on interactions of major components of natural and anthropogenic processes (CO2, dust, iron, and nitrogen) that influence the climate system.
Future time periods considered for the modelling of potential distributions of Ae. aegypti and Ae. albopictus were 2021–2040, 2041–2060, 2061–2080, and 2081–2100.

2.4. Model Building, Fitting, and Evaluation

Species occurrence data (i.e., presence data) were randomly sorted into training data (75% of presence data) and testing data (25% of presence data). Training data were utilized for model fitting, whereas testing data were used for model evaluation.
Pseudo-absence data were obtained by selecting random point coordinates of training (n = 250) and testing (n = 62) from probability of occurrence = 0 (blue color) of the global maps of predicted distribution of Ae. aegypti and Ae. albopictus [1]. This approach is used for generating the non-presence class for generalized boosted regression models [32]. It means unsuitable places where species absences are more likely, a.k.a. pseudo-absence [33].
A generalized boosted regression tree model fitting was run using the R function gbm.step in the dismo package. The dataset of analysis consisted of values of presence(=1)/pseudo-absence(=0) of each species and geographically corresponding extracted values of environmental layers. This geographical correspondence was attained by extracting values of environmental layers per point coordinates of presences and pseudo-absences. The dataset of analysis (y = presence/pseudo-absence, X1–36 = environmental layers) was divided into 10 subsets of equal stratification between presences and pseudo-absences for fitting 10 submodels that had their results cross-validated according to [34]. Deviance from results of cross-validation among the submodels was calculated step-by-step. In each step, forward model complexity (number of regression trees) increased to improve model fitting and thus decrease deviance. The optimum complexity (i.e., the minimum deviance) was selected to adjust data and estimate contributions of environmental variables on presence/pseudo-absence of each species.
The fitted model with the training data was then evaluated by assessing its accuracy level to correctly predict presences and pseudo-absences in the testing data. The number of errors of omission (missing presences) and commission (missing pseudo-absences) vs. the number of correctly identified presences and pseudo-absences were used to calculate a cut-off at which the sum of sensitivity (true positive rate) and specificity (true negative rate) is highest.

2.5. Spatial Prediction

The fitted and evaluated model was applied to spatially predict the probability of presence of Ae. aegypti and Ae. albopictus across all continents in the world. The probability of presence meant a fundamental niche to the global climate data for 1970–2000 and meant potential distribution to each future climate data period (2021–2040, 2041–2060, 2061–2080, and 2081–2100). Technically, a raster object was built with predictions from the fitted model over environmental raster data using the R function predict in the raster package. This approach has been commonly used for species distribution modelling elsewhere [32].

3. Results

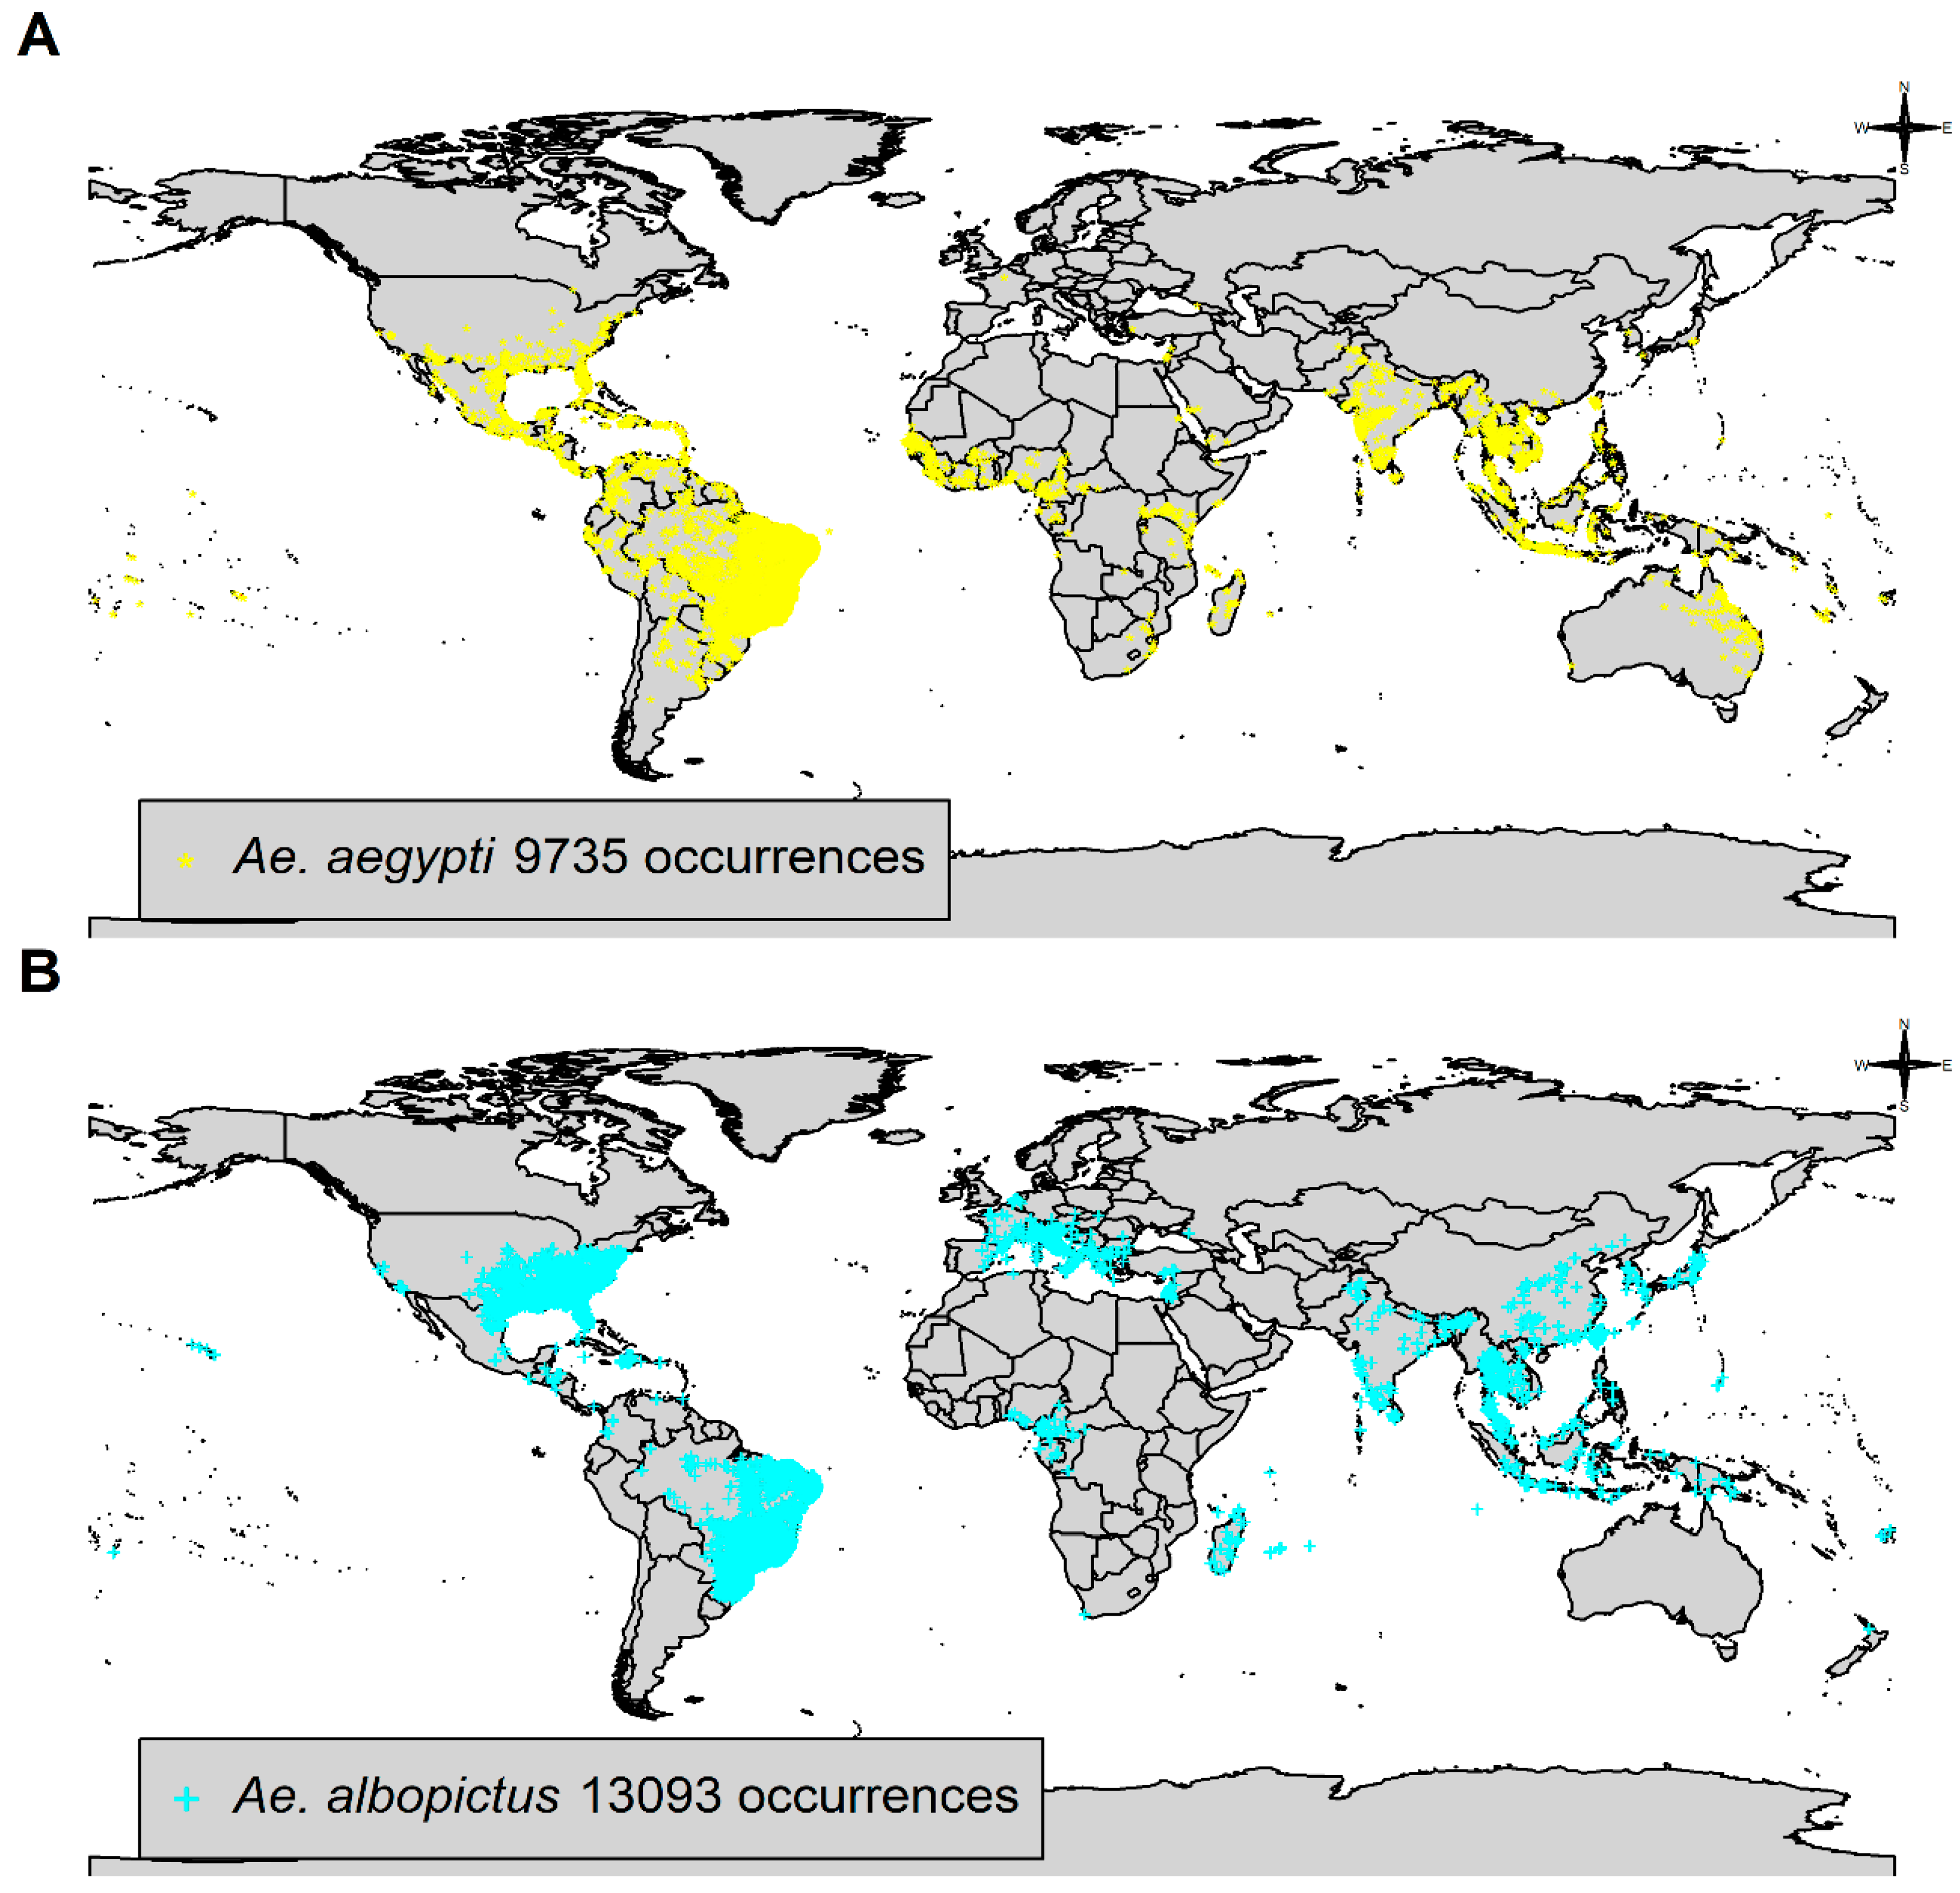
3.1. Species Occurrence Data

Aedes aegypti occurrence data showed 9,735 presence records in 114 countries (Figure 1A). Country distribution was unequal towards countries in the tropical and subtropical zones, including Brazil (n = 4780; 49.1%), Taiwan (n = 817; 8.4%), Indonesia (n = 421; 4.3%), Thailand (n = 398; 4.1%), United States (n = 337; 3.5%), India (n = 331; 3.4%), Mexico (n = 328; 3.4%), Kenya (n = 240; 2.5%), Australia (n = 169; 1.7%), and Viet Nam (n = 156; 1.6%) with highest numbers of presence records among the 114 countries (Figure 1A).
Aedes albopictus presence records (n = 13,093) were noted from 85 countries (Figure 1B). This occurrence data showed distribution towards higher latitudes in the northern hemisphere (Europe, United States, and Japan) in addition to the expected tropical and subtropical countries (e.g., Brazil). United States of America (n = 6135) and Brazil (n = 3360) contributed 72.5% of occurrence data (Figure 1B).

3.2. Environmental Data

Climate data 1970–2000 and future climate projections 2021–2100 of GFDL-ESM4.1 in SSP3-7.0 showed variation of precipitation and temperature in northern and southern hemispheres. Temperature showed a linear increase over time in both hemispheres. Precipitation increased or decreased over time depending on the region of the world. In Washington DC, the capital of the United States, annual average temperature and annual total precipitation increased from 1100 mm and 13.2 °C in 1970–2000 to 1269 mm and 17.1 °C in 2081–2100. In Brasilia, the capital of Brazil, the annual average temperature also increased by 3.9 °C (range: 20.3–24.2 °C), but annual total precipitation decreased by 207 mm (range: 1539–1332 mm) in 2081–2100 vs. 1970–2000. Future climate projections showed that both northern and southern hemispheres will become hotter in the future, but the northern hemisphere will get wetter, whereas the southern hemisphere will get drier.

3.3. Boosted Regression Tree Model

The fitted model for Ae. aegypti had 1450 iterations performed. The evaluation showed that the fitted model had very good reliability and was able to classify presence and pseudo-absence correctly (Figure S1, Supplementary Material). The receiver operating characteristic (ROC) area under the curve (AUC) was 0.995 and the threshold that maximized the sum of sensitivity and specificity was 0.845. This threshold was further used in the spatial prediction (see below in Section 3.4). The relative influences of environmental variables on the fitted model were 50.71% of average maximum temperature, 24.02% of average minimum temperature, and 25.27% of total precipitation. The most important predictor was maximum temperature in October (relative contribution = 15.4%). Relative contribution and response curves per top 15 predictors are shown in Figure S2 (Supplementary Material). A more precise assessment at fitted values in relation to the most important predictor in the model (maximum temperature in October) is in Figure S3 (Supplementary Material). The optimum range of average maximum temperature was between 18–37 °C. The lowest average minimum temperature should exceed 10 °C for higher probabilities of presence. Monthly precipitation above 10 mm and up to 280 mm had the maximum probability of occurrence.
The fitted model for Ae. albopictus had less iterations performed than the one for Ae. aegypti, equaling 1050. Evaluation of this model showed that its AUC was approximately 1.0 and its threshold that maximizes sensitivity + specificity was 0.995. This fitted model was thus considered highly reliable in predicting the probability of presence of Ae. albopictus (Figure S4, Supplementary Material). Additionally, the relative influences of environmental variables on this fitted model were different when compared to those of the previous fitted model for Ae. aegypti. For the fitted model of Ae. albopictus, the relative contribution was 49.48% of average minimum temperature, 32.62% of total precipitation, and 17.91% of average maximum temperature. The top three predictors were: minimum temperature in October (relative contribution = 22.6%), precipitation in April (20%), and minimum temperature in September (17.8%) (Figures S5 and S6—Supplementary Material). This species can tolerate average minimum temperatures down to 6 °C. The optimum range of average maximum temperature 9–31 °C was cooler than that of Ae. aegypti. The optimum range of total precipitation was narrower in Ae. albopictus and was estimated at between 50–230 mm monthly.

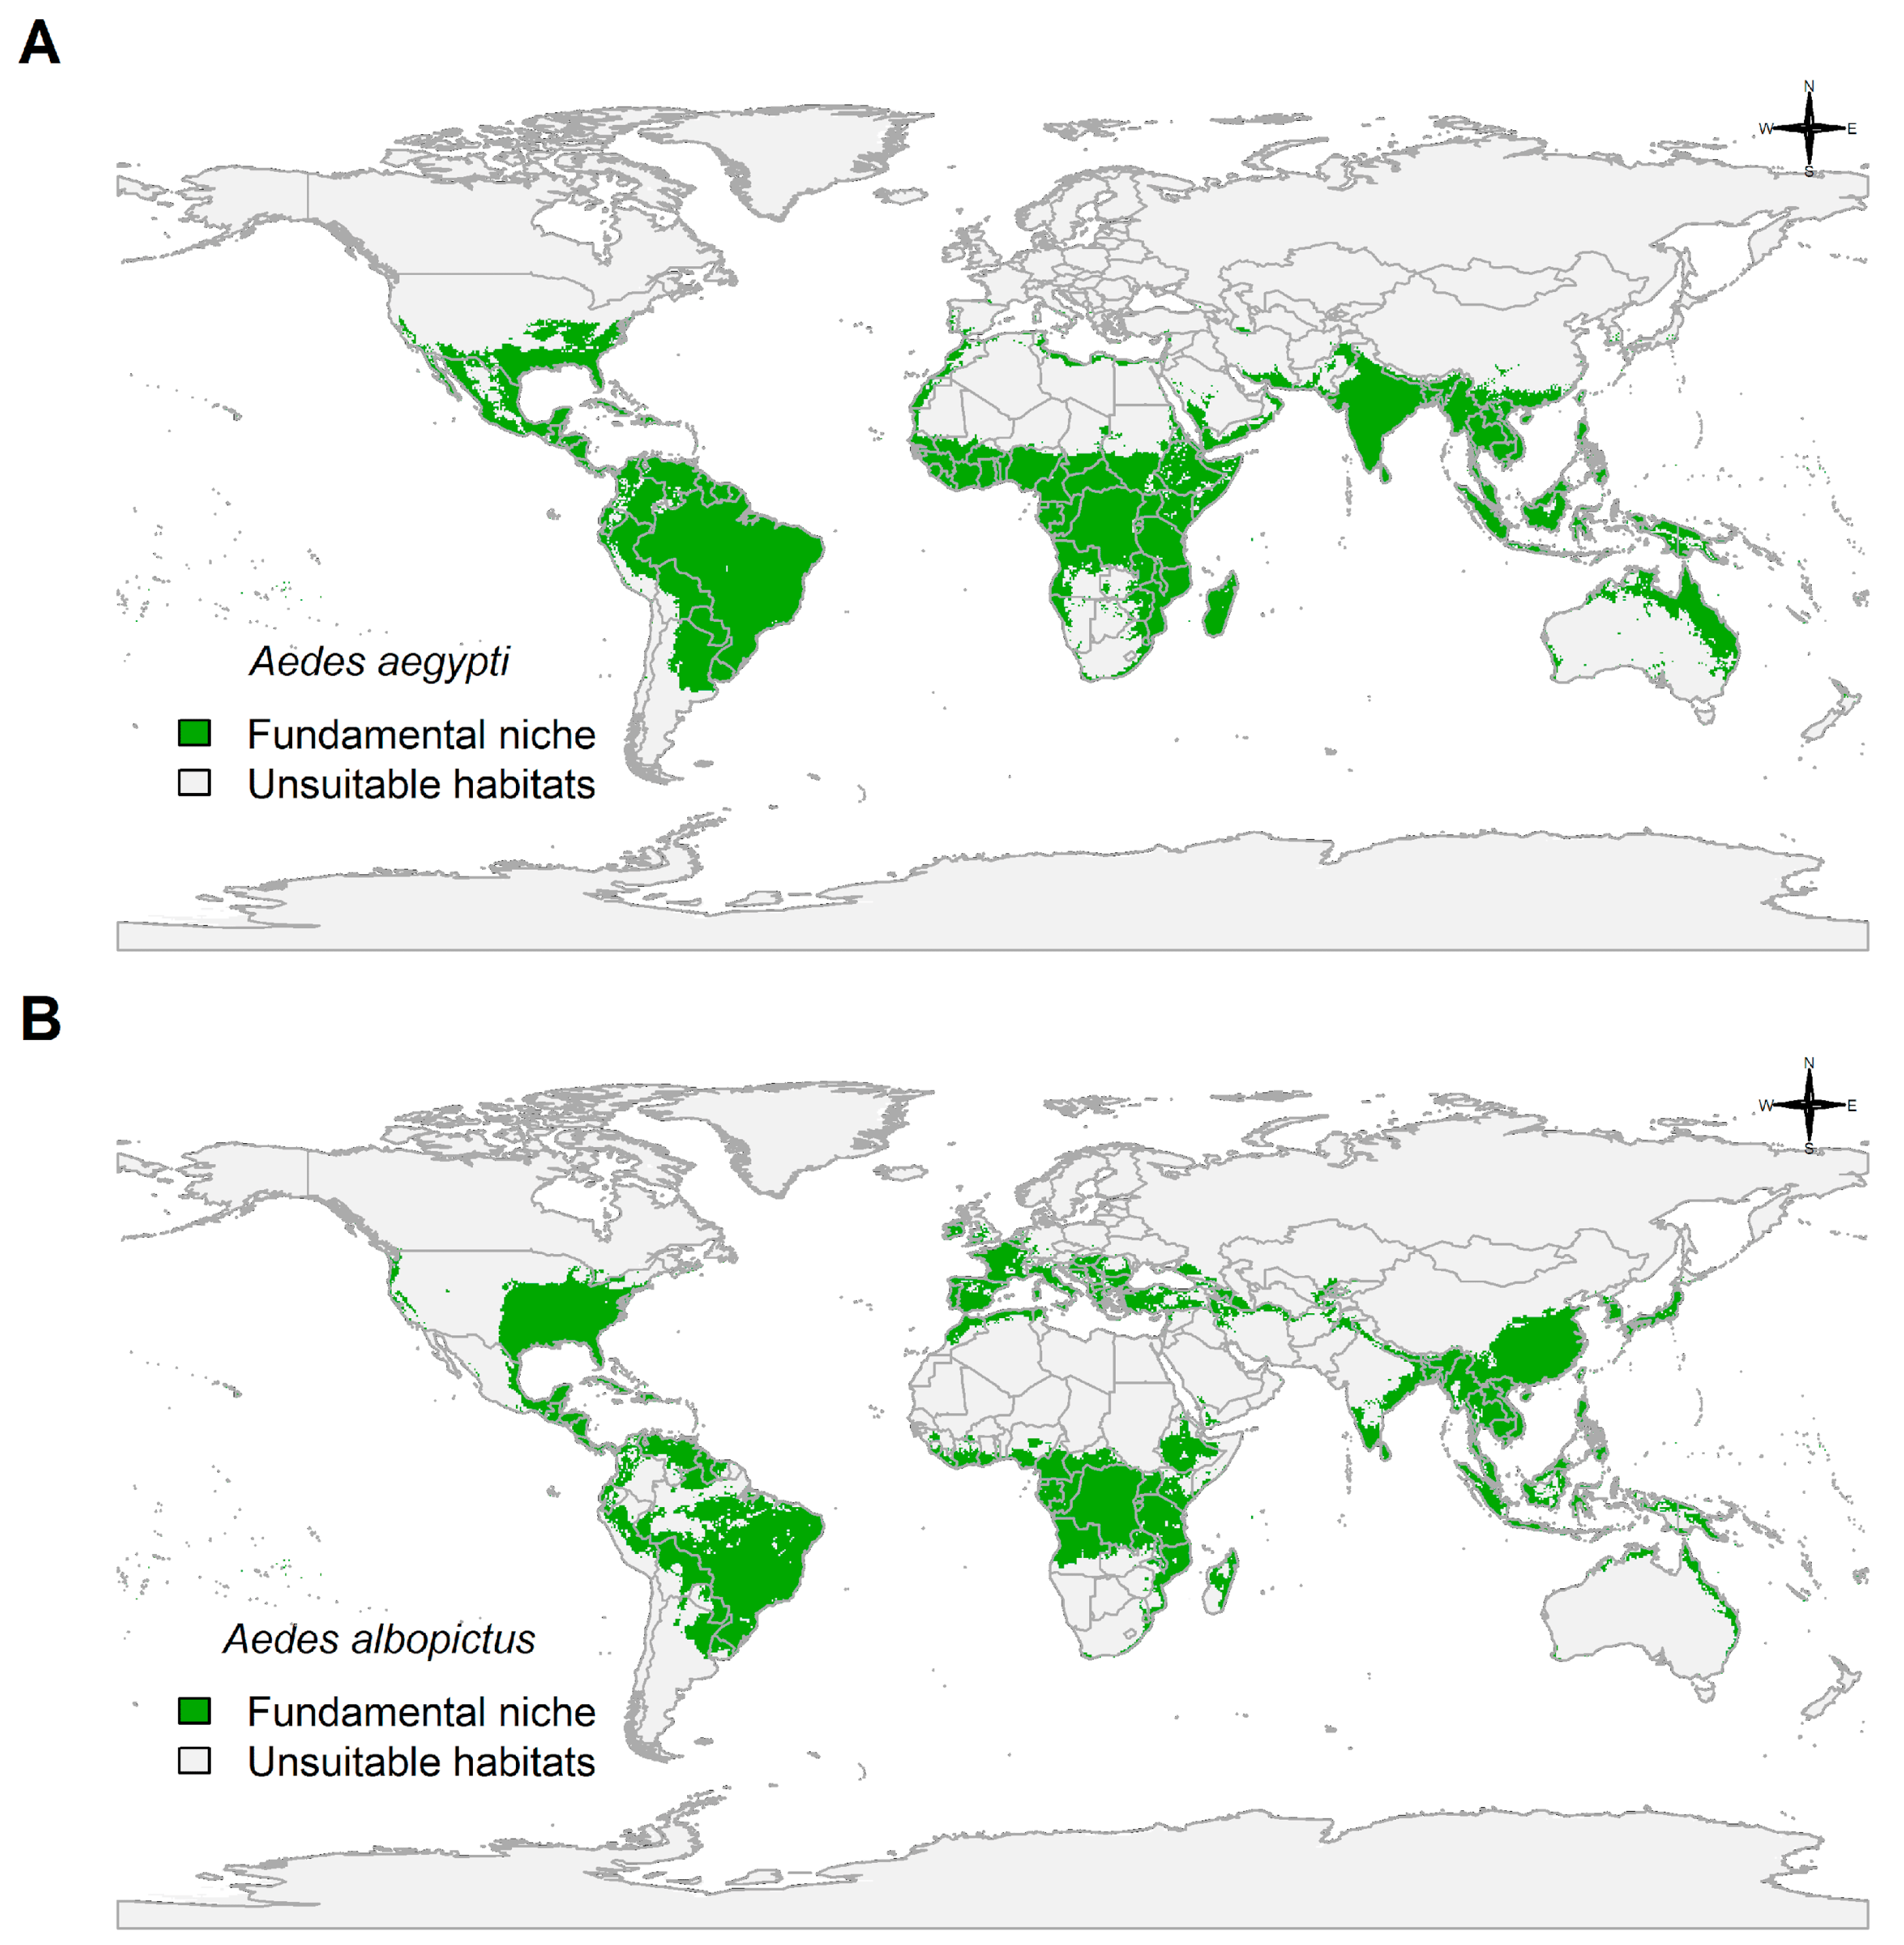
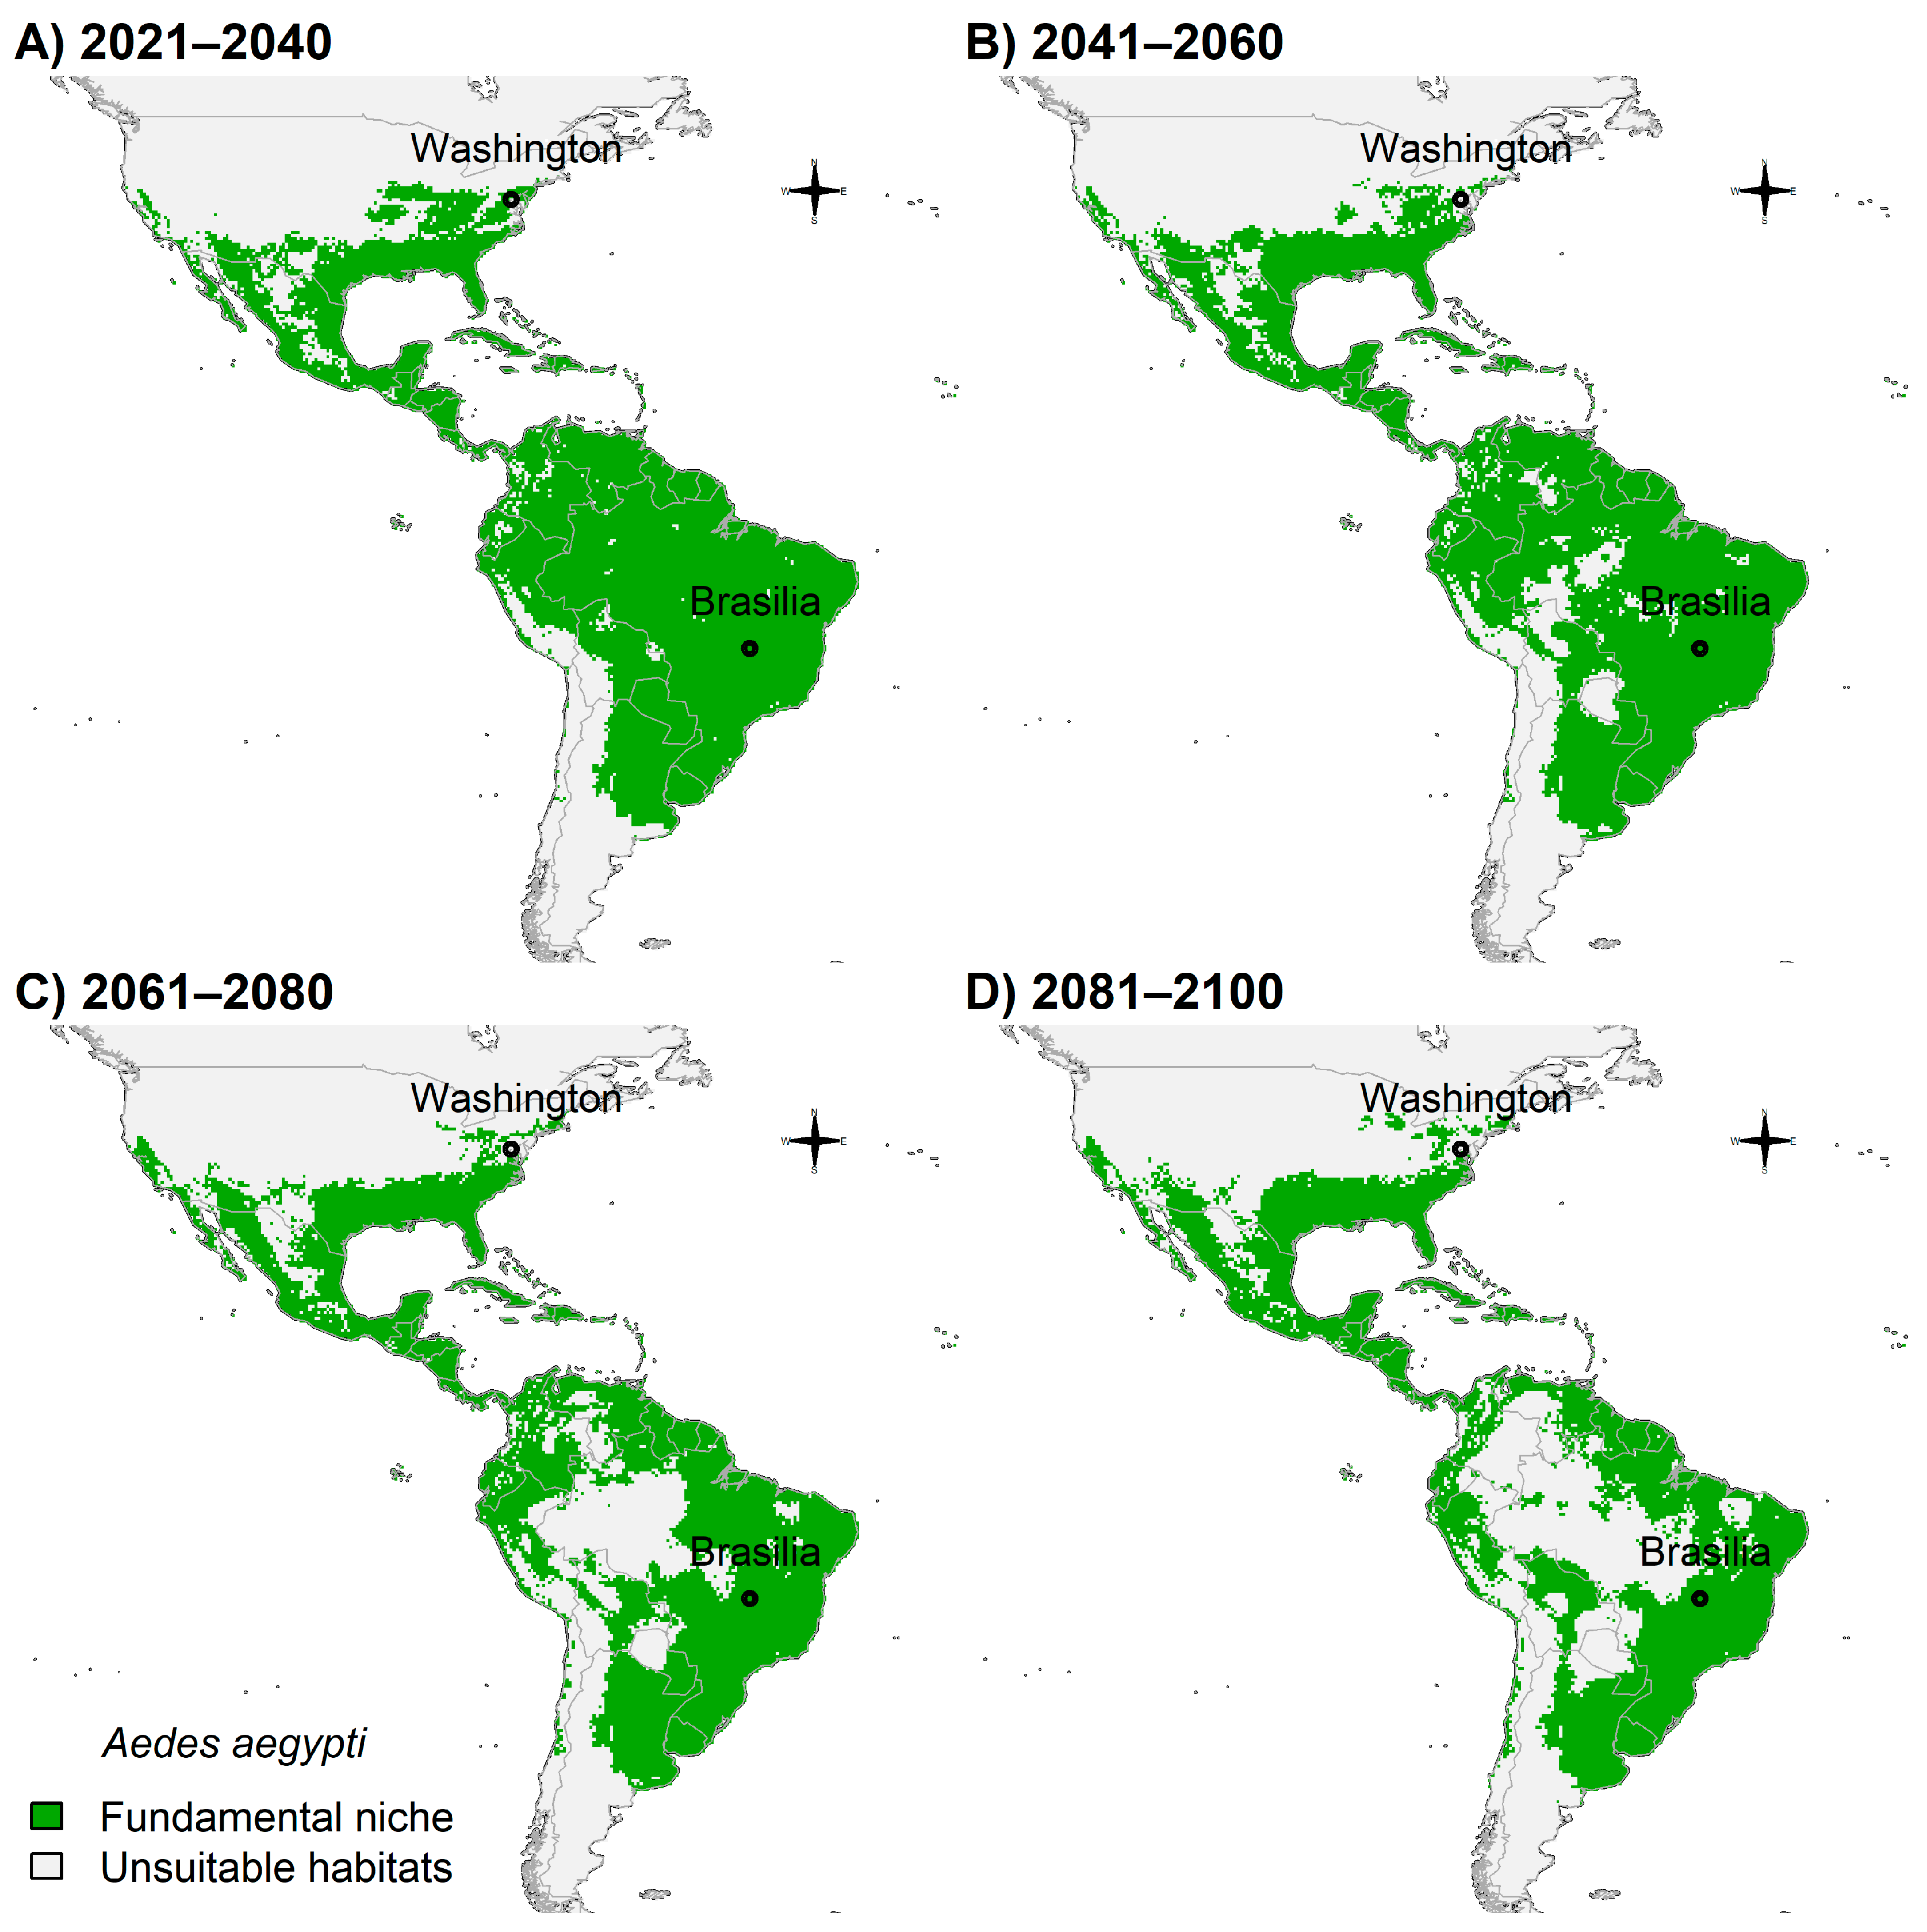
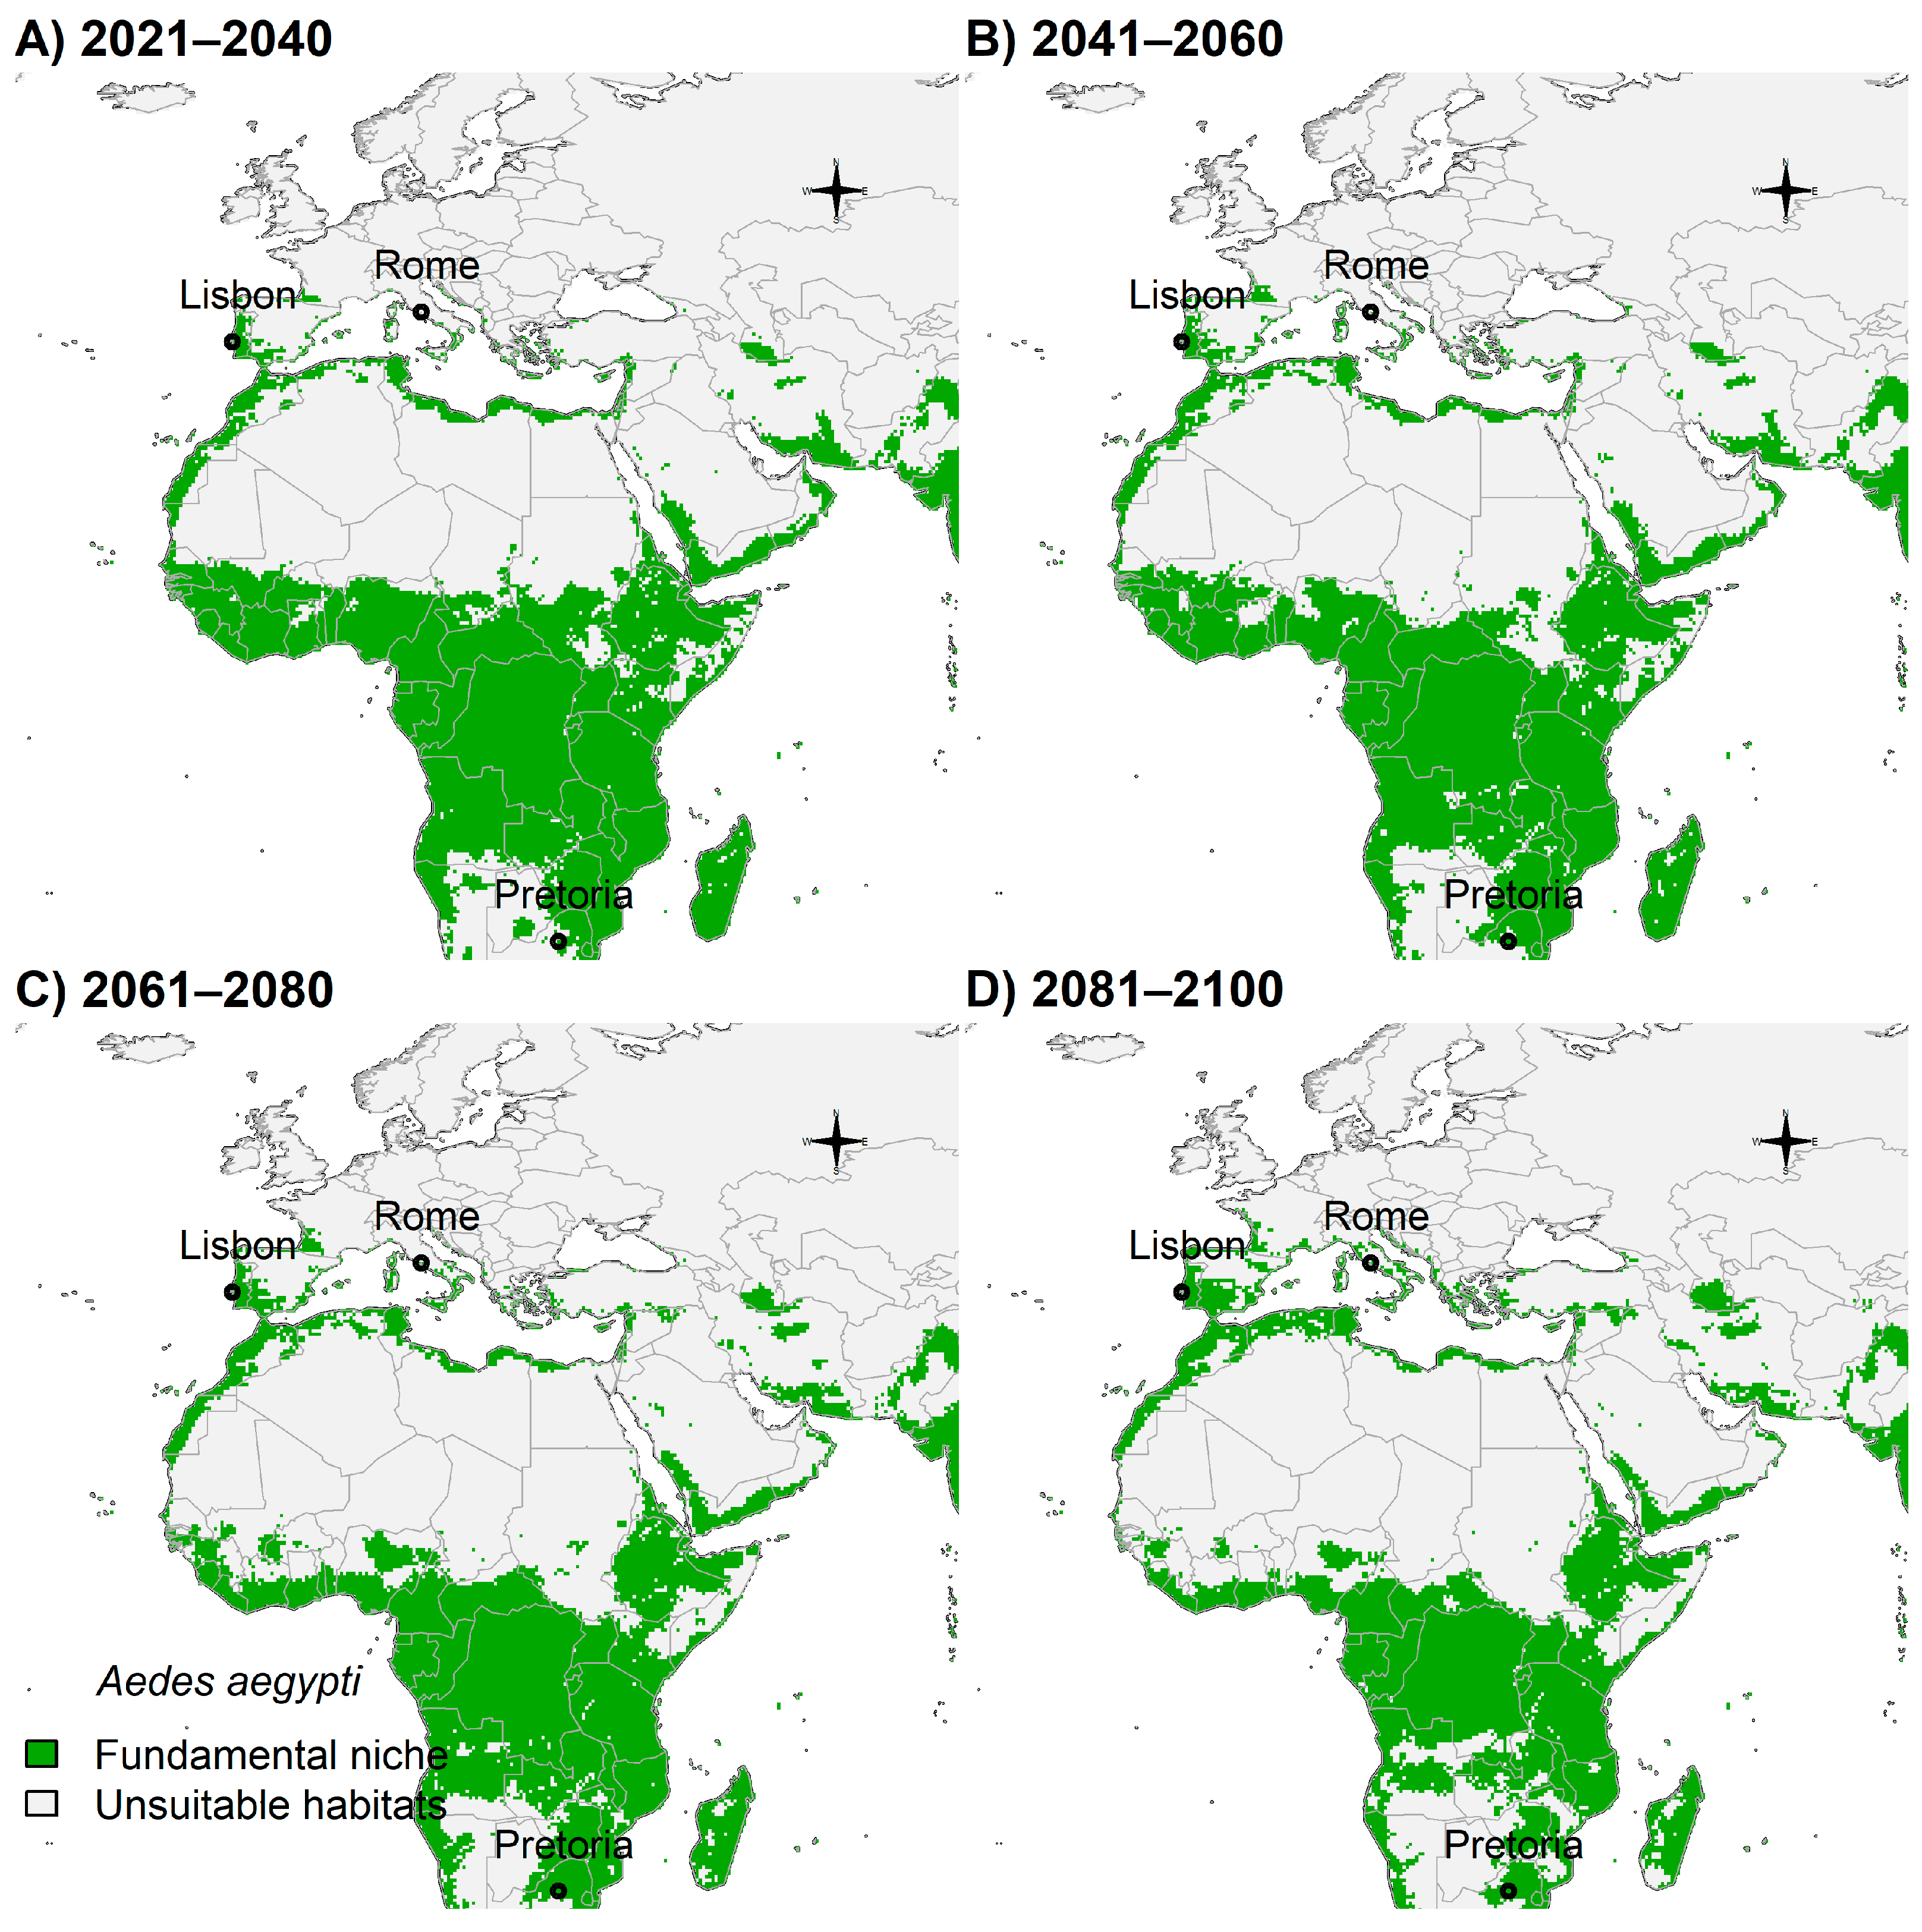
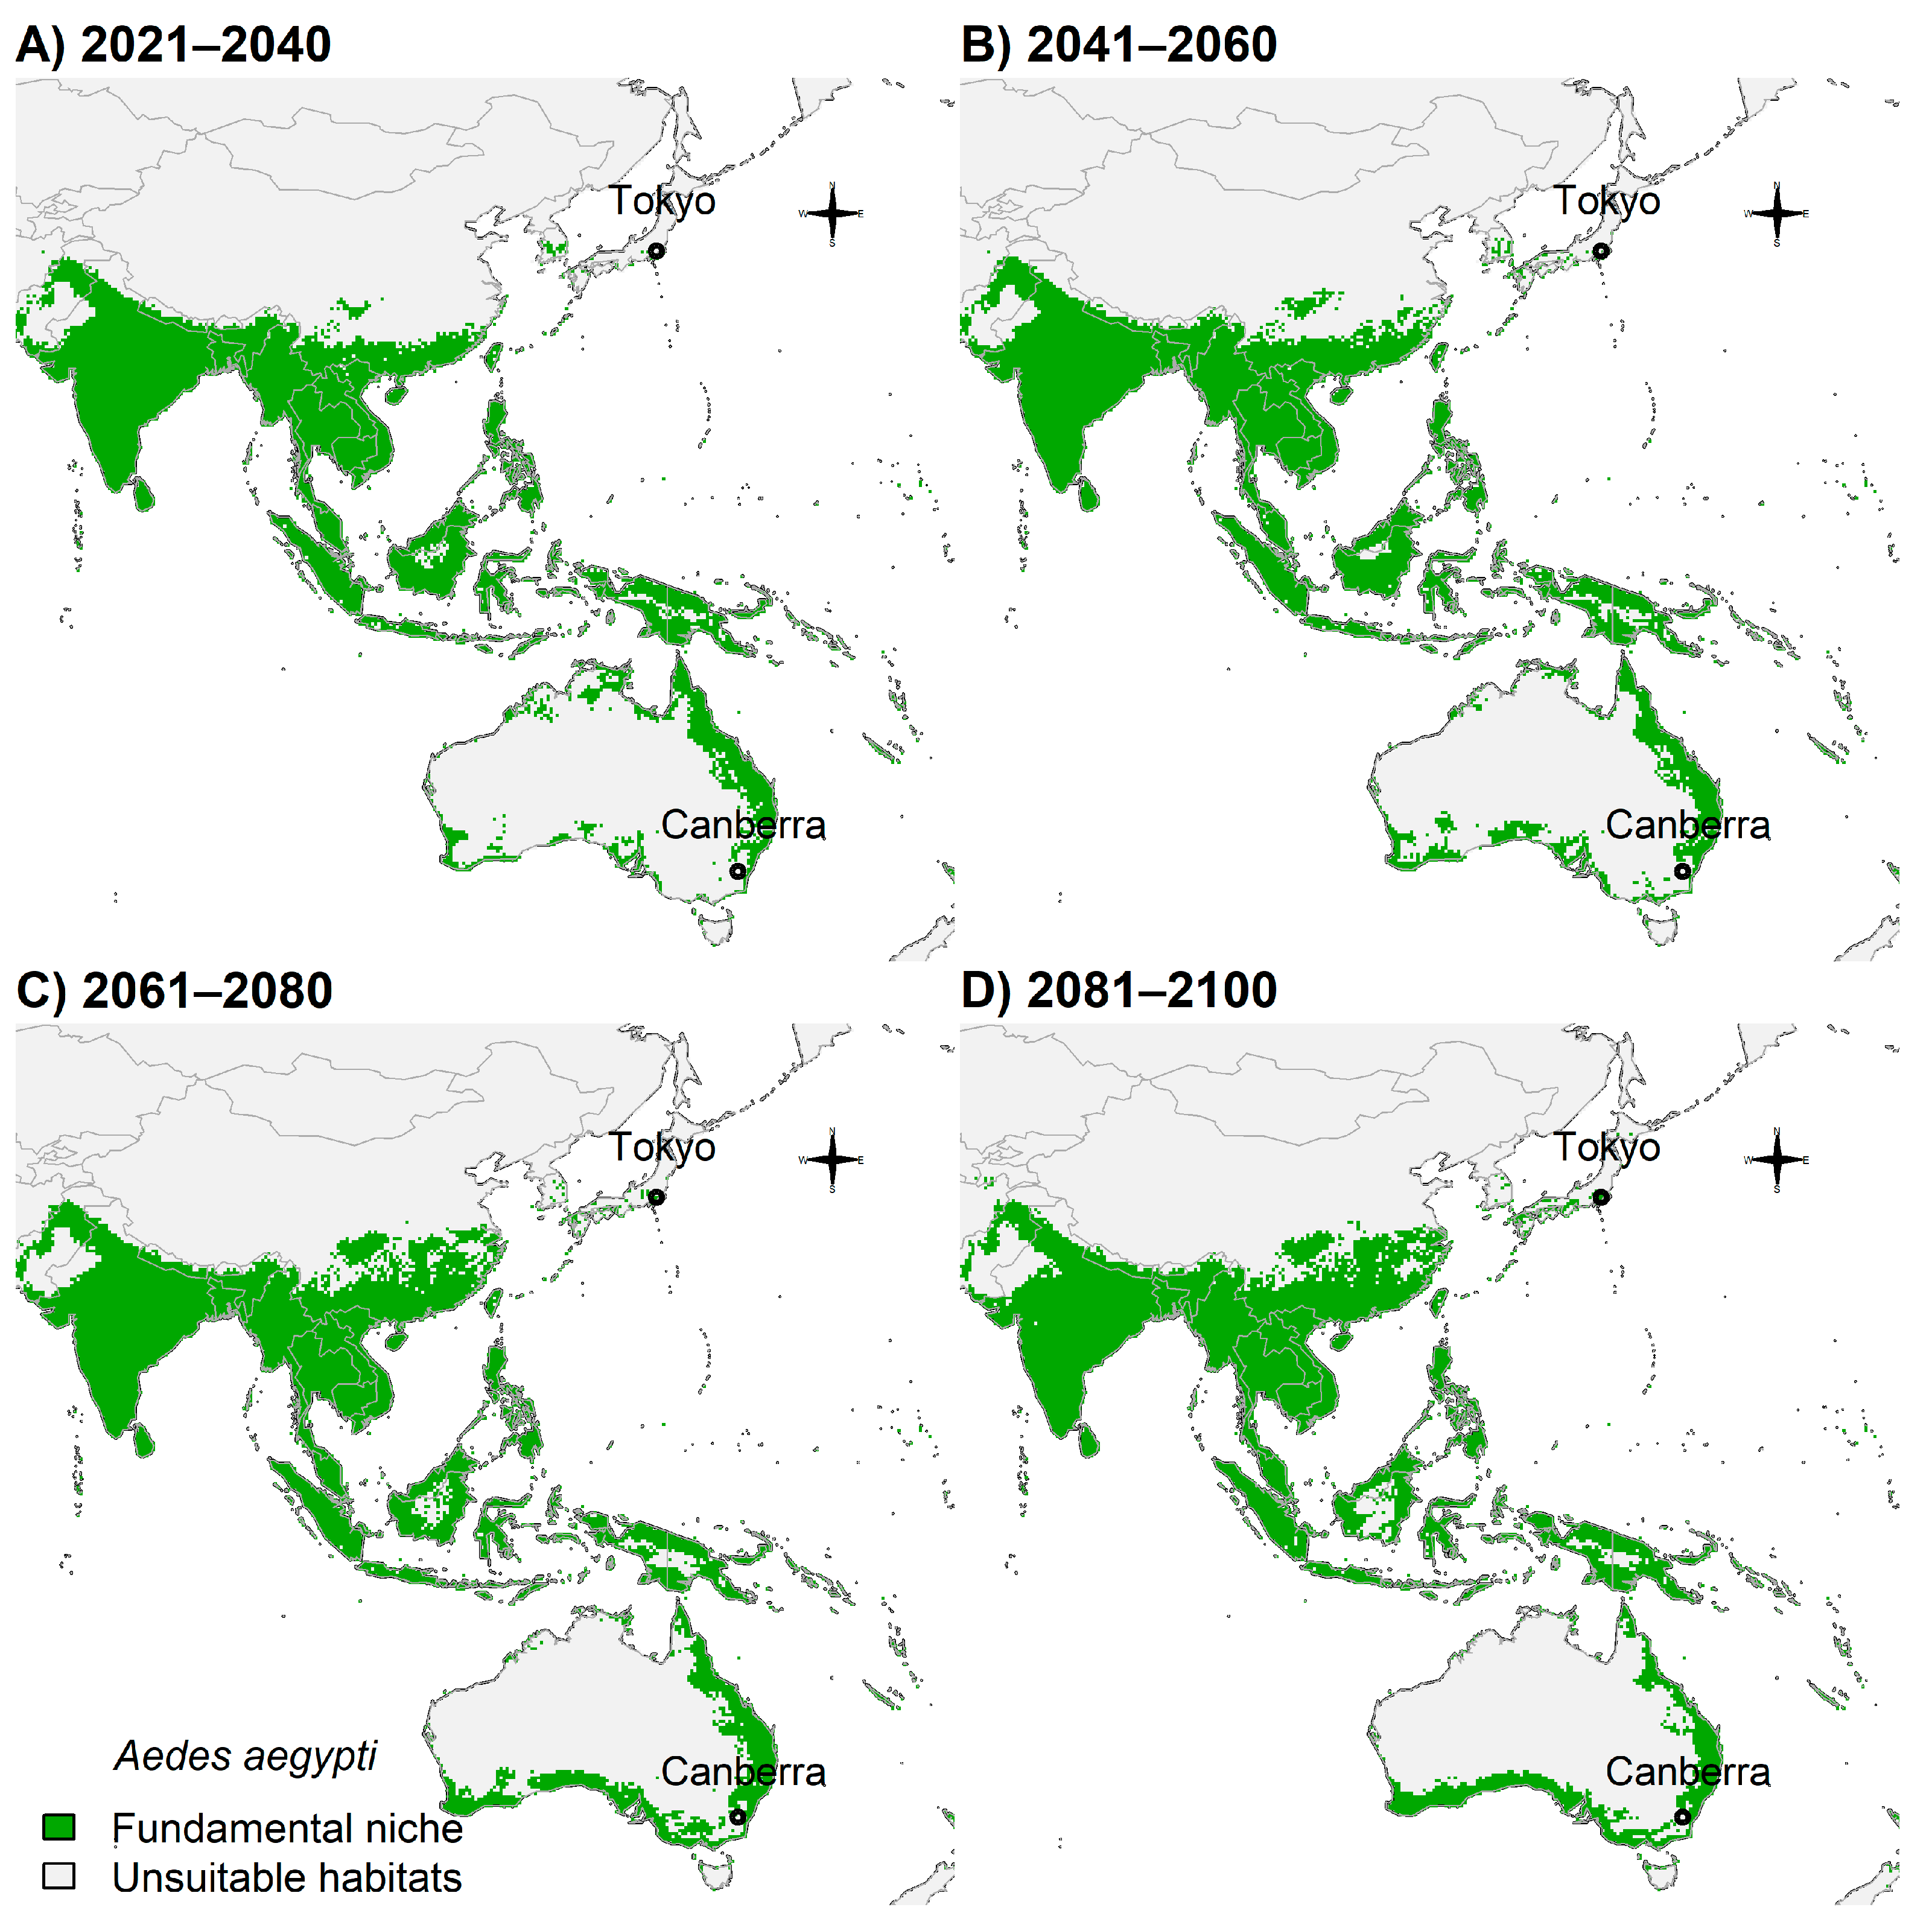
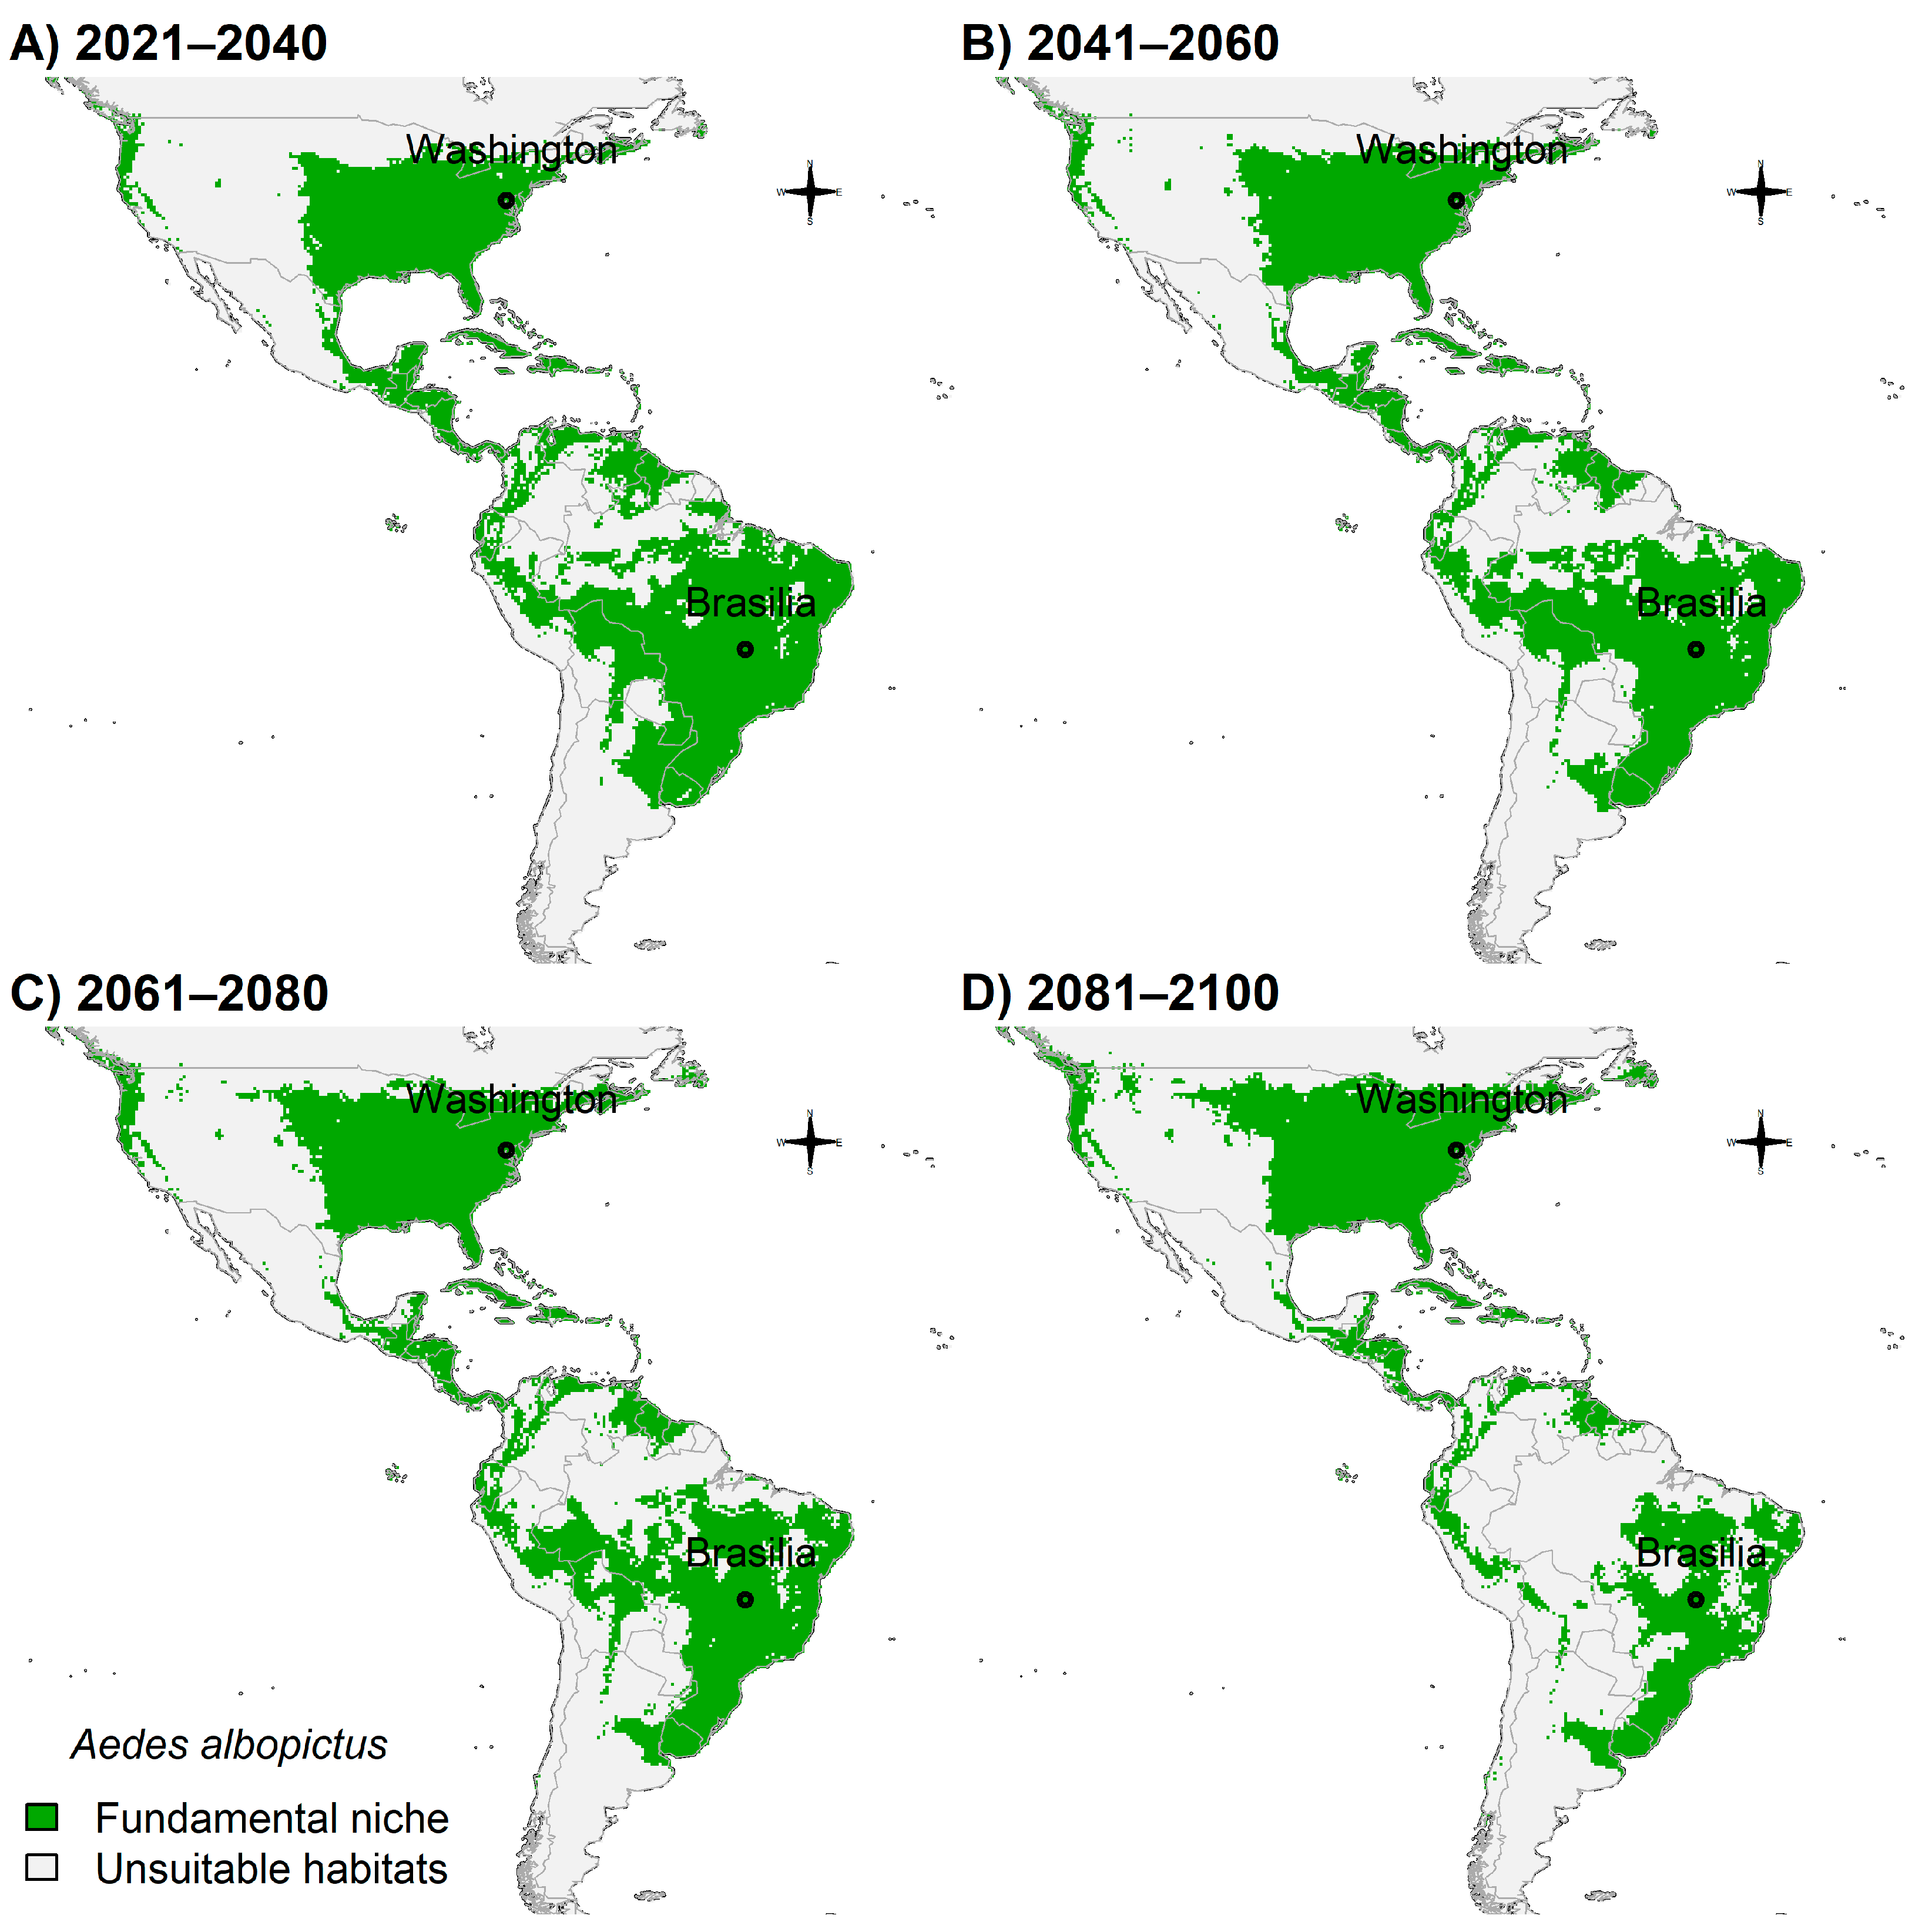
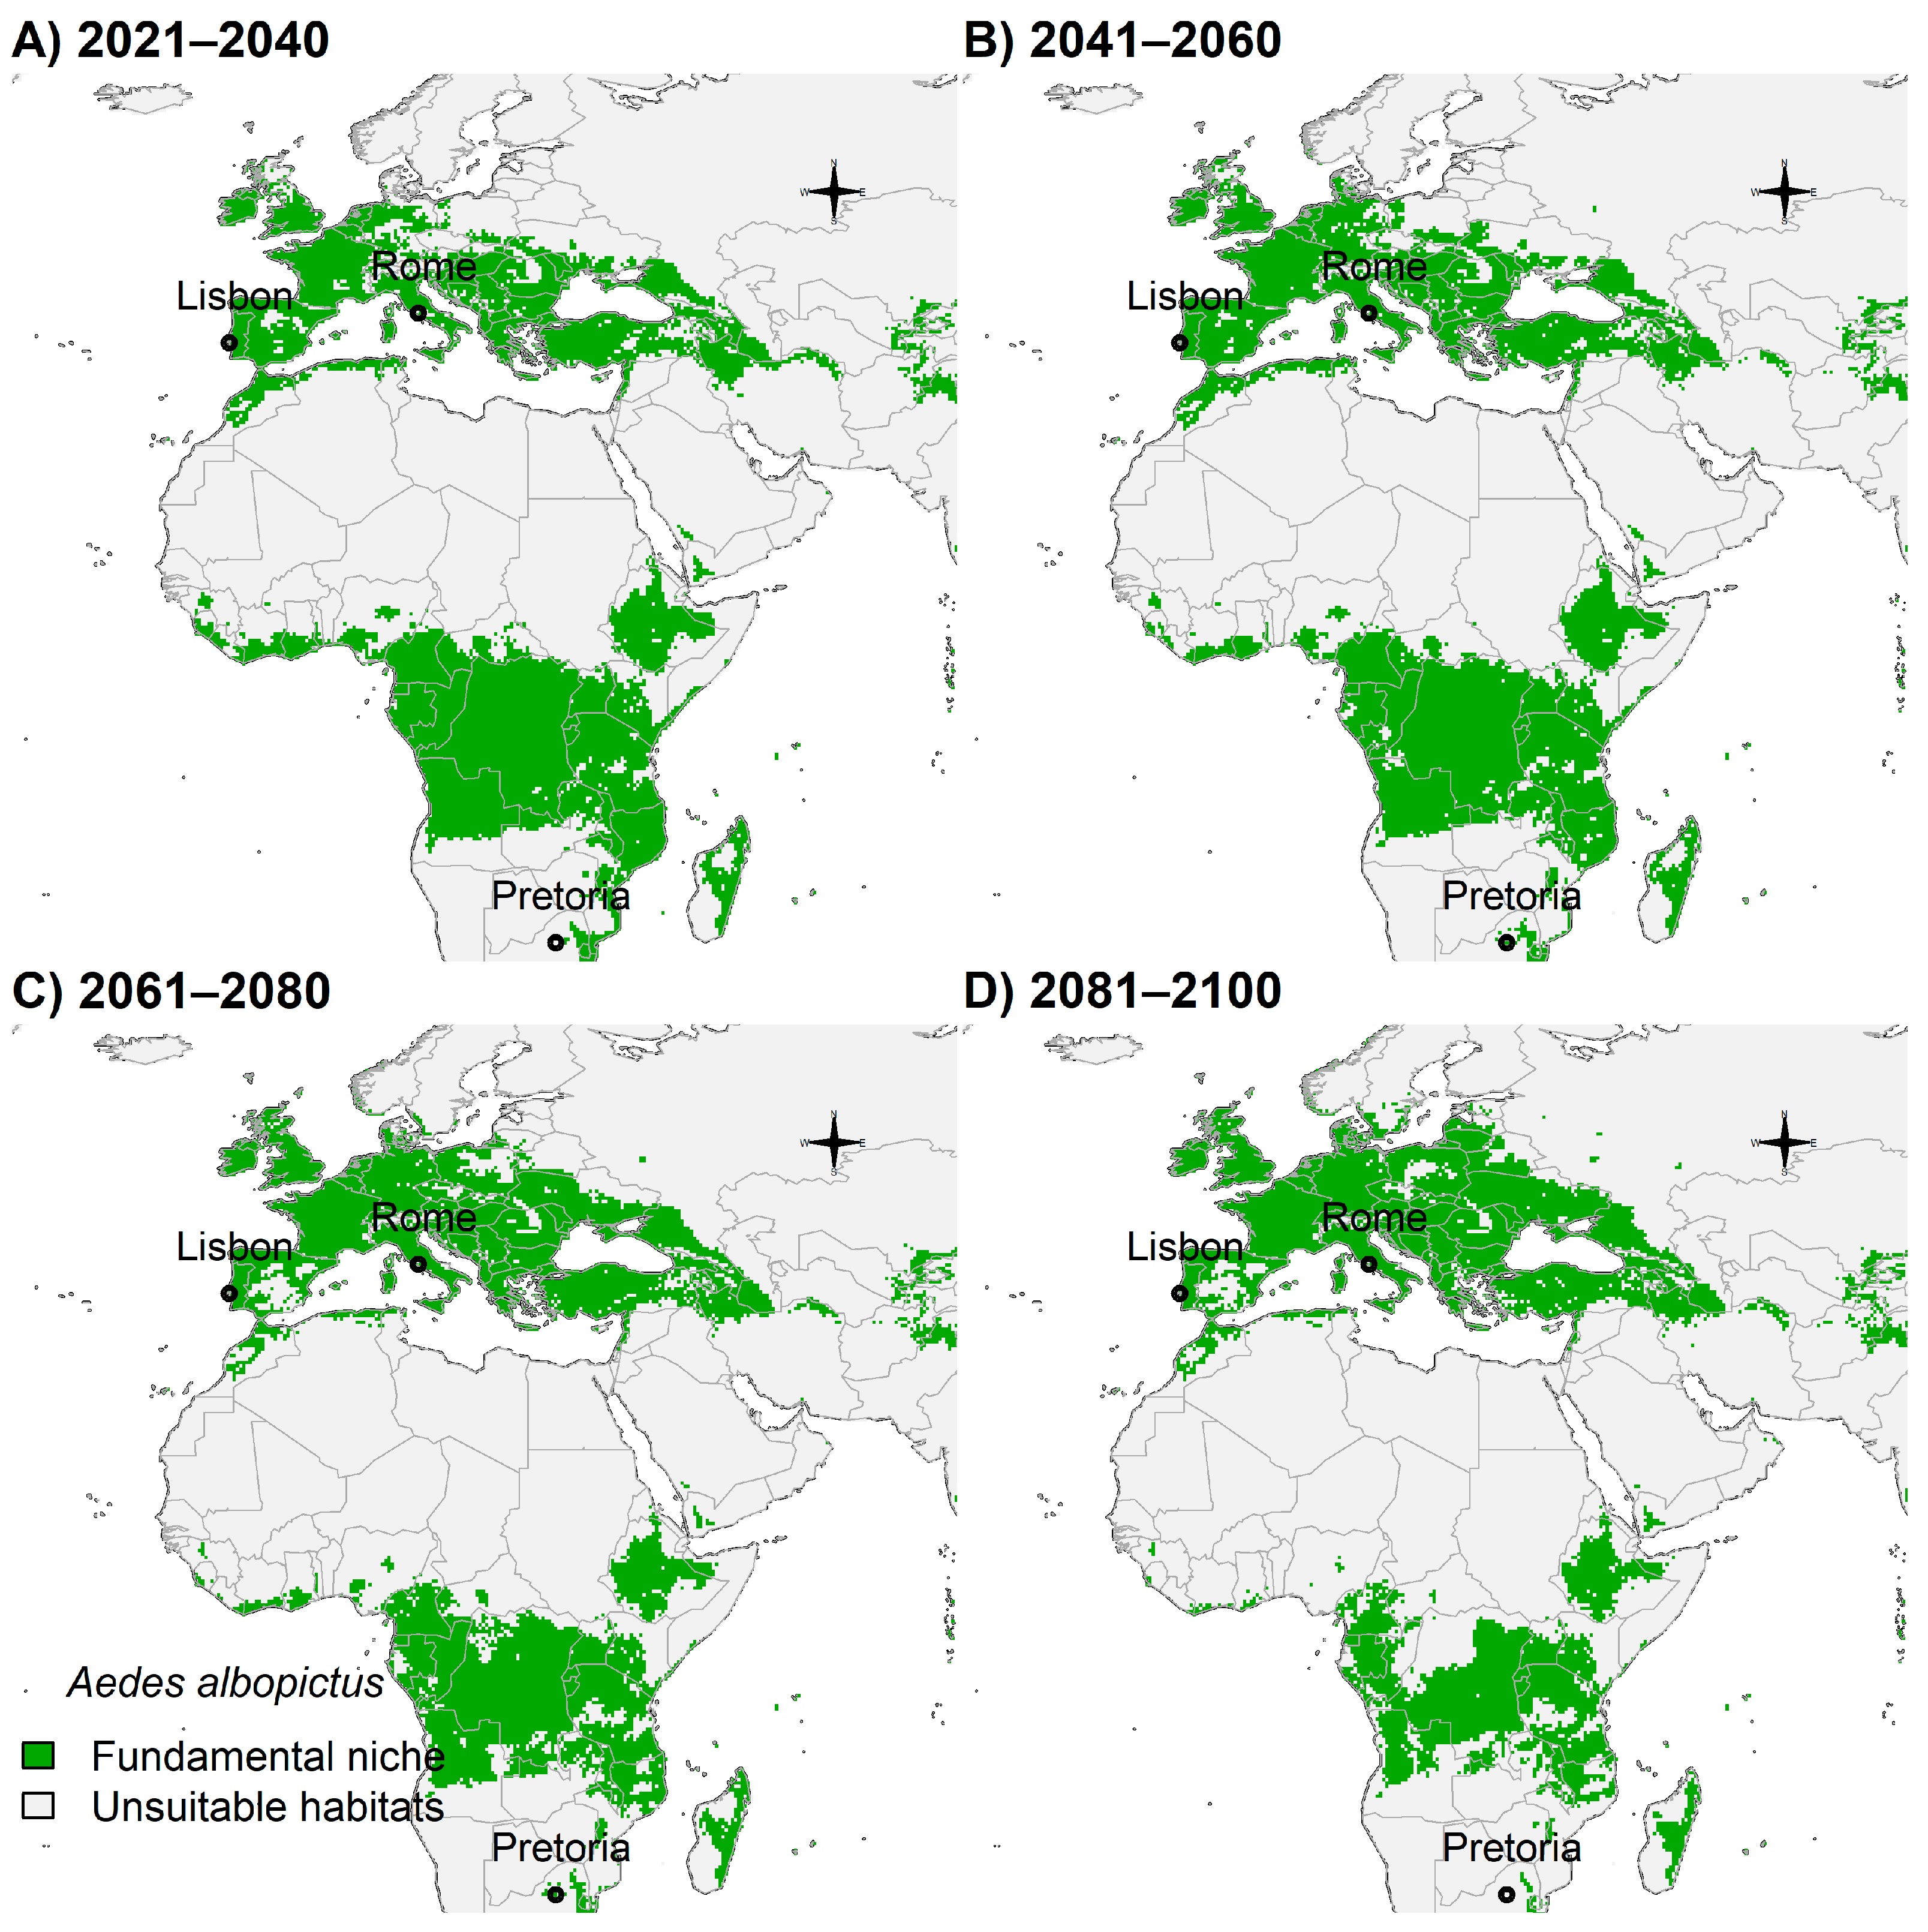
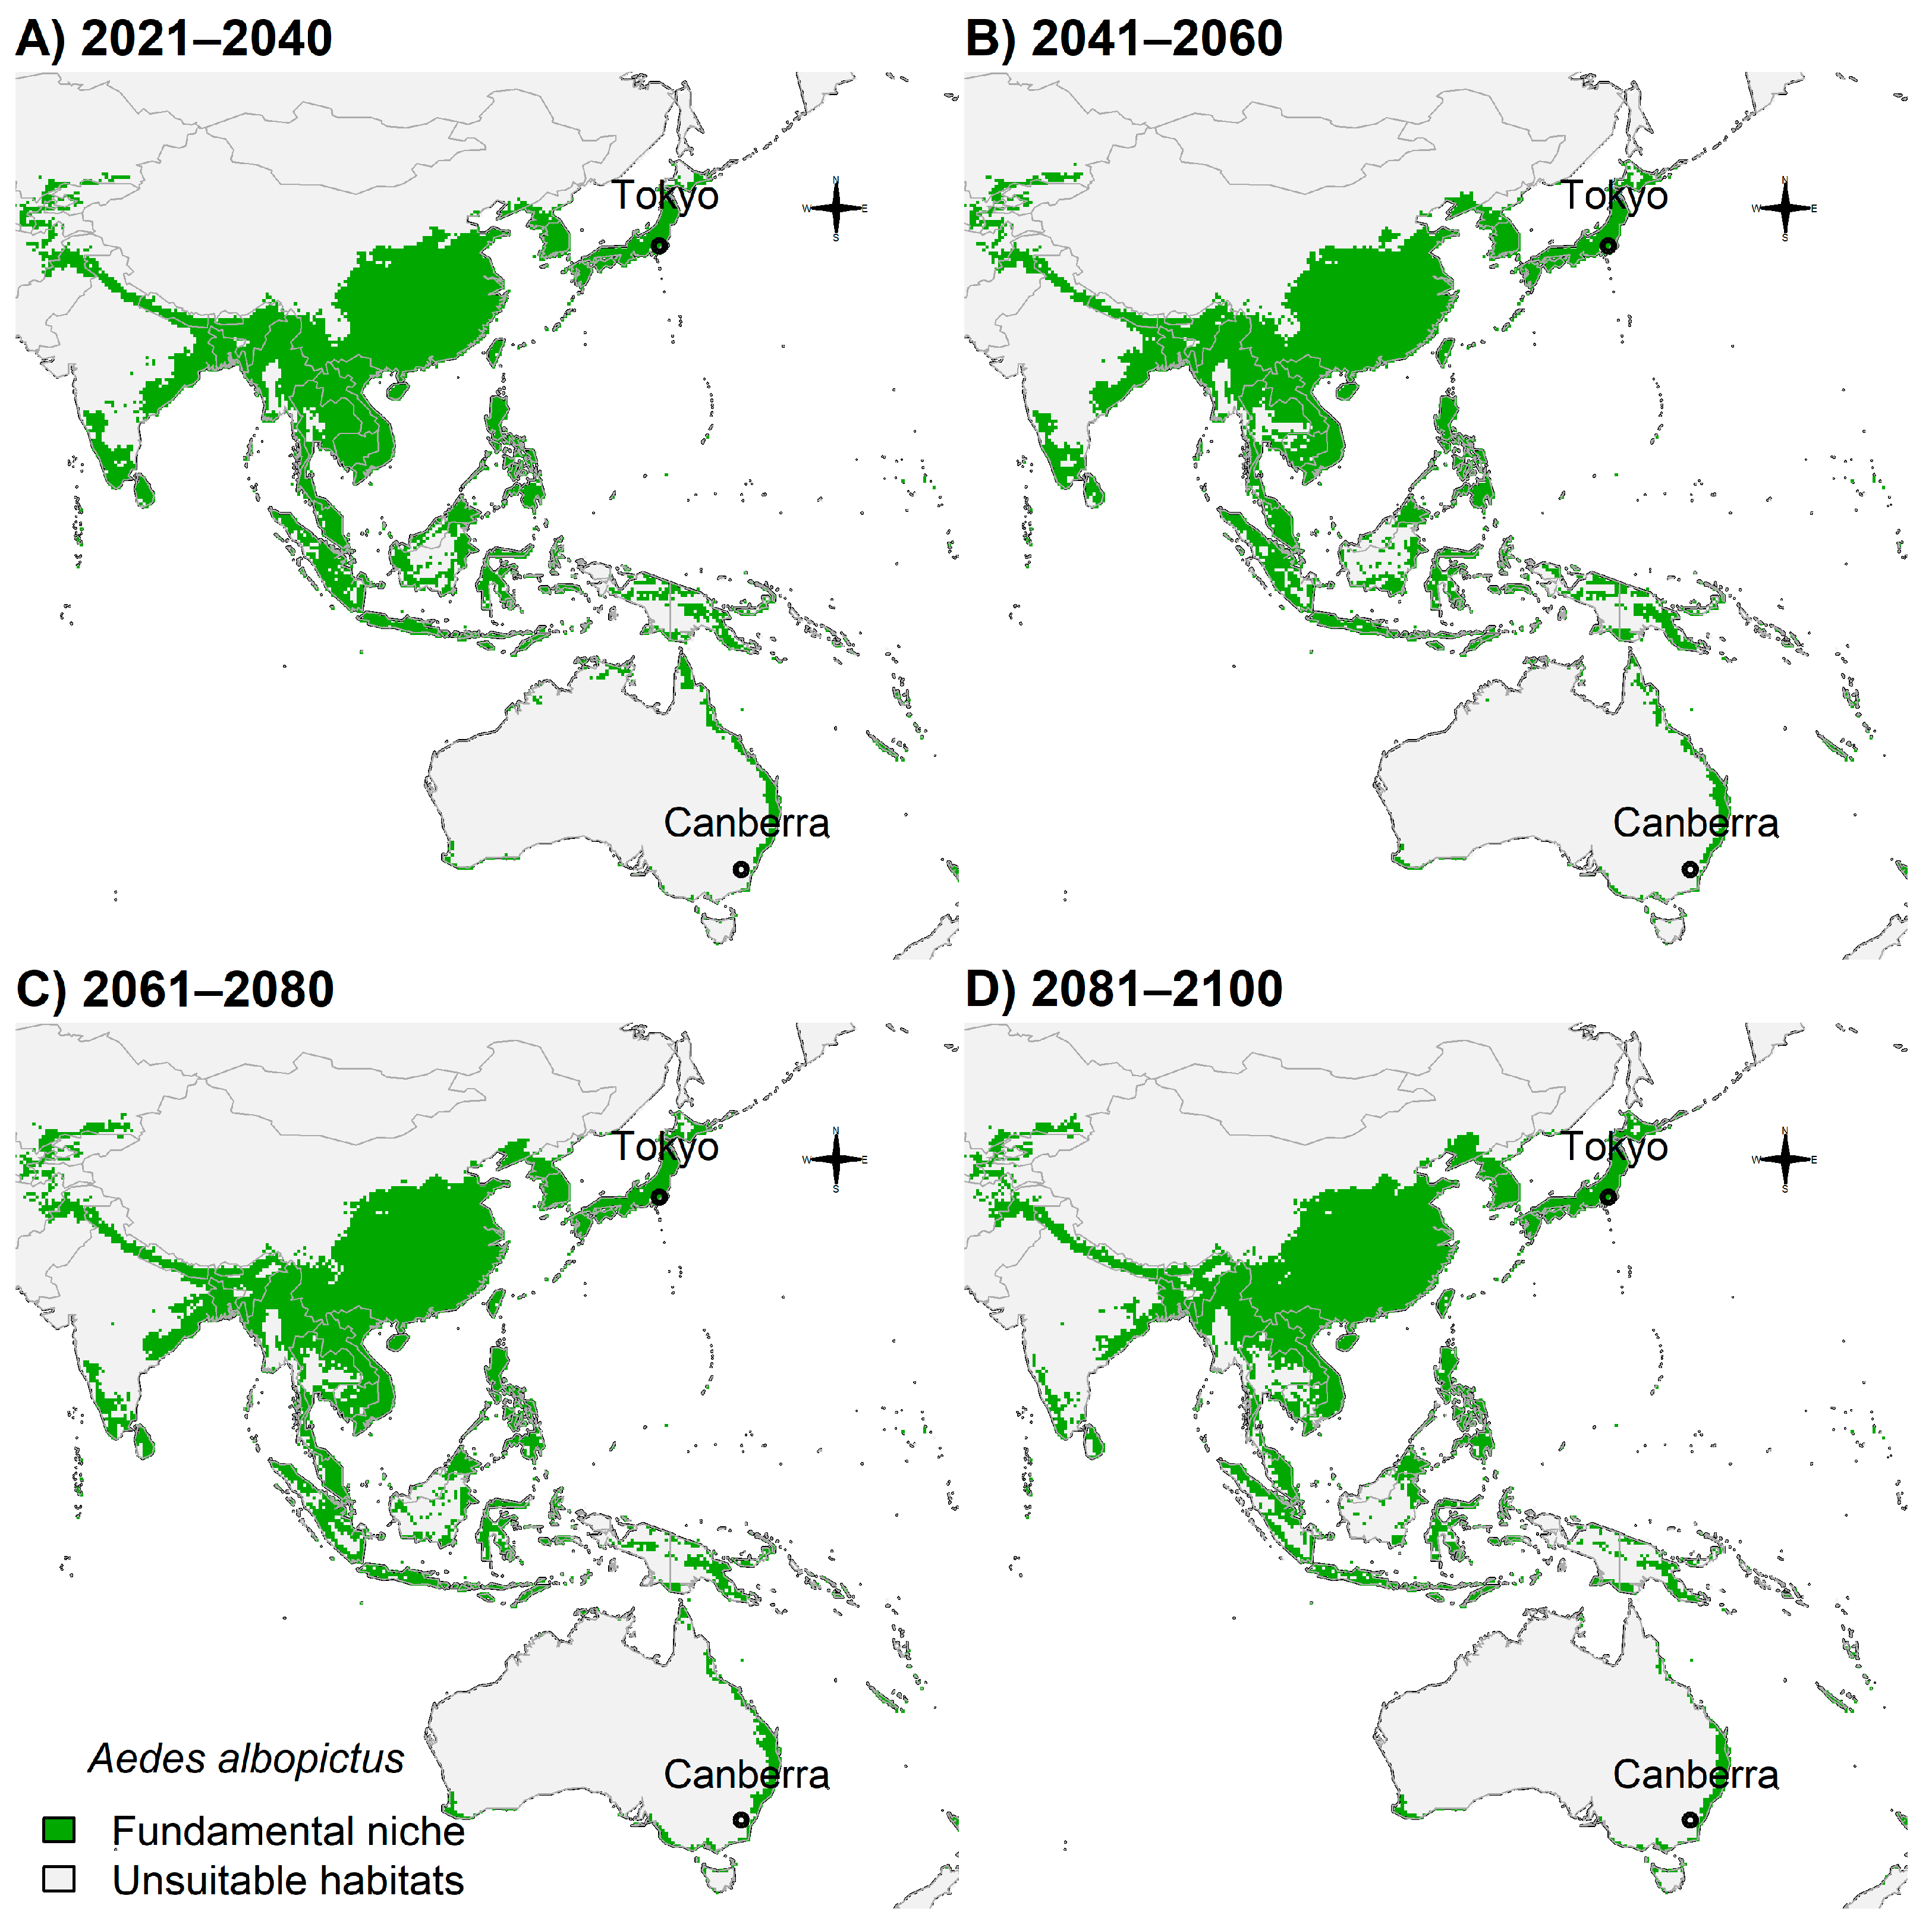
3.4. Fundamental Niche and Potential Future Distributions

The threshold values obtained from the evaluation step of the fitted models were further applied to transform the spatially predicted probability of presence to a binary score that represented two outcomes: (1) fundamental niche (predicted probability of presence higher than the threshold), (2) unsuitable habitats (≤threshold value).
Fundamental niche in Figure 2A,B meant regions having suitable climate for these species where they could be present if they are able to disperse into and find favorable biotic interactions. Antarctica, Canada, Russia, Scandinavia, Sahara Desert, southern Argentina, the Australian deserts, and the New Guinea Highlands were all determined unsuitable habitats for both Ae. aegypti and Ae. albopictus (Figure 2A,B).
The fundamental niche of Ae. aegypti showed higher association with regions of the southern hemisphere in South America, Sub-Saharan Africa, Indonesia, and northeastern Australia (Figure 2A). Additionally, suitable regions in Mexico, United States, North Africa, and Southeast Asia were also present (Figure 2A). Europe showed no suitability, except for scattered coastal areas in Portugal, Spain, and Italy (Figure 2A).
In contrast to the fundamental niche of Ae. aegypti, the fundamental niche of Ae. albopictus shown in Figure 2B is less associated with southern regions but considerably associated with the northern hemisphere, including regions of the United States, Europe, China, and Japan (Figure 2B).
Potential future distributions showed important changes over the four periods (2021–2040, 2041–2060, 2061–2080, 2081–2100) depending on species, hemisphere, and continent being analyzed.
Aedes aegypti potential future distributions in Americas showed that the United States will not develop additional suitable areas, while most of the Amazon basin of Brazil will become unsuitable for this species in the future (Figure 3A–D).
Europe showed suitable areas in Portugal, Spain, France, and Italy, while parts of Sub-Saharan Africa would have fewer suitable areas (Figure 4A–D).
Some areas of China, Japan, and southern Australia showed suitability for future Ae. aegypti (Figure 5A–D).
Considering that Ae. albopictus was shown to be more associated with the northern hemisphere (Figure 2B) and have higher tolerance to cooler areas than Ae. aegypti (see Section 3.3 above), future climate change scenarios showed that this species’ potential distribution will likely expand in the United States (Figure 6A–D). However, South America would possess fewer suitable areas, particularly in the Amazon basin (Figure 6A–D).
Aedes albopictus potential distribution will likely expand towards northern areas in Europe (Figure 7A–D). On the contrary, Sub-Saharan Africa will possess less suitable habitats in the future (Figure 7A–D).
Indonesia also showed that future suitability for Ae. albopictus will be scarcer in the future southern hemisphere but will remain somewhat unchanged in Asia (Figure 8A–D).
In addition to the maps of binary outcomes (fundamental niche, unsuitable habitats) shown in Figure 2, Figure 3, Figure 4, Figure 5, Figure 6, Figure 7 and Figure 8, maps of probability of presence are shown in Supplementary Material Figures S7–10.

4. Discussion

Our results indicate that average maximum temperatures of 10–30 °C and monthly precipitation of 50–200 mm were the most suitable ranges for both species. These variables had a joint contribution of 75% for the prediction of fundamental niches in a previous modelling study [1]. This explains the potential distributions of these species in areas of tropical and subtropical zones, where they can transmit arboviral pathogens to humans in high density cities [35]. This further points to their niche similarities and overlapping co-occurrences [26]. However, differences between Ae. aegypti and Ae. albopictus were seen here when comparing their spatial predictions from fitted boosted regression tree models. Aedes aegypti showed a generally broader distribution potential globally. An important exception is the potential of Ae. albopictus distribution across temperate zones. This Ae. albopictus potential has been studied previously in other modelling studies [11,23,24,25,26]. Its northern range expansion in the United States and southern Canada was predicted by the end of this century [11,23,24,26]. Future models shown here and those published elsewhere [26] also agree that further expansion of Ae. albopictus towards northern Europe is likely in 2050. In the Southern Hemisphere, its distribution is expected not to expand but likely shrink in the future.
Aedes aegypti has a markedly broad distribution globally, as shown here and elsewhere [9,10,36]. Its potential distribution is predicted to increase 10–30% globally, depending on the scenario of greenhouse gas emissions (most optimistic–pessimistic) by the end of this century [36]. Other studies predicted that this trend will accelerate after 2050, which means that its expansion may be greater than 30% in comparison with the current distribution [9]. This is because more suitable habitats for Ae. aegypti in many areas in the Northern Hemisphere are expected over the next century [10]. Conversely, here and elsewhere [10] showed that favorable suitable habitats across many regions in the Southern Hemisphere are expected to recede as the impacts of climate change increase.
More specifically, we observed that the today’s climatically favorable habitats for both Ae. aegypti and Ae. albopictus are predicted to be contracted across the Amazon under the future scenario of regional rivalry herein chosen. Amazonian rainforest heavily depends on suitable climate, including frequently high precipitation levels, meaning that there is a high likelihood of largescale diebacks of plant species due to intensifying dry seasons [37,38]. This loss of primary tropical rainforest due to increasingly frequent droughts in the Amazon region will also accelerate the continued decline of biodiversity [39]. Niche displacement of Nyssorhynchus darlingi (formerly known as Anopheles darlingi [40]), the dominant malaria vector in the region, has already been shown under climate change scenarios [32]. Considering how successful these species have been at colonizing the world’s tropical zones, it is worrisome that places including the Amazon rainforest may become inhospitable to them due to the loss of optimum precipitation levels over the next century.
Europe will continue providing suitable habitats for both species in this century. Arguably, we have already seen a preview of this potential impact with the 2012 outbreak of dengue fever on the island of Madeira, Portugal. Prior to 2005, Ae. aegypti had not been known to occur on the island, but at least two introduction events (originating from Venezuela) established a population on the island [41]. In 2012, island residents experienced their first cases of autochthonous dengue infection, spread by Ae. aegypti mosquitoes [42]. The expansion of Ae. albopictus further into the European continent is a public health issue of current concern. This species is contributing to an increased risk of vector-borne disease transmission across mainland France [43]. A total of 65 autochthonous dengue cases (serotypes 1 and 3) were reported in France, 2022, and the dengue virus identified in these humans was probably vectorized by local populations of Ae. albopictus [43]. As many European countries are among the most visited destinations in the world [44], further invasion and transmission of serotypes of dengue or other arboviruses is likely.
The rise of political instability across the globe does not bode well for limiting the range expansion of these two species. Regional rivalries over territory and resources will likely drive human contributions to climate change for the rest of the century. In addition, robust mosquito surveillance systems must be established with data shared across borders if range expansions are to be effectively monitored. This may prove difficult during conflict, which has a long history of driving vector-borne disease incidence [45]. Regional rivalry within a country, including Brazil, will likely increase both social inequality and risks of vector-borne disease spillover [29]. Political, social, and economic instability within Venezuela has resulted in dramatic increases in vector-borne disease transmission and the resulting large-scale human migration has had considerable public health impacts for other countries in South America and as far as Europe [46,47].
We recognize there are a few notable limitations to this study. First, our model relies heavily on two environmental variables: temperature and precipitation. While we recognize that there are many other environmental factors that contribute to establishing a niche for each species, these two variables are likely the most significant factors [1,35]. The life cycle of these mosquitoes depends on the availability of habitats for eggs, larvae, and pupae [16]. The development of these immatures is only achieved when an optimum range of precipitation occurs [16]. Adult males and females depend on optimum ranges of temperature to fly into the air; otherwise, they will become inactive and/or die [16]. Second, we rely on pseudo-absence rather than true absence data. Since pseudo-absence data is derived from randomly selected locations within the study area, and occurrence data is often biased towards areas that are easier to sample, our results are biased to some extent [33]. Nevertheless, our results are supported by another study that applied a process-based mathematical model and reached similar outcomes [36]. Finally, we relied heavily on unverified identification records that were not confirmed by molecular identification of cryptic taxa. Aedes aegypti and Ae. albopictus are two of the most recognizable mosquito species and are identified quite easily by non-experts using morphology alone. Furthermore, both species are generally not considered species complexes, although there appears to be emerging evidence of cryptic structure for Ae. aegypti on islands in the southwestern Indian Ocean [48], and for Ae. albopictus in southern China and Vietnam [49].
One of the approaches that has been used to improve taxonomic resolution of SDMs is to undertake modelling only with molecularly confirmed samples, such as those identified using the Barcode of Life Data System (BOLD). This approach has been successfully applied to discriminate species in the Albitarsis Complex that can dominate malaria transmission in future scenarios [32]. It has also been used for deriving the unique niche of each cryptic species in the Strodei Subgroup of Nyssorhynchus [50].
BOLD uses the Refined Single Linkage (RESL) clustering algorithm to delineate operational taxonomic units called Barcode Index Numbers (BINs; [51]), which can be considered molecular-based proxies for species. BOLD BINs can therefore be considered an additional, readily accessible, and powerful dataset for the SDM analysis of cryptic species. Better curation of the BOLD database would first need to be undertaken, however, to exclude or correct specimens that have been incorrectly identified. An example of corrections needed for BOLD data can be seen with Ae. aegypti, where considerable specimen misidentification has currently delimited nine BINs with Ae. aegypti members, but where Ae. aegypti sensu stricto (as defined in [48]) is represented only by BIN BOLD:AAA4210. With due consideration for such curatorial issues, our recommendation is for the inclusion of BOLD BIN data in the occurrence data of the species being modelled to improve the biological accuracy of SDMs.

5. Conclusions

Countries all over the globe will need to prepare for vector species distributions to change and these changes will have major impacts on public health decision making. Our SDMs provide a glimpse into possible futures which can help identify locations for resource allocation and surveillance efforts before a significant threat to human health emerges. In areas where these species are expected to decline, this information can be used to justify new public health priorities.

Supplementary Materials

The following supporting information can be downloaded at: https://www.mdpi.com/article/10.3390/insects14010049/s1. Figure S1—Evaluation graphs of the model for Aedes aegypti (ROC curve and density plot of presence and pseudo-absence data). Figure S2—Relative contribution plots for the 15 most influential variables in the model for Aedes aegypti. Y axes are on the logit scale and have zero mean. Figure S3—Fitted values in relation to the most important predictor used in the model for Aedes aegypti with wtm = weighted mean of fitted values. Figure S4—Evaluation graphs of the model for Aedes albopictus (ROC curve and density plot of presence and pseudo-absence data). Figure S5—Relative contribution plots for the 11 most influential variables in the model for Aedes albopictus. Y axes are on the logit scale and have zero mean. Figure S6—Fitted values in relation to top 3 important predictor used in the model for Aedes albopictus with wtm = weighted mean of fitted values. Figure S7—Map of probability of presence of Aedes aegypti today. Figure S8—Map of probability of presence of Aedes aegypti in 2081–2100. Figure S9—Map of probability of presence of Aedes albopictus today. Figure S10—Map of probability of presence of Aedes albopictus in 2081–2100.

Author Contributions

Conceptualization, G.Z.L., A.M.P., J.F.A.O., B.P.B., D.B.P. and Y.-M.L.; methodology, G.Z.L., A.M.P., B.P.B. and D.B.P.; validation, J.F.A.O. and Y.-M.L.; formal analysis, G.Z.L. and A.M.P.; investigation, G.Z.L., A.M.P. and J.F.A.O.; resources, Y.-M.L.; data curation, D.B.P.; writing—original draft preparation, G.Z.L., A.M.P. and D.B.P.; writing—review and editing, G.Z.L., A.M.P., J.F.A.O., B.P.B., D.B.P. and Y.-M.L.; All authors have read and agreed to the published version of the manuscript.

Funding

This work was financially supported by the Armed Forces Health Surveillance Division—Global Emerging Infections Surveillance (AFHSD-GEIS) under awards P0065_22_WR and P0050_23_WR. The activities undertaken at WRBU were performed in part under a Memorandum of Understanding between the Walter Reed Army Institute of Research (WRAIR) and the Smithsonian Institution, with institutional support provided by both organizations. GZL is financially supported by Conselho Nacional de Desenvolvimento Científico e Tecnológico (CNPq Grant no. 307432/2019–0/) and São Paulo Research Foundation (FAPESP Grant no. 2021/06669-6).

Data Availability Statement

The data used for analysis can be available under reasonable request.

Acknowledgments

We are all grateful to the pioneer work undertaken by Desmond H. Foley in the design and concept of the VectorMap, which served as the basis for biological data utilized in this study.

Conflicts of Interest

The authors declare that they have no conflict of interest regarding the publication of this paper. The view(s) expressed in this article are those of the authors and do not necessarily reflect the official policy or position of the Departments of the Army, Air Force, or Navy, the Department of Defence, or the U.S. Government. The use of trade names in this document does not constitute an official endorsement or approval of the use of such commercial hardware or software. Do not cite this document for advertisement. The publication has been cleared for publication by the Walter Reed Army Institute of Research (WRAIR).

References

  1. Kraemer, M.U.G.; Sinka, M.E.; Duda, K.A.; Mylne, A.Q.N.; Shearer, F.M.; Barker, C.M.; Moore, C.G.; Carvalho, R.G.; Coelho, G.E.; Van Bortel, W.; et al. The Global Distribution of the Arbovirus Vectors Aedes aegypti and Ae. albopictus. eLife 2015, 4, e08347. [Google Scholar] [CrossRef] [PubMed]
  2. Kraemer, M.U.G.; Sinka, M.E.; Duda, K.A.; Mylne, A.; Shearer, F.M.; Brady, O.J.; Messina, J.P.; Barker, C.M.; Moore, C.G.; Carvalho, R.G.; et al. The Global Compendium of Aedes aegypti and Ae. albopictus Occurrence. Sci. Data 2015, 2, 150035. [Google Scholar] [CrossRef] [PubMed] [Green Version]
  3. Lwande, O.W.; Obanda, V.; Lindström, A.; Ahlm, C.; Evander, M.; Näslund, J.; Bucht, G. Globe-Trotting Aedes aegypti and Aedes albopictus: Risk Factors for Arbovirus Pandemics. Vector Borne Zoonotic Dis. 2020, 20, 71–81. [Google Scholar] [CrossRef] [PubMed] [Green Version]
  4. Oliveira, W.K.; Cortez-Escalante, J.; De Oliveira, W.T.G.H.; do Carmo, G.M.I.; Henriques, C.M.P.; Coelho, G.E.; Araújo de França, G.V. Increase in Reported Prevalence of Microcephaly in Infants Born to Women Living in Areas with Confirmed Zika Virus Transmission During the First Trimester of Pregnancy—Brazil, 2015. MMWR Morb. Mortal. Wkly. Rep. 2016, 65, 242–247. [Google Scholar] [CrossRef]
  5. Girard, M.; Nelson, C.B.; Picot, V.; Gubler, D.J. Arboviruses: A Global Public Health Threat. Vaccine 2020, 38, 3989–3994. [Google Scholar] [CrossRef] [PubMed]
  6. Bhatt, S.; Gething, P.W.; Brady, O.J.; Messina, J.P.; Farlow, A.W.; Moyes, C.L.; Drake, J.M.; Brownstein, J.S.; Hoen, A.G.; Sankoh, O.; et al. The Global Distribution and Burden of Dengue. Nature 2013, 496, 504–507. [Google Scholar] [CrossRef] [Green Version]
  7. Brady, O.J.; Hay, S.I. The Global Expansion of Dengue: How Aedes aegypti Mosquitoes Enabled the First Pandemic Arbovirus. Annu. Rev. Entomol. 2020, 65, 191–208. [Google Scholar] [CrossRef] [Green Version]
  8. Näslund, J.; Ahlm, C.; Islam, K.; Evander, M.; Bucht, G.; Lwande, O.W. Emerging Mosquito-Borne Viruses Linked to Aedes aegypti and Aedes albopictus: Global Status and Preventive Strategies. Vector Borne Zoonotic Dis. 2021, 21, 731–746. [Google Scholar] [CrossRef]
  9. Iwamura, T.; Guzman-Holst, A.; Murray, K.A. Accelerating Invasion Potential of Disease Vector Aedes aegypti under Climate Change. Nat. Commun. 2020, 11, 2130. [Google Scholar] [CrossRef]
  10. Khormi, H.M.; Kumar, L. Climate Change and the Potential Global Distribution of Aedes aegypti: Spatial Modelling Using GIS and CLIMEX. Geospat. Health 2014, 8, 405–415. [Google Scholar] [CrossRef]
  11. Rochlin, I.; Ninivaggi, D.V.; Hutchinson, M.L.; Farajollahi, A. Climate Change and Range Expansion of the Asian Tiger Mosquito (Aedes albopictus) in Northeastern USA: Implications for Public Health Practitioners. PLoS ONE 2013, 8, e60874. [Google Scholar] [CrossRef] [PubMed] [Green Version]
  12. Rosenzweig, C. Global Climate Change: Predictions and Observations. Am. J. Agric. Econ. 1989, 71, 1265–1271. [Google Scholar] [CrossRef]
  13. Juliano, S.A.; O’Meara, G.F.; Morrill, J.R.; Cutwa, M.M. Desiccation and Thermal Tolerance of Eggs and the Coexistence of Competing Mosquitoes. Oecologia 2002, 130, 458–469. [Google Scholar] [CrossRef] [PubMed] [Green Version]
  14. Bennett, K.L.; Gómez Martínez, C.; Almanza, A.; Rovira, J.R.; McMillan, W.O.; Enriquez, V.; Barraza, E.; Diaz, M.; Sanchez-Galan, J.E.; Whiteman, A.; et al. High Infestation of Invasive Aedes Mosquitoes in Used Tires along the Local Transport Network of Panama. Parasit. Vectors 2019, 12, 264. [Google Scholar] [CrossRef] [PubMed] [Green Version]
  15. Foley, D.H.; Wilkerson, R.C.; Birney, I.; Harrison, S.; Christensen, J.; Rueda, L.M. MosquitoMap and the Mal-Area Calculator: New Web Tools to Relate Mosquito Species Distribution with Vector Borne Disease. Int. J. Health Geogr. 2010, 9, 11. [Google Scholar] [CrossRef] [PubMed] [Green Version]
  16. Wilkerson, R.C.; Linton, Y.-M.; Strickman, D. Mosquitoes of the World; Johns Hopkins University Press: Baltimore, MD, USA, 2020; ISBN 978-1-4214-3814-6. [Google Scholar]
  17. Crawford, J.E.; Alves, J.M.; Palmer, W.J.; Day, J.P.; Sylla, M.; Ramasamy, R.; Surendran, S.N.; Black, W.C.; Pain, A.; Jiggins, F.M. Population Genomics Reveals That an Anthropophilic Population of Aedes aegypti Mosquitoes in West Africa Recently Gave Rise to American and Asian Populations of This Major Disease Vector. BMC Biol. 2017, 15, 16. [Google Scholar] [CrossRef] [PubMed] [Green Version]
  18. Brown, J.E.; McBride, C.S.; Johnson, P.; Ritchie, S.; Paupy, C.; Bossin, H.; Lutomiah, J.; Fernandez-Salas, I.; Ponlawat, A.; Cornel, A.J.; et al. Worldwide Patterns of Genetic Differentiation Imply Multiple “domestications” of Aedes aegypti, a Major Vector of Human Diseases. Proc. Biol. Sci. 2011, 278, 2446–2454. [Google Scholar] [CrossRef] [Green Version]
  19. Chadee, D.D.; Martinez, R. Aedes aegypti (L.) in Latin American and Caribbean Region: With Growing Evidence for Vector Adaptation to Climate Change? Acta Trop. 2016, 156, 137–143. [Google Scholar] [CrossRef]
  20. Chretien, J.-P.; Anyamba, A.; Bedno, S.A.; Breiman, R.F.; Sang, R.; Sergon, K.; Powers, A.M.; Onyango, C.O.; Small, J.; Tucker, C.J.; et al. Drought-Associated Chikungunya Emergence along Coastal East Africa. Am. J. Trop. Med. Hyg. 2007, 76, 405–407. [Google Scholar] [CrossRef] [Green Version]
  21. Cunze, S.; Kochmann, J.; Koch, L.K.; Klimpel, S. Aedes albopictus and Its Environmental Limits in Europe. PLoS ONE 2016, 11, e0162116. [Google Scholar] [CrossRef]
  22. Farjana, T.; Tuno, N.; Higa, Y. Effects of Temperature and Diet on Development and Interspecies Competition in Aedes aegypti and Aedes Albopictus. Med. Vet. Entomol. 2012, 26, 210–217. [Google Scholar] [CrossRef] [PubMed]
  23. Khan, S.U.; Ogden, N.H.; Fazil, A.A.; Gachon, P.H.; Dueymes, G.U.; Greer, A.L.; Ng, V. Current and Projected Distributions of Aedes Aegypti and Ae. albopictus in Canada and the U.S. Environ. Health Perspect. 2020, 128, 57007. [Google Scholar] [CrossRef] [PubMed]
  24. Ogden, N.H.; Milka, R.; Caminade, C.; Gachon, P. Recent and Projected Future Climatic Suitability of North America for the Asian Tiger Mosquito xi. Parasit. Vectors 2014, 7, 532. [Google Scholar] [CrossRef]
  25. Hill, M.P.; Axford, J.K.; Hoffmann, A.A. Predicting the Spread of Aedes albopictus in Australia under Current and Future Climates: Multiple Approaches and Datasets to Incorporate Potential Evolutionary Divergence: Invasion Potential of A. albopictus in Australia. Austral Ecol. 2014, 39, 469–478. [Google Scholar] [CrossRef]
  26. Kamal, M.; Kenawy, M.A.; Rady, M.H.; Khaled, A.S.; Samy, A.M. Mapping the Global Potential Distributions of Two Arboviral Vectors Aedes aegypti and Ae. albopictus under Changing Climate. PLoS ONE 2018, 13, e0210122. [Google Scholar] [CrossRef] [Green Version]
  27. IPCC. Climate Change 2021: The Physical Science Basis. Contribution of Working Group I to the Sixth Assessment Report of the Intergovernmental Panel on Climate Change; Cambridge University Press: Cambridge, UK; New York, NY, USA, 2021; in press. [Google Scholar]
  28. Fujimori, S.; Hasegawa, T.; Masui, T.; Takahashi, K.; Herran, D.S.; Dai, H.; Hijioka, Y.; Kainuma, M. SSP3: AIM Implementation of Shared Socioeconomic Pathways. Global Environ. Chang. 2017, 42, 268–283. [Google Scholar] [CrossRef]
  29. Vittor, A.Y.; Laporta, G.Z.; Sallum, M.A.M.; Walker, R.T. The COVID-19 Crisis and Amazonia’s Indigenous People: Implications for Conservation and Global Health. World Dev. 2021, 145, 105533. [Google Scholar] [CrossRef]
  30. Wieczorek, J.; Guo, Q.; Hijmans, R. The Point-Radius Method for Georeferencing Locality Descriptions and Calculating Associated Uncertainty. Int. J. Geogr. Inf. Sci. 2004, 18, 745–767. [Google Scholar] [CrossRef]
  31. Chapman, A.; Wieczorek, J. Georeferencing Best Practices. GBIG 2020. [Google Scholar] [CrossRef]
  32. Laporta, G.Z.; Linton, Y.-M.; Wilkerson, R.C.; Bergo, E.S.; Nagaki, S.S.; Sant’Ana, D.C.; Sallum, M.A.M. Malaria Vectors in South America: Current and Future Scenarios. Parasit. Vectors 2015, 8, 426. [Google Scholar] [CrossRef]
  33. Phillips, S.J.; Dudík, M.; Elith, J.; Graham, C.H.; Lehmann, A.; Leathwick, J.; Ferrier, S. Sample Selection Bias and Presence-Only Distribution Models: Implications for Background and Pseudo-Absence Data. Ecol. Appl. 2009, 19, 181–197. [Google Scholar] [CrossRef] [Green Version]
  34. Hastie, T.; Tibshirani, R.; Friedman, J.H. The Elements of Statistical Learning: Data Mining, Inference, and Prediction, 2nd ed.; Springer Series in Statistics; Springer: New York, NY, USA, 2009; ISBN 978-0-387-84857-0. [Google Scholar]
  35. Santos, J.; Meneses, B.M. An Integrated Approach for the Assessment of the Aedes aegypti and Aedes albopictus Global Spatial Distribution, and Determination of the Zones Susceptible to the Development of Zika Virus. Acta Trop. 2017, 168, 80–90. [Google Scholar] [CrossRef] [PubMed]
  36. Liu-Helmersson, J.; Brännström, Å.; Sewe, M.O.; Semenza, J.C.; Rocklöv, J. Estimating Past, Present, and Future Trends in the Global Distribution and Abundance of the Arbovirus Vector Aedes aegypti Under Climate Change Scenarios. Front. Public Health 2019, 7, 148. [Google Scholar] [CrossRef] [PubMed] [Green Version]
  37. Cox, P.M.; Betts, R.A.; Collins, M.; Harris, P.P.; Huntingford, C.; Jones, C.D. Amazonian Forest Dieback under Climate-Carbon Cycle Projections for the 21st Century. Theor. Appl. Climatol. 2004, 78, 137–156. [Google Scholar] [CrossRef]
  38. Malhi, Y.; Roberts, J.T.; Betts, R.A.; Killeen, T.J.; Li, W.; Nobre, C.A. Climate Change, Deforestation, and the Fate of the Amazon. Science 2008, 319, 169–172. [Google Scholar] [CrossRef] [PubMed] [Green Version]
  39. Boisier, J.P.; Ciais, P.; Ducharne, A.; Guimberteau, M. Projected Strengthening of Amazonian Dry Season by Constrained Climate Model Simulations. Nat. Clim Chang. 2015, 5, 656–660. [Google Scholar] [CrossRef]
  40. Foster, P.G.; de Oliveira, T.M.P.; Bergo, E.S.; Conn, J.E.; Sant’Ana, D.C.; Nagaki, S.S.; Nihei, S.; Lamas, C.E.; González, C.; Moreira, C.C.; et al. Phylogeny of Anophelinae Using Mitochondrial Protein Coding Genes. R. Soc. Open Sci. 2017, 4, 170758. [Google Scholar] [CrossRef] [PubMed] [Green Version]
  41. Seixas, G.; Salgueiro, P.; Bronzato-Badial, A.; Gonçalves, Y.; Reyes-Lugo, M.; Gordicho, V.; Ribolla, P.; Viveiros, B.; Silva, A.C.; Pinto, J.; et al. Origin and Expansion of the Mosquito Aedes aegypti in Madeira Island (Portugal). Sci. Rep. 2019, 9, 2241. [Google Scholar] [CrossRef] [Green Version]
  42. Alves, M.J.; Fernandes, P.L.; Amaro, F.; Osório, H.; Luz, T.; Parreira, P.; Andrade, G.; Zé-Zé, L.; Zeller, H. Clinical Presentation and Laboratory Findings for the First Autochthonous Cases of Dengue Fever in Madeira Island, Portugal, October 2012. Eur. Surveill 2013, 18, 20398. [Google Scholar] [CrossRef]
  43. Cochet, A.; Calba, C.; Jourdain, F.; Grard, G.; Durand, G.A.; Guinard, A.; Investigation team; Noël, H.; Paty, M.-C.; Franke, F. Autochthonous Dengue in Mainland France, 2022: Geographical Extension and Incidence Increase. Eur. Surveill 2022, 27, 2200818. [Google Scholar] [CrossRef]
  44. Robino, D.M. Global Destination Cities Index 2019. MasterCard. Available online: https://www.mastercard.com/news/media/wexffu4b/gdci-global-report-final-1.pdf (accessed on 16 December 2022).
  45. Shanks, G.D. Reintroduced Malaria in Queensland, Australia during the Second World War. Intern. Med. J. 2021, 51, 1348–1351. [Google Scholar] [CrossRef] [PubMed]
  46. Grillet, M.E.; Hernández-Villena, J.V.; Llewellyn, M.S.; Paniz-Mondolfi, A.E.; Tami, A.; Vincenti-Gonzalez, M.F.; Marquez, M.; Mogollon-Mendoza, A.C.; Hernandez-Pereira, C.E.; Plaza-Morr, J.D.; et al. Venezuela’s Humanitarian Crisis, Resurgence of Vector-Borne Diseases, and Implications for Spillover in the Region. Lancet Infect. Dis. 2019, 19, e149–e161. [Google Scholar] [CrossRef] [Green Version]
  47. Hotez, P.J.; Basáñez, M.-G.; Acosta-Serrano, A.; Grillet, M.E. Venezuela and Its Rising Vector-Borne Neglected Diseases. PLoS Negl. Trop. Dis. 2017, 11, e0005423. [Google Scholar] [CrossRef] [PubMed] [Green Version]
  48. Soghigian, J.; Gloria-Soria, A.; Robert, V.; Le Goff, G.; Failloux, A.-B.; Powell, J.R. Genetic Evidence for the Origin of Aedes aegypti, the Yellow Fever Mosquito, in the Southwestern Indian Ocean. Mol. Ecol. 2020, 29, 3593–3606. [Google Scholar] [CrossRef] [PubMed]
  49. Guo, Y.; Song, Z.; Luo, L.; Wang, Q.; Zhou, G.; Yang, D.; Zhong, D.; Zheng, X. Molecular Evidence for New Sympatric Cryptic Species of Aedes albopictus (Diptera: Culicidae) in China: A New Threat from Aedes albopictus Subgroup? Parasit. Vectors 2018, 11, 228. [Google Scholar] [CrossRef] [PubMed] [Green Version]
  50. Greni, S.E.; Demari-Silva, B.; de Oliveira, T.M.P.; Suesdek, L.; Laporta, G.Z.; Sallum, M.A.M. A Multi-Gene Analysis and Potential Spatial Distribution of Species of the Strodei Subgroup of the Genus Nyssorhynchus (Diptera: Culicidae). J. Med. Entomol. 2018, 55, 1486–1495. [Google Scholar] [CrossRef] [PubMed]
  51. Ratnasingham, S.; Hebert, P.D.N. A DNA-Based Registry for All Animal Species: The Barcode Index Number (BIN) System. PLoS ONE 2013, 8, e66213. [Google Scholar] [CrossRef] [PubMed]
Figure 1. VectorMap species occurrence data: (A) Aedes aegypti; and (B) Aedes albopictus as adults (females, males) or immatures (larvae). Georeferencing of point coordinates was effectuated in decimal degrees of latitude and longitude in WGS84. World country map was based on simplified world country polygons by the National Aeronautics and Space Administration (NASA).
Insects 14 00049 g001
Figure 2. Spatial prediction of fitted boosted regression tree models: (A) Aedes aegypti (model evaluation: AUC = 0.9946303; threshold of maximum sensitivity + specificity = 0.8452035); and (B) Aedes albopictus (model evaluation: AUC = 0.9996303; threshold of maximum sensitivity + specificity = 0.9944801). Fundamental niche = predicted probability of presence > threshold; unsuitable habitats = otherwise. World country map was based on simplified world country polygons by NASA.
Insects 14 00049 g002
Figure 3. Potential future distribution of Ae. aegypti in Americas: (A) 2021–2040; (B) 2041–2060; (C) 2061–2080; and (D) 2081–2100. Future climate projections based on the global climate model GFDL-ESM4.1 by NOAA in the shared socio-economic pathway SSP3-7.0 of region rivalry. Locations of capitals of countries were shown for reference.
Insects 14 00049 g003
Figure 4. Potential future distribution of Ae. aegypti in Europe and Africa: (A) 2021–2040; (B) 2041–2060; (C) 2061–2080; and (D) 2081–2100. Future climate projections based on the global climate model GFDL-ESM4.1 by NOAA in the shared socio-economic pathway SSP3-7.0 of region rivalry. Locations of capitals of countries were shown for reference.
Insects 14 00049 g004
Figure 5. Potential future distribution of Ae. aegypti in Asia and Oceania: (A) 2021–2040; (B) 2041–2060; (C) 2061–2080; and (D) 2081–2100. Future climate projections based on the global climate model GFDL-ESM4.1 by NOAA in the shared socio-economic pathway SSP3-7.0 of region rivalry. Locations of capitals of countries were shown for reference.
Insects 14 00049 g005
Figure 6. Potential future distribution of Ae. albopictus in Americas: (A) 2021–2040; (B) 2041–2060; (C) 2061–2080; and (D) 2081–2100. Future climate projections based on the global climate model GFDL-ESM4.1 by NOAA in the shared socio-economic pathway SSP3-7.0 of region rivalry. Locations of capitals of countries were shown for reference.
Insects 14 00049 g006
Figure 7. Potential future distribution of Ae. albopictus in Europe and Africa: (A) 2021–2040; (B) 2041–2060; (C) 2061–2080; and (D) 2081–2100. Future climate projections based on the global climate model GFDL-ESM4.1 by NOAA in the shared socio-economic pathway SSP3-7.0 of region rivalry. Locations of capitals of countries were shown for reference.
Insects 14 00049 g007
Figure 8. Potential future distribution of Ae. albopictus in Asia and Oceania: (A) 2021–2040; (B) 2041–2060; (C) 2061–2080; and (D) 2081–2100. Future climate projections based on the global climate model GFDL-ESM4.1 by NOAA in the shared socio-economic pathway SSP3-7.0 of region rivalry. Locations of capitals of countries were shown for reference.
Insects 14 00049 g008
Disclaimer/Publisher’s Note: The statements, opinions and data contained in all publications are solely those of the individual author(s) and contributor(s) and not of MDPI and/or the editor(s). MDPI and/or the editor(s) disclaim responsibility for any injury to people or property resulting from any ideas, methods, instructions or products referred to in the content.

