
Integrating Global Citizen Science Platforms to Enable Next-Generation Surveillance of Invasive and Vector Mosquitoes

 , , , , , , ,
  , and
, and 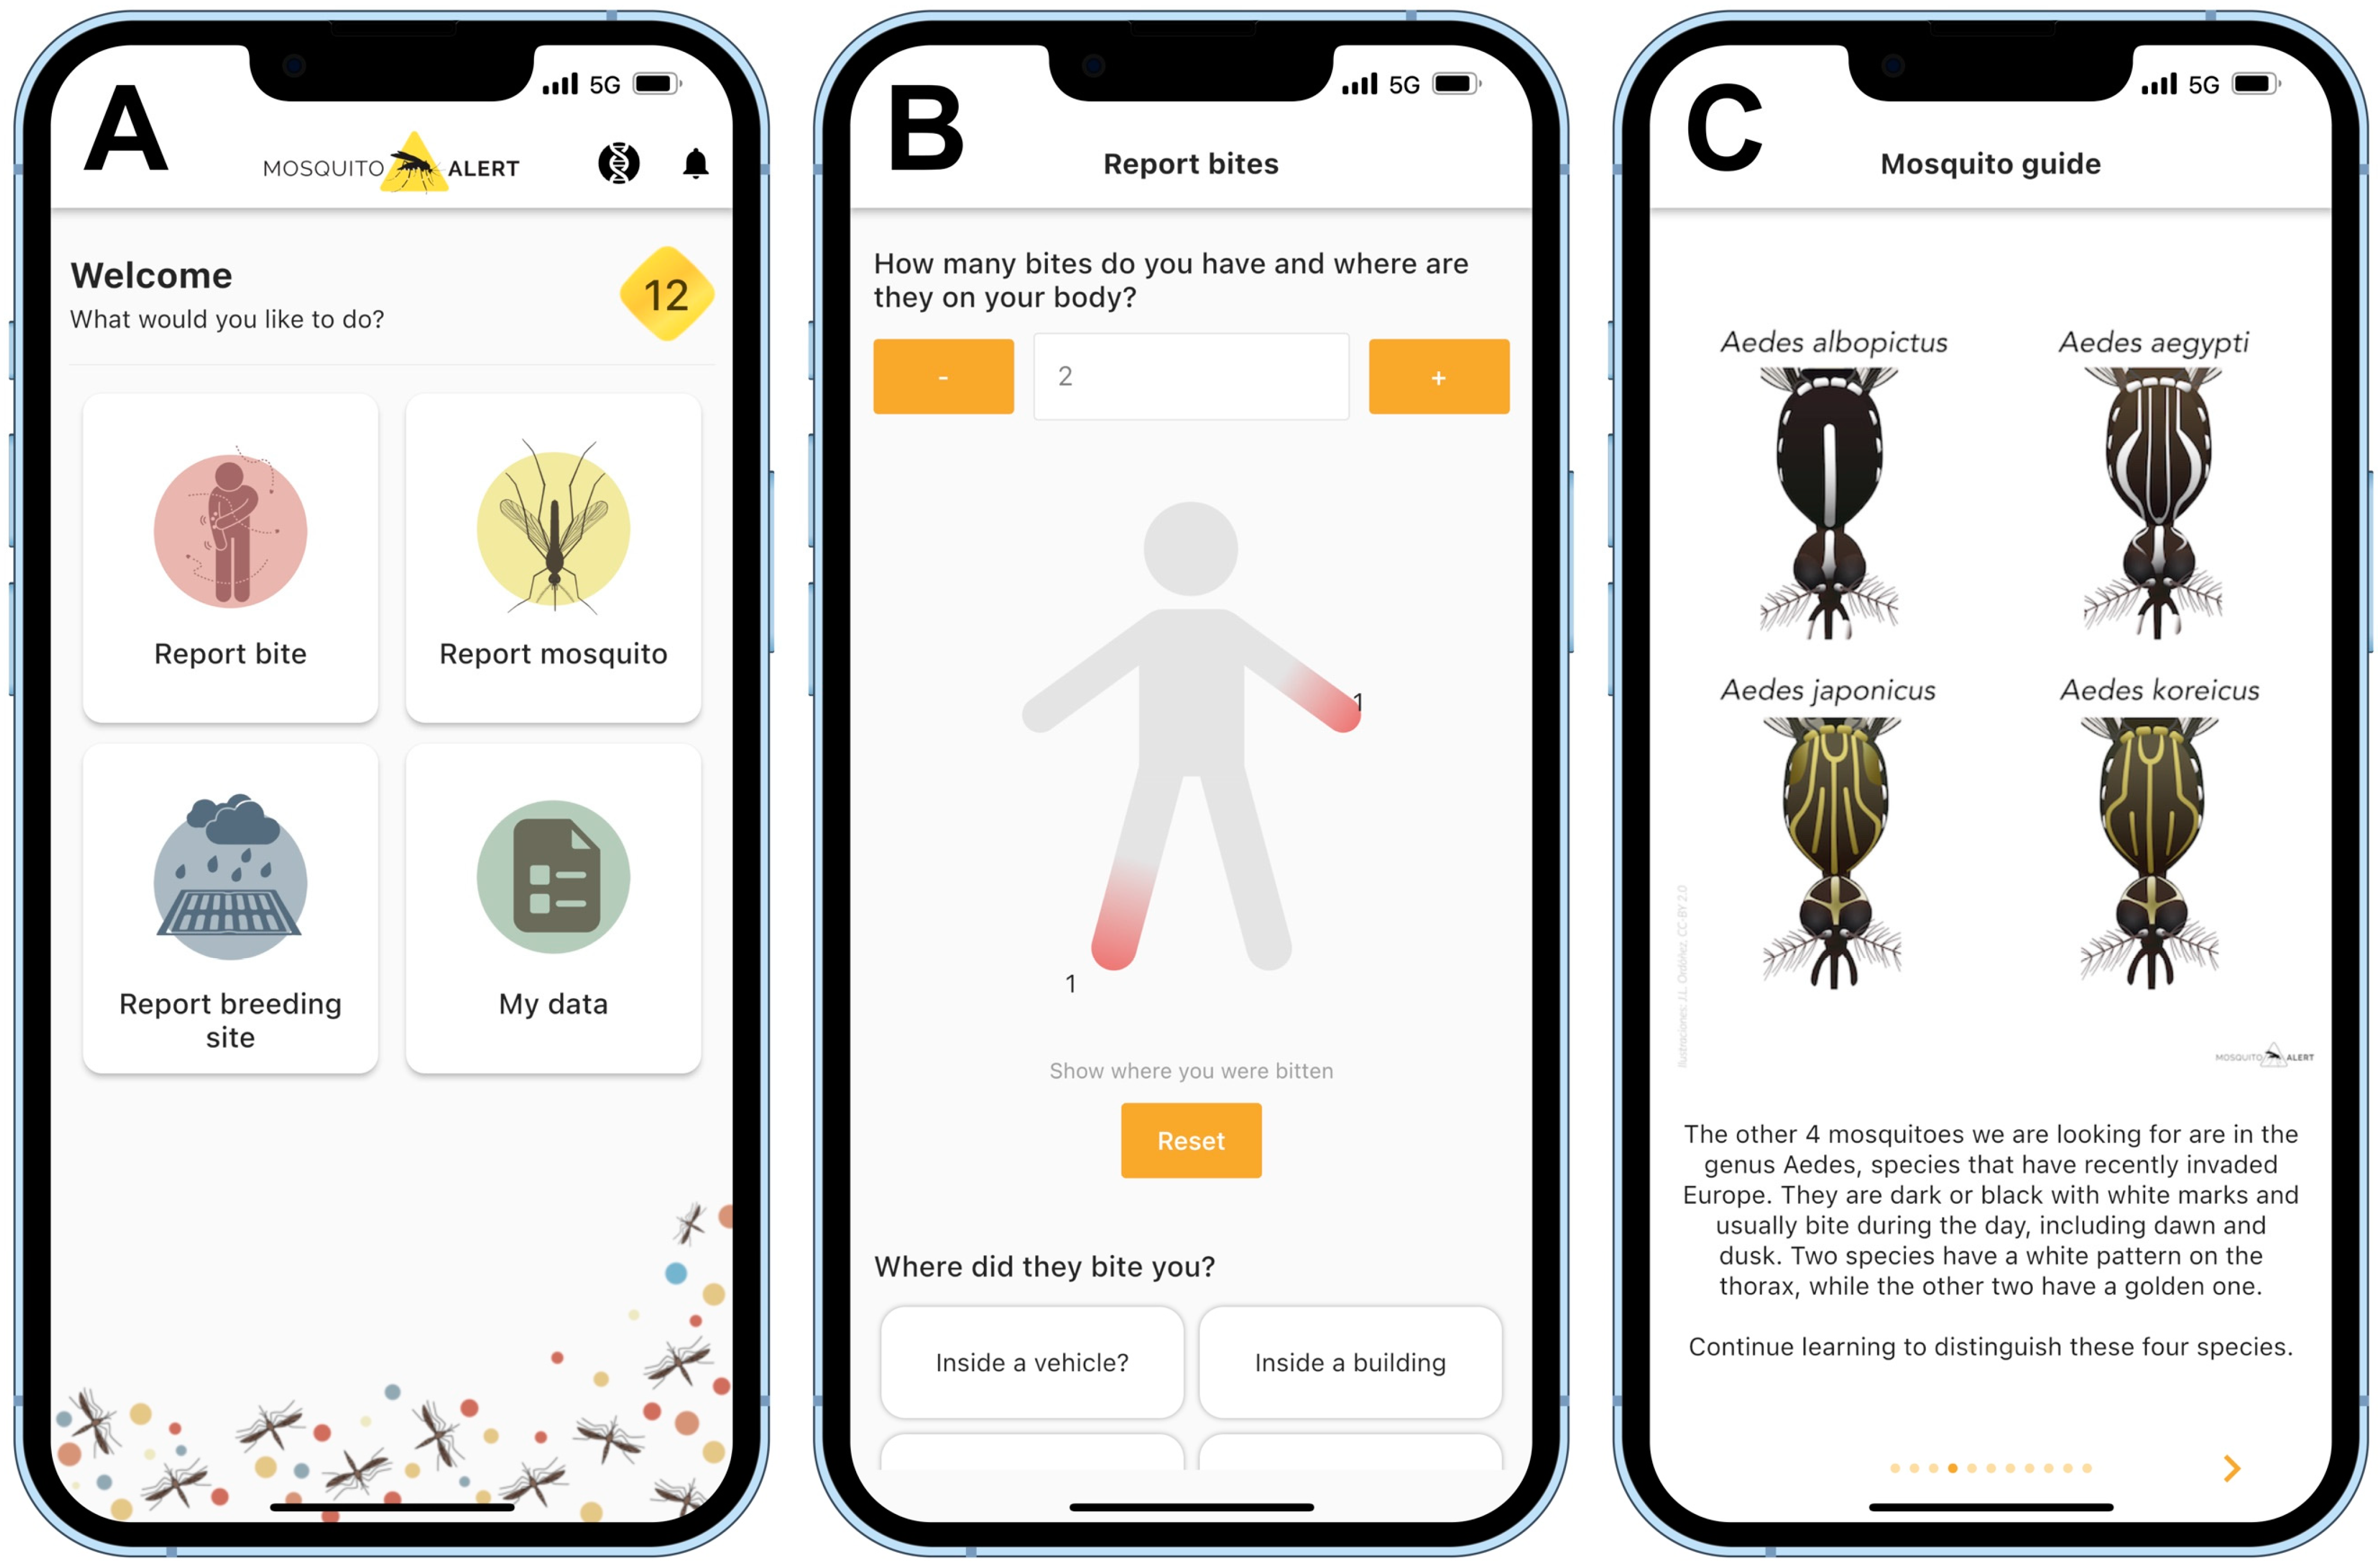
Abstract
:Simple Summary
Abstract
1. Introduction
Objectives
- I.
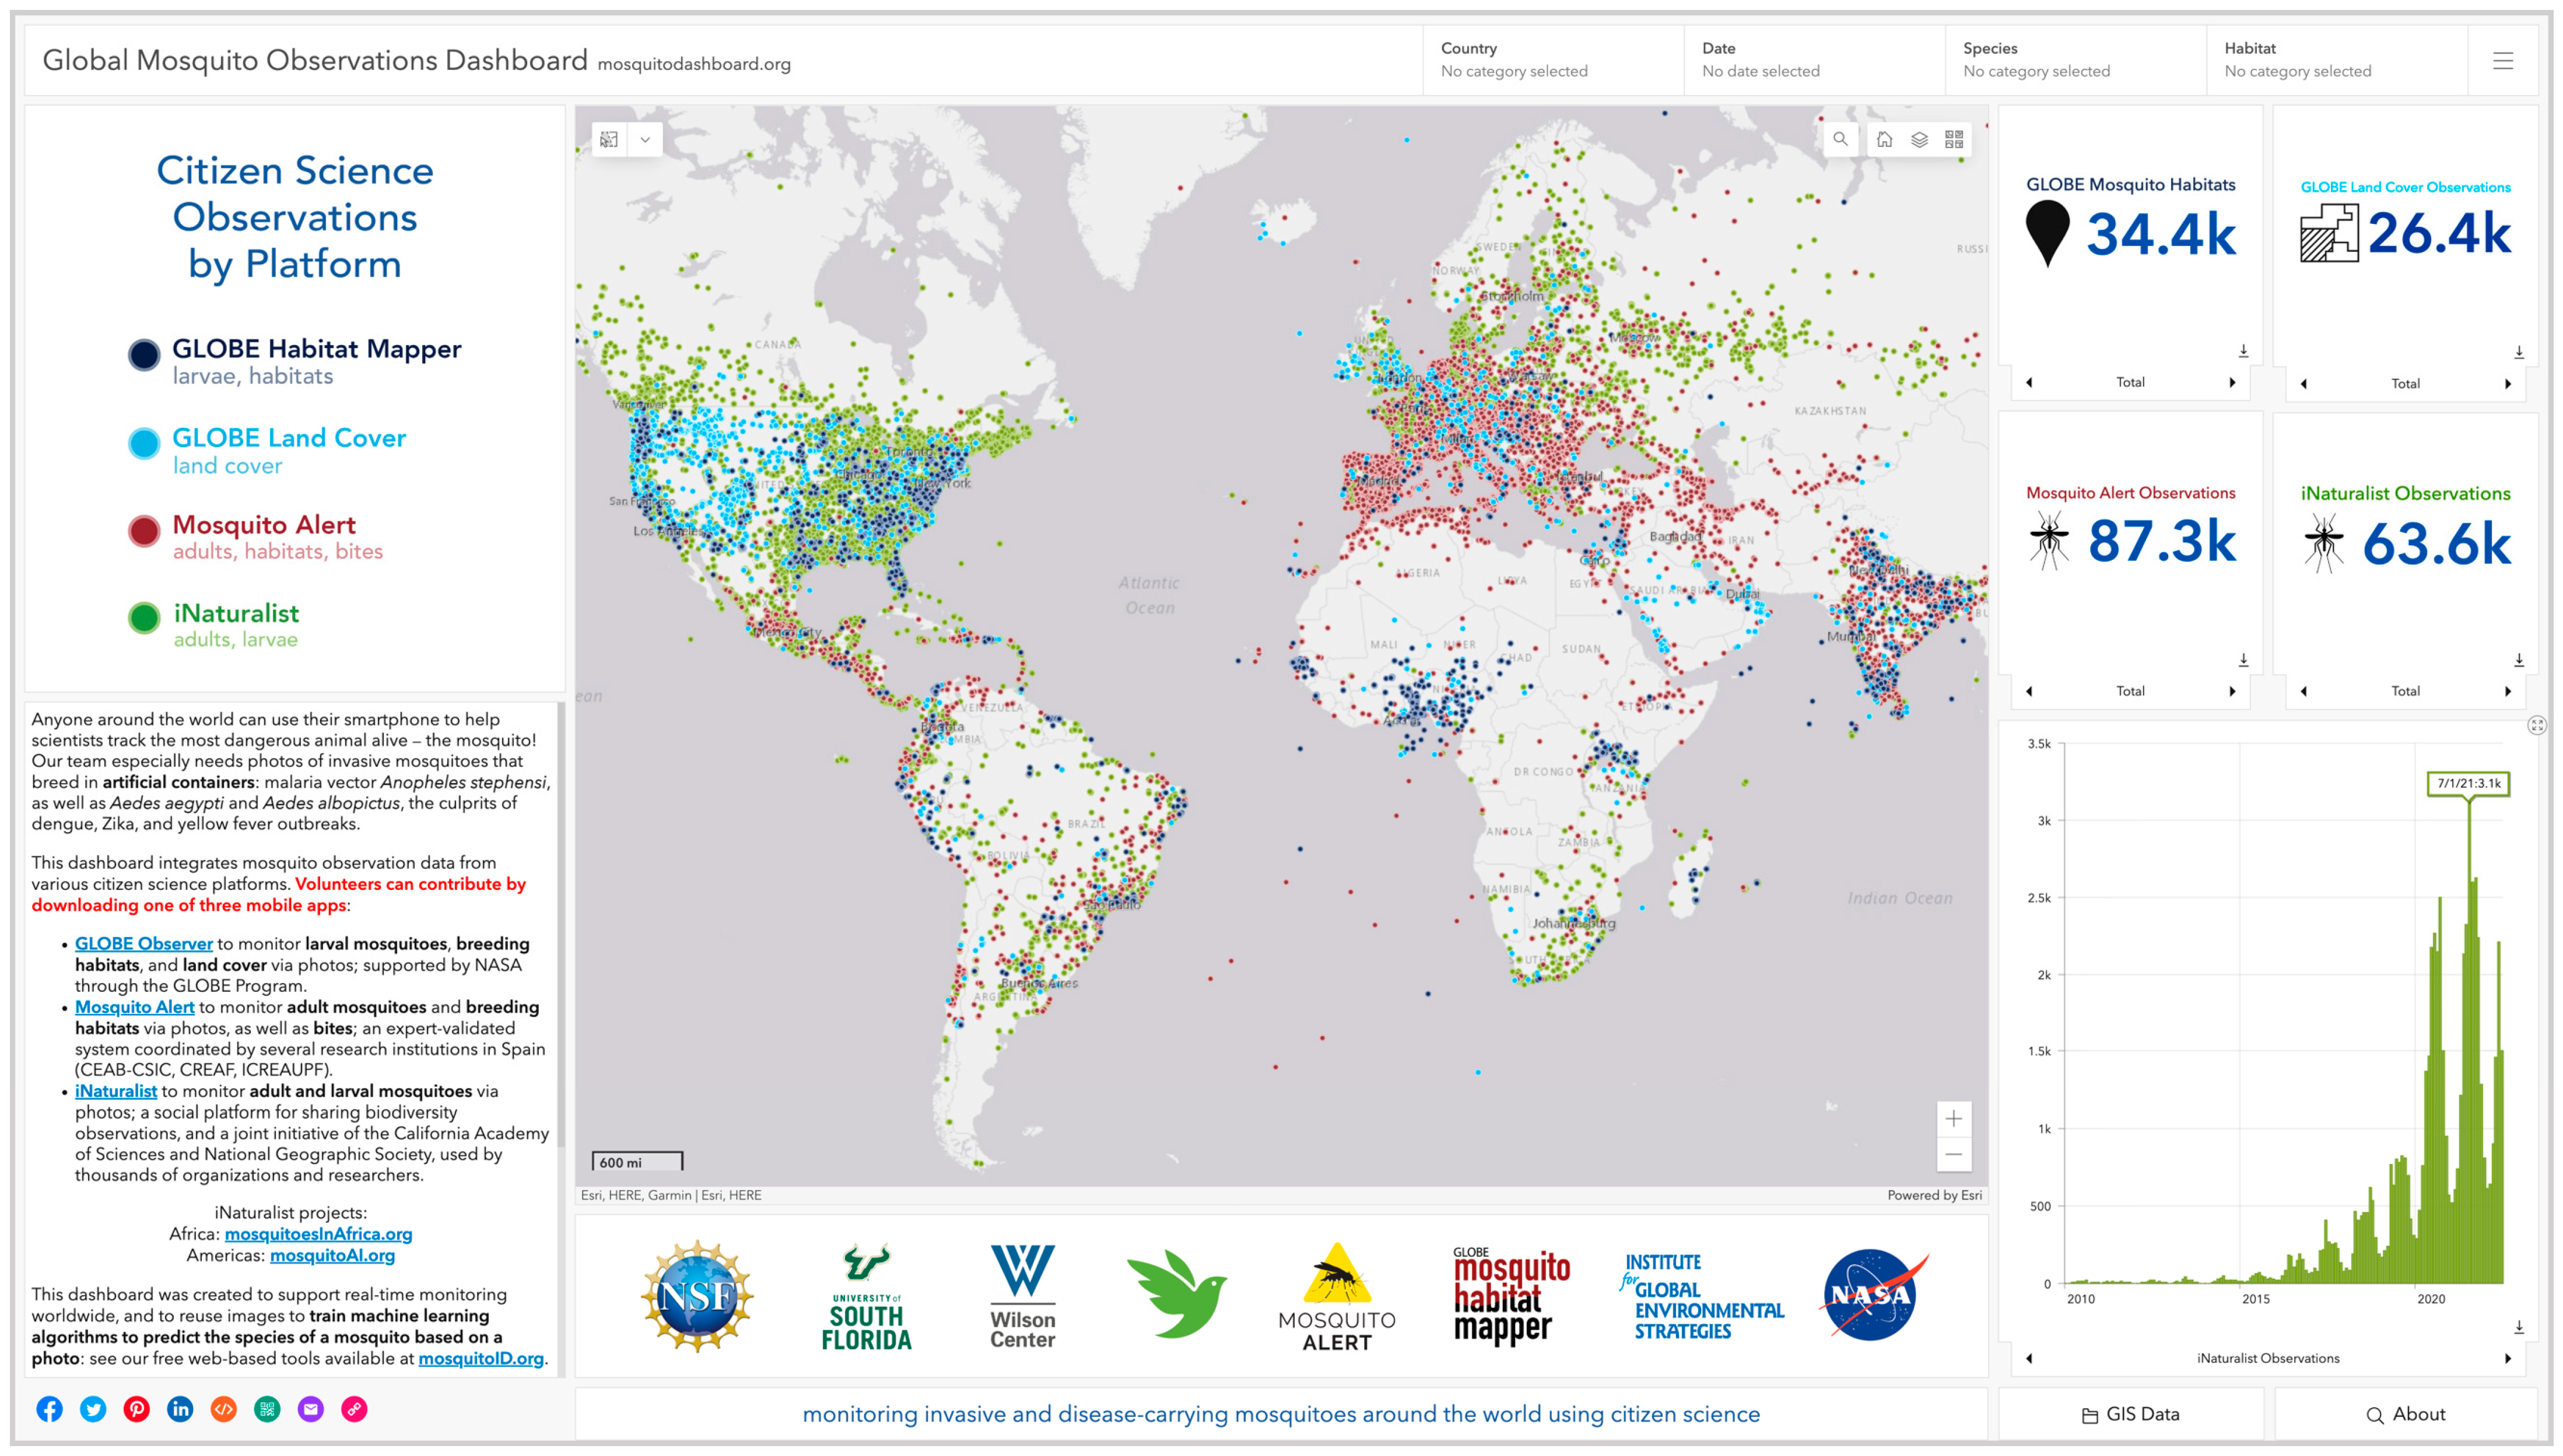
- Integrate datasets from different citizen science projects into a single, interoperable dashboard to support current and future global surveillance of invasive and vector mosquitoes. By harmonizing (i.e., standardizing and combining) multiple updating data streams into an easily accessible and free online format, we predict that these efforts will add value by contributing to monitoring and investigative outcomes beyond what a single platform might achieve. Benefits will arise from reusing and pooling information across disparate spatial and temporal scales as well as across a broader set of observations, from land cover and breeding habitats to larvae, adults, and bites.
- II.
- Target four invasive and vector species of Aedes (Ae.) mosquitoes for observation through a multi-platform promotional campaign and direct recruitment of citizen scientists. Prior work suggests that citizen scientist observations of mosquitoes are reliable measures of relative abundance and human–mosquito interactions [14,30]. Thus, we also aim to generate and reuse species presence data to populate a national risk model for Ae. albopictus (Spain) and to validate a local habitat model for Ae. aegypti (Tampa Bay area, FL, USA). These two species are the primary vectors of dengue, Zika, yellow fever, and chikungunya [13]. Ae. scapularis [35] and Ae. vittatus [36] were recently detected via traps in south Florida and the Caribbean, respectively. Both invasive species have been identified as vectors [36,37] and present new challenges to local vector control organizations for the surveillance and containment of these exotics. Therefore, we also aim to generate new citizen science observations for these two species for both general surveillance and early warning purposes, especially considering that there are no iNaturalist observations of Ae. scapularis in the USA or Ae. vittatus worldwide. We predict that our campaigns will yield at least one observation of an invasive Aedes in a new area for a respective platform, and that the citizen science data will serve as a useful complement to trap-based data for the risk and habitat models.
- III.
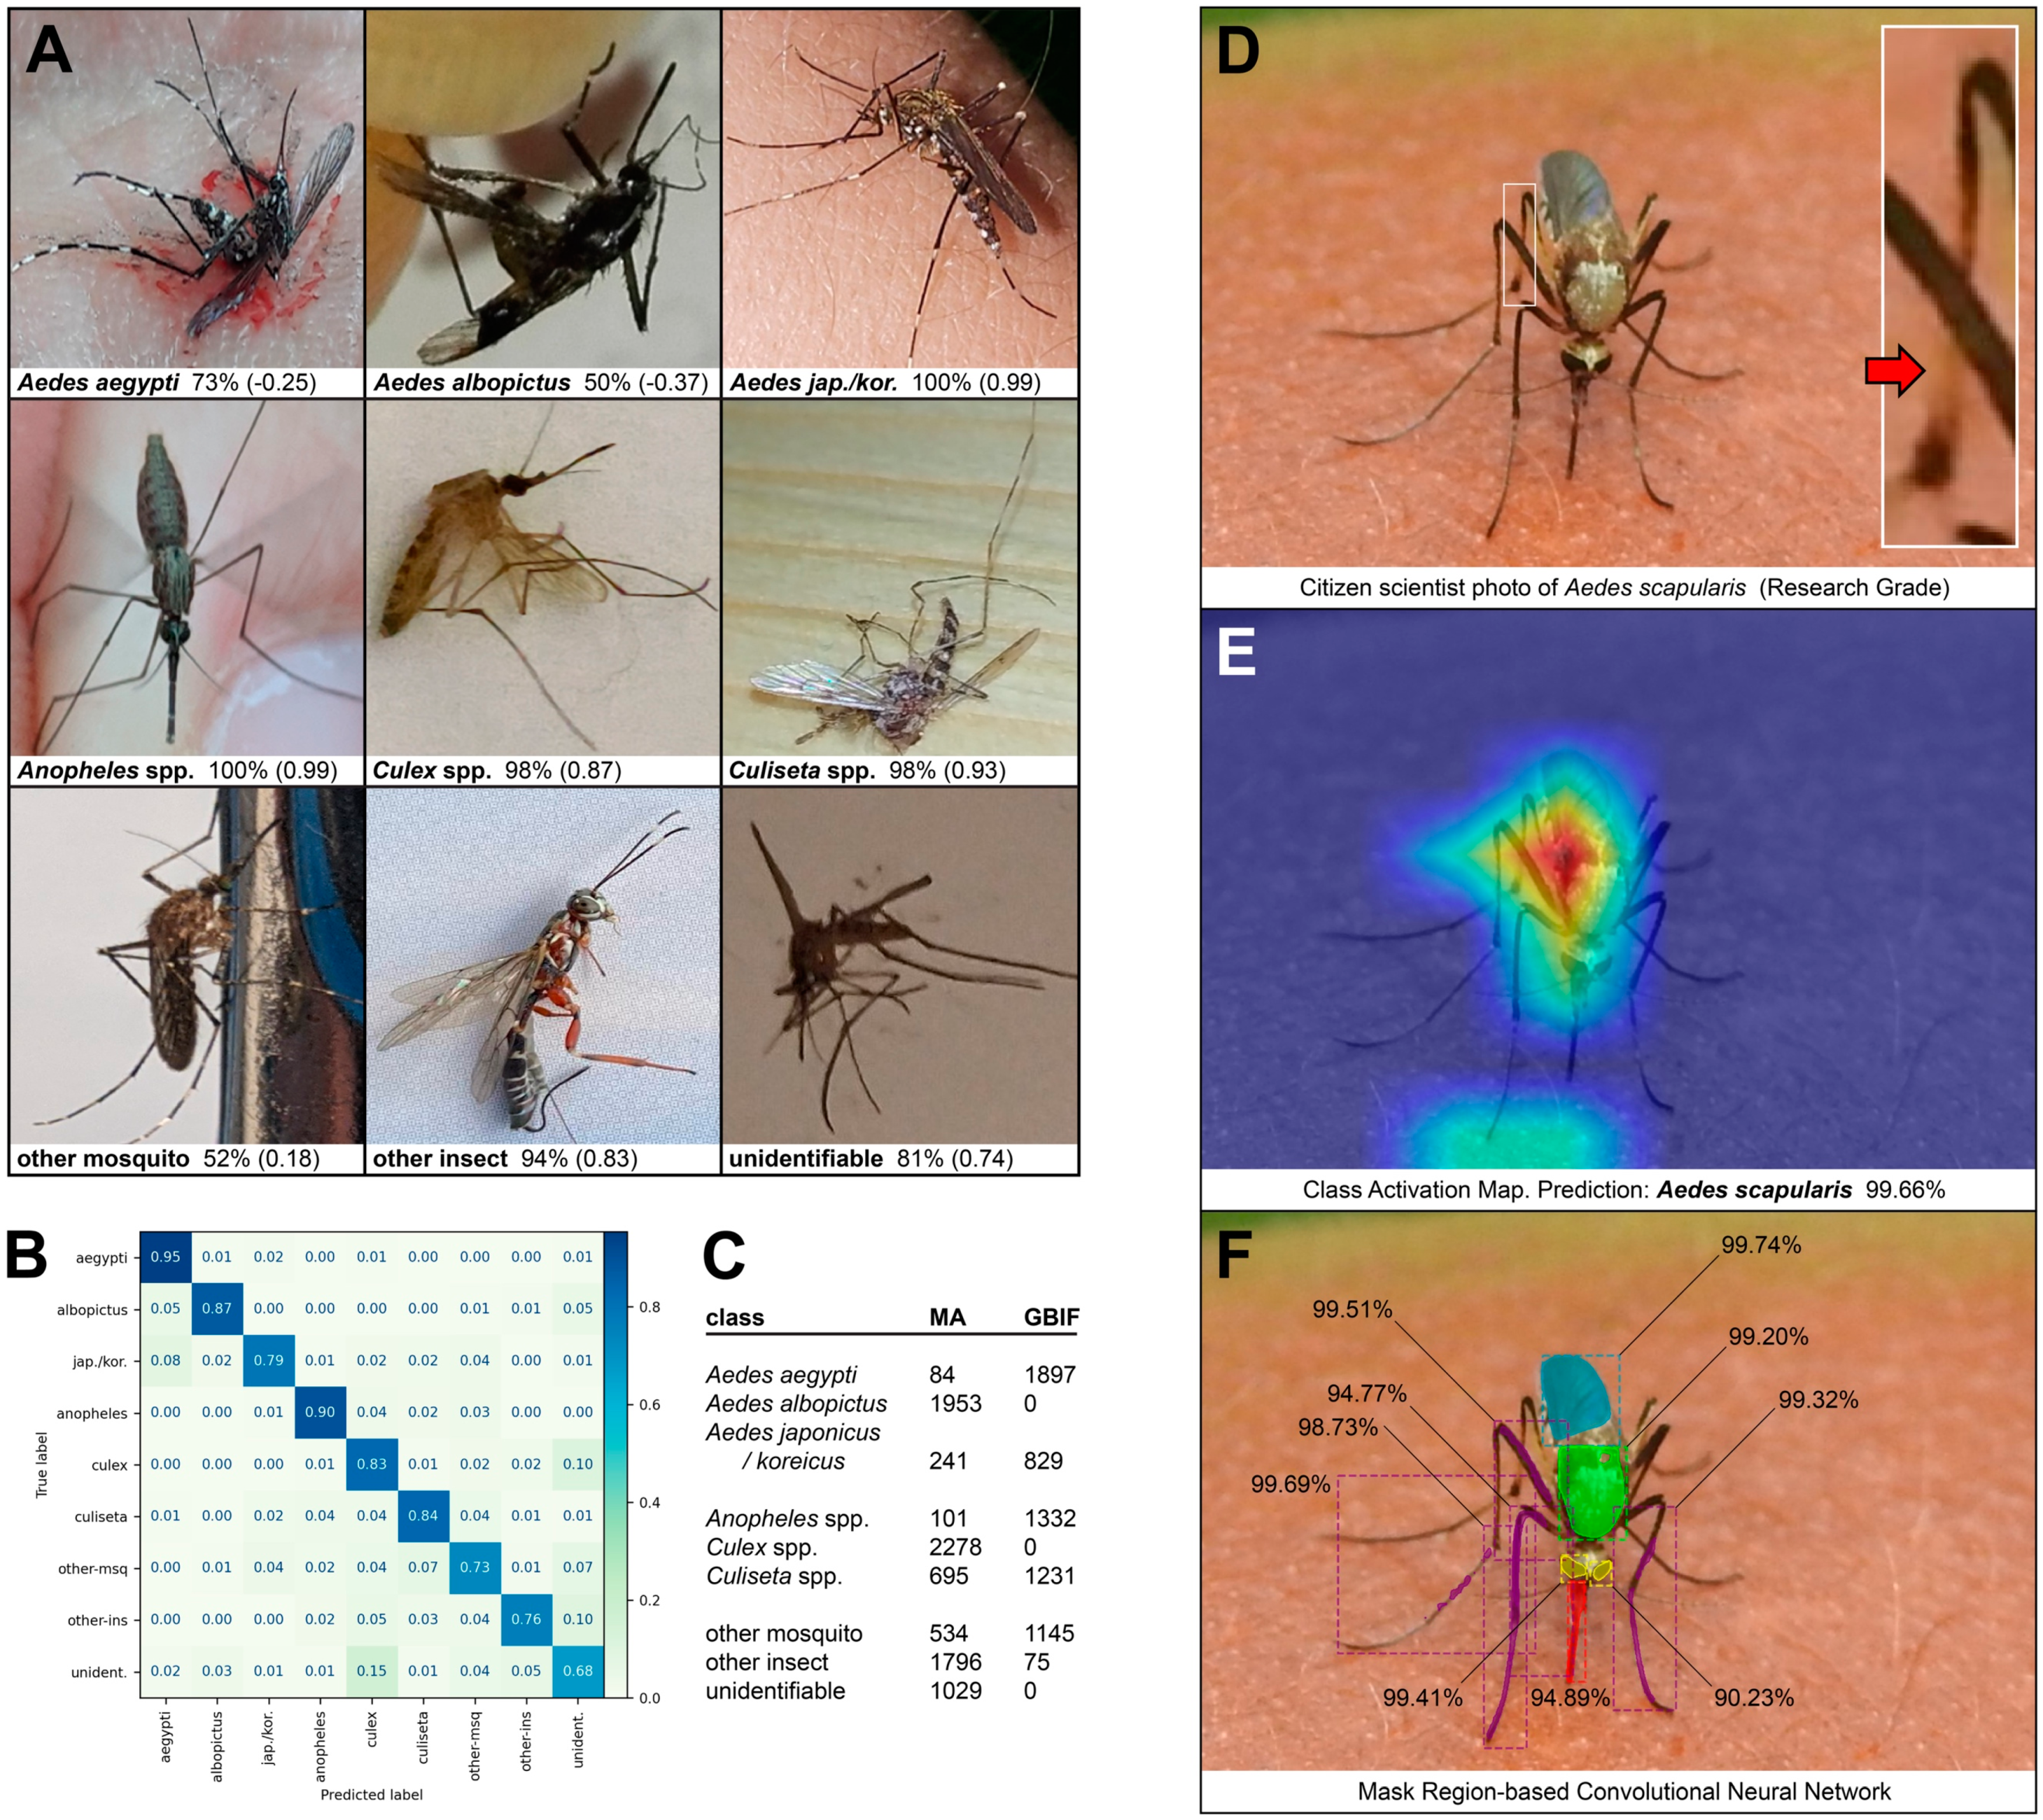
- Reuse citizen science images to train and test artificial intelligence (AI) algorithms that identify mosquito species. These efforts will build on our prior image recognition work, which has demonstrated that smartphone photos of mosquitoes can be accurately classified [38,39,40]. We aim to integrate images across multiple platforms to create training datasets that are balanced across classes. While photos of all mosquito species are beneficial, the need is especially critical for the aforementioned Ae. scapularis and Ae. vittatus. We predict that these efforts will serve to catalyze a longer-term objective of deploying real-time AI in future surveillance efforts.
2. Materials and Methods
2.1. Mosquito Alert

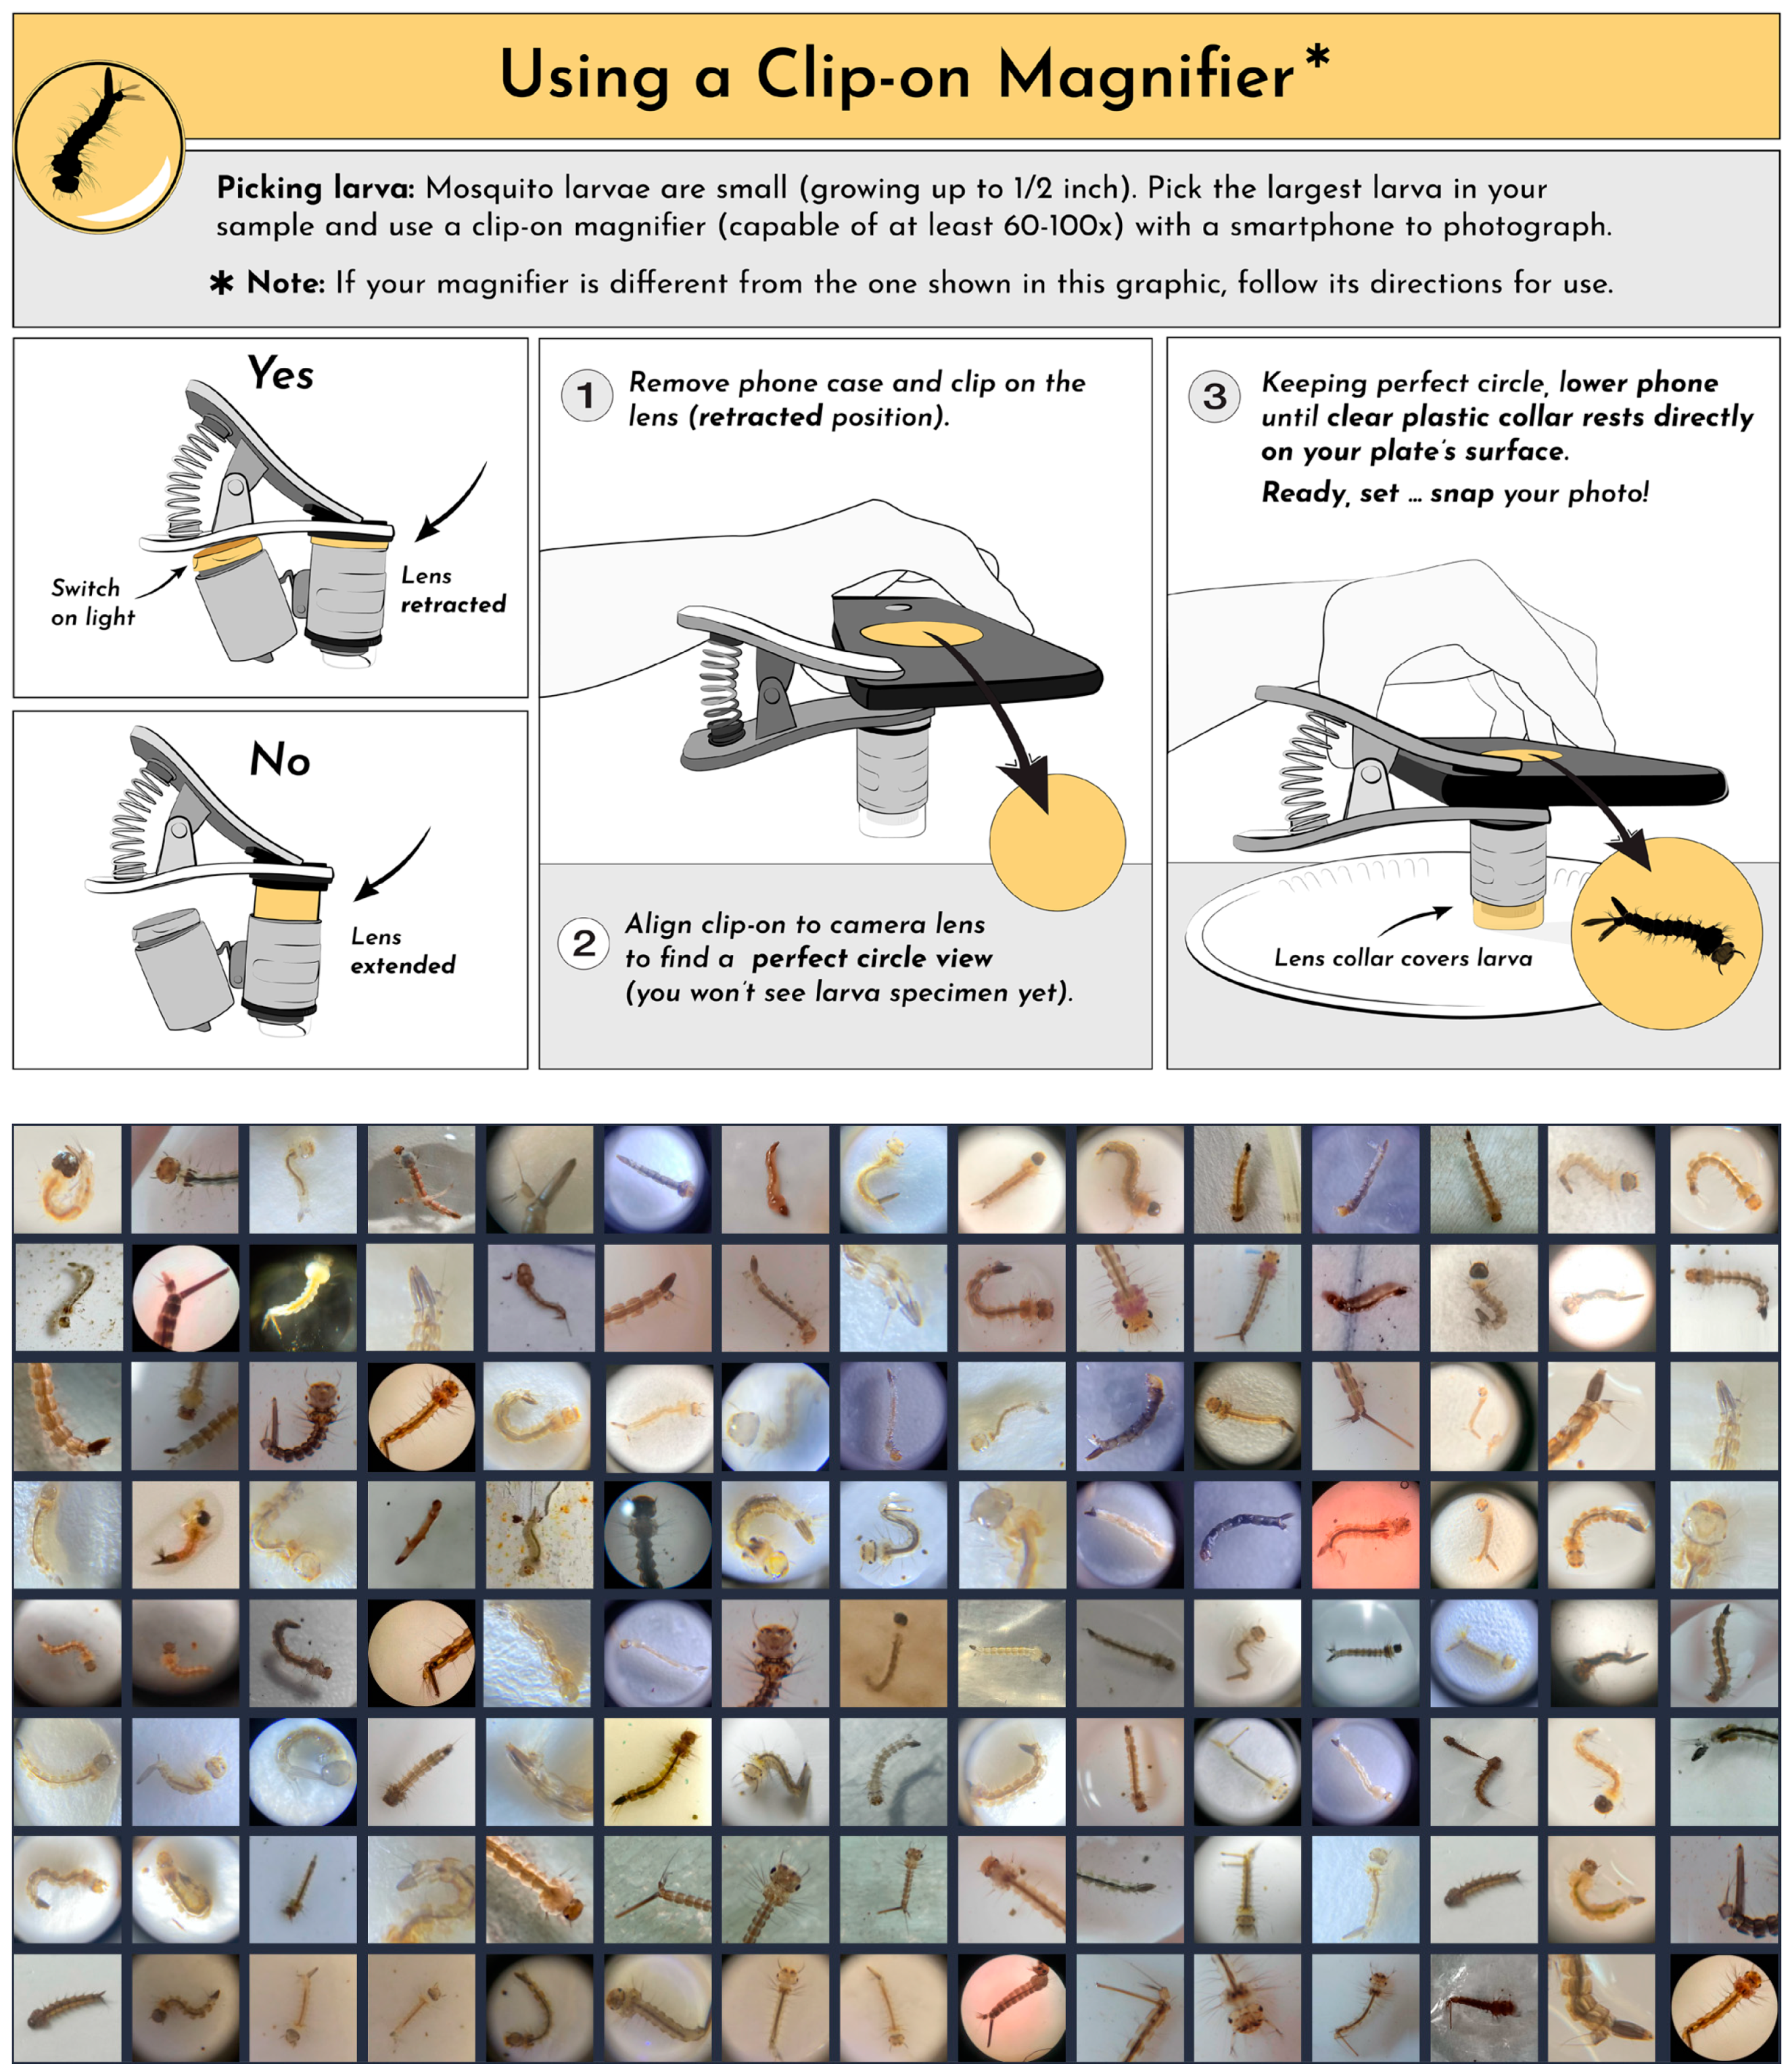
2.2. GLOBE Observer
2.3. iNaturalist
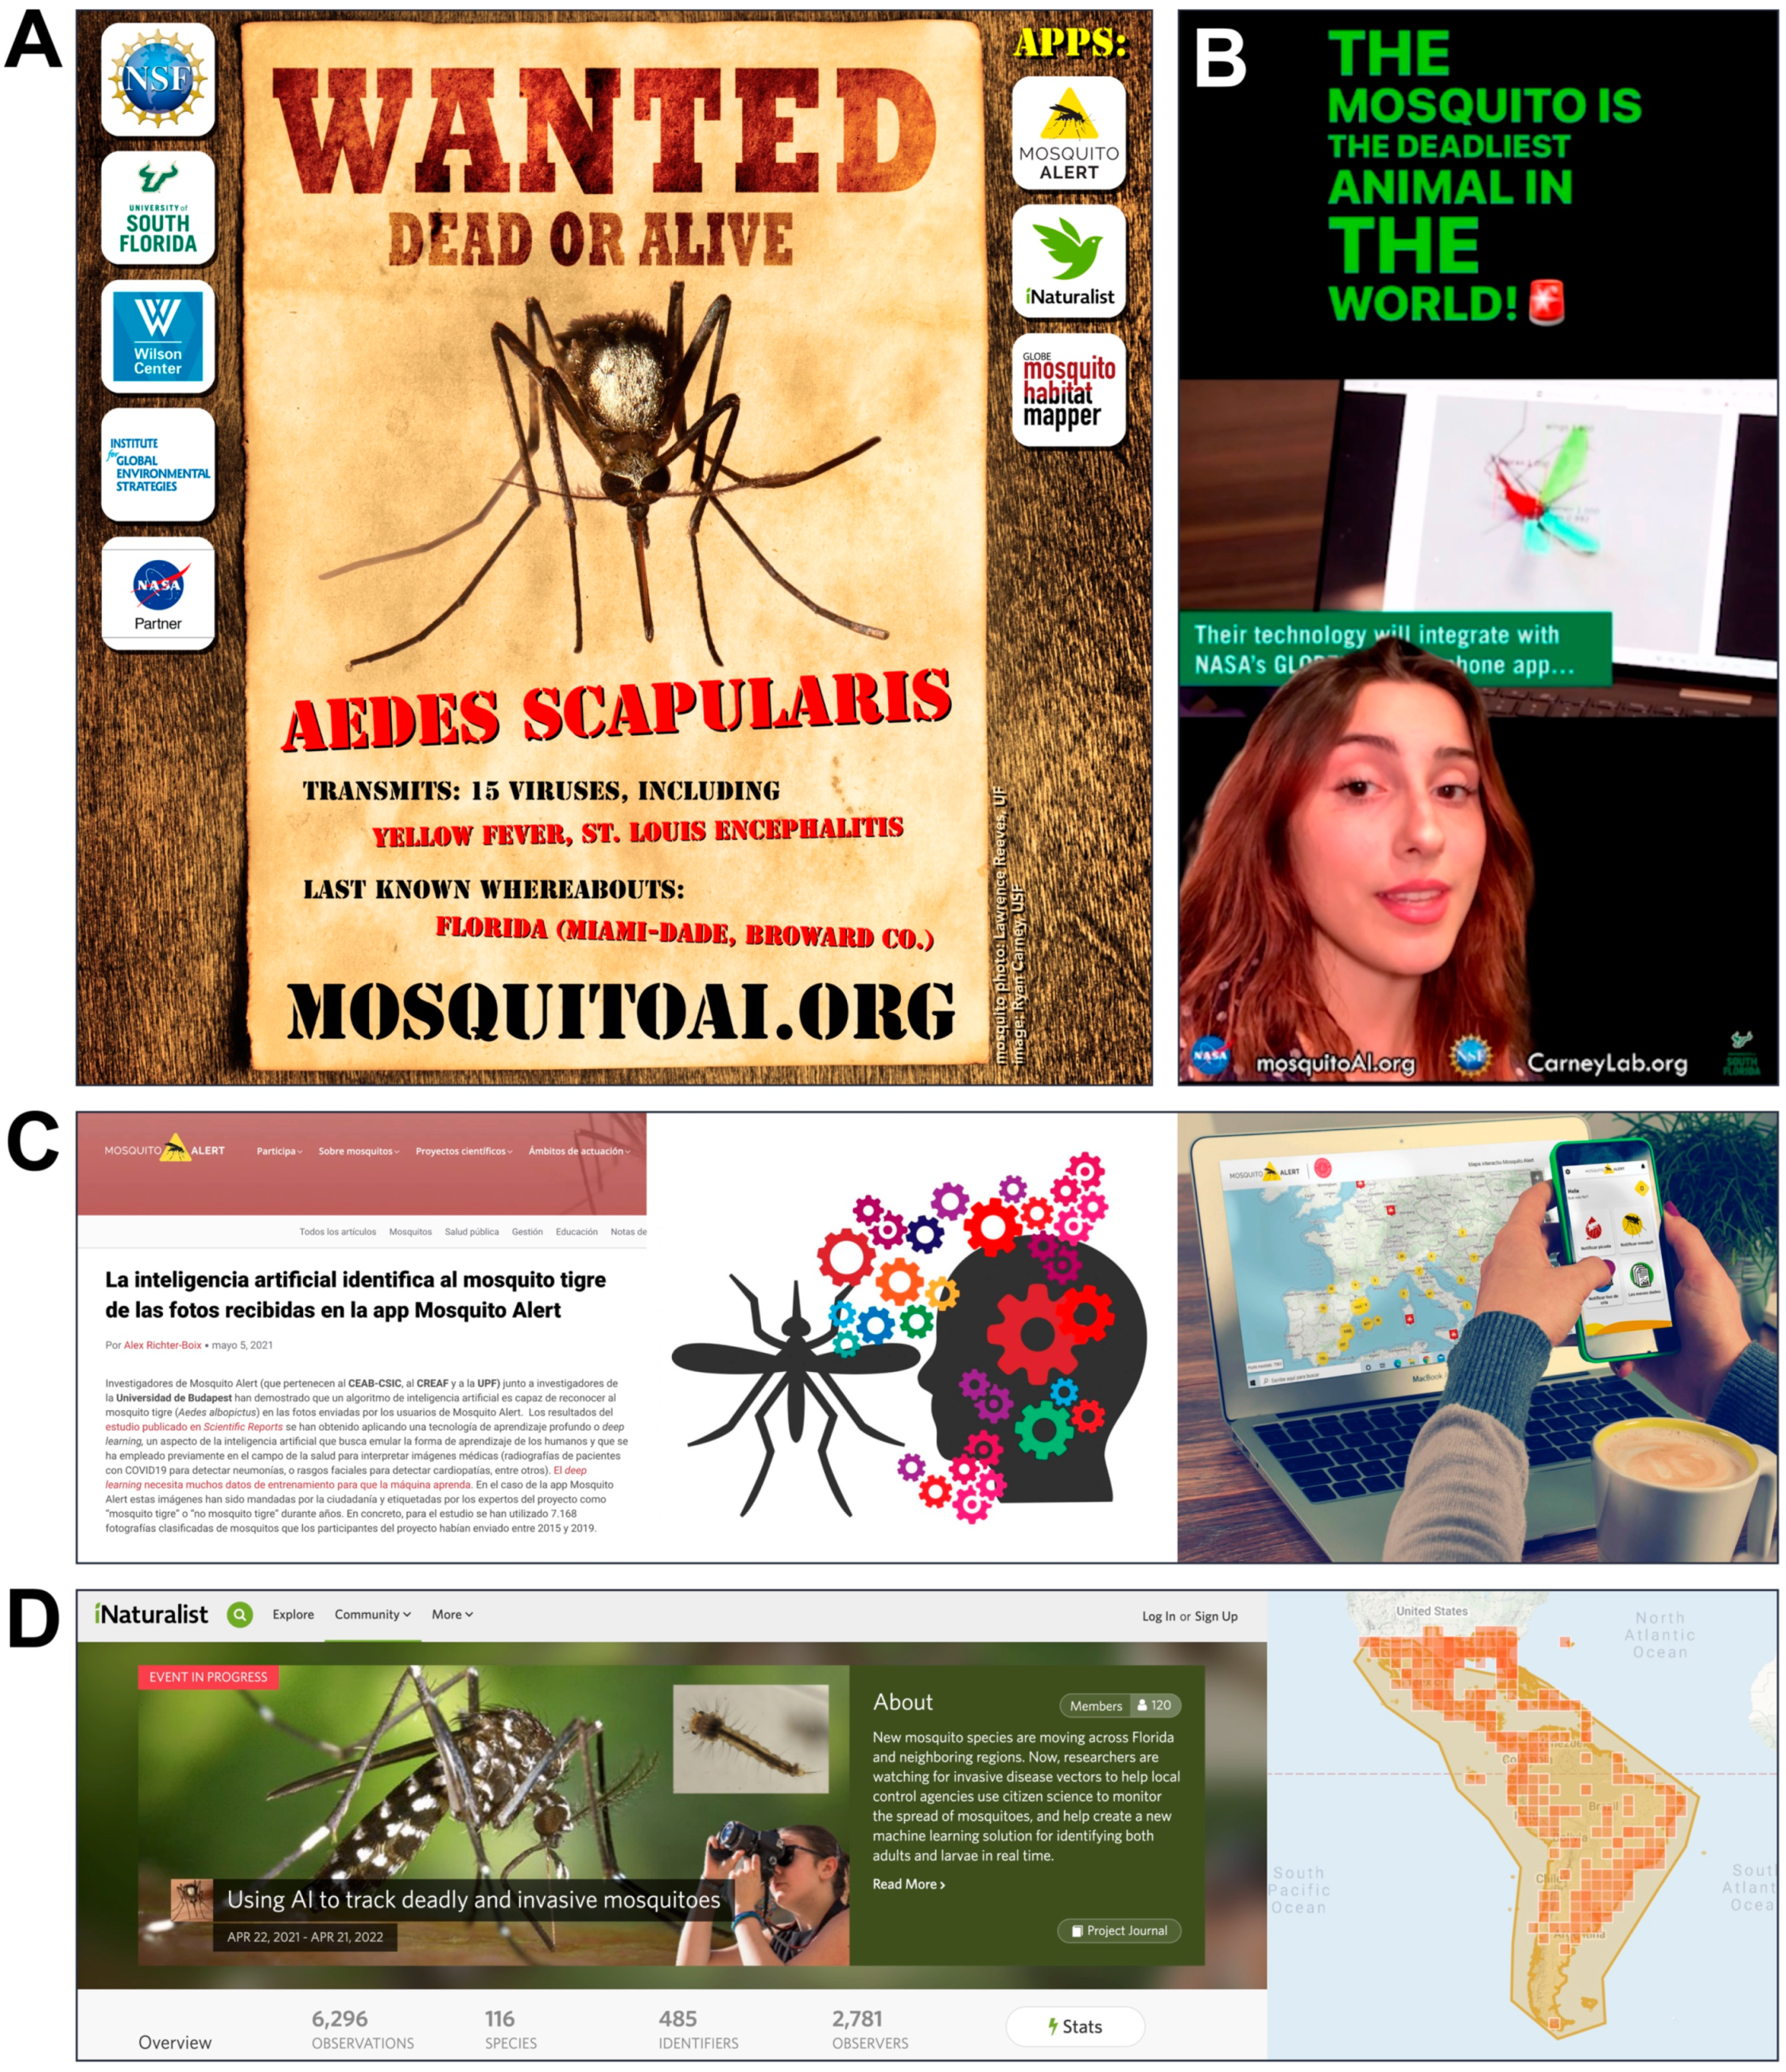
2.4. Campaigns

2.5. Dashboard
2.6. Artificial Intelligence
3. Results
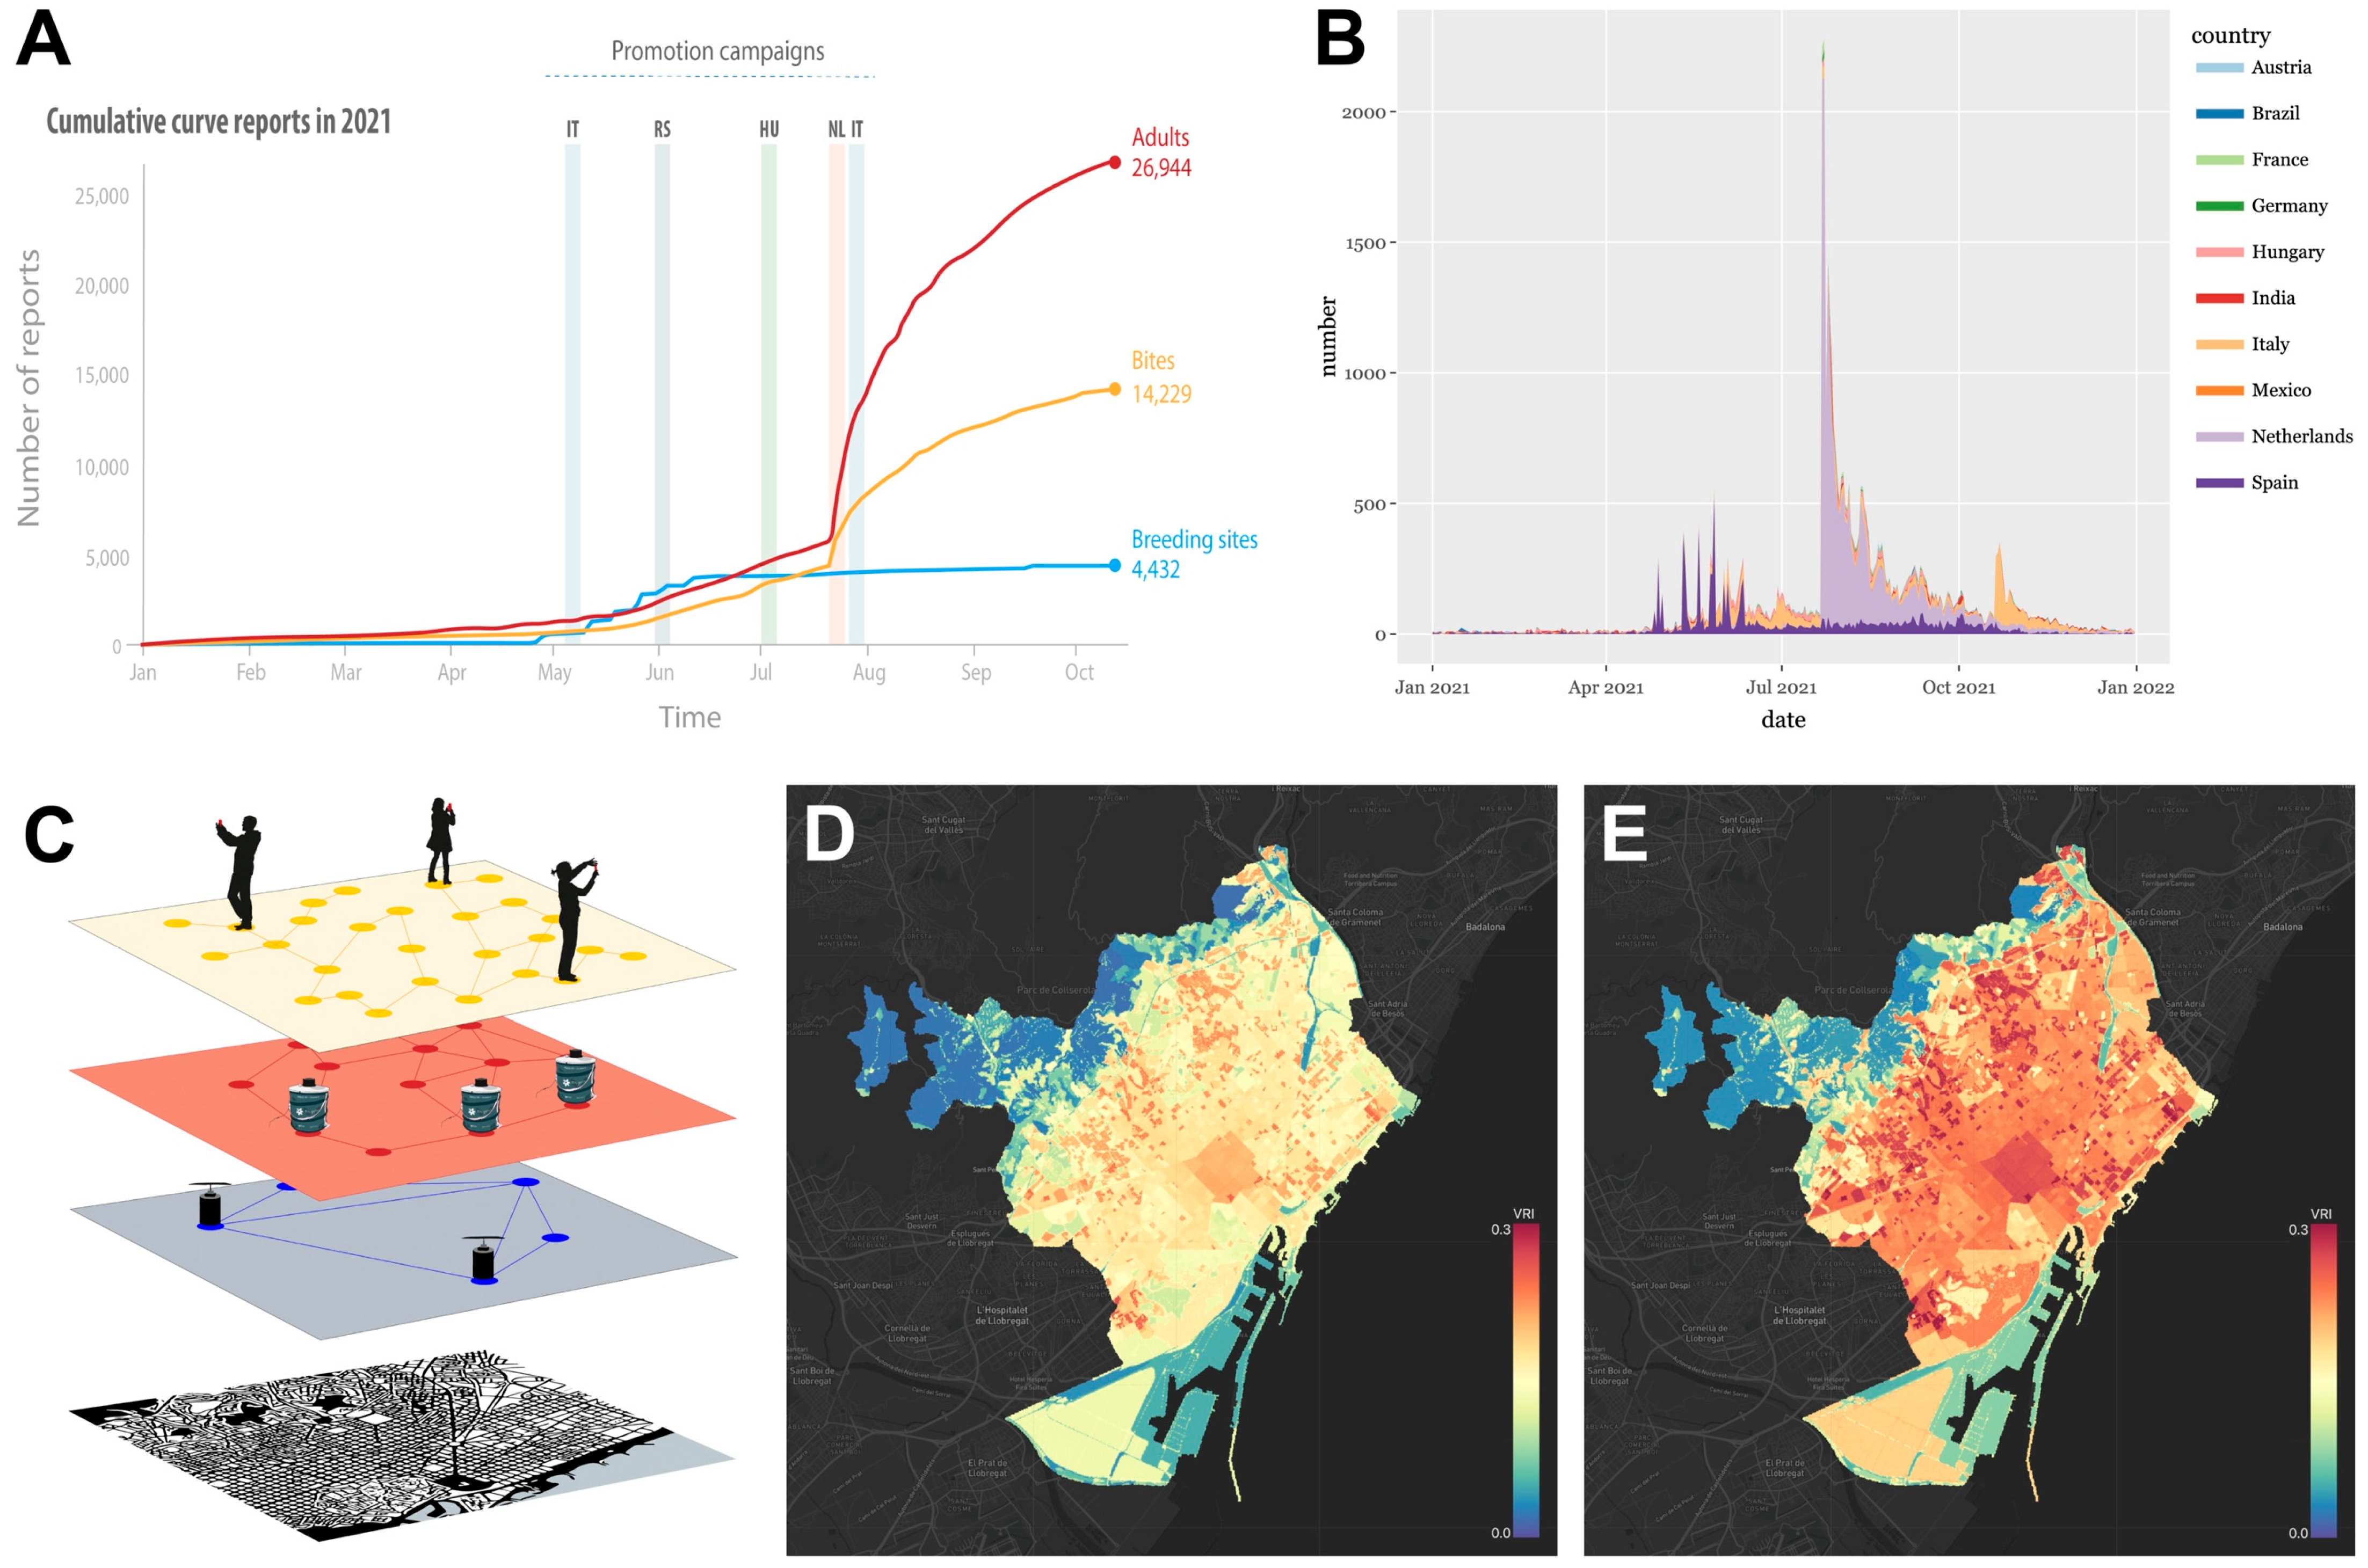
3.1. Campaigns
3.1.1. Mosquito Alert
3.1.2. GLOBE Observer
3.1.3. iNaturalist

3.2. Dashboard

3.3. Artificial Intelligence

4. Discussion
5. Conclusions
Supplementary Materials
Author Contributions
Funding
Institutional Review Board Statement
Data Availability Statement
Acknowledgments
Conflicts of Interest
References
- Haklay, M.; Dörler, D.; Heigl, F.; Manzoni, M.; Hecker, S.; Vohland, K. What is citizen science? The challenges of definition. In The Science of Citizen Science; Vohland, K., Land-Zandstra, A., Ceccaroni, L., Lemmens, R., Perelló, J., Ponti, M., Samson, R., Wagenknecht, K., Eds.; Springer: Cham, Switzerland, 2021. [Google Scholar] [CrossRef]
- Eitzel, M.V.; Cappadonna, J.L.; Santos-Lang, C.; Duerr, R.E.; Virapongse, A.; West, S.E.; Kyba, C.C.M.; Bowser, A.; Cooper, C.B.; Sforzi, A.; et al. Citizen science terminology matters: Exploring key terms. Citiz. Sci. Theory Pract. 2017, 2, 1. [Google Scholar] [CrossRef] [Green Version]
- Gardiner, M.M.; Allee, L.L.; Brown, P.M.; Losey, J.E.; Roy, H.E.; Smyth, R.R. Lessons from lady beetles: Accuracy of monitoring data from US and UK citizen-science programs. Front. Ecol. Environ. 2012, 10, 471–476. [Google Scholar] [CrossRef] [Green Version]
- MacPhail, V.J.; Gibson, S.D.; Hatfield, R.; Colla, S.R. Using Bumble Bee Watch to investigate the accuracy and perception of bumble bee (Bombus spp.) identification by community scientists. PeerJ 2020, 8, e9412. [Google Scholar] [CrossRef] [PubMed]
- Maistrello, L.; Dioli, P.; Bariselli, M.; Mazzoli, G.L.; Giacalone-Forini, I. Citizen science and early detection of invasive species: Phenology of first occurrences of Halyomorpha halys in Southern Europe. Biol. Invasions 2016, 18, 3109–3116. [Google Scholar] [CrossRef]
- Packer, L.; Monckton, S.K.; Onuferko, T.M.; Ferrari, R.R. Validating taxonomic identifications in entomological research. Insect Conserv. Divers. 2018, 11, 1–12. [Google Scholar] [CrossRef]
- Prudic, K.L.; McFarland, K.P.; Oliver, J.C.; Hutchinson, R.A.; Long, E.C.; Kerr, J.T.; Larrivée, M. eButterfly: Leveraging massive online citizen science for butterfly conservation. Insects 2017, 8, 53. [Google Scholar] [CrossRef]
- Hamer, S.A.; Curtis-Robles, R.; Hamer, G.L. Contributions of citizen scientists to arthropod vector data in the age of digital epidemiology. Curr. Opin. Insect Sci. 2018, 28, 98–104. [Google Scholar] [CrossRef] [PubMed]
- Katapally, T.R. A global digital citizen science policy to tackle pandemics like COVID-19. J. Med. Internet Res. 2020, 22, e19357. [Google Scholar] [CrossRef] [PubMed]
- Abourashed, A.; Doornekamp, L.; Escartin, S.; Koenraadt, C.J.; Schrama, M.; Wagener, M.; Bartumeus, F.; van Gorp, E. The potential role of school citizen science programs in infectious disease surveillance: A critical review. Int. J. Environ. Res. Public Health 2021, 18, 7019. [Google Scholar] [CrossRef]
- Palmer, J.R.; Brocklehurst, M.; Tyson, E.; Bowser, A.; Pauwels, E.; Bartumeus, F. Global Mosquito Alert; UCL Press: London, UK, 2018. [Google Scholar]
- World Health Organization. World Malaria Report; License: CC BY-NC-SA 3.0 IGO; World Health Organization: Geneva, Switzerland, 2021. [Google Scholar]
- World Health Organization. Dengue and Severe Dengue. 2022. Available online: who.int/news-room/fact-sheets/detail/dengue-and-severe-dengue (accessed on 30 April 2022).
- Palmer, J.R.; Oltra, A.; Collantes, F.; Delgado, J.A.; Lucientes, J.; Delacour, S.; Bengoa, M.; Eritja, R.; Bartumeus, F. Citizen science provides a reliable and scalable tool to track disease-carrying mosquitoes. Nat. Commun. 2017, 8, 916. [Google Scholar] [CrossRef] [Green Version]
- UN Global Pulse. Big Data for Development: Challenges and Opportunities. 2012. Available online: https://www.unglobalpulse.org/document/big-data-for-development-opportunities-and-challenges-white-paper/ (accessed on 27 January 2022).
- Bartumeus, F.; Oltra, A.; Palmer, J.R.B. Citizen Science: A gateway for innovation in disease-carrying mosquito management. Trends Parasitol. 2018, 34, 727–729. [Google Scholar] [CrossRef] [PubMed]
- Low, R.; Boger, R.; Nelson, P.; Kimura, M. GLOBE Mosquito Habitat Mapper citizen science data 2017–2020. GeoHealth 2021, 5, 2021GH000436. [Google Scholar] [CrossRef]
- Asingizwe, D.; Poortvliet, P.M.; van Vliet, A.J.; Koenraadt, C.J.; Ingabire, C.M.; Mutesa, L.; Leeuwis, C. What do people benefit from a citizen science programme? Evidence from a Rwandan citizen science programme on malaria control. Malar. J. 2020, 19, 283. [Google Scholar] [CrossRef]
- Tyson, E.; Bowser, A.; Palmer, J.; Kapan, D.; Bartumeus, F.; Martin, B.; Pauwels, E. Global Mosquito Alert: Building Citizen Science Capacity for Surveillance and Control of Disease-Vector Mosquitoes. Wilson Center. 2018. Available online: wilsoncenter.org/publication/global-mosquito-alert-building-citizen-science-capacity-for-surveillance-and-control (accessed on 27 January 2022).
- Murindahabi, M.M.; Asingizwe, D.; Poortvliet, P.M.; van Vliet, A.J.H.; Hakizimana, E.; Mutesa, L.; Takken, W.; Koenraadt, C.J.M. A citizen science approach for malaria mosquito surveillance and control in Rwanda. Wagening. J. Life Sci. 2018, 86–87, 101–110. [Google Scholar] [CrossRef]
- Cochero, J.; Battistia, D.; Matias, C.; Campos, R. “AppEAR” y “Caza mosquitos”: Dos herramientas de ciencia ciudadana para dispositivos móviles que ayudan a contribuir con proyectos científicos a gran escala. Documento de conferencia. In Proceedings of the XV Congreso de la RedPOP, “Conexiones, Nuevas Maneras de Popularizar la Ciencia”, Buenos Aires, Argentina, 21–25 August 2017; Available online: digital.cic.gba.gob.ar/handle/11746/8918 (accessed on 27 December 2021).
- Sousa, L.B.; Fricker, S.R.; Doherty, S.S.; Webb, C.E.; Baldock, K.L.; Williams, C.R. Citizen science and smart phone e-entomology enables low-cost upscaling of mosquito surveillance. Sci. Total Environ. 2020, 704, 135349. [Google Scholar] [CrossRef]
- Kampen, H.; Medlock, J.M.; Vaux, A.G.C.; Koenraadt, C.J.M.; van Vliet, A.J.H.; Bartumeus, F.; Oltra, A.; Sousa Chouin, S.; Werner, J. Approaches to passive mosquito surveillance in the EU. Parasites Vectors 2015, 8, 9. [Google Scholar] [CrossRef] [PubMed] [Green Version]
- Guilbaud, C.S.; Guilbaud, T.G. Mosquito Mapper: A phone application to map urban mosquitoes. Sci. Phone Apps Mob. Devices 2017, 3, 6. [Google Scholar] [CrossRef] [Green Version]
- Pernat, N.; Kampen, H.; Jeschke, J.M.; Werner, D. Citizen science versus professional data collection: Comparison of approaches to mosquito monitoring in Germany. J. Appl. Ecol. 2021, 58, 214–223. [Google Scholar] [CrossRef]
- Pernat, N.; Kampen, H.; Ruland, F.; Jeschke, J.M.; Werner, D. Drivers of spatio-temporal variation in mosquito submissions to the citizen science project ‘Mückenatlas’. Sci. Rep. 2021, 11, 1356. [Google Scholar] [CrossRef] [PubMed]
- Pernat, N.; Kampen, H.; Jeschke, J.M.; Werner, D. Buzzing homes: Using citizen science data to explore the effects of urbanization on indoor mosquito communities. Insects 2021, 12, 374. [Google Scholar] [CrossRef]
- Caputo, B.; Manica, M.; Filipponi, F.; Blangiardo, M.; Cobre, P.; Delucchi, L.; De Marco, C.M.; Iesu, L.; Morano, P.; Petrella, V.; et al. ZanzaMapp: A scalable citizen science tool to monitor perception of mosquito abundance and nuisance in Italy and beyond. Int. J. Environ. Res. Public Health 2020, 17, 7872. [Google Scholar] [CrossRef]
- Mwangungulu, S.P.; Sumaye, R.D.; Limwagu, A.J.; Siria, D.J.; Kaindoa, E.W.; Okumu, F.O. Crowdsourcing vector surveillance: Using community knowledge and experiences to predict densities and distribution of outdoor-biting mosquitoes in rural Tanzania. PLoS ONE 2016, 11, e0156388. [Google Scholar] [CrossRef] [PubMed] [Green Version]
- Jordan, R.C.; Sorensen, A.E.; Ladeau, S. Citizen science as a tool for mosquito control. J. Am. Mosq. Control. Assoc. 2017, 33, 241–245. [Google Scholar] [CrossRef] [PubMed]
- Tarter, K.D.; Levy, C.E.; Yaglom, H.D.; Adams, L.E.; Plante, L.; Casal, M.G.; Gouge, D.H.; Rathman, R.; Stokka, D.; Weiss, J.; et al. Using citizen science to enhance surveillance of Aedes aegypti in Arizona, 2015-17. J. Am. Mosq. Control Assoc. 2019, 35, 11–18. [Google Scholar] [CrossRef] [PubMed] [Green Version]
- Maki, E.C.; Cohnstaedt, L.W. Crowdsourcing for large-scale mosquito (Diptera: Culicidae) sampling. Can. Entomol. 2015, 147, 118–123. [Google Scholar] [CrossRef] [Green Version]
- Schmidt, C.; Phippard, A.; Olsen, J.M.; Wirt, K.; Rivera, A.; Crawley, A.; Waterman, S.; Ernst, K. Kidenga: Public engagement for detection and prevention of Aedes-borne viral diseases. Online J. Public Health Inform. 2017, 9, e111. [Google Scholar] [CrossRef] [Green Version]
- Johnston, A.; Matechou, E.; Dennis, E.B. Outstanding challenges and future directions for biodiversity monitoring using citizen science data. Methods Ecol. Evol. 2022. [Google Scholar] [CrossRef]
- Reeves, L.E.; Medina, J.; Miqueli, E.; Sloyer, K.E.; Petrie, W.; Vasquez, C.; Burkett-Cadena, N.D. Establishment of Aedes (Ochlerotatus) scapularis (Diptera: Culicidae) in mainland Florida, with notes on the Ochlerotatus group in the United States. J. Med. Entomol. 2021, 58, 717–729. [Google Scholar] [CrossRef]
- Pagac, B.B.; Spring, A.R.; Stawicki, J.R.; Dinh, T.L.; Lura, T.; Kavanaugh, M.D.; Pecor, D.B.; Justi, S.A.; Linton, Y.M. Incursion and establishment of the Old World arbovirus vector Aedes (Fredwardsius) vittatus (Bigot, 1861) in the Americas. Acta Trop. 2021, 213, 105739. [Google Scholar] [CrossRef]
- Sudeep, A.B.; Shil, P. Aedes vittatus (Bigot) mosquito: An emerging threat to public health. J. Vector Borne Dis. 2017, 54, 295. [Google Scholar] [CrossRef]
- Pataki, B.A.; Garriga, J.; Eritja, R.; Palmer, J.R.; Bartumeus, F.; Csabai, I. Deep learning identification for citizen science surveillance of tiger mosquitoes. Sci. Rep. 2021, 11, 4718. [Google Scholar] [CrossRef] [PubMed]
- Minakshi, M.; Bharti, P.; McClinton, W.B., III; Mirzakhalov, J.; Carney, R.M.; Chellappan, S. Automating the surveillance of mosquito vectors from trapped specimens using computer vision techniques. In Proceedings of the 3rd ACM SIGCAS Conference on Computing and Sustainable Societies, Guayaquil, Ecuador, 15–17 June 2020; pp. 105–115. [Google Scholar]
- Minakshi, M.; Bharti, P.; Bhuiyan, T.; Kariev, S.; Chellappan, S. A framework based on deep neural networks to extract anatomy of mosquitoes from images. Sci. Rep. 2020, 10, 13059. [Google Scholar] [CrossRef] [PubMed]
- Eritja, R.; Delacour-Estrella, S.; Ruiz-Arrondo, I.; González, M.A.; Barceló, C.; García-Pérez, A.L.; Lucientes, J.; Miranda, M.Á.; Bartumeus, F. At the tip of an iceberg: Citizen science and active surveillance collaborating to broaden the known distribution of Aedes japonicus in Spain. Parasites Vectors 2021, 14, 375. [Google Scholar] [CrossRef] [PubMed]
- Eritja, R.; Ruiz-Arrondo, I.; Delacour-Estrella, S.; Schaffner, F.; Álvarez-Chachero, J.; Bengoa, M.; Puig, M.Á.; Melero-Alcíbar, R.; Oltra, A.; Bartumeus, F. First detection of Aedes japonicus in Spain: An unexpected finding triggered by citizen science. Parasites Vectors 2019, 12, 53. [Google Scholar] [CrossRef] [PubMed]
- Eritja, R.; Rubido-Bará, M.; Delacour-Estrella, S.; Bengoa, M.; Ruiz-Arrondo, I.; Alert, C.M. Ciencia ciudadana y biodiversidad: Primera cita de Aedes (Fredwardsius) vittatus (Bigot, 1861) (Diptera: Culicidae) en Galicia, mediante el proyecto Mosquito Alert. In Anales de Biología; No. 40; Servicio de Publicaciones de la Universidad de Murcia: Murcia, Spain, 2018; pp. 41–45. [Google Scholar]
- Amos, H.M.; Starke, M.J.; Rogerson, T.M.; Colón Robles, M.; Andersen, T.; Boger, R.; Campbell, B.A.; Low, R.D.; Nelson, P.; Overoye, D. GLOBE Observer data: 2016–2019. Earth Space Sci. 2020, 7, e2020EA001175. [Google Scholar] [CrossRef] [PubMed]
- Low, R.D.; Schwerin, T.A.; Boger, R.; Soeffing, C.; Nelson, P.V.; Bartlett, D.; Kimura, M.; Ingle, P.; Clark, A. Building international capacity for citizen scientist engagement in mosquito surveillance and mitigation: The GLOBE Program’s GLOBE Observer Mosquito Habitat Mapper. Insects 2022, 13, 624. [Google Scholar] [CrossRef]
- Gu, W.; Regens, J.L.; Beier, J.C.; Novak, R.J. Source reduction of mosquito larval habitats has unexpected consequences on malaria transmission. Proc. Natl. Acad. Sci. USA 2006, 103, 17560–17563. [Google Scholar] [CrossRef] [PubMed] [Green Version]
- Forsyth, J.E.; Mutuku, F.M.; Kibe, L.; Mwashee, L.; Bongo, J.; Egemba, C.; Ardoin, N.M.; LaBeaud, A.D. Source reduction with a purpose: Mosquito ecology and community perspectives offer insights for improving household mosquito management in coastal Kenya. PLoS Negl. Trop. Dis. 2020, 14, e0008239. [Google Scholar] [CrossRef] [PubMed]
- Pan American Health Organization (PAHO). Caribbean Mosquito Awareness Week. 2020. Available online: paho.org/en/campaigns/caribbean-mosquito-awareness-week-2020 (accessed on 28 October 2021).
- The GLOBE Program (n.d.) MUC Field Guide: A Key to Land Cover Classification. Available online: globe.gov/documents/355050/355097/MUC+Field+Guide/5a2ab7cc-2fdc-41dc-b7a3-59e3b110e25f (accessed on 28 March 2022).
- Atha, D.; Boom, B.; Thornbrough, A.; Kurtz, J.; Mcintyre, L.; Hagen, M.; Schuler, J.A.; Rohleder, L.; Hewitt, S.J.; Kelly, J. Arum italicum (Araceae) is invasive in New York. Phytoneuron 2017, 31, 1–18. [Google Scholar]
- Davis, A.K.; Frick, B.L. Physiological evaluation of newly invasive jorō spiders (Trichonephila clavata) in the southeastern USA compared to their naturalized cousin, Trichonephila clavipes. Physiol. Entomol. 2022. [Google Scholar] [CrossRef]
- Werenkraut, V.; Baudino, F.; Roy, H.E. Citizen science reveals the distribution of the invasive harlequin ladybird (Harmonia axyridis Pallas) in Argentina. Biol. Invasions 2020, 22, 2915–2921. [Google Scholar] [CrossRef]
- iNaturalist Contributors, iNaturalist. Culicidae iNaturalist Research-Grade Observations. iNaturalist.org. Occurrence Dataset. 2022. Available online: https://doi.org/10.15468/dl.py22jh (accessed on 30 June 2022).
- Leary, P. New Computer Vision Model. iNaturalist Blog. 2021. Available online: inaturalist.org/blog/54236-new-computer-vision-model (accessed on 31 March 2022).
- Spiesman, B.J.; Gratton, C.; Hatfield, R.G.; Hsu, W.H.; Jepsen, S.; McCornack, B.; Patel, K.; Wang, G. Assessing the potential for deep learning and computer vision to identify bumble bee species from images. Sci. Rep. 2021, 11, 7580. [Google Scholar] [CrossRef] [PubMed]
- Bhuiyan, T.; Carney, R.M.; Chellappan, S. Artificial intelligence versus natural selection: Using computer vision techniques to classify bees and bee mimics. iScience 2022, in press. [Google Scholar] [CrossRef]
- Díez-Fernández, A.; la Puente, J.M.; Ruiz, S.; Gutiérrez-López, R.; Soriguer, R.; Figuerola, J. Aedes vittatus in Spain: Current distribution, barcoding characterization and potential role as a vector of human diseases. Parasites Vectors 2018, 11, 297. [Google Scholar] [CrossRef] [Green Version]
- Higgins, C.I.; Williams, J.; Leibovici, D.G.; Simonis, I.; Davis, M.J.; Muldoon, C.; van Genuchten, P.; O’Hare, G.; Wiemann, S. Citizen OBservatory WEB (COBWEB): A generic infrastructure platform to facilitate the collection of citizen science data for environmental monitoring. Int. J. Spat. Data Infrastruct. Res. 2016, 11, 20–48. [Google Scholar]
- Liang, S.; Huang, C.Y.; Khalafbeigi, T. OGC SensorThings API Part 1: Sensing, Version 1.0; Open Geospatial Consortium: Wayland, MA, USA, 2016. [Google Scholar]
- He, K.; Zhang, X.; Ren, S.; Sun, J. Deep residual learning for image recognition. In Proceedings of the IEEE Conference on Computer Vision and Pattern Recognition 2016, Las Vegas, NV, USA, 27–30 June 2016; pp. 770–778. [Google Scholar]
- Kingma, D.P.; Ba, J. Adam: A method for stochastic optimization. arXiv 2014, arXiv:1412.6980. [Google Scholar]
- Zhou, B.; Khosla, A.; Lapedriza, A.; Oliva, A.; Torralba, A. Learning deep features for discriminative localization. In Proceedings of the IEEE Conference on Computer Vision and Pattern Recognition, Las Vegas, NV, USA, 27–30 June 2016; pp. 2921–2929. [Google Scholar]
- He, K.; Gkioxari, G.; Dollár, P.; Girshick, R. Mask R-CNN. In Proceedings of the IEEE International Conference on Computer Vision 2017, Venice, Italy, 22–29 October 2017; pp. 2961–2969. [Google Scholar]
- Stevenson, R.; Suomela, T.; Kim, H.; He, Y. Seven primary data types in citizen science determine data quality requirements and methods. Front. Clim. 2021, 3, 645120. [Google Scholar] [CrossRef]
- Shirk, J.L.; Ballard, H.L.; Wilderman, C.C.; Phillips, T.; Wiggins, A.; Jordan, R.; McCallie, E.; Minarchek, M.; Lewenstein, B.V.; Krasny, M.E.; et al. Public participation in scientific research: A framework for deliberate design. Ecol. Soc. 2012, 17, 29. [Google Scholar] [CrossRef] [Green Version]
- Bowser, A.; Cooper, C.; de Sherbinin, A.; Wiggins, A.; Brenton, P.; Chuang, T.-R.; Faustman, E.; Haklay, M.; Meloche, M. Still in need of norms: The state of the data in citizen science. Citiz. Sci. Theory Pract. 2020, 5, 1–16. [Google Scholar] [CrossRef]
- Williams, J.; Chapman, C.; Leibovici, D.; Lois, G.; Matheus, A.; Oggioni, A.; Schade, S.; See, L.; van Genuchten, P. Maximizing the impact and reuse of citizen science data. In Citizen Science: Innovation in Open Science, Society, and Policy; Hecker, S., Haklay, M., Bowser, A., Makuch, Z., Vogel, J., Bonn, A., Eds.; UCL Press: London, UK, 2018. [Google Scholar] [CrossRef]
- Bowser, A.; Long, W.; Meloche, M.; Newbury, E.; King, M. Filling Data Gaps: A Citizen Science Solution; Woodrow Wilson International Centre for Scholars: Washington, DC, USA, 2020. [Google Scholar]
- Wilkinson, M.D.; Dumontier, M.; Aalbersberg, I.J.; Appleton, G.; Axton, M.; Baak, A.; Blomberg, N.; Boiten, J.W.; da Silva Santos, L.B.; Bourne, P.E.; et al. The FAIR Guiding Principles for scientific data management and stewardship. Sci Data 2016, 3, 160018. [Google Scholar] [CrossRef] [Green Version]
- Lorenz, C.; Chiaravalloti-Neto, F.; de Oliveira Lage, M.; Quintanilha, J.A.; Parra, M.C.; Dibo, M.R.; Favaro, E.A.; Guirado, M.M.; Nogueira, M.L. Remote sensing for risk mapping or Aedes aegypti infestations: Is this a practical task? Acta Trop. 2020, 205, 105398. [Google Scholar] [CrossRef] [PubMed]
- Low, R.D.; Nelson, P.V.; Soeffing, C.; Clark, A.; SEES 2020 Mosquito Mappers Summer Research Interns. Adopt a Pixel 3 km: A multiscale data set linking remotely sensed land cover imagery with field based citizen science observations. Front. Clim. 2021, 3, 658063. [Google Scholar] [CrossRef]
- Sallam, M.; Fizer, C.; Pilant, A.; Whung, P. Systematic review: Land cover, meteorological and socioeconomic determinants of Aedes mosquito habitat for risk mapping. Int. J. Environ. Res. Public Health 2017, 14, 1230. [Google Scholar] [CrossRef] [PubMed] [Green Version]
- Sinka, M.E.; Pironon, S.; Massey, N.C.; Longbottom, J.; Hemingway, J.; Moyes, C.L.; Willis, K.J. A new malaria vector in Africa: Predicting the expansion range of Anopheles stephensi and identifying the urban populations at risk. Proc. Natl. Acad. Sci. USA 2020, 117, 24900–24908. [Google Scholar] [CrossRef] [PubMed]
- Fischer, H.; Cho, H.; Storksdieck, M. Going beyond hooked participants: The nibble-and-drop framework for classifying citizen science participation. Citiz. Sci. Theory Pract. 2021, 6, 10. [Google Scholar] [CrossRef]
- iNaturalist (Updated 5 January 2022). Bioblitz Guide. Available online: inaturalist.org/pages/bioblitz+guide (accessed on 4 May 2022).
- Ueda, K. Year in Review 2020. iNaturalist Blog. 2020. Available online: inaturalist.org/blog/44876-year-in-review-2020 (accessed on 31 March 2022).

Publisher’s Note: MDPI stays neutral with regard to jurisdictional claims in published maps and institutional affiliations. |
© 2022 by the authors. Licensee MDPI, Basel, Switzerland. This article is an open access article distributed under the terms and conditions of the Creative Commons Attribution (CC BY) license (https://creativecommons.org/licenses/by/4.0/).
Share and Cite
Carney, R.M.; Mapes, C.; Low, R.D.; Long, A.; Bowser, A.; Durieux, D.; Rivera, K.; Dekramanjian, B.; Bartumeus, F.; Guerrero, D.; et al. Integrating Global Citizen Science Platforms to Enable Next-Generation Surveillance of Invasive and Vector Mosquitoes. Insects 2022, 13, 675. https://doi.org/10.3390/insects13080675
Carney RM, Mapes C, Low RD, Long A, Bowser A, Durieux D, Rivera K, Dekramanjian B, Bartumeus F, Guerrero D, et al. Integrating Global Citizen Science Platforms to Enable Next-Generation Surveillance of Invasive and Vector Mosquitoes. Insects. 2022; 13(8):675. https://doi.org/10.3390/insects13080675
Chicago/Turabian StyleCarney, Ryan M., Connor Mapes, Russanne D. Low, Alex Long, Anne Bowser, David Durieux, Karlene Rivera, Berj Dekramanjian, Frederic Bartumeus, Daniel Guerrero, and et al. 2022. "Integrating Global Citizen Science Platforms to Enable Next-Generation Surveillance of Invasive and Vector Mosquitoes" Insects 13, no. 8: 675. https://doi.org/10.3390/insects13080675