

Meta-Analysis of Transcriptomes in Insects Showing Density-Dependent Polyphenism


1
Laboratory of BioDX, PtBio Co-Creation Research Center, Genome Editing Innovation Center, Hiroshima University, 3-10-23 Kagamiyama, Higashi-Hiroshima City 739-0046, Japan
2
Laboratory of Genome Informatics, Graduate School of Integrated Sciences for Life, Hiroshima University, 3-10-23 Kagamiyama, Higashi-Hiroshima City 739-0046, Japan
3
Insect Design Technology Module, Division of Insect Advanced Technology, Institute of Agrobiological Sciences, National Agriculture and Food Research Organization (NARO), 1-2 Owashi, Tsukuba 305-8634, Japan
*
Author to whom correspondence should be addressed.
Insects 2022, 13(10), 864; https://doi.org/10.3390/insects13100864
Submission received: 7 July 2022
/
Revised: 10 August 2022
/
Accepted: 22 September 2022
/
Published: 23 September 2022
(This article belongs to the Special Issue Insect Genome and Transcriptome Data)
Abstract
:Simple Summary
Population density can be an environmental cue to induce modification of insect morphology, physiology, and behavior. This phenomenon is called density-dependent plasticity. Aphids and locusts exhibit textbook examples of density-dependent plasticity but there is a lack of integrative understanding for insect density-dependent plasticity. To address this problem, we combined public gene expression data obtained from multiple studies and re-analyzed them (this process is called meta-analysis). The present study provides additional insight into the regulatory mechanisms of density-dependent plasticity, demonstrating the effectiveness of meta-analyses of public transcriptomes.
Abstract
With increasing public data, a statistical analysis approach called meta-analysis, which combines transcriptome results obtained from multiple studies, has succeeded in providing novel insights into targeted biological processes. Locusts and aphids are representative of insect groups that exhibit density-dependent plasticity. Although the physiological mechanisms underlying density-dependent polyphenism have been identified in aphids and locusts, the underlying molecular mechanisms remain largely unknown. In this study, we performed a meta-analysis of public transcriptomes to gain additional insights into the molecular underpinning of density-dependent plasticity. We collected RNA sequencing data of aphids and locusts from public databases and detected differentially expressed genes (DEGs) between crowded and isolated conditions. Gene set enrichment analysis was performed to reveal the characteristics of the DEGs. DNA replication (GO:0006260), DNA metabolic processes (GO:0006259), and mitotic cell cycle (GO:0000278) were enriched in response to crowded conditions. To date, these processes have scarcely been the focus of research. The importance of the oxidative stress response and neurological system modifications under isolated conditions has been highlighted. These biological processes, clarified by meta-analysis, are thought to play key roles in the regulation of density-dependent plasticity.
1. Introduction
Phenotypic plasticity is the ability to respond adaptively to environmental variations by producing more than one phenotype for a single genotype [1,2]. If two or more distinct phenotypes are produced, this is called polyphenism [3]. Various environmental conditions can be cues to induce plastic phenotype changes, with population density being one of those [3,4,5,6]. Locusts and aphids are representative insect groups for which density-dependent plasticity is considered to have contributed to their evolutionary success [7,8]. Aphids exhibit wing polyphenotypes and locusts exhibit polyphenisms in body color and behavior (e.g., gregarious and flight ability).
Physiological mechanisms underlying density-dependent polyphenism have been revealed in aphids [7] and locusts [9]. Furthermore, a recent transcriptome analysis revealed gene expression profiles in response to different density conditions. RNA sequencing (RNA-seq) revealed that a laterally transferred viral gene is responsible for switching wing polyphonic phenotypes [10]. In locusts, expressed sequence tag (EST), microarray, and RNA-seq revealed differentially expressed genes (DEGs), including juvenile hormone (JH)-binding protein [11], heat-shock proteins [12], oxidative stress response genes [12], neurotransmitter-related genes [13], catecholamine metabolic pathway genes [14], and the microtubule cytoskeleton [15]. However, the common molecules involved in all locust species exhibiting density-dependent polyphenism remain largely unknown. As mentioned above, RNA sequencing has revealed the species-specific regulatory mechanisms in each species, and the common genes involved in the regulation of density-dependent polyphenism are predicted to be present. However, an inclusive analysis of aphids and locusts was not performed to determine the common genes expressed in all or multiple species that show density-dependent polyphenism.
Meta-analysis that combines the transcriptome results from multiple studies is thought to be effective in providing additional insights into density-dependent polyphenisms because a meta-analysis can uncover new information that cannot be achieved with conventional hypothesis-driven research methods. Meta-analysis of transcriptomes is effective in revealing novel gene expression profiles [16,17,18,19,20]. As mentioned above, the amount of transcriptome data related to density-dependent polyphenism is sufficient to execute the meta-analysis. In the present study, we conducted a meta-analysis of public transcriptomes using RNA-seq data obtained from five Schistocerca species, the pea aphid Acyrthosiphon pisum, and the migratory locust Locusta migratoria. We identified DEGs between crowded and isolated conditions and performed gene set enrichment analysis to understand the characteristics of the DEGs.
2. Materials and Methods
2.1. Curation of Public Gene Expression Data
Expression data were searched for in the public databases Gene Expression Omnibus (GEO) [21] and DBCLS SRA (https://sra.dbcls.jp/ (accessed on 16 April 2021)), and RNA-seq data archived in the Sequence Read Archive (SRA) [22] using the keywords including crowding, density, polyphenism, and gregarious. The datasets examined in this study were selected based on the following criteria: RNA-seq data obtained from crowded or isolated insect species showing density-dependent polyphenism.
2.2. RNA-Seq Data Retrieval, Processing, and Quantification
SRA retrieval and conversion to FASTQ files was performed using the prefetch and fasterq-dump programs in the SRA Toolkit (v2.9.6) [23], respectively. To decrease disk space usage, the obtained FASTQ files were immediately compressed using pigz (v. 2.4). For the trimming and quality control, Trim Galore! (v.0.6.6) [24] and Cutadapt (v.3.4) [25] software was used. Trim Galore! [24] was run with the parameters -fastqc --trim1 -paired (if data were paired-end). Trim Galore! [24] includes Cutadapt (v.3.4) [25] to trim low-quality base calls. Since all data were passed through this quality check, low-quality data were not included in this study.
2.3. Quantification of Gene Expression Level
In species whose genomic information is available (the pea aphid Acyrthosiphon pisum and the migratory locust Locusta migratoria), RNA-seq reads were mapped to reference genome sequences using HISAT2 (v.2.2.1) [26] with parameters -q --dta -x (Acyrthosiphon pisum: GCF_005508785.1 or L. migratoria: GCA_000516895.1). Quantification of the mapped data was performed using StringTie (2.1.5) [27], and the values of transcripts per million (TPM) were used as quantitative values of gene expression.
In species with genomic information not available (all species of grasshopper Schistocerca), TPM values were calculated using Salmon (v.1.5.0) [28] with parameters -i index -l IU. Transcriptome assemblies required for Salmon were retrieved from the Transcriptome Shotgun Assembly (TSA) database (Table S1). If there were no available assemblies in TSA, de novo transcriptome assembly was performed using Trinity (v2.13.1) program with Docker environment utilizing scripts in the Systematic Analysis for Quantification of Everything (SAQE) repository [16]. Trinity was performed with the default parameters.
2.4. The Detection of Differentially Expressed Genes
To evaluate the changes in expression of each gene, the expression ratio was calculated using TPM paired with crowded and isolated transcriptomes (CI ratio). The CI ratio for each gene was calculated using Equation (1):
This calculation was performed for all pairs of crowded and isolated transcriptomes. Pairs of transcriptome data used for comparison are shown in Table S2. The value “0.01” was added to the TPM for each gene to convert zero into a logarithm. Crowded and isolated ratios (CI-ratio) were classified as “upregulated”, “downregulated”, or “unchanged” according to the thresholds. Genes with a CI ratio greater than 1 (2-fold expression change) were treated as “upregulated”. Genes whose CI ratio was under –1 (0.5-fold expression changes) were treated as “downregulated”. Others were treated as “unchanged”. To reveal the DEGs between the crowded and isolated conditions, the crowded and isolated scores (CI score) of each gene were calculated by subtracting the number of sample pairs with “downregulated” from those of “upregulated”, as shown in Equation (2):
The calculation method for CI ratios and CI scores was based on a previous study [17] (https://github.com/no85j/hypoxia_code/blob/master/CodingGene/HN-score.ipynb (accessed on 17 March 2022)). Visualization of CI ratio was performed with heatmap2 (R ver 4.2.0).
2.5. Gene Annotation and Gene Set Enrichment Analysis
In species whose genomic information is available, GFFread (v0.12.1) [29] was used with the reference genome (Acyrthosiphon pisum: GCF_005508785.1 and L. migratoria: GCA_000516895.1) to extract the transcript sequence from the genome data. In species whose genomic information is not available (all species of the Schistocerca genus), transcript sequences were collected from the TSA database (Table S1). However, transcript sequences of Schistocerca gregaria were obtained by de novo assembly using Trinity, as described above (2.3. Quantification of gene expression level). TransDecoder (v5.5.0) (https://transdecoder.github.io/ accessed on 22 June 2021) was used to identify coding regions and translate them into amino acid sequences of all species. Open reading frames were extracted by TransDecoder.Longorfs with parameters -m 100, and coding regions were predicted by TransDecoder.Predict with default parameters. Then, the protein BLAST (BLASTP) program with parameters -evalue 0.1 -outfmt 6 -max_target_seqs 1 in the NCBI BLAST software package (v2.6.0) was used to determine the orthologous gene relationship among species. Ensembl Biomart was used to obtain stable protein IDs and gene names from D. melanogaster gene set (BDGP6.32).
Gene set enrichment analysis was performed by Metascape [30] using the DEGs obtained in Section 2.4.
3. Results
3.1. Data Collection of Transcriptomes in Density-Dependent Polyphenism
To compare gene expression under crowded and isolated conditions, we retrieved transcriptome data acquired under different density conditions. Consequently, 66 pairs of transcriptome data were collected from the public databases (Table 1). Full information about the dataset used in this study is provided in Table S2 [10,31,32,33,34,35]. These data comprised transcriptomes from seven insect species, including aphids and locusts. The tissues used to obtain these transcriptomes are shown in Table 1.
3.2. Gene Set Enrichment Analysis
After the expression ratio (CI ratio) was calculated for each species, as described in the Materials and Methods Section 2.4, we integrated the CI ratio table and obtained the CI ratio values of 2652 genes (Table S3). During this process, orthologous relationships among species were required to be determined using BLAST, because the gene names of the expression ratio are species specific depending on the annotation file or transcriptome assemblies of each species. First, we performed a BLASTP search using all genes in S. gregaria as queries against those in each species examined in this study. Since density-dependent polyphenisms have been extensively studied using this species, this species was selected as a reference for the determination of orthologous relationships among species. Next, we performed searches for all genes vs. all BLASTP between D. melanogaster and S. gregaria to annotate the gene names of each species into those of D. melanogaster.
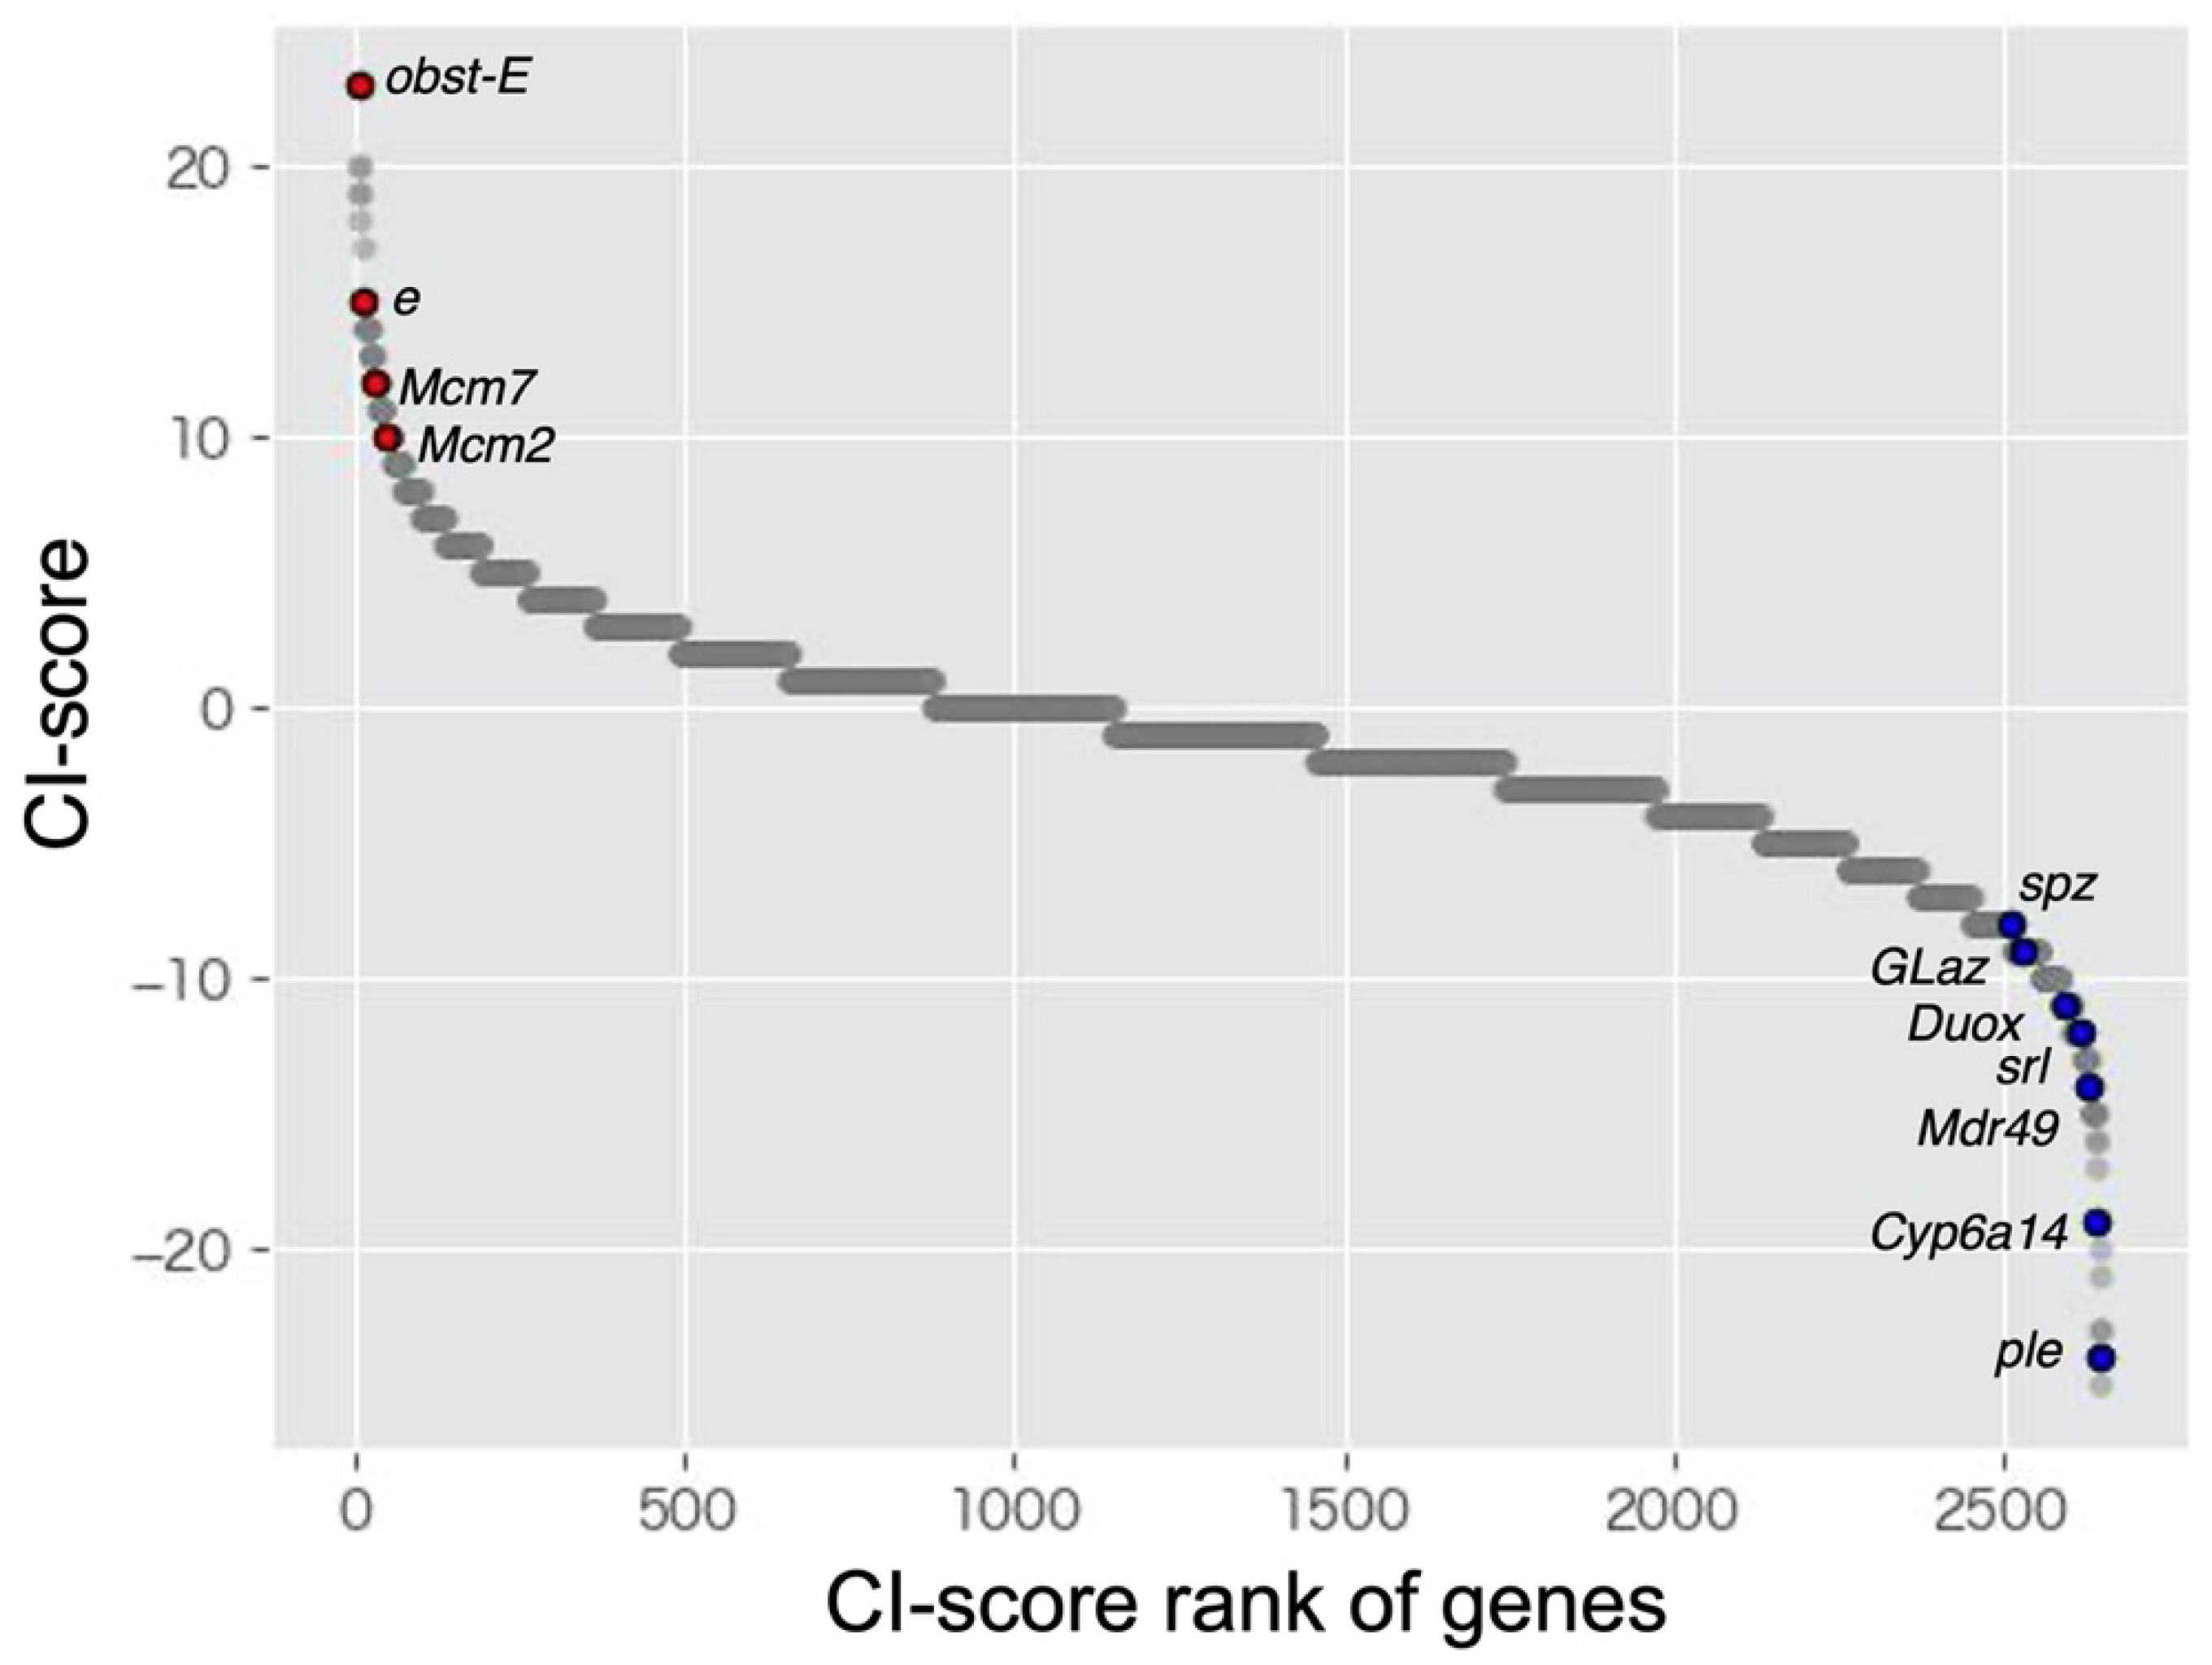
CI scores were calculated based on the CI ratio table (Table S4). The previous studies showed that ebony, Mcm2, and Mcm7 were upregulated in response to crowded condition, and Duox, Mdr49 and Cyp6a14 were downregulated in response to crowded condition (i.e., upregulated in response to isolated condition) [14,33,34]. In this study, the CI score of these genes showed high or low values (Figure 1). This means that the expression patterns of these genes were consistent with previous results. Previous transcriptome analyses also showed that GO:0008061 [cuticle binding] and GO:0006979 [oxidative stress] were enriched in crowded and isolated condition, respectively [14,33,34]. CI score of genes that was included in these GO terms (GO:0008061; obst-E, GO:0006979; spz, Glaz, srl) showed high or low values (Figure 1). These results show the suitability of the CI score method to detect the DEGs. We listed the top 1% of genes with the highest and lowest CI scores (Table 2 and Table 3, respectively). ebony (e) showed a high CI score for the upregulated DEGs (tenth rank in Table 2). This gene, encoding a protein that converts dopamine to N-β-alanyl dopamine, is highly expressed in gregarious L. gregaria, leading to the production of the yellow color [14]. In the top 1% of genes with the highest and lowest CI scores, we assessed the expression pattern in each species and/or tissue (Tables S5 and S6). Many genes with unchanged expression levels were observed in A. pisum and L. migratoria. Although this tendency was also observed in the heatmap of expression ratio (Figure S1), the genes that showed a drastic expression change were observed in L. migratoria samples (SmD3 and CG34461).
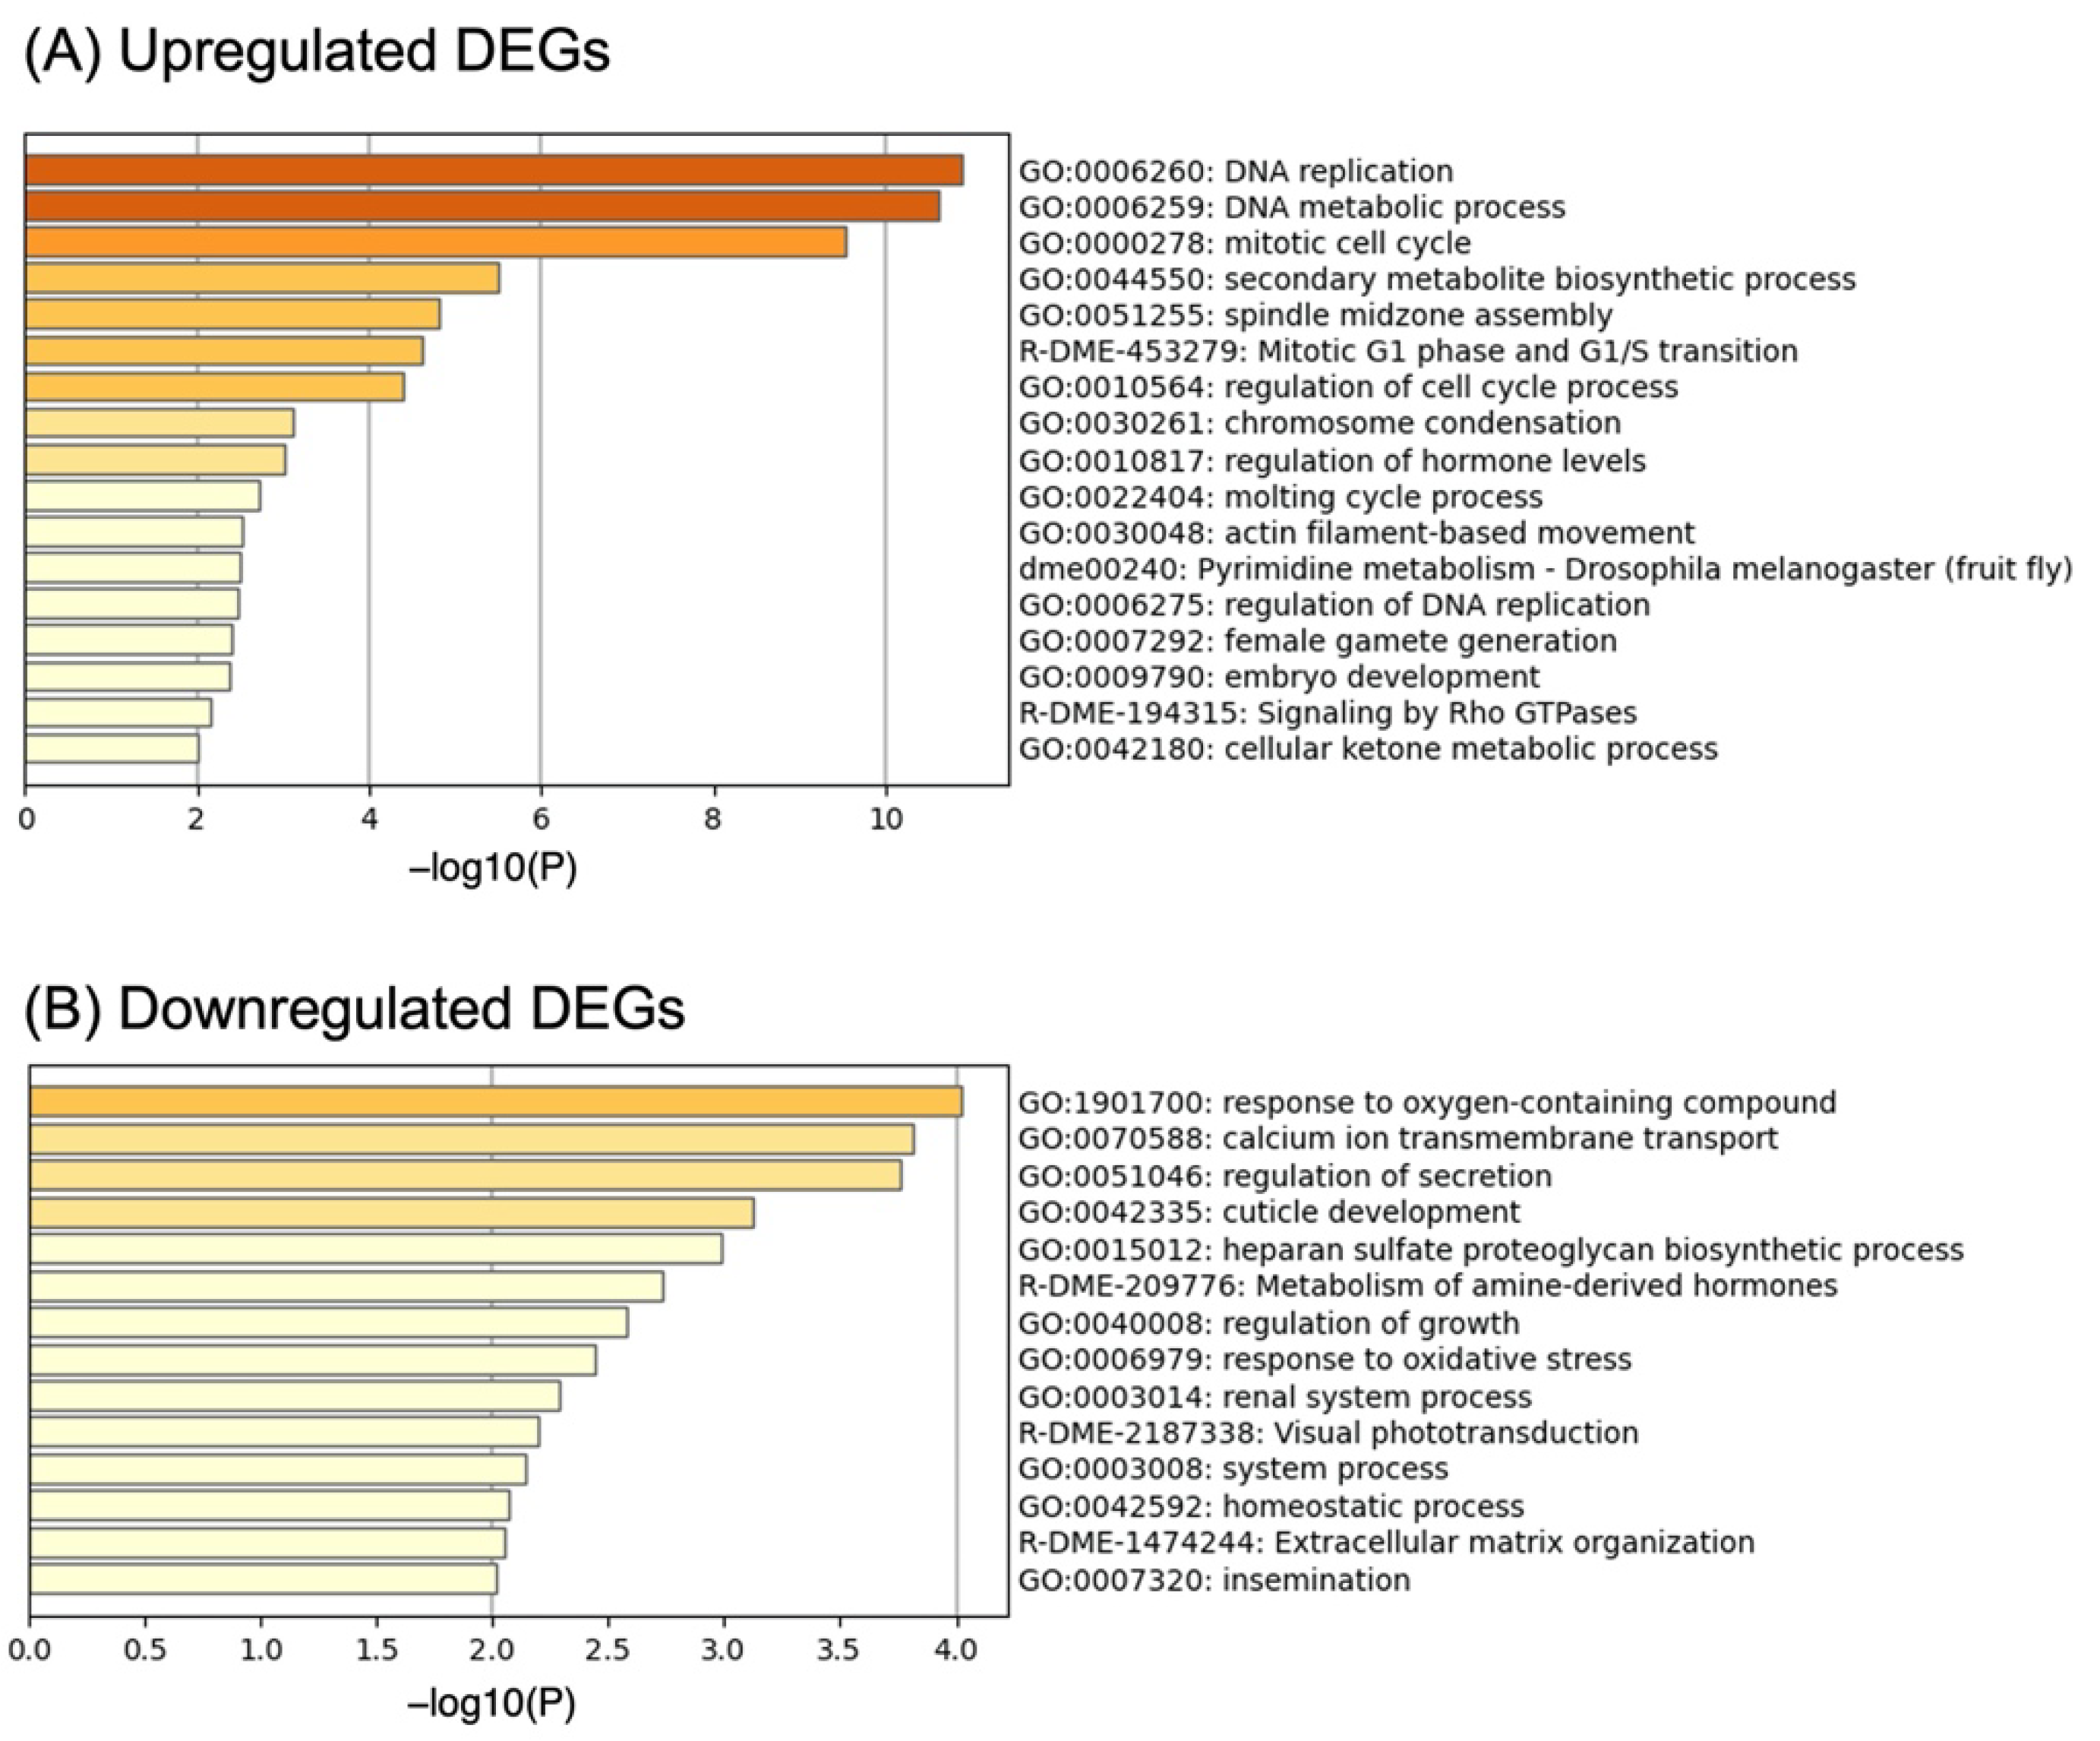
We selected 97 upregulated genes and 199 downregulated genes as DEGs (CI score thresholds:8 and −8). Using these DEGs, we performed gene set enrichment analysis using Metascape to identify their characteristics. Metascape showed that “DNA replication” (GO:0006260; CG14803, CG2990, Psf3, CG8142, RnrL, Psf1, Pol31, Mcm7, Mcm2, E2f1, DNApol-alpha60, dup), “DNA metabolic process” (GO:0006259; CG14803, CG2990, Psf3, CG8142, RnrL, FANCI, pds5, Psf1, Pol31, Gen, Mcm7, Mcm2, pch2, Fancl, CG5285, E2f1, DNApol-alpha60, dup), and “mitotic cell cycle” (GO:0000278; Psf3, sofe, borr, Incenp, pds5, SmD3, tum, Klp61F, Psf1, Pol31, eco, polo, Mcm2, E2f1, jar, Cap-D2, DNApol-alpha60, dup, Zwilch) were enriched significantly in upregulated DEGs (Figure 2A). In addition, we searched for genes that were likely to be associated with density-dependent polyphenism (Table 2). JHEH encodes for juvenile hormone epoxide hydrolase involved in JH inactivation, as reported by Iga and Kataoka 2012 [36]. JH plays a central role in the regulation of polyphenism.
The response to oxygen-containing compounds (GO:1901700; G9a, hfw, Shmt, Clic, Duox, FASN1, Kr-h1, GLaz, ple, Rab8, srl, Syn, CASK, spz, and dco) was significantly enriched in the downregulated DEGs (Figure 2B). Multiple genes involved in the response to oxidative stress (GO:0006979: Duox, GLaz, ple, srl, and spz) were included in GO: 1,901,700.
The CI score of the pale (ple) gene, encoding tyrosine hydroxylase, which is involved in pigmentation of the cuticle and catecholamine biosynthesis [37], was the second lowest (Table 3). This indicates that the expression of ple was higher in many isolated transcriptomes than in crowded transcriptomes. ple genes are known to be highly expressed under crowded conditions, inducing gregarious color and behavior [14].
4. Discussion
As various data acquired under different conditions are registered, manual curations are needed for meta-analysis. In this study, we collected RNA sequencing data (66 pairs) from public databases and compared their expression levels in various insect species. We aimed to identify the common genes that can explain the regulation of the density-dependent polyphenism of all or multiple species. However, in the gene list with highest or lowest CI score (Table 2, Table 3, Tables S5 and S6), almost all genes showed no expression changes in A. pisum. This result may reflect the use of different developmental stages. The aphids used in this study are derived from adults, whereas the other samples are derived from larval stages. However, we believe that our meta-analysis of public RNA sequencing using this vast amount of data has led to important insights into the gene expression profile underlying density-dependent polyphenism, as discussed below.
Gene set enrichment analysis showed that DNA replication, DNA metabolic processes, and the mitotic cell cycle were enriched in response to crowded conditions (Figure 1). DNA replication and cell cycle have rarely been focused on as regulatory mechanisms of density-dependent polyphenism [33]. A recent study [42] showed that the regulation of DNA replication and the cell cycle is involved in the density-dependent wing polyphenism of the planthopper Nilaparvata lugenes. Together with this study, our results emphasize the importance of DNA replication and the cell cycle as the regulatory mechanisms of density-dependent polyphenism. Although wing polyphenism was also observed in A. pisum, it was not observed in locusts. Therefore, the regulation of DNA replication and cell cycle is expected to be involved in other developmental processes in locusts. Although the role of JH in aphid wing polyphenism is controversial, JH content is lower under crowded conditions than under isolated conditions in locusts [9,43]. Therefore, Jheh2 expression in response to crowded conditions may play an important role in JH degradation.
The high expression of ple gene under isolated conditions was not consistent with a previous study. Although ple genes are known to be responsible for gregarious pigmentation in L. migratoria, the relationship between ple genes and body-color polyphenism is controversial [44]. Several downregulated DEGs (Duox, GLaz, ple, srl, and spz) classified under response to oxygen-containing compounds were related to the response to oxidative stress, and ple was included in that category. A previous microarray study showed that the expression of transcripts encoding proteins against oxidative stress damage (peroxiredoxin, 5-oxoprolinase, microsomal glutathione-S-transferase, and transaldolase) was higher in isolated locusts than in crowded locusts [12]. Rapid accumulation of oxidative stress inhibits flight sustainability in solitary L. migratoria, leading to variations in flight traits between solitary and gregarious locusts [45]. Therefore, the high ple expression under the isolated conditions in this study may result from the response to oxidative stress.
Neurological system modifications may play an important role in inducing density-dependent phenotypic changes in S. gregaria [12] and L. migratoria [15]. We found that the expression of several genes functioning in the nervous system was increased under isolated conditions (CG9657 [38], Lrp4 [39], GluClalpha [40], and Syt4 [41]). CG9657 is an SLC5A transporter expressed in glial cells and is involved in sleep behavior in D. melanogaster [38]. Presynaptic Lrp4 functions to ensure normal synapse numbers in D. melanogaster [39]. GluClalpha plays an important role in the ON/OFF selectivity of the visual systems in D. melanogaster [40]. Syts are Ca2+-binding proteins involved in the presynaptic transmitter release [41]. These genes are also related to density-dependent behavioral changes.
5. Conclusions
We identified novel genes related to density-dependent polyphenism in insects using a meta-analysis of public transcriptomes. Reliable and general principles should be derived from meta-analysis because this method integrates the results of a number of studies. Therefore, our results can be applied to other species that exhibit density-dependent polyphenisms.
Supplementary Materials
The following supporting information can be downloaded at https://www.mdpi.com/article/10.3390/insects13100864/s1, Table S1: IDs of transcriptome assemblies used in this study, Table S2: Transcriptome dataset used in this study. The following tables can be downloaded at figshare (https://doi.org/10.6084/m9.figshare.20174255.v1), Table S3: Gene expression ratios when comparing crowded and isolated conditions (CI ratio), Table S4: Score calculated based on the CI ratio between crowded and isolated conditions, Table S5: Number of samples with expression patterns responding to the crowded condition (Top 1% of genes with the highest CI scores), Table S6: Number of samples with expression patterns responding to the crowded condition (Top 1% of genes with the lowest CI scores), Figure S1: Expression ratio of Top 1% of genes with the highest and lowest CI scores in each species. Each color box indicates the expression ratio of each sample.
Author Contributions
Conceptualization, K.T. and H.B.; methodology, K.T. and H.B.; software, K.T. and K.Y.; validation, K.T. and H.B.; formal analysis, K.T.; investigation, K.T.; resources, H.B.; data curation, K.T.; writing—original draft preparation, K.T.; writing—review and editing, K.Y. and H.B.; visualization, K.T.; supervision, H.B.; project administration, H.B.; funding acquisition, H.B. All authors have read and agreed to the published version of the manuscript.
Funding
This research was supported by the Center of Innovation for Bio-Digital Transformation (BioDX), a program on the open innovation platform for industry-academia co-creation (COI-NEXT), and the Japan Science and Technology Agency (JST, COI-NEXT, JPMJPF2010).
Institutional Review Board Statement
Not applicable.
Informed Consent Statement
Not applicable.
Data Availability Statement
The data presented in this study are openly available in figshare [https://doi.org/10.6084/m9.figshare.20174255.v1 (accessed on 30 June 2022)].
Acknowledgments
We would like to thank all laboratory members at Hiroshima University for their valuable comments. Computations were performed on the computers at Hiroshima University Genome Editing Innovation Center.
Conflicts of Interest
The authors declare no conflict of interest. The funders had no role in the study design; collection, analyses, or interpretation of data; writing of the manuscript; or decision to publish the result.
References
- Westeberhard, M.J. Phenotypic Plasticity and the Origins of Diversity. Annu. Rev. Ecol. Syst. 1989, 20, 249–278. [Google Scholar] [CrossRef]
- West-Eberhard, M.J. Developmental Plasticity and Evolution; Oxford University Press: Oxford, UK, 2003. [Google Scholar]
- Simpson, S.J.; Sword, G.A.; Lo, N. Polyphenism in Insects. Curr. Biol. 2011, 21, R738–R749. [Google Scholar] [CrossRef]
- Scott, F.; Gilbert, D. Epel Ecological Developmental Biology: Integrating Epigenetics, Medicine, And Evolution; Sinauer Associates Inc.: Sunderland, MA, USA, 2009. [Google Scholar]
- Toga, K.; Homma, Y.; Togawa, T. Control of the ecdysteroid level plays a crucial role in density-dependent metamorphosis in the giant mealworm beetle Zophobas atratus. Dev. Biol. 2021, 473, 71–79. [Google Scholar] [CrossRef]
- Ozawa, T.; Ohta, K.; Shimada, M.; Okada, K.; Okada, Y. Environmental Factors Affecting Pupation Decision in the Horned Flour Beetle Gnatocerus cornutus. Zool. Sci. 2015, 32, 183–187. [Google Scholar] [CrossRef]
- Eogawa, K.; Emiura, T. Aphid polyphenisms: Trans-generational developmental regulation through viviparity. Front. Physiol. 2014, 5, 1. [Google Scholar] [CrossRef]
- Wang, X.; Kang, L. Molecular Mechanisms of Phase Change in Locusts. Annu. Rev. Èntomol. 2014, 59, 225–244. [Google Scholar] [CrossRef]
- Breuer, M.; Hoste, B.; De Loof, A. The endocrine control of phase transition: Some new aspects. Physiol. Èntomol. 2003, 28, 3–10. [Google Scholar] [CrossRef]
- Parker, B.J.; Brisson, J.A. A Laterally Transferred Viral Gene Modifies Aphid Wing Plasticity. Curr. Biol. 2019, 29, 2098–2103. [Google Scholar] [CrossRef]
- Kang, L.; Chen, X.; Zhou, Y.; Liu, B.; Zheng, W.; Li, R.; Wang, J.; Yu, J. The analysis of large-scale gene expression correlated to the phase changes of the migratory locust. Proc. Natl. Acad. Sci. USA 2004, 101, 17611–17615. [Google Scholar] [CrossRef]
- Badisco, L.; Ott, S.R.; Rogers, S.M.; Matheson, T.; Knapen, D.; Vergauwen, L.; Verlinden, H.; Marchal, E.; Sheehy, M.R.J.; Burrows, M.; et al. Microarray-Based Transcriptomic Analysis of Differences between Long-Term Gregarious and Solitarious Desert Locusts. PLoS ONE 2011, 6, e28110. [Google Scholar] [CrossRef] [Green Version]
- Chen, S.; Yang, P.; Jiang, F.; Wei, Y.; Ma, Z.; Kang, L. De Novo Analysis of Transcriptome Dynamics in the Migratory Locust during the Development of Phase Traits. PLoS ONE 2010, 5, e15633. [Google Scholar] [CrossRef] [PubMed]
- Ma, Z.; Guo, W.; Guo, X.; Wang, X.; Kang, L. Modulation of behavioral phase changes of the migratory locust by the catecholamine metabolic pathway. Proc. Natl. Acad. Sci. USA 2011, 108, 3882–3887. [Google Scholar] [CrossRef] [PubMed]
- Wang, X.; Fang, X.; Yang, P.; Jiang, X.; Jiang, F.; Zhao, D.; Li, B.; Cui, F.; Wei, J.; Ma, C.; et al. The locust genome provides insight into swarm formation and long-distance flight. Nat. Commun. 2014, 5, 2957. [Google Scholar] [CrossRef] [PubMed]
- Bono, H. Meta-Analysis of Oxidative Transcriptomes in Insects. Antioxidants 2021, 10, 345. [Google Scholar] [CrossRef]
- Ono, Y.; Bono, H. Multi-Omic Meta-Analysis of Transcriptomes and the Bibliome Uncovers Novel Hypoxia-Inducible Genes. Biomedicines 2021, 9, 582. [Google Scholar] [CrossRef]
- Suzuki, T.; Ono, Y.; Bono, H. Comparison of Oxidative and Hypoxic Stress Responsive Genes from Meta-Analysis of Public Transcriptomes. Biomedicines 2021, 9, 1830. [Google Scholar] [CrossRef]
- Rahman, M.R.; Petralia, M.C.; Ciurleo, R.; Bramanti, A.; Fagone, P.; Shahjaman, M.; Wu, L.; Sun, Y.; Turanli, B.; Arga, K.Y.; et al. Comprehensive Analysis of RNA-Seq Gene Expression Profiling of Brain Transcriptomes Reveals Novel Genes, Regulators, and Pathways in Autism Spectrum Disorder. Brain Sci. 2020, 10, 747. [Google Scholar] [CrossRef]
- Shaar-Moshe, L.; Hübner, S.; Peleg, Z. Identification of conserved drought-adaptive genes using a cross-species meta-analysis approach. BMC Plant Biol. 2015, 15, 111. [Google Scholar] [CrossRef]
- Barrett, T.; Wilhite, S.E.; Ledoux, P.; Evangelista, C.; Kim, I.F.; Tomashevsky, M.; Marshall, K.A.; Phillippy, K.H.; Sherman, P.M.; Holko, M.; et al. NCBI GEO: Archive for functional genomics data sets—Update. Nucleic Acids Res. 2013, 41, D991–D995. [Google Scholar] [CrossRef]
- Kodama, Y.; Shumway, M.; Leinonen, R. The sequence read archive: Explosive growth of sequencing data. Nucleic Acids Res. 2011, 40, D54–D56. [Google Scholar] [CrossRef] [Green Version]
- The NCBI SRA (Sequence Read Archive); NCBI—National Center for Biotechnology Information/NLM/NIH: Bethesda, MD, USA, 2021.
- Krueger, F. Trim Galore. Available online: Https://Www.Bioinformatics.Babraham.Ac.Uk/Projects/Trim_galore/ (accessed on 30 April 2021).
- Martin, M. Cutadapt removes adapter sequences from high-throughput sequencing reads. EMBnet. J. 2011, 17, 10–12. [Google Scholar] [CrossRef]
- Kim, D.; Paggi, J.M.; Park, C.; Bennett, C.; Salzberg, S.L. Graph-based genome alignment and genotyping with HISAT2 and HISAT-genotype. Nat. Biotechnol. 2019, 37, 907–915. [Google Scholar] [CrossRef] [PubMed]
- Pertea, M.; Kim, D.; Pertea, G.M.; Leek, J.T.; Salzberg, S.L. Transcript-level expression analysis of RNA-seq experiments with HISAT, StringTie and Ballgown. Nat. Protoc. 2016, 11, 1650–1667. [Google Scholar] [CrossRef]
- Patro, R.; Duggal, G.; Love, M.I.; Irizarry, R.A.; Kingsford, C. Salmon provides fast and bias-aware quantification of transcript expression. Nat. Methods 2017, 14, 417–419. [Google Scholar] [CrossRef]
- Pertea, G.; Pertea, M. GFF Utilities: GffRead and GffCompare. F1000Research 2020, 9, 304. [Google Scholar] [CrossRef]
- Zhou, Y.; Zhou, B.; Pache, L.; Chang, M.; Khodabakhshi, A.H.; Tanaseichuk, O.; Benner, C.; Chanda, S.K. Metascape provides a biologist-oriented resource for the analysis of systems-level datasets. Nat. Commun. 2019, 10, 1523. [Google Scholar] [CrossRef] [PubMed]
- Bakkali, M.; Martín-Blázquez, R. RNA-Seq reveals large quantitative differences between the transcriptomes of outbreak and non-outbreak locusts. Sci. Rep. 2018, 8, 9207. [Google Scholar] [CrossRef]
- Yang, M.; Wang, Y.; Liu, Q.; Liu, Z.; Jiang, F.; Wang, H.; Guo, X.; Zhang, J.; Kang, L. A β-carotene-binding protein carrying a red pigment regulates body-color transition between green and black in locusts. Elife 2019, 8, e41362. [Google Scholar] [CrossRef]
- Foquet, B.; Castellanos, A.A.; Song, H. Comparative analysis of phenotypic plasticity sheds light on the evolution and molecular underpinnings of locust phase polyphenism. Sci. Rep. 2021, 11, 11925. [Google Scholar] [CrossRef]
- Yang, P.; Hou, L.; Wang, X.; Kang, L. Core transcriptional signatures of phase change in the migratory locust. Protein Cell 2019, 10, 883–901. [Google Scholar] [CrossRef] [Green Version]
- Guo, X.; Ma, Z.; Du, B.; Li, T.; Li, W.; Xu, L.; He, J.; Kang, L. Dop1 enhances conspecific olfactory attraction by inhibiting miR-9a maturation in locusts. Nat. Commun. 2018, 9, 1193. [Google Scholar] [CrossRef] [PubMed]
- Iga, M.; Kataoka, H. Recent Studies on Insect Hormone Metabolic Pathways Mediated by Cytochrome P450 Enzymes. Biol. Pharm. Bull. 2012, 35, 838–843. [Google Scholar] [CrossRef] [PubMed]
- Noh, M.Y.; Muthukrishnan, S.; Kramer, K.J.; Arakane, Y. Cuticle formation and pigmentation in beetles. Curr. Opin. Insect Sci. 2016, 17, 1–9. [Google Scholar] [CrossRef] [PubMed]
- Yildirim, K.; Winkler, B.; Pogodalla, N.; Mackensen, S.; Baldenius, M.; Garcia, L.; Naffin, E.; Rodrigues, S.; Klämbt, C. Redundant functions of the SLC5A transporters Rumpel, Bumpel, and Kumpel in ensheathing glial cells. Biol. Open 2022, 11, bio059128. [Google Scholar] [CrossRef] [PubMed]
- Mosca, T.J.; Luginbuhl, D.J.; E Wang, I.; Luo, L. Presynaptic LRP4 promotes synapse number and function of excitatory CNS neurons. Elife 2017, 6, e27347. [Google Scholar] [CrossRef]
- Molina-Obando, S.; Vargas-Fique, J.F.; Henning, M.; Gür, B.; Schladt, T.M.; Akhtar, J.; Berger, T.K.; Silies, M. ON selectivity in the Drosophila visual system is a multisynaptic process involving both glutamatergic and GABAergic inhibition. Elife 2019, 8, e49373. [Google Scholar] [CrossRef]
- Wu, X.; Hu, S.; Kang, X.; Wang, C. Synaptotagmins: Beyond Presynaptic Neurotransmitter Release. Neurosci. 2019, 26, 9–15. [Google Scholar] [CrossRef]
- Xu, N.; Wei, S.-F.; Xu, H.-J. Transcriptome Analysis of the Regulatory Mechanism of FoxO on Wing Dimorphism in the Brown Planthopper, Nilaparvata lugens (Hemiptera: Delphacidae). Insects 2021, 12, 413. [Google Scholar] [CrossRef]
- Dale, J.; Tobe, S. Biosynthesis and titre of juvenile hormone during the first gonotrophic cycle in isolated and crowded Locusta migratoria females. J. Insect Physiol. 1986, 32, 763–769. [Google Scholar] [CrossRef]
- Tanaka, S.; Harano, K.-I.; Nishide, Y.; Sugahara, R. The mechanism controlling phenotypic plasticity of body color in the desert locust: Some recent progress. Curr. Opin. Insect Sci. 2016, 17, 10–15. [Google Scholar] [CrossRef]
- Du, B.; Ding, D.; Ma, C.; Guo, W.; Kang, L. Locust density shapes energy metabolism and oxidative stress resulting in divergence of flight traits. Proc. Natl. Acad. Sci. USA 2021, 119, e2115753118. [Google Scholar] [CrossRef] [PubMed]
Figure 1.
Scatter plots of CI-score of all genes (2652 genes) identified in this study. The red and blue dots indicate genes that have been identified in the previous studies as the differentially expressed genes between crowded and isolated conditions.
Figure 1.
Scatter plots of CI-score of all genes (2652 genes) identified in this study. The red and blue dots indicate genes that have been identified in the previous studies as the differentially expressed genes between crowded and isolated conditions.

Figure 2.
Results of gene set enrichment analysis in (A) upregulated DEGs and (B) downregulated DEGs.
Figure 2.
Results of gene set enrichment analysis in (A) upregulated DEGs and (B) downregulated DEGs.


Table 1.
Summary of datasets used in this study.
| Species | Number of RNA Sequencing Files (under Crowded Condition) | Number of RNA Sequencing Files (under Isolated Condition) | Tissue |
|---|---|---|---|
| Schistocerca gregaria | 1 | 1 | CNS |
| Acyrthosiphon pisum | 8 | 8 | whole |
| Schistocerca americana | 10 | 10 | head, thorax |
| Schistocerca nitens | 10 | 10 | head, thorax |
| Schistocerca piceifrons | 10 | 10 | head, thorax |
| Schistocerca serialis cubense | 10 | 10 | head, thorax |
| Locusta migratoria | 17 | 17 | brain, Integument, thoracic ganglion |
Table 2.
Top 1% of genes with the highest CI scores.
| Number of Samples with Expression Patterns Responding to the Crowded Condition | ||||
|---|---|---|---|---|
| Gene_Name | Upregulated | Downregulated | Unchanged | CI Score |
| obst-E | 31 | 8 | 27 | 23 |
| CG14803 | 23 | 3 | 40 | 20 |
| His2A:CG33835 | 30 | 10 | 26 | 20 |
| Jheh2 | 22 | 3 | 41 | 19 |
| nw | 27 | 8 | 31 | 19 |
| HDAC1 | 21 | 3 | 42 | 18 |
| Ugt36D1 | 24 | 7 | 35 | 17 |
| CG5321 | 22 | 7 | 37 | 15 |
| Cdep | 21 | 6 | 39 | 15 |
| e | 17 | 2 | 47 | 15 |
| pds5 | 19 | 4 | 43 | 15 |
| CG4572 | 21 | 7 | 38 | 14 |
| CG6765 | 16 | 2 | 48 | 14 |
| Incenp | 23 | 9 | 34 | 14 |
| Psf3 | 21 | 7 | 38 | 14 |
| ft | 21 | 7 | 38 | 14 |
| polo | 19 | 5 | 42 | 14 |
| tou | 22 | 8 | 36 | 14 |
| tum | 19 | 5 | 42 | 14 |
| CG10175 | 22 | 9 | 35 | 13 |
| CG2990 | 20 | 7 | 39 | 13 |
| CG8173 | 18 | 5 | 43 | 13 |
| DNApol-alpha60 | 22 | 9 | 35 | 13 |
| SmD3 | 18 | 5 | 43 | 13 |
| Ts | 20 | 7 | 39 | 13 |
| CG8646 | 20 | 8 | 38 | 12 |
Table 3.
Top 1% of genes with the lowest CI scores.
| Number of Samples with Expression Patterns Responding to the Crowded Condition | ||||
|---|---|---|---|---|
| Gene_Name | Upregulated | Downregulated | Unchanged | CI Score |
| CG14301 | 3 | 28 | 35 | −25 |
| ple | 7 | 31 | 28 | −24 |
| CG9657 | 6 | 29 | 31 | −23 |
| Lrp4 | 3 | 26 | 37 | −23 |
| GluClalpha | 5 | 26 | 35 | −21 |
| CG34461 | 9 | 29 | 28 | −20 |
| Cyp6a14 | 9 | 28 | 29 | −19 |
| CG10211 | 10 | 27 | 29 | −17 |
| Ggt-1 | 8 | 24 | 34 | −16 |
| Syt4 | 6 | 22 | 38 | −16 |
| Cralbp | 9 | 24 | 33 | −15 |
| KaiR1D | 3 | 18 | 45 | −15 |
| RpS5a | 3 | 18 | 45 | −15 |
| Shmt | 6 | 21 | 39 | −15 |
| Tcs3 | 4 | 19 | 43 | −15 |
| tyn | 2 | 17 | 47 | −15 |
| CG13744 | 7 | 22 | 37 | −15 |
| CG15449 | 5 | 19 | 42 | −14 |
| Est-6 | 9 | 23 | 34 | −14 |
| KaiR1D | 11 | 25 | 30 | −14 |
| Mdr49 | 7 | 21 | 38 | −14 |
| dpr12 | 6 | 20 | 40 | −14 |
| CG13643 | 7 | 20 | 39 | −13 |
| CG6006 | 5 | 18 | 43 | −13 |
| CG7246 | 2 | 15 | 49 | −13 |
| Cnb | 5 | 18 | 43 | −13 |
Publisher’s Note: MDPI stays neutral with regard to jurisdictional claims in published maps and institutional affiliations. |
© 2022 by the authors. Licensee MDPI, Basel, Switzerland. This article is an open access article distributed under the terms and conditions of the Creative Commons Attribution (CC BY) license (https://creativecommons.org/licenses/by/4.0/).
Share and Cite
MDPI and ACS Style
Toga, K.; Yokoi, K.; Bono, H. Meta-Analysis of Transcriptomes in Insects Showing Density-Dependent Polyphenism. Insects 2022, 13, 864. https://doi.org/10.3390/insects13100864
AMA Style
Toga K, Yokoi K, Bono H. Meta-Analysis of Transcriptomes in Insects Showing Density-Dependent Polyphenism. Insects. 2022; 13(10):864. https://doi.org/10.3390/insects13100864
Chicago/Turabian StyleToga, Kouhei, Kakeru Yokoi, and Hidemasa Bono. 2022. "Meta-Analysis of Transcriptomes in Insects Showing Density-Dependent Polyphenism" Insects 13, no. 10: 864. https://doi.org/10.3390/insects13100864
Note that from the first issue of 2016, this journal uses article numbers instead of page numbers. See further details here.