
Friends in All the Green Spaces: Weather Dependent Changes in Urban Mosquito (Diptera: Culicidae) Abundance and Diversity


1
Inst of Agricultural and Environmental Sciences, Estonian University of Life Sciences, Friedrich Reinhold Kreutzwaldi 5D, 51006 Tartu, Estonia
2
Environmental Board, Narva mnt. 7a, 15172 Tallinn, Estonia
3
Inst of Veterinary Medicine and Animal Sciences, Estonian University of Life Sciences, Friedrich Reinhold Kreutzwaldi 62, 51006 Tartu, Estonia
*
Author to whom correspondence should be addressed.
Insects 2021, 12(4), 352; https://doi.org/10.3390/insects12040352
Submission received: 22 March 2021
/
Revised: 12 April 2021
/
Accepted: 13 April 2021
/
Published: 15 April 2021
(This article belongs to the Special Issue Diptera Diversity in Space and Time)
Abstract
:Simple Summary
Many female mosquitoes require vertebrate blood for egg production. Cities are becoming increasingly important points of contact between mosquitoes and their prey, as large-scale urbanization continues. Human settlements represent unique but fragmented habitats that are permanently warmer than rural areas. Because of this, there is a growing demand to better understand urban mosquito populations and the factors affecting them in various circumstances. The aim of this study was to investigate the weather conditions influencing mosquito species and abundance in a Northern European town. Thus, a three-year-long mosquito collection effort was undertaken in Estonia. Results indicated that the number of active mosquitoes decreased with wind and higher temperatures. Interestingly, there was a significant negative correlation between temperature and humidity. Furthermore, while mosquitoes belonging to the Culex pipiens/Culex torrentium group were consistently abundant during the end of the warm season, other dominant species varied considerably between the months and the three study years. Overall, springtime hydrological conditions seemed to greatly influence the mosquito season. Urbanization could generate both higher temperatures and drier environments, resulting in fewer mosquitoes in some areas. This study also revealed the mosquito species most likely to contribute to disease transmission in Estonian towns.
Abstract
Mosquitoes (Diptera: Culicidae) are universally recognized as troublesome pests and vectors of various pathogens and parasites. Understandably, the species makeup and diversity of individual populations depends on local and broad scale environmental trends, especially on temperature and hydrological variations. Anthropogenic landscapes make for unique habitats, but their effect on insects likely varies across climatic regions. The aim of this study was to investigate the diversity and seasonal patterns of urban mosquitoes in the boreal region. Specimens were collected with an insect net from May to September during three years and determined to species or species group level. Weather information was added to each data point and results analyzed using multivariate regression models. Fieldwork yielded 1890 mosquitoes from four genera. Both abundance and the effective number of species (ENS) significantly decreased during the study period. The number of collected mosquitoes had a negative correlation with wind speed and temperature, latter of which exhibited a negative association with humidity. Species succession followed predictable patterns, but with some variation between years. Still, Culex pipiens/Culex torrentium were the most abundant throughout the study. Importantly, all dominant species were known disease vectors. Our work showed that higher temperatures could result in fewer mosquitoes in boreal towns.
Keywords:
Aedes; Anopheles; Coquillettidia; Culex; Culiseta; entomology; Estonia; environment; pathogen vectors1. Introduction
Mosquitoes (Diptera: Culicidae) are common biting insects found on almost every continent: Thus far, a total of 3583 species have been recorded from various parts of the world [1,2]. Moreover, mosquitoes are the primary transmitters, also known as vectors, for many of the most important arthropod-borne diseases [3]. All vector-borne diseases combined account for about 17% of the global disease burden, currently endangering around 80% of the world’s population [4]. However, ongoing processes like urbanization, alterations in agricultural practices, deforestation, climate change as well as socioeconomic developments influence the prevalence and geographic ranges of both vectors and vector-borne pathogens [5,6,7]. Furthermore, different mosquito species can act as the principal vector for the same pathogen depending on whether the transmission cycle takes place in a sylvatic, rural or urban setting [8,9]. Hence, it is not only important to study global mosquito diversity patterns, but to also understand how mosquito communities and vector-human interactions are shaped by local conditions, as mosquitoes are the most likely vectors to cause vector-borne disease epidemics in urban environments [10].
Human habitats present mosquitoes with unique challenges: densely populated areas provide human-biting insects with a reliable food source, giving anthropophilic species a notable evolutionary advantage [11]. Furthermore, cities present a highly fragmented setting, where biodiversity is influenced by the interactions between the microenvironment and urbanization specific broad-scale trends [12,13,14]. For example, the urban heat island effect is a well-established phenomenon: Large settlements tend to be significantly warmer than the surrounding areas [15,16,17]. These higher temperatures help create suitable habitats for organisms normally found in lower latitudes, supporting the spread and establishment of invasive species [18,19]. This in turn allows for the northward expansion of exotic vector-borne pathogens, exposing more people to the risk of infections [5,20]. On the other hand, urbanization is most commonly associated with a general decrease in species diversity, affecting specialized organisms more than generalists, although this varies by taxon [12,13,18]. Densely populated settlements naturally contribute to the abundance and development of synanthropic organisms. Therefore, it is to be expected that anthropogenic landscapes favor some mosquito species above others [11,21]. Urban green spaces are particularly noteworthy for providing mosquitoes with ample shelter and a variety of food sources [22,23]. Hence, as mosquitoes can be a severe nuisance as well as present a clear health risk, it is important to develop a better understanding of their community structure in various locations with differing levels of urban development [5,21,24].
Biodiversity, species abundance and the community makeup of anthropogenic landscapes has received increasing attention in the past decades [25]. A number of studies have investigated general mosquito abundance and diversity in various towns and suburban areas as well as how these populations respond to different weather conditions [26,27,28,29]. Others have examined the urban lifecycles of the most common or significant synanthropic mosquito species [30,31]. Some studies have concentrated on the ways the characteristics of urban green spaces can influence mosquito abundance, regardless of weather patterns, and how these areas could be designed to be safer for humans [32,33,34]. Similarly, efforts have been made to improve methods of detecting areas which serve as mosquito refuges and breeding sites [35]. For example, previous research has shown that the container breeding Culex (Cx.) pipiens Linnaeus, 1758 is exceedingly common and abundant in urban environments [26,27]. Nonetheless, in the Po Plain Valley region of Italy it was found that during summer months the overall density of Cx. pipiens was still higher in rural sites rather than urban areas [30]. Furthermore, field tests in Thailand indicated that environmental characteristics like closeness of waterbodies and forested areas as well as higher canopy cover increased the number of larvae predators in mosquito breeding sites, but these predators attacked mosquitoes of various species at different rates [34]. Researchers looking at city parks in Manaus, Brazil collected mosquitoes from various distances from the forest edge, revealing a significant difference in the species composition of sites near the perimeter and those 500 m into the forest [36]. On the other hand, a study conducted in Hong Kong found that while temperature had an overarching effect on urban mosquito populations, windiness had a negative effect on mosquito abundance in rooftop green spaces, making these areas safer for residents than ground level parks [33]. Research in Chicago, IL, USA demonstrated that species richness as well as diversity correlated positively with habitat heterogeneity, and climatic variability appeared to influence mosquito diversity patterns across the study sites [14]. In the same study, doctor Chaves and colleagues also found that an increase in species diversity coincided with a reduction in mosquito abundance. All in all, it is clear that urban mosquito populations are shaped by both largescale progresses as well as the local microhabitat, but the nature and strength of these interactions should be further examined in settlements with various levels of urbanization and in different climate zones [12].
Thus far, most studies regarding urban mosquitoes have been conducted in the tropics, subtropics and the warmer areas of the temperate climate zone. The aim of this study was to better understand the main factors influencing mosquito abundance and species diversity in the urban green spaces of a low density settlement in the boreal biome. For this purpose, four main hypotheses were established:
- Higher temperature and relative humidity values result in a greater number of active mosquitoes.
- Stronger winds are expected to have a negative correlation with the number of active individuals.
- The ratio of collected female and male mosquitoes varies over the warm season, because male mosquitoes have shorter lifespans [37] and thus their abundance should be more sensitive to recent adverse weather conditions.
- Urban mosquito populations are dominated by one or two abundant synanthropic species.
2. Materials and Methods
This study was conducted in Tartu, the second largest town in Estonia, situated on the east and west shores of river Emajõgi. Weather in Estonia is characterized by the temperate continental climate with cold winters and brief but warm summers according to the Köppen-Trewartha climate classification system [38,39]. The European Commission considers Estonia to belong to the Boreal biome [40]. Tartu itself is a university town with slightly more than 96,000 inhabitants (624.2 inhabitants per km2) and serves as the regional center for Southern-Estonia [41]. The town area spans 38.80 km2: This includes 3.90 km2 (about 10.1%) of urban green spaces and 5.10 km2 (13.1%) of natural vegetation [42,43].
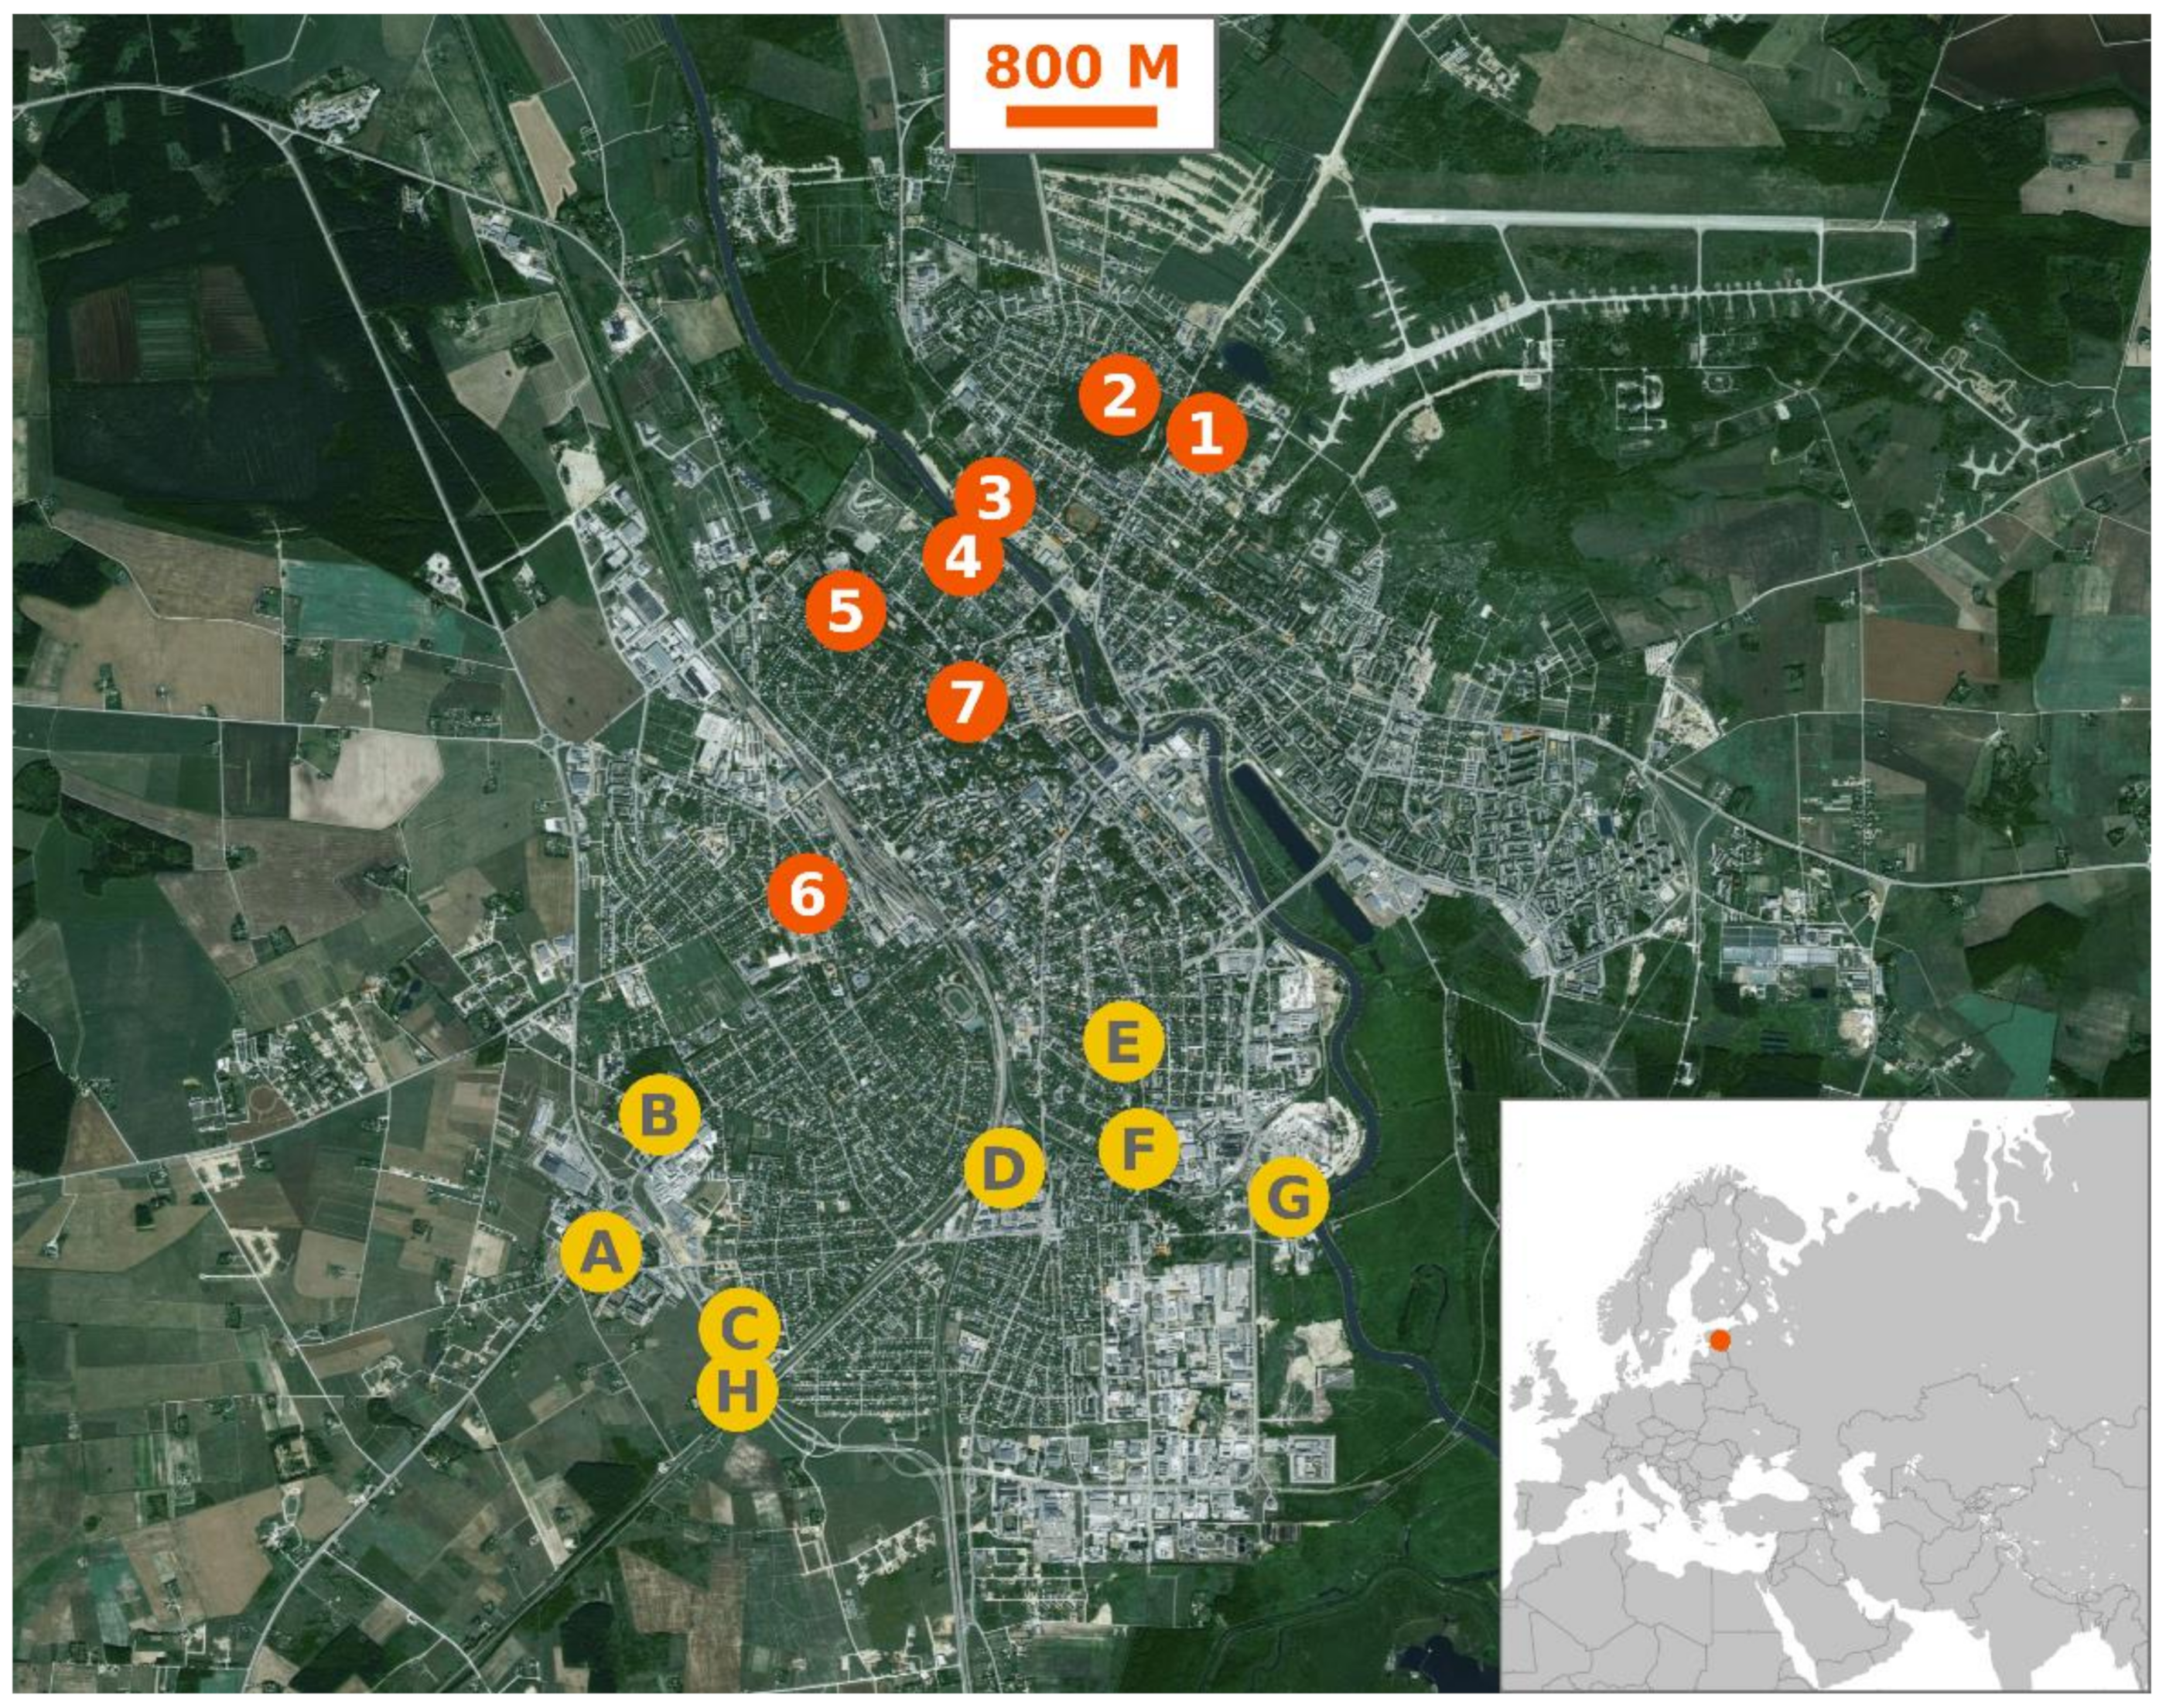
Mosquitoes were collected using a 50 cm diameter mesh net once a week from May to October during 2013, 2016 and 2017. Hand-net collections have been previously used by numerous researchers [44] and this method was chosen for its cost effectiveness as well as robustness, as it allowed collecting mosquitoes from busy areas where the use of stationary traps was not possible. Collection sites (Figure 1) were visited each week in a changing order starting from five o’clock in the afternoon. All in all, six collection sites were sampled during 2013, one new site was added in 2016 and further eight sites were added in 2017. Collection sites were located in the shaded areas of parks, near play areas, recreational trails or footpaths:
- Site 1 (58°23′40.6″ N, 26°44′05.6″ E) was situated in a corner of an abandoned gravel quarry by a well-traveled park with large trees but very little brush.
- Site 2 (58°23′44.6″ N, 26°43′44.4″ E) was in a sitting area in the town’s largest commentary complex, surrounded by both old trees as well as ornamental hedges.
- Site 3 (58°23′24.7″ N, 26°42′55.7″ E) was located on the north shore of river Emajõgi, under sparse old trees.
- Site 4 (58°23′20.1″ N, 26°42′52.6″ E) was situated on the south side of river Emajõgi and included both old park trees as well as brush.
- Site 5 (58°23′05.5″ N, 26°42′19.7″ E) was in Tähtvere park by a large ornamental bush, sparsely surrounded by old trees.
- Site 6 (58°22′17.8″ N, 26°41′58.1″ E) was in Mathieseni park, on the south side of a row of tall ornamental bushes, surrounded by park trees. This park borders the Tartu University Hospital and is visited by both faculty and patients.
- Site 7 (58°22′52.10″ N, 26°42′49.13″ E) was situated on an uneven natural hill called Toomemägi, close to the ruins of a former cathedral. This park is dotted by trees and the irregular features as well as ruined structures offer plenty of shade.
- Site A (58°21′13.4″ N, 26°40′45.5″ E) was located in a tree enclosed green space at the edge of the town.
- Site B (58°21′36.9″ N, 26°41′10.4″ E) was on the border between single-family homes and a small densely wooded area.
- Site C (58°21′1.3″ N, 26°41′30.6″ E) was situated beside a construction site at the edge of the town, with very few trees or bushes in the vicinity.
- Site D (58°21′26.4″ N, 26°42′60.0″ E) was on the margins of Pauluse cemetery, which is dotted by old trees and features a small pond.
- Site E (58°21′50.6″ N, 26°43′43.0″ E) was situated close to the border between the yard of St. Alexander’s Orthodox Church and surrounding residential buildings.
- Site F (58°21′36.5″ N, 26°43′56.3″ E) was located in a small parking area surrounded by Forseliuse park, which feature large trees and a children’s play area.
- Site G (58°21′23.8″ N, 26°44′31.7″ E) was on a construction site near river Emajõgi, surrounded by large commercial buildings.
- Site H (58°20′52.9″ N, 26°41′37.3″ E) was located in a sparsely populated area near the city limits, overgrown with brush.
The collection protocol called for two times 25 swings with the insect net and specimens were gathered between as well as after the sets with an aspirator. Net swings were made in the air and through the tips of soft vegetation. Date, time and the person collecting mosquitoes was recorded at each site. Mosquitoes were later killed by freezing and stored in 75% ethanol (C2H5OH) or as dry material at −20 °C. Specimens were identified to species or a species group level under a stereomicroscope Olympus SZ61 (Olympus Corporation, Shinjuku, Tokyo, Japan) using a standard taxonomic key [37] and their gender was recorded. Mosquitoes too damaged for identification were marked as “unspecified”. Afterwards, weather information was added to the data from the records of the Estonian Weather Service, based on the date and time of fieldwork. Data was acquired from Tartu-Tõravere meteorological station (58°15′51″ N, 26°27′41″ E), which is situated about 16 km southwest (SW) of the city limits of Tartu. Each catch in the dataset was provided with the measurements of time to sundown (min), temperature (°C), relative humidity (%), wind speed (m/s) and atmospheric pressure at sea level (hPa).
Shannon diversity indices (H) were calculated based on the number of mosquitoes and the quantity of different species in each catch [45]. The Shannon diversity index can be written as the following equation:
where S is the number of different mosquito species and p is the number of individuals of the same species divided by the number of all individuals. From this, the true diversity of the collected mosquito samples was calculated using the effective number of species (ENS). This statistic indicates what kind of a population with equally represented species the examined sample is similar to [46]. ENS was calculated by taking the exponential of the Shannon diversity index and the results were rounded to integers:
As the mosquito count data had a Poisson distribution, the parameter lambda (λ) was used to represent the average number of mosquitoes caught during collection events. For the same reasons, 95% confidence interval (CI), instead of standard deviation, was used to characterize dispersion. Additional statistical analyses were done in the free software R version 3.6.1 [47]. Mosquitoes which could not be identified to species or species group level were only included in the dataset when analyzing specimen yields and removed when examining species diversity. Additionally, data was cleaned of outliers and the independent variables were checked for pairwise correlations using R package “psych” [48]. The degree of correlation was evaluated using the non-parametric Kendall rank correlation coefficient (τ). As relative humidity and time until sunset were moderately correlated with each other (τ = −0.43) as well as the month (τ = 0.45 and τ = −0.44, respectively) they were dropped from the analysis. As no fieldwork was done in October in 2013 and only few catches were made during that month in 2016, the records for October were also eliminated from the dataset. Days when fieldwork was terminated early due to rainfall were removed.
Using the R package “MASS” [49], negative binomial generalized linear model (GLM) was employed to determine the character and power of the relationship between the independent variables (collection site, month and year of collection, temperature, wind speed, relative humidity and gender) and the number of collected mosquitoes. This was due to the dataset exhibiting both over dispersion and zero inflation. On the other hand, a GLM with Poisson distribution was used for modeling the relationships between independent variables and ENS. Non-significant variables were removed from the models by hand. Models were tested for over- and under-dispersion as well as zero inflation using the R packages “DHARMa” [50] and “performance” [51], respectively. Furthermore, the R package “mctest” [52,53] was employed to evaluate the level of multicollinearity among the independent variables based on variance inflation factor (VIF) and tolerance (TOL). Illustrative figures were generated using the R package “ggplot2” [54]. When necessary, correlation statistics included on these figures were calculated by conducting a non-parametric test using Kendall rank correlation.
3. Results
The dataset analyzed in this study consisted of 1890 mosquitoes caught from 15 collection sites in the town of Tartu: 654 mosquitoes were collected in 2013 (74.01% of these were female), 556 in 2016 (53.60% female) and 680 in 2017 (58.97% female). Of these individuals, 47 mosquitoes were too damaged to be identified by their morphological traits. It should be stressed, that in 2013 six collection sites were sampled, in 2016 one new site was added and in 2017 a total of eight additional sites were added. Therefore, while the total number of collected mosquitoes was similar between the three years, in reality the mean number of individuals caught during each collection event decreased from 6.41, 95% CI [6.22–6.61] (Poisson lambda (λ), 95% confidence interval (CI) [lower limit–upper limit]) in 2013 to 3.78, 95% CI [3.62–3.94] in 2016 and 2.53, 95% CI [2.41–2.65] in 2017. The number of mosquitoes caught during one collection event varied from zero to 90 and was influenced by year, month, temperature, wind conditions, insect gender as well as study site, but also by the associations between these factors (Table 1). Species diversity, represented by the effective number of species (ENS), also showed a slight decrease between the three years: the average ENS was 1.59, 95% CI [1.40–1.78] in 2013, 1.39 [1.23–1.55] in 2016 and 1.11 [0.99–1.23] in 2017. Additionally, the ENS of a single collection event only varied from zero to six and was influenced by the collection year and site (Table 2).
The number of collected mosquitoes was dependent on the collection year and month as well as on the interaction between the two variables (Figure 2). On average, mosquito collection events yielded far more individuals during 2013 than during 2016 and 2017. However, there was also marked variance between the fieldwork months. All in all, higher numbers of mosquitoes were caught during May and June. Noticeably fewer mosquitoes were collected on average during July, August and September. Interestingly, when looking at how the interactions between year and month influence average mosquito yield, it seems that in 2016 and 2017 the average number of mosquitoes collected during May is significantly smaller than in 2013 compared to the other months. Because of this, the interactions between the later years and other collection months, except for June in 2016, show a positive effect on the average mosquito yield.
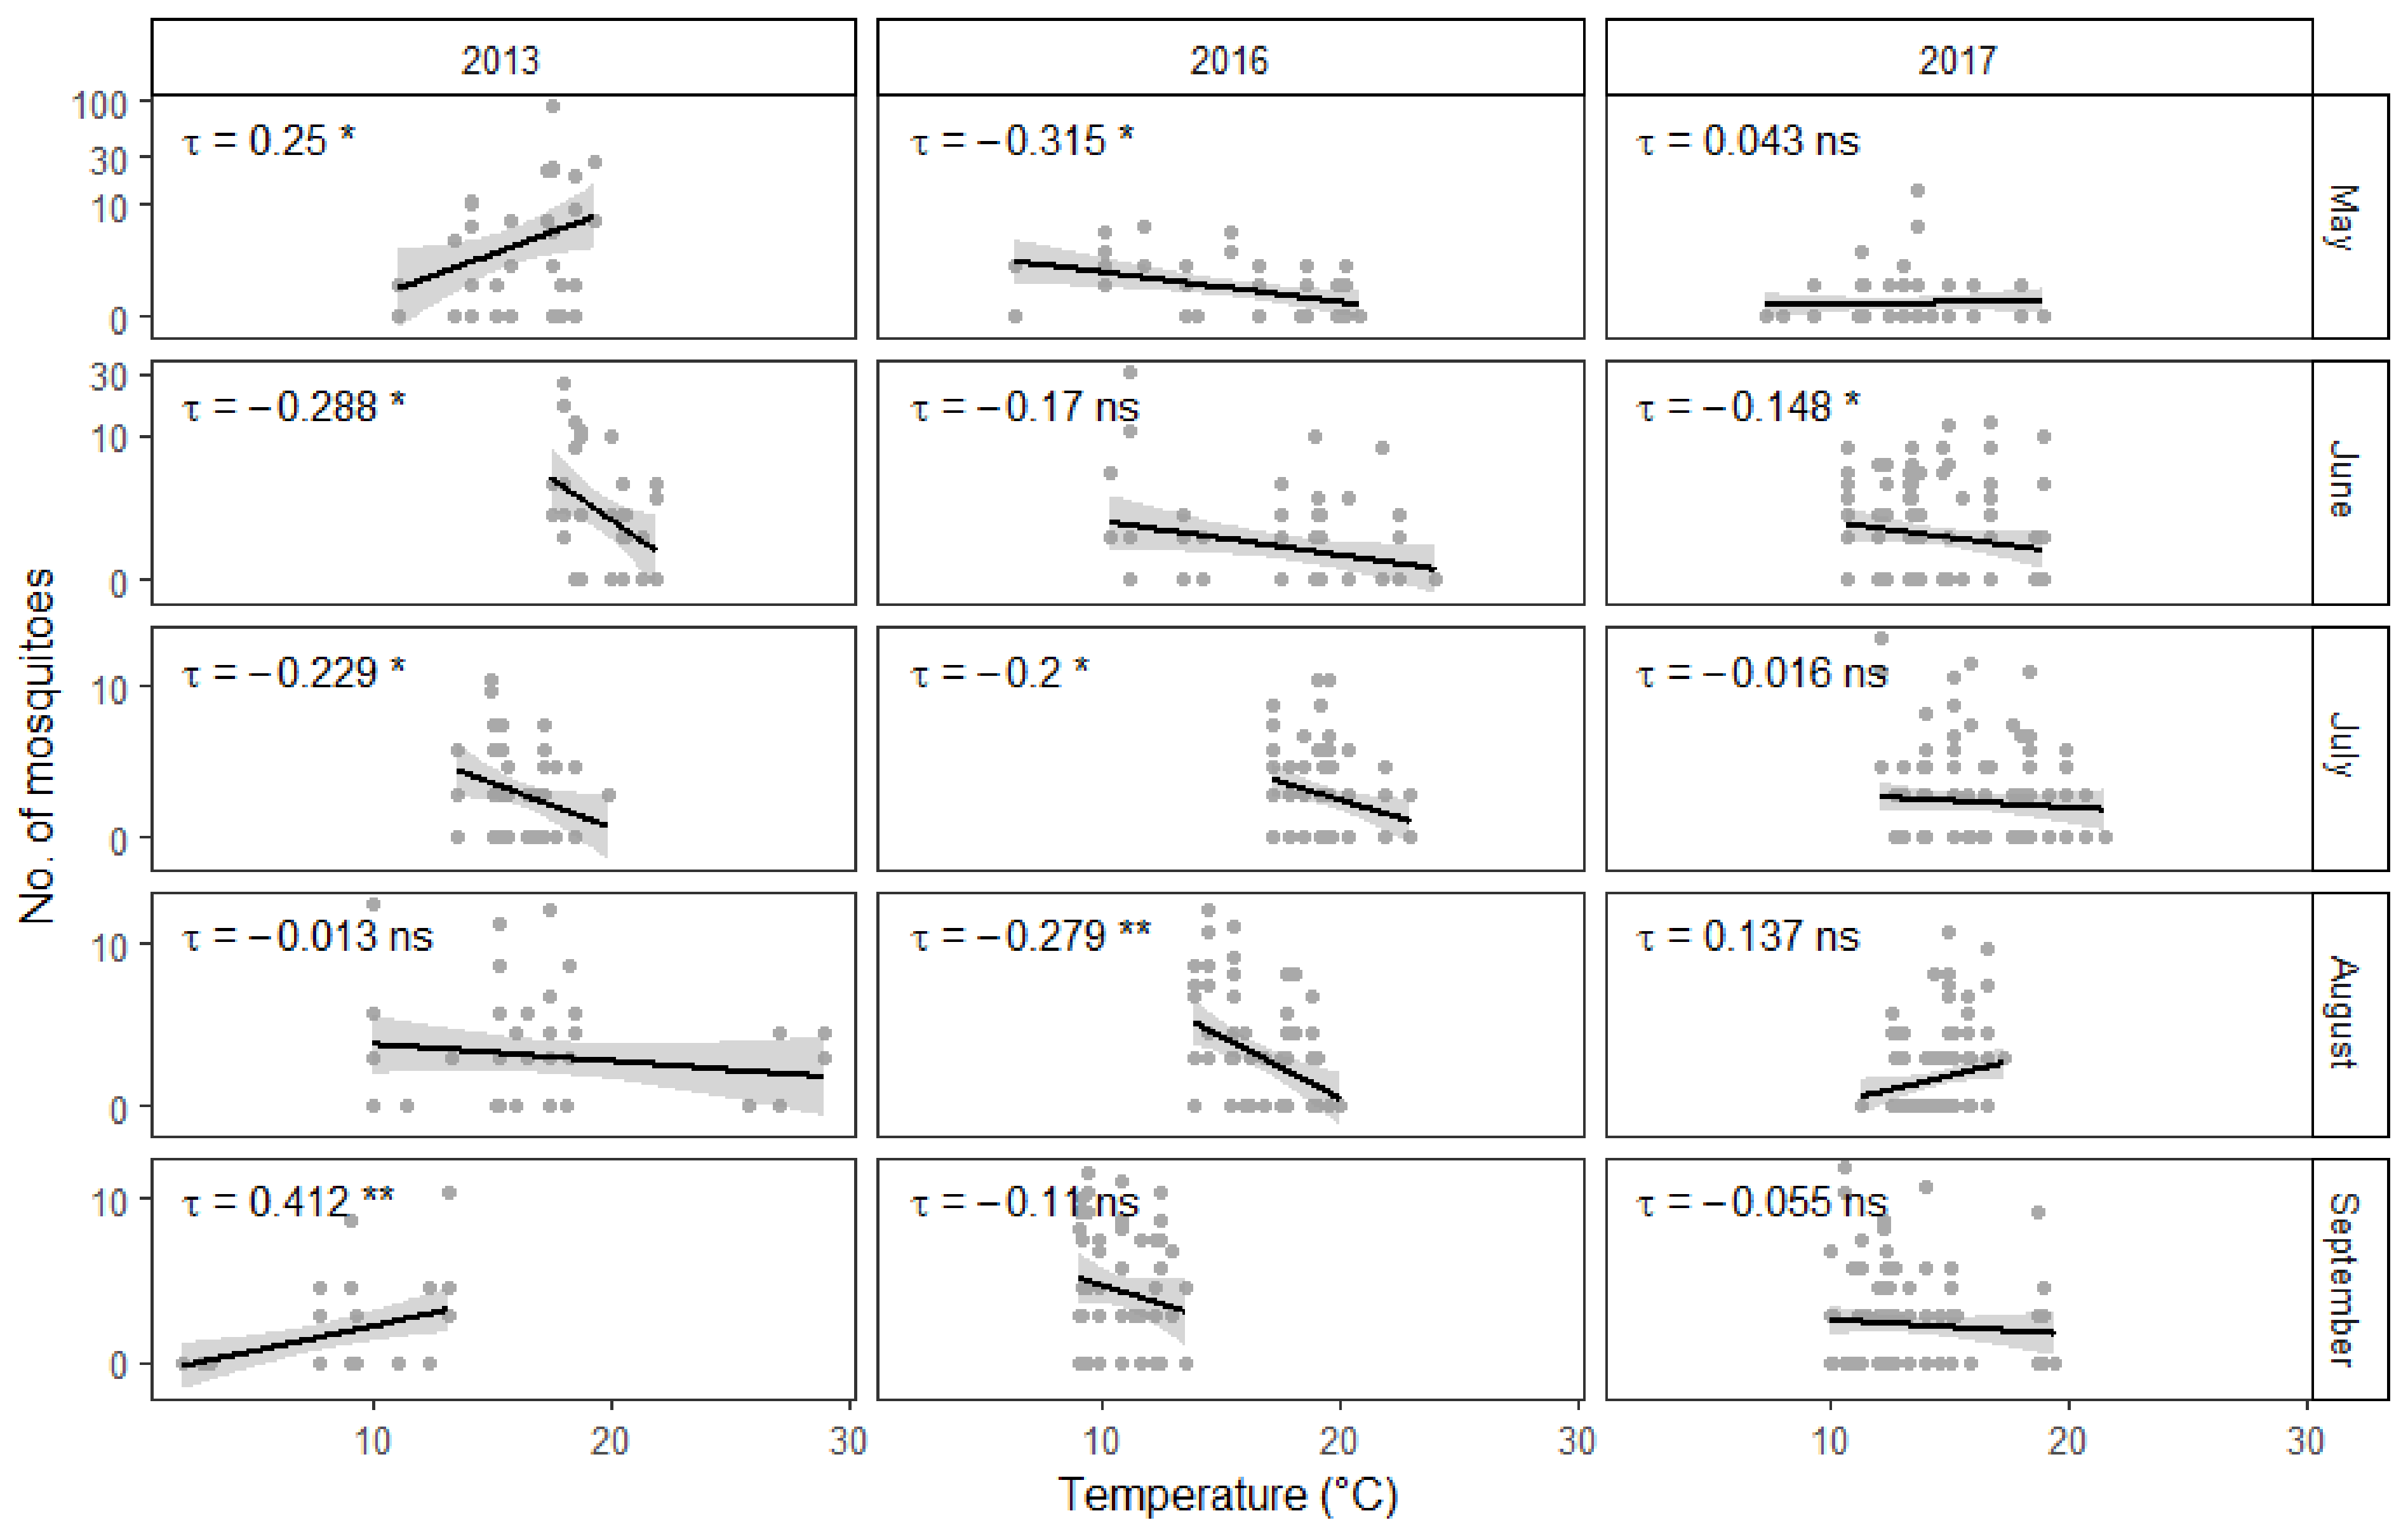
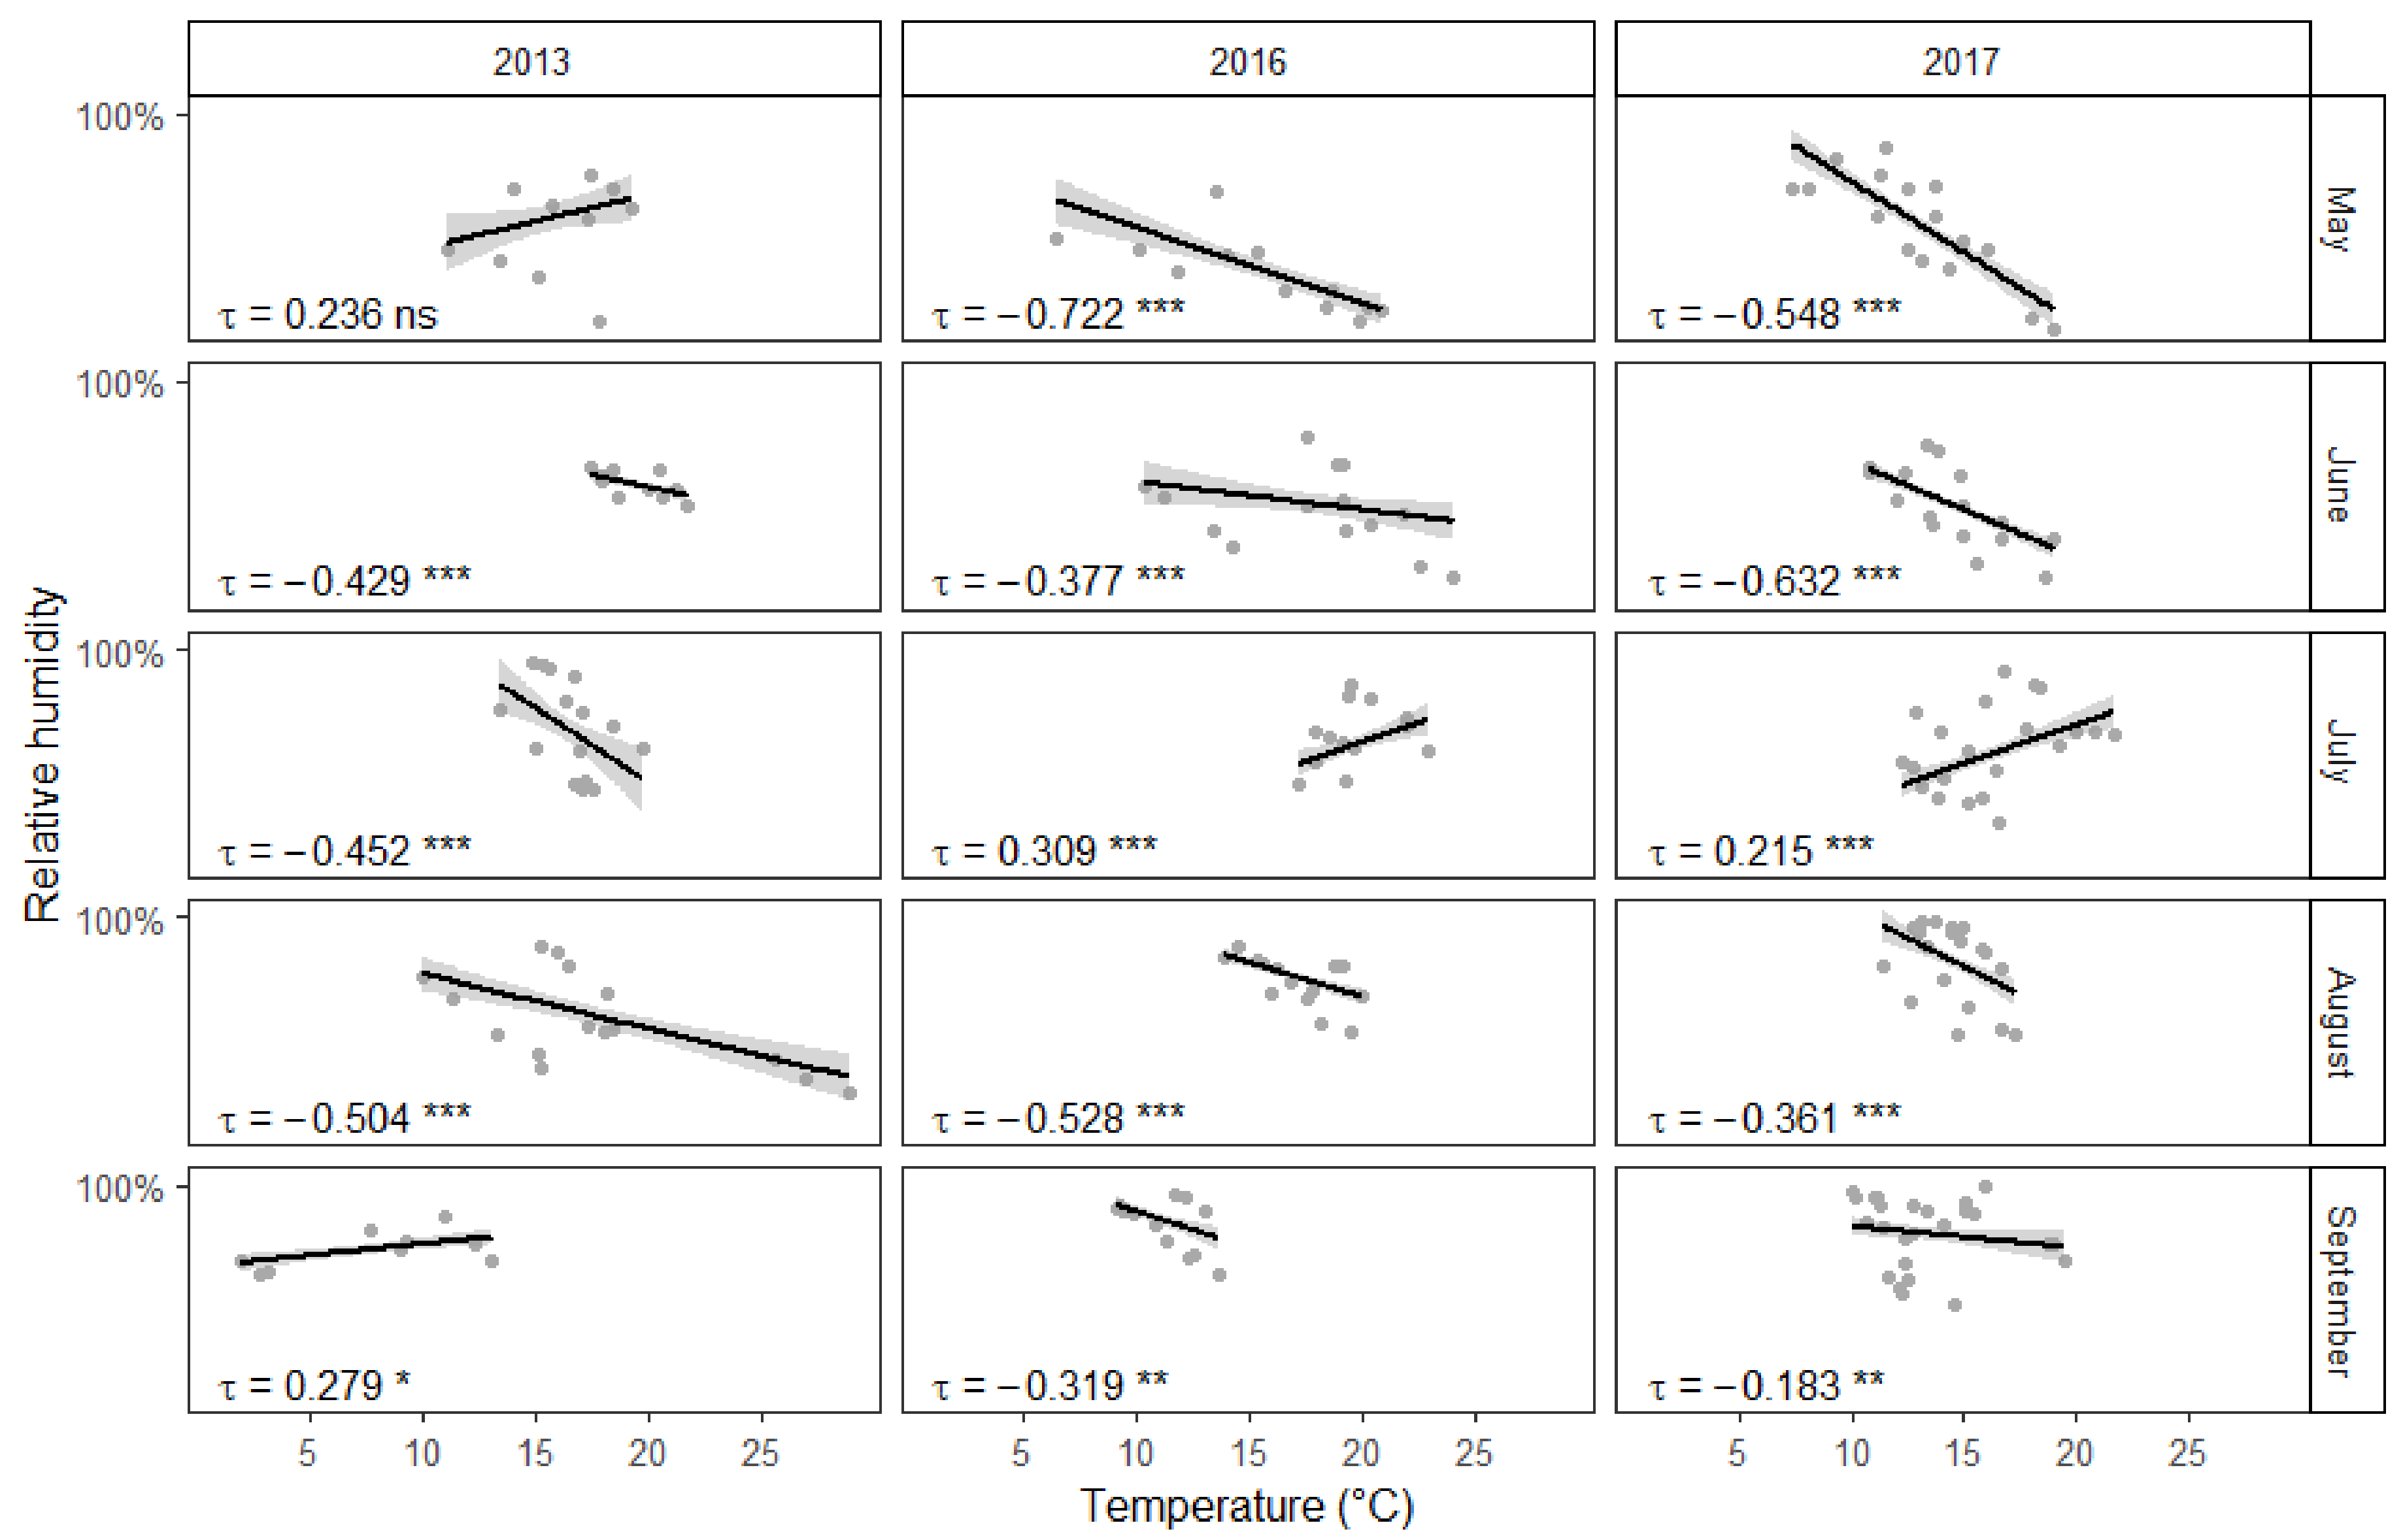
Somewhat surprisingly, higher temperatures appeared to correlate with fewer collected mosquitoes (Figure 3). Interestingly, there was a negative association between temperature and relative humidity (Figure 4). On the other hand, as could be expected, stronger winds in the area of the town resulted in fewer mosquitoes being collected during fieldwork. However, there was no significant interaction between individual study sites and general wind conditions. Quite predictably, male mosquitoes were collected much less often than females. Additionally, there appears to be an interaction between collection month and insect gender. The proportion of males among the collected mosquitoes was overall significantly larger in August than in May. This difference becomes even more pronounced in September. However, there was no significant interaction between collection year and gender. Furthermore, some of the 15 study sites yielded more mosquitoes on average than others.
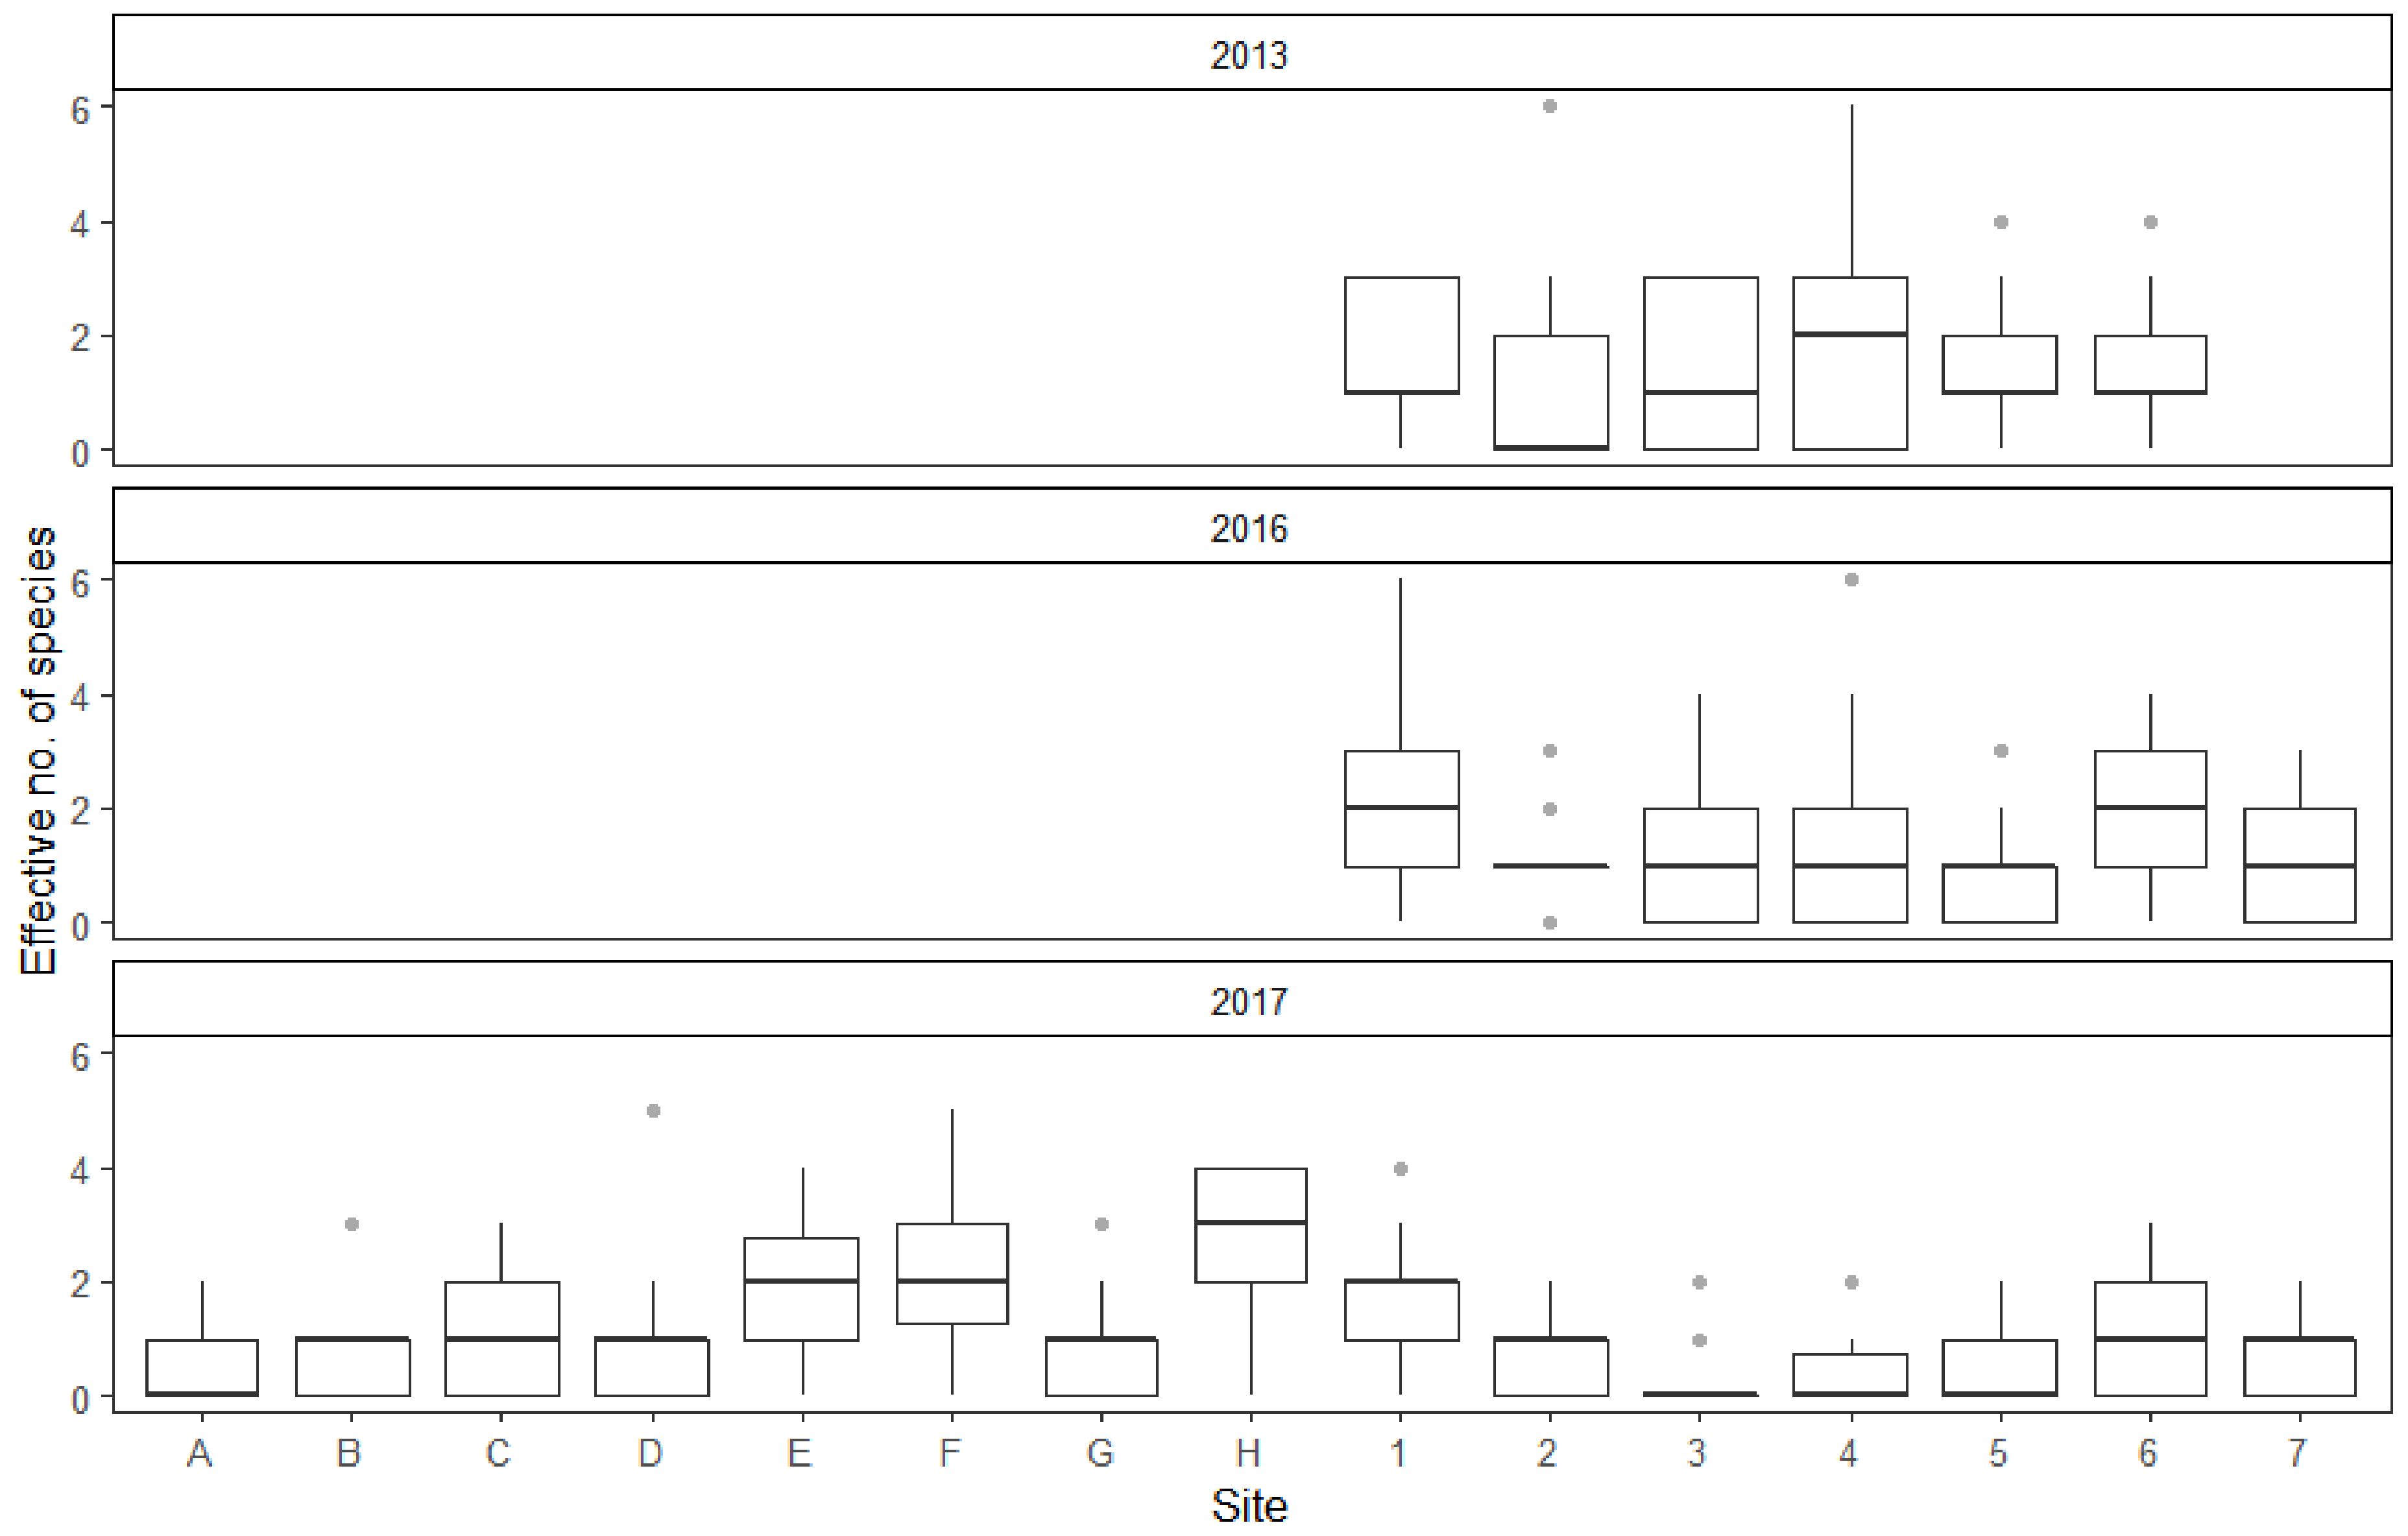
The effective number of species (ENS) statistic was chosen to represent population diversity. ENS was calculated for every collection event, based on all of the mosquitoes that could be identified to species or species group level by morphological markers. Results show that the diversity of the collected individuals was influenced by both collection site and year (Figure 5). ENS did not appear to be influenced by the study month, temperature, wind conditions or atmospheric pressure. Furthermore, some collection sites yield more mosquito species on average than the reference site. As with mosquito abundance, the average effective number of species decreased from 2013 to 2017. Interestingly, the overall number of recorded species actually increased during the study.
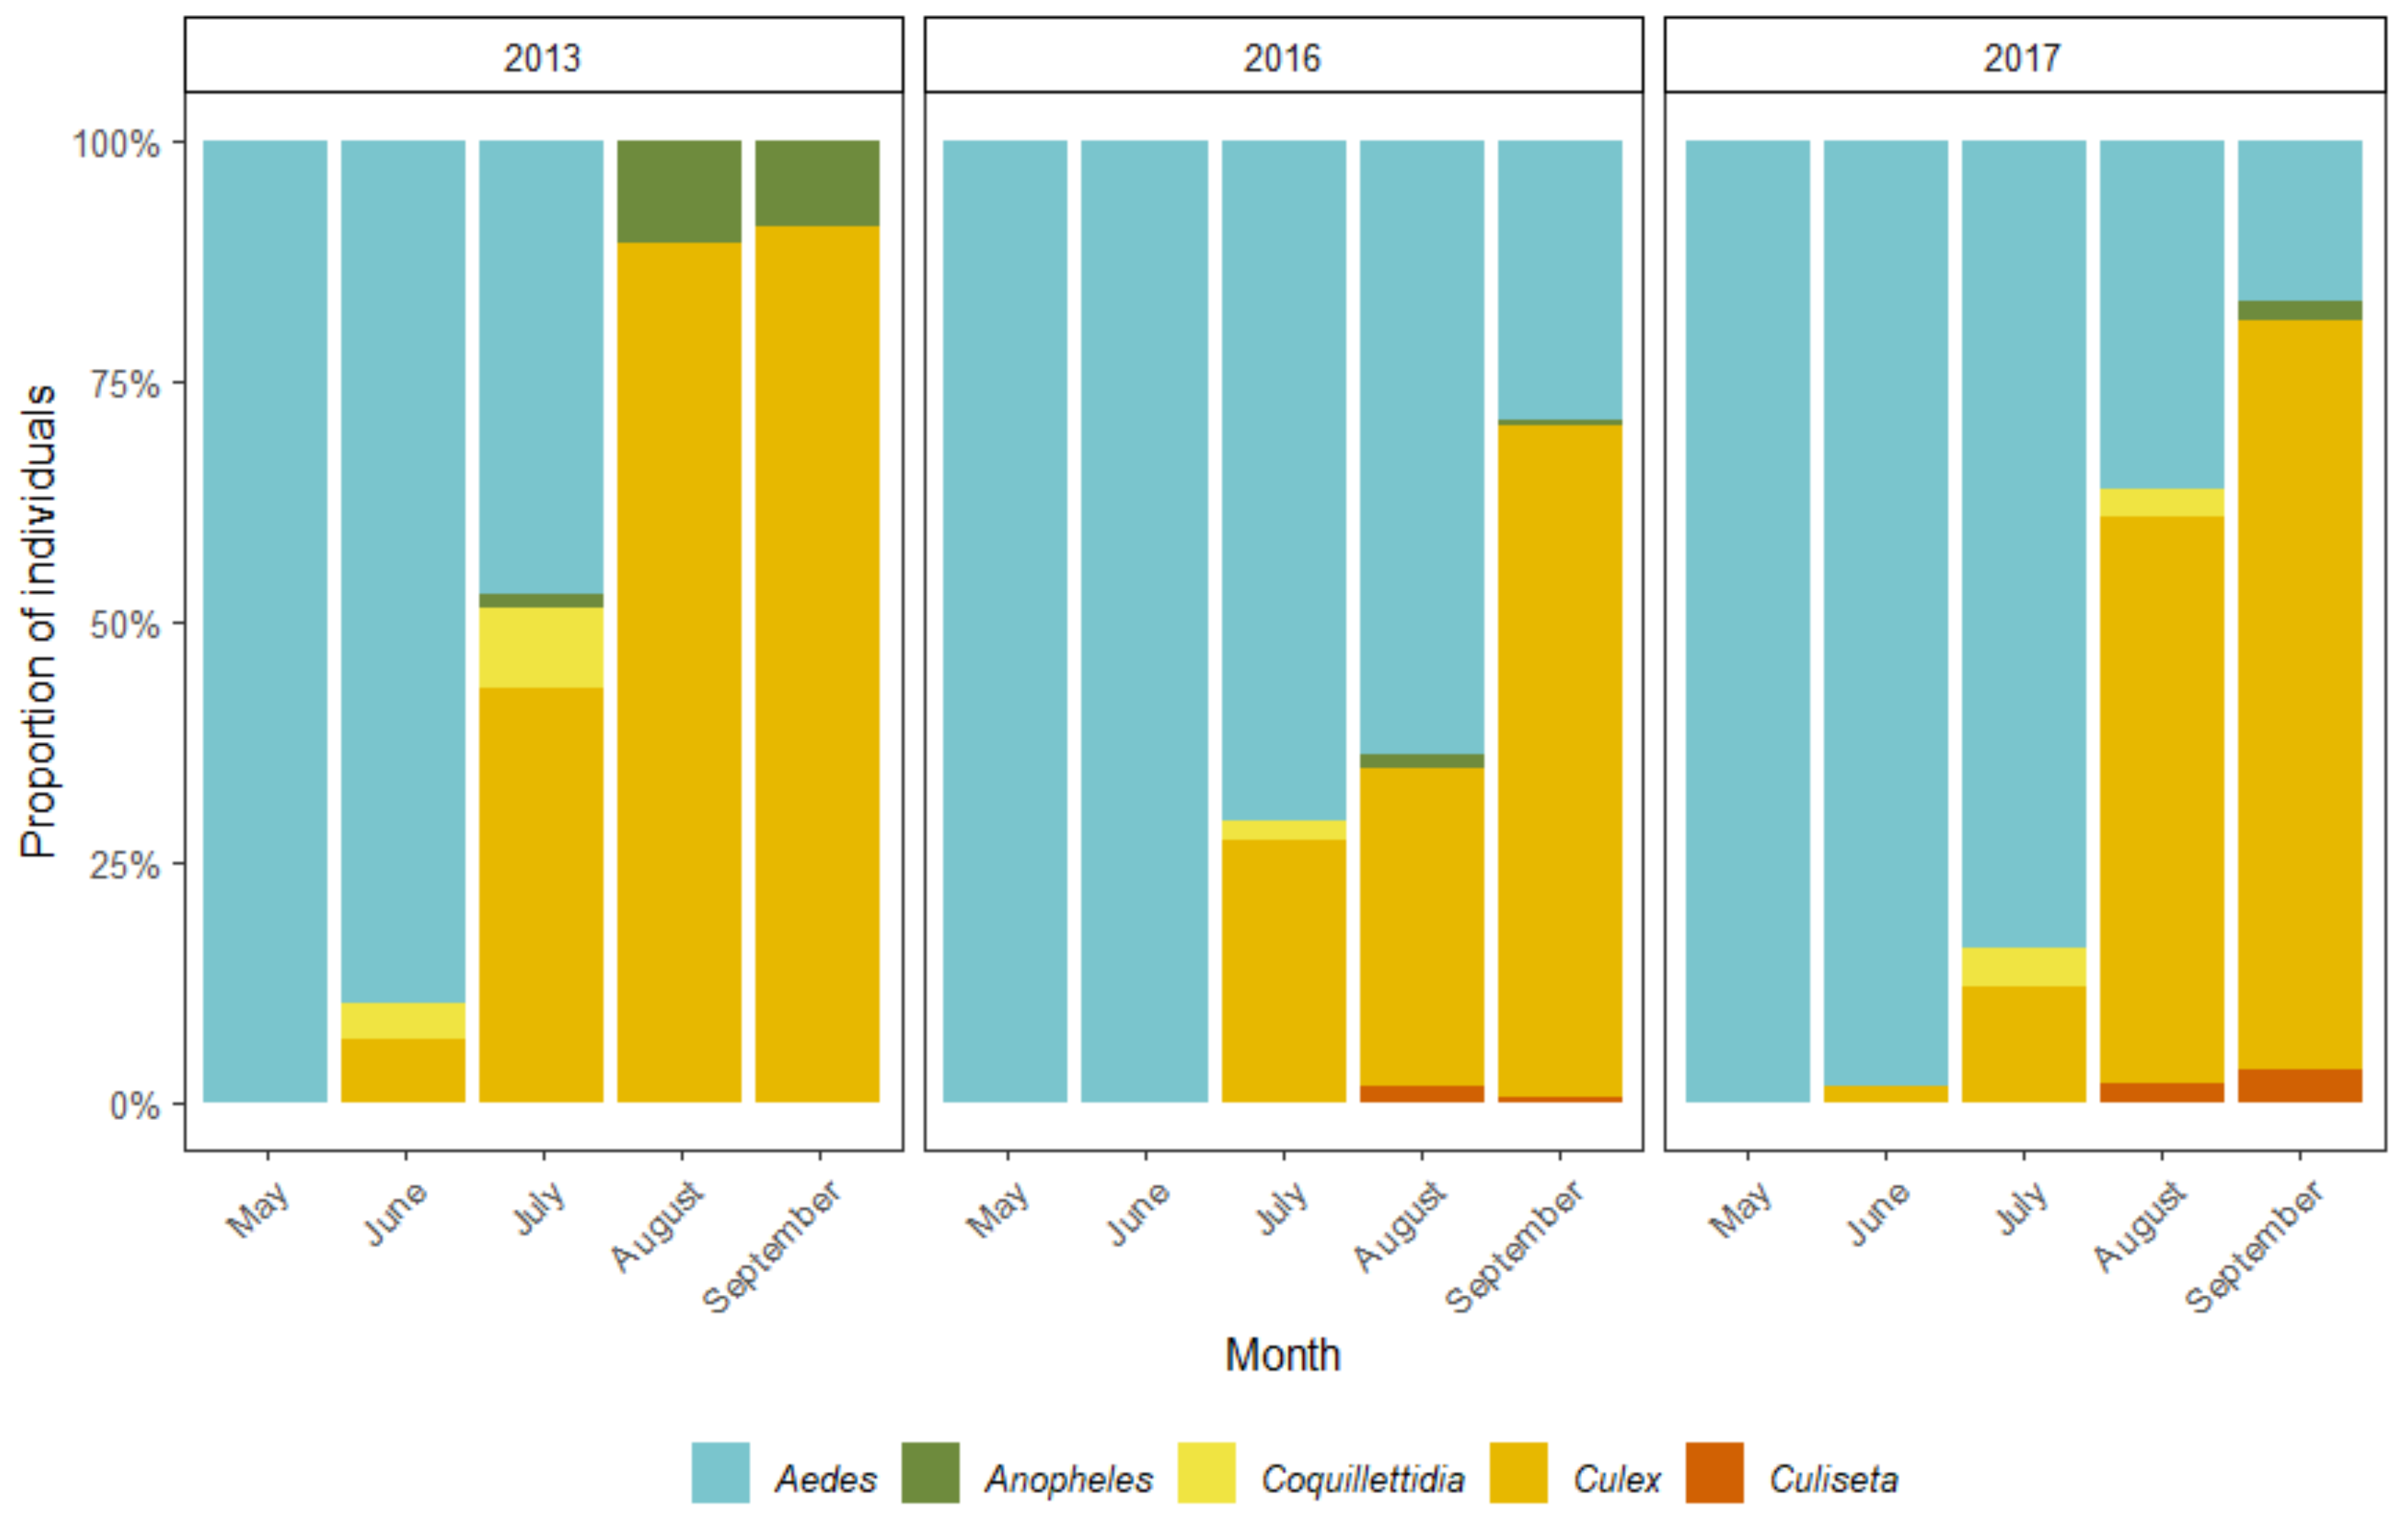
All in all, 20 different mosquito species and species groups from five genera (Aedes Meigen, 1818, Anopheles Meigen, 1818, Coquillettidia Dyar, 1904, Culex Linnaeus, 1758 and Culiseta Felt, 1904) were collected during the study period—14 species in 2013 and 17 in both 2016 as well as 2017. There are thought to be about 32 mosquito species in Estonia [55]. Culex (Culex) pipiens Linnaeus, 1758 together with Cx. (Culex) torrentium Martini, 1925 were the most collected mosquitoes during all three study years. However, the abundance of other common species varied dramatically from year to year (Table 3). Furthermore, the dominant species changed within each study year as the warm season progressed (Figure 6). In 2013, the species or species group most commonly collected in May was Ae. communis (de Geer, 1776), and in June Ae. annulipes group. Cx. pipiens/ Cx. torrentium were dominant throughout the remaining warm season. On the other hand, the years 2016 and 2017 were similar to each other. In both years Ae. (Ochlerotatus) punctor (Kirby, 1837) together with Ae. (Ochlerotatus) punctodes (Dyar, 1922) and Ae. annulipes group dominated in May and June, respectively. Cx. pipiens/Cx. torrentium group as well as the Ae. cinereus/Ae. geminus group were most numerous in July and August. As expected, Cx. pipiens/Cx. torrentium were the predominant individuals in September.
4. Discussion
The chosen collection method only allowed to capture a relatively small sample, 1890 individuals, of the local mosquito population, but this was sufficient to illustrate how different environmental factors influence the quantity and diversity of active mosquitoes in urban green spaces. Results show that both the mean number of collected mosquitoes as well as the average effective number of species decreased significantly from 2013 to 2017, while the number of recorded species actually increased. There have been no coordinated mosquito control efforts in Tartu, therefore the differences in abundance and variety are probably due to changes in annual weather patterns. Furthermore, it is likely that the town environment further amplified the effects of some of these atmospheric conditions.
Temperature, precipitation and humidity are considered to be the most important weather factors influencing mosquito abundance [5]. Additionally, these aspects are not only important during the warm season: weather conditions during winter and early spring can also have a profound effect on bloodsucking insects. For example, many of the spring mosquito species rely on snowmelt pools or flood waters for the development of the new generation and therefore require snowy winters [37]. In fact, this is the most likely explanation for why fieldwork in May 2013 yielded so many more mosquitoes on average compared to 2016 and 2017. According to the Estonian Weather Service, snow could be found everywhere in Estonia during the first three months of 2013, and the snow cover finally completely disappeared by the end of April, resulting in routine flooding [56]. On the other hand, snow conditions were less stable during the first months of 2016, with the snow partially melting many times during January, February and March, then finally disappearing at the beginning of April [57]. January and February of 2017 were especially warm and snow could only form thin layers on the ground, similar pattern continued in March with the snow cover melting and reforming many times until the end of the month [58]. Due to the absence of snow at the end of April during the last two study years, there was likely less floodwater available for the mosquito larvae that depend on it. Moreover, the mean temperature and the amount of rainfall in May also differed substantially from 2013 to 2017. May in 2013 was warm (mean temperature 2.9 °C higher than normal) as well as rainy (mean precipitation 22 mm higher than normal), while 2016 was warm (mean temperature 2.7 °C higher than normal) but dry (mean precipitation 24 mm less than normal) and 2017 was cool (mean temperature 1.1 °C colder compared to normal) as well as dry (mean precipitation 27 mm less than normal) [56,57,58]. Both winter snow cover as well as weather conditions in May likely played a significant role in the decrease of spring and early summer mosquitoes from 2013 to 2017. Furthermore, it has been previously reported, that the mean relative humidity in May can strongly influence the insect abundance throughout the rest of the warm season [30]. It is clear that mosquitoes started off with high abundance in 2013, but the number of individuals noticeably decreased over the rest of the warm season. However, the number of mosquitoes caught during collection events followed the complete opposite trajectory in 2016, when September yielded the most specimens. Furthermore, the 2017 study year proved the most variable as the number of collected mosquitoes was similarly low in May but also noticeably dropped in August. All this indicates that the variations in local weather conditions between years and months play an important role in the number of actively flying mosquitoes.
Undoubtedly, air temperature is an important factor in determining the development speed of mosquito larvae and air temperature often correlated with the number of mosquitoes collected during the three years of this study. However, warmer temperatures were somewhat surprisingly often associated with fewer captured mosquitoes. This could be explained by the negative correlation between temperature and relative humidity. Mosquitoes are relatively delicate insects and risk drying out in direct sunlight and low humidity conditions. Therefore it is not surprising that high relative humidity is positively correlated with higher numbers of active mosquitoes [59]. At the same time, urban environments have been shown to have lower relative humidity and higher temperature values than the surrounding areas [17,60]. This most likely means that the collection sites were in reality even warmer and drier than what the closest weather station measured. However, there were also exceptions to the general trend, when the relationship between temperature and the number of collected mosquitoes could not be explained by the level of relative humidity. Regrettably, this study fails to offer an alternative explanation to these cases. Finally, there was also a statistically important positive correlation between temperature and the number of active mosquitoes during September 2013, likely because temperatures had dropped below +5 °C, which had a noticeable negative impact on collection success. All of this taken together means that the first hypotheses postulated in this study is not completely correct. While both higher temperature and humidity values are favorable for mosquitoes, there can be a negative correlation between the two factors.
Wind conditions were also shown to affect mosquitoes and the second hypotheses of this study was proven correct. Stronger winds had a predictably negative correlation with the average number of individuals collected during fieldwork. Although moderate wind speeds can be helpful to mosquitoes by facilitating long distance dispersal and by carrying host scent further down-wind, many mosquito species have trouble flying in windy conditions [37,61,62]. For example, strong winds have been proposed to be the main reason why mosquitoes avoid inhabiting urban green roofs [33]. It should be noted that there was no significant interaction between wind speed and collection site in the current study, indicating that none of the sites were more protected from the wind than others. All in all, it could be advantageous to take wind conditions into consideration when deigning urban green spaces, in order to avoid creating areas which could become too shielded from the wind and facilitate mosquito biting activity.
Collecting mosquitoes with an insect net made it possible to capture both female and male individuals. Although only female mosquitoes require blood and thus act as disease vectors and pests, a better understanding of the male population is also necessary for the development of effective mosquito control measures [63]. Predictably, female mosquitoes were collected more often than males: Although many species exhibit a 1:1 sex ratio and some are even male biased [64], female mosquitoes were likely attracted to the person conducting fieldwork, while males were caught more randomly. However, there was also an interaction between mosquito gender and month. More male mosquitoes were collected in the last two months of the study period compared to May and this change was not paralleled by females. This could be explained in part because Cx. pipiens females, one of the most numerous species in August and September, do not usually take a blood meal before overwintering [37] and thus were less likely to be drawn to the fieldworker. On the other hand, it seems that yearly weather changes influence both genders similarly as there was no statistically significant interaction between mosquito gender and collection year. All in all, hypotheses number three of this study was not proven correct. Although the sex ratio of the collected mosquitoes varied over the fieldwork period, these differences were better explained by other factors than weather fluctuations during the warm season.
Some collection sites yielded significantly more mosquitoes on average than the reference site A. Out of the six spots that were visited during all of the collection years, more mosquitoes were caught at sites 1 and 6. Yet, this result cannot be explained by the factors accounted for in this study. There was no discernable interaction between collection sites and wind. Neither do sites 1 and 6 noticeably differ from the others in the availability of mosquito breeding sites. Furthermore, sites C, D, E, F, G and H also yielded significantly more mosquitoes on average compared to the reference site. However, care should be taken when comparing sites A through H to sites 1 to 7, as these were collected from by different people and collector bias cannot be excluded. Finally, there are also landscape factors that can influence mosquito abundance and help explain the variation between collection sites [32], but these are outside the scope of this study.
The average effective number of species (ENS) was only significantly different between 2013 and 2017, with the fieldwork results of the later year displaying less species diversity. This was most likely due to the 2017 study year yielding fewer collected mosquitoes in general and normally rare species were even less likely to be caught. This was further reflected in fact that the collection sites E, F, H, 1 and 6, which had some of the best mosquito yields on average, were also the ones with the highest mean ENS results. Although, there were some differences: sites G and D did not appear to have a statistically significant effect on ENS, but exhibited a larger positive effect on the average number of collected mosquitoes than sites 1 and 6. Hence, there likely is some variation in species diversity between the collection sites that cannot be explained by a larger number of sampled individuals.
Species succession throughout the warm season follows predictable patterns. Ae. communis, Ae. intrudens and Ae. punctor/Ae. punctodes are snowmelt mosquitoes able to tolerate colder conditions [37] and thus were understandably most numerous in May. Interestingly, while Ae. communis and Ae. intrudens was exceedingly numerous in 2013, they were much less prominent in the later study years. Ae. intrudens in particular was almost absent in 2017. While the number of collected Ae. punctor/Ae. punctodes individuals also fell during 2016 and 2017, the change was much less dramatic. Mosquitoes from the Ae. annulipes group and Ae. cinereus/Ae. geminus also appeared during the beginning of the warm season, overtaking snowmelt mosquitoes as the most numerous species in June and July, with some variation between the years. Individuals of the Ae. annulipes group could be found from May to August but were most numerous in June. However, in 2013 the largest number of Ae. cinereus/Ae. geminus mosquitoes were collected in May, but no individuals from these species could be found in August or September. On the other hand, in the later study years Ae. cinereus/Ae. geminus were much more numerous during the summer months and could still be collected throughout September. Ae. cinereus and Ae. geminus are thought to prefer semi-permanent water features, but also require warmer temperatures than the snowmelt mosquitoes [37]. Therefore, May being both warm and rainy in 2013 most likely explains why these species were active early in the season at the time, but suitable breeding sites likely dried up over the summer. Cx. pipiens and Cx. torrentium were the most enduringly abundant species during the study period: every year first individuals started appearing at the beginning of summer and became dominant in September. Other various species were caught in low numbers, mostly over the summer months. All in all, it appears that the fourth hypothesis of this study was proven correct: the synanthropic species Cx. pipiens was abundant during every year of the study, while a few other species were dominant in some years but not others. Additionally, the 20 species collected in this study constitute about 62.5% of the overall mosquito richness in Estonia. Compared to the Estonian checklist, which was compiled in 1955 [65] and updated in 2014 [55], the urban mosquito fauna of Tartu is missing halophilic species as well as some species from the genera Culiseta. Some of the rarer Aedes species of Estonia were also not collected during this study. Still, the relatively high level of collected species indicates that the urban green spaces of Tartu encompass various microhabitats able to support both synanthropic and sylvan mosquitoes. Such environmental variety is commendable from a general biodiversity perspective but may also imply that it is more likely for future invasive mosquito species to become locally established.
Furthermore, the species most numerous in Tartu are all known disease vectors. For example, prior studies have identified Cx. pipiens and/or Cx. torrentium individuals infected with the West Nile virus [66,67], Ockelbo virus [68], Usutu virus [69], Borrelia (B.) garinii [70], Francisella (F.) tularensis [71], Dirofilaria (D.) repens and D. immitis [72,73]. Moreover, Cx. pipiens s.l. can play a key role in transferring pathogens between birds and humans [74]. Ae. cinereus mosquitoes have been associated with the Jamestown Canyon virus [75], Ockelbo virus [68], both B. afzelii and B. garinii [70], F. tularensis [71] as well as D. repens and D. immitis [76,77]. Lastly, the different species of the Ae. annulipes group have also been previously indicated in the transmission of F. tularensis [71] and D. repens [77].
Future work could sample both urban and rural habitats for comparison. Furthermore, establishing collection points in private yards would permit the use of stationary passive insect traps without losing the ability to collect male mosquitoes. These measures would give a more granular overview of how various conditions influence the changes in mosquito abundance and diversity.
5. Conclusions
The numbers of active mosquitoes inhabiting urban green spaces in the town of Tartu are greatly influenced by the variations in yearly weather patterns. The mean number of collected mosquitoes sharply declined between 2013 and 2017. This could have been in large part because of the winter snow conditions and the meteorological character of the end of spring, as May 2013 was set apart of the other study years by an abundance of snowmelt water as well as a warm and rainy weather. The number of active mosquitoes was also influenced by temperature, humidity and wind. Importantly, there was an apparent negative correlation between temperature and humidity, something that the urban environment most likely further enforced. This means that higher temperatures in the urban environments of the boreal biome may in some cases actually result in fewer active mosquitoes. Furthermore, stronger winds also decreased the number of collected mosquitoes. This is something that could be taken into account when planning for new urban parks with less mosquito biting activity. On the other hand, the diversity index of the collected mosquitoes, represented by the effective number of species (ENS), also declined from 2013 to 2017. This was most likely in part a side effect of the general degrease in the mean number of collected mosquitoes. All in all, Cx. pipiens together with Cx. torrentium remained the most abundant mosquito species throughout the three study years. Other dominant species tended to vary between the years. Worryingly, the most numerous species collected in this study are all capable of carrying several pathogens. In the light of ongoing anthropogenically driven environmental changes, the surveillance of mosquitoes as well as vector-borne pathogens is becoming increasingly necessary in colder climate zones.
Author Contributions
Conceptualization, O.K. and V.B.; methodology, O.K. and V.B.; formal analysis, H.K. and L.T.; investigation, V.B., H.K. and O.K.; resources, O.K.; data curation, V.B. and H.K.; writing—original draft preparation, H.K.; writing—review and editing, H.K., O.K., L.T. and V.B.; visualization, H.K.; supervision, O.K. and L.T.; project administration, O.K.; funding acquisition, O.K. All authors have read and agreed to the published version of the manuscript.
Funding
This research was made possible by the Strategic Development Fund of the Estonian University of Life Sciences grant M14143VLVP and by the Estonian Research Council project IUT21-1. The funding bodies had no influence over study design, fieldwork, data analyzes, interpretation or manuscript preparations.
Data Availability Statement
The data presented in this study is openly available in FigShare at DOI: 10.6084/m9.figshare.14198951 (accessed on 12 March 2021). The dataset can also be obtained from the corresponding author.
Acknowledgments
The authors would like to thank T. Kesküla, who generously helped in the mosquito collection effort. The authors are also immensely grateful to A. Kaasik, N. Nazarenko and T. Tammaru for their valuable advice regarding statistical analyses as well as to Elis Tiidu for manuscript corrections. The authors are also indebted to the anonymous reviewers, who provided insightful comments as well as encouragement.
Conflicts of Interest
The authors declare no conflict of interest. The funders had no role in the design of the study; in the collection, analyses, or interpretation of data; in the writing of the manuscript, or in the decision to publish the results.
References
- Harbach, R.E. Mosquito Taxonomic Inventory. Available online: http://mosquito-taxonomic-inventory.info/ (accessed on 13 October 2020).
- Cornel, A.J.; Mayi, M.P.A.; Kowo, C.; Foncha, D.; Andongma, E.; Anong, D.N.; Elad, M.; Djomo, C.; Tchuinkam, T.; Brisco, K.K.; et al. New species of Culex (Culiciomyia) (Diptera: Culicidae) from Talangaye Forest in Cameroon and descriptions and identification keys for males of the Afrotropical species of the subgenus. Zootaxa 2020, 4858, 451–506. [Google Scholar] [CrossRef]
- WHO. A Global Brief on Vector-Borne Diseases; WHO: Geneva, Switzerland, 2014. [Google Scholar]
- WHO. Global Vector Control Response 2017–2030; WHO: Geneva, Switzerland, 2017. [Google Scholar]
- Franklinos, L.H.V.; Jones, K.E.; Redding, D.W.; Abubakar, I. The effect of global change on mosquito-borne disease. Lancet Infect. Dis. 2019, 19, 302–312. [Google Scholar] [CrossRef]
- Dhiman, R.C.; Singh, P. Climate change and vector-borne diseases in the urban ecosystem in India. In Climate Change Impacts on Urban Pests; Dhang, P., Ed.; CABI: Oxfordshire, UK, 2017; pp. 1–189. [Google Scholar]
- Brugueras, S.; Fernández-Martínez, B.; Martínez-de la Puente, J.; Figuerola, J.; Porro, T.M.; Rius, C.; Larrauri, A.; Gómez-Barroso, D. Environmental drivers, climate change and emergent diseases transmitted by mosquitoes and their vectors in southern Europe: A systematic review. Environ. Res. 2020, 191, 1–17. [Google Scholar] [CrossRef]
- Lefèvre, T.; Vantaux, A.; Dabiré, K.R.; Mouline, K.; Cohuet, A. Non-genetic determinants of mosquito competence for malaria parasites. PLoS Pathog 2013, 9, e1003365. [Google Scholar] [CrossRef]
- Tolle, M.A. Mosquito-borne diseases. Curr. Probl. Pediatr. Adolesc. Health Care 2009, 39, 97–140. [Google Scholar] [CrossRef]
- Weaver, S.C. Prediction and prevention of urban arbovirus epidemics: A challenge for the global virology community. Antivir. Res. 2018, 156, 80–84. [Google Scholar] [CrossRef]
- Rose, N.H.; Sylla, M.; Badolo, A.; Lutomiah, J.; Ayala, D.; Aribodor, O.B.; Ibe, N.; Akorli, J.; Otoo, S.; Mutebi, J.P.; et al. Climate and urbanization drive mosquito preference for humans. Curr. Biol. 2020, 30, 3570–3579. [Google Scholar] [CrossRef]
- Adams, B.J.; Li, E.; Bahlai, C.A.; Meineke, E.K.; McGlynn, T.P.; Brown, B.V. Local- and landscape-scale variables shape insect diversity in an urban biodiversity hot spot. Ecol. Appl. 2020, 30, 1–14. [Google Scholar] [CrossRef] [Green Version]
- Faeth, S.H.; Bang, C.; Saari, S. Urban biodiversity: Patterns and mechanisms. Ann. N. Y. Acad. Sci. 2011, 1223, 69–81. [Google Scholar] [CrossRef] [Green Version]
- Chaves, L.F.; Hamer, G.L.; Walker, E.D.; Brown, W.M.; Ruiz, M.O.; Kitron, U.D. Climatic variability and landscape heterogeneity impact urban mosquito diversity and vector abundance and infection. Ecosphere 2011, 2, 1–21. [Google Scholar] [CrossRef]
- Oke, T.R. City size and the urban heat island. Atmos. Environ. 1973, 7, 769–779. [Google Scholar] [CrossRef]
- Watkins, R.; Palmer, J.; Kolokotroni, M. Increased temperature and intensification of the urban heat island: Implications for human comfort and urban design. Built Environ. 2007, 33, 85–96. [Google Scholar] [CrossRef]
- Fukui, E. Increasing temperature due to the expansion of urban areas in Japan. J. Meteorol. Soc. Jpn. Ser. II 1957, 35A, 336–341. [Google Scholar] [CrossRef] [Green Version]
- McIntyre, N.E. Ecology of urban arthropods: A review and a call to action. Ann. Entomol. Soc. Am. 2000, 93, 825–835. [Google Scholar] [CrossRef]
- Youngsteadt, E.; Ernst, A.F.; Dunn, R.R.; Frank, S.D. Responses of arthropod populations to warming depend on latitude: Evidence from urban heat islands. Glob. Chang. Biol. 2017, 23, 1436–1447. [Google Scholar] [CrossRef] [PubMed]
- Semenza, J.C.; Suk, J.E. Vector-borne diseases and climate change: A European perspective. FEMS Microbiol. Lett. 2018, 365, fnx244. [Google Scholar] [CrossRef]
- Câmara, D.C.P.; Pinel, C.D.S.; Rocha, G.P.; Codeço, C.T.; Honório, N.A. Diversity of mosquito (Diptera: Culicidae) vectors in a heterogeneous landscape endemic for arboviruses. Acta Trop. 2020, 212, 105715. [Google Scholar] [CrossRef]
- Medeiros-Sousa, A.R.; Ceretti-Junior, W.; de Carvalho, G.C.; Nardi, M.S.; Araujo, A.B.; Vendrami, D.P.; Marrelli, M.T. Diversity and abundance of mosquitoes (Diptera: Culicidae) in an urban park: Larval habitats and temporal variation. Acta Trop. 2015, 150, 200–209. [Google Scholar] [CrossRef]
- Barredo, E.; DeGennaro, M. Not just from blood: Mosquito nutrient acquisition from nectar sources. Trends Parasitol. 2020, 36, 473–484. [Google Scholar] [CrossRef] [Green Version]
- Lõhmus, M.; Balbus, J. Making green infrastructure healthier infrastructure. Infect. Ecol. Epidemiol. 2015, 5, 1–12. [Google Scholar] [CrossRef]
- Pickett, S.T.A.; Cadenasso, M.L.; Childers, D.L.; Mcdonnell, M.J.; Zhou, W. Evolution and future of urban ecological science: Ecology in, of, and for the city. Ecosyst. Health Sustain. 2016, 2, e01229. [Google Scholar] [CrossRef]
- Szepesszentgyörgyi, Á.; Rentsendorj, O. Seasonal changes in the mosquito fauna (Diptera, Culicidae) in the city of Szeged in 1999. Tiscia 2006, 35, 33–39. [Google Scholar]
- Sengil, A.Z.; Akkaya, H.; Gonenc, M.; Gonenc, D.; Ozkan, D. Species composition and monthly distribution of mosquito (Culicidae) larvae in the Istanbul metropolitan area, Turkey. Int. J. Biol. Med. Res. 2011, 2, 415–424. [Google Scholar]
- Hoshi, T.; Imanishi, N.; Higa, Y.; Chaves, L.F. Mosquito biodiversity patterns around urban environments in south-central Okinawa island, Japan. J. Am. Mosq. Control. Assoc. 2014, 30, 260–267. [Google Scholar] [CrossRef] [PubMed] [Green Version]
- Paras, K.L.; O’Brien, V.A.; Reiskind, M.H. Comparison of the vector potential of different mosquito species for the transmission of heartworm, Dirofilaria immitis, in rural and urban areas in and surrounding Stillwater, Oklahoma, U.S.A. Med. Vet. Entomol. 2014, 28, 60–67. [Google Scholar] [CrossRef] [PubMed]
- Carrieri, M.; Fariselli, P.; MacCagnani, B.; Angelini, P.; Calzolari, M.; Bellini, R. Weather factors influencing the population dynamics of Culex pipiens (Diptera: Culicidae) in the Po Plain Valley, Italy (1997–2011). Environ. Entomol. 2014, 43, 482–490. [Google Scholar] [CrossRef] [PubMed] [Green Version]
- Heinisch, M.R.S.; Diaz-Quijano, F.A.; Chiaravalloti-Neto, F.; Menezes Pancetti, F.G.; Rocha Coelho, R.; dos Santos Andrade, P.; Urbinatti, P.R.; de Almeida, R.M.M.S.; Lima-Camara, T.N. Seasonal and spatial distribution of Aedes aegypti and Aedes albopictus in a municipal urban park in São Paulo, SP, Brazil. Acta Trop. 2019, 189, 104–113. [Google Scholar] [CrossRef] [PubMed]
- Zhao, J.; Tang, T.; Wang, X. Effects of landscape composition on mosquito population in urban green spaces. Urban. For. Urban. Green. 2020, 49, 126626. [Google Scholar] [CrossRef]
- Wong, G.K.L.; Jim, C.Y. Urban-microclimate effect on vector mosquito abundance of tropical green roofs. Build. Environ. 2017, 112, 63–76. [Google Scholar] [CrossRef]
- Weterings, R.; Umponstira, C.; Buckley, H.L. Container-breeding mosquitoes and predator community dynamics along an urban-forest gradient: The effects of habitat type and isolation. Basic Appl. Ecol. 2014, 15, 486–495. [Google Scholar] [CrossRef] [Green Version]
- Thompson, D.R.; de la Torre Juárez, M.; Barker, C.M.; Holeman, J.; Lundeen, S.; Mulligan, S.; Painter, T.H.; Podest, E.; Seidel, F.C.; Ustinov, E. Airborne imaging spectroscopy to monitor urban mosquito microhabitats. Remote Sens. Environ. 2013, 137, 226–233. [Google Scholar] [CrossRef]
- Hendy, A.; Hernandez-Acosta, E.; Chaves, B.A.; Fé, N.F.; Valério, D.; Mendonça, C.; de Lacerda, M.V.G.; Buenemann, M.; Vasilakis, N.; Hanley, K.A. Into the woods: Changes in mosquito community composition and presence of key vectors at increasing distances from the urban edge in urban forest parks in Manaus, Brazil. Acta Trop. 2020, 206, 105441. [Google Scholar] [CrossRef]
- Becker, N.; Petric, D.; Zgomba, M.; Boase, C.; Madon, M.; Dahl, C.; Kaiser, A. Mosquitoes and Their Control, 2nd ed.; Springer: Heidelberg, Germany, 2010. [Google Scholar]
- Trewartha, G.T. An Introduction to Climate, 3rd ed.; McGraw-Hill Book Company: New York, NY, USA, 1980. [Google Scholar]
- Belda, M.; Holtanová, E.; Halenka, T.; Kalvová, J. Climate classification revisited: From Köppen to Trewartha. Clim. Res. 2014, 59, 1–13. [Google Scholar] [CrossRef] [Green Version]
- European Union. Commission Implementing Decision (EU) 2020/494 of 24 March 2020 adopting the thirteenth update of the list of sites of Community importance for the Boreal biogeographical region (notified under document C(2020) 1713). Off. J. Eur. Union 2020, 63, 1–175. [Google Scholar]
- Statistics Estonia Tartu City. Available online: https://www.stat.ee/en/find-statistics/statistics-region/tartu-county/tartu-city (accessed on 27 October 2020).
- Maikov, K. Landscape characteristics in Tartu City Parks: User influences through design. WIT Trans. Ecol. Environ. 2013, 179, 353–364. [Google Scholar]
- Raud, M.; Mitt, M.; Oja, T.; Olt, J.; Orupõld, K.; Kikas, T. The utilisation potential of urban greening waste: Tartu case study. Urban For. Urban Green. 2017, 21, 96–101. [Google Scholar] [CrossRef]
- Silver, J.B. Mosquito Ecology: Field Sampling Methods, 3rd ed.; Springer: Dordrecht, The Netherlands, 2008. [Google Scholar]
- Shannon, C.E. A mathematical theory of communication. Bell Syst. Tech. J. 1948, 27, 379–423. [Google Scholar] [CrossRef] [Green Version]
- Chao, A.; Chiu, C.-H.; Jost, L. Phylogenetic diversity measures and their decomposition a framework based on Hill numbers. In Biodiversity Conservation and Phylogenetic Systematics; Pellens, R., Grandcolas, P., Eds.; Springer International Publishing: Cham, Switzerland, 2016; pp. 141–172. [Google Scholar]
- R Core Team. R: A Language and Environment for Statistical Computing; R Foundation for Statistical Computing: Vienna, Austria, 2019. [Google Scholar]
- Revelle, W. Psych: Procedures for Psychological, Psychometric, and Personality Research. Available online: https://cran.r-project.org/web/packages/psych/index.html/ (accessed on 2 November 2020).
- Venables, W.; Ripley, B.D. Modern Applied Statistics with S, 4th ed.; Springer: New York, NY, USA, 2002. [Google Scholar]
- Hartig, F. DHARMa: Residual Diagnostics for Hierarchical (Multi-Level/Mixed) Regression Models. Available online: https://cran.r-project.org/web/packages/DHARMa/vignettes/DHARMa.html (accessed on 2 November 2020).
- Lüdecke, D.; Makowski, D.; Waggoner, P.; Patil, I. Performance: Assessment of Regression Models Performance. Available online: https://rdrr.io/cran/performance/ (accessed on 2 November 2020).
- Imdad, M.U.; Aslam, M. Mctest: Multicollinearity Diagnostic Measures. Available online: https://cran.r-project.org/web/packages/mctest/mctest.pdf (accessed on 2 November 2020).
- Imdad, M.U.; Aslam, M.; Altaf, S. mctest: An R package for detection of collinearity among regressors. R J. 2016, 8, 495–505. [Google Scholar]
- Wickham, H. Ggplot2: Elegant Graphics for Data Analysis, 1st ed.; Springer: New York, NY, USA, 2016. [Google Scholar]
- Burtin, V. Pistesääsklaste (Diptera: Culicidae) Liigiline Koosseis ja Elupaigaeelistused Tartu Linnas [Mosquito (Diptera: Culicidae) Species Richness and Habitat Preference in the Town of Tartu]; Estonian University of Life Sciences: Tartu, Estonia, 2014. [Google Scholar]
- Kallis, A.; Loodla, K.; Tillmann, E.; Krabbi, M.; Juust, E.; Pärg, R.; Jõeveer, A.; Šišova, V.; Pärnpuu, P. Eesti Meteoroloogia Aastaraamat 2013 [Meteorological Yearbook of Estonia 2013]; Keskkonnaagentuur: Tallinn, Estonia, 2014. [Google Scholar]
- Loodla, K.; Tillmann, E.; Kallis, A.; Pärg, R.; Vint, K.; Juust, E.; Krabbi, M. Eesti Meteoroloogia Aastaraamat 2016 [Meteorological Yearbook of Estonia 2016]; Keskkonnaagentuur: Tallinn, Estonia, 2017. [Google Scholar]
- Loodla, K.; Tillmann, E.; Kallis, A.; Pärg, R.; Vint, K.; Juust, E.; Krabbi, M. Eesti Meteoroloogia Aastaraamat 2017 [Meteorological Yearbook of Estonia 2017]; Keskkonnaagentuur: Tallinn, Estonia, 2018. [Google Scholar]
- Lebl, K.; Brugger, K.; Rubel, F. Predicting Culex pipiens/restuans population dynamics by interval lagged weather data. Parasites Vectors 2013, 6, 129. [Google Scholar] [CrossRef] [Green Version]
- Araujo, R.V.; Albertini, M.R.; Costa-da-Silva, A.L.; Suesdek, L.; Franceschi, N.C.S.; Bastos, N.M.; Katz, G.; Cardoso, V.A.; Castro, B.C.; Capurro, M.L.; et al. São Paulo urban heat islands have a higher incidence of dengue than other urban areas. Braz. J. Infect. Dis. 2015, 19, 146–155. [Google Scholar] [CrossRef] [Green Version]
- Dufourd, C.; Dumont, Y. Impact of environmental factors on mosquito dispersal in the prospect of sterile insect technique control. Comput. Math. Appl. 2013, 66, 1695–1715. [Google Scholar] [CrossRef]
- Endo, N.; Eltahir, E.A.B. Prevention of malaria transmission around reservoirs: An observational and modelling study on the effect of wind direction and village location. Lancet Planet. Health 2018, 2, 406–413. [Google Scholar] [CrossRef]
- Lees, R.S.; Knols, B.; Bellini, R.; Benedict, M.Q.; Bheecarry, A.; Bossin, H.C.; Chadee, D.D.; Charlwood, J.; Dabiré, R.K.; Djogbenou, L.; et al. Review: Improving our knowledge of male mosquito biology in relation to genetic control programmes. Acta Trop. 2014, 132, S2–S11. [Google Scholar] [CrossRef] [PubMed]
- Lounibos, L.P.; Escher, R.L. Sex ratios of mosquitoes from long-term censuses of florida tree holes. J. Am. Mosq. Control. Assoc. 2008, 24, 11–15. [Google Scholar] [CrossRef]
- Remm, H. Eesti NSV Verdimevate Kahetiivaliste Fauna [Diptera Fauna of Estonian SSR]; Tartu State University: Tartu, Estonia, 1955; Available online: https://dspace.ut.ee/handle/10062/71418 (accessed on 2 November 2020).
- Mavridis, K.; Fotakis, E.A.; Kioulos, I.; Mpellou, S.; Konstantas, S.; Varela, E.; Gewehr, S.; Diamantopoulos, V.; Vontas, J. Detection of West Nile Virus—Lineage 2 in Culex pipiens mosquitoes, associated with disease outbreak in Greece, 2017. Acta Trop. 2018, 182, 64–68. [Google Scholar] [CrossRef]
- Assaid, N.; Mousson, L.; Moutailler, S.; Arich, S.; Akarid, K.; Monier, M.; Beck, C.; Lecollinet, S.; Failloux, A.B.; Sarih, M. Evidence of circulation of West Nile virus in Culex pipiens mosquitoes and horses in Morocco. Acta Trop. 2020, 205, 105414. [Google Scholar] [CrossRef]
- Francy, D.B.; Jaenson, T.G.T.; Lundstrom, J.O.; Schildt, E.B.; Espmark, Å.; Henriksson, B.; Niklasson, B. Ecologic studies of mosquitoes and birds as hosts of Ockelbo virus in Sweden and isolation of Inkoo and Batai viruses from mosquitoes. Am. J. Trop. Med. Hyg. 1989, 41, 355–363. [Google Scholar] [CrossRef]
- Eiden, M.; Gil, P.; Ziegler, U.; Rakotoarivony, I.; Marie, A.; Frances, B.; L’Ambert, G.; Simonin, Y.; Foulongne, V.; Groschup, M.H.; et al. Emergence of two Usutu virus lineages in Culex pipiens mosquitoes in the Camargue, France, 2015. Infect. Genet. Evol. 2018, 61, 151–154. [Google Scholar] [CrossRef]
- Melaun, C.; Zotzmann, S.; Santaella, V.G.; Werblow, A.; Zumkowski-Xylander, H.; Kraiczy, P.; Klimpel, S. Occurrence of Borrelia burgdorferi s.l. in different genera of mosquitoes (Culicidae) in Central Europe. Ticks Tick-Borne Dis. 2016, 7, 256–263. [Google Scholar] [CrossRef] [PubMed]
- Thelaus, J.; Andersson, A.; Broman, T.; Bäckman, S.; Granberg, M.; Karlsson, L.; Kuoppa, K.; Larsson, E.; Lundmark, E.; Lundström, J.O.; et al. Francisella tularensis subspecies holarctica occurs in Swedish mosquitoes, persists through the developmental stages of laboratory-infected mosquitoes and is transmissible during blood feeding. Microb. Ecol. 2014, 67, 96–107. [Google Scholar] [CrossRef] [Green Version]
- Cancrini, G.; Scaramozzino, P.; Gabrielli, S.; Di Paolo, M.; Toma, L.; Romi, R. Aedes albopictus and Culex pipiens implicated as natural vectors of Dirofilaria repens in central Italy. J. Med. Entomol. 2007, 44, 1064–1066. [Google Scholar] [CrossRef]
- Șuleșco, T.; Volkova, T.; Yashkova, S.; Tomazatos, A.; von Thien, H.; Lühken, R.; Tannich, E. Detection of Dirofilaria repens and Dirofilaria immitis DNA in mosquitoes from Belarus. Parasitol. Res. 2016, 115, 3535–3541. [Google Scholar] [CrossRef] [PubMed]
- Farajollahi, A.; Fonseca, D.M.; Kramer, L.D.; Marm Kilpatrick, A. “Bird biting” mosquitoes and human disease: A review of the role of Culex pipiens complex mosquitoes in epidemiology. Infect. Genet. Evol. 2011, 11, 1577–1585. [Google Scholar] [CrossRef] [Green Version]
- Andreadis, T.G.; Anderson, J.F.; Armstrong, P.M.; Main, A.J. Isolations of Jamestown Canyon virus (Bunyaviridae: Orthobunyavirus) from field-collected mosquitoes (Diptera: Culicidae) in Connecticut, USA: A ten-year analysis, 1997–2006. Vector-Borne Zoonotic Dis. 2008, 8, 175–188. [Google Scholar] [CrossRef] [Green Version]
- Shaikevich, E.; Bogacheva, A.; Ganushkina, L. Dirofilaria and Wolbachia in mosquitoes (Diptera: Culicidae) in central European Russia and on the Black Sea coast. Parasite 2019, 26. [Google Scholar] [CrossRef] [Green Version]
- Kemenesi, G.; Kurucz, K.; Kepner, A.; Dallos, B.; Oldal, M.; Herczeg, R.; Vajdovics, P.; Bányai, K.; Jakab, F. Circulation of Dirofilaria repens, Setaria tundra, and Onchocercidae species in Hungary during the period 2011–2013. Vet. Parasitol. 2015, 214, 108–113. [Google Scholar] [CrossRef] [PubMed]
Figure 1.
Map showing the collection sites in Tartu and the location of Estonia. Sites 1, 2, 3, 4, 5 and 6 were used in 2013, 2016 and 2017. Site 7 was included in the study in 2016 and 2017. Sites A, B, C, D, E, F, G and H were added in 2017. Base map of Tartu: Estonian Land Board (https://xgis.maaamet.ee/xgis2/page/app/maainfo, accessed on 18 November 2020), 2019. Map of Europe: © MapTiler; © OpenStreetMap contributors (https://www.maptiler.com/, accessed on 18 November 2020).

Figure 2.
Average number of mosquitoes collected during the different months of the study period. Boxplots showing the median (dark line dividing the box), interquartile range (IQR) containing 50% of the data points (length of the box), upper and lower quartiles (whiskers) and outliers (gray dots). Y-axis has been transformed to a logarithmic scale for ease of viewing.

Figure 3.
Influence of temperature on the abundance of mosquitoes during different months. Y-axis has been transformed to a logarithmic scale for ease of viewing. Gray points represent fieldwork results. Linear regression lines are surrounded by gray areas representing 95% confidence intervals. Correlation statistics have been calculated using the non-parametric Kendall rank correlation. Significance: >0.05 = “ns”, 0.05 to 0.01 = “*”, 0.01 to 0.001 = “**”.

Figure 4.
Correlation between temperature and relative humidity. On many occasions higher temperatures correlated with lower relative humidity. Collection events are represented by gray dots, linear regression lines are surrounded by gray areas representing 95% confidence intervals. Correlation statistics have been calculated using the non-parametric Kendall rank correlation. Significance: >0.05 = “ns” 0.05 to 0.01 = “*”, 0.01 to 0.001 = “**”, <0.001 = “***”.

Figure 5.
Average effective no. of species (ENS) of each collection site throughout the three study years. Boxplots showing the median (dark line dividing the box), interquartile range (IQR) containing 50% of the data points (length of the box), upper and lower quartiles (whiskers) and outliers (gray dots).

Figure 6.
The succession of mosquitoes from different genera over the study period. The percentage of mosquitoes from five different genera collected in 2013, 2016 and 2017, showing the transition from Aedes to Culex dominated populations during the warm months.
Figure 6.
The succession of mosquitoes from different genera over the study period. The percentage of mosquitoes from five different genera collected in 2013, 2016 and 2017, showing the transition from Aedes to Culex dominated populations during the warm months.


Table 1.
Generalized linear model (GLM) results showing how independent variables influence the number of collected mosquitoes.
Table 1.
Generalized linear model (GLM) results showing how independent variables influence the number of collected mosquitoes.
| Explanatory Variables | β | ±SE | Cl 2.5% | Cl 97.5% | z Value | p Value |
|---|---|---|---|---|---|---|
| (Intercept) | 3.526 | 0.561 | 2.40 | 4.63 | 6.290 | <0.001 *** |
| Temperature | −0.099 | 0.019 | −0.138 | −0.060 | −5.210 | <0.001 *** |
| Wind conditions | −0.129 | 0.065 | −0.262 | 0.005 | −1.991 | 0.047 * |
| Study Site (Ref: Site A) | ||||||
| Site B | 0.852 | 0.481 | −0.077 | 1.817 | 1.771 | 0.077 |
| Site C | 1.080 | 0.478 | 0.168 | 2.032 | 2.261 | 0.024 * |
| Site D | 1.465 | 0.460 | 0.601 | 2.380 | 3.185 | 0.001 ** |
| Site E | 2.092 | 0.447 | 1.244 | 2.996 | 4.678 | <0.001 *** |
| Site F | 2.789 | 0.439 | 1.957 | 3.680 | 6.361 | <0.001 *** |
| Site G | 1.637 | 0.458 | 0.773 | 2.553 | 3.573 | <0.001 *** |
| Site H | 2.762 | 0.442 | 1.928 | 3.654 | 6.252 | <0.001 *** |
| Site 1 | 1.440 | 0.415 | 0.663 | 2.272 | 3.465 | 0.001 *** |
| Site 2 | 0.070 | 0.429 | −0.739 | 0.928 | 0.163 | 0.871 |
| Site 3 | 0.197 | 0.428 | −0.609 | 1.053 | 0.460 | 0.645 |
| Site 4 | 0.731 | 0.421 | −0.064 | 1.578 | 1.737 | 0.082 |
| Site 5 | 0.534 | 0.423 | −0.267 | 1.386 | 1.262 | 0.207 |
| Site 6 | 1.231 | 0.416 | 0.446 | 2.070 | 2.956 | 0.003 ** |
| Site 7 | 0.806 | 0.431 | −0.003 | 1.666 | 1.871 | 0.061 |
| Collection Year (Ref: 2013) | ||||||
| 2016 | −1.948 | 0.317 | −2.617 | −1.287 | −6.139 | <0.001 *** |
| 2017 | −3.627 | 0.331 | −4.315 | −2.962 | −10.965 | <0.001 *** |
| Collection Month (Ref: May) | ||||||
| June | −0.479 | 0.353 | −1.117 | 0.159 | −1.357 | 0.175 |
| July | −1.844 | 0.339 | −2.492 | −1.206 | −5.444 | <0.001 *** |
| August | −1.584 | 0.334 | −2.234 | −0.943 | −4.747 | <0.001 *** |
| September | −3.558 | 0.409 | −4.366 | −2.764 | −8.710 | <0.001 *** |
| Gender (Ref: Female) | ||||||
| Male | −0.887 | 0.264 | −1.435 | −0.335 | −3.364 | <0.001 *** |
| Interactions between Year (Ref: 2013) and Month (Ref: May) | ||||||
| 2016: June | 0.675 | 0.440 | −0.217 | 1.564 | 1.533 | 0.125 |
| 2017: June | 1.639 | 0.415 | 0.823 | 2.458 | 3.946 | <0.001 *** |
| 2016: July | 2.167 | 0.427 | 1.285 | 3.052 | 5.069 | <0.001 *** |
| 2017: July | 2.743 | 0.413 | 1.909 | 3.586 | 6.642 | <0.001 *** |
| 2016: August | 1.601 | 0.414 | 0.750 | 2.453 | 3.864 | <0.001 *** |
| 2017: August | 1.673 | 0.408 | 0.861 | 2.491 | 4.100 | <0.001 *** |
| 2016: September | 3.390 | 0.457 | 2.457 | 4.329 | 7.420 | <0.001 *** |
| 2017: September | 4.026 | 0.466 | 3.104 | 4.959 | 8.634 | <0.001 *** |
| Interactions between Month (Ref: May) and Insect Gender (Ref: Female) | ||||||
| June: Male gender | −0.175 | 0.341 | −0.872 | 0.518 | −0.515 | 0.607 |
| July: Male gender | 0.229 | 0.333 | −0.452 | 0.906 | 0.686 | 0.493 |
| August: Male gender | 0.817 | 0.333 | 0.135 | 1.496 | 2.452 | 0.014 * |
| September: Male gender | 1.197 | 0.333 | 0.507 | 1.884 | 3.594 | <0.001 *** |
Deviance residuals: min = −2.1444; 1Q = −1.0263; median = −0.6284; 3Q = 0.2327; max = 3.2837. Theta: 0.7169, standard error (SD): 0.0575. Null deviance 1410.84 on 1035 degrees of freedom (df), residual deviance 945.81 on 1000 df. Significance symbols: 0.05 to 0.01 = “*”, 0.01 to 0.001 = “**”, <0.001 = “***”. Abbreviation as follows: Estimates (β), standard error (±SE) and confidence limit (Cl).
Table 2.
Generalized linear model (GLM) results showing how collection site and year influenced the effective number of species (ENS).
Table 2.
Generalized linear model (GLM) results showing how collection site and year influenced the effective number of species (ENS).
| Explanatory Variables | β | ±SE | CI 2.5% | CI 97.5% | t Value | p Value |
|---|---|---|---|---|---|---|
| (Intercept) | −0.065 | 0.357 | −0.835 | 0.58 | −0.182 | 0.856 |
| Collection Sites (Ref: Site A) | ||||||
| Site B | 0.442 | 0.427 | −0.382 | 1.318 | 1.034 | 0.301 |
| Site C | 0.747 | 0.405 | −0.019 | 1.589 | 1.847 | 0.065 |
| Site D | 0.747 | 0.405 | −0.019 | 1.589 | 1.847 | 0.065 |
| Site E | 1.269 | 0.377 | 0.571 | 2.069 | 3.362 | <0.001 *** |
| Site F | 1.541 | 0.367 | 0.868 | 2.326 | 4.194 | <0.001 *** |
| Site G | 0.636 | 0.412 | −0.149 | 1.489 | 1.543 | 0.123 |
| Site H | 1.598 | 0.367 | 0.925 | 2.383 | 4.350 | <0.001 *** |
| Site 1 | 0.893 | 0.358 | 0.243 | 1.665 | 2.491 | 0.013 * |
| Site 2 | 0.343 | 0.368 | −0.330 | 1.130 | 0.931 | 0.352 |
| Site 3 | 0.180 | 0.372 | −0.502 | 0.974 | 0.484 | 0.628 |
| Site 4 | 0.553 | 0.364 | −0.110 | 1.333 | 1.519 | 0.129 |
| Site 5 | 0.256 | 0.370 | −0.422 | 1.046 | 0.691 | 0.490 |
| Site 6 | 0.737 | 0.361 | 0.082 | 1.513 | 2.044 | 0.041 * |
| Site 7 | 0.328 | 0.380 | −0.374 | 1.134 | 0.863 | 0.388 |
| Study Years (Ref: 2013) | ||||||
| 2016 | −0.109 | 0.107 | −0.319 | 0.102 | −1.013 | 0.311 |
| 2017 | −0.628 | 0.127 | −0.881 | −0.381 | −4.932 | <0.001 *** |
Deviance residuals: min = −2.2229; 1Q = −1.1782; median = −0.1585; 3Q = 0.6215; max = 2.9675. Null deviance 706.51 on 517 degrees of freedom (df), residual deviance 595.01 on 501 df. Significance symbols: 0.05 to 0.01 = “*”, <0.001 = “***”. Abbreviation as follows: Estimates (β), standard error (±SE) and confidence limit (Cl).
Table 3.
List of mosquito species and groups collected during the study in alphabetical order. The table contains the number of individuals from each identified taxon, followed by the percentage (%) of female mosquitoes. Six collection sites were sampled during 2013, seven sites in 2016 and 15 collection points in 2017. The mean number of mosquitoes caught during a collection event was 6.41 in 2013, 3.78 in 2016 and 2.53 in 2017.
| Species | 2013 | 2016 | 2017 | |||
|---|---|---|---|---|---|---|
| Total | % Female | Total | % Female | Total | % Female | |
| Unspecified | 15 | 93.33 | 21 | 85.71 | 11 | 90.91 |
| Aedes (Aedes) cinereus geminus | 45 | 66.67 | 109 | 49.54 | 108 | 57.41 |
| Aedes (Aedimorphus) vexans (Meigen, 1830) | 4 | 75.00 | 40 | 67.50 | 31 | 64.52 |
| Aedes (Ochlerotatus) annulipes group | 106 | 94.34 | 74 | 48.65 | 133 | 75.19 |
| Aedes (Ochlerotatus) cataphylla Dyar, 1916 | 0 | NA | 7 | 85.71 | 29 | 86.21 |
| Aedes (Ochlerotatus) communis (de Geer, 1776) | 138 | 95.65 | 19 | 42.11 | 23 | 73.91 |
| Aedes (Ochlerotatus) diantaeus Howard, Dyar and Knab, 1913 | 1 | 0.00 | 0 | NA | 0 | NA |
| Aedes (Ochlerotatus) excrucians (Walker, 1856) | 16 | 81.25 | 6 | 66.67 | 8 | 75.00 |
| Aedes (Ochlerotatus) flavescens (Müller, 1764) | 1 | 100.00 | 2 | 50.00 | 0 | NA |
| Aedes (Ochlerotatus) intrudens Dyar, 1919 | 106 | 95.28 | 3 | 100.00 | 2 | 100.00 |
| Aedes (Ochlerotatus) leucomelas (Meigen, 1804) | 0 | NA | 2 | 50.00 | 7 | 85.71 |
| Aedes (Ochlerotatus) pullatus (Coquillett, 1904) | 0 | NA | 1 | 100.00 | 0 | NA |
| Aedes (Ochlerotatus) punctor/ punctodes | 44 | 75.00 | 38 | 52.63 | 76 | 67.11 |
| Aedes (Ochlerotatus) sticticus (Meigen, 1838) | 0 | NA | 36 | 94.44 | 26 | 84.62 |
| Anopheles (Anopheles) claviger (Meigen, 1804) | 3 | 0.00 | 0 | NA | 1 | 100.00 |
| Anopheles (Anopheles) maculipennis complex | 4 | 25.00 | 3 | 33.33 | 2 | 100.00 |
| Coquillettidia (Coquillettidia) richiardii (Ficalbi, 1889) | 11 | 72.73 | 2 | 100.00 | 10 | 80.00 |
| Culex (Culex) pipiens/torrentium | 151 | 30.46 | 163 | 43.56 | 202 | 33.17 |
| Culex (Neoculex) territans Walker, 1856 | 9 | 22.22 | 27 | 33.33 | 4 | 0.00 |
| Culiseta (Culicella) ochroptera (Peus, 1935) | 0 | NA | 3 | 66.67 | 1 | 100.00 |
| Culiseta (Culiseta) annulata (Schrank, 1776) | 0 | NA | 0 | NA | 6 | 16.67 |
| Total | 654 | 556 | 680 | |||
Publisher’s Note: MDPI stays neutral with regard to jurisdictional claims in published maps and institutional affiliations. |
© 2021 by the authors. Licensee MDPI, Basel, Switzerland. This article is an open access article distributed under the terms and conditions of the Creative Commons Attribution (CC BY) license (https://creativecommons.org/licenses/by/4.0/).
Share and Cite
MDPI and ACS Style
Kirik, H.; Burtin, V.; Tummeleht, L.; Kurina, O. Friends in All the Green Spaces: Weather Dependent Changes in Urban Mosquito (Diptera: Culicidae) Abundance and Diversity. Insects 2021, 12, 352. https://doi.org/10.3390/insects12040352
AMA Style
Kirik H, Burtin V, Tummeleht L, Kurina O. Friends in All the Green Spaces: Weather Dependent Changes in Urban Mosquito (Diptera: Culicidae) Abundance and Diversity. Insects. 2021; 12(4):352. https://doi.org/10.3390/insects12040352
Chicago/Turabian StyleKirik, Heli, Viktoria Burtin, Lea Tummeleht, and Olavi Kurina. 2021. "Friends in All the Green Spaces: Weather Dependent Changes in Urban Mosquito (Diptera: Culicidae) Abundance and Diversity" Insects 12, no. 4: 352. https://doi.org/10.3390/insects12040352
Note that from the first issue of 2016, this journal uses article numbers instead of page numbers. See further details here.