Degradation Effects of Base Oils after Thermal and Electrical Aging for EV Thermal Fluid Applications


Abstract
:1. Introduction
2. Materials and Methods
2.1. Thermal Aging
2.2. Electrical Aging
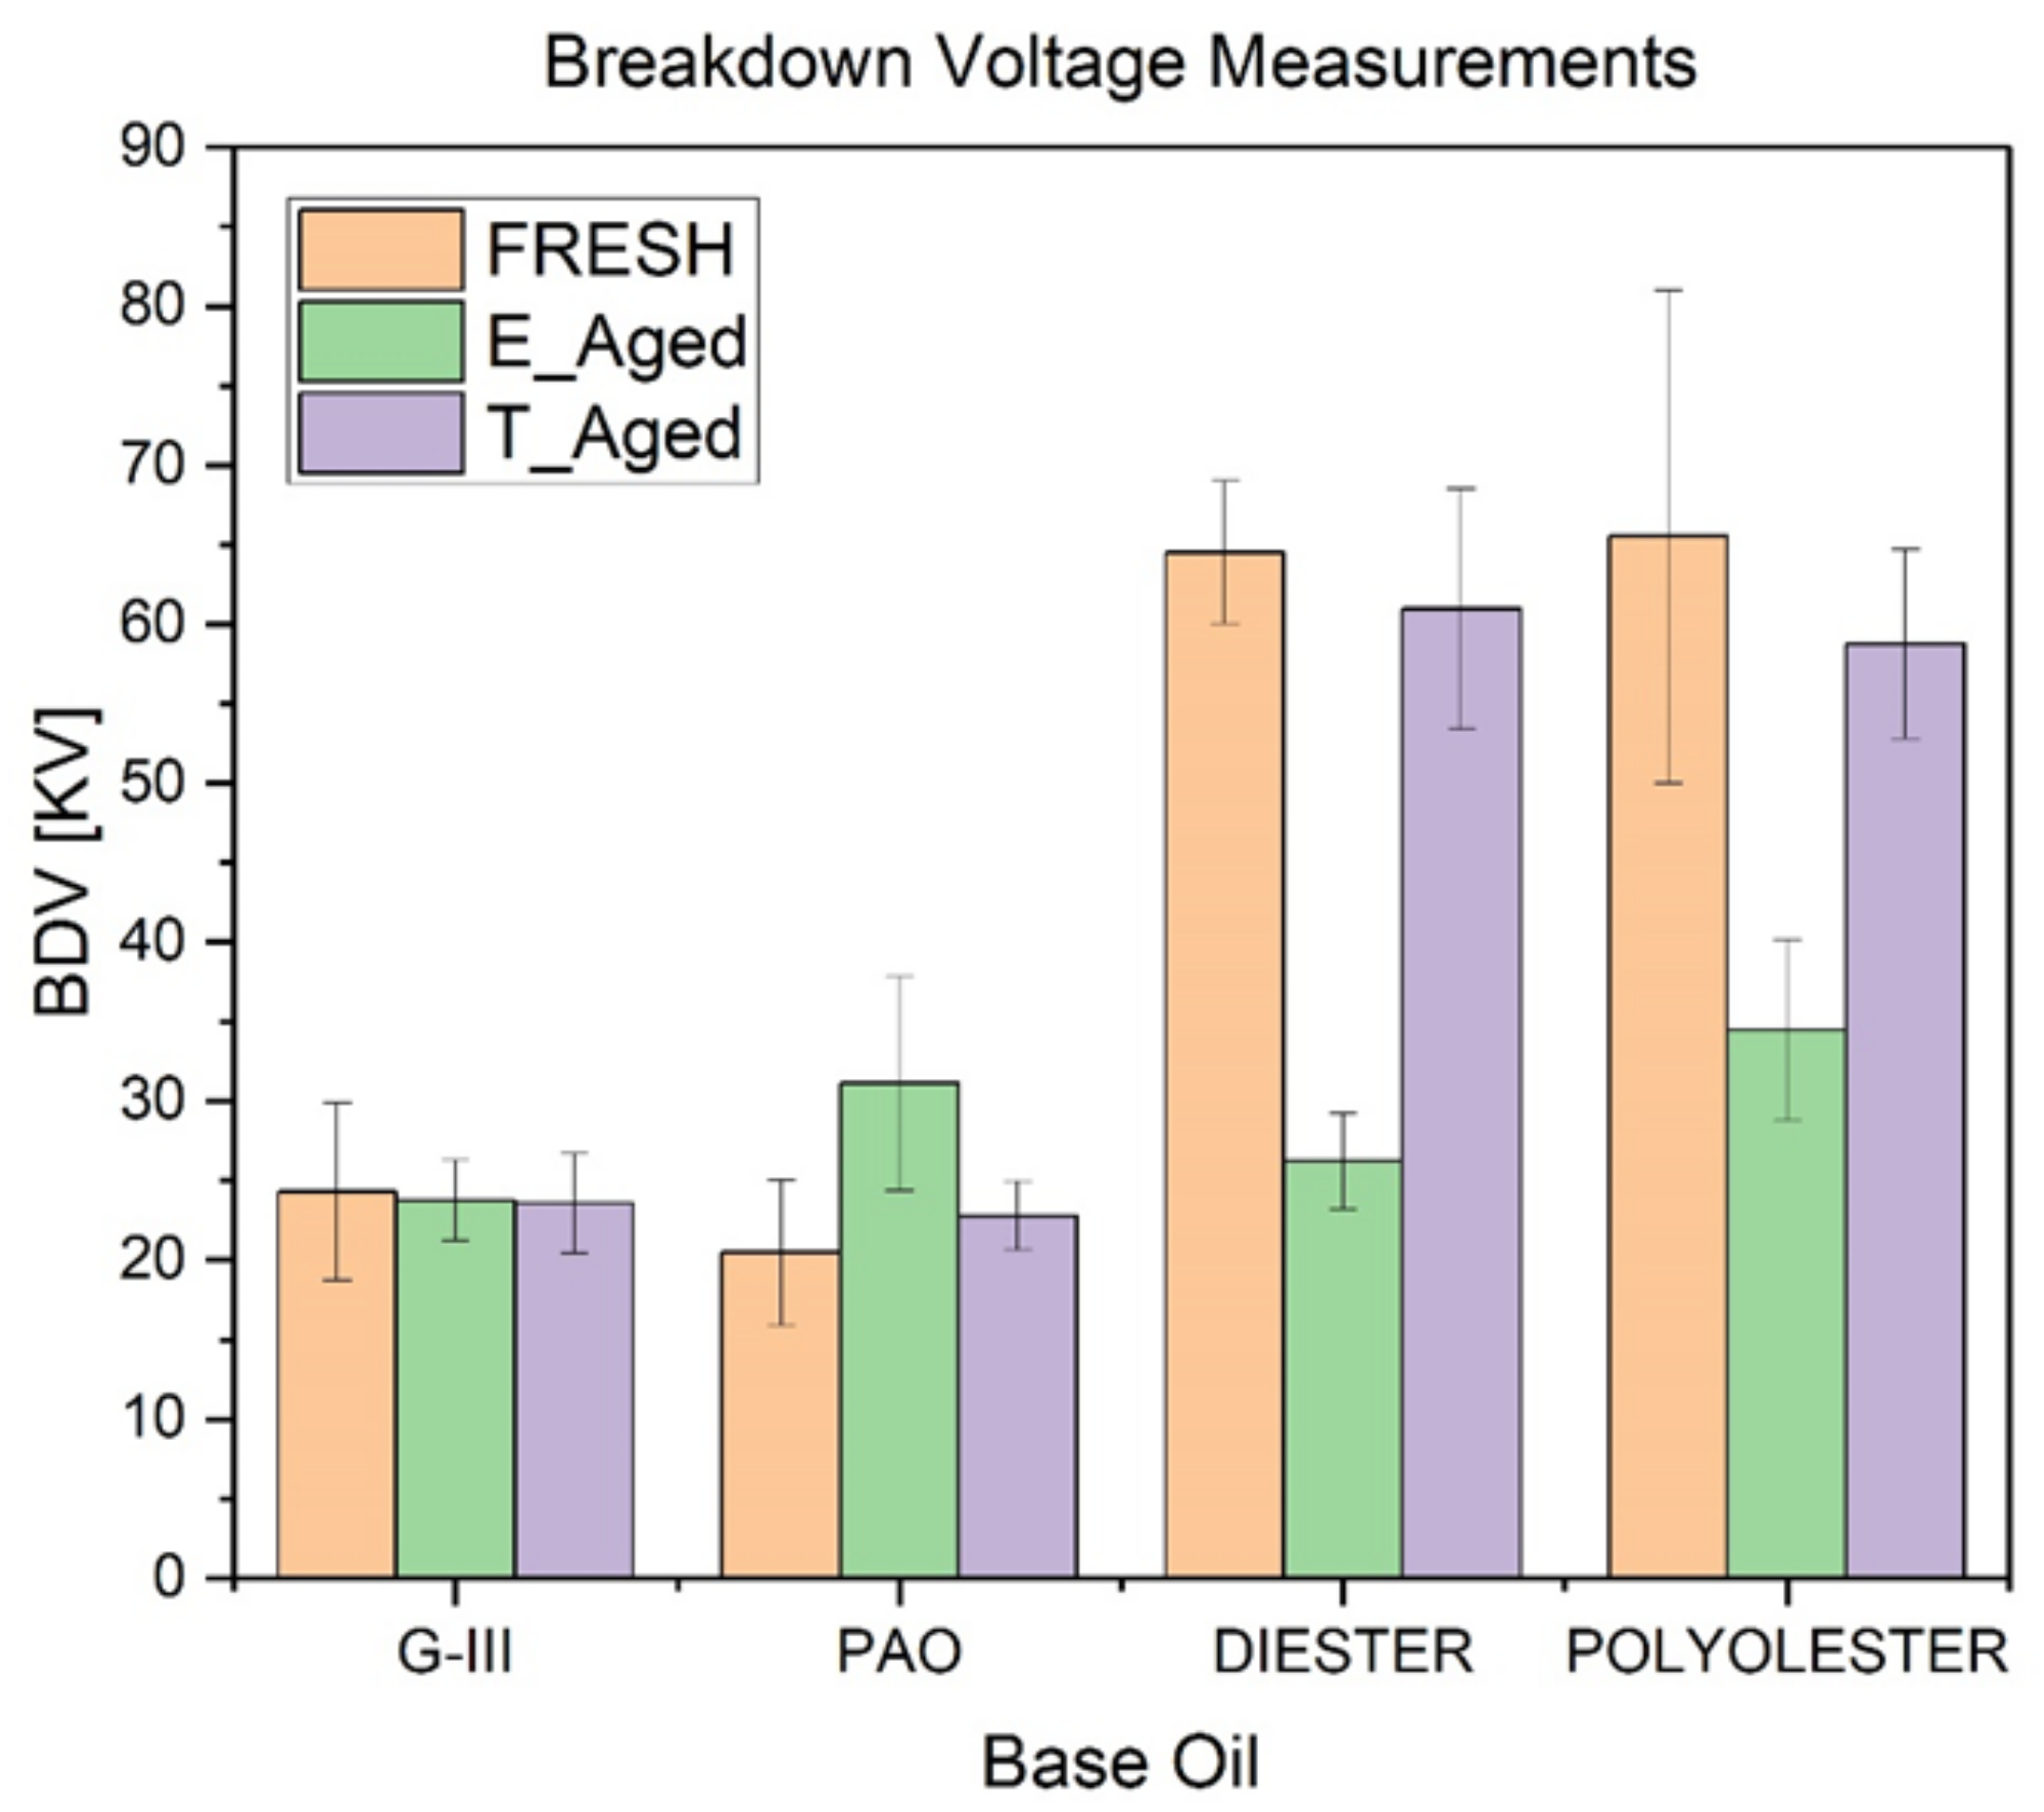
2.3. Breakdown Voltage
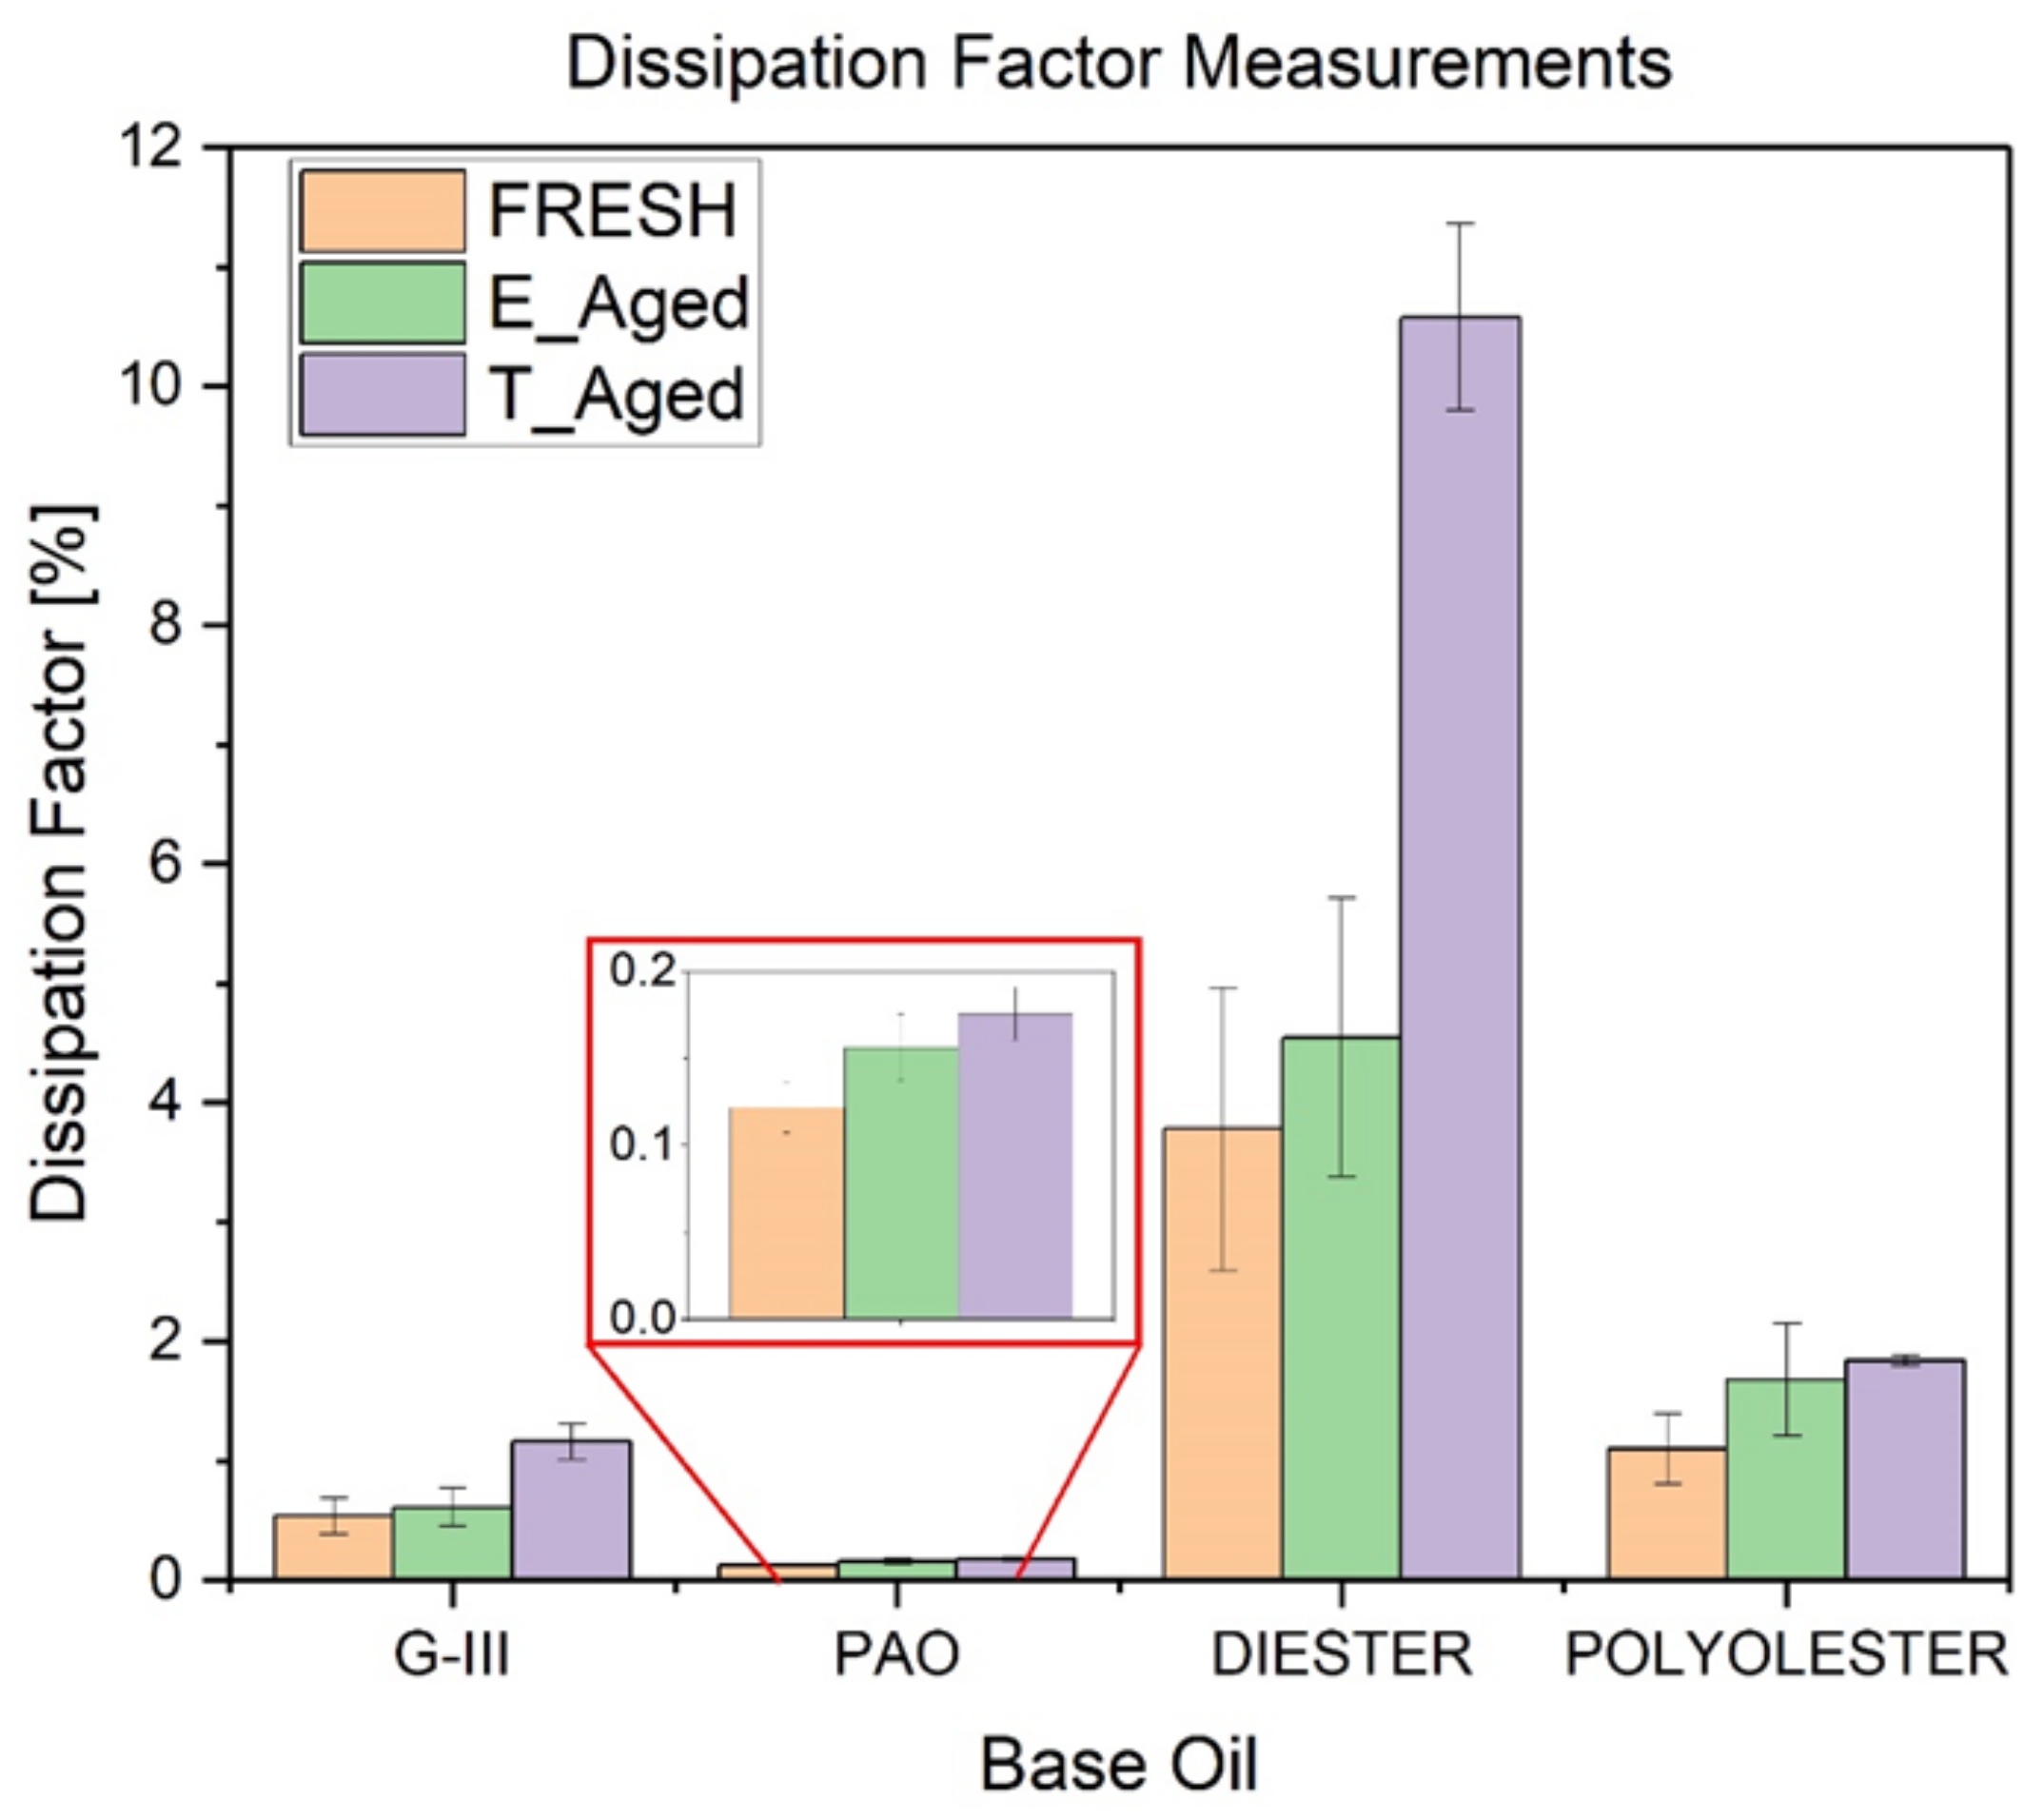
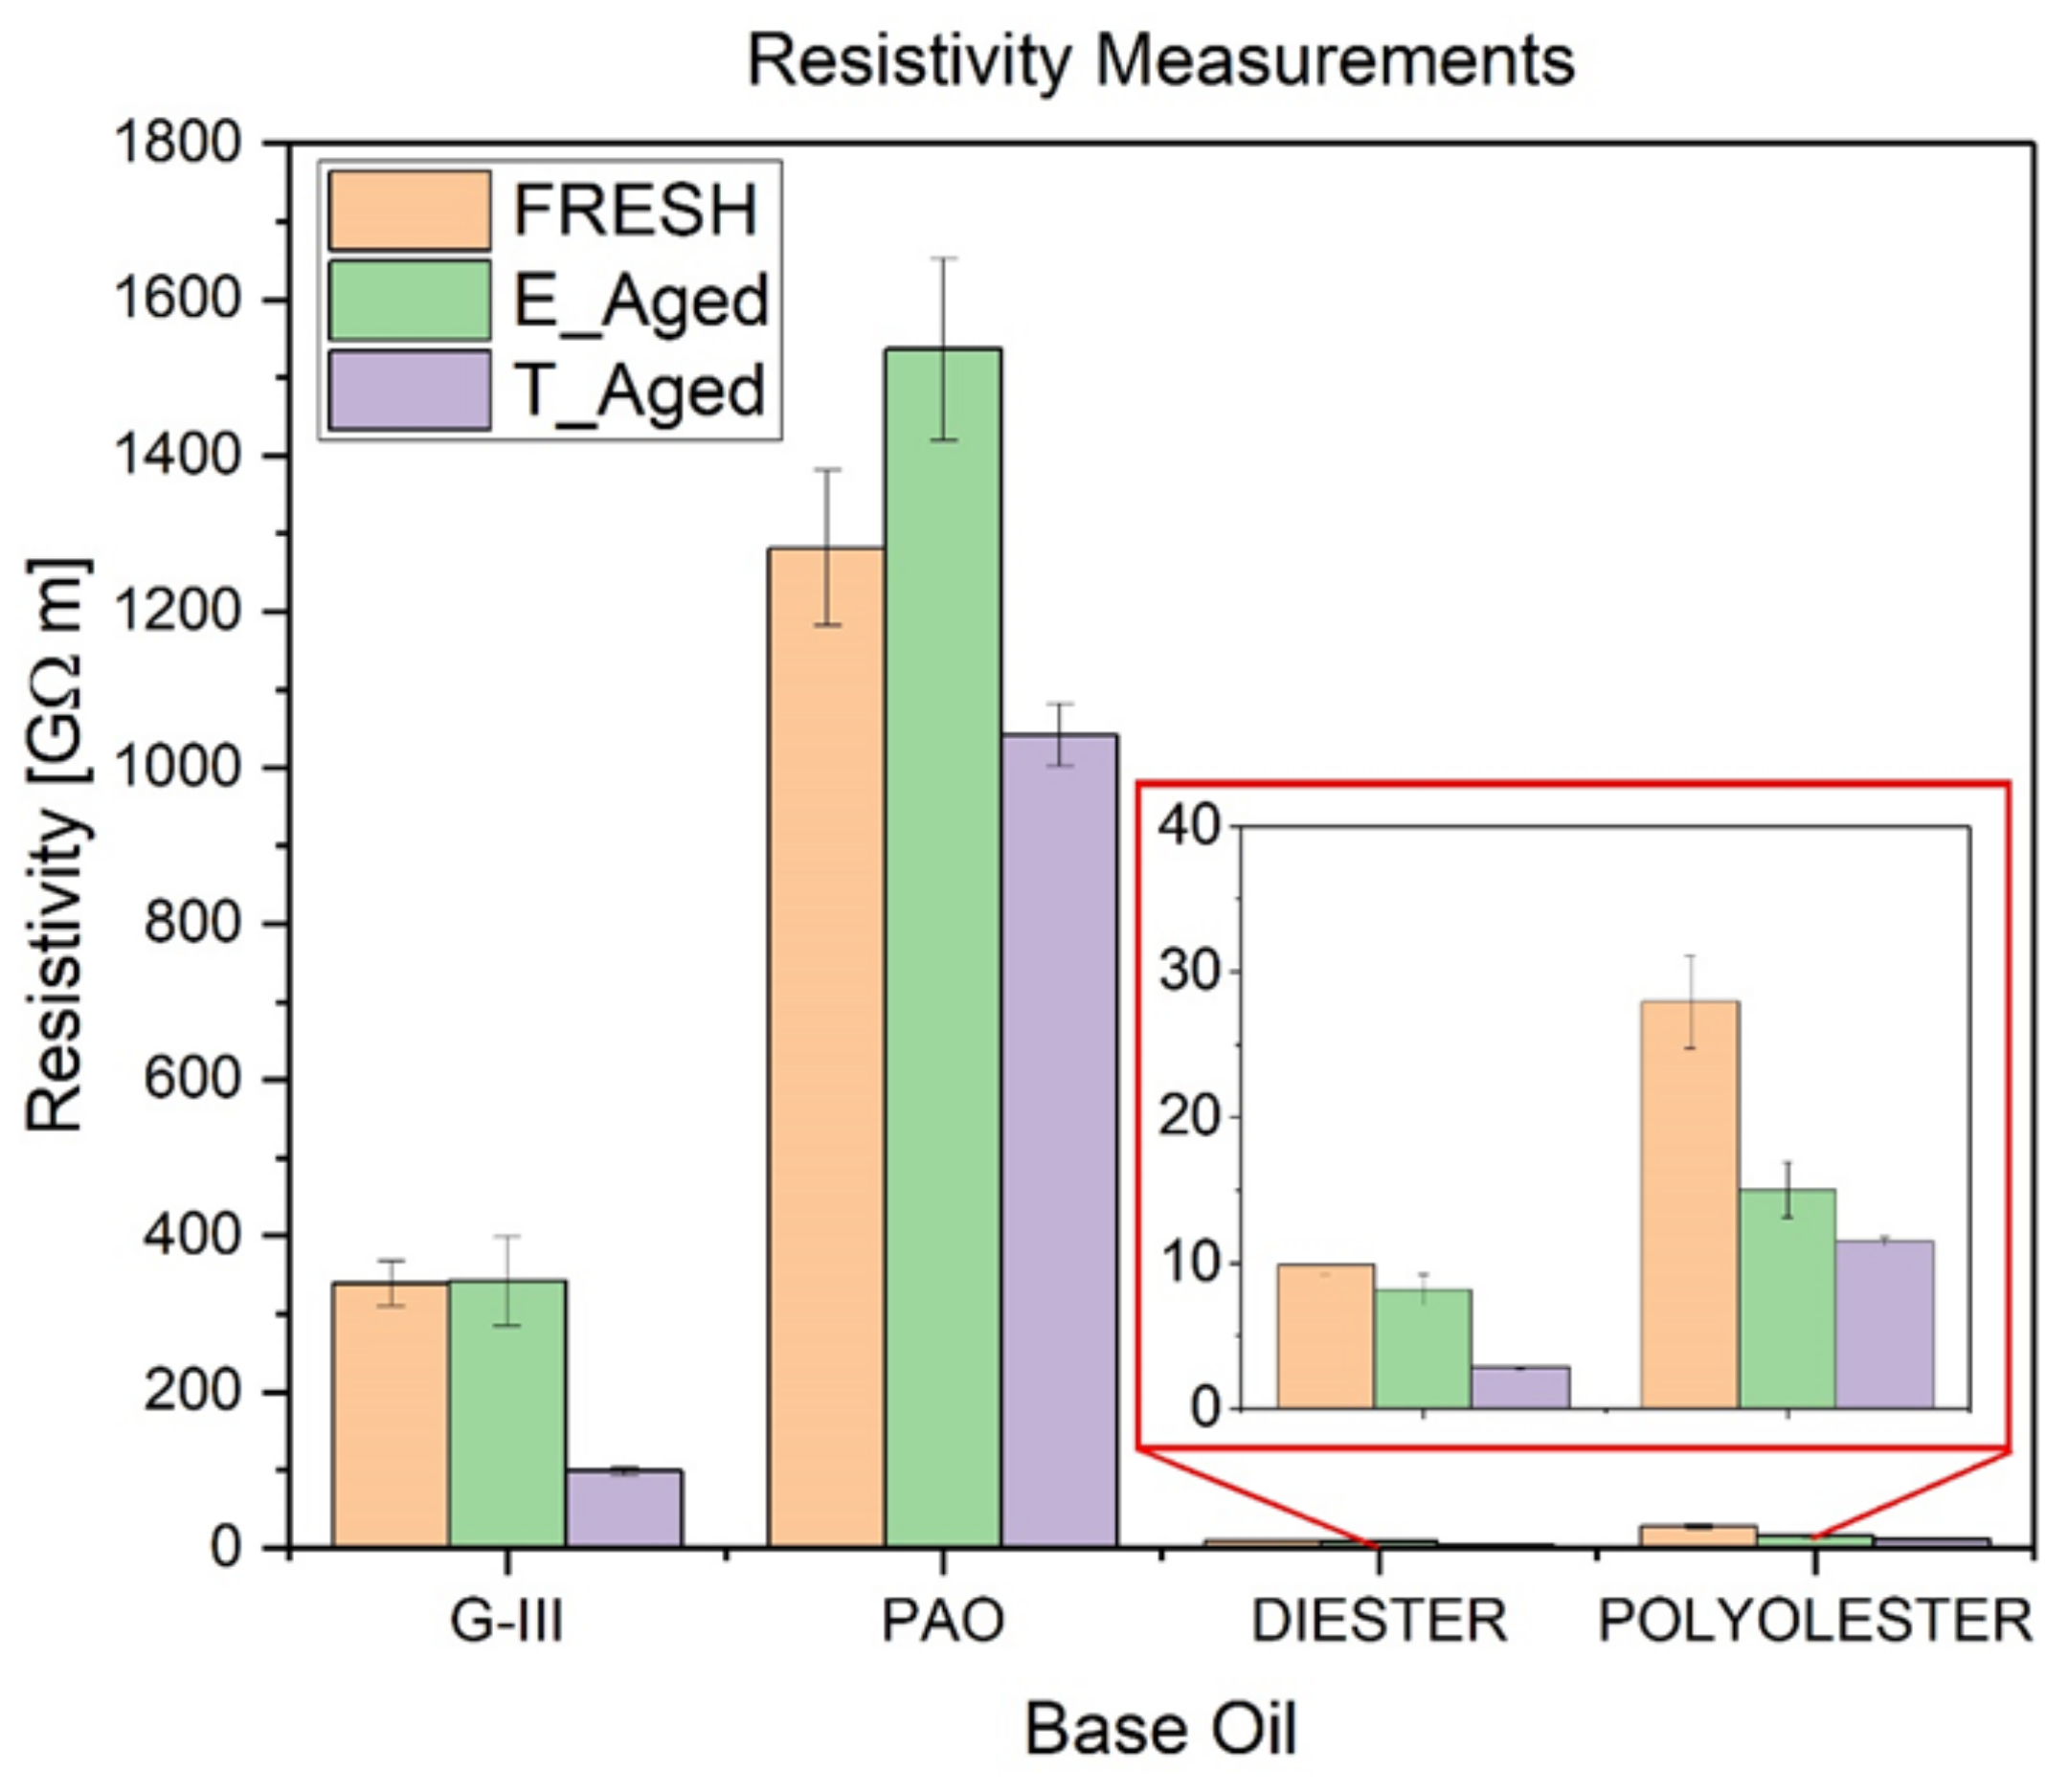
2.4. Resistivity and Dissipation Factor
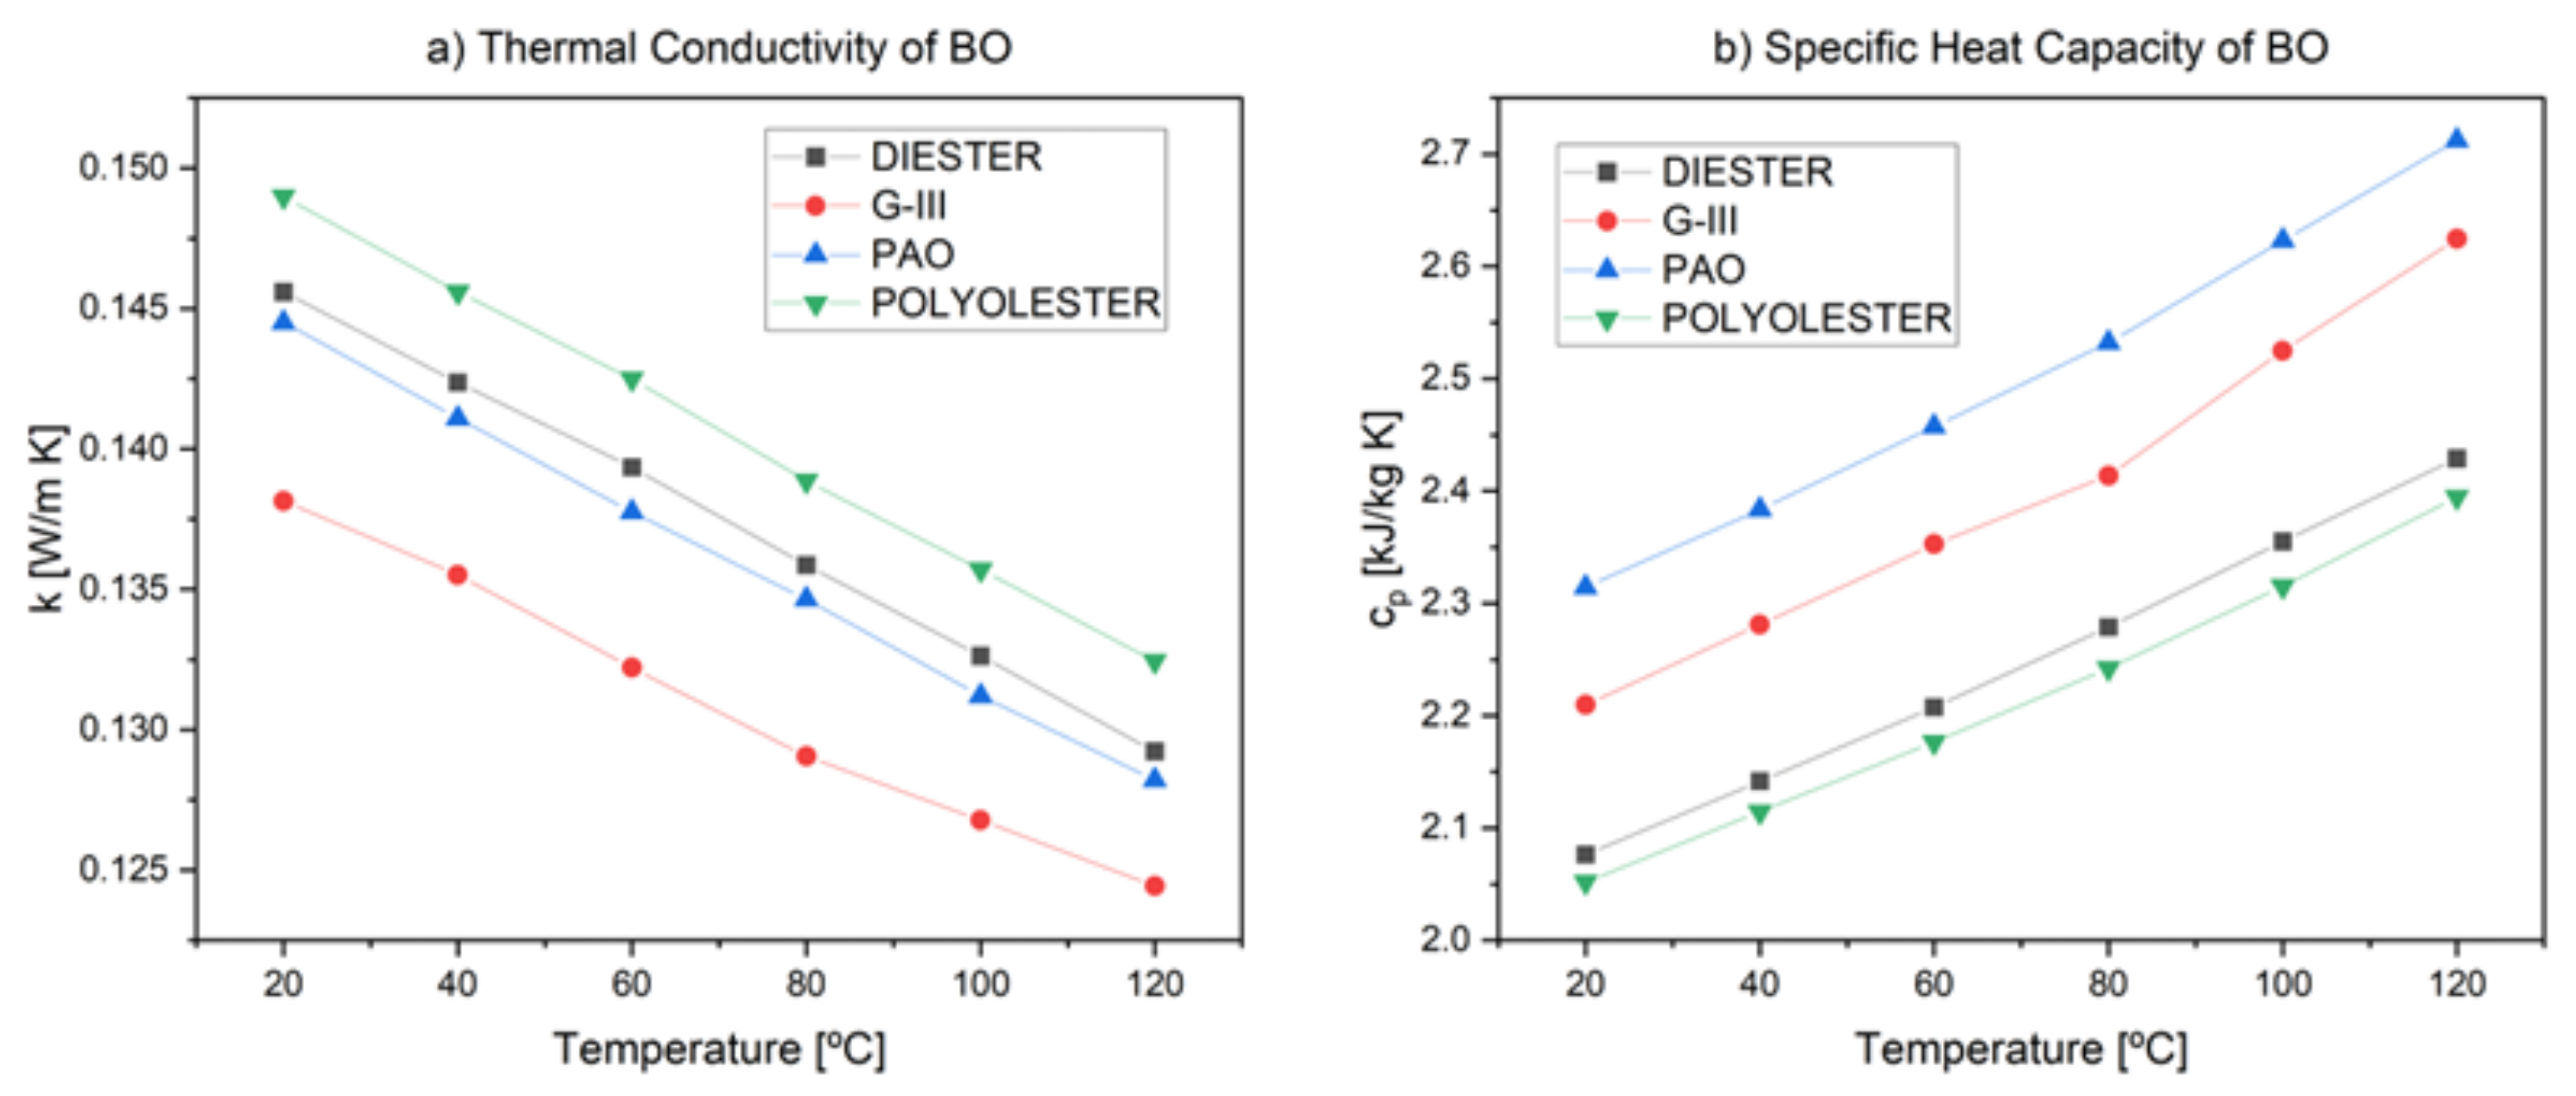
2.5. Thermal Properties
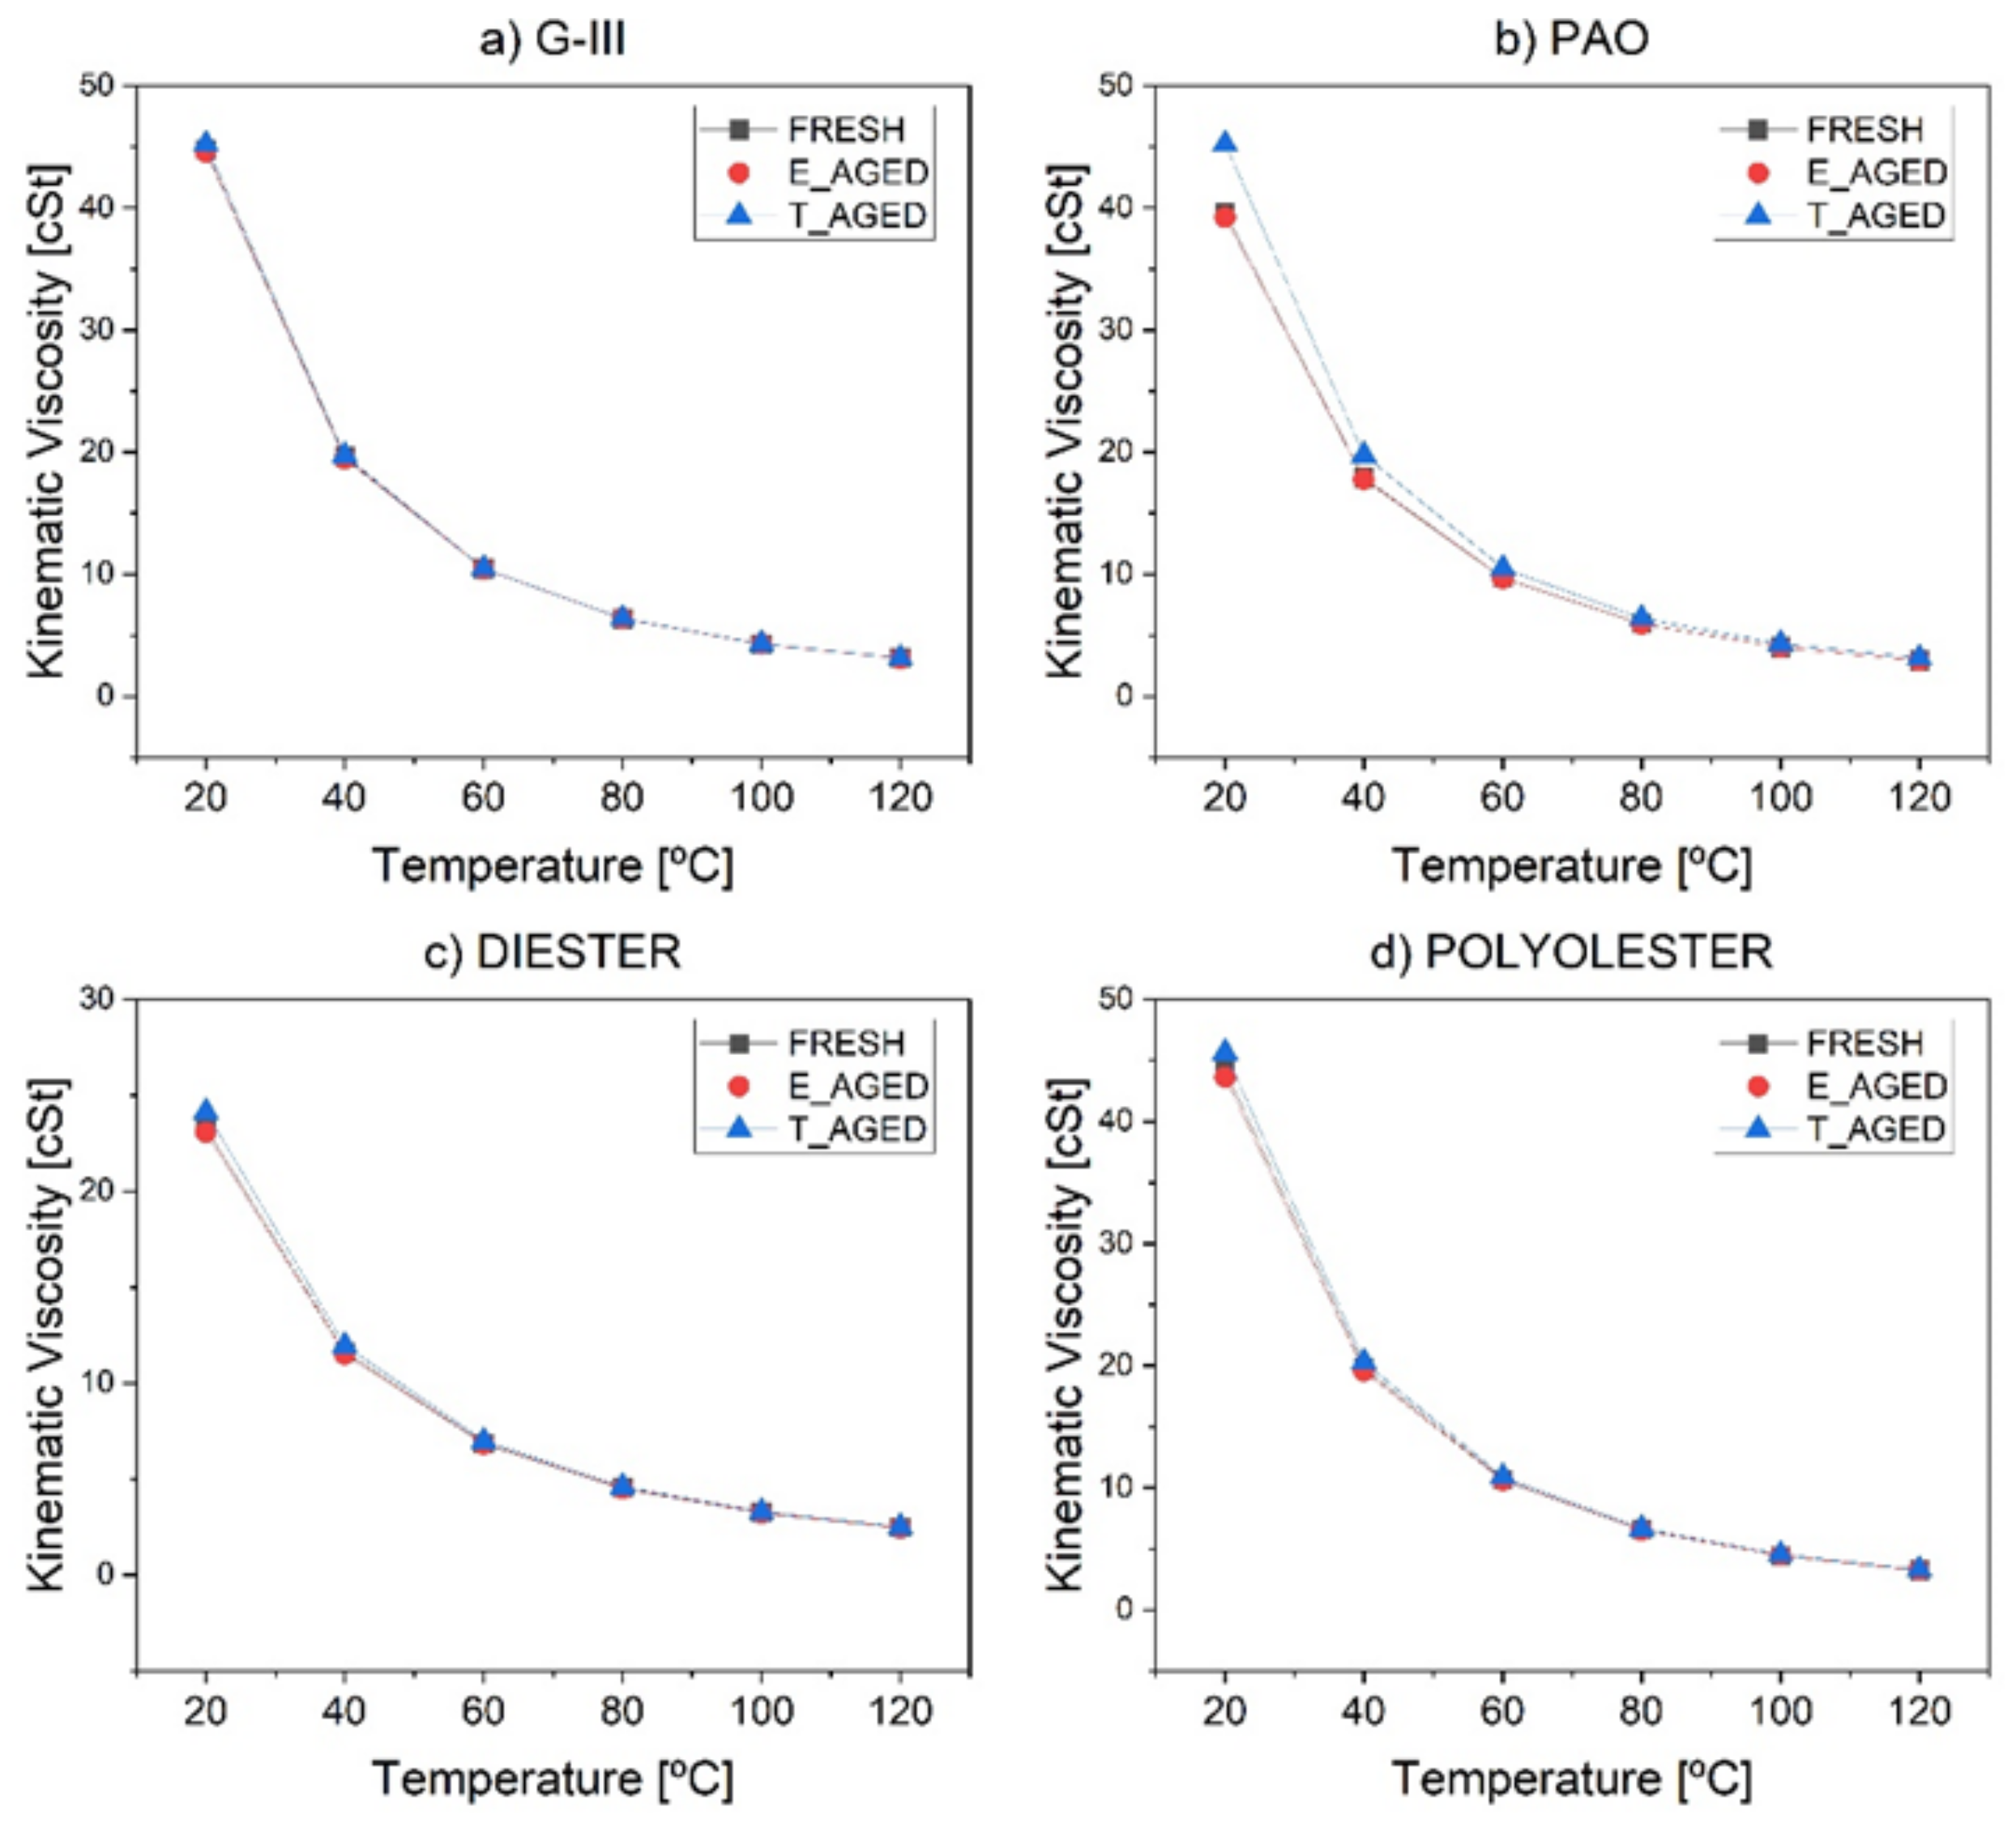
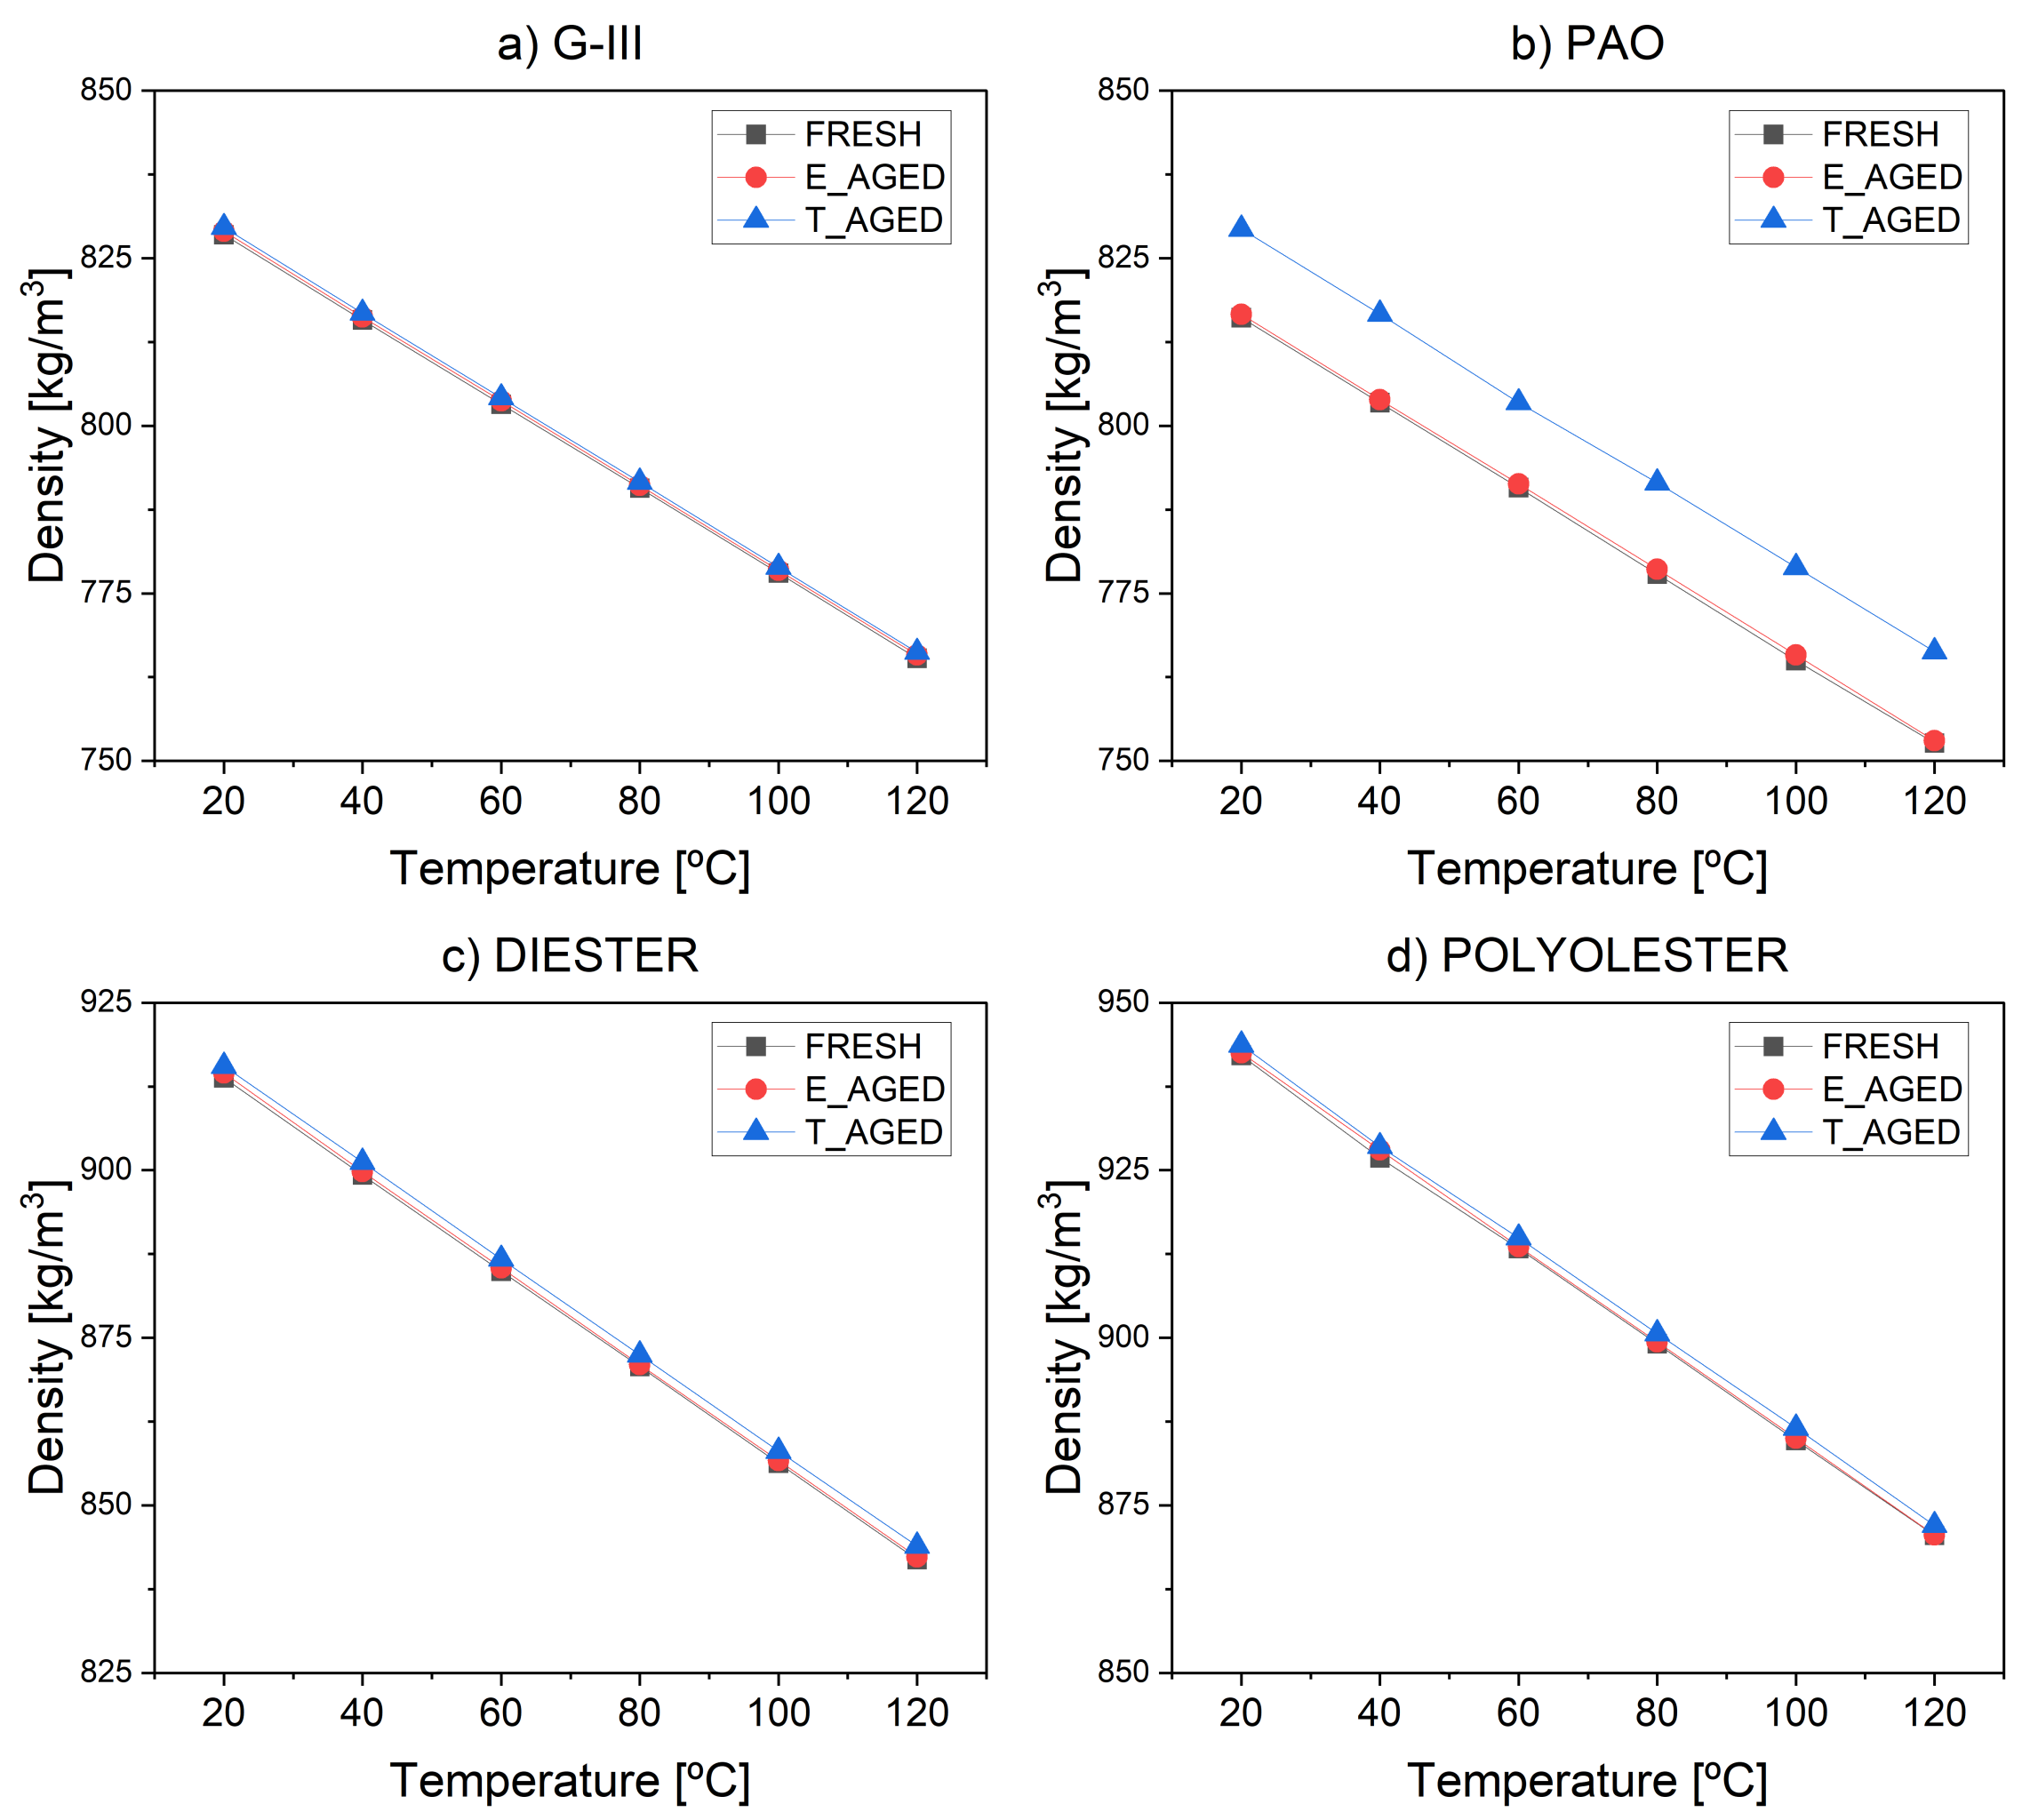
2.6. Viscosity and Density
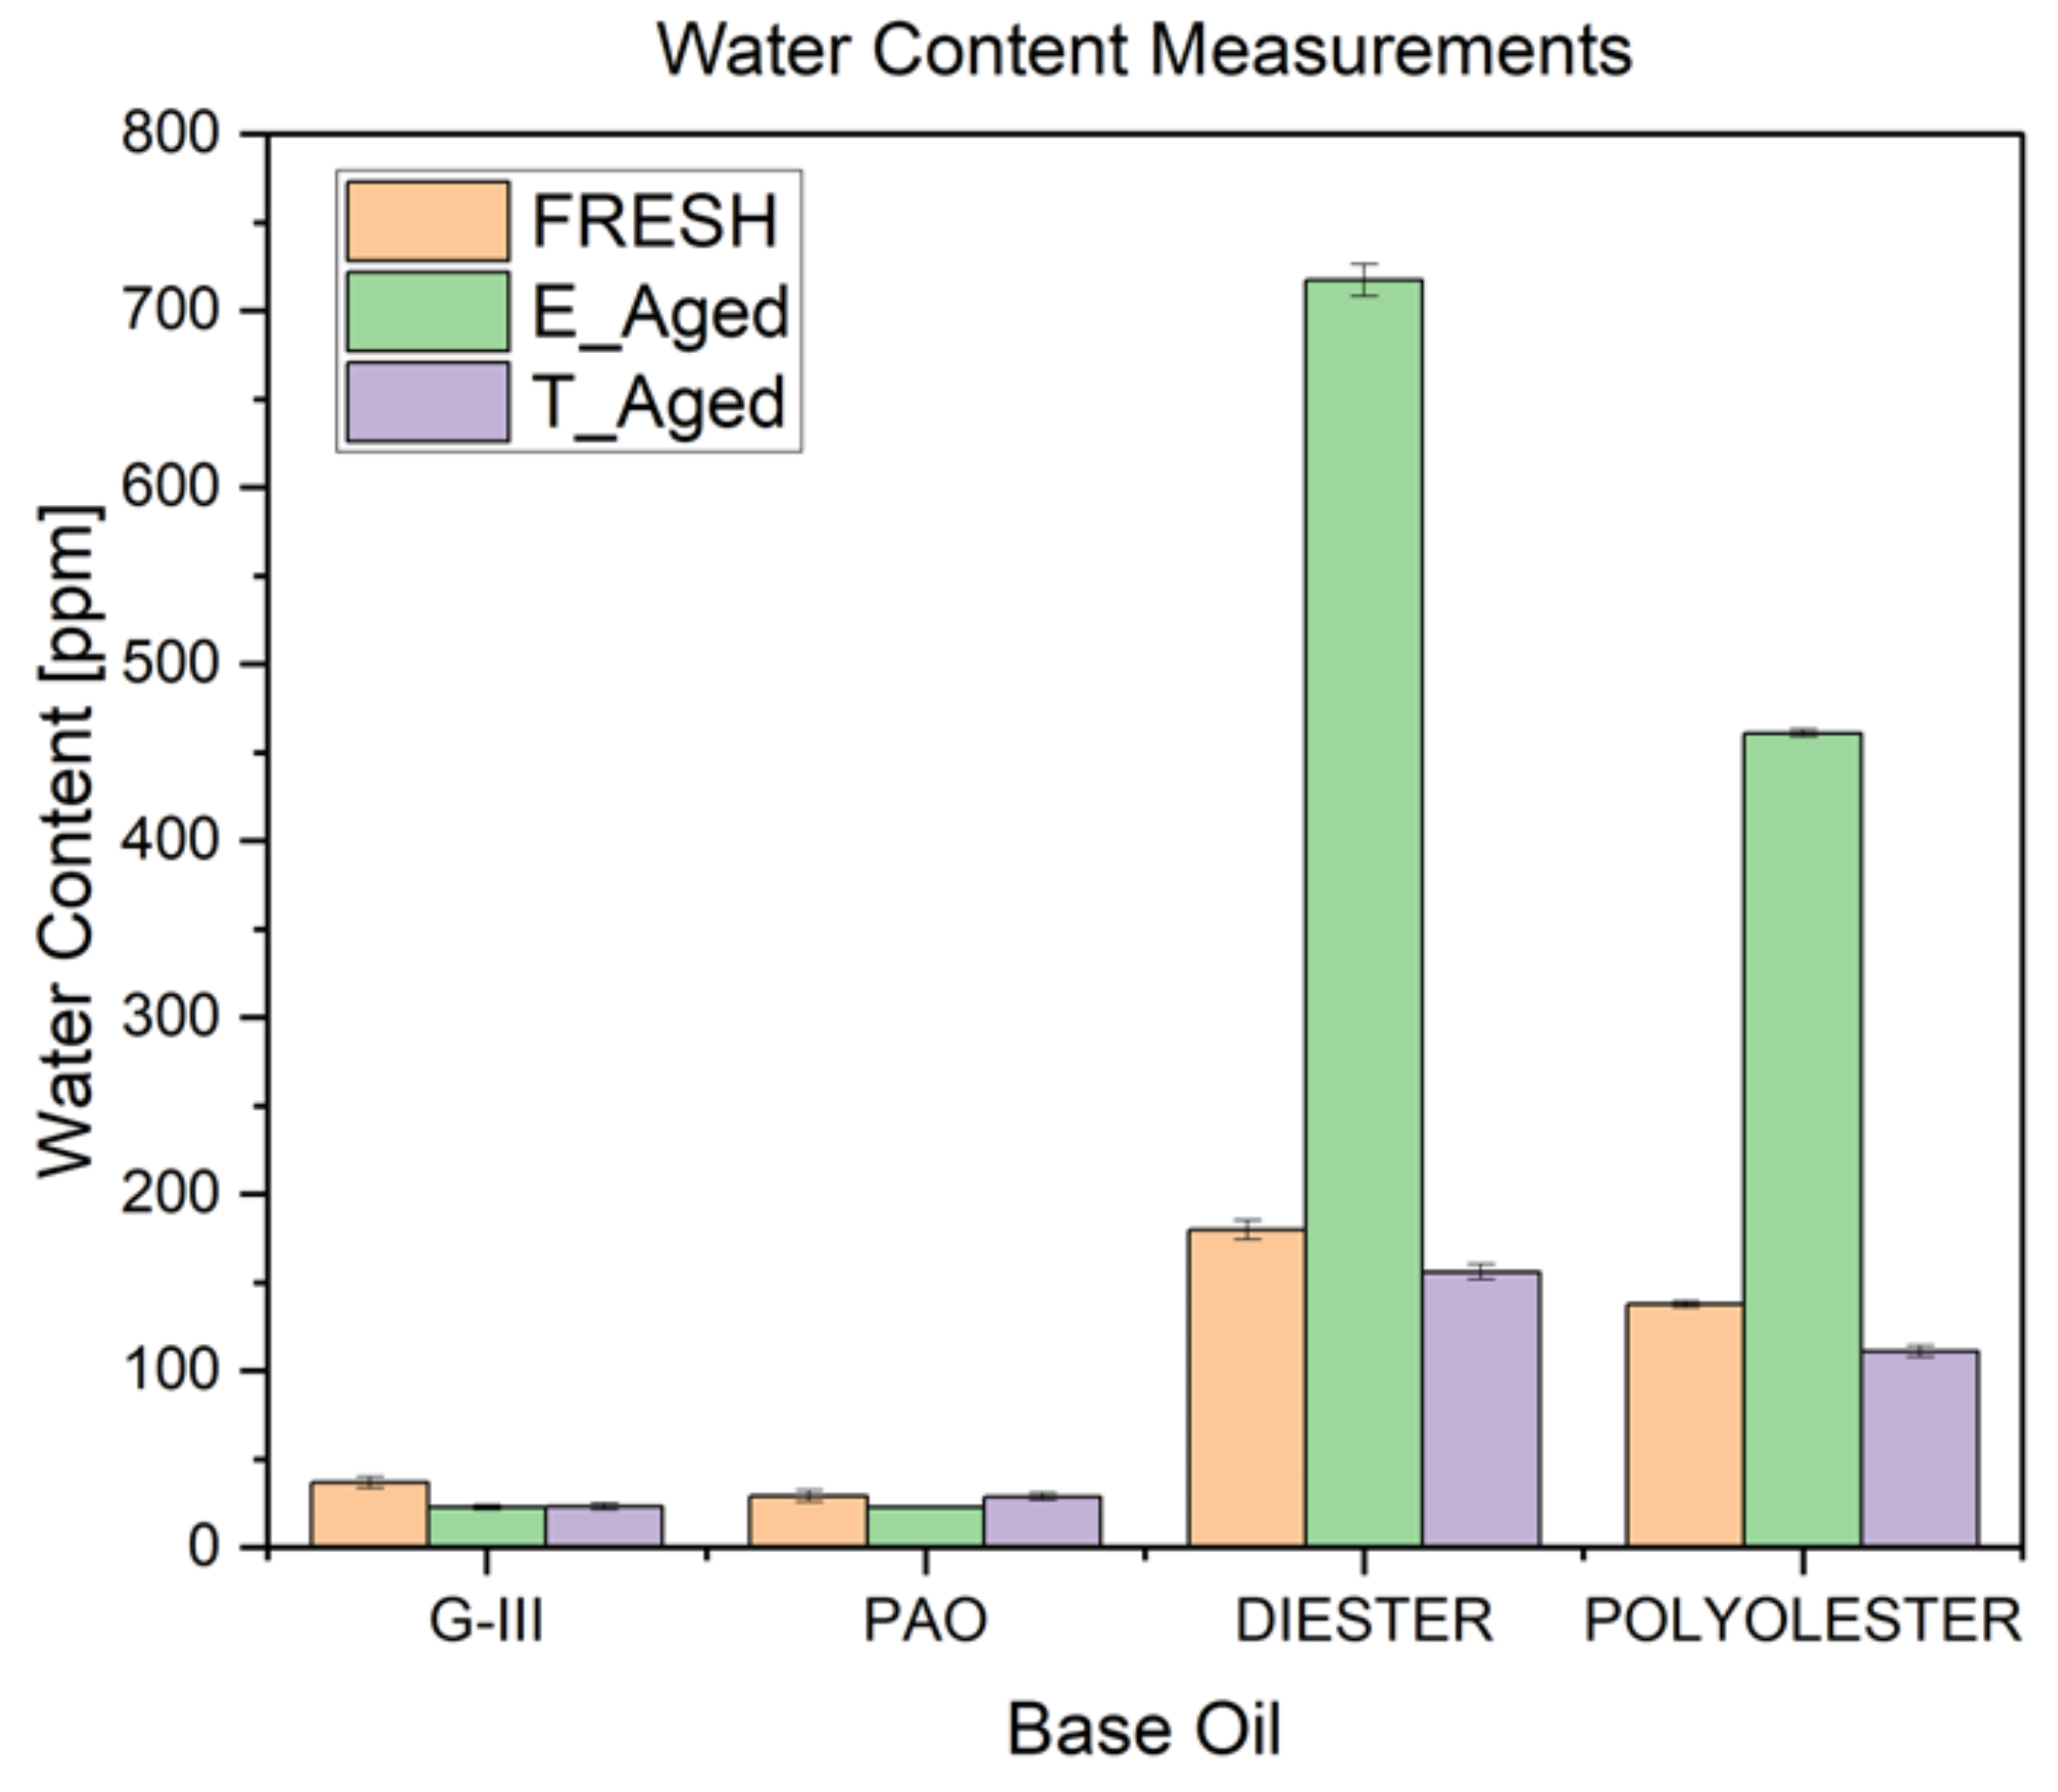
2.7. Water Content
3. Scope and Limitations
4. Results and Discussion
4.1. Thermal Performance
4.2. Electrical Performance
5. Conclusions
Author Contributions
Funding
Data Availability Statement
Conflicts of Interest
References
- St. John, A. EV Sales Growing Faster Than Expected. 20321. Available online: https://www.autonews.com/mobility-report/ev-sales-growing-faster-expected (accessed on 31 December 2021).
- Kim, J.; Oh, J.; Lee, H. Review on battery thermal management system for electric vehicles. Appl. Therm. Eng. 2019, 149, 192–212. [Google Scholar]
- Huber, C.; Kuhn, R. 13—Thermal Mmanagement of Batteries for Electric Vehicles. In Advances in Battery Technologies for Electric Vehicles; Scrosati, B., Garche, J., Tillmetz, W., Eds.; Woodhead Publishing Series in Energy; Woodhead Publishing: Sawston, UK, 2015; pp. 327–358. [Google Scholar] [CrossRef]
- Mali, V.; Saxena, R.; Kumar, K.; Kalam, A.; Tripathi, B. Review on battery thermal management systems for energy-efficient electric vehicles. Renew. Sustain. Energy Rev. 2021, 151, 111611. [Google Scholar]
- Mallick, S.; Neog, S.; Mahanta, D.; Rafi, M. A Review on Passive Cooling Techniques for Lithium-Ion Battery Thermal Management System of Electric Vehicle. In Proceedings of the IOP Conference Series: Materials Science and Engineering, Coimbatore, India, 25–26 March 2021; Volume 1145, p. 012046. [Google Scholar]
- Pesaran, A.A. Battery thermal management in EV and HEVs: Issues and solutions. Battery Man 2001, 43, 34–49. [Google Scholar]
- Pambudi, N.A.; Sarifudin, A.; Firdaus, R.A.; Ulfa, D.K.; Gandidi, I.M.; Romadhon, R. The immersion cooling technology: Current and future development in energy saving. Alex. Eng. J. 2022, 61, 9509–9527. [Google Scholar]
- Lubrizol360. Why Immersion Cooling Is the Future of Electric Vehicle Battery Thermal Management. 2022. Available online: https://360.lubrizol.com/2022/Why-Immersion-Cooling-Is-the-Future-of-EV-Battery-Thermal-Management (accessed on 31 December 2022).
- Patil, M.S.; Seo, J.H.; Lee, M.Y. A novel dielectric fluid immersion cooling technology for Li-ion battery thermal management. Energy Convers. Manag. 2021, 229, 113715. [Google Scholar]
- Roe, C.; Feng, X.; White, G.; Li, R.; Wang, H.; Rui, X.; Li, C.; Zhang, F.; Null, V.; Parkes, M.; et al. Immersion cooling for lithium-ion batteries—A review. J. Power Sources 2022, 525, 231094. [Google Scholar]
- Hägerbrand, J. Measurements of Resistivity in Transformer Insulation Liquids. Master’s Thesis, University of Uppsala, Uppsala, Sweden, 2020. [Google Scholar]
- Mu, Z.; Wang, Z.; Liu, Q. Measurements of DC Resistivity of Insulating Oils. In Proceedings of the 2016 IEEE International Conference on High Voltage Engineering and Application (ICHVE), Chengdu, China, 19–22 September 2016; pp. 1–4. [Google Scholar]
- Ab Ghani, S.; Khiar, M.S.A.; Chairul, I.S.; Zamir, M.I. Effect of repeated electrical breakdowns on mineral and natural ester insulating oils. Bull. Electr. Eng. Inform. 2021, 10, 2989–2996. [Google Scholar]
- Oumert, L.S.; Boucherit, A.; Zafour, A.H.Z.; Fofana, I. Comparative study of the degradation rate of new and regenerated mineral oils following electrical stress. IET Gener. Transm. Distrib. 2018, 12, 5891–5897. [Google Scholar]
- Keyser, M.; Pesaran, A.; Li, Q.; Santhanagopalan, S.; Smith, K.; Wood, E.; Ahmed, S.; Bloom, I.; Dufek, E.; Shirk, M.; et al. Enabling fast charging—Battery thermal considerations. J. Power Sources 2017, 367, 228–236. [Google Scholar]
- Ahmed, S.; Bloom, I.; Jansen, A.N.; Tanim, T.; Dufek, E.J.; Pesaran, A.; Burnham, A.; Carlson, R.B.; Dias, F.; Hardy, K.; et al. Enabling fast charging—A battery technology gap assessment. J. Power Sources 2017, 367, 250–262. [Google Scholar]
- Clarke, D. Understanding Lubricant Requirements of Hybrid-Electric Vehicles; No. 2014-01-1476; SAE Technical Paper; SAE: Warrendale, PA, USA, 2014. [Google Scholar]
- Narvaez, J.A. Thermal Conductivity of Poly-alpha-olefin (pao)-Based Nanofluids. Ph.D Thesis, University of Dayton, Dayton, OH, USA, 2010. [Google Scholar]
- Szewczyk, R.; Wicks, R.; Martin, R. Comparison of Synthetic and Natural Esters With Focus on Thermal Aspects of Insulation Systems. In Proceedings of the CIRED 2021—The 26th International Conference and Exhibition on Electricity Distribution, Online, 20–23 September 2021; Volume 2021, pp. 142–146. [Google Scholar] [CrossRef]
- Fenske, M.; Stevenson, C.; Lawson, N.; Herbolsheimer, G.; Koch, E. Oxidation of lubricating oils. Factors controlling oxidation stability. Ind. Eng. Chem. 1941, 33, 516–524. [Google Scholar]
- Yao, T.; Zhang, N.; Zhang, M.; She, X.; Liao, X.; Shen, Y.; Gan, Z. Effect of iron and copper on the thermal oxidation stability of synthetic hydrocarbon aviation lubricating oil. Catal. Commun. 2021, 161, 106363. [Google Scholar]
- ASTMD130; Standard Test Method for Corrosiveness to Copper from Petroleum Products by Copper Strip Test. ASTM International: West Conshohocken, PA, USA, 2019.
- ASTMD1816; Standard Test Method for Dielectric Breakdown Voltage of Insulating Oils of Petroleum Origin Using VDE Electrodes. ASTM International: West Conshohocken, PA, USA, 2012.
- IEC60247; Insulating Liquids—Measurement of Relative Permittivity, Dielectric Dissipation Factor (tan d) and d.c. Resistivity. International Electrotechnical Commission: Geneva, Switzerland, 2004.
- ASTMD7896; Standard Test Method for Thermal Conductivity, Thermal Diffusivity, and Volumetric Heat Capacity of Engine Coolants and Related Fluids by Transient Hot Wire Liquid Thermal Conductivity Method. ASTM International: West Conshohocken, PA, USA, 2019.
- ASTMD7042; Standard Test Method for Dynamic Viscosity and Density of Liquids by Stabinger Viscometer (and the Calculation of Kinematic Viscosity). ASTM International: West Conshohocken, PA, USA, 2021.
- ASTMD6304; Standard Test Method for Determination of Water in Petroleum Products, Lubricating Oils, and Additives by Coulometric Karl Fischer Titration. ASTM International: West Conshohocken, PA, USA, 2021.
- Richenderfer, A. Heat Transfer Performance of Fluids for EVs. In Proceedings of the Inaugural STLE Tribology & Lubrication for E-Mobility Conference, San Antonio, TX, USA, 3–5 November 2021. [Google Scholar]
- Simons, R.E. Calculation corner: Comparing heat transfer rates of liquid coolants using the Mouromtseff number. Electron. Cool. 2006, 12, 10. [Google Scholar]
- Villarroel, R.; de Burgos, B.G.; García, D.F. Moisture dynamics in natural-ester filled transformers. Int. J. Electr. Power Energy Syst. 2021, 124, 106172. [Google Scholar] [CrossRef]


| Properties | Equipment | Standard |
|---|---|---|
| Viscosity and density | SVM 3001 Viscometer, Anton Paar | ASTM D7042, D4052, D287, D1298 |
| Water content | Coulometric Karl Fischer titration, Metrohm | ASTM D6304 |
| Breakdown voltage | HZJQ-X1, Huazheng | ASTM D1816 |
| Resistivity, dissipation factor | Oil Tan Delta & Resistivity DF9010 system, APT Power Technology Co | IEC 60247 |
| Thermal conductivity and specific heat capacity | THW-L1, Thermtest Instruments | ASTMD7896 |
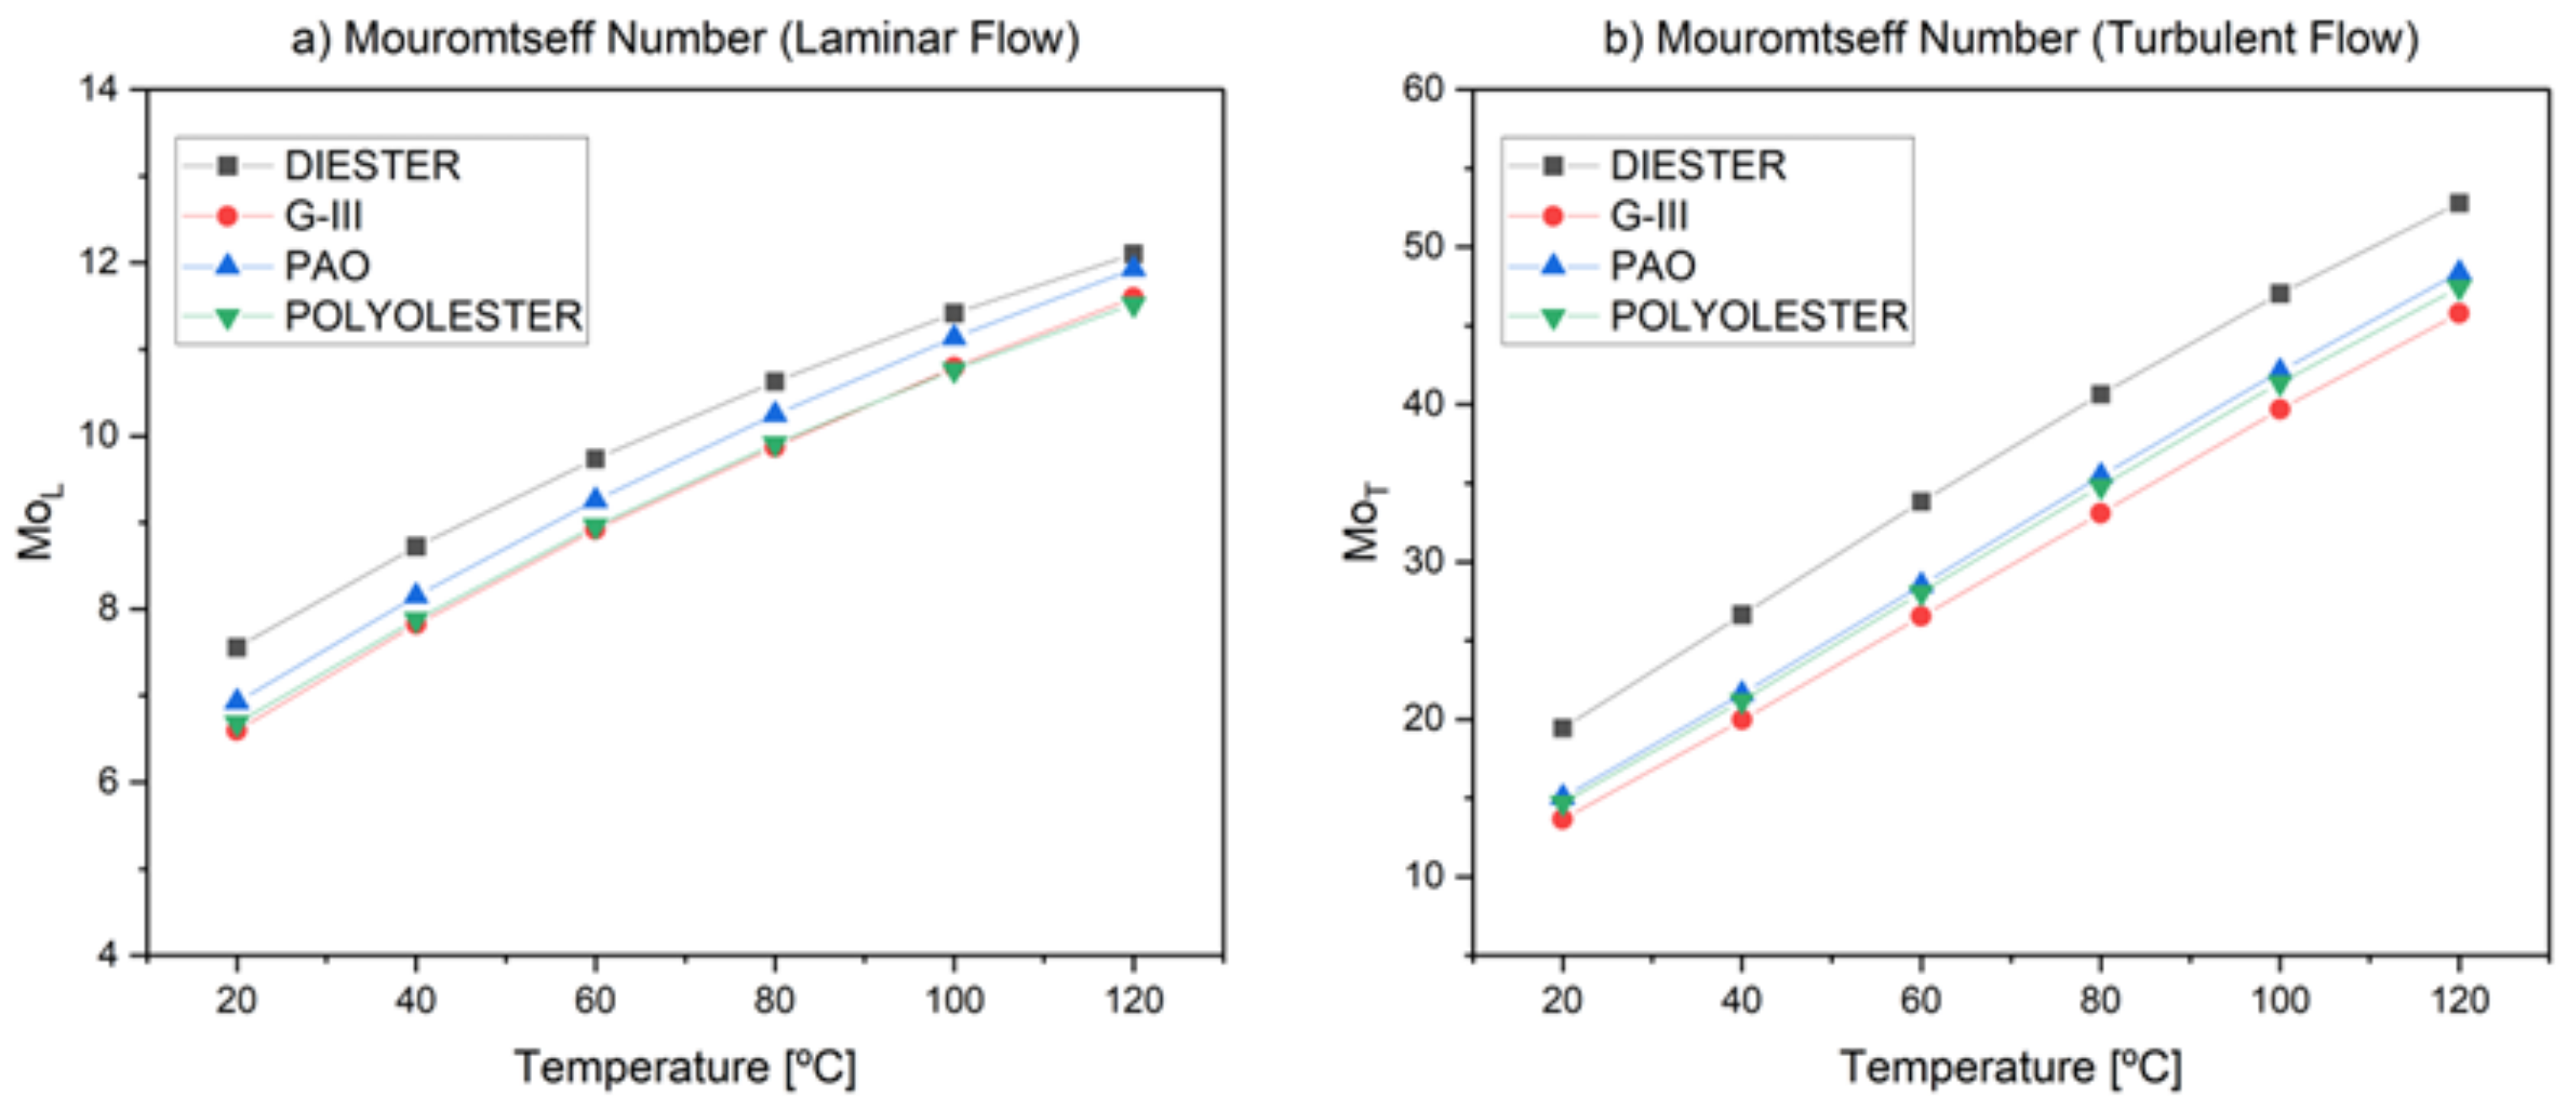
| Exponent | Laminar Flow | Turbulent Flow |
|---|---|---|
| a | 0.33 | 0.80 |
| b | 0.67 | 0.67 |
| d | 0.33 | 0.33 |
| e | 0.17 | 0.47 |
| Property | Status | G-III | PAO | Diester | Polyolester |
|---|---|---|---|---|---|
| Thermal conductivity | T_AGED | 0.28% | −2.32% | 0.61% | 0.67% |
| E_AGED | 0.20% | −0.98% | −0.42% | −0.48% | |
| Specific heat capacity | T_AGED | 0.31% | −3.07% | 0.31% | 0.08% |
| E_AGED | 0.28% | −0.90% | −0.14% | −0.37% | |
| Kinematic viscosity | T_AGED | 0.65% | 9.09% | 2.20% | 2.05% |
| E_AGED | −0.25% | −0.43% | −0.65% | −0.89% | |
| Density | T_AGED | 0.12% | 1.71% | 0.21% | 0.18% |
| E_AGED | 0.06% | 0.07% | 0.05% | 0.05% | |
| Mo | T_AGED | 0.02% | −5.92% | −0.44% | −0.42% |
| E_AGED | 0.36% | −0.73% | 0.01% | −0.01% |
| Property | G-III | PAO | Diester | Polyolester |
|---|---|---|---|---|
| High thermal conductivity | + | ++ | +++ | ++++ |
| High specific heat capacity | +++ | ++++ | ++ | + |
| High Mouromtseff Number | + | +++ | ++++ | ++ |
| High resistivity | +++ | ++++ | + | ++ |
| Low dissipation factor | +++ | ++++ | + | ++ |
| High breakdown voltage | ++++ | +++ | + | ++ |
| Low moisture absorption | +++ | ++++ | + | ++ |
Disclaimer/Publisher’s Note: The statements, opinions and data contained in all publications are solely those of the individual author(s) and contributor(s) and not of MDPI and/or the editor(s). MDPI and/or the editor(s) disclaim responsibility for any injury to people or property resulting from any ideas, methods, instructions or products referred to in the content. |
© 2023 by the authors. Licensee MDPI, Basel, Switzerland. This article is an open access article distributed under the terms and conditions of the Creative Commons Attribution (CC BY) license (https://creativecommons.org/licenses/by/4.0/).
Share and Cite
Tormos, B.; Bermúdez, V.; Ruiz, S.; Alvis-Sanchez, J. Degradation Effects of Base Oils after Thermal and Electrical Aging for EV Thermal Fluid Applications. Lubricants 2023, 11, 241. https://doi.org/10.3390/lubricants11060241
Tormos B, Bermúdez V, Ruiz S, Alvis-Sanchez J. Degradation Effects of Base Oils after Thermal and Electrical Aging for EV Thermal Fluid Applications. Lubricants. 2023; 11(6):241. https://doi.org/10.3390/lubricants11060241
Chicago/Turabian StyleTormos, Bernardo, Vicente Bermúdez, Santiago Ruiz, and Jorge Alvis-Sanchez. 2023. "Degradation Effects of Base Oils after Thermal and Electrical Aging for EV Thermal Fluid Applications" Lubricants 11, no. 6: 241. https://doi.org/10.3390/lubricants11060241