Article

Multiscale Structural Mechanics of Rotary Shaft Seals: Numerical Studies and Visual Experiments

Institute of Machine Components, University of Stuttgart, 70569 Stuttgart, Germany
*
Author to whom correspondence should be addressed.
Lubricants 2023, 11(6), 234; https://doi.org/10.3390/lubricants11060234
Submission received: 11 April 2023 / Revised: 17 May 2023 / Accepted: 18 May 2023 / Published: 23 May 2023
(This article belongs to the Special Issue Tribological Properties and Failure Prediction in Mechanical Elements)

Abstract

:
Although rotary shaft seals have been used successfully in many industrial applications for decades, their tribological behavior is still not completely understood. In-depth knowledge of the structural mechanics is essential for the design and optimization of such sealing systems. High complexity results from the multiscale interactions in the tribological system rotary shaft seal. Large macroscopic deformations occur due to the hyperelastic material behavior of elastomers coupled with microscopic tangential distortions of the sealing edge surface in the contact area. This paper includes both numerical and experimental studies on the tribological behavior of rotary shaft seals. A multiscale finite element model provides the simulation of the macroscopic deformations and the microscopic displacements. A test rig equipped with a hollow glass shaft enables in situ visual contact analyses, qualitative determinations of pressure distributions and quantitative measurements of elastomer surface distortions. The optical phenomenon of frustrated total internal reflection enables qualitative evaluations of the pressure distribution. Particle image velocimetry (PIV) is employed to quantify the tangential distortions. The test rig enables the measurement of the friction torque with the same configuration. The results of the numerical and experimental investigations for the radial load, friction torque and tangential distortions are compared and discussed. This serves to validate the simulation methods and the correlation of the measured parameters. This finally results in a solid and validated basis for further tribological investigations of rotary shaft seals.

1. Introduction

Rotary shaft seals prevent leakage of fluid into the environment and the ingress of dirt into industrial machinery and technical systems. As shown in Figure 1, rotary shaft seals are complex tribological systems that, in addition to the sealing ring as the sealing element, include the shaft as the sealing counter face, the fluid to be sealed, e.g., lubricant, and the ambient and operating conditions. Tribological fundamentals and detailed information on rotary shaft seals can be found in [1,2]. Two sealing mechanisms can be distinguished. The static sealing mechanism results from the interference between the inner diameter of the sealing ring and the outer diameter of the shaft, as well as from the spring pressing the sealing edge onto the shaft surface. The active sealing mechanism results from the relative movement between the sealing edge and the shaft surface in operation. This causes fluid to be sealed to be pumped from the air side to the fluid side in the axial direction. Various functional hypotheses and physical operating principles on multiple scales serve as explanations.
The misalignment-induced macroscopic wiping edge principle is based on the bidirectional fluid flow of rotary shaft seals. Jagger [3] demonstrated this effect with two-sided flooded rotary shaft seals. The lubricant on the fluid side was dyed differently than on the air side. After a short time, he observed a mixture of the two lubricants. Based on this, Müller [4] and Gawlinski [5] determined a pumping capability of rotary shaft seals due to a relative reciprocating motion of the sealing counter face caused by eccentricity. Borras et al. [6] studied this operating principle using a macro-elastohydrodynamic lubrication model. They concluded that the macroscopic wiping edge principle complements, but does not replace, existing microscopic viscous sealing principles. Experimental test rig experiments by Bekgulyan et al. [7] confirmed this conclusion. The microscopic viscous sealing edge distortion principle attributes the back-pumping mechanism to distortions of the asperities on the rough elastomer sealing edge surface caused by shear forces. Based on the work of Kawahara et al. [8], Kammüller [9] found in experimental studies that the distorted asperities align similarly to the shape of the flanks of a threaded shaft seal and consequently deflect tangentially dragged fluid in the axial direction. Hence, they provide hydrodynamically active structures. Kammüller used a hollow shaft made of polymethyl methacrylate (PMMA) in conjunction with light microscopy to visualize the tangential deformations. For this purpose, a highly reflective gold layer was evaporated onto the sealing edge surface. These findings were corroborated by van Leeuwen and Wolfert [10] and Schulz et al. [11] in visual experiments. In addition to experimental work, Grün et al. provided numerical evidence of distorted asperities on new [12] and worn [13] sealing rings. Finite element analysis (FEA) serves to compute the macroscopic deformation of the sealing edge and the microscopic distortion of the sealing edge surface roughness. A wide variety of methods for numerical modeling of the sealing edge roughness can be found in [12,13,14,15,16,17]. Some of them are considerable simplifications. In this study, real measured surfaces are applied to the FE model following Wenk et al. [17].
The friction between the elastomer sealing edge surface and the shaft counter face depends on a couple of factors. As described in [18], the design of the seal, the fluid properties of the lubricant, the pressure to be sealed, the temperature, the sliding speed and the surface finish have a considerable influence. Based on systematic investigations of the friction in rotary shaft seals from [19], the friction can be divided into two components. According to Lein [19], a speed-independent boundary friction component and a speed-dependent fluid friction component can be distinguished. Friction torque measurements with simultaneous temperature measurements in the contact area between the sealing edge and the shaft surface on the air side are presented in [20]. Based on the measured temperature increase, the speed dependence of the friction parameter
ϕ = μ η · x ˙ · π · d F R 1 3
is obtained according to [21,22]. Let μ be the coefficient of friction, η the dynamic viscosity, x ˙ the sliding velocity, d the nominal diameter, and F R the radial load. Plotted versus the dimensionless coefficient
G B r i n k = η · n · π · d · b F R
according to [23], this results in the Gümbel number diagram, as shown in Figure 2. Here, b is the contact width of the sealing edge, and n the shaft speed. The friction coefficient
μ = F T F R
with the tangential friction load F T is plotted versus the Gümbel number [24], also known internationally as the Hersey number [25]:
G h y d = 2 · n · η · b · π 2 · d F R .
This hydrodynamic duty parameter is still an important parameter for describing the friction behavior of a wide variety of seals, e.g. [26,27,28,29].
The present study deals with the numerical and experimental analyses of the multi-scale structural mechanics of rotary shaft seals. An FE model described in detail in [12,13] is adopted for the numerical analyses. In contrast to the numerically generated surface roughness in [12,13], here, surface measurement data from real sealing edges are implemented directly. This provides a realistic investigation of the micro mechanical effects in the sealing gap. The experimental analyses involve radial load measurements, friction torque measurements, and visual experiments. Radial load and friction torque are macroscopic parameters. The contact analysis, the evaluation of the contact pressure distribution and the quantification of the tangential displacement are carried out on the micro-scale. The phenomenon of the frustrated total internal reflection enables a qualitative evaluation of the contact pressure. Here, the particle image velocimetry (PIV) is not used to analyze flows, but serves to track the fillers and asperities in the elastomer surface. This allows a quantification of the tangential displacements. The results of the numerical and experimental analyses are compared and discussed.

2. Materials and Methods

2.1. Materials

The tests were carried out on rotary shaft sealing rings conforming to DIN 3760 [30] and DIN 3761 [31] of type BAUM5x7 80x100x10 75 FKM 585 from Freudenberg Sealing Technologies GmbH (Weinheim, Baden-Württemberg, Germany). The nominal inner diameter is d = 80   mm , and the sealing elastomer is a fluororubber (FKM) with a hardness of 75 Shore A according to data sheet [32]. Based on [33], the parameter C 10 = 1.568   M P a is determined for the Neo-Hookean material model used in the FE models. A Keyence VK-9710 confocal laser scanning microscope (Keyence Corporation, Osaka, Osaka Prefecture, Japan) was used to measure the elastomer surface in the area of the sealing edge. A total of 8 positions were recorded on each of 6 unmounted sealing rings. The roughness parameters were determined as described in [34]. Over the total of 48 measurement fields, the root-mean-square height was in a range of S q = 2.27 3.46   μ m . The mean value was S q = 2.80   μ m . Figure 3 shows 3 representative surface sections of the measured surfaces. The surface sections originate from different measurement fields of the examined sealing rings. These serve as input for the FE modeling. The roughness parameters refer to the entire surface section. It can be clearly seen that the machined fluid side is significantly rougher than the molded air side.
The lubricant used is an additive-free mineral oil (FVA 3 reference oil, ISO VG 100) with a viscosity of η = 0.28   Pa   s at a temperature of ϑ = 20   ° C .
The sealing counter face is a hollow shaft made of borosilicate glass. The refractive index is n = 1.473 for light with a wavelength of λ = 587.6   n m . The hollow shaft has an outer diameter of d o = 79.9013 ± 0.0987   mm and a roundness deviation of t = 0.0778   mm . Thus, the roundness tolerance according to DIN 3761 [35] is minimally exceeded. The shaft surface requires tactile measurements, since the glass surface is not reflective. Hence, in contrast to the sealing edge surfaces, only two-dimensional roughness parameters can be given for the hollow glass shaft surface. A Hommel Etamic—T 8000 tactile roughness measuring instrument (JENOPTIK Industrial Metrology Germany GmbH, Villingen-Schwenningen, Baden-Württemberg, Germany) provides the determination of the surface roughness of the sealing counter face on the hollow glass shaft. The hollow glass shaft has a maximum height of the roughness profile of R z = 0.06   μ m .

2.2. Radial Load Measurements

The radial load of the sealing rings significantly influences the tribological behavior of the rotary shaft seals. The radial load consists of two load components. The first component results from the interference between the outer diameter of the shaft and the inner diameter of the sealing ring. The sealing ring is expanded by being pushed onto the shaft during mounting, and the sealing edge is pressed onto the shaft surface. The second load component corresponds to the spring load. The radial load measurement is performed using the split shaft method according to [36]. Figure 4 shows a schematic diagram of a radial load measurement device with a split-shaft mandrel. One half of the mandrel is stationary, and the other is reciprocating and preloaded by a spring. As the sealing ring presses the measuring mandrels together, a distance sensor detects the deviation. A linear actuator moves the mandrel to the nominal diameter, compensating for the diameter error. As shown in Figure 4, the load cell measures the projected load:
F M = 0 π d 2 · p l · sin φ d φ = d · p l ,
where p l is the line load. The radial load is described by
F R = 0 2 π d 2 · p l d φ = π · d · p l .
Based on Equations (5) and (6), the radial load can thus be described by
F R = π · F M
proportional to the measured load. Further descriptions and applications of the split-shaft method can be found, among others, in [36,37,38,39,40].
Feldmeth et al. [36] carried out extensive studies on the measurement of the radial load and provided recommendations on how to perform the measurement. In order to obtain realistic measurement results compared with those in operation, the sealing rings are stored on a shaft for at least 24   h before measurement. Subsequently, each sealing ring is measured at 5 positions, with an angular offset of 90 ° respectively. Here, the first position ( 0 ° ) corresponds to the fifth position ( 360 ° ). The average of the measured values at positions 2 ( 90 ° ) and 5 ( 360 ° ) yields the radial load of the sealing ring. In the present studies, the radial loads of all sealing rings were measured according to method C from [36] with and without a mounted spring. This yielded the load component of the interference between the shaft and the sealing ring diameter and the spring load component.

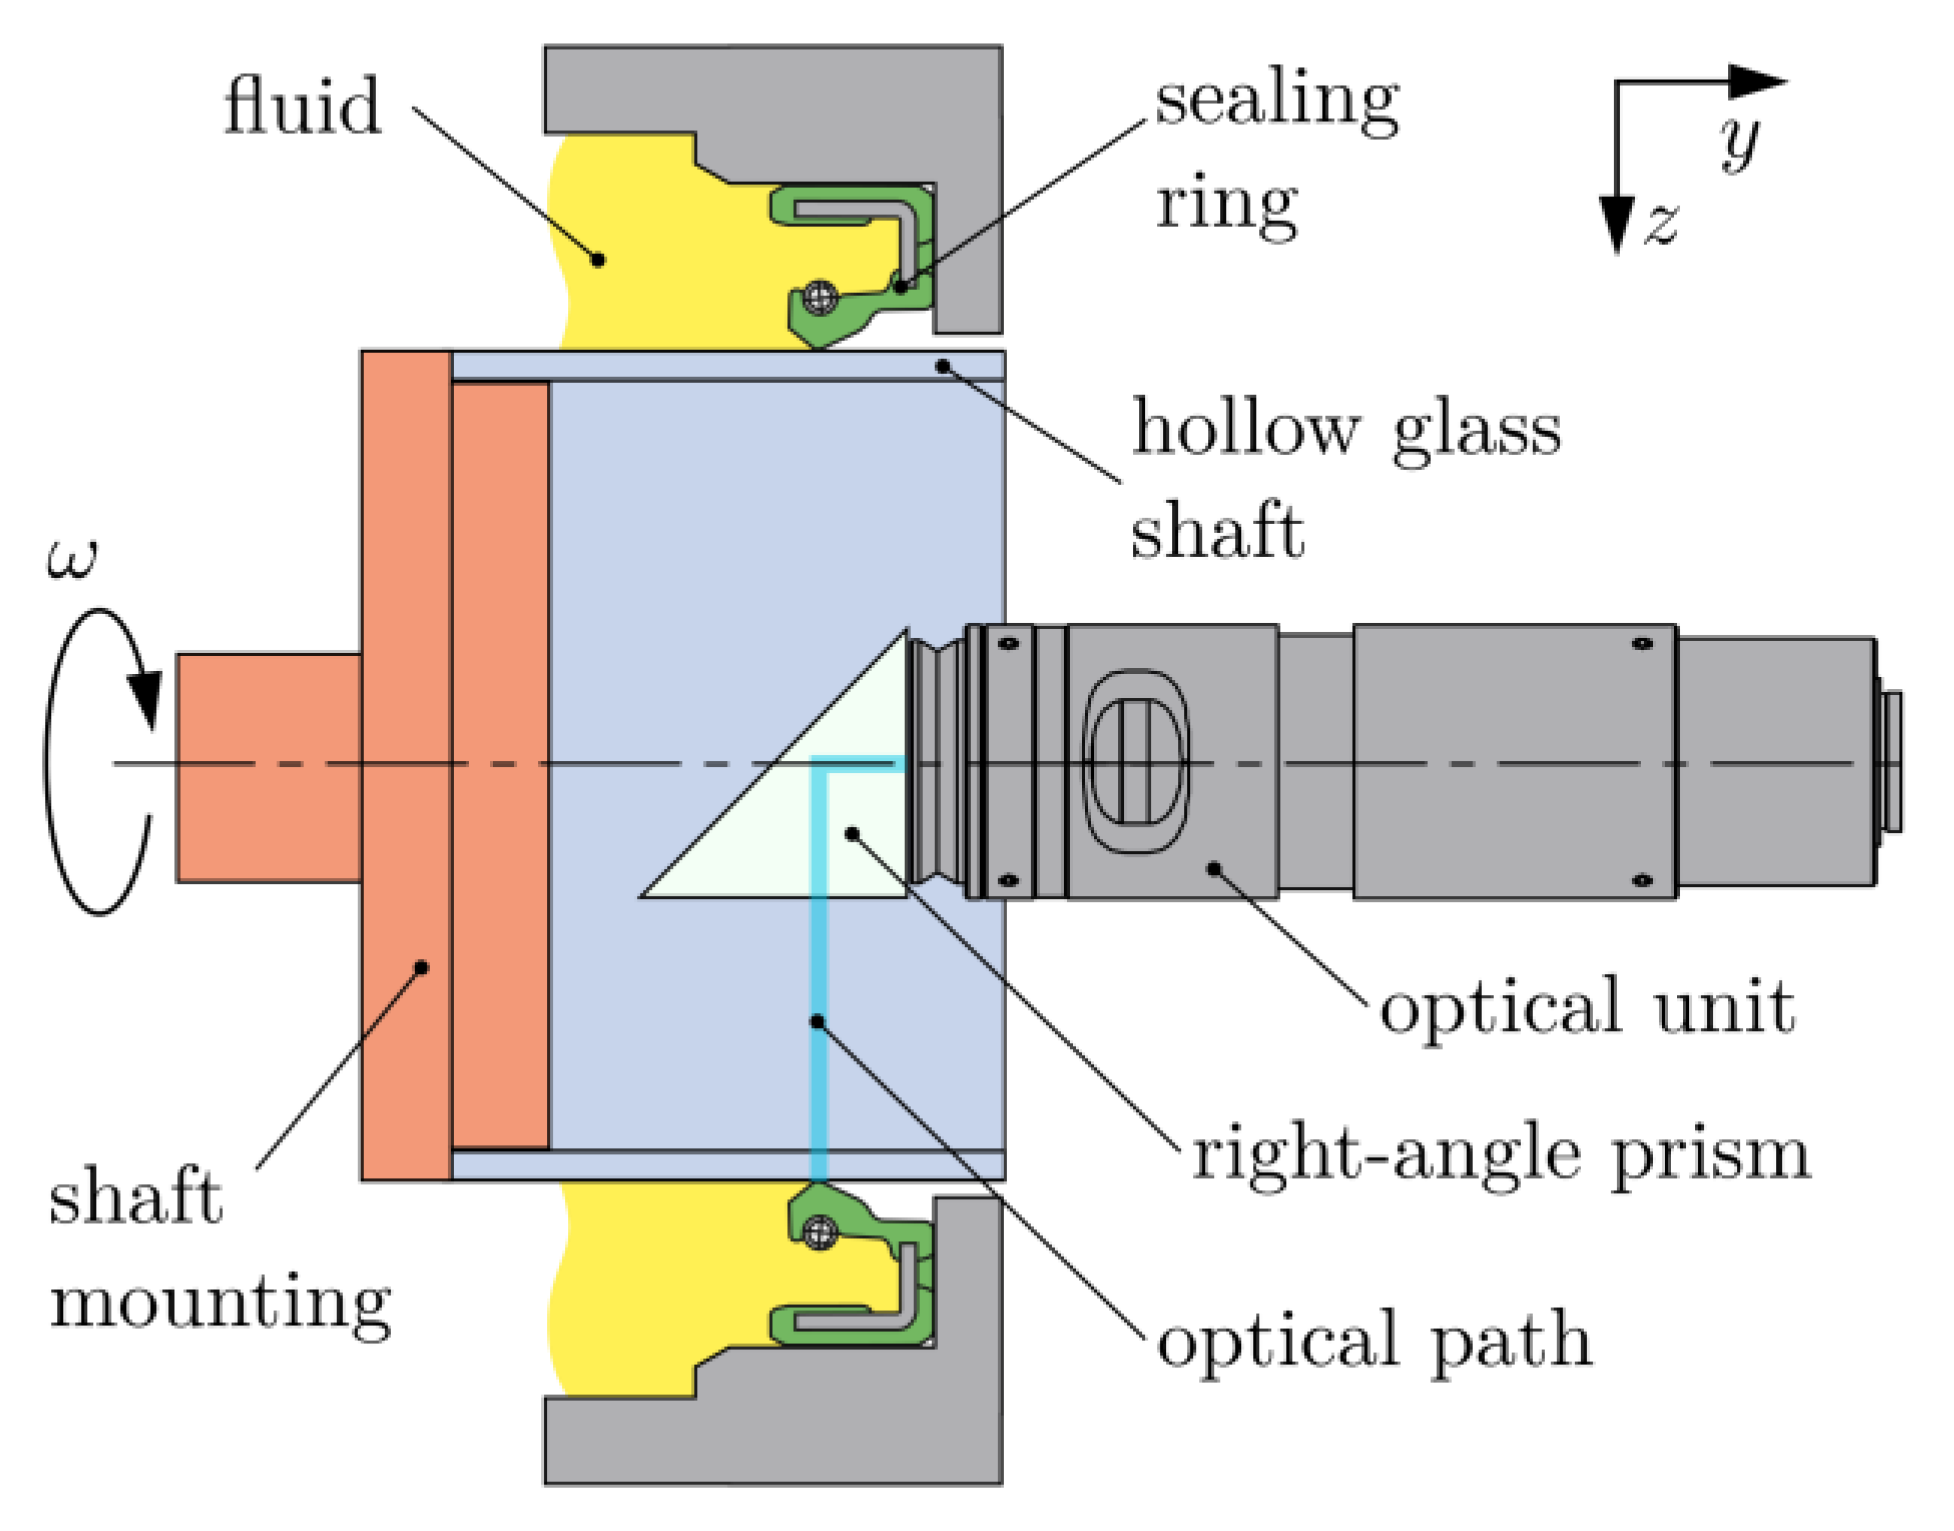
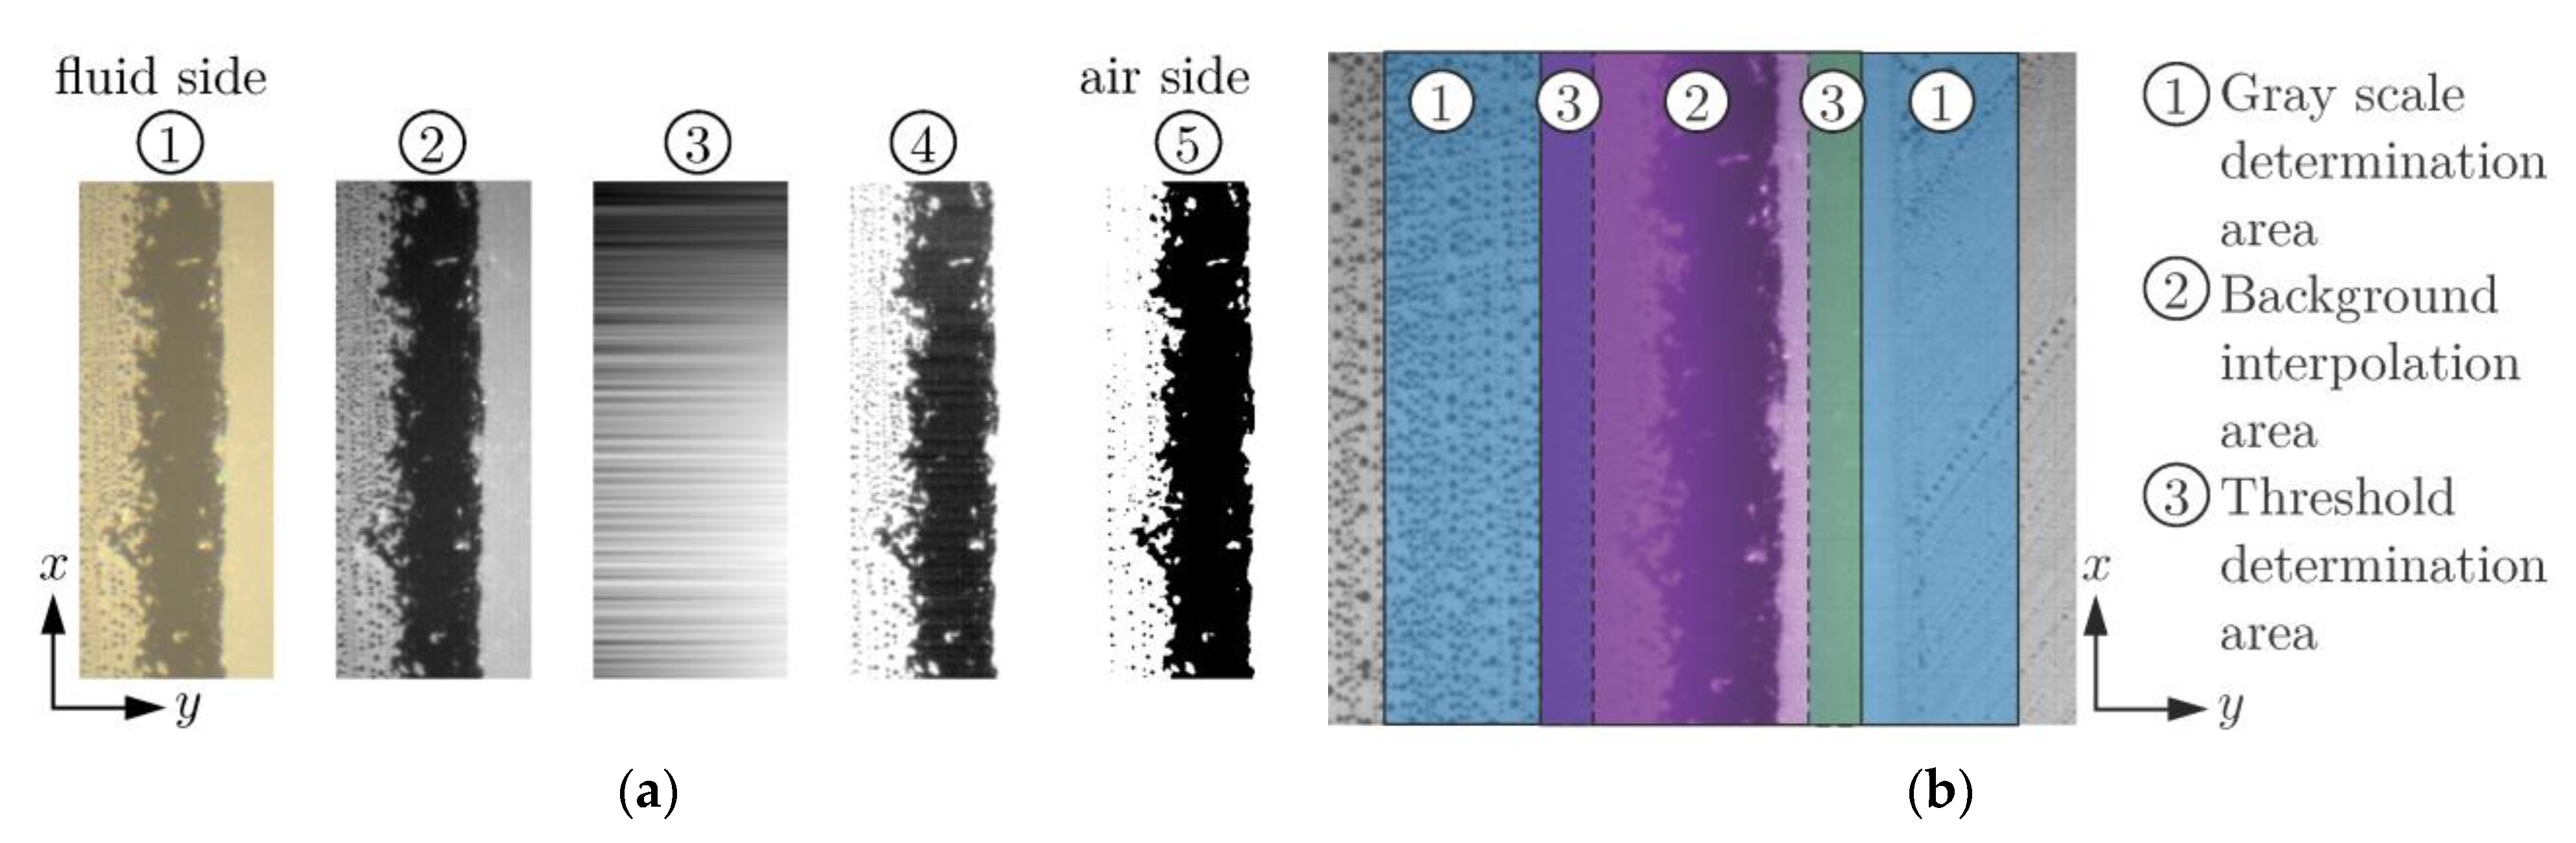
2.3. Visual Experiments

The visual test rig corresponds to the setup of the test facility from [11] with slight modifications. Figure 5 shows the principal experimental setup. The hollow glass shaft enables visual examination of the sealing contact during operation. An IDS UI-3140CP-C-HQ camera (IDS Imaging Development Systems GmbH, Obersulm, Baden-Württemberg, Germany) is used to take pictures of the sealing contact during operation. It has a maximum frame rate of 169   f p s at a maximum resolution of 1280 × 1024   p x . In combination with an applied Navitar 1-80100D lens (Navitar Inc., Rochester, New York, NY, USA), a resolution up to 400   n m   p x 1 can be achieved. In order to examine the sealing contact through the hollow glass shaft, good illumination is necessary. A coaxial light and light cables with a cold light source provide the illumination of the contact area.
The contact between the hollow glass shaft and the sealing edge can be analyzed with the coaxial light when stationary. Dark areas of the image correspond to the contact area. For a quantitative evaluation, the original image is processed first. The steps of the image processing are shown in Figure 6. The original image (Figure 6(a①)) is first converted to a grayscale image (Figure 6(a②)). Based on the differences in brightness at the edges of the analyzed area (no contact between the sealing edge and the shaft), an image background is interpolated (Figure 6(a③)). Figure 6b illustrates the exemplary process of the background interpolation. Each of the two blue areas (Figure 6(b①)) provides a median value of the gray scale per row in the y direction. These two gray levels represent the limits for the linear interpolation per row in the purple area (Figure 6(b②)). Subtracting this background from the grayscale image yields a uniformly illuminated image (Figure 6(a④)). Thresholding performs the binarization of the image (Figure 6(a⑤)). The threshold results from the green areas in Figure 6(b③). Let g 1 ( x , y ) and g 2 ( x , y ) be the gray values of the two areas; the threshold is set to
g t h = 0.9 · min g 1 , g 2 .
Here, g 1 and g 2 are the mean values of the respective area. The factor 0.9 has been established over many evaluations as an empirical value to obtain comparable results. A Boolean matrix defines the resulting binary image. Here, 1 (true) denotes a black pixel ( g < g t h ), and 0 (false) a white pixel ( g g t h ). By averaging the values by columns ( x direction), the percentage contact area in the axial direction is obtained. From this, a percentage contact area ratio curve can be determined. Another threshold k is defined to distinguish between contact and non-contact. This allows the quantification of the contact width between the hollow glass shaft and the sealing edge.
Hermann and Seffler [41] presented a method for the qualitative experimental determination of the static contact pressure distribution in the sealing contact. For this purpose, the optical phenomenon of frustrated total internal reflection is exploited, as described in [42]. Figure 7a illustrates the method schematically. For this purpose, an impurity in the form of a wire is inserted axially into the contact area (across the contact band). The impurity interrupts the contact band, and a contact interruption curve appears through the hollow glass shaft. This corresponds qualitatively to the static contact pressure distribution profile. The slight deformation of the sealing edge arises due to the contact pressure counteracting the deformation. This implies that a higher contact pressure compensates the impurity easier than a low contact pressure, and thus, the curve lies closer to the impurity. Figure 7b shows an example of the evaluation, carried out analogously to the contact analysis described previously.
Within the scope of this study, the particle image velocimetry (PIV) described in [43] provides the computation of the displacement of the sealing edge surface. PIV is an optical method that is typically used to measure the motion of a fluid flow. Particles are added to the fluid, and their motion is tracked. Fillers and roughness of the elastomer surface of the sealing edge behave similarly to particles, allowing determination of the displacement of the sealing edge surface. From the velocities determined according to [44], the absolute displacements of the sealing edge surface can be determined and plotted over the contact width. The evaluation of the tangential displacement of the sealing edge surface was carried out at a circumferential velocity of x ˙ = 0.42 × 10 3   m   s 1 . Higher velocities lead to a distance between the individual frames of the video that is too excessive for a reasonable evaluation by means of PIV. Visual observations at higher circumferential speeds show a negligible difference in the shape of the sealing edge surface displacement.

2.4. Friction Torque Measurements

The friction torque of rotary shaft seals can be measured on the same test rig as the visual experiments. Figure 8 shows the setup of a friction torque measurement. This reduces the influence of the sealing ring housing on the friction torque measurement. The torque is transmitted by the lever arm and measured by a pressure sensor. This setup allows friction torque measurements under the same conditions as in the visual experiments.

2.5. FE Modeling

The FE modeling includes the discretization and meshing of the computational domain, the material definition as well as the determination of the boundary conditions. A detailed description of the modeling can be found in [12,13]. In contrast to this model, real measured surface data are used here rather than numerically generated data. A total of 4 different sealing edge geometries are considered. An idealized smooth geometry provides the evaluation of the macroscopic effects and the comparison with the measured values. The three real measured surfaces shown in Figure 3 are used to show the formation of microscopic hydrodynamic structures. The macro geometry remains the same for the sealing ring. Figure 9 shows the rough sealing edge surfaces considered. The MountainsMap 7 software (Digital Surf SARL, Besançon, Bourgogne-Franche-Comté, France) is used to post-process and export the microscope data from Figure 3. The macroscopic shape of the sealing edge is removed using a polynomial of the 7th degree. The resulting planar rough surface is exported. The superposition of the ideally smooth sealing edge with the planar rough surfaces finally leads to the sealing edge surfaces in Figure 9. As in the microscope images from Figure 3, the different levels of roughness become apparent. Furthermore, the higher roughness of the sealing edge on the fluid side is also clearly visible.
The remaining modeling is analogous to [12,13]. Only the simulation parameters, shown in Table 1, are different. In order to determine the material parameter C 10 for the hyperelastic Neo-Hookean material model, method D from [33] is adopted. The coefficients of friction applied are obtained from the literature [45,46,47,48] for the corresponding lubricant elastomer combination. For example, Wennehorst et al. [48] obtained valid results with a coefficient of friction of μ = 0.30 , and Plath et al. [46] with a coefficient of friction of μ = 0.35 in numerical analysis of rotary shaft seals. The radial load component resulting from the spring is given by the difference between the radial load measurements with and without mounted spring. The radial load of the tested sealing rings is, on average, F R = 20.16   N . Applied to a 0.1 ° segment of a sealing ring, this corresponds to a force of F S = 5.6 × 10 3   N . A quasi-static state is assumed.

3. Results

3.1. FE Analysis

The FEA provides the numerical computation of the multiscale structural mechanics of rotary shaft seals. Figure 10 shows the radially pressed and tangentially distorted sealing edge surfaces. The coordinates up to a height of z 13.5   μ m are considered. Here, z = 0 equals to the shaft surface. The corresponding contact pressure distributions are shown in Figure 11. The resulting data were smoothed as described in [49,50] to minimize numerical noise. The dashed black line represents the mean tangential displacement u .
During mounting, the asperities of the rough elastomer sealing edge surface are strongly flattened. The roughness difference between the fluid and air sides remains even in the deformed state. Hence, the root mean square height in the deformed state is S q = 0.30   μ m for Figure 10a, S q = 0.27   μ m for Figure 10b and S q = 0.37   μ m for Figure 10c. This is consistent with the findings of Wenk et al. [17]. The deformation and alignment of the asperities on the rough surface are particularly evident at the borders of the contact area. This results in hydrodynamically active structures, which are considered to be essential for the lubrication and sealing mechanism of rotary shaft seals according to [4,9].
The contact pressure distributions, shown in Figure 11, depend on the roughness of the elastomer surface. High contact pressures occur at high asperities, and the contact pressure decreases in roughness valleys. The contact pressure distribution serves to analyze the contact behavior of the sealing edge. As in the recording of the real sealing edge in contact with the hollow glass shaft shown in Figure 6, the air side border of the contact area is clearly sharper than that on the fluid side. Certain asperities of the rougher surface of the fluid side flank angle contact with the shaft surface, resulting in a blurred border.

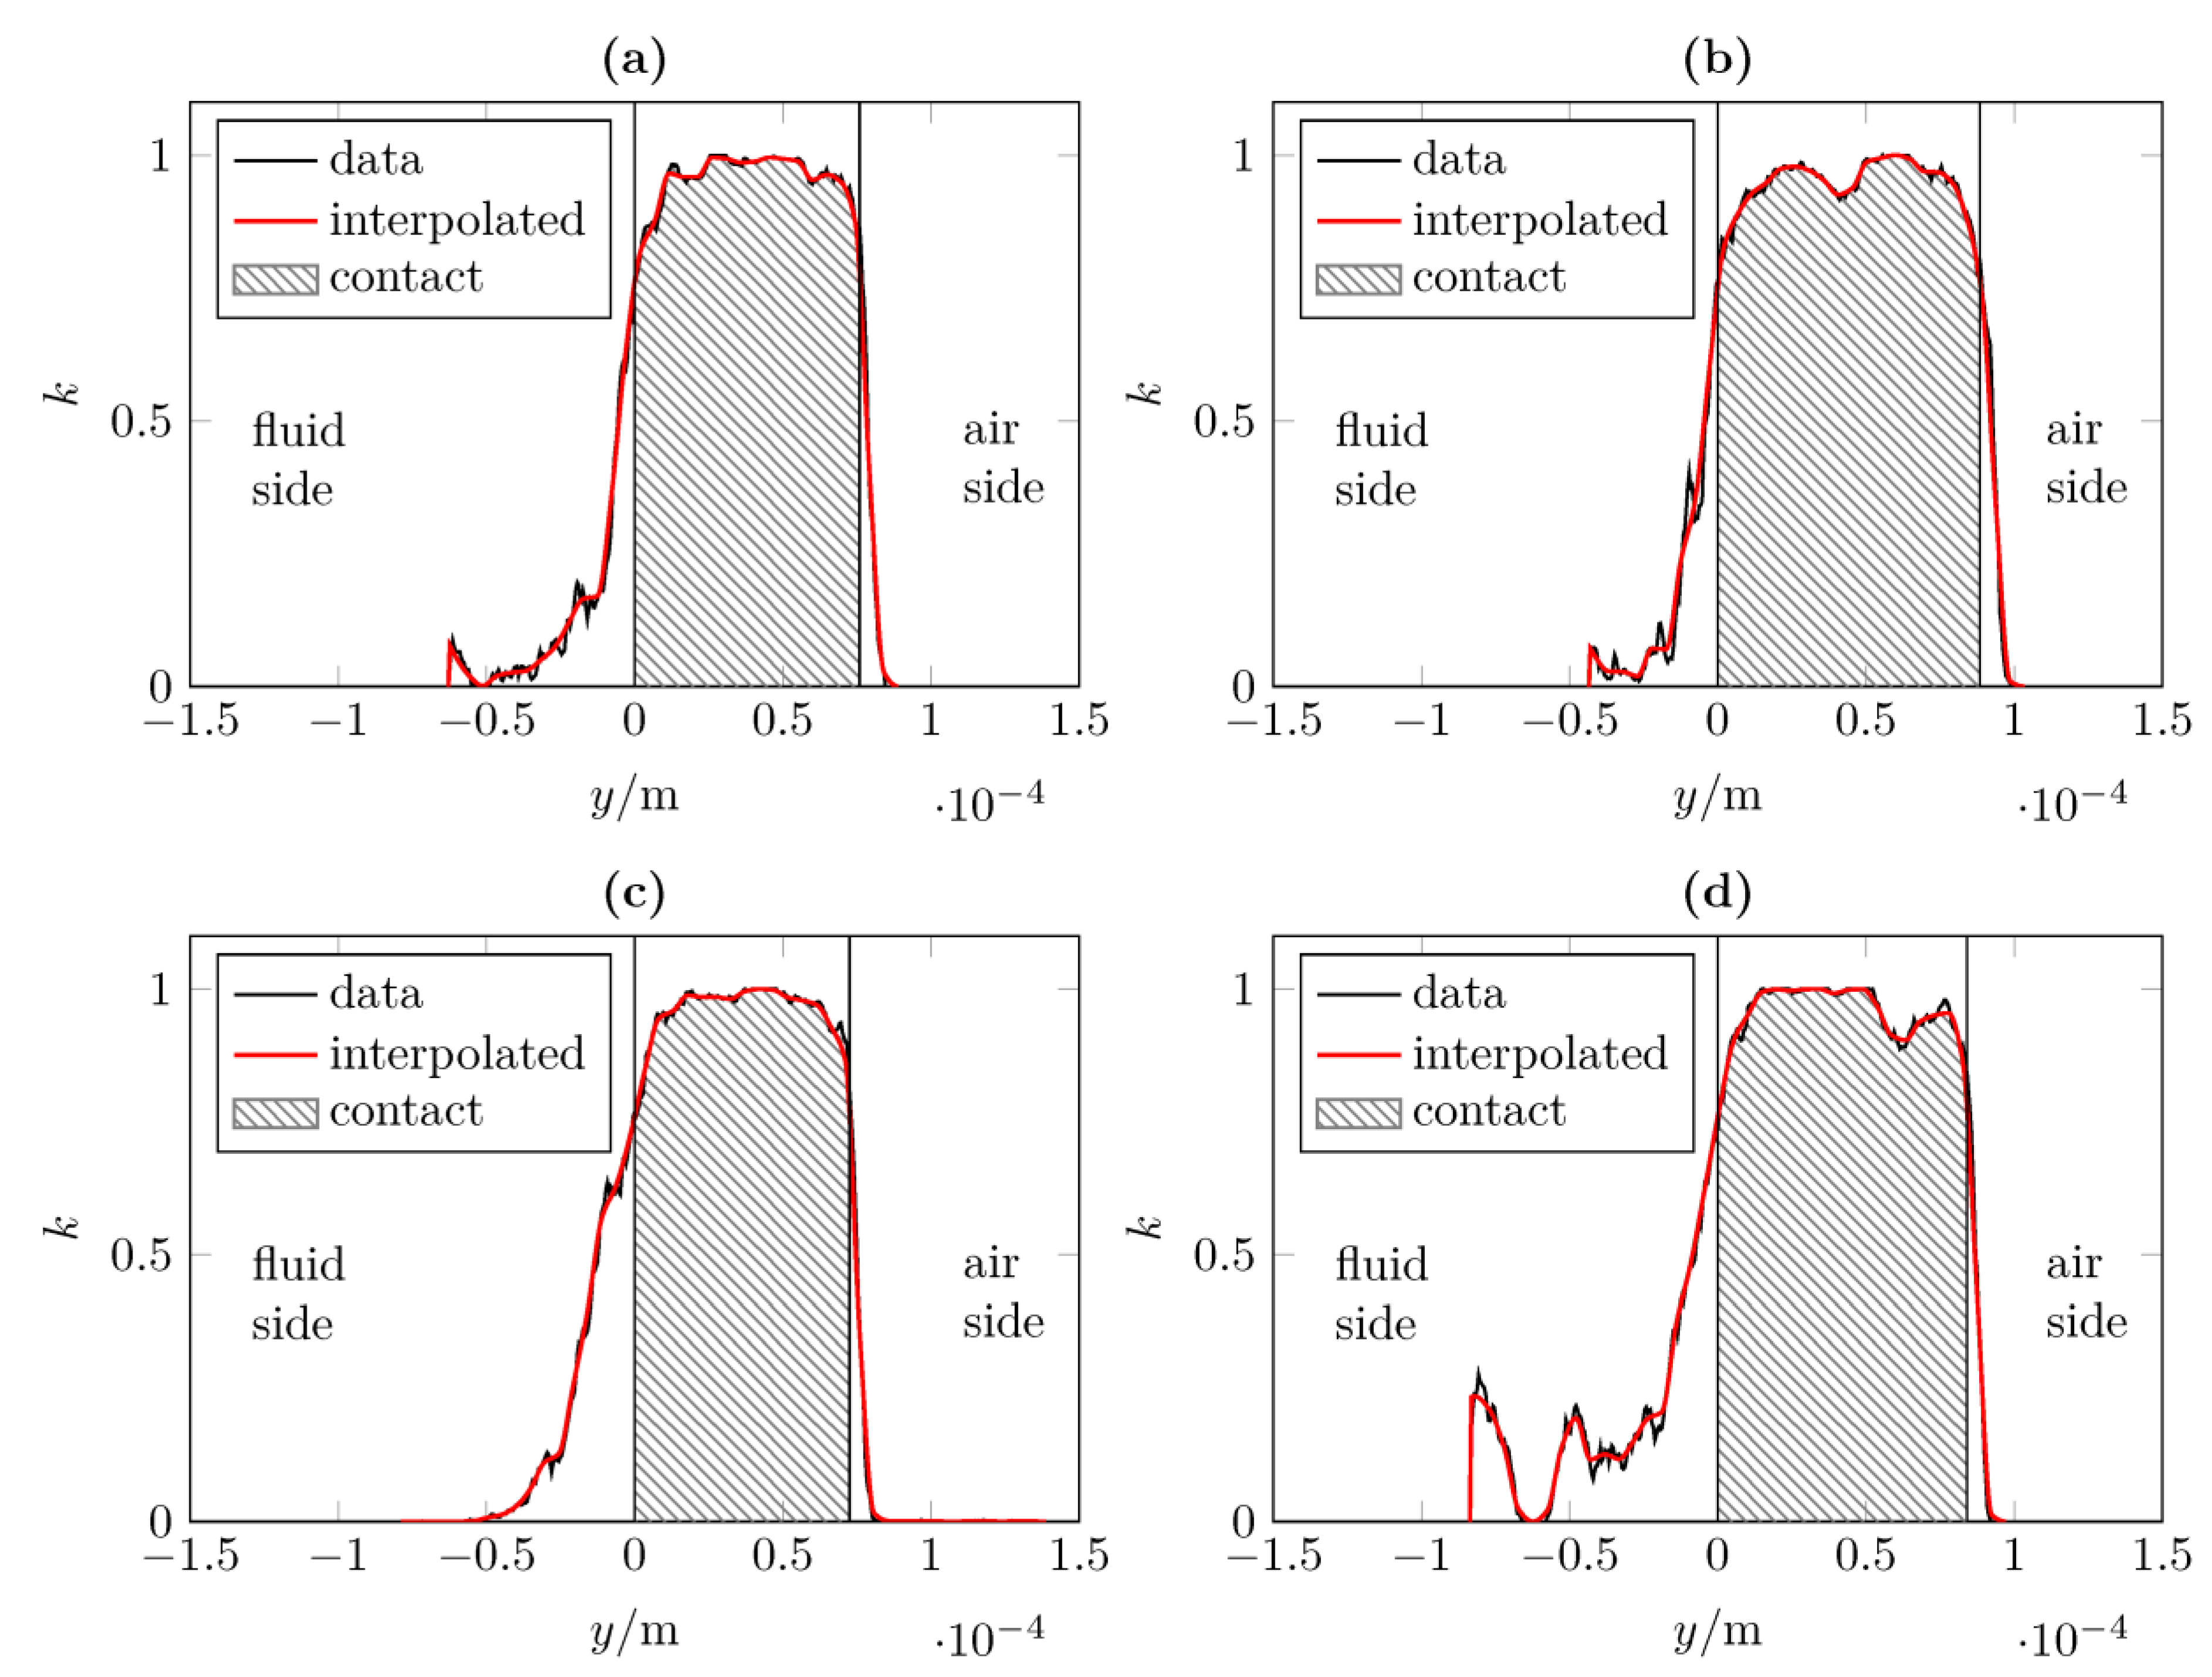
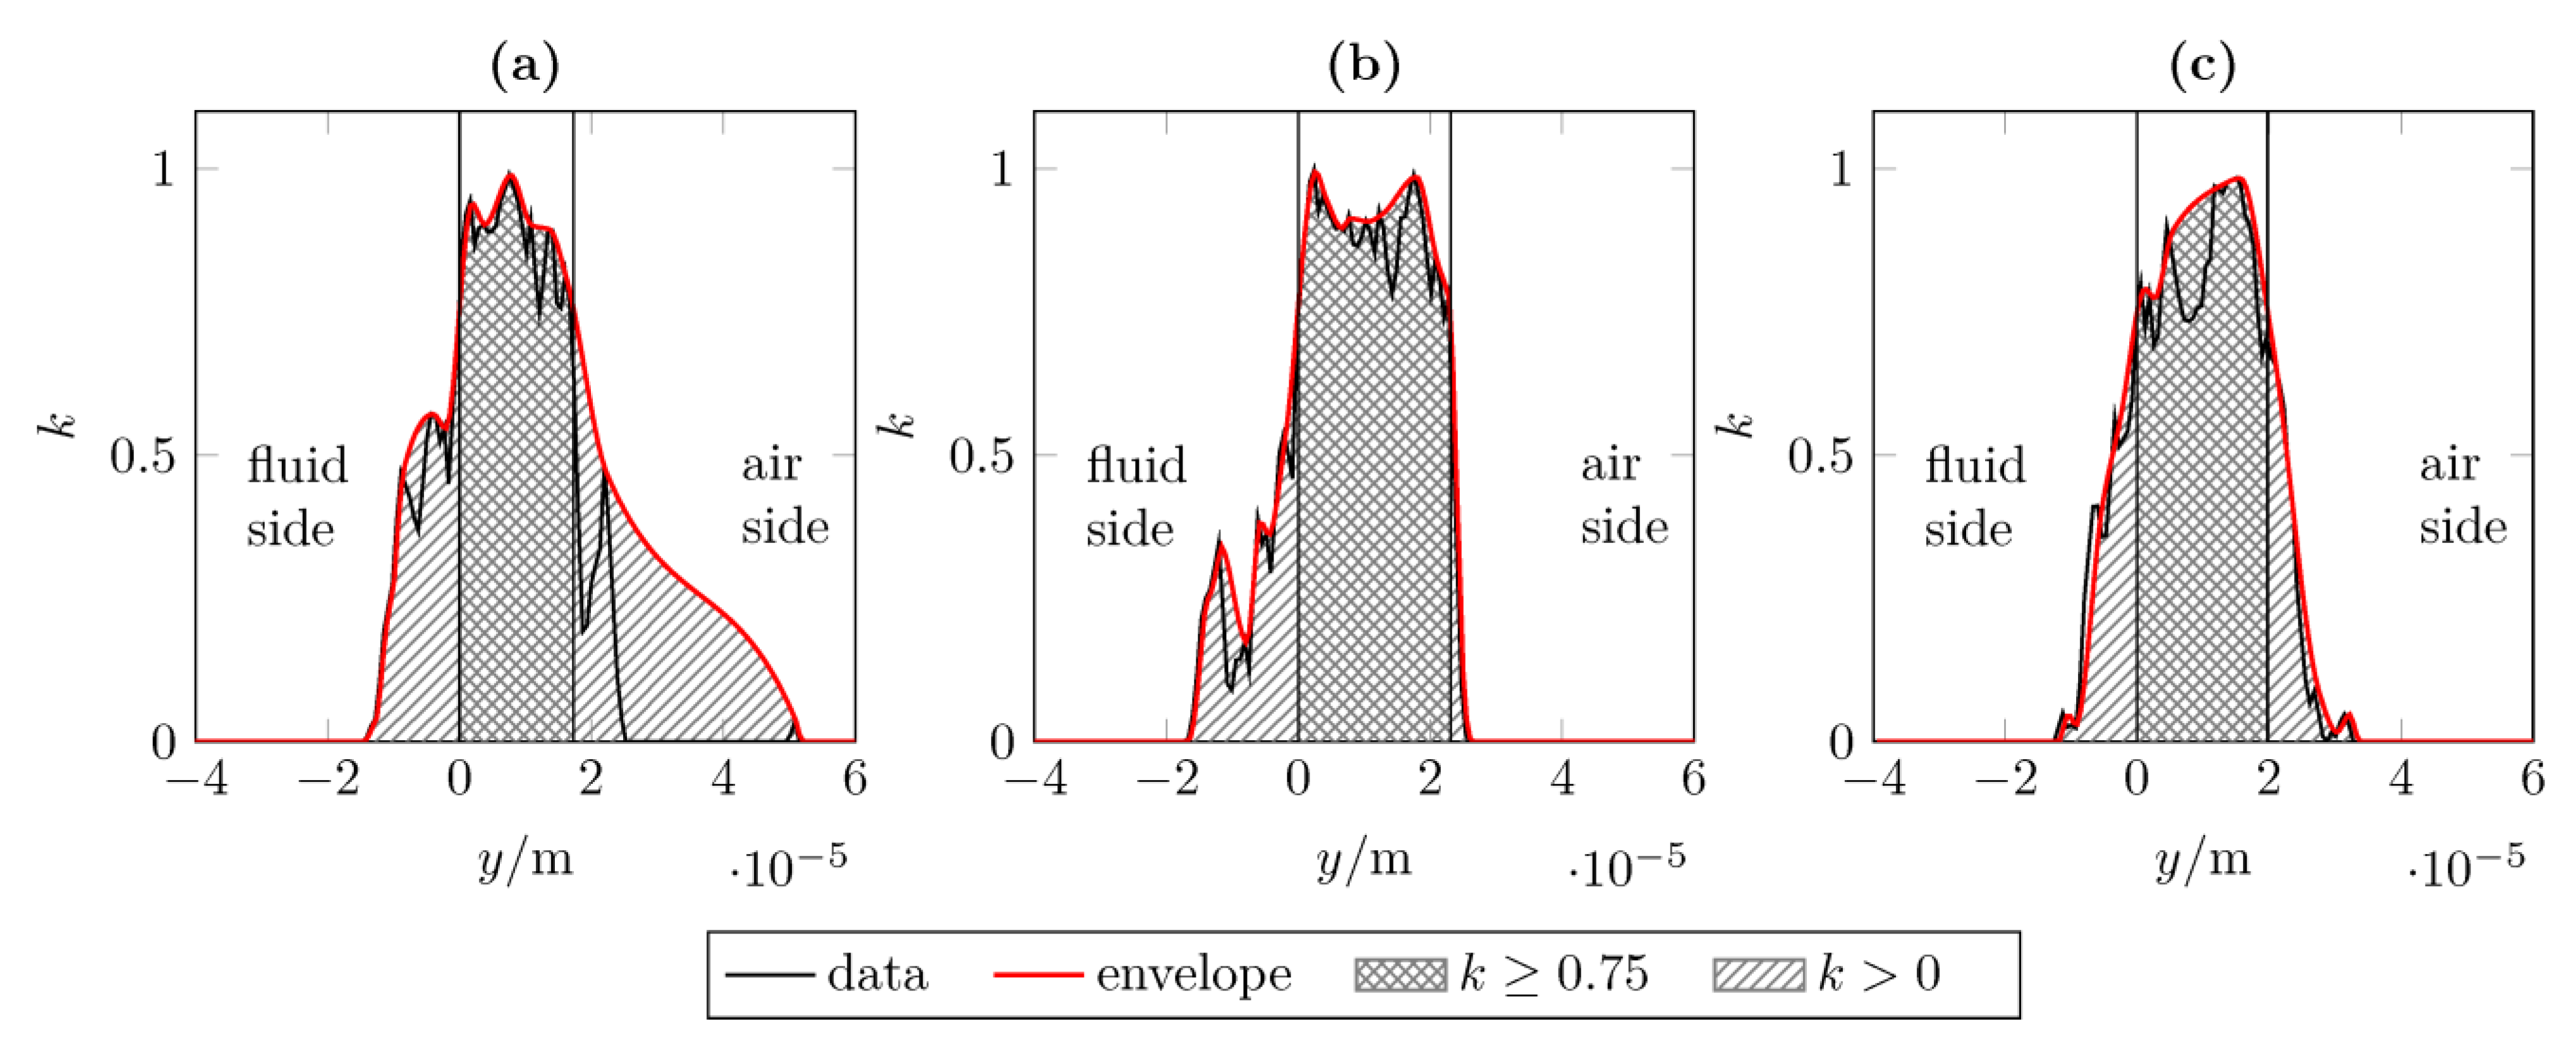
3.2. Contact Analysis

The contact analysis considers the rotary shaft seal at standstill. The sealing ring is, therefore, mounted on the shaft, and the sealing edge is radially compressed, but the shaft is not rotating. Figure 12 shows the measured percentage contact areas. The contact percentage is plotted versus the axial direction y . Each contact area results from a different rotary shaft seal (RSS1–RSS4). The interpolated data serve to define the limits of the contact area based on the threshold k . The contact is defined from a threshold of k = 0.75 . Each contact area starts at the axial position y = 0 . The measured contact width lies in a range of b = 73 88   μ m and, on average, at b = 80   μ m . The contact areas from the FEA of the rough sealing edge surfaces are shown in Figure 13. The computed contact widths lie in a range of b = 17 23   μ m with a contact fraction of k 0.75 . The average contact width is b = 20   μ m . For k > 0 , contact widths result in a range of b = 44 67   μ m . The average contact width is b = 52   μ m .
Figure 14 shows a summary of the contact analysis. In addition, the average cross-sectional profiles of the compressed sealing edges from Figure 10 are shown in the axial y direction. It becomes clear that the contact widths differ considerably between experimental and numerical results. The differences depend considerably on the contact definition in the numerical results. Defining the contact as k 0.75 in the evaluation of the simulated data leads to a deviation of 75% between the measured and the simulated contact width. Assuming the contact by means of k = 0 , the deviation decreases to 35%. Different reasons can lead to this kind of deviation. In the FE model, the shaft is ideally smooth, ideally round and has no deviation from the nominal diameter. As shown in Section 2.1, the used hollow glass shaft has a roundness deviation of t = 77.8   μ m . Figure 14 shows that the differences in contact correspond to an additional compression of the sealing edge by Δ h = 10   μ m , which is in the range of the roundness deviation of the shaft.

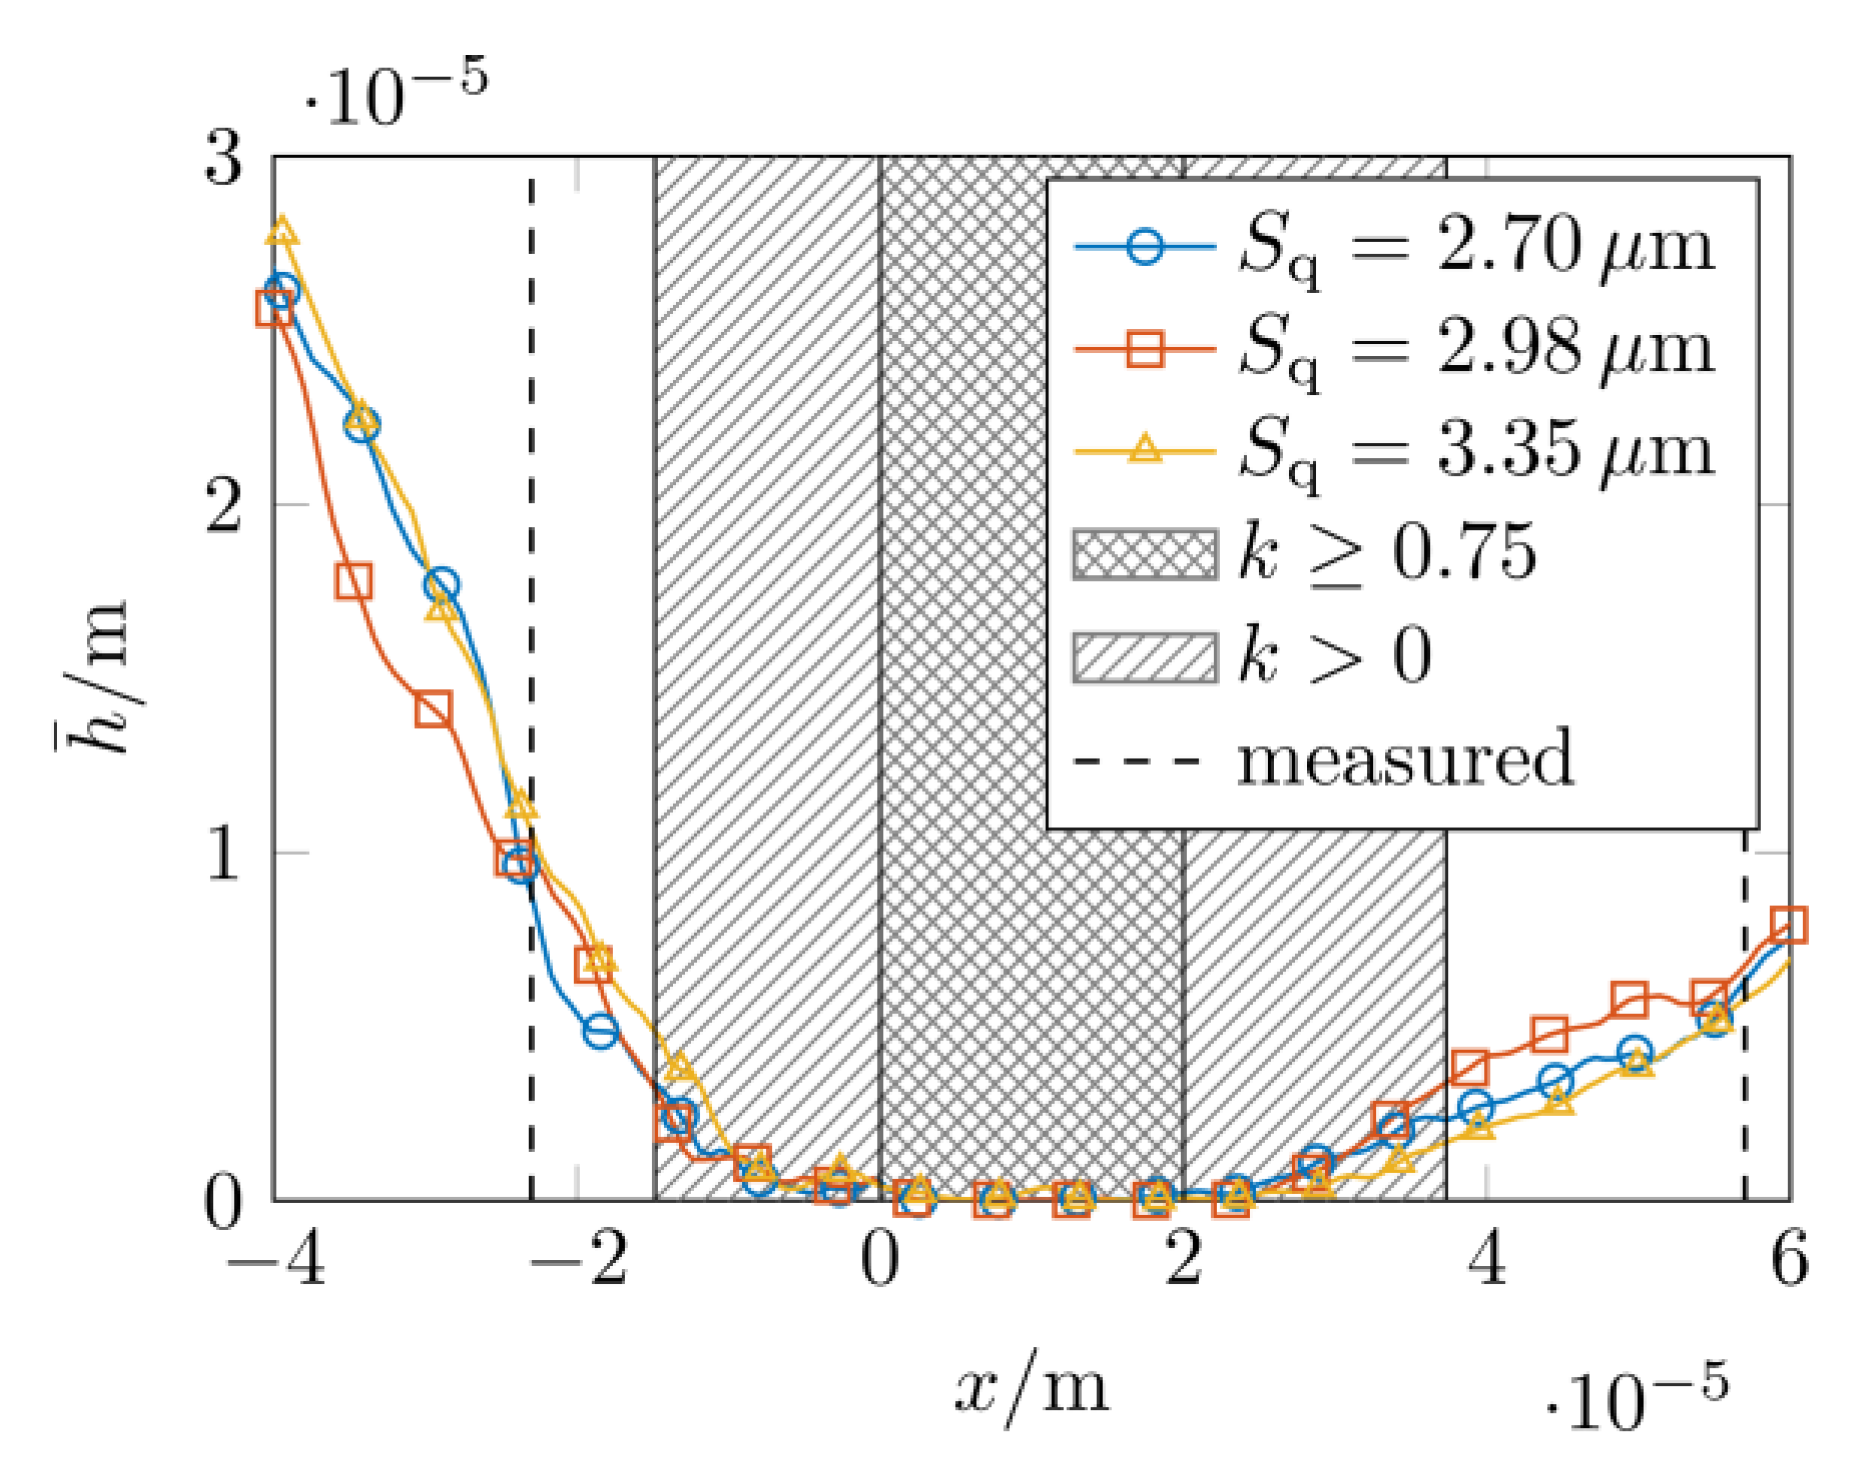
3.3. Contact Pressure

Figure 15a shows the measured qualitative contact pressure distributions by means of the contact interruption curves. The dimensionless normalized pressure p * is plotted versus the contact width in the axial y direction. Each curve is from a different sealing ring. The asymmetry of the distributions with the maximum on the fluid side is clearly apparent. The contact pressure versus contact width from the FEA is shown in Figure 15b. The column-wise mean value in the circumferential direction obtained from the distribution in Figure 11 is plotted. In addition, the contact pressure distribution of an ideally smooth sealing edge is shown. The asymmetry of the distribution is evident, as in the visual experiments. The contact widths from the experiments and from the FEA differ, as in the contact analyses. The FEA results show the influence of the roughness on the contact pressure distribution. The distributions show peaks and valleys. This indicates that parts with higher asperities are compressed more than parts with lower asperities. This effect is not apparent in the visual investigations of the contact pressure distribution.

3.4. Radial Load

The computed radial load is obtained based on a model with an idealized smooth sealing edge surface. This means that the applied sealing edge surface contains no microstructures like the sealing edges shown in Figure 9. The experimental results are from radial load measurements of 20 rotary shaft seals. Figure 16 shows the computed values in comparison with the measured values. The computed and measured values are in the same range. The FEA allows determination of the radial load both in the mounted and in the distorted state. The mounted state corresponds to the compressed sealing edge during the mounting of the sealing ring. In the distorted state, the sealing edge is compressed and tangentially displaced by the relative movement between the shaft and the sealing edge surface during operation. It shows that as the friction coefficient increases, the radial load decreases slightly by 5 % in the mounted state. At the same time, the radial force increases by 7 % when the sealing edge is distorted.

3.5. Friction Torque

The friction torque measurements are carried out at rotational speeds between n = 0.01   r p m and n = 200   r p m , corresponding to circumferential speeds between x ˙ = 0.0025   m   s 1 and x ˙ = 50.2655   m   s 1 . The measurements are performed with a low quantity of fluid. For the calculation of the friction coefficient μ according to Equation (3), the tangential friction load F T is obtained from the measured friction torque T M , and the normal load F R is determined from the radial load measurements. The viscosity is assumed to have a constant value of η = 0.28 Pa s, which corresponds to a value at a temperature of ϑ = 45   ° C . The contact width b = 80   μ m corresponds to the mean contact widths from the measurements in Figure 12. The resulting Gümbel curve is shown in Figure 17. The fit in the diagram shows, in general, the classical shape of the Gümbel curve. As the Gümbel number increases, the coefficient of friction has a local minimum at G h y d 4 × 10 8 and then rises again. Above a value of G h y d 1 × 10 6 , a further drop in the curve becomes apparent. This confirms measurements according to [26,51]. The diagram in Figure 17 also shows the friction coefficients considered in the FE analysis of the tangential distortions and the rotational speed where the measurements of the tangential distortions were carried out.

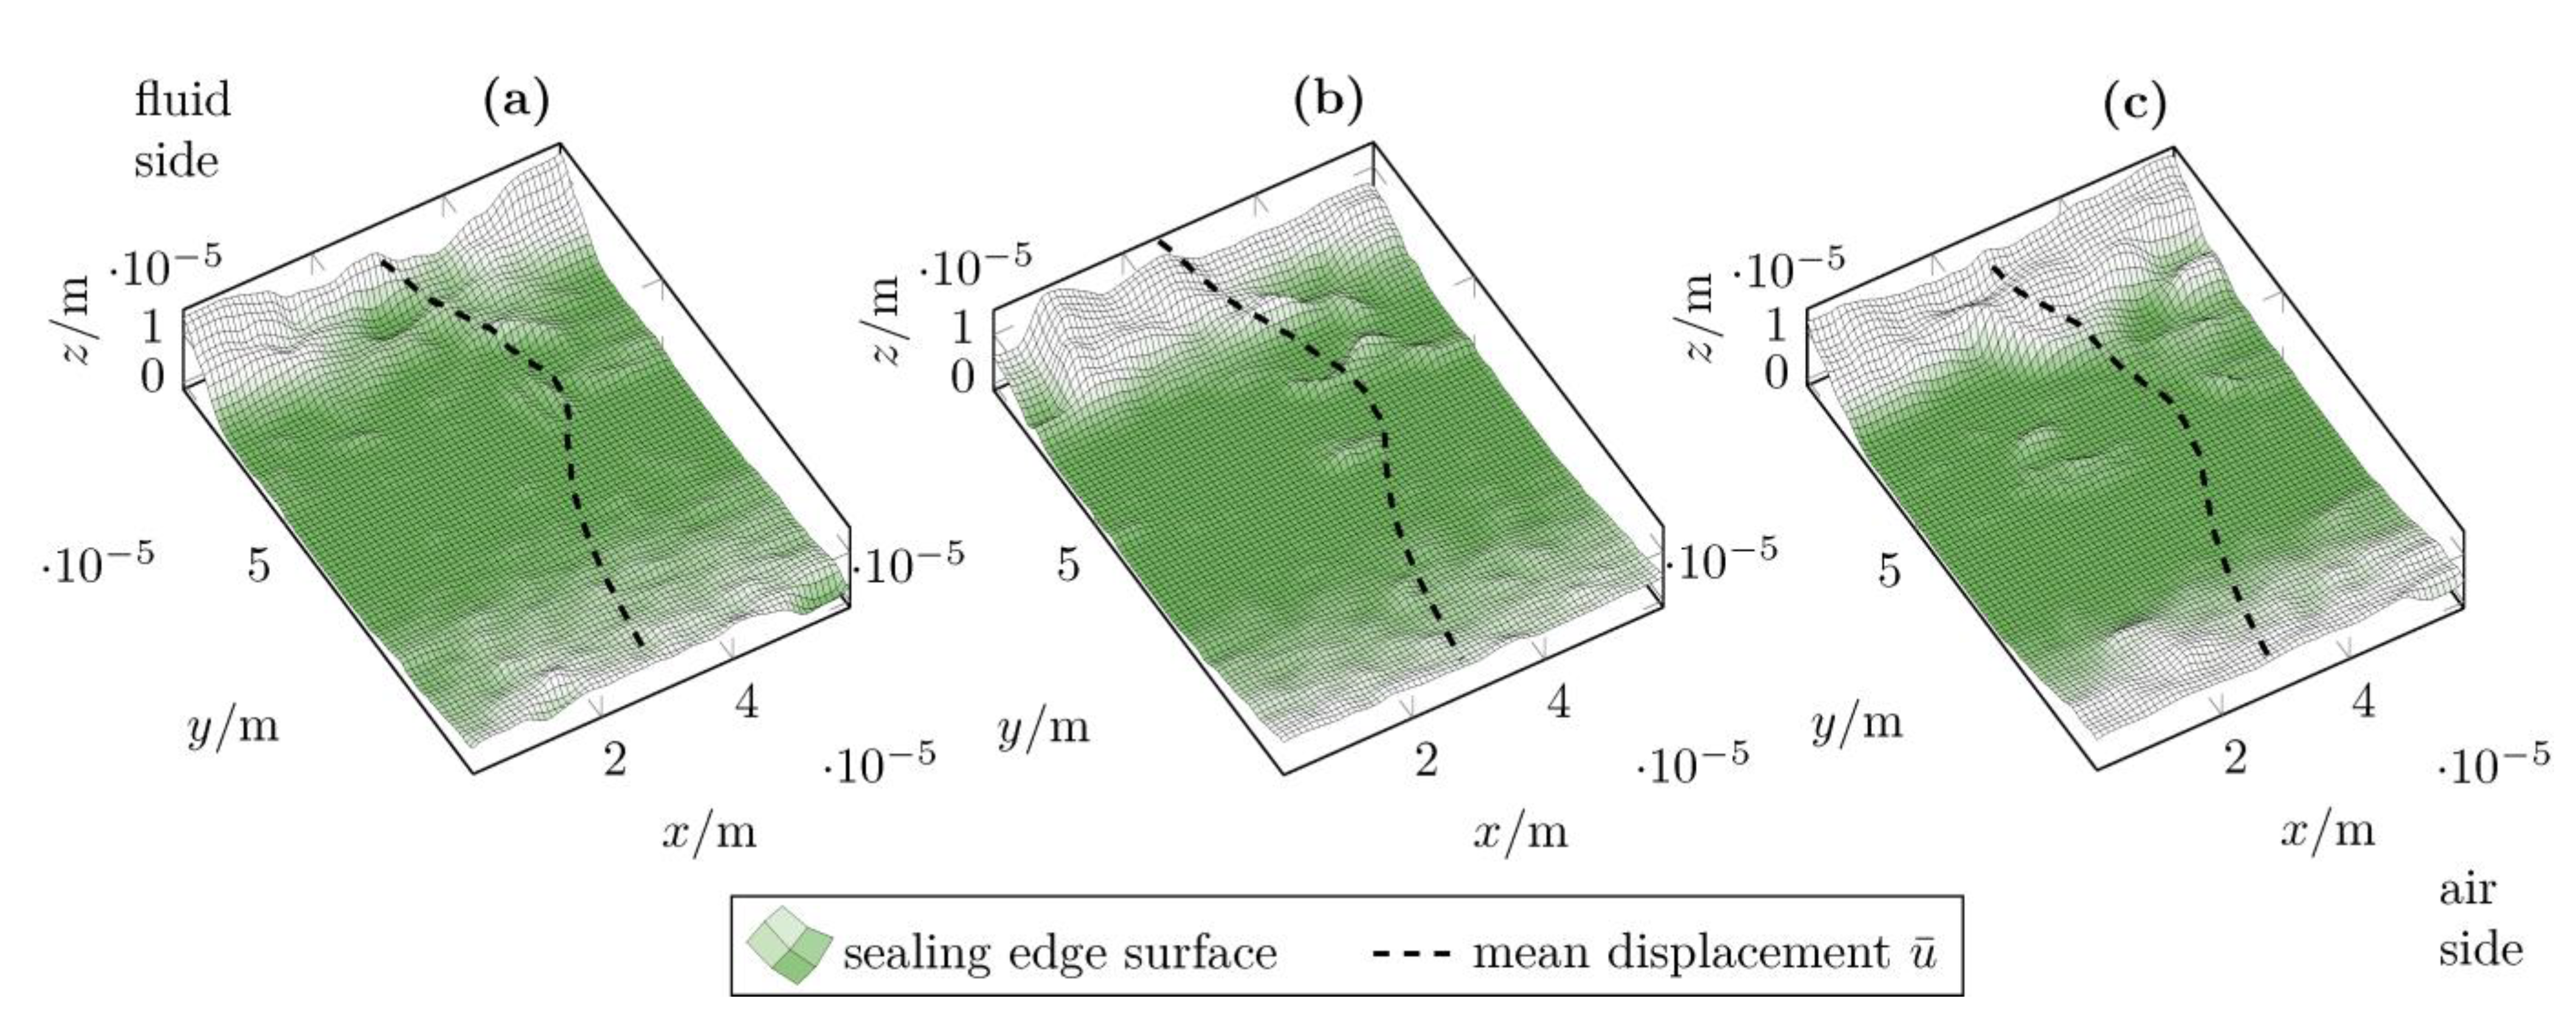
3.6. Tangential Displacement

The measurements of the tangential displacement of the sealing edge surface were carried out on 4 rotary shaft seals. The computed displacements are obtained from the results of the deformed sealing edge surfaces from Figure 10. The measurement results and a comparison with the numerical results of the ideally smooth sealing edge geometry can be found in Figure 18. A total of 4 individual measurements were performed on each sealing ring. Figure 18a shows the results of the measurements. The markers represent the measurement results, and the line corresponds to the curve interpolated by the mean values of the measurements. The measured tangential displacements of the different sealing rings show the same course. The maximum displacement is oriented to the fluid side. This is consistent with the visual studies in [8,9,10,11]. The measured displacements of the different sealing rings differ only slightly and are in a range of u 42 64   μ m . Figure 18b compares the results of the FE analysis assuming an ideally smooth sealing edge with the measured data. For clarity, only the mean measured displacement curves are plotted. The results show close agreement for specific coefficients of friction. The computation considering a coefficient of friction of μ = 0.3 appears to be the best approximation of the measured data of the investigated sealing rings. This agrees with the coefficients of friction applied in [48].
Figure 19 shows a comparison of the numerical results for the ideally smooth sealing edge geometry and for the rough sealing edge surfaces. The determined coefficient of friction of μ = 0.3 is applied. The curves for the rough surfaces represent the mean displacement u , as in Figure 10. The results for the rough sealing edge surfaces match closely with those for the ideally smooth surfaces. The tangential displacements for the rough sealing edge surfaces show a slightly higher displacement than for the ideally smooth surface. Furthermore, the rough sealing edges show a more discontinuous course of the tangential displacement. Both effects correspond to the contact pressure distributions shown in Figure 15b.
Despite the close agreement of the numerical and experimental results, it must be noted that the determined friction coefficient is a reasonable approximation for the elastomer glass lubricant combination considered here and cannot be transferred to other applications without further ado.

4. Conclusions

The present study dealt with comprehensive multi-scale experimental and numerical analysis of rotary shaft seals. The test rigs and equipment used, the test material, and the experimental and numerical methods were presented in detail with reference to previous work. The results of the experimental tests were compared with the numerical computations and discussed. In conclusion, the following points emerge:
  • FE analyses are suitable for both macroscopic and microscopic investigations of the structural mechanics of rotary shaft seals. Real measured surface data can be directly integrated into the numerical model.
  • The presented visual test rig provided in situ observations of the lubrication and sealing behavior of rotary shaft seals based on the alignment of hydrodynamically active roughness structures according to the theories of [8,9].
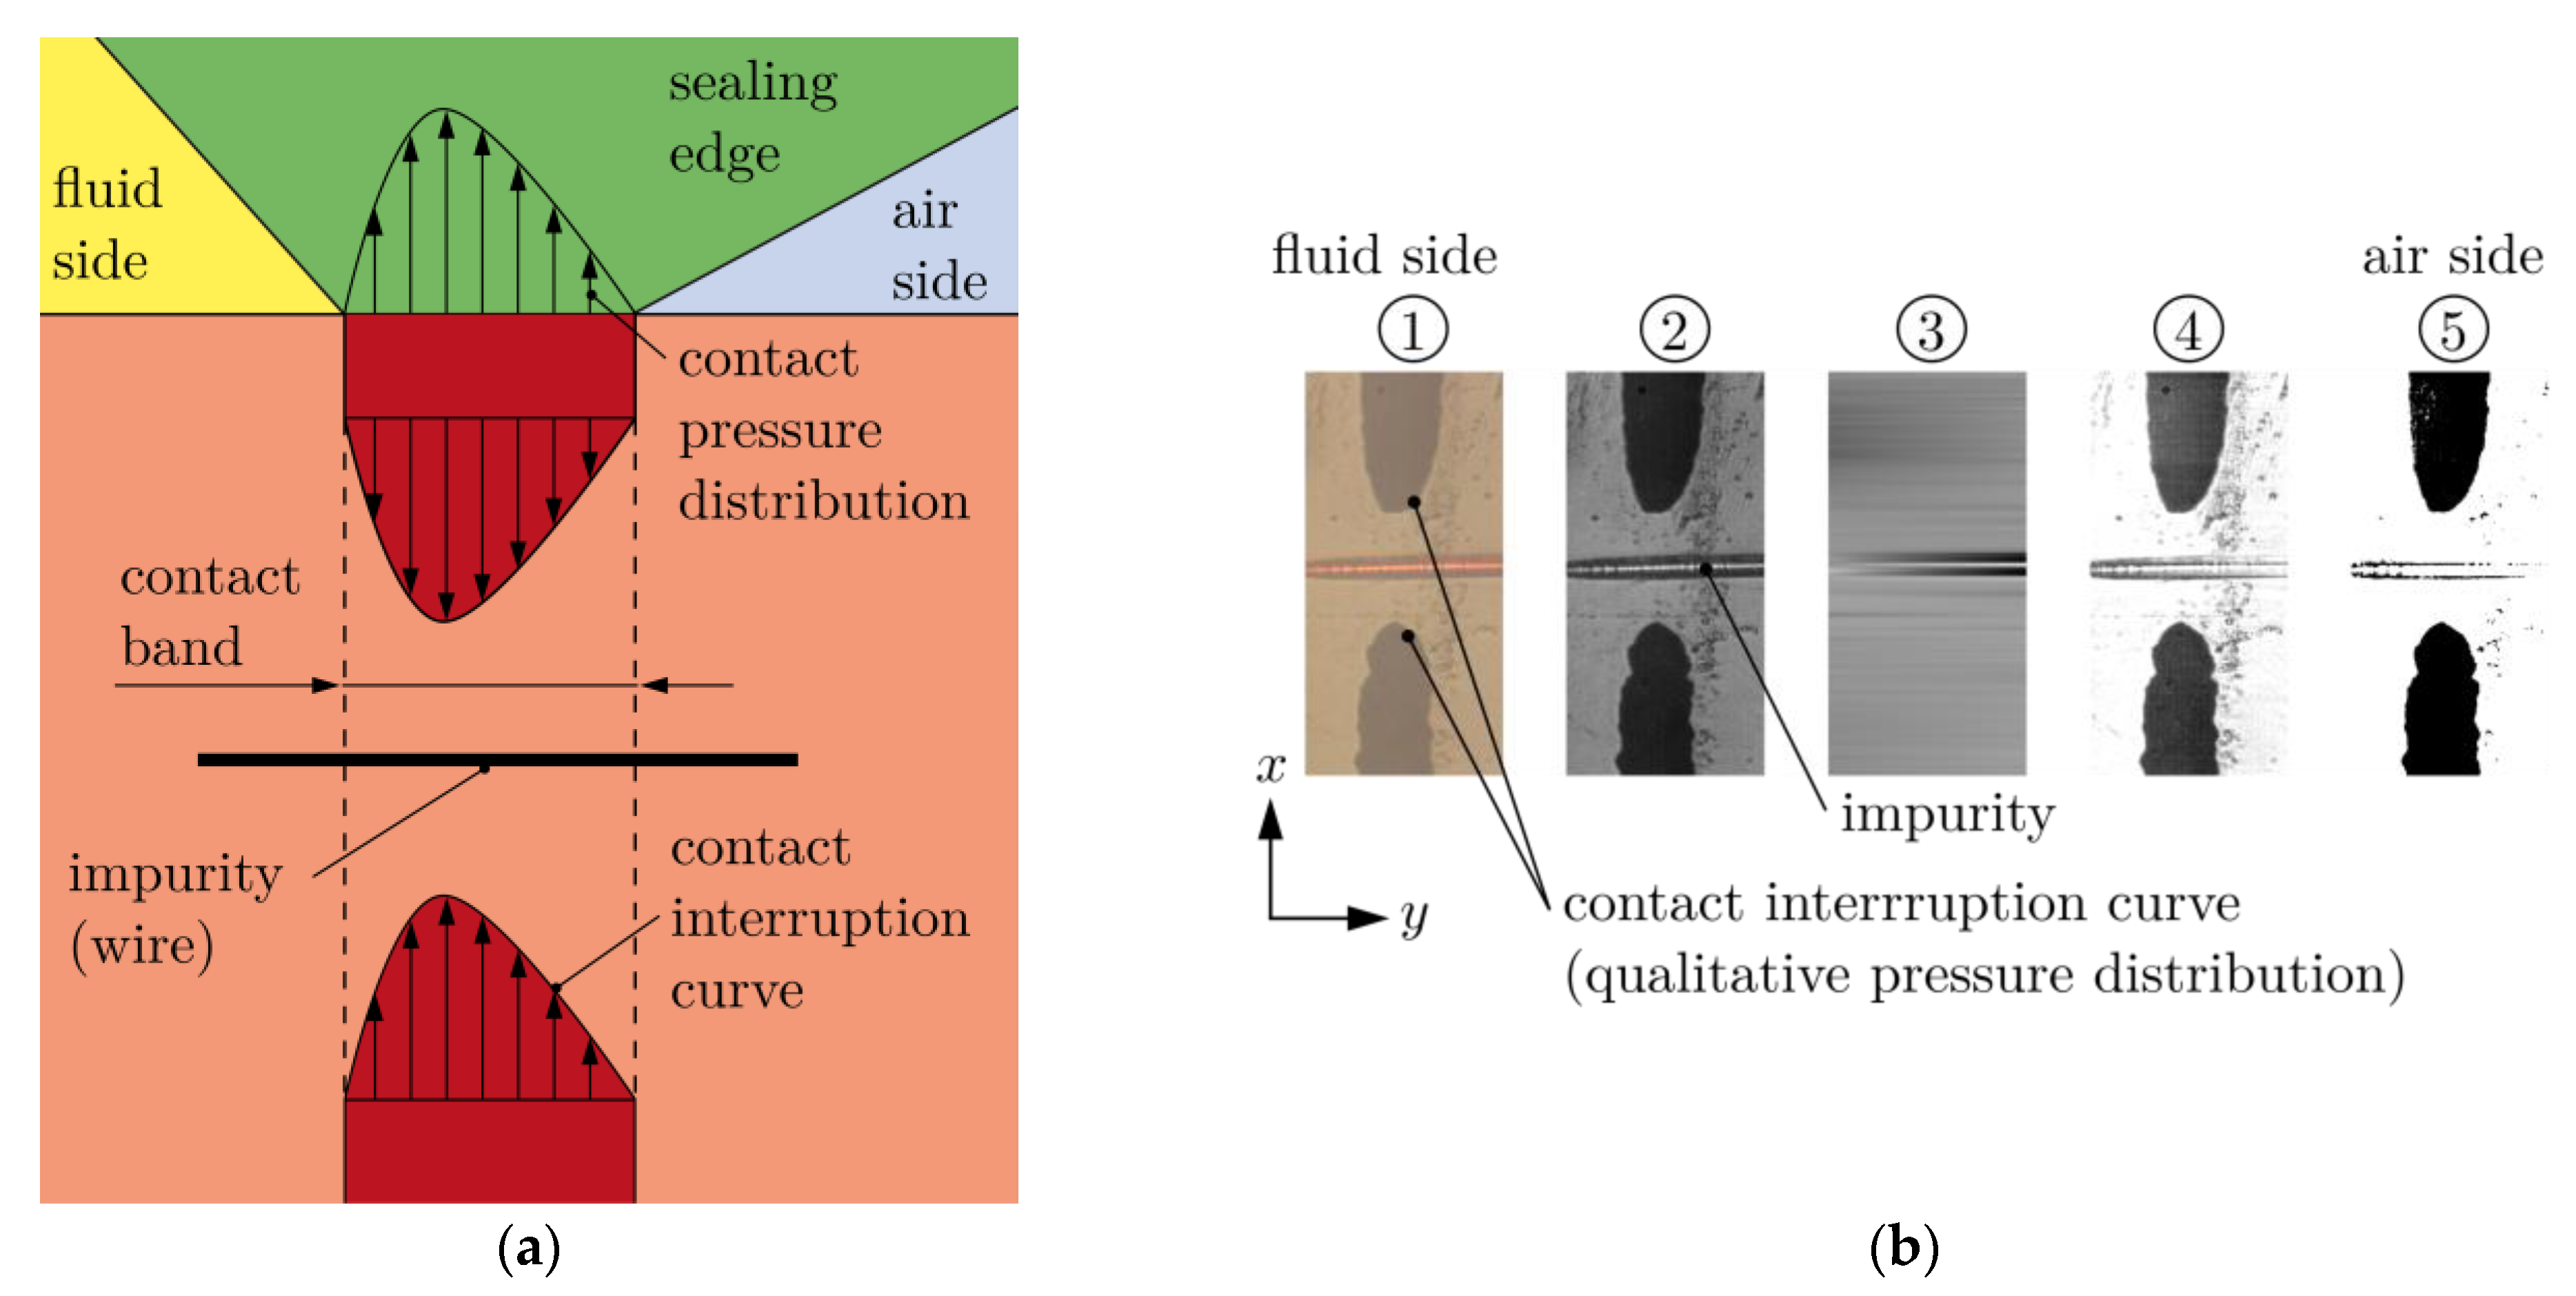
  • Frustrated total internal reflection provided a qualitative analysis of the contact pressure distribution based on the contact interruption curve. This offers possible improvements with regard to a higher resolution of the contact interruption curve for the experimental detection of the microscopic effects in the contact pressure distribution.
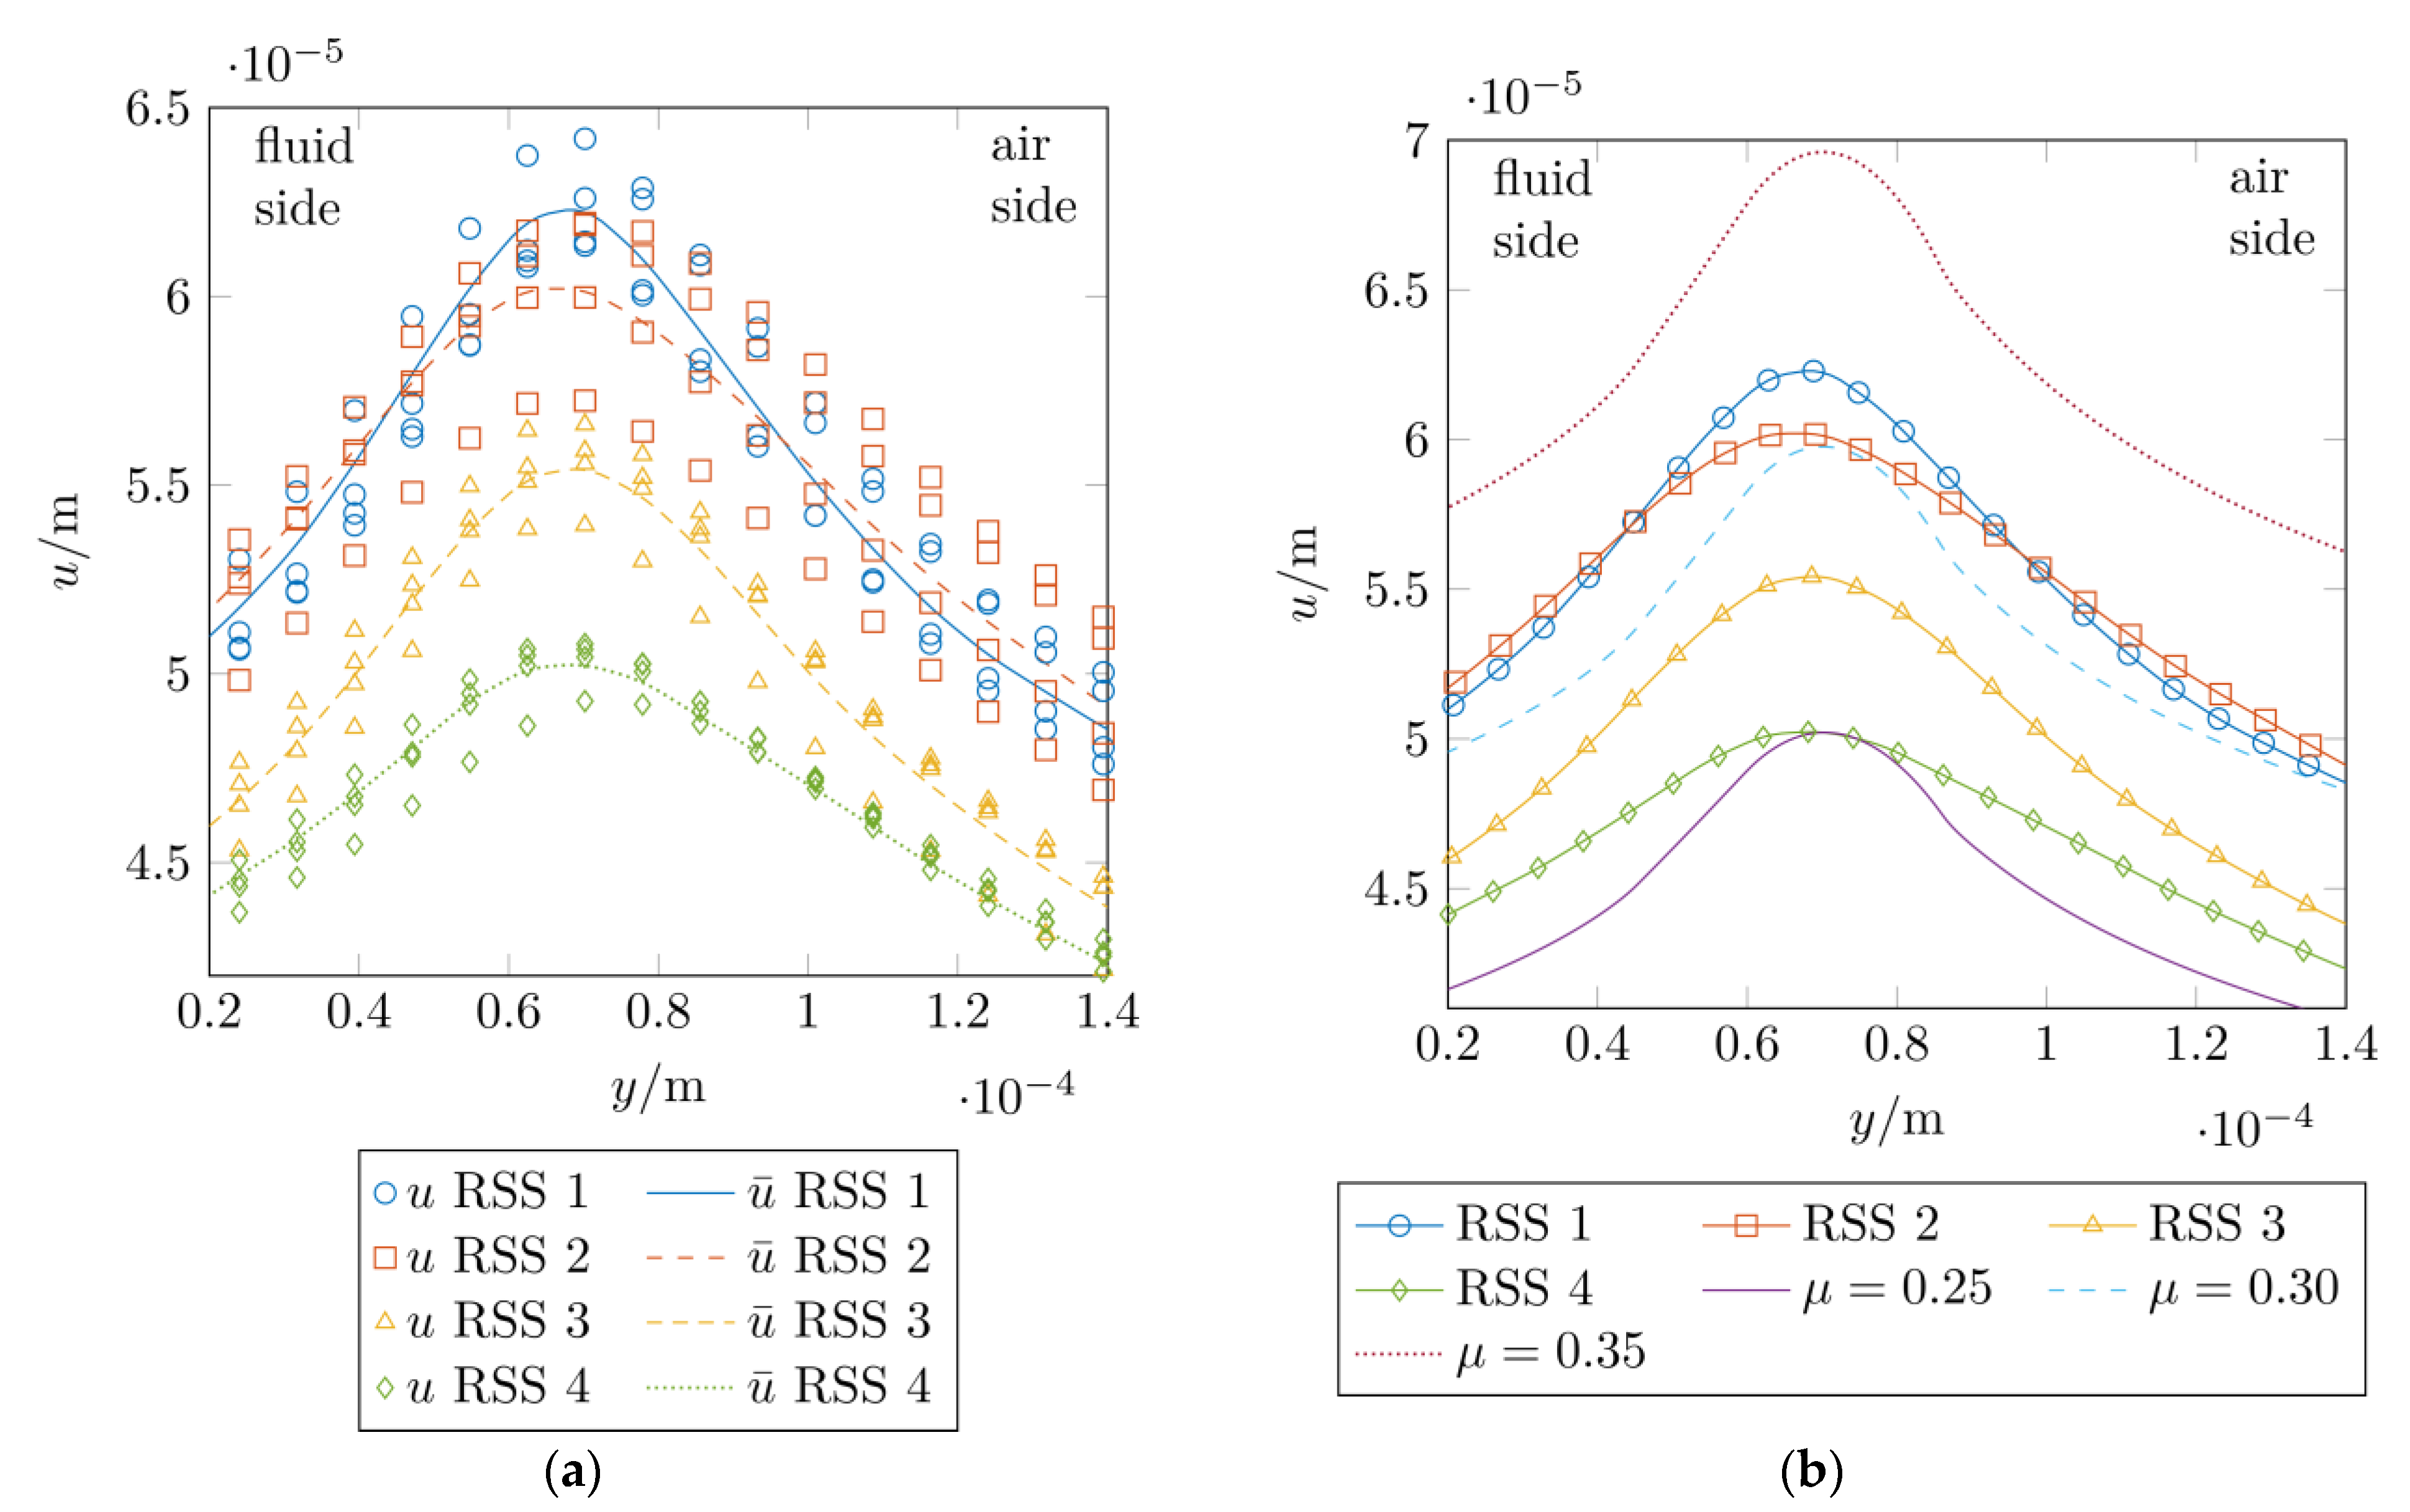
  • Particle image velocimetry (PIV) offers a possibility to quantify the tangential distortion of the sealing edge surfaces.
  • Depending on the contact definition (threshold k ), there were average differences of 35 % to 75 % between the measured and computed contact widths. This difference was also evident in the study of the contact pressure distribution. Possible reasons for this are tolerance deviations of the used materials and test rigs. There is potential for improvement here with regard to a completely user-independent contact analysis without the specification of a threshold k .
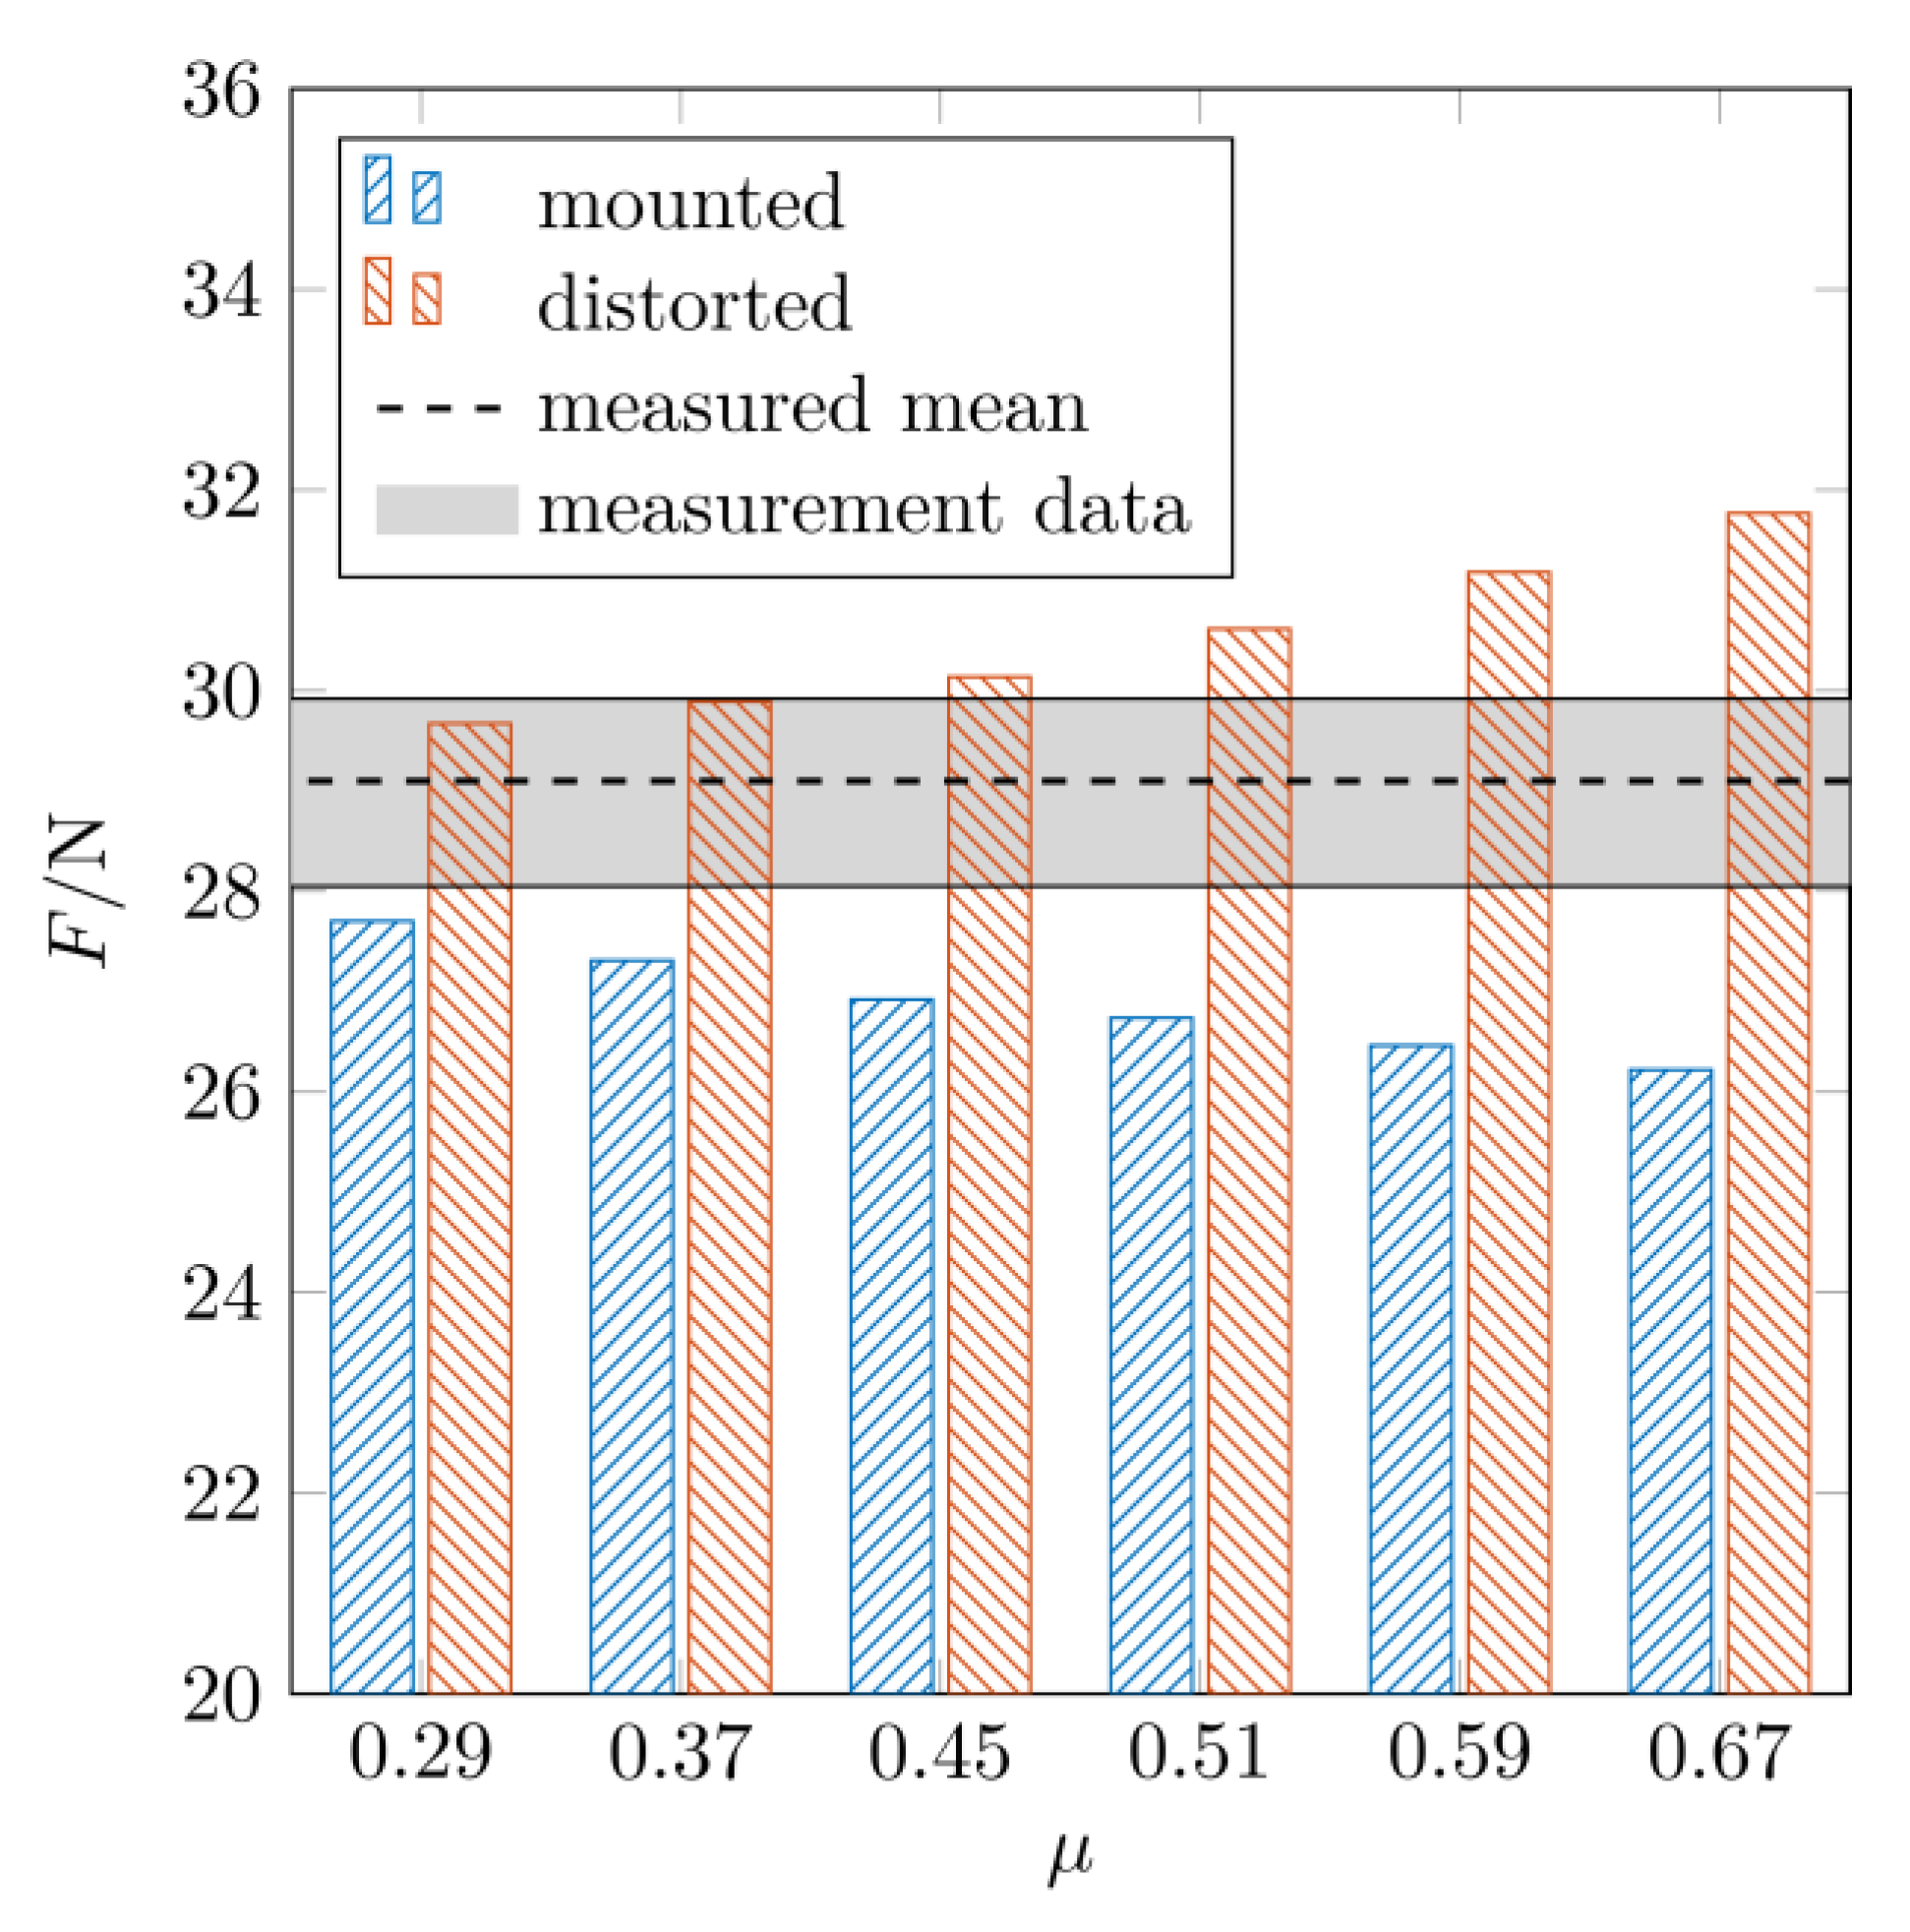
  • The measured and computed radial loads were in the same range. Furthermore, numerical analyses showed that the radial load in operation (with distorted sealing edge surface) was higher than in mounted condition (with a compressed seal edge).
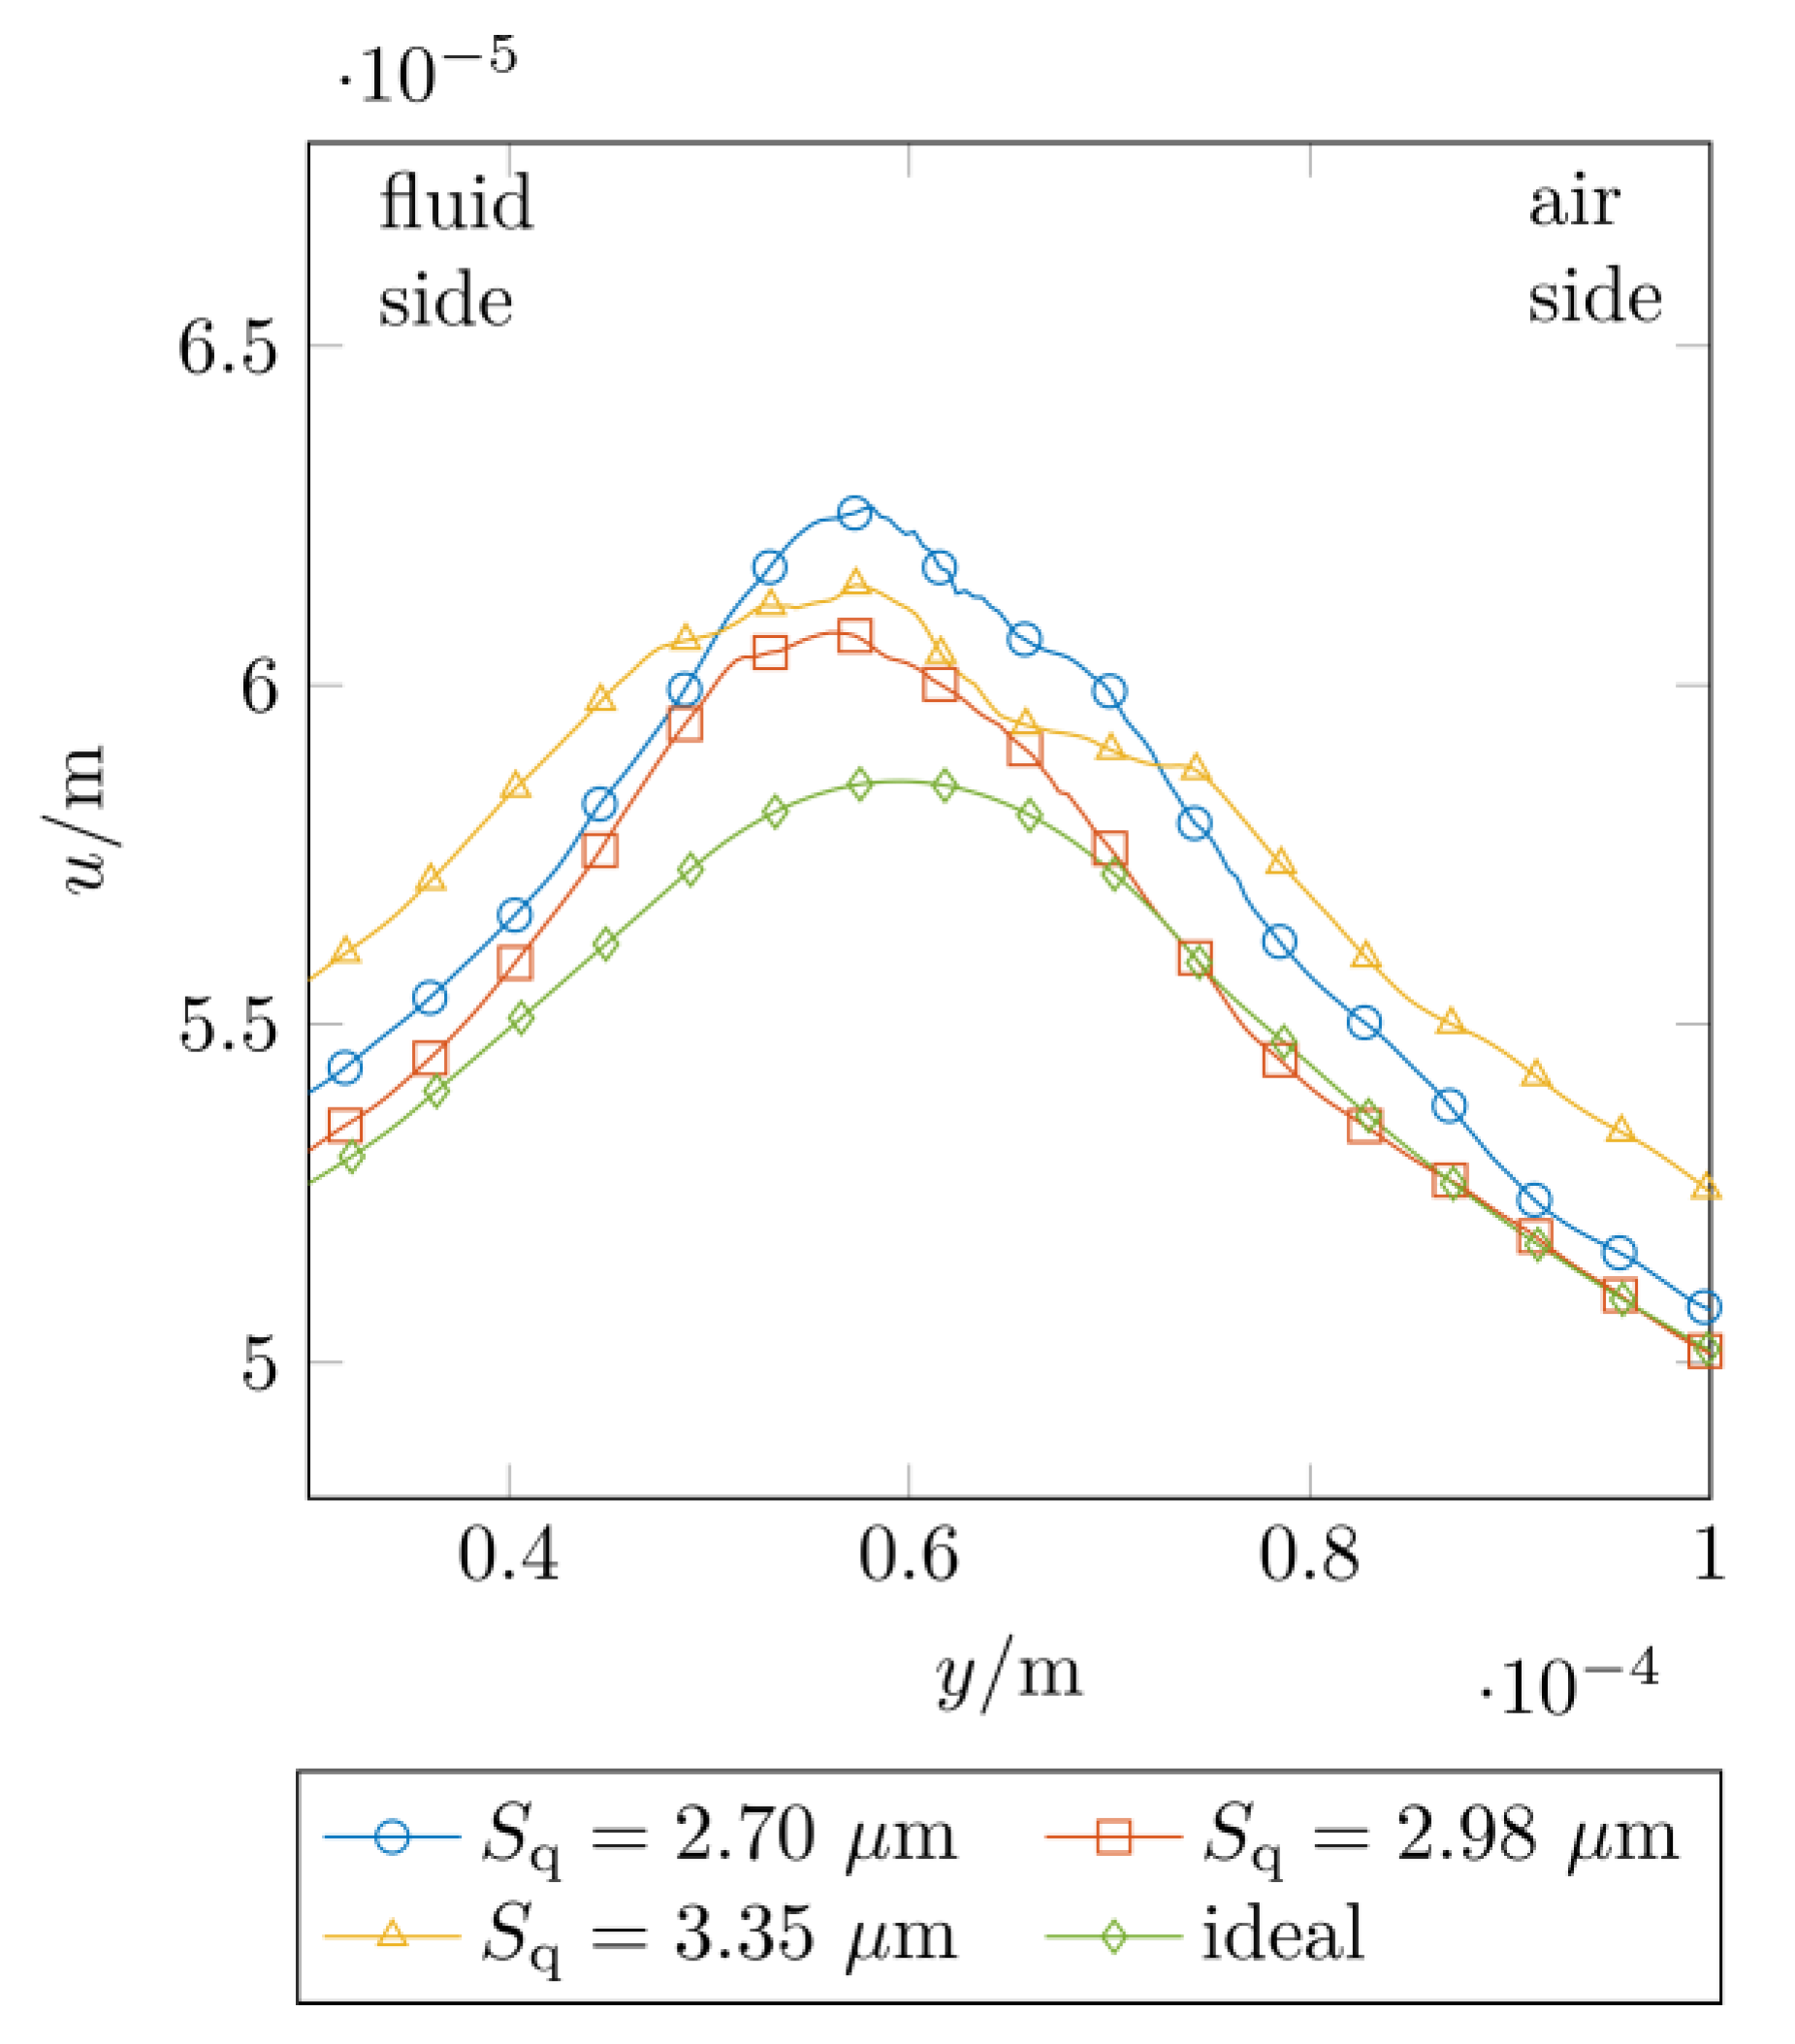
  • The measured and computed tangential displacements of the sealing edges showed a high agreement for coefficients of friction in a range of μ = 0.25 0.35 . There were no major differences between the ideally smooth sealing edge surface and the real surface measurement data.
In summary, the present study provides a solid basis for further structural mechanics or fluid mechanics studies on rotary shaft seals.

Author Contributions

Conceptualization, J.G., M.G. and F.B.; methodology, J.G. and M.G.; software, J.G. and M.G.; investigation, J.G. and M.G.; resources, F.B.; writing—original draft preparation, J.G.; writing—review and editing, J.G., M.G. and F.B.; visualization, J.G.; supervision, F.B.; project administration, J.G. and F.B. All authors have read and agreed to the published version of the manuscript.

Funding

This research received no external funding.

Data Availability Statement

Not applicable.

Conflicts of Interest

The authors declare no conflict of interest.

Nomenclature

Symbols
b Contact width
C 10 Neo-Hookean material parameter
d Nominal diameter
d o Outer shaft diameter
F M Measured load
F R Radial load
F S Segment load
F T Tangential friction load
g Gray values
g t h Threshold gray value
G B r i n k Dimensionless number [23]
G h y d Dimensionless (Gümbel/Hersey) number [24,25]
k Threshold for contact analysis
n Shaft rotation speed
n Refractive index
p l Line load
R z Maximum height of the roughness profile
S q Root-mean-square roughness height
t Roundness deviation
T M Measured friction torque
u Tangential displacement
x Circumferential direction
x ˙ Circumferential sliding velocity
y Axial direction
z Radial direction
η Dynamic viscosity
ϑ Temperature
λ Wavelength of the light
μ Coefficient of friction
ϕ Friction parameter [21,22]
ω Angular velocity
Abbreviations
DINGerman Institute for Standardization (ger.: Deutsche Institut für Normung e.V.)
FEAFinite element analysis
FKMFluororubber
FVAResearch Association for Drive Technology (ger.: Forschungsvereinigung Antriebstechnik e.V.)
ISOInternational standards organization
PIVParticle image velocimetry
PMMAPolymethyl methacrylate
RSSRotary shaft seal
VGViscosity grade

References

  1. Bauer, F. Tribologie; Springer Fachmedien Wiesbaden: Wiesbaden, Germany, 2021; ISBN 978-3-658-32919-8. [Google Scholar]
  2. Bauer, F. Federvorgespannte-Elastomer-Radial-Wellendichtungen; Springer Fachmedien Wiesbaden: Wiesbaden, Germany, 2021; ISBN 978-3-658-32921-1. [Google Scholar]
  3. Jagger, E.T. Rotary Shaft Seals: The Sealing Mechanism of Synthetic Rubber Seals Running at Atmospheric Pressure. Inst. Mech. Eng. 1957, 171, 597–616. [Google Scholar] [CrossRef]
  4. Müller, H.K. Concepts of Sealing Mechanism of Rubber Lip Type Rotary Shaft Seals. In Proceedings of the 11th International Conference on Fluid Sealing, Cannes, France, 1 April 1987; pp. 698–709. [Google Scholar]
  5. Gawlinski, M.J. Lip Motion and Its Consequences in Oil Lip Seal Operation. In Proceedings of the Papers Presented at the Ninth International Conference on Fluid Sealing; Stephens, H.S., Stapleton, C.A., Eds.; BHRA Fluid Engineering: Noordwijkerhout, The Netherlands, 1981; pp. 111–124. [Google Scholar]
  6. Borras, F.X.; de Rooij, M.B.; Schipper, D.J. Misalignment-Induced Macro-Elastohydrodynamic Lubrication in Rotary Lip Seals. Tribol. Int. 2020, 151, 106479. [Google Scholar] [CrossRef]
  7. Bekgulyan, S.; Feldmeth, S.; Bauer, F. Influence of Static and Dynamic Eccentricity on the Pumping Rate of Radial Lip Seals. In Proceedings of the Papers Presented at: 25th International Conference on FLUID SEALING; Rackov, M., Mitrović, R., Čavić, M., Eds.; Springer: Cham, Switzerland; Manchester, UK, 2020; pp. 79–91. [Google Scholar]
  8. Kawahara, Y.; Abe, M.; Hirabayashi, H. An Analysis of Sealing Characteristics of Oil Seals. ASLE Trans. 1980, 23, 93–102. [Google Scholar] [CrossRef]
  9. Kammüller, M. Zur Abdichtwirkung von Radial-Wellendichtringen. Ph.D. Thesis, Universität Stuttgart, Stuttgart, Germany, 1986. [Google Scholar]
  10. van Leeuwen, H.; Wolfert, M. The Sealing and Lubrication Principles of Plain Radial Lip Seals: An Experimental Study of Local Tangential Deformations and Film Thickness. Tribol. Ser. 1997, 32, 219–232. [Google Scholar] [CrossRef]
  11. Schulz, M.; Hagmayer, M.; Baumann, M.; Bauer, F. Analysis of Fluid Flow in the Sealing Gap of Radial Shaft Seals and Elastic Deformation of the Sealing Surface. J. Tribol. 2021, 143, 122301. [Google Scholar] [CrossRef]
  12. Grün, J.; Feldmeth, S.; Bauer, F. The Sealing Mechanism of Radial Lip Seals: A Numerical Study of the Tangential Distortion of the Sealing Edge. Tribol. Mater. 2022, 1, 1–10. [Google Scholar] [CrossRef]
  13. Grün, J.; Feldmeth, S.; Bauer, F. Wear on Radial Lip Seals: A Numerical Study of the Influence on the Sealing Mechanism. Wear 2021, 476, 203674. [Google Scholar] [CrossRef]
  14. Tønder, K.; Salant, R.F. Non-Leaking Lip Seals: A Roughness Effect Study. J. Tribol. 1992, 114, 595–599. [Google Scholar] [CrossRef]
  15. Salant, R.F.; Flaherty, A.L. Elastohydrodynamic Analysis of Reverse Pumping in Rotary Lip Seals with Microundulations. J. Tribol. 1994, 116, 56–62. [Google Scholar] [CrossRef]
  16. Salant, R.F.; Flaherty, A.L. Elastohydrodynamic Analysis of Reverse Pumping in Rotary Lip Seals with Microasperities. J. Tribol. 1995, 117, 53–59. [Google Scholar] [CrossRef]
  17. Wenk, J.F.; Stephens, L.S.; Lattime, S.B.; Weatherly, D. A Multi-Scale Finite Element Contact Model Using Measured Surface Roughness for a Radial Lip Seal. Tribol. Int. 2016, 97, 288–301. [Google Scholar] [CrossRef]
  18. Flitney, R. Seals and Sealing Handbook; Elsevier: Oxford, UK, 1995; ISBN 978-0-08-099416-1. [Google Scholar]
  19. Lein, J. Mechanische Untersuchungen an Dichtungsringen Für Rotierende Wellen; Springer: Berlin/Heidelberg, Germany, 1954; ISBN 978-3-662-23302-3. [Google Scholar]
  20. Lines, D.J.; O’Donoghue, J.P. Under-Lip Temperatures in Rotary Shaft Seals. In Proceedings of the Fifth International Conference on Fluid Sealing; The British Hydromechanics Research Association: Coventry, UK, 1971; pp. D1-1–D1-20. [Google Scholar]
  21. Hirano, F.; Ishiwata, H. Paper 15: The Lubricating Condition of a Lip Seal. Proc. Inst. Mech. Eng. Conf. Proc. 1965, 180, 187–196. [Google Scholar] [CrossRef]
  22. Hirano, F.; Ishiwata, H.; Kambayashi, H. Friction and Sealing Characteristics of Oil Seals. In Proceedings of the International Conference on Fluid Sealing; British Hydromechanics Research Association: Harlow, UK, 1961; pp. 1–17. [Google Scholar]
  23. Brink, R.V. Oil Seal Life—Good Loading or Good Luck. SAE Tech. Pap. 1965, 209–216. [Google Scholar] [CrossRef]
  24. Gümbel, L.K.F. Das Problem Der Lagerreibung. Mon. Des Berl. Bez. Dtsch. Ing. 1914, 5,6, 87–104, 109–120. [Google Scholar]
  25. Hersey, M.D. The Laws of Lubrication of Horizontal Journal Bearings. J. Wash. Acad. Sci. 1914, 4, 542–552. [Google Scholar]
  26. Schulz, M.; Baumann, M.; Bauer, F.; Haas, W. Influence of Different Shaft Surface Finishes on the Tribological and Functional Behaviour of Radial Shaft Seals. In Proceedings of the 7th International Conference Integrity-Reliability-Failure, Funchal, Portugal, 6–10 September 2018; Silva Gomes, J.F., Meguid, S.A., Eds.; pp. 351–368. [Google Scholar]
  27. Sommer, M.; Haas, W. A New Approach on Grease Tribology in Sealing Technology: Influence of the Thickener Particles. Tribol. Int. 2016, 103, 574–583. [Google Scholar] [CrossRef]
  28. Schulz, M.; Baumann, M.; Bauer, F. Influence of Belt Ground and Superfinished Shaft Counterfaces on the Tribological and Functional Behaviour of Elastomeric Lip Seals. In Proceedings of the 24th International Conference on Fluid Sealing, Manchester, UK, 7–8 March 2018; pp. 143–159. [Google Scholar]
  29. Feuchtmüller, O.; Hörl, L.; Bauer, F. An Empirical Study on the Friction of Reciprocating Rod Seals at Predefined Lubrication Conditions and Shear Rates. Lubricants 2022, 10, 56. [Google Scholar] [CrossRef]
  30. DIN 3760:1996-09; Radial-Wellendichtringe. 1996.
  31. DIN 3761-1:1984-01; Radial-Wellendichtringe Für Kraftfahrzeuge. Begriffe, Maßbuchstaben, Zulässige Abweichungen, Radialkraft. 1984.
  32. Freudenberg Sealing Technologies: Material 75 FKM 585. Available online: https://ecatalog.fst.com/ (accessed on 24 March 2022).
  33. Feldmeth, S.; Bauer, F.; Haas, W. Component-Based Parameter Identification for the Contact Simulation of Elastomeric Radial Lip Seals. In Proceedings of the Deutsche Kautschuk-Tagung DKT 2015/International Rubber Conference IRC 2015, Nürnberg, Germany, 29 June–2 July 2015; p. 194. [Google Scholar]
  34. DIN EN ISO 25178-2:2020-02; Geometrische Produktspezifikation (GPS)—Oberflächenbeschaffenheit: Flächenhaft—Teil 2: Begriffe, Definitionen Und Oberflächen-Kenngrößen (ISO/DIS 25178-2:2019). 2020.
  35. DIN 3761-2:1983-11; Radial-Wellendichtringe Für Kraftfahrzeuge. Anwendungshinweise. 1983.
  36. Feldmeth, S.; Stoll, M.; Bauer, F. How to Measure the Radial Load of Radial Lip Seals. Tribol. Und Schmier. 2021, 68, 5–12. [Google Scholar] [CrossRef]
  37. Stakenborg, M.J.L. On the Sealing Mechanism of Radial Lip Seals. Tribol. Int. 1988, 21, 335–340. [Google Scholar] [CrossRef]
  38. Sinzara, W.; Sherrington, I.; Smith, E.H.; Brooks, H.; Onsy, A. Effects of Eccentric Loading on Lip Seal Performance. In Proceedings of the 6th European Conference on Lubrication Management and Technology (Lubmat 2018), San Sebastian, Spain, 4–6 June 2018. [Google Scholar]
  39. Frölich, D.; Magyar, B.; Sauer, B. A Comprehensive Model of Wear, Friction and Contact Temperature in Radial Shaft Seals. Wear 2014, 311, 71–80. [Google Scholar] [CrossRef]
  40. Borras, F.X.; Bazrafshan, M.; De Rooij, M.B.; Schipper, D.J. Stern Tube Seals under Static Condition: A Multi-Scale Contact Modeling Approach. Proc. Inst. Mech. Eng. Part J J. Eng. Tribol. 2021, 235, 181–195. [Google Scholar] [CrossRef]
  41. Hermann, W.; Seffler, H.-W. Neue Erkenntnisse Für Den Abdichtmechanismus von Radial-Wellendichtringen. ATZ Automob. Z. 1985, 87, 475–484. [Google Scholar]
  42. Zhu, S.; Yu, A.W.; Hawley, D.; Roy, R. Frustrated Total Internal Reflection: A Demonstration and Review. Am. J. Phys. 1986, 54, 601–607. [Google Scholar] [CrossRef]
  43. Raffel, M.; Willert, C.E.; Scarano, F.; Kähler, C.J.; Wereley, S.T.; Kompenhans, J. Particle Image Velocimetry; Springer International Publishing: Cham, Switzerland, 2018; ISBN 978-3-319-68851-0. [Google Scholar]
  44. Thielicke, W.; Sonntag, R. Particle Image Velocimetry for MATLAB: Accuracy and Enhanced Algorithms in PIVlab. J. Open Res. Softw. 2021, 9, 12. [Google Scholar] [CrossRef]
  45. Johnston, D.E.; Vogt, R. Rotary Shaft Seal Friction, the Influence of Design, Material, Oil and Shaft Surface. J. Passeng. Cars 1995, 104, 1453–1466. [Google Scholar]
  46. Plath, S.; Meyer, S.; Wollesen, V.M. Friction Torque of a Rotary Shaft Lip Type Seal—A Comparison between Test Results and Finite Element Simulation. Mechanika 2005, 54, 55–59. [Google Scholar]
  47. Engelke, T. Einfluss Der Elastomer-Schmierstoff-Kombination Auf Das Betriebsverhalten von Radialwellendichtringen. Ph.D. Thesis, Leibniz University Hannover, Hannover, Germany, 2011. [Google Scholar]
  48. Wennehorst, B.; Engelke, T.; Poll, G. Modelling Radial Lip Seal Friction—A Multi-Scale Mixed Lubrication Approach. In Proceedings of the 21st International Conference on Fluid Sealing, Milton Keynes, UK, 30 November–1 December 2011; pp. 207–226. [Google Scholar]
  49. Garcia, D. Robust Smoothing of Gridded Data in One and Higher Dimensions with Missing Values. Comput. Stat. Data Anal. 2010, 54, 1167–1178. [Google Scholar] [CrossRef]
  50. Garcia, D. A Fast All-in-One Method for Automated Post-Processing of PIV Data. Exp. Fluids 2011, 50, 1247–1259. [Google Scholar] [CrossRef]
  51. Schuler, P. Einfluss von Grenzflächeneffekten Auf Den Dichtmechanismus Der Radial-Wellendichtung. Ph.D. Thesis, Universität Stuttgart, Süßen, Germany, 2014. [Google Scholar]
Figure 1. Schematic illustration of the tribological system rotary shaft seal.
Lubricants 11 00234 g001
Figure 2. Exemplary Gümbel curve for friction in the system rotary shaft seal.
Lubricants 11 00234 g002
Figure 3. Representative surface sections selected out of all measurement fields: (a) S q = 2.70   µ m , (b) S q = 2.98   µ m , (c) S q = 3.35   µ m .
Lubricants 11 00234 g003
Figure 4. Schematic illustration of a radial load measurement device for the split-shaft measuring method.
Lubricants 11 00234 g004
Figure 5. Schematic illustration of the visual test rig.
Lubricants 11 00234 g005
Figure 6. Image processing: (a) Binarization; (b) Background interpolation.
Lubricants 11 00234 g006
Figure 7. Qualitative measurement of the contact pressure distribution in the sealing contact: (a) Schematic representation of the qualitative determination of the pressure distribution; (b) Image processing for pressure distribution analysis.
Lubricants 11 00234 g007
Figure 8. Measuring device for the friction torque.
Lubricants 11 00234 g008
Figure 9. Rough sealing edge surfaces (a) S q = 2.70   µ m , (b) S q = 2.98   µ m , (c) S q = 3.35   µ m .
Lubricants 11 00234 g009
Figure 10. Distorted sealing edge surfaces: (a) S q = 2.70   µ m ( S q = 0.30   µ m ), (b) S q = 2.98   µ m ( S q = 0.27   µ m ) and (c) S q = 3.35   µ m ( S q = 0.37   µ m ) root mean square height after deformation in brackets.
Lubricants 11 00234 g010
Figure 11. Contact pressure distribution: (a) S q = 2.70   µ m ( S q = 0.30   µ m ), (b) S q = 2.98   µ m ( S q = 0.27   µ m ) and (c) S q = 3.35   µ m ( S q = 0.37   µ m ) root mean square height after deformation in brackets.
Lubricants 11 00234 g011
Figure 12. Measured percentage contact areas (a) RSS 1, (b) RSS 2, (c) RSS 3, (d) RSS 4.
Lubricants 11 00234 g012
Figure 13. Computed percentage contact areas: (a) S q = 2.70   µ m ( S q = 0.30   µ m ), (b) S q = 2.98   µ m ( S q = 0.27   µ m ) and (c) S q = 3.35   µ m ( S q = 0.37   µ m ) root mean square height after deformation in brackets.
Lubricants 11 00234 g013
Figure 14. Contact analysis.
Lubricants 11 00234 g014
Figure 15. Contact pressure distribution: (a) Measured qualitative contact pressure distribution (contact interruption curve); (b) Computed contact pressure distribution.
Lubricants 11 00234 g015
Figure 16. Radial load.
Lubricants 11 00234 g016
Figure 17. Gümbel curve (Gray area: Considered friction coefficient in the numerical studies; Dashed lines: Operating point for measuring the tangential displacement).
Lubricants 11 00234 g017
Figure 18. Tangential displacement: (a) Measured tangential displacements; (b) Comparison of measured and computed displacements.
Lubricants 11 00234 g018
Figure 19. Computed displacements.
Lubricants 11 00234 g019
Table 1. Simulation parameters.
ParametersValueDetermination Method
Material parameter C 10 1.568   M P a Material parameter determination [33]
Shaft diameter d 80   mm -
Friction coefficient μ 0.25 0.67 Literature [45,46,47,48]
Segment load F S 5.6 × 10 3   N Radial load measurements [36]
Disclaimer/Publisher’s Note: The statements, opinions and data contained in all publications are solely those of the individual author(s) and contributor(s) and not of MDPI and/or the editor(s). MDPI and/or the editor(s) disclaim responsibility for any injury to people or property resulting from any ideas, methods, instructions or products referred to in the content.

