Article

‘Triangle Ester’ Molecules as Blending Components in Mineral Oil: A Theoretical and Experimental Investigation

1
Academy of Scientific and Innovative Research (AcSIR), Ghaziabad 201002, India
2
CSIR-Indian Institute of Petroleum, Mohkampur 248005, India
*
Author to whom correspondence should be addressed.
Lubricants 2023, 11(3), 144; https://doi.org/10.3390/lubricants11030144
Submission received: 5 February 2023 / Revised: 13 March 2023 / Accepted: 15 March 2023 / Published: 17 March 2023

Abstract

:
The present work explored the use of fatty acid ‘Triangle ester’ molecules (Epoxidized Ester (EE), and Thiirane Ester (TE)) as antifriction and antiwear additives at varying levels for Group I and Group II mineral base oils using the standard ASTMD-4172B four-ball test. Relative to neat base oil, EE blends showed improved antifriction by ~61% and ~42% and antiwear properties by ~32% and ~41% in Group I and Group II base oils, respectively, while the TE blends showed friction reduction by ~65% and ~40% and wear reduction by ~93% and ~50% relative to the same neat base stock. Time evolution of the ‘Triangle ester’ molecules and their blends with mineral oil (modeled as hexadecane) w.r.t. conformational changes, adsorption energy, intermolecular energy, and effect of the applied stress were estimated theoretically using MD simulations. Further, optimized levels of these additives were explored for their effectiveness as a blending component for commercial engine oil (CEO) and could reduce the friction and wear of CEO by ~50% and ~30%, respectively.

Graphical Abstract

1. Introduction

In the era of increasing technological advancements, requiring concomitantly higher use of machines and electro-mechanical assets, there is a parallel enhancement of power consumption by a tremendous amount. Further, the damage to mechanical components caused by tribological hindrances during the prolonged running of machines increases the overall usage of energy and reduction in the life of mechanical equipment. Reports suggest that about 30% of the principal resources of the world are devoted solely to overcoming frictional losses, while the life of 80% of the mechanical components is limited due to wear [1]. An irreplaceable role played by lubricants in enhancing the lifetime of these mechanical components is reducing wear and friction. Since lubrication is crucial for diverse applications, e.g., automotive, mechanical, marine, etc., sustenance and management of energy, resources, and materials in the lubricants production and application value claim is a global concern. Increasing attention towards such sustainability aspects is therefore pushing the lubrication industry towards the use of eco-friendly feed as base stock instead of using petroleum-derived mineral-based lubricant, which are depleting at a faster rate. Studies have reported that out of all the produced lubricants in the world, 85–90% originate from non-renewable mineral oil sources [2]. The consumption and post-consumption of mineral oil for lubrication have ultimately resulted in adverse effects due to their poor biodegradability and release of toxic materials into the environment [3]. To deal with these issues, much attention is shifting towards the use of environmentally benign, more stable, and flexible ways to produce and use lubricants leveraging available natural resources. This can result in minimal damage to the environment along with minimum waste generation. Recent findings reflect a significant inclination towards the utilization of bio-based and synthetic lubricants for commercial applications, especially in engine oils [4,5,6,7,8,9]. Vegetable oils and synthetic esters offer good scope for the development of new lubricant formulations to be used in diverse areas of the broader mechanical industry [10,11,12,13,14]. Studies have also demonstrated that additives made from vegetable oil and synthetic esters have performed extremely well at high pressures by releasing almost no toxic by-products as compared to those obtained from commercial products such as ZDDPs, acrylates, etc., which generate chemicals, residues, and metalloids that are dangerous to the environment [15,16,17,18,19,20,21].
Several attempts have been made to recognize acceptable alternatives for decarbonization or reduced environmental impact from the use of mineral oils as lubricants in internal combustion (IC) engines. These include the usage of lightweight material, controlled combustion technologies, etc., while researchers have also highlighted the prospects of ester-based bio-lubricants as a substitute to conventional engine oils [22,23]. Despite having advantages, such as high oleic and stearic acid content, renewability, and biodegradability, the presence of hydrogen atoms on the β-carbon atom in an ester molecule renders them prone to oxidation, thereby restricting their application for large-scale industrial purposes, especially under very high-temperature conditions. Studies have shown that oxidation and thermal stability of bio-based lubricants can be improved either by using per-esters of sugar, reducing unsaturation in the chain or by interchanging the glycerol group in vegetable oils with an alcohol group which is devoid of β-hydrogen atoms [24].
Due to the similarity in chemical structure between tree-borne bio-oils and conventional mineral oils, the esters derived by reacting fatty acids originating from natural oils/fats with different alcohol derivatives such as neopentyl glycol, trimethylolpropane and pentaerythritol (PE) were used extensively as blends in commercial gear and engine oils [25,26,27]. The most common fatty acids that act as basic building blocks of oleo chemical esters are stearic, isostearic, oleic, palmitic, and linoleic acids [3]. The amphiphilic nature of these esters facilitates lubrication by the adsorption of close-packed monolayers from their polar ends, and covalently bonded hydrocarbon chains consequently incline normally to the surface [1]. These esters, due to their much wider viscosity ranges, higher thermal and oxidative stability, and biodegradability, along with low aquatic toxicity, offer a wider application range as compared with naturally occurring triglyceride esters.
The most recent study suggests that the conversion of the olefinic site to oxirane (EE) and thiirane (TE) tends to enhance the lubrication aspects of the film [28,29,30]. Building upon this work, we studied the influence of lubricant formulations prepared by blending 1–5% of synthesized oxirane and thiirane-based oleic acid ester with Group I (Gp I) and Group II (Gp II) base oils. The oil blends were investigated for their antifriction and antiwear properties using a four-ball wear tester. The blending ratio was optimized from the obtained results of tribological properties and checked for performance under different contact stresses. Finally, the same optimized blend ratio was investigated for its performance with commercial engine oil. The worn-out steel substrates after the test were further analyzed by an optical profilometer, field emission scanning electron microscopy (FESEM) [31], and elemental mapping to understand the lubrication mechanism and the role of EE and TE (refer to SI for the molecular structure of EE and TE) in enhancing the tribological properties of mineral oil.

2. Materials and Methods

2.1. Experimental Details

Commercial mineral oils Gp I and Gp II were obtained from the refinery as the reference experimental base oils. Further, the lubricant blends were prepared by adding EE and TE v/v% of 1%, 2%, 3%, 4%, and 5% in these base oils. The prepared blend suspensions were thoroughly agitated first by stirring using a magnetic stirrer for 120 min, followed by sonication (for 45 min) before conducting the experiments. The blends formed clear solutions with no traces of separation or layer formation.

2.2. Determination of Tribo-Performance Behavior

In order to determine the antiwear and antifriction properties of the developed blends, the standard Four-ball test rig was used. The machine was operated employing the conditions mentioned in ASTM D: 4172B standard test procedure. The results presented are the average values from three identically carried out experiments. The post-experimental analysis for the wear scars obtained on the ball specimens was done using apochromatic stereo-zoom optical microscopy, profilometry, and SEM/EDAX.

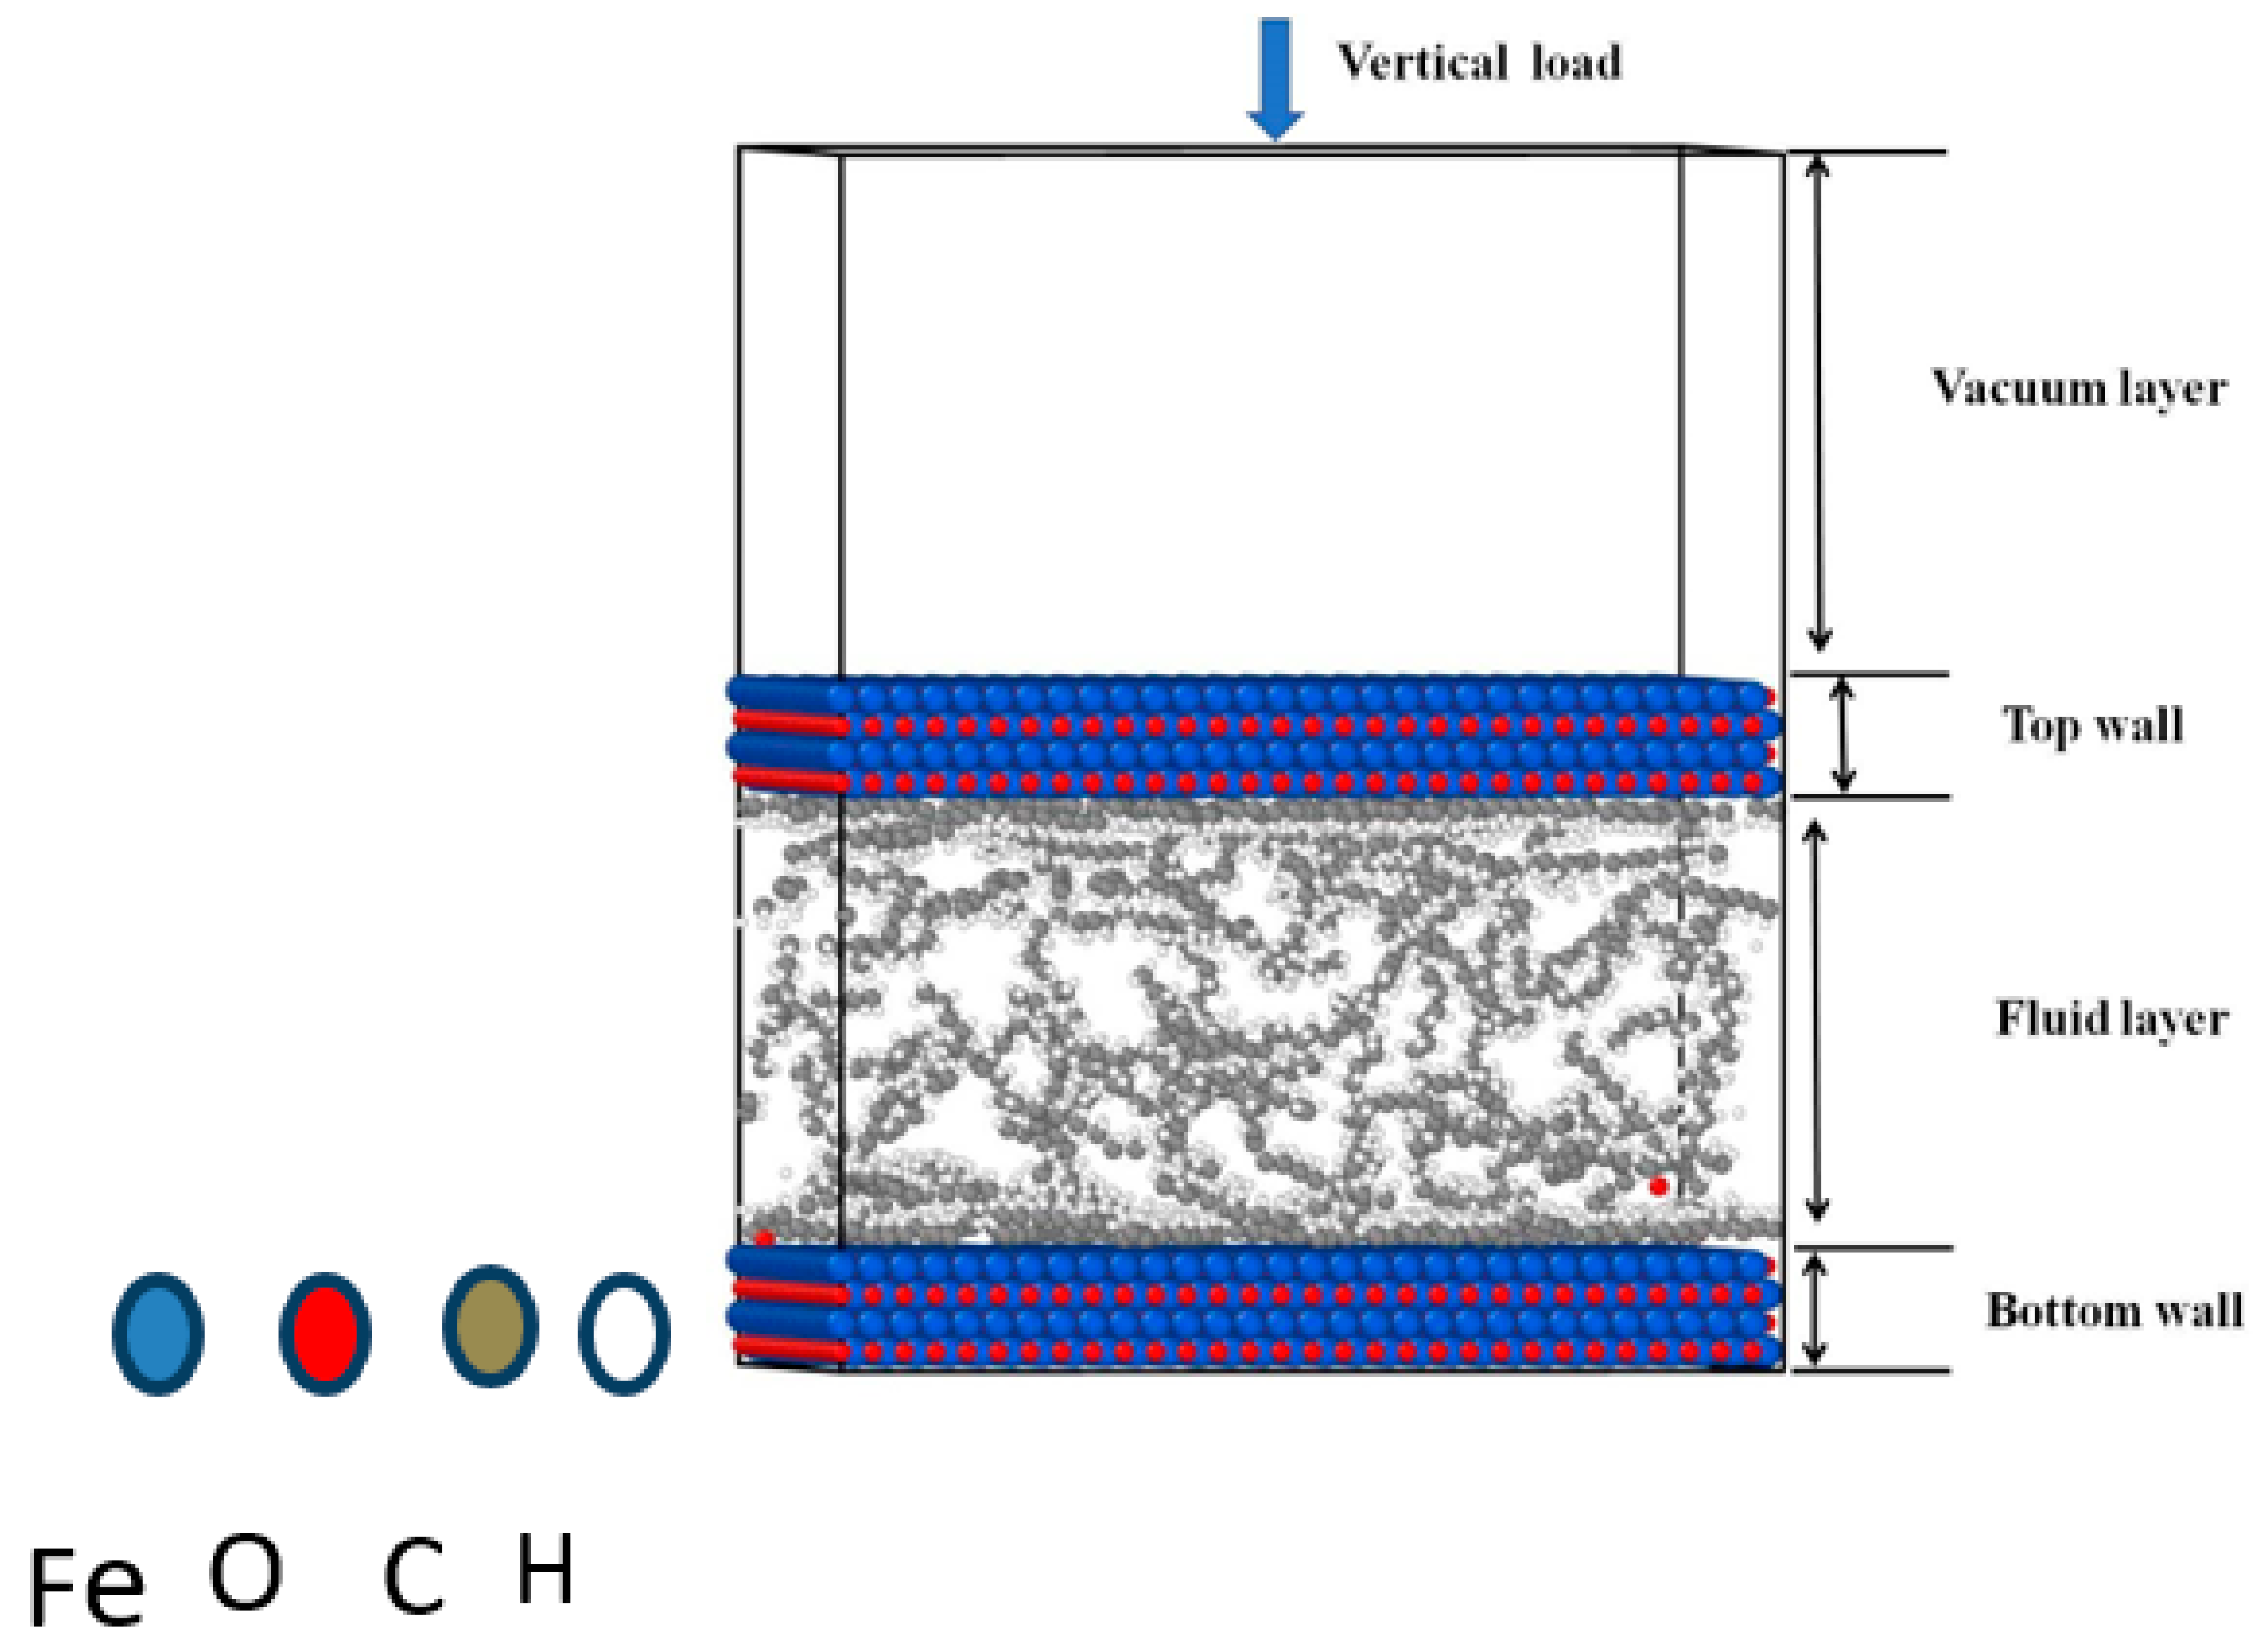
2.3. Molecular Dynamics Model and Calculation Details

Alkanes (CnH2n+2) are the main components of mineral oil (MO), and n-hexadecane (C16H34), being structurally similar, is generally used as a representative molecule to understand the lubrication behavior of MO over a substrate. Accordingly, we have used the n-hexadecane molecule to simulate the adsorption process of various lubricant blend formulations based on Molecular Dynamics (MD) on an iron oxide surface. The molecules of the synthesized ‘Triangle esters’, namely EE and TE, were used to prepare the blends with composition ranging from 1–5% by weight in hexadecane using an amorphous cell module. Blends of EE and TE differ in their density (ranging from 0.858–0.881 g/cm3). Hence the simulation cell dimensions were varied accordingly to achieve the desired density of the blends. The details of the simulated model of eight blends are given in Table 1.
The following calculations illustrate the methodology for the preparation of a simulated system with 1% EE blend in hexadecane.
Number   of   molecules   of   EE   in   its   1   mol   548.52   g = N A = 6.023 × 10 23
Number   of   molecules   of   EE   in   1   g = 6.023 × 10 23 / 548.52 = 0.1098 × 10 23   molecules   ( very   large   system )
Similarly, for hexadecane:
Number of molecules of hexadecane in its 1 mol (226.45 g) = NA= 6.023 × 10²³
Number of molecules of hexadecane in 99 g = (6.023 × 10²³/226.45) = 2.6331 × 10²³ molecules (very large system)
Alternatively,
The weight of 50 molecules of hexadecane = (226.45/NA) × 50 = 1878.38287 × 10−23 g
In total, 1% of this weight is the amount of EE to be added, which equals 1878.38287 × 10−25 g.
The number of molecules of EE corresponding to this weight can be calculated as:
Number of molecules of EE in its 1 mol (548.52 g) = NA= 6.023 × 10²³
Number of molecules of EE in 1 g = (6.023 × 10²³/548.52) = 0.0109804565 × 10²³ molecules
Number of molecules of EE in 1878.38287 × 10−25 g = 20.6255014 × 10⁻² molecules
Therefore, for 1% EE blends preparation, 0.206 molecules (fractional number cannot be simulated) of EE are taken along with 50 molecules of hexadecane.
Further, in order to prepare a 1% EE blend, 1 molecule of EE (integer value) was taken with 250 molecules of hexadecane.
Alternative calculations for TE are done in order to prepare blends of the desired composition.
The weight of 50 molecules of hexadecane = (226.45/NA) × 50 = 1878.38287 × 10−23 g
A total of 1% of this weight is the amount of TE to be added, which equals 1878.38287 × 10−25 g.
The number of molecules of TE corresponding to this weight can be calculated as:
Number of molecules of TE in its 1 mol (565.00 g) = NA= 6.023 × 10²³
Number of molecules of EE in 1 g = (6.023 × 10²³/565) = 0.010660177 × 10²³ molecules
Number of molecules of TE in 1878.38287 × 10−25 g = 20.0238939 × 10⁻² molecules
Further, in order to prepare 1% TE blend, 1 molecule of TE (integer value) was taken with 250 molecules of hexadecane. The density of the system was set up by fixing the boundaries of the cubic simulation box. Accordingly, the simulation box for EE and TE blends of 1–5% composition corresponds to the cell sizes as laid out in Table 1.
The MD simulations employed condensed phase optimized molecular potentials for atomistic simulation studies (COMPASS) forcefield. The simulated system consisted of lubricant blends sandwiched between two iron oxide FeO (100) walls as top and bottom layers, with vacuum thickness of 40 Å on the top layer, as shown in Figure 1. As a part of molecular equilibrium dynamics, dynamic relaxation of the lubricant blends was done using canonical ensemble (NVT) with time step of 0.1 fs for a total time of 250 ps. To reduce the length-scale and time-scale gap between experimental and computational work and reduce the errors that would arise, the simulation system was modeled in such a way that it could mimic the real system. This was done by choosing the dynamics accuracy level of bonding and non-bonding forces to the medium method.
The two iron oxide FeO (110) surface layers were used as limiting layers that moved in the z-direction, while periodic boundary conditions were imposed in all directions. The non-bonded, group-based truncation method was used for electrostatic and Van der Waals interactions. The adsorption energy of molecules dispersed as lubricants over the surface was calculated using Equation (1), and the intermolecular interaction energy was calculated through the cohesive energy density module in Material Studio V6.0 software package using Equation (2). The Mean Square Displacement (MSD) of each atom in all three directions was calculated using the blends trajectory document and Mean Square Displacement analysis available in the Forcite module. The MSD in all directions for all the atoms present in the blend as a function of time was obtained as a linear curve. The slope of the MSD time curve, when divided by 6 (to account for distribution over positive and negative x, y, and z directions), provided the self-diffusion coefficient.
E1 = E2 − (E3 + E4)
E5 = E6 − E7
where E1 = adsorption energy of the lubricant layer over FeO (100) substrate; E2 = total energy of lubrication model; E3 = energy of lubricant layer; E4 = energy of FeO (100) substrate when no lubricant molecule is dispersed over it, all in units of kCal/mol.
Similarly, E5 = intermolecular interaction energy of the lubricant molecules; E6 = total energy of the lubricating molecular film obtained by calculating the cohesion energy density (CED) of the system; E7 = internal energy of the lubricant molecule in units of kJ/mol. The adsorption energy and intermolecular interaction energy of EE containing three membered epoxy and TE containing three-membered sulfur were compared with neat base oil hexadecane.

3. Results and Discussion

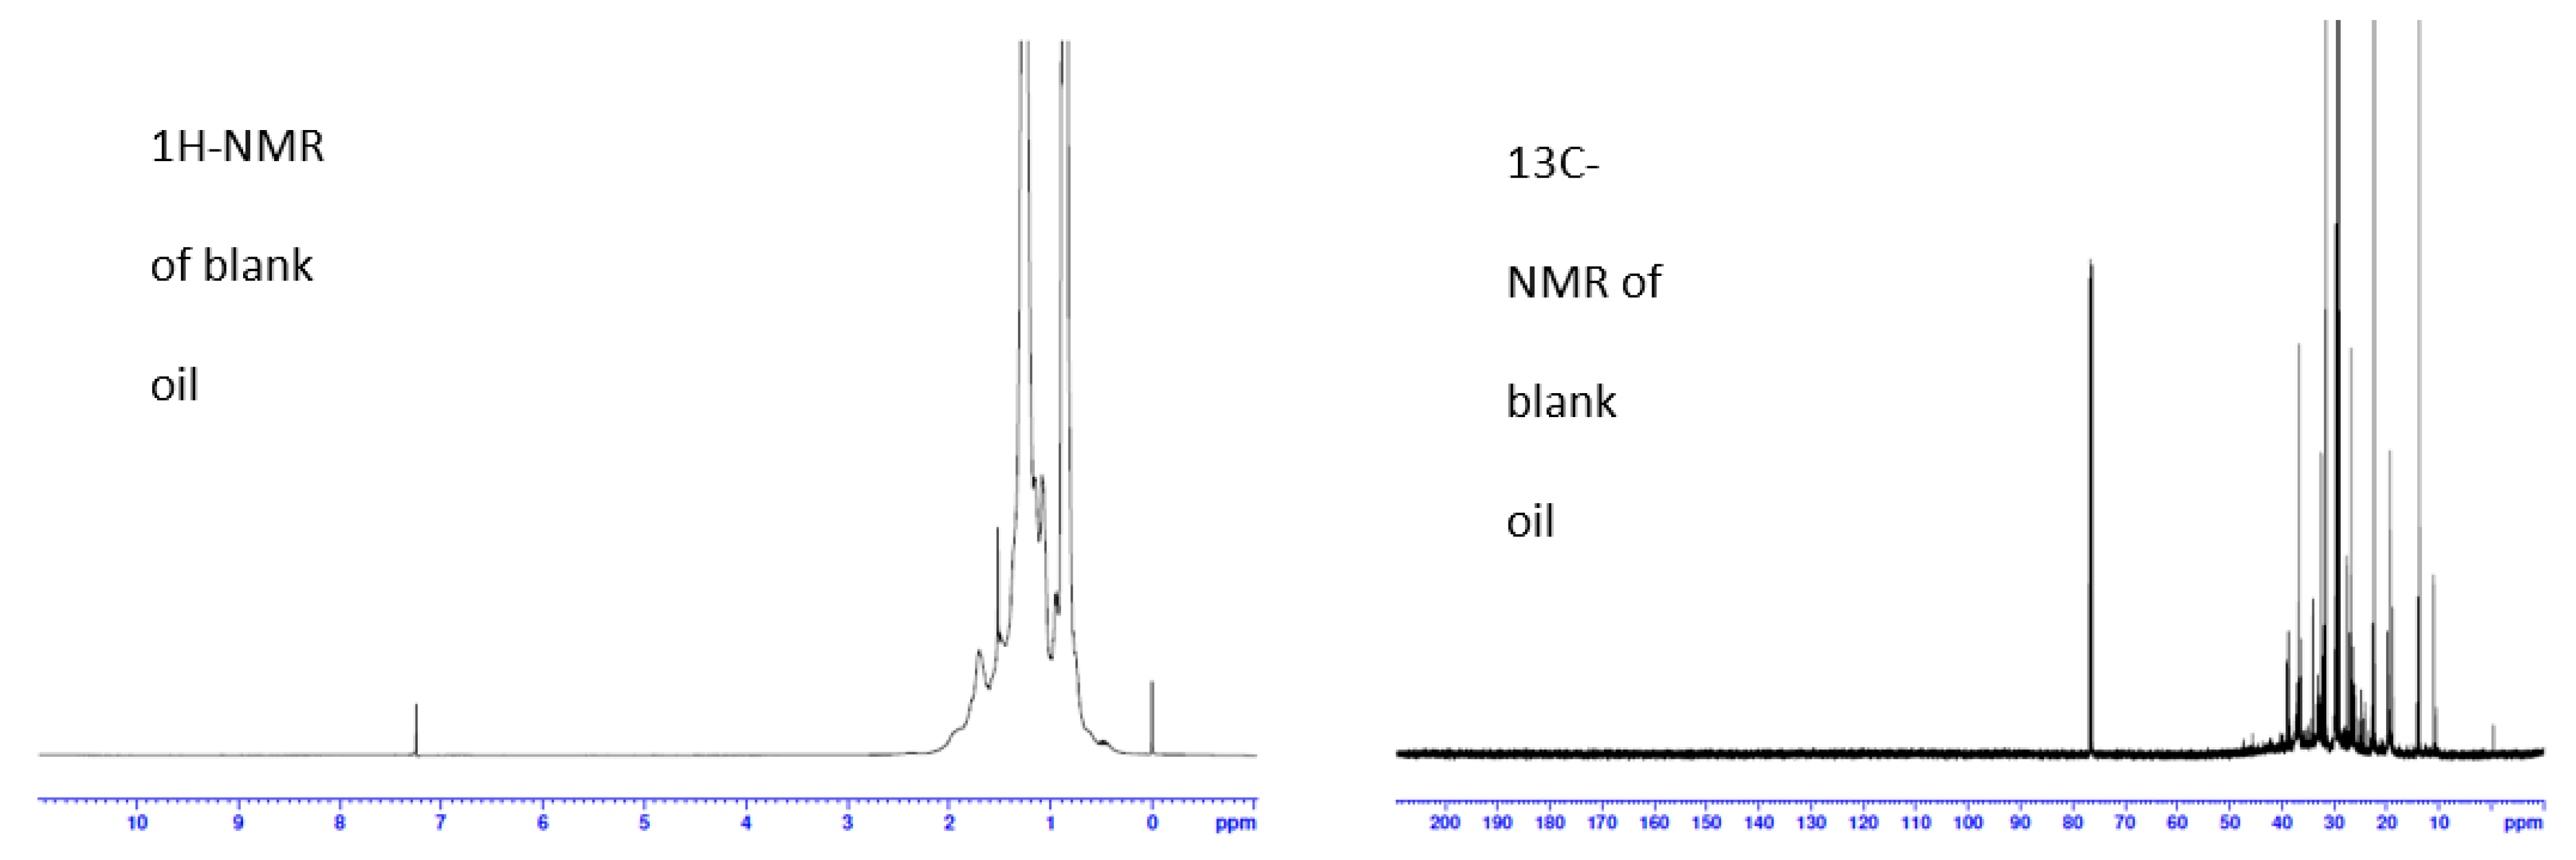
3.1. Tribological Characteristics of the Base Oil

The tribological performance of base oils (Gp I and Gp II) was determined using the ASTM D4172B standard test procedure. The standard procedure assessed the antifriction and antiwear behavior of the lubricants at the maximum Hertzian stress of 4.7 GPa. The friction curves obtained for the base oils are shown in Figure 2. The chosen Gp I base oil exhibited lower friction coefficients than the Gp II base oil in the studied sliding point contact geometry. The COF of 100 v/v% Gp I base oil was 0.148, while Gp II base oil showed a COF value of 0.154. It may be inferred that the Gp I base oil, which contained less than 90% saturates and higher sulfur content, resulted in the formation of stable boundary film at the given contact pressures as compared to Gp II base oil, which is predominantly saturated and contains less sulfur.
The used ball specimens lubricated with base oil samples were observed through an optical microscope to obtain the wear scar diameter. The wear scar diameters obtained for the base oils and the blends are presented in Figure 3 and Figure 4. It was observed that the Gp II base oil samples indicated better antiwear properties than Gp I base oil. Gp I exhibited poor antiwear characteristics because of its relatively lower content of saturates, which lowered its interaction with the metal at the interface resulting in ineffective adsorption. However, the blends of EE and TE exhibited good tribological characteristics because these polar molecules could evidently form a stable film on a metal surface either by physical or chemical adsorption within the time scale of the experiments. Compared with neat base oils, the addition of 1–5% EE or TE was found to change the viscosity of lubricant formulation and also enhance the overall lubricant film stability over the substrate.

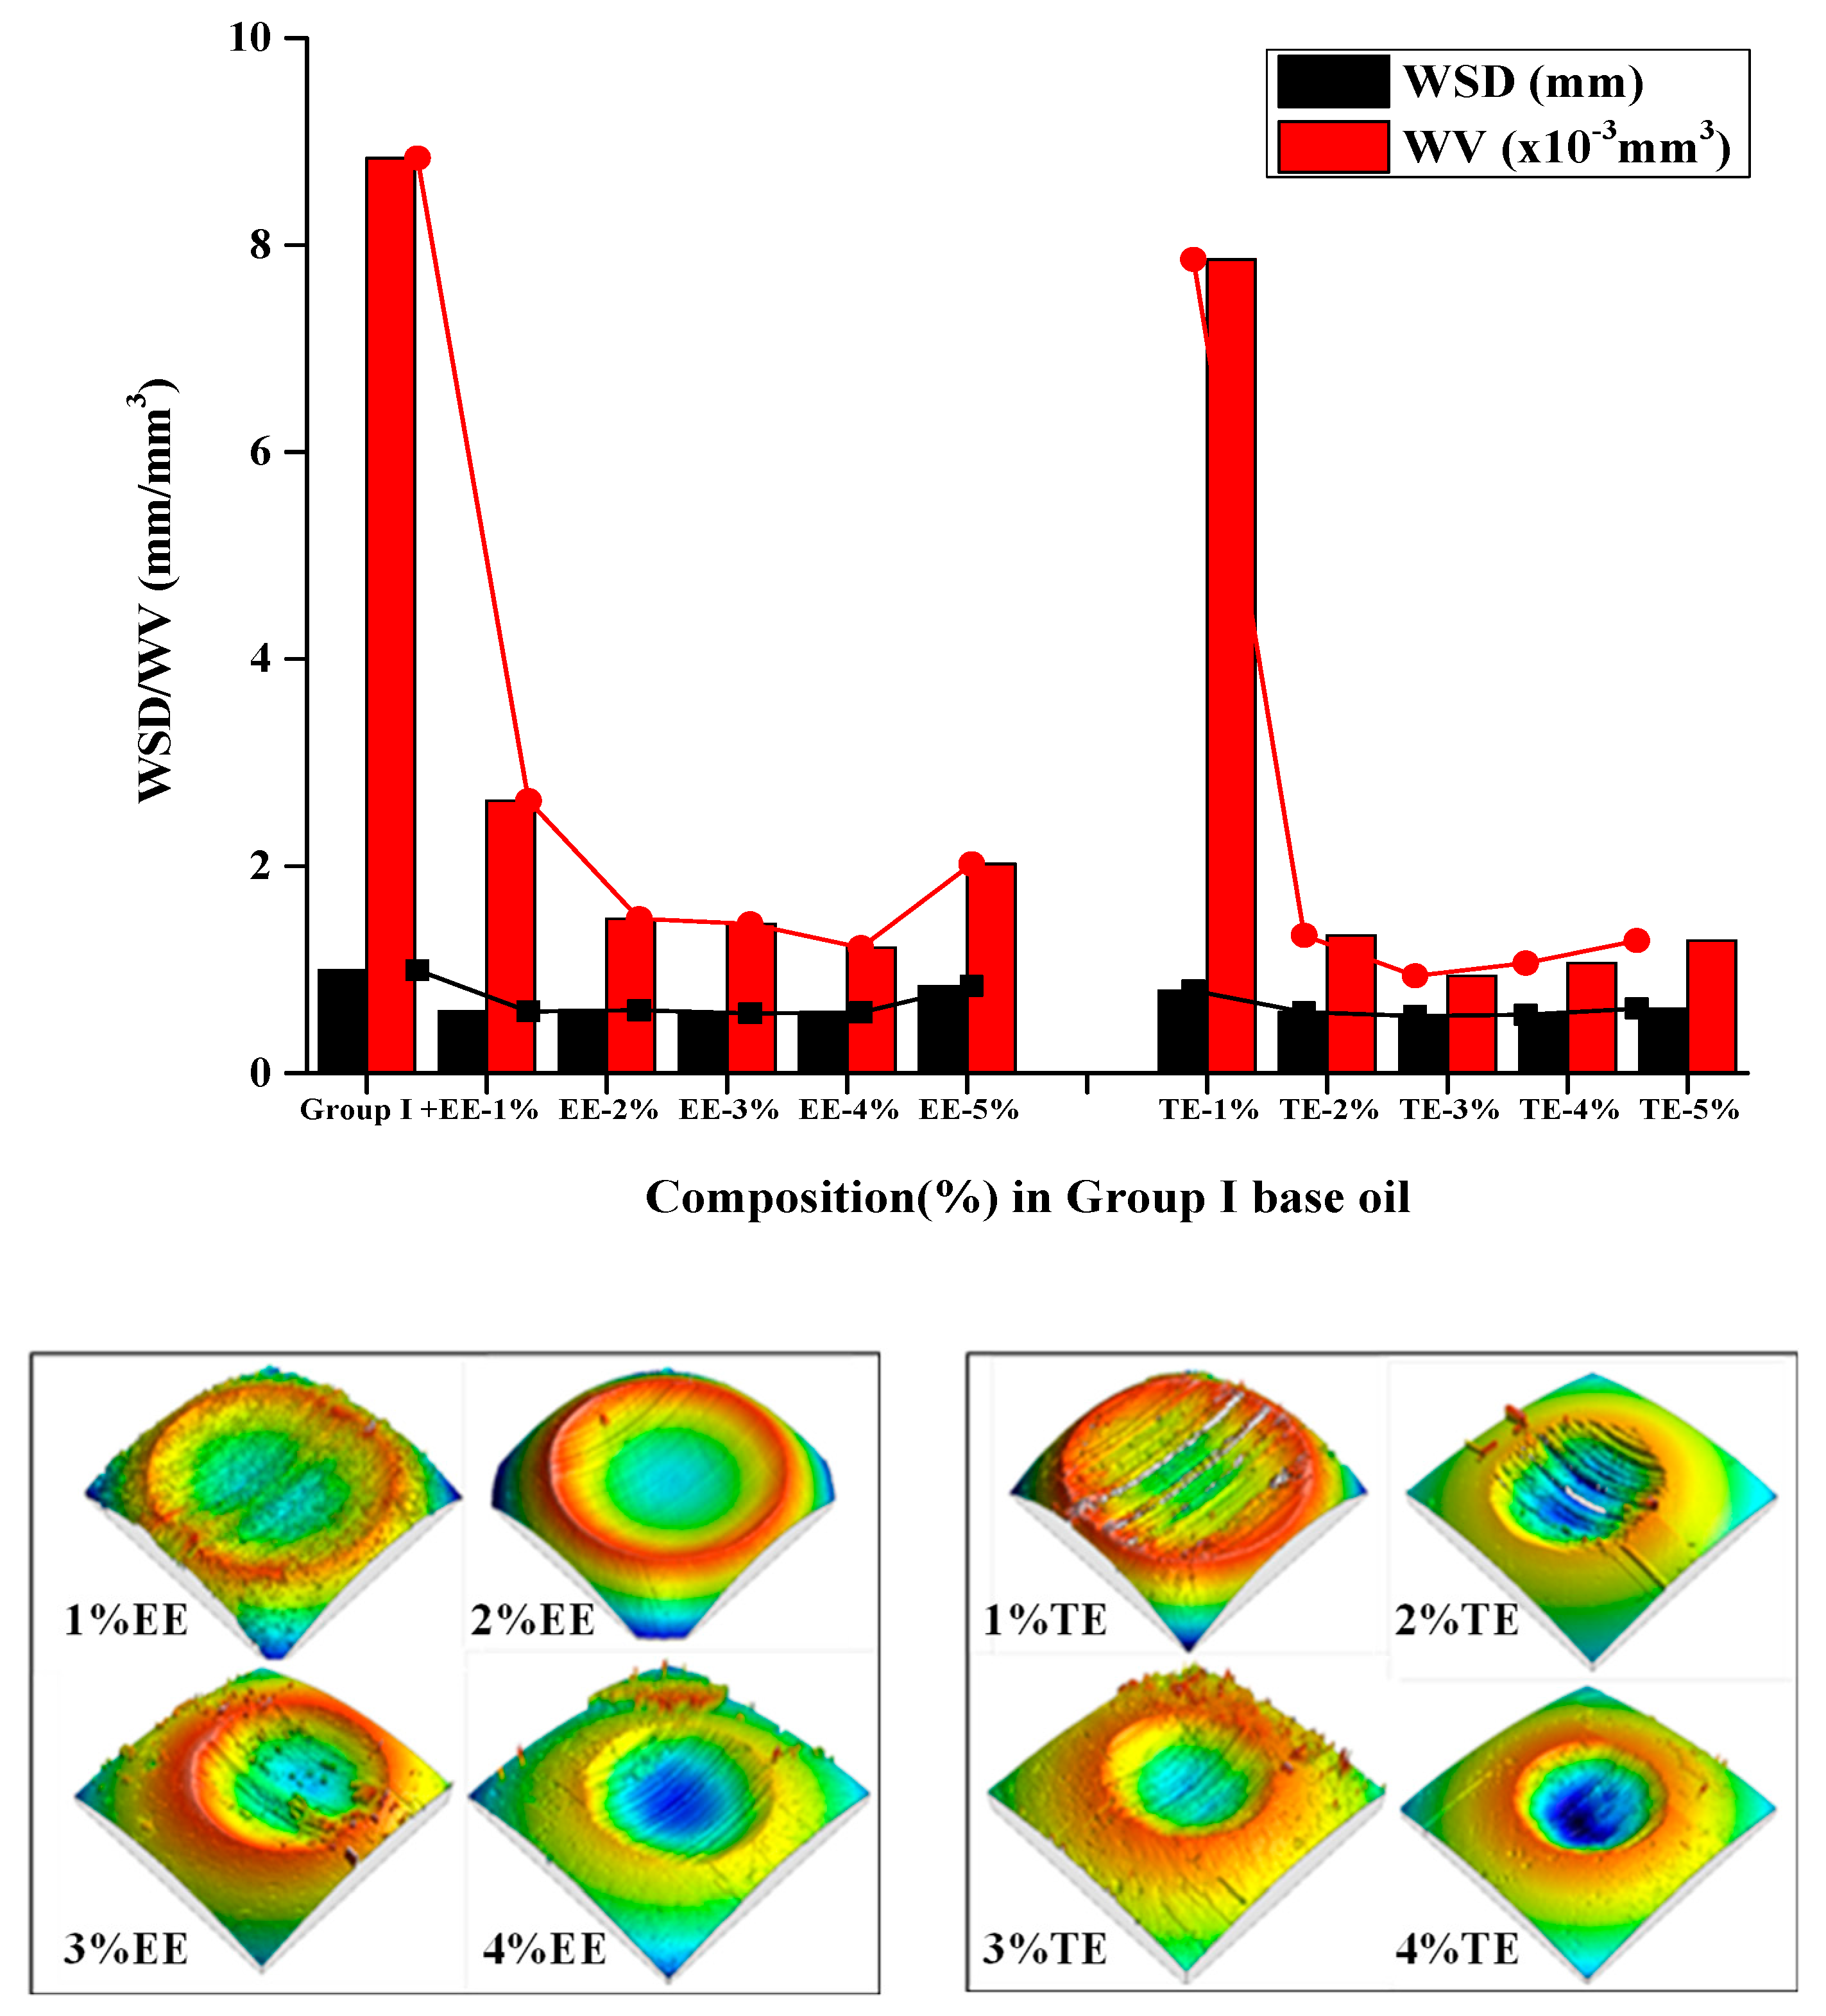
3.2. Tribological Characteristics of the Blends

COF: The influence of synthesized EE and TE on the tribological performance of Gp I and Gp II base oil blends, as shown in Figure 2, suggests that average coefficient of friction of EE blends with Gp I and Gp II base oil decreased with the increase in its concentration up to 4%. Above this concentration, intermolecular interactions between the triangle ester molecules (cohesive forces) began to express themselves, possibly reducing the availability of single ester molecules at the substrate-fluid interface (adhesive forces), thus increasing the viscosity, as evident from viscosity data in Table 2 and Table 3, and subsequently increasing the COF. Similar behavior in the case of COF was observed for the TE blends. With the rise in TE concentration, the blends reported lower values of COF.
Looking closely into the graphs, we observed that with less saturated chains present in Gp I base oil and other impurities from the crude, the base oil tended to form homogeneous blends having strong bonds with the relatively polar molecules as could be seen with EE and TE. The blends of EE in Gp I showed improved antifriction as compared with Gp II base oils. In addition, when increasing the concentration of EE, which is relatively more polar than TE, the relative increase in the blend polarity was higher. Furthermore, Gp I being more polar relative to Gp II supported like interactions with EE, which in turn enhances the film-forming ability of the EE blends in Gp I as compared with TE.
The higher number of saturated chains present in Gp II base oil was evident from 1H-NMR results, shown in Figure 5.
The enhanced saturation in Gp II tended to increase the hydrophobicity of the bulk medium, allowing better dispersion of less polar TE than EE. The TE blends, therefore, form stable films in less polar Gp II base oil, as evident from the friction plots of TE in Gp II base oil. Above a particular optimized concentration, the like interactions with Gp I and Gp II base oil became weak, causing an increase in friction.
Wear: The wear scar in Figure 3 and Figure 4 indicates that the chosen base oils of Gp I and Gp II showed weak interaction with the underlying FeO substrate, resulting in high wear. The graphs and the optical microscope images suggest that on the introduction of EE and TE in Gp I and Gp II base oil, the wear volume was reduced till a certain concentration indicating the synergistic operating effect between lubricant formulation (containing ester, epoxy, and thiirane moiety) and metal oxide substrate.
The synergistic effect was highly visible in Gp I base oil with 4% EE due to the presence of relatively polar EE, which interacted strongly with the base oil and also with the polar FeO substrate. The epoxy ring with two lone pairs present in its 2p orbital was involved in like interactions with the unsaturated chains of base oil by 2p-2p bonding, thus causing better film-forming ability. The 3% TE, however, showed stable film in the Gp II base oil due to its lone pairs present in the 3p orbital, which did not involve bonding, but its low polarity caused more interactions with the saturated chains of Gp II and with the underlying substrate. The lubricating film formed by TE can be deduced to work together with more saturated chains and played a key role in the protection of friction pairs. In contrast, with Gp I, the wear can be related to the polar molecular interaction of 4% EE with the substrate, reflecting noted improvements in an antiwear property, whereas in Gp II, 3% TE showed the lowest wear indicating superior film stability at this optimal concentration.

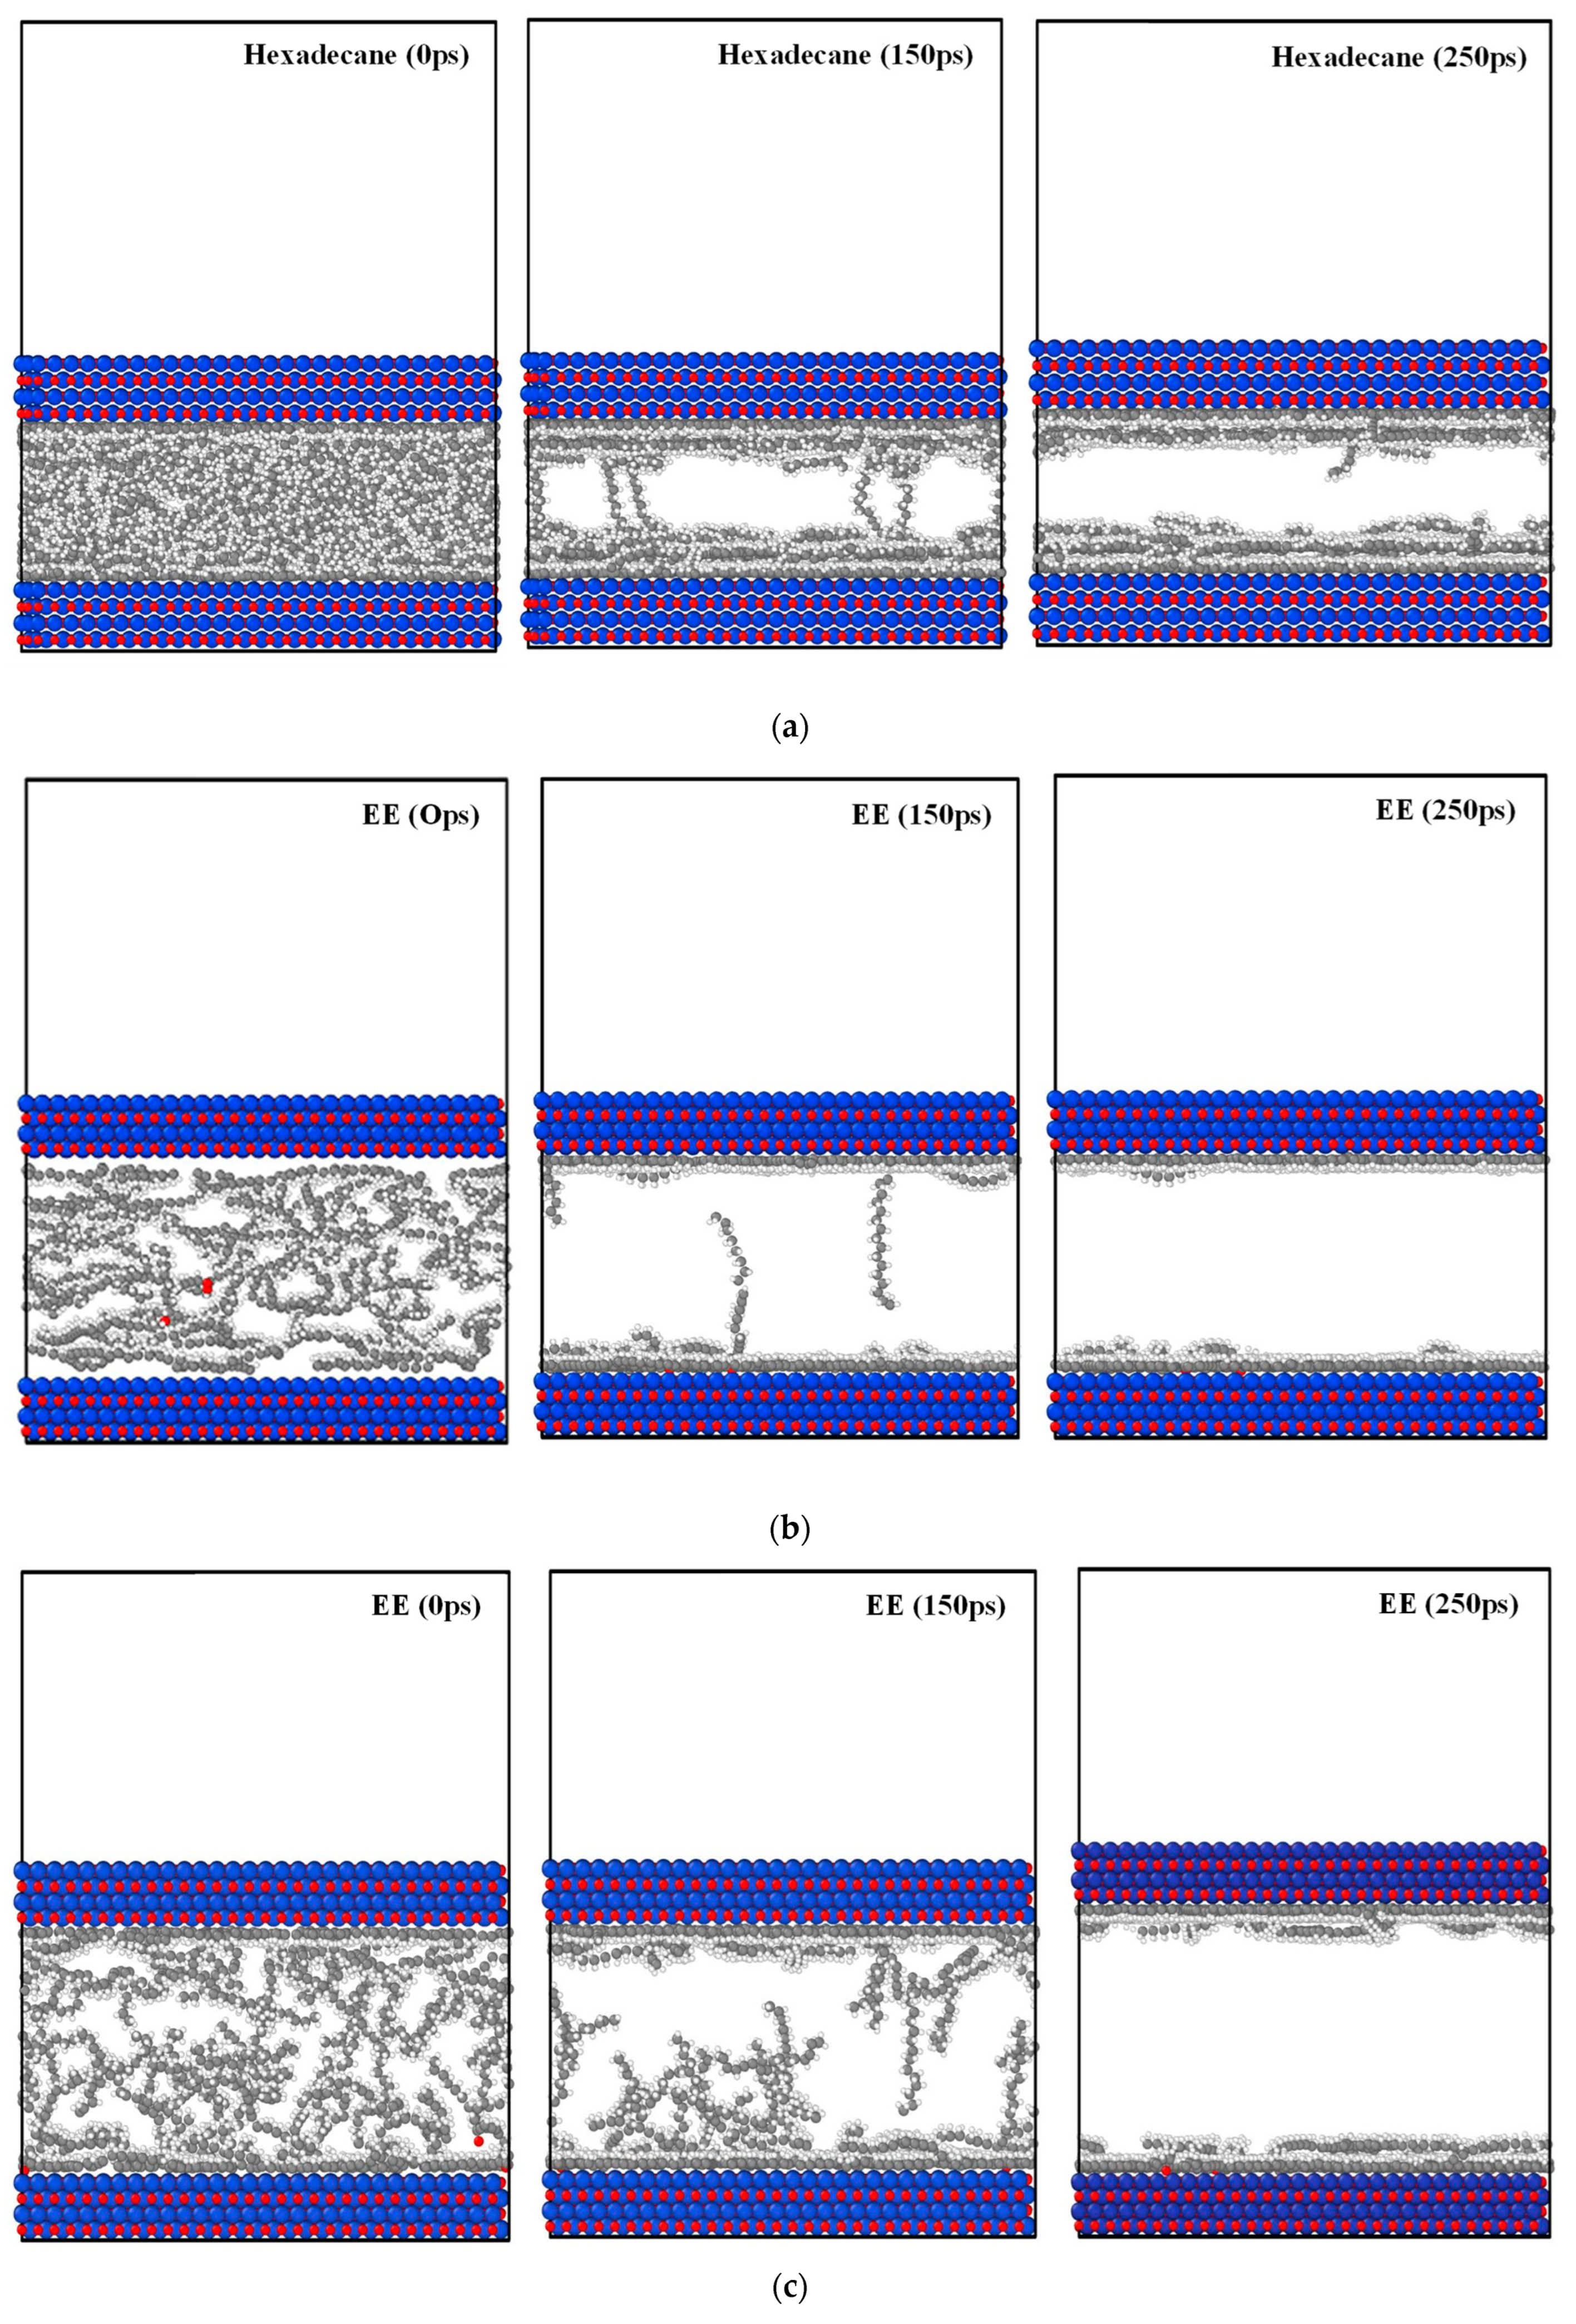
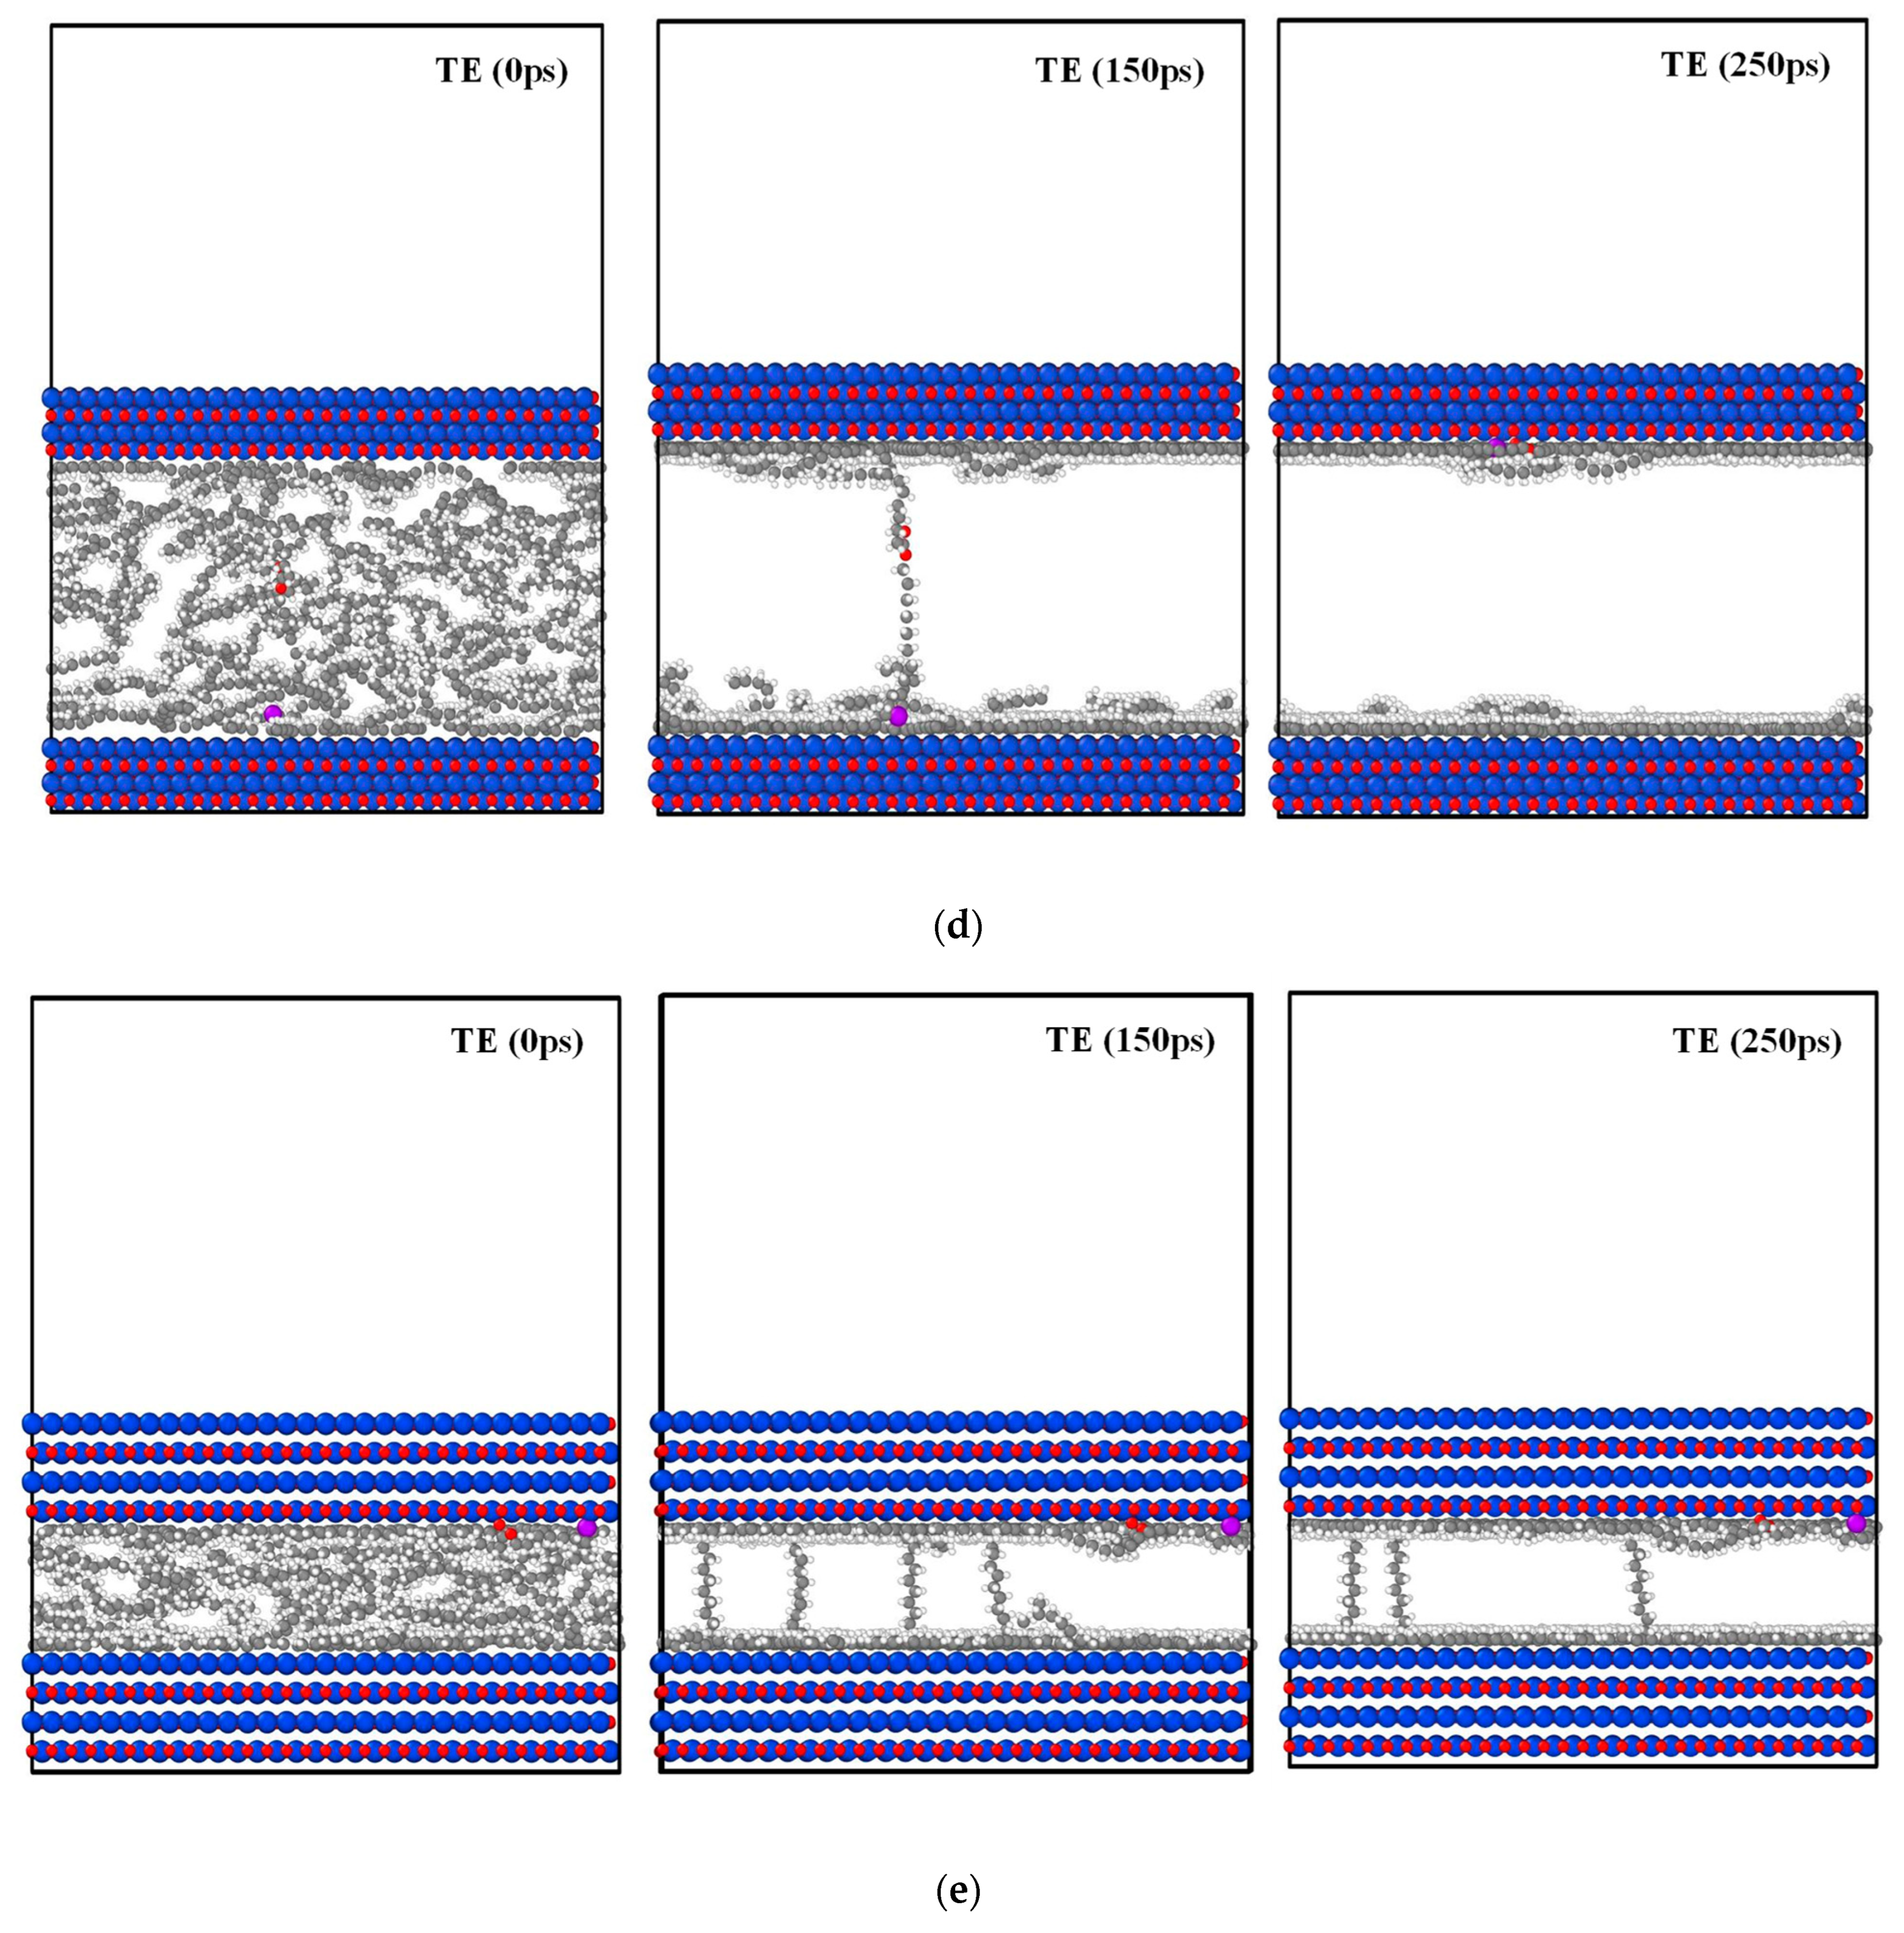
3.3. Molecular Dynamics Analysis

COF: Figure 6a–e show the configuration of the lubricating system at different time steps during dynamic relaxation of the mineral base oil (n-hexadecane, C16H34) and its blends. It can be observed that at an applied stress of 4.7 GPa, the hydrocarbon molecules sheared along the z-direction. The friction of the molecular system was essentially due to the interlayer shearing between the hydrocarbon molecules. The distribution of the molecules along the walls was measured using relative concentration distribution in the vertical direction at different time intervals (before and after dynamics), as shown in Figure 6a–d.
It was observed that the fluid concentration of the mineral oil and its blends was higher on the top and bottom FeO (100) walls at 1 nm and 45 nm in the z-direction (direction of applied load) than in the middle of the wall. This also indicates that mineral oil and blends of EE and TE are well adsorbed on the surface of FeO (100) and, therefore, can potentially reduce the friction between two FeO (100) surfaces.
Figure 7 presents the plots of relative concentration distribution, which depict the arrangement of SAMs built up at the walls. The hexadecane molecules formed less ordered SAMs, as can be seen from the two bimodal peaks between the walls, indicating its poor adsorption over FeO substrate. The instability of the film was due to the poor interaction between hydrocarbon the molecule and the metal oxide substrate, leading to increased flux in the fluid layer near the walls. As a result, relatively higher COF was observed experimentally in the case of mineral oil.
The relative distribution graphs for blends indicate that higher concentration at the walls helped in the formation of ordered SAMs which resulted in improved antifriction behavior at the contact interface. The blends with 1% and 2% EE concentration showed almost similar relative distribution curves in line with almost similar average coefficient of kinetic friction obtained experimentally. The blends with 3% EE and 4% EE showed sharp peaks indicating the formation of orderly films. At 5% EE, all available surfaces appeared to be saturated, and the relative concentration of fluid in the bulk phase began to increase again, as shown by a loosely bound layer above the SAMs in Figure 6c. This increase in the number of molecules in bulk over and above the equilibrium concentration of molecules required for the SAM resulted in increased friction, as evident from the experimentally obtained friction versus time graphs in Figure 3.
For 3% TE blends, the relative distribution of molecules was highly ordered as compared with all other TE blend levels in MO (hexadecane) base oil, as evident from Figure 7. The nature of peaks shows a symmetric distribution at the top and bottom walls and close to zero in the gap. This can be expected to reduce interlayer friction, and indeed the contact shows low COF in the experimental results of Figure 3. In addition, as the TE concentration rises beyond 3%, e.g., at 4% and 5%, it can be seen that the excess molecules resulted in a less orderly state in the gap, indicating that lubricant-lubricant interactions dominated above 3% concentration in hexadecane. This can be attributed to TE-TE steric hindrance during the movement of the layers past one another, resulting in a rise in friction beyond this 3% level.
As per the Boltzmann distribution model, molecules in excess of what would constitute equilibrium adsorption at the substrate would be in the desorbed state beyond the interface of FeO. The first layer of molecules directly in contact with the walls signified the adsorbed state, while the molecules present away are indicated to be in the state of desorption. In the case of hexadecane, the relative distribution plots display two peaks where the first peak is near the wall while the second peak, with almost similar but lower relative concentration, is away from the walls. This bimodal profile suggests that adsorbed and desorbed state contained similar molecules, suggesting weak adsorption, i.e., physisorption. This is likely the reason for hexadecane acting as a weak protecting film on metal oxide substrates.
In contrast, as we started adding the polar triangle esters that have a greater affinity for FeO due to their heteroatom, the adsorption model began to shift towards higher relative concentrations at the surface as compared to neat hexadecane. At 1% blend concentration, the EE displayed bimodal peaks with higher relative distribution as compared to TE, suggesting that EE may form better lubricant film, but the bimodal nature further suggests that desorbed molecules between the walls contributed towards higher COF as compared to single broad peak when TE was used. The nature of peaks for EE blends changed their shape from a bimodal (blank and 1% EE) to a single peak up to 4% concentration. With TE, the peaks showed a single hump on each of the walls, suggesting the orderly nature of blends at all concentrations. The relative distribution of the molecules in TE blends rose with the increase in concentration to 3%, and above this concentration, the amplitude of the distribution curves decreased, reflecting similar characteristics of the 5% TE blend as that of 1% TE. The similar amplitude of the relative distribution curves was also found to relate well with the COF data, which showed a direct relationship with the obtained computational data.
The experimental data depicts that TE blends showed better antifriction behavior as compared to EE blends, because of the more orderly arrangement of molecules at the interface. Moreover, the computational results are closer to the experimental results obtained with Gp II base oil, suggesting that the computational model of hexadecane and its blends is more accurate for mineral oil which contained a higher concentration of saturates, unlike Gp I with comparatively less saturated chains in its bulk. This is not surprising as the model compound, n-hexadecane, is itself a fully saturated and linear molecule.
Wear: The lubricant at the interface experience two types of interactions: first, within the lubricant molecules (intermolecular interaction energy) and second, with the metal substrate in contact (adsorption energy). The former decides the stability of the lubricant film while the latter decides the strength and durability of the substrate-lubricant pair, which in turn is responsible for protection of the metal oxide substrate during machine operation. In order to decide tribological characteristics of the contact, it is important to consider both these types of interactions. The dominant force among these two eventually decides the wear behavior of a given mechanical contact for a given substrate-lubricant pair.
From Figure 8, it is observed that the adsorption energy of base oil and its blends with triangle ester molecules was consistently greater than the intermolecular interaction energy indicating that adhesive forces at the interface dominated over cohesive forces in the bulk of the range of blends studied. The blends of EE and TE displayed a more stable lubricating oil film than pure hexadecane, as reflected in the larger adsorption energy.
Additionally, the adsorption energy of TE was far greater than EE in all cases in the range studied, indicating that blends of TE can adsorb more strongly on the surface of FeO (100). At the same time, there was adequate interaction between lubricating oil molecules, enabling them to form an adequately thick and stable film between the FeO (100) surfaces. From the relative components of the energy as given in Equation (3) and shown in Figure 9, it can be inferred that the non–bonding interactions between the molecules are the primary contributors to the formation of a stable lubricating oil film.
Total Energy:
E = Ekinetic + Epotential
where:
E k i n e t i c = i = 1 n m i r i 2 2 = p 2 2 m .
E p o t e n t i a l = V i n t r 1 , , r n + i = 1 n U r i e x t i
n’ particles/atoms at positions ri (i = 1…n), Velocities = p2/2m; Vint= Interaction between particles/atoms; Uext is external potential.
It can be observed from the graphs that the contribution of non-bonded forces was highest as compared to other forces in all developed lubricant blends. The non-bonding forces were strong in TE with −323.22 kcal/mol, followed by EE blend with −313.80 kcal/mol, and lowest with hydrocarbon hexadecane having −223.39 kcal/mol. The presence of heteroatom in EE and TE increased the polarity of the lubricating film as compared to hexadecane, which, in turn, enabled stronger interactions of EE and TE molecules with the surface of FeO (100).
The TE blends, as expected, because of the polar sulfur atom but relatively lower ring strain, showed the greatest (negative) adsorption energy. EE similarly showed better adsorption force than neat base oil but weaker than TE, as evident from the plot. These simulation results are consistent with the obtained experimental wear volume, which also shows that TE interactede strongly with FeO (100) as compared to EE and neat base oil molecules.
The TE, which contains an ester moiety and an additional sulfur atom, was involved in synergistic bonding with the metal oxide substrate. The optimized concentration (3%) showed an increase in the bond length of C-S from 1.805 Å in free TE to 2.535 Å after adsorption at this concentration, while EE with additional C-O moiety in epoxy showed an increase in bond length from 1.43 to 1.59 Å.
The extent of increase in bond length was higher in the blends, as shown in Table 4, as compared to the pure state. This reflects that resistive drag due to cohesive forces in the pure state was higher as compared to the blended state. The higher change in bond length of the TE blend as compared to the EE blend was presumably due to the strong interaction of the lone pair of TE present in the 3p orbital of sulfur with the 3d of Fe in FeO. EE (4% blend composition) showed interaction with a lone pair present in 2p orbital, which was energetically less favored with 3d of Fe present in the substrate.
These interactions also resulted in a change in the self-diffusion pattern of the molecules over metal oxide substrate as shown in Figure 10 (Self-diffusion plots). The diffusion coefficient was calculated as the slope of Mean Square Displacement (MSD) versus the time value of all atoms in the lubricating film in all directions. The values explain the speed of diffusion of molecules in all directions in a given space.
Results show that neat base oil had the highest value of self-diffusion coefficient suggesting high flux of the hydrocarbon molecules from their mean position, indicating unsteadiness of the mineral oil molecules as compared to prepared blends.
Between EE and TE blends under all dilutions, TE blends showed a slower movement of the lubricant molecules than EE, indicating a strong interaction and stable lubricant film at the interface of FeO walls as compared to EE. The 3% EE curve broke away from the 1% and 2% EE curves as the cohesive forces between EE molecules came into play. In the case of TE blends, beyond the 3% optimal concentration, little difference was seen between 4% and 5% levels. These trends of the blend were found to relate well with the obtained WV results.

3.3.1. Influence of Contact Stress

COF: The influence of contact stresses on the friction and wear behavior of the optimized blend concentrations was studied at 3.73 GPa, 4.71 GPa, and 5.39 GPa. The EE blends in Gp I base oil showed much lower friction as compared to that in Gp II, which may be due to its high polarity, which formed like interactions with the bulk and also with the polar metal oxide substrate. However, the interactions with the substrate occurred through epoxy and ester moiety; the ring strain of EE being higher than TE resulted in higher friction in all conditions of stress.
In addition, as the contact stress increased, temperature was expected to rise at the interface resulting in increased inter-atomic energy between the heteroatom of the lubricant and the metal atom of the substrate resulting in higher friction. This temperature impact is likely to be more pronounced in the case of EE because of the greater electronegativity difference between the metal and oxygen as compared to metal and sulfur of TE.
Considering the Gp I and Gp II COF plots of EE and TE in Figure 11, it is inferred that the frictional heating in EE was less in Gp I base oil which can be accounted for by the greater heat exchange of more polar EE with other unsaturated molecules rather than the walls of metal oxide substrate. However, in Gp II, the extent of such heat exchange was less due to more saturated and less polar bulk. The TE, however, showed better antifriction results in Gp II, which was due to its less polar nature and its ability to exchange heat with the saturated counterparts as compared to Gp I base oil.
Wear: Figure 12 suggests that EE and TE blends both showed an increase in wear volume with the rise in contact stress. The graphs display that TE blends showed better antiwear as compared to EE under all conditions of stress, as reflected by WV results. However, at the highest stress of 5.39 GPa, the WSD of EE in Gp I base oil was lower than TE, while in Gp II, the values were almost similar. The WV, on the contrary, shows the opposite trend with a visible difference in its magnitude. This suggests that at higher stresses, WV is an accurate method of comparison of wear attributes of the contact.
The Gp I base oil showed higher wear as compared to Gp II in all cases. This may be due to the greater saturation present in Gp II relative to the unsaturation and branching present in Gp I, which limited effective film formation over the metal oxide substrate. In the case of Gp I and Gp II blends of EE, the presence of unsaturated sites along with highly strained EE may result in higher intermolecular interactions as compared to that with metal oxide substrate. However, the opposite may occur in Gp II, resulting in better adsorption and film-forming ability. This is reflected in the lower wear of EE in Gp II base oil. The TE also showed the same behavior, but the presence of lower ring strain in TE resulted in a stable film as compared to EE under all conditions of stress. This also put forward that, unlike the more polar EE, the TE engaged in adsorption rather than forming intermolecular interactions. The results are further understood at the atomic scale using molecular dynamics simulations.

3.3.2. Molecular Dynamics Analysis at Different Stresses

Figure 9 establishes that the forces stabilizing the optimized lubricant films (3% TE in hexadecane and 4% EE in hexadecane) were mainly non-bonding in nature. Figure 13a shows that Van der Waals stabilization energy for the optimized EE blend was −224.4 kcal/mol, while for the TE blend, it was −324.8 kcal/mol. This clearly reflects that the TE blend lubricating film withstands applied stress better than EE blend.
Figure 13b suggests that with the evolution of time, EE did not show many changes in its energy, while it was also reflected that as the vertical stress rose, the magnitude of non-bonding interactions decreased from −224.8 to −222.3 kcal/mol, confirming that higher stresses results into weak bonding of fluid film with the substrate and hence also result into higher friction and wear.
On the other hand, TE blends can be seen to follow step-down kind of curve, reflecting that they stabilized with the evolution of time. In addition, it is observed that for 3.7 GPa, the lubricant film stabilized early (at 110 ps), while as the contact stress rose, the film took a long time to stabilize and reach an equilibrium state, i.e., 140 ps with 4.71 GPa while 213 ps with 5.3 GPa, as can be seen from Figure 13c. This further confirms that the TE film can hold higher stresses maintaining stable film for a longer duration.
The self-diffusion coefficient plot in Figure 13d suggests that EE and TE films almost behaved in a similar manner under lower stresses, with EE showing higher self-diffusion coefficient values as compared to TE. The higher values indicate that at any instant of time, the fluid was hopping around the space much faster as compared to that with lower values.
This also means that such fluid showed weaker interactions with the metal oxide substrate as the EE blend in this study. The difference in the curves is clearly visible at the highest stress of 5.39 GPa, which may be accounted for by the much weaker interactions of EE causing very high friction and wear as compared to TE.

3.3.3. Temperature Profile

Looking closely into the heat exchange that occurs with the walls, it is obvious that with an increase in the contact stress, the temperature at the interface also rose. This is also confirmed by Figure 14a,b that under higher stress, slip heating gave rise to higher temperatures. In the case of the optimized blend of EE, the temperature rise is less compared to the optimized TE blend, which may be attributed to the higher entropy associated with the large size of the sulfur atom and, consequently, greater distortion when vertical stress was applied. It is also interesting to find that TE moiety tended to adsorb on the upper wall while EE stayed at the lower wall, reaffirming the ability of TE blends to respond well to stresses. EE blends, on the other hand, appeared to migrate away from direct stresses that were experienced at the top wall.
The temperature profiles suggest that in the case of EE blends in Figure 14a, as the stress increases, the temperature rose sharply at the upper wall, it is postulated that this indicates weak interactions and low thermal conductivity for EE blends and consequent slip heating resulting in sudden rise in friction and wear at higher stress conditions. In the case of TE in Figure 14b, the temperature profiles exhibit far greater stress tolerance indicating that film can bear higher stresses consistent with the observed gradual rise in friction and wear values.
The thermal conductivity measured at different temperatures, as shown in Figure 15, also suggests that the thermal conductivity of pure TE was higher than pure EE, while the blends of TE showed relatively low thermal conductivity which can be accounted for by the non-polar nature of the bulk medium. The TE blends still showed higher thermal conductivity than EE blends, indicating that TE can better act as a heat sink and can withstand the temperature rise much better than EE by absorbing the heat generated due to frictional heating.

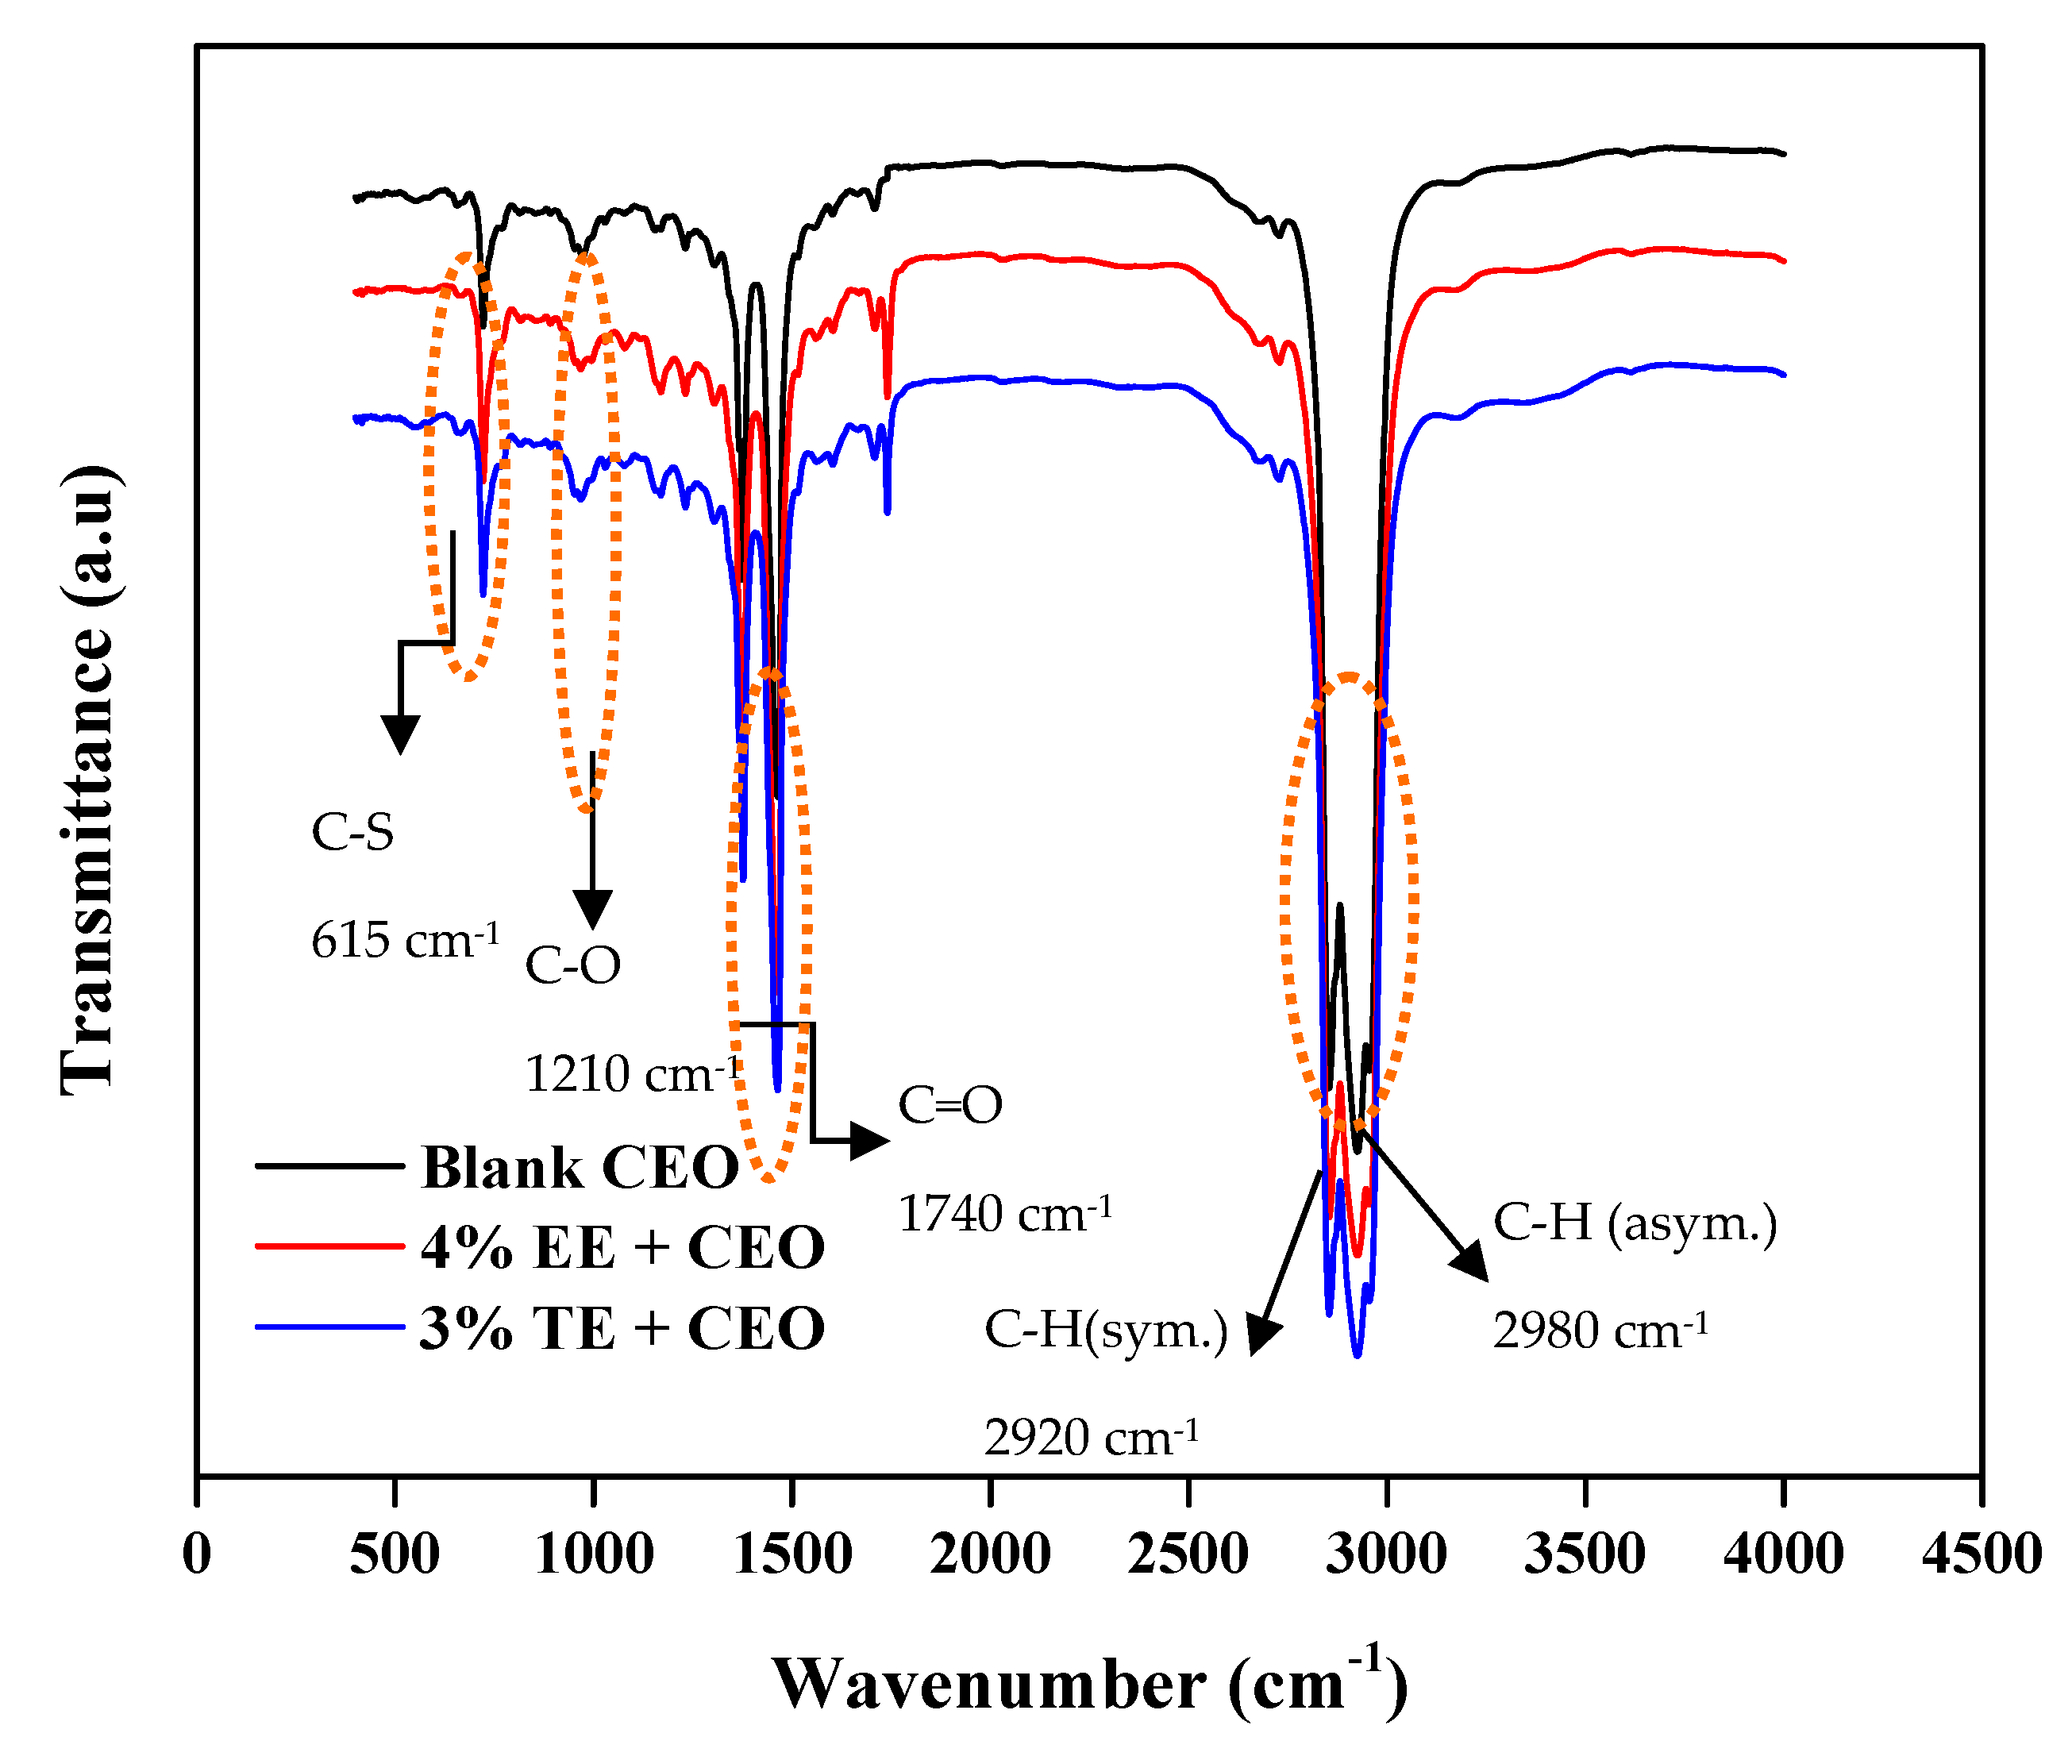
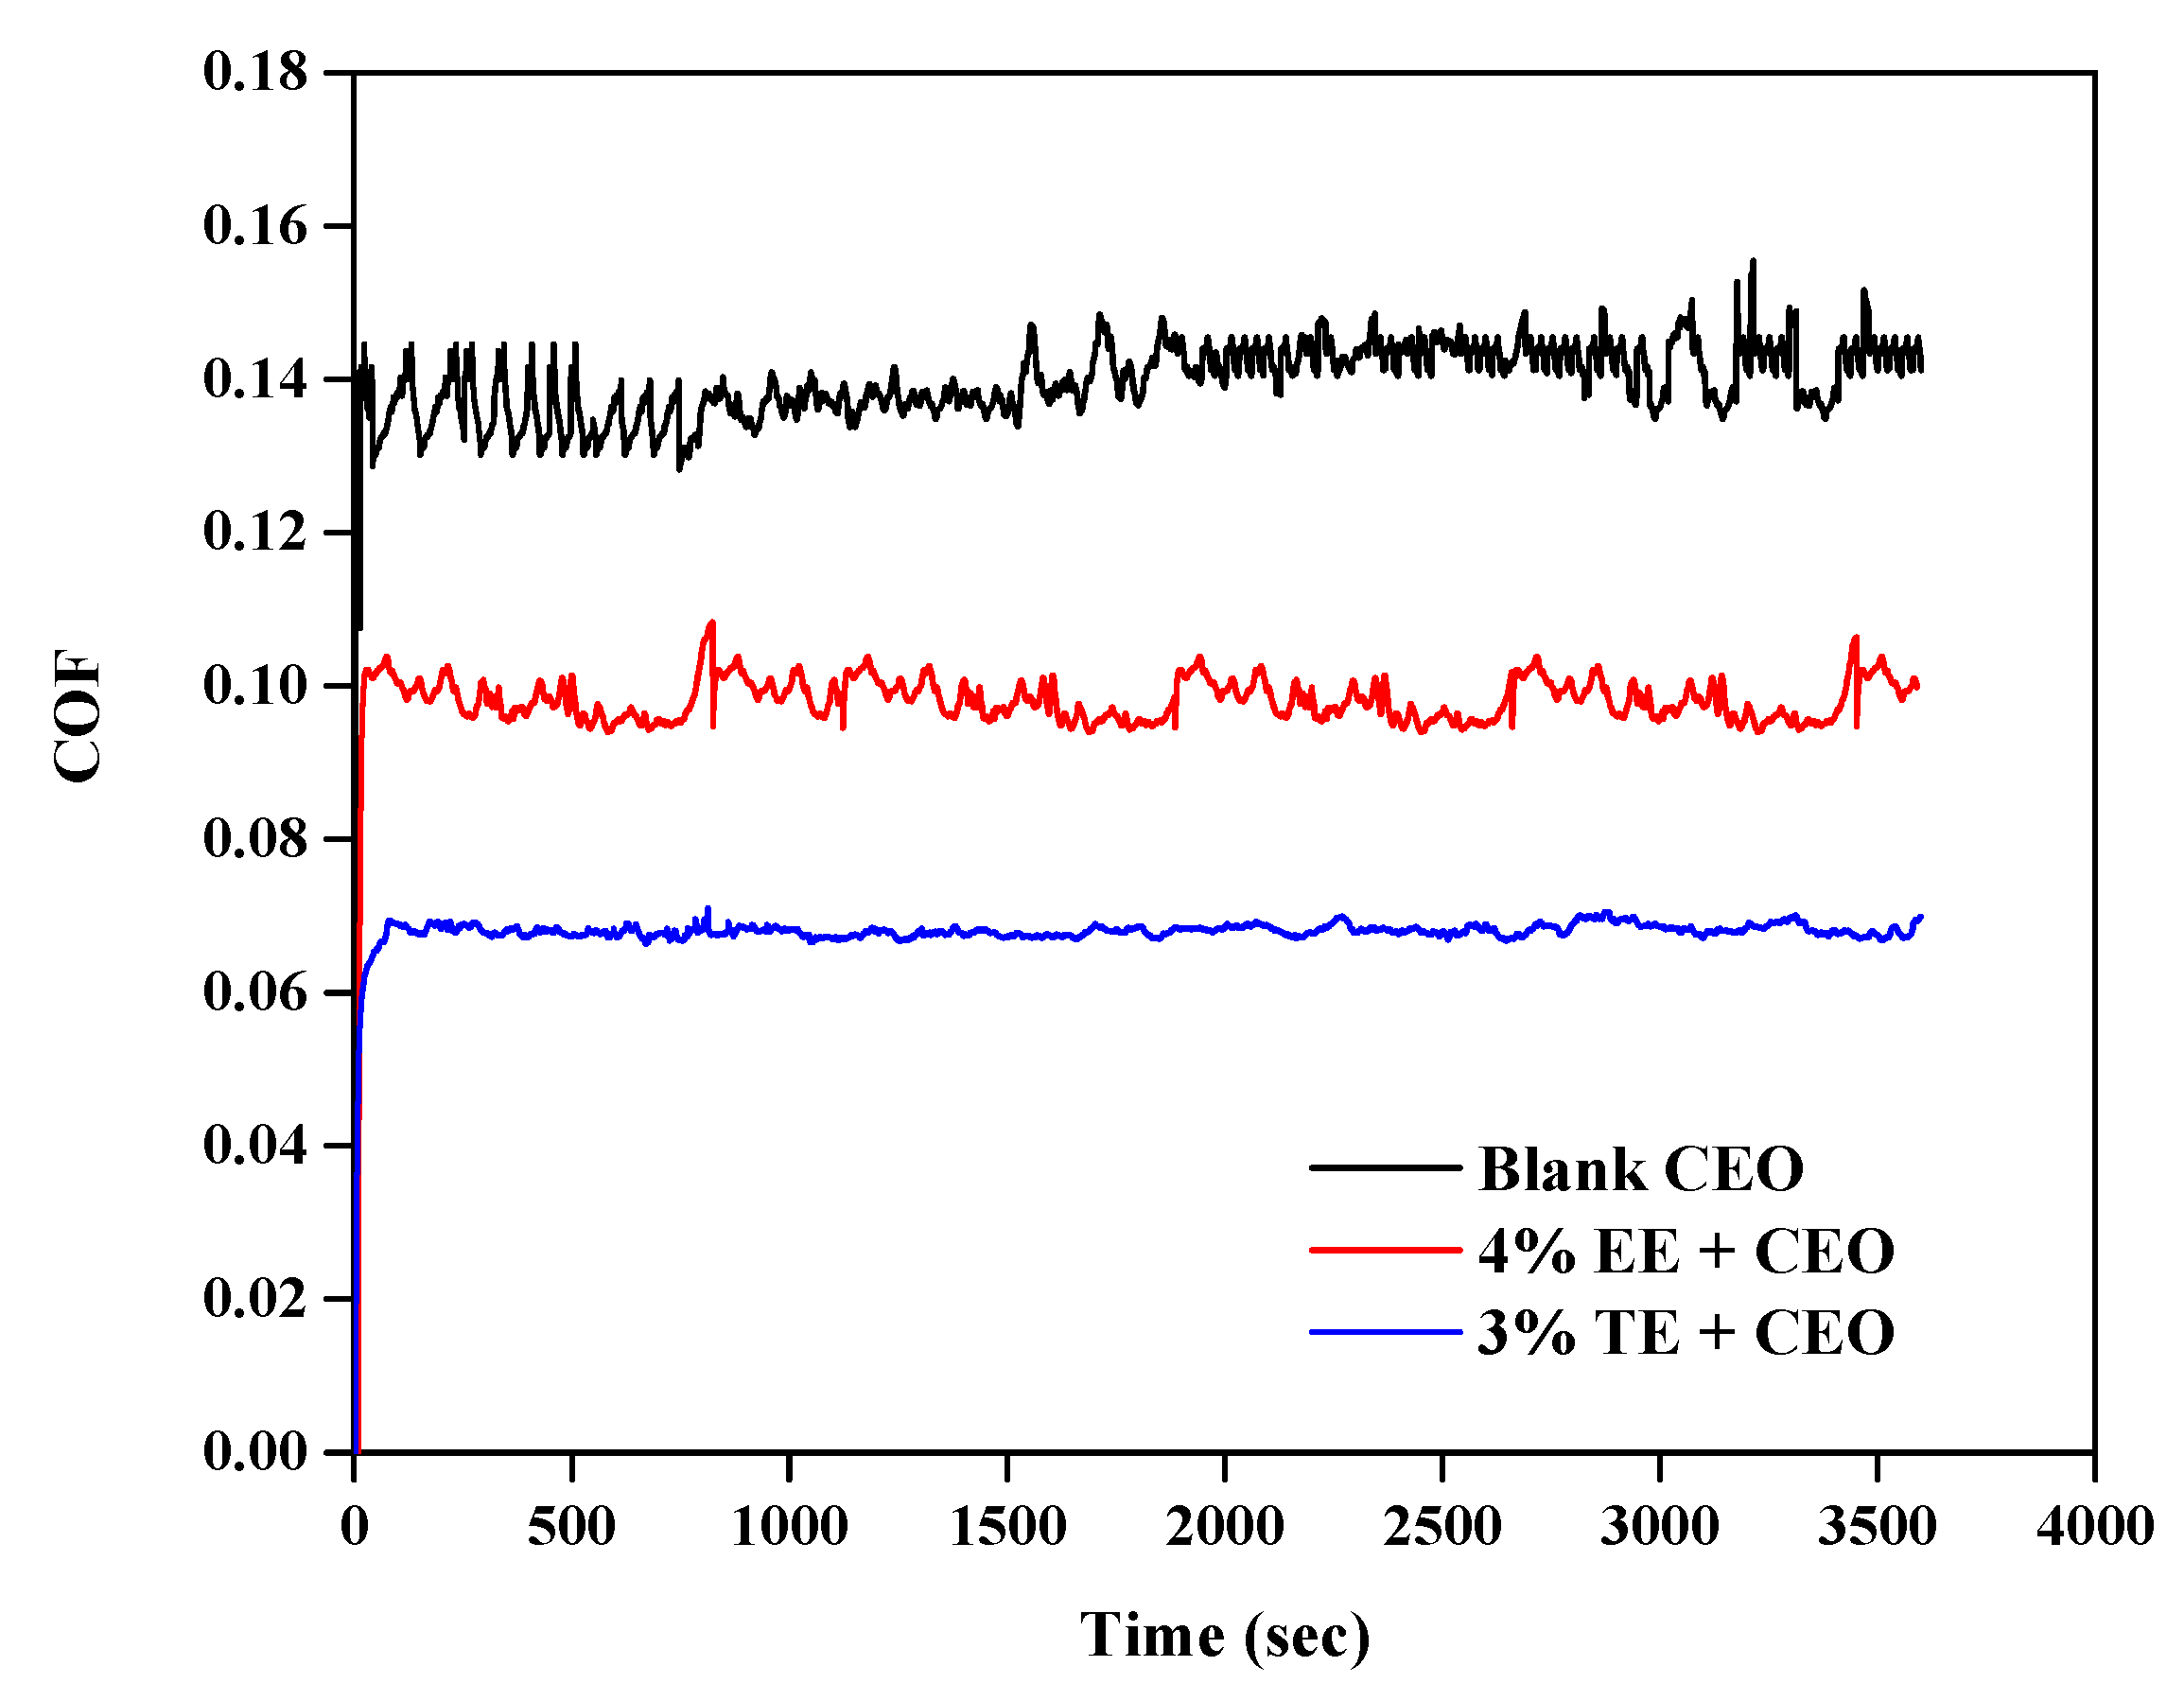
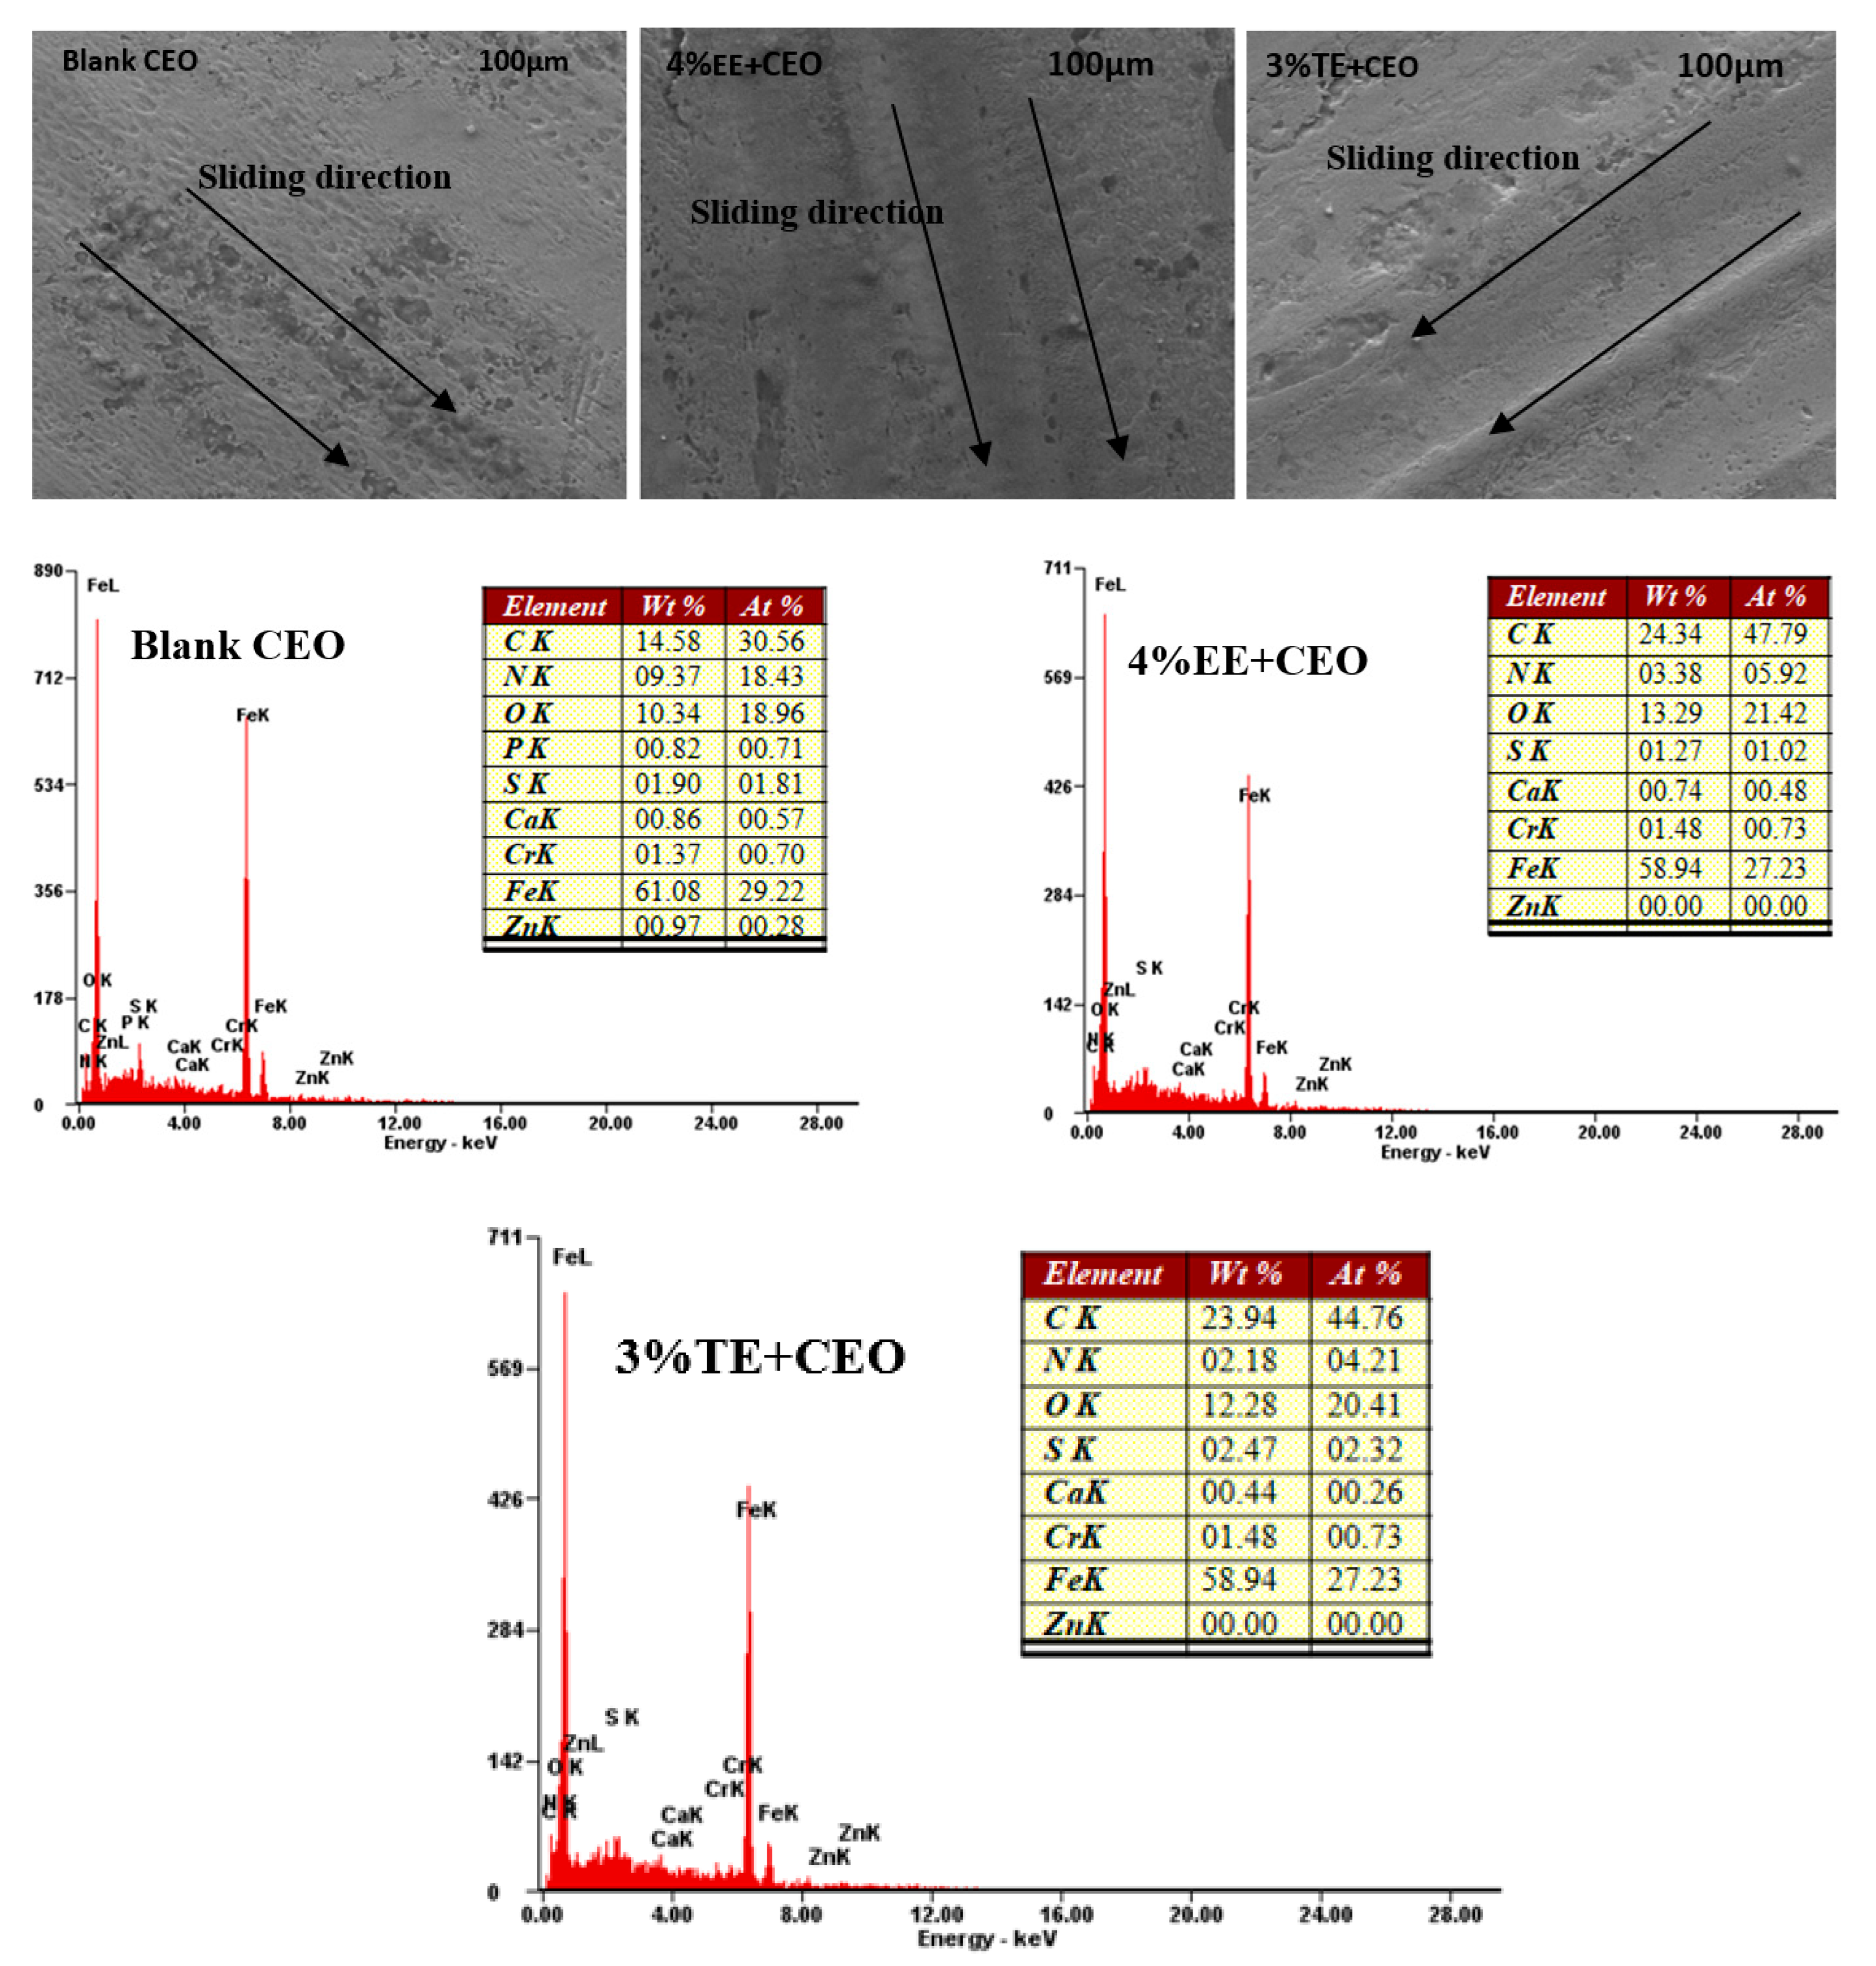
3.4. Application in Commercial Engine Oil (CEO)

The optimized blend ratios of EE and TE showed a visible reduction in friction and wear when blended with SAE 5W40 multigrade CEO. The commercial oil package contains several types of additives in its bulk; still the standard antiwear test of blends showed the formation of strong lubricating films. This also confirms the compatibility of such long-chain esters with the bulk commercial engine oil package.
The ability of EE and TE to form homogeneously stable fluid films was confirmed by FTIR spectroscopy, as seen in Figure 16, where new peaks marked in red are visible due to the bonding of the base oil with ester and heteroatoms of EE and TE.
Figure 17, Figure 18 and Figure 19 show that the COF of blends was improved by 28.5% and 53.5%, while antiwear was improved by 15.6% and 30.5% with optimized doses of EE and TE, relative to CEO. The images of the wear scar in Figure 18 confirm that the interaction of blends with the iron oxide substrate was higher than the reference oil, thereby exhibiting weaker metal-to-metal interaction and allowing improved protection of the substrate. SEM images at higher magnification show transformation of scratching wear in the case of blank engine oil to rubbing and polishing wear with blends of EE and TE, respectively. This further affirms the expectation that EE and TE adsorb strongly and selectively on the substrate relative to other components present in the CEO, including its additive package.
The EDAX profiles of the blends, displayed in Figure 19, show the presence of zinc, phosphorus, nitrogen, calcium, sulfur, and oxygen in the CEO package, and the same elements were present on the surface of the ball specimen in the blank CEO EDAX profile without any triangle esters added. This is not unsurprising as the CEO is a fully formulated lubricant containing additives such as ZDDP. However, TE and EE blends of CEO also contain P, indicated by the presence of a phosphorus peak, but due to its low concentration at or below the detection limit of 0.25% by weight, the P element data was considered negligible and not extracted in the table. This may be attributed to the affinity of phosphorus present in the CEO for oxygen atoms present in the ester, which, in turn, increases the deposition of oxygen, as evident from significant observed oxygen content on the worn surfaces with EE and TE blends, respectively. This further confirms the affinity of heteroatoms in EE and TE for the metal oxide substrate, ultimately reflecting superior protection of the substrate better than what is afforded by blank CEO.

4. Conclusions

(1)
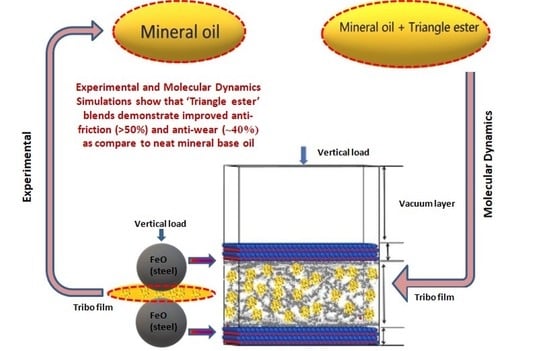
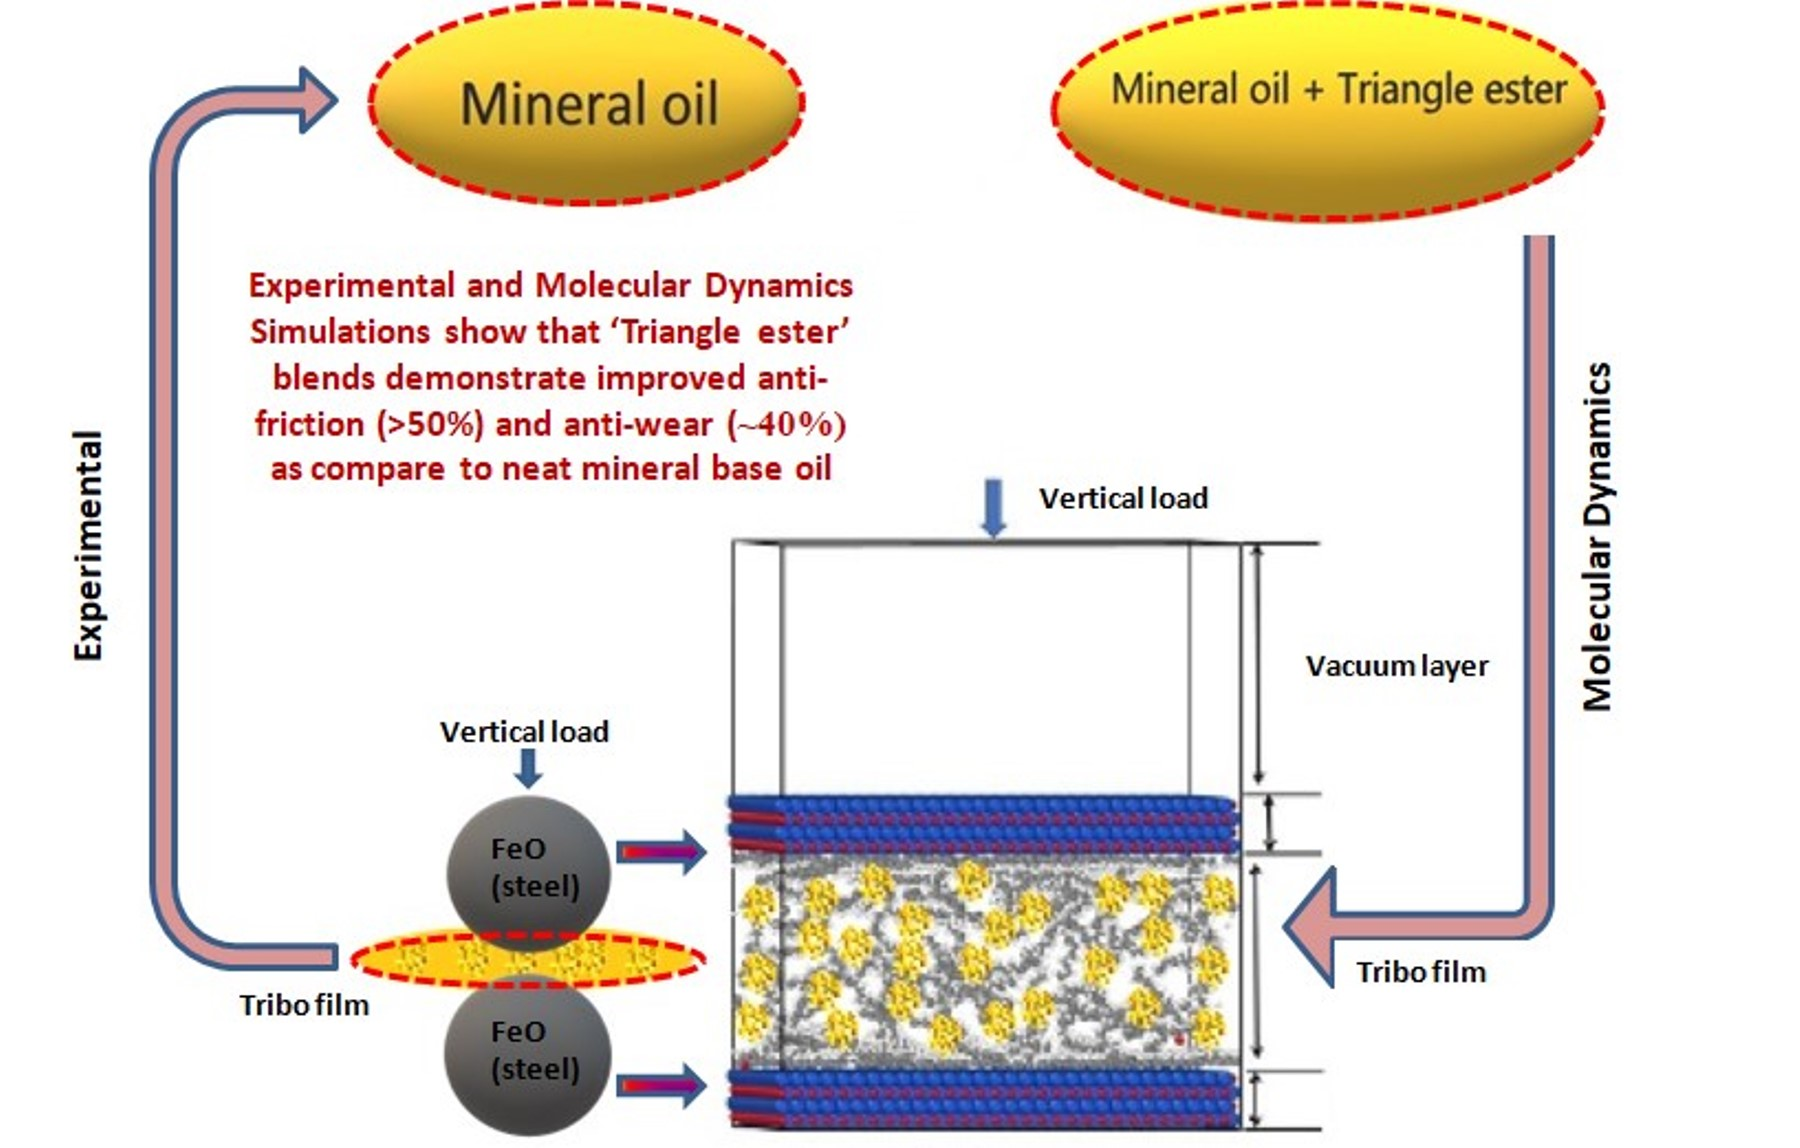
The optimized concentration of EE improved friction by 61.3% and 42.5% and wear by 12.75% and 41.1% in Gp I and Gp II base oils, respectively. In the case of TE blends, the friction reduced by 64.8% and 40.2%, while wear scar diameter was reduced by about 93.5% and 49.6% in Gp I and Gp II base oils.
(2)
The Gp I base oil, being more polar due to the presence of unsaturated olefins and sulfur content, engaged well in like interactions with EE that reflect in lower friction of EE as compared with TE in Gp I base oil. The TE, however, showed better antifriction behavior in Gp II base oil.
(3)
The blank MO, which is high in unsaturates (Gp I base oil), displayed higher friction due to weak bonding with the metal oxide substrate.
(4)
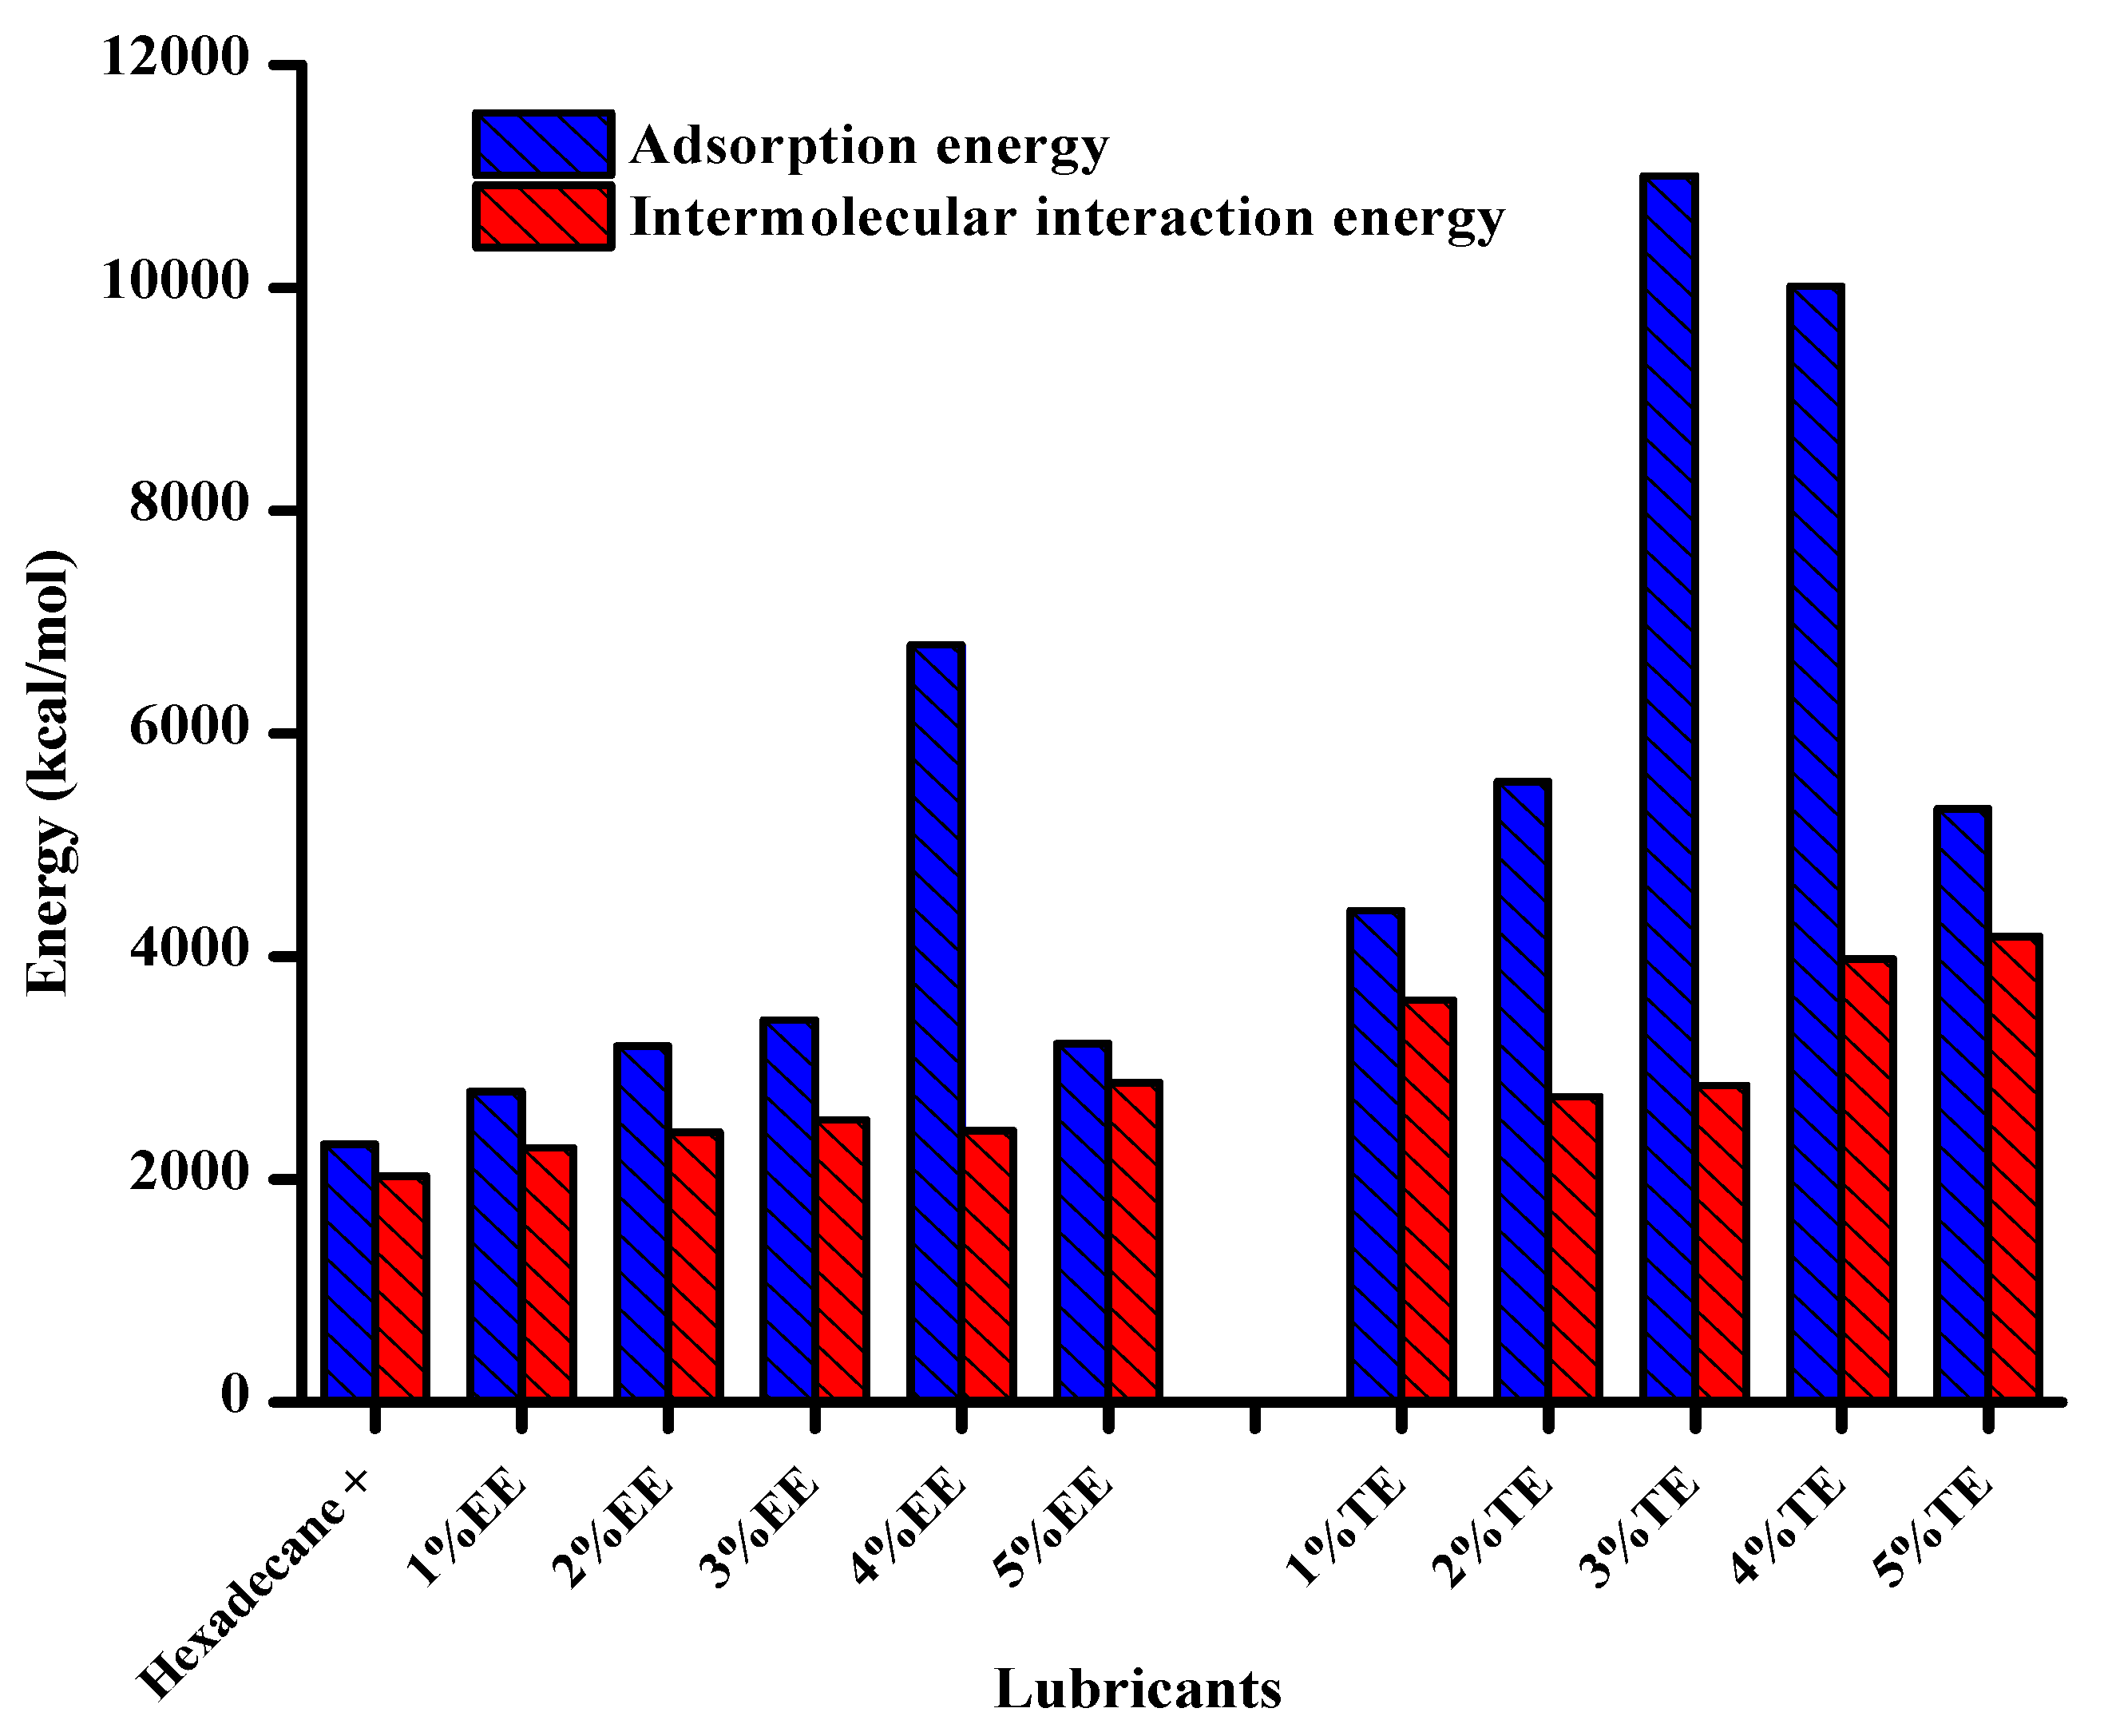
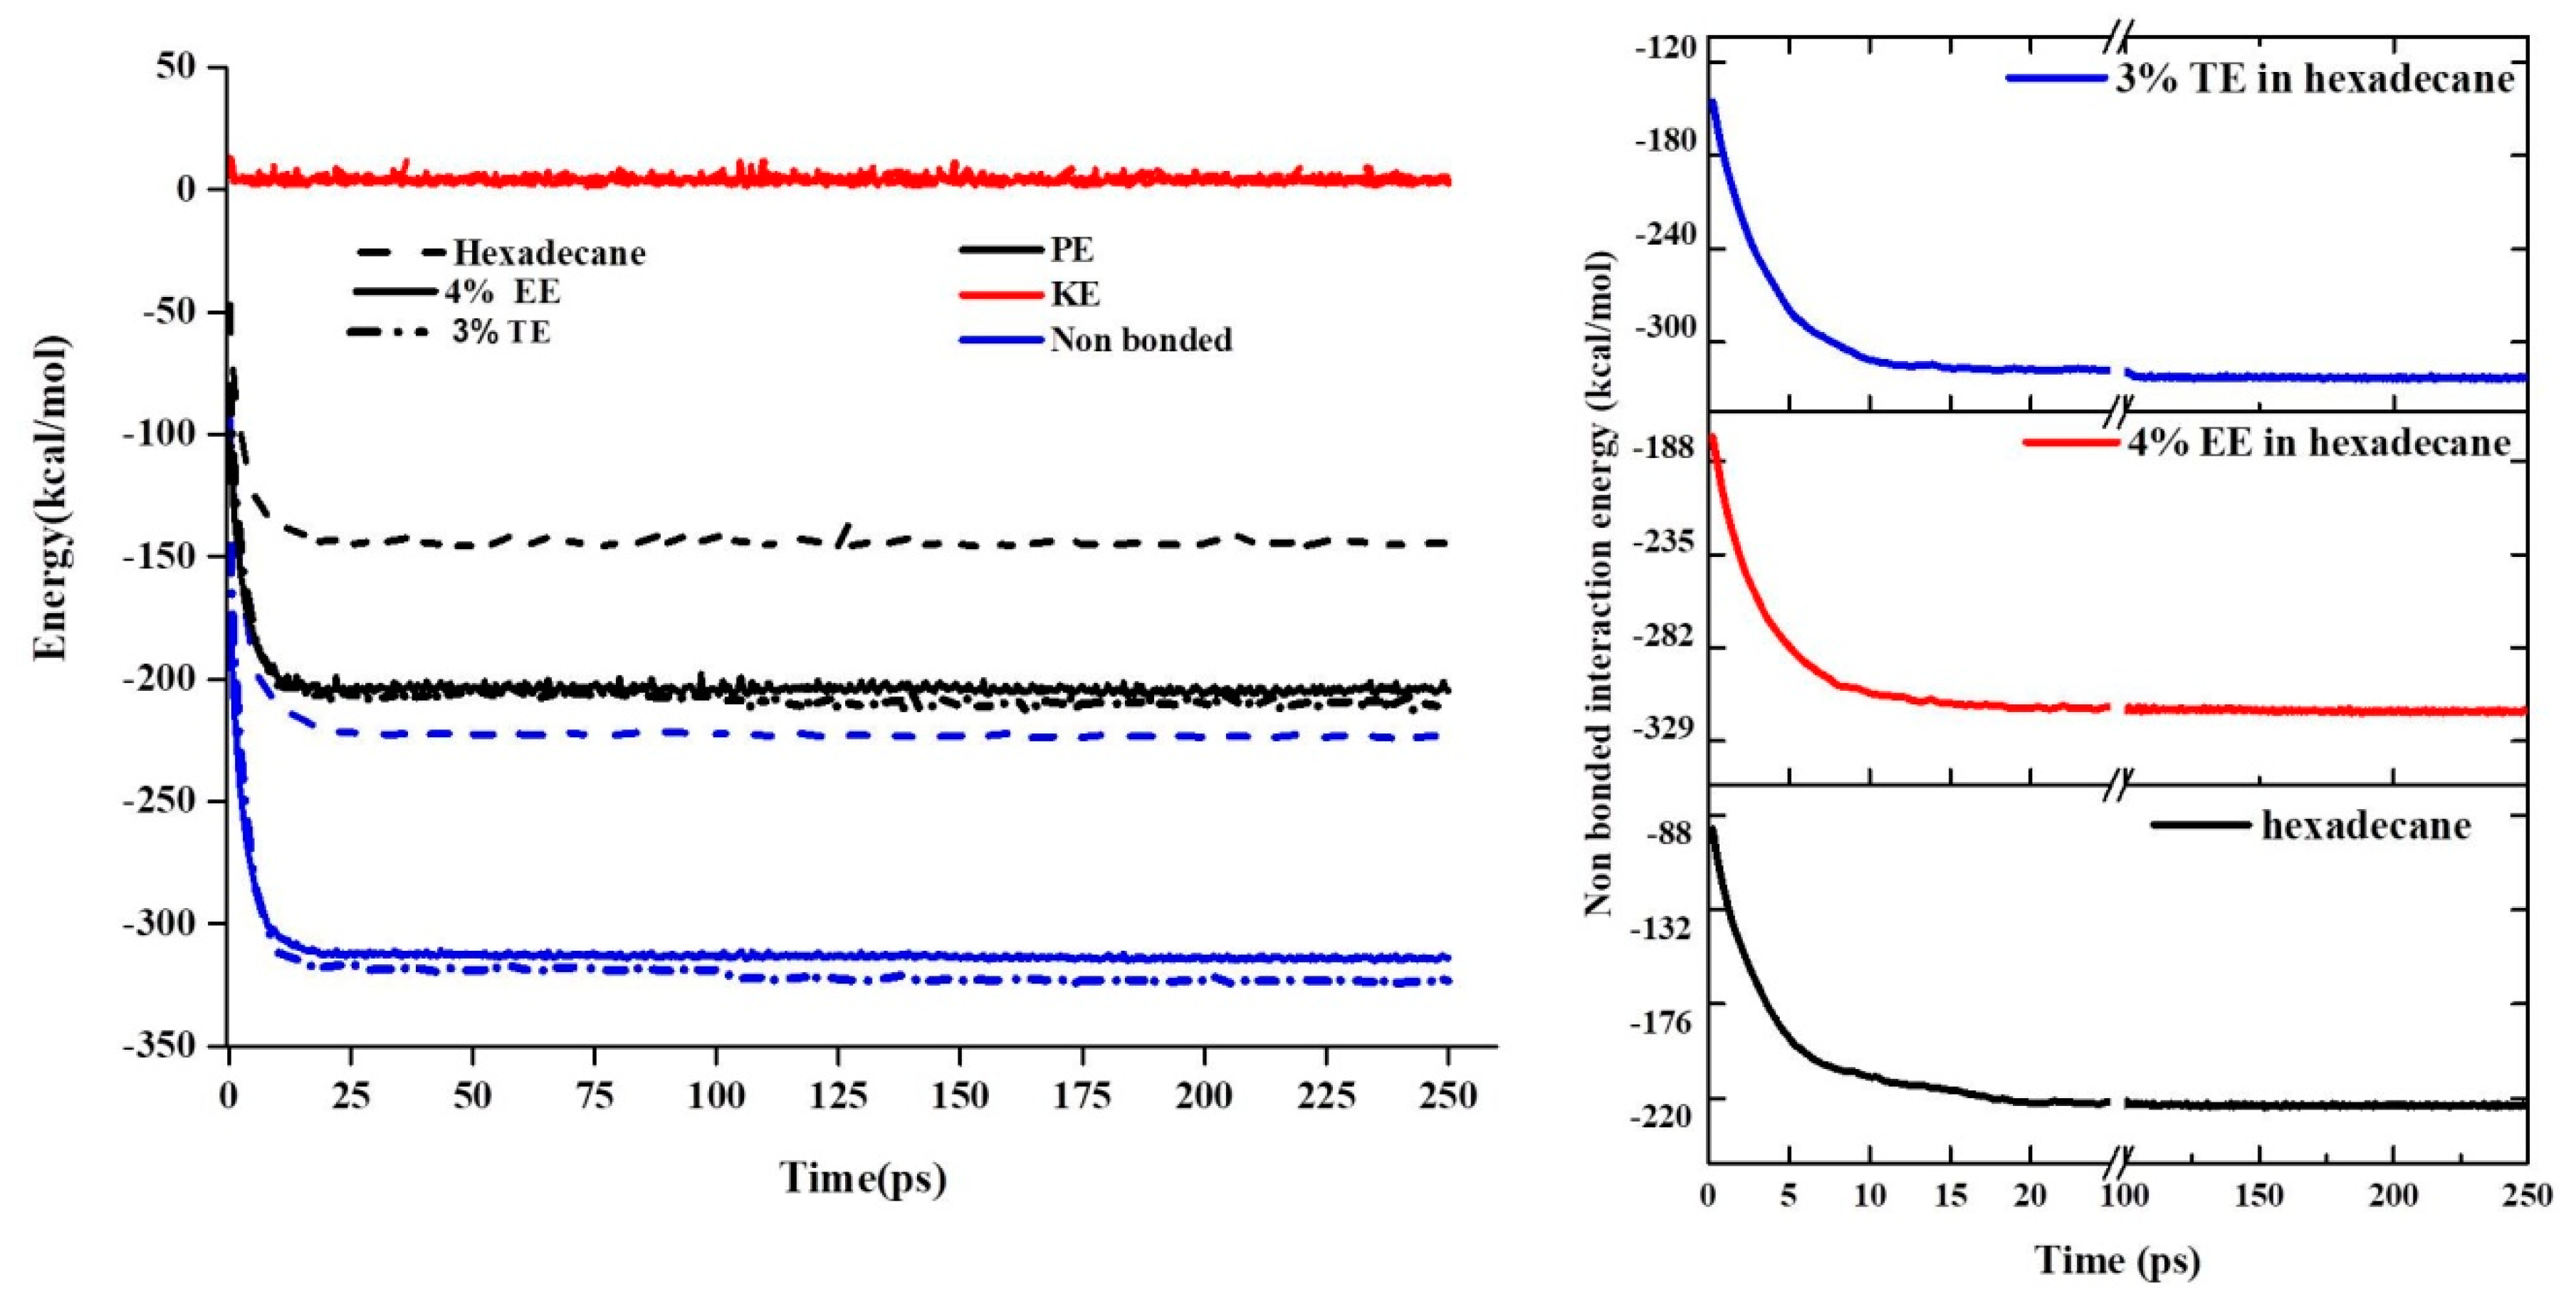
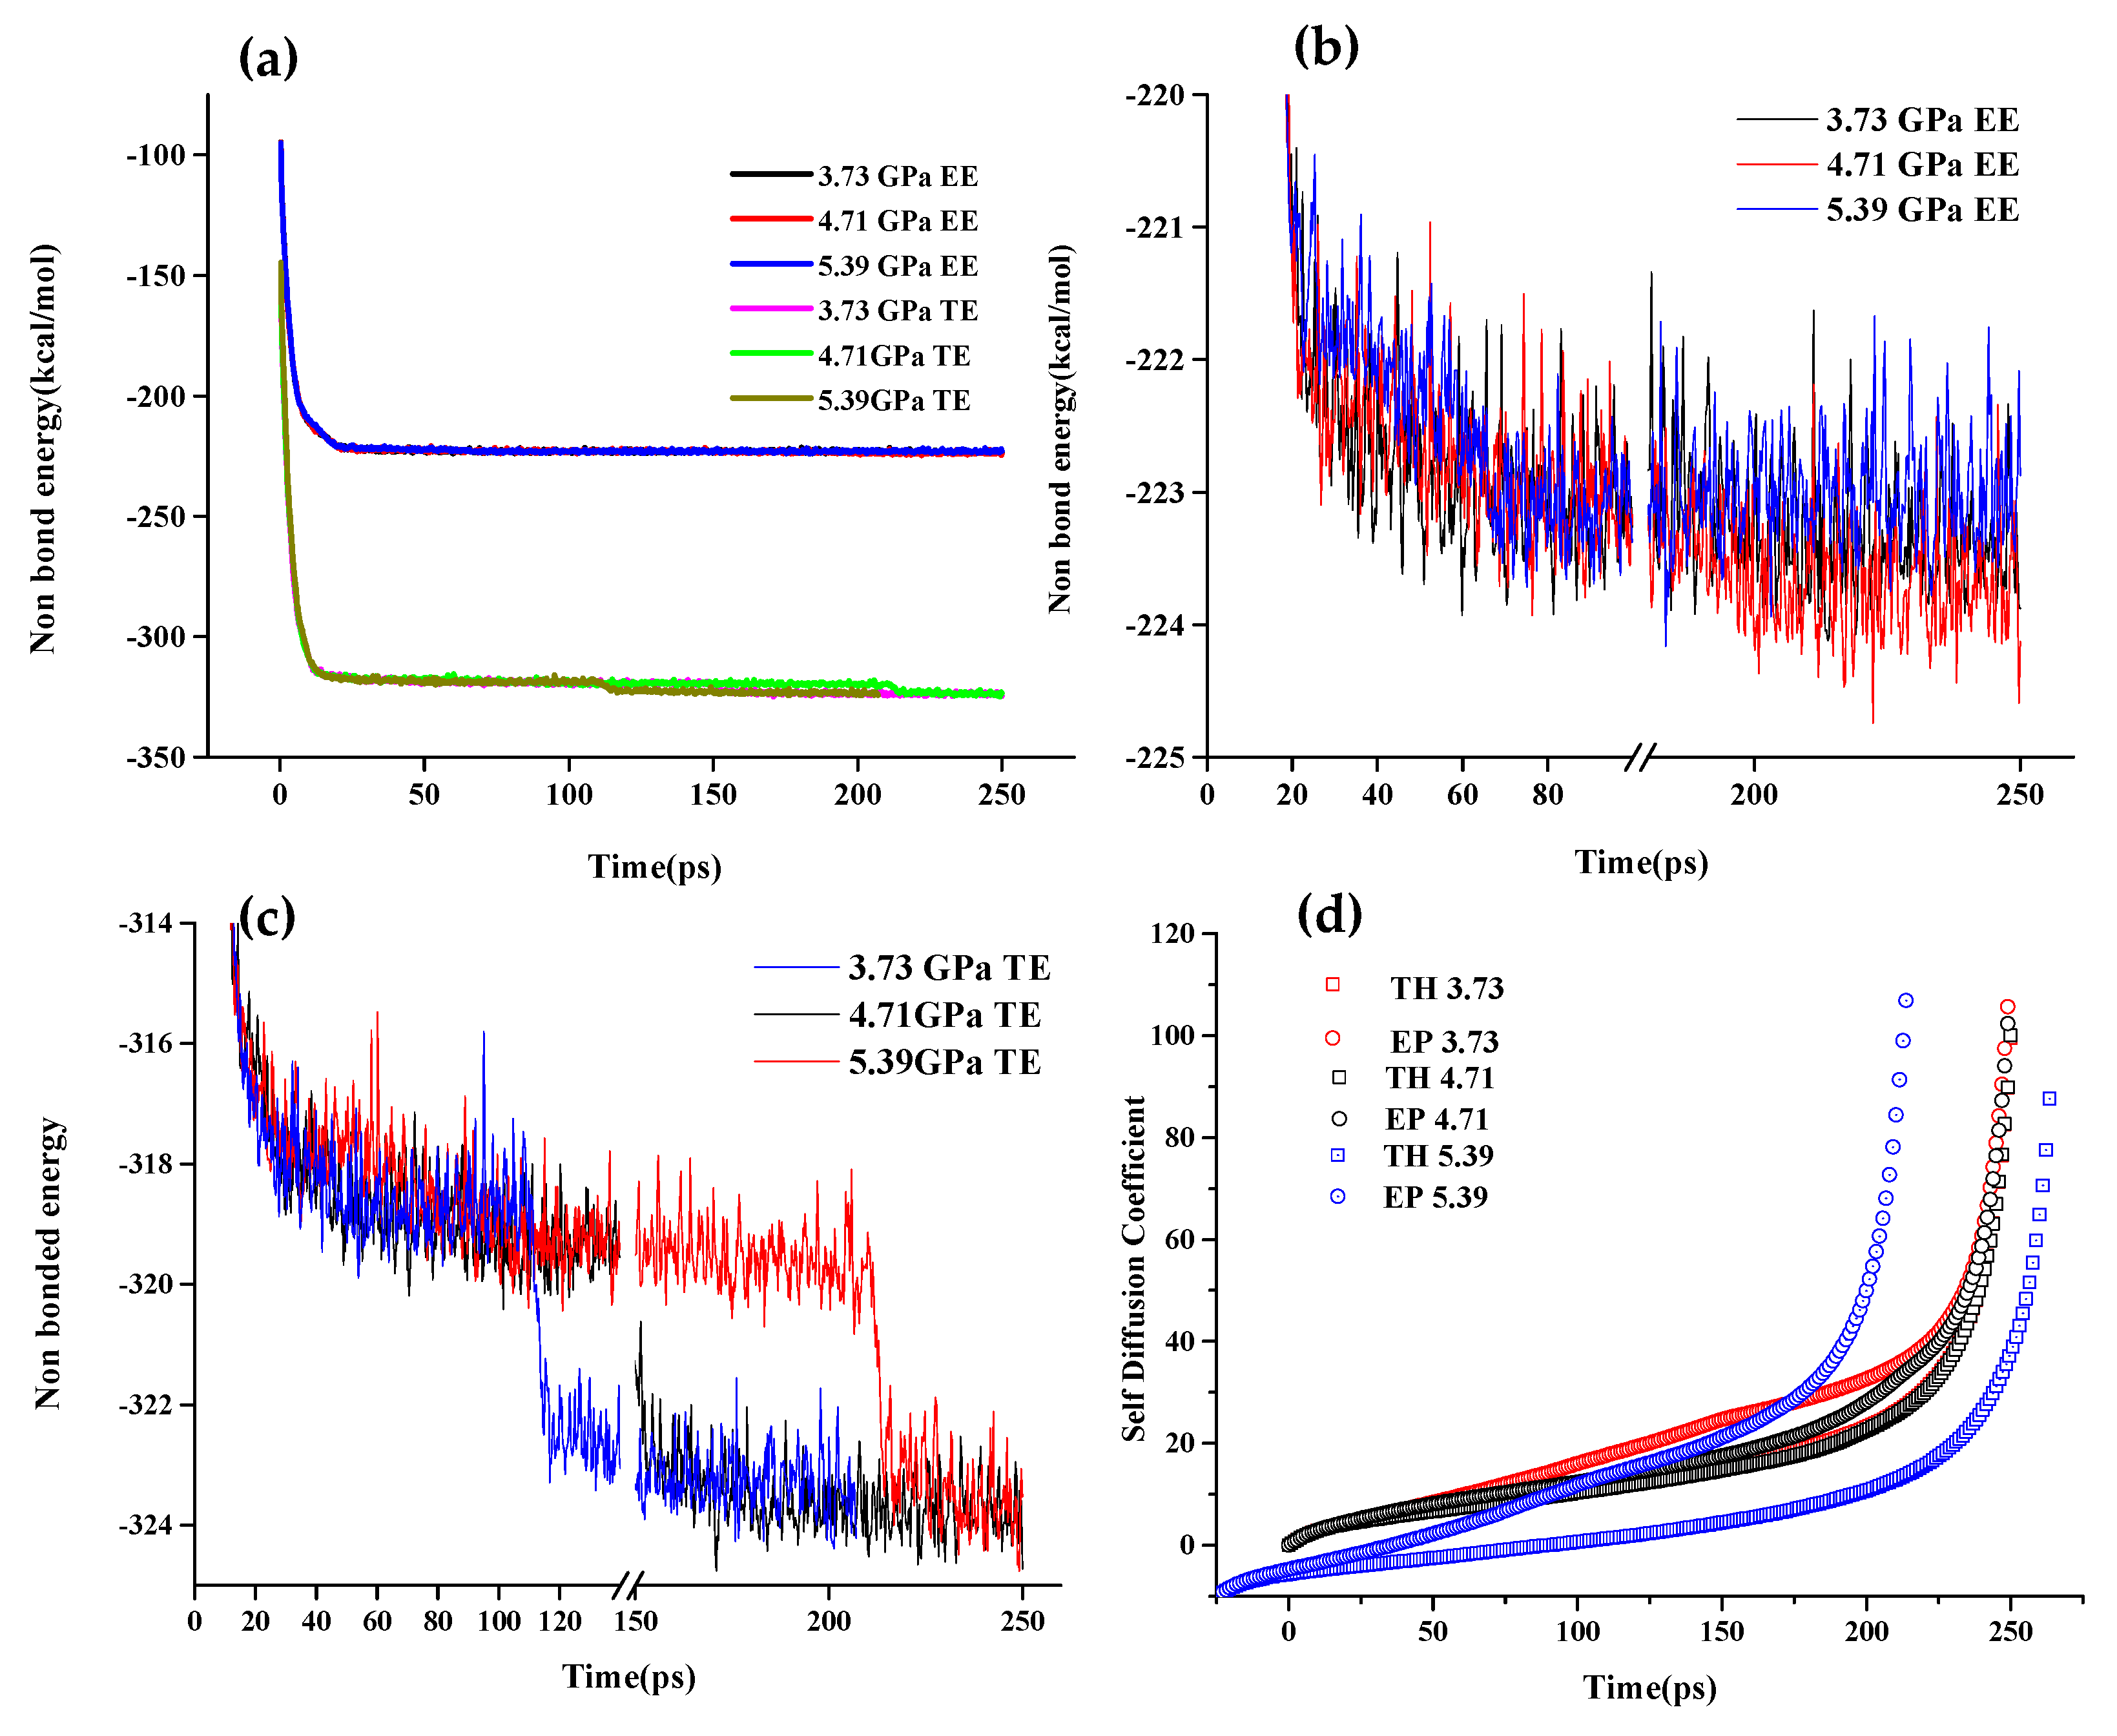
MD simulations showed that Van der Waals forces were the primary drivers for the interaction of the fluid with the substrate. These forces showed high values for TE and EE blends as compared with the neat base oil.
(5)
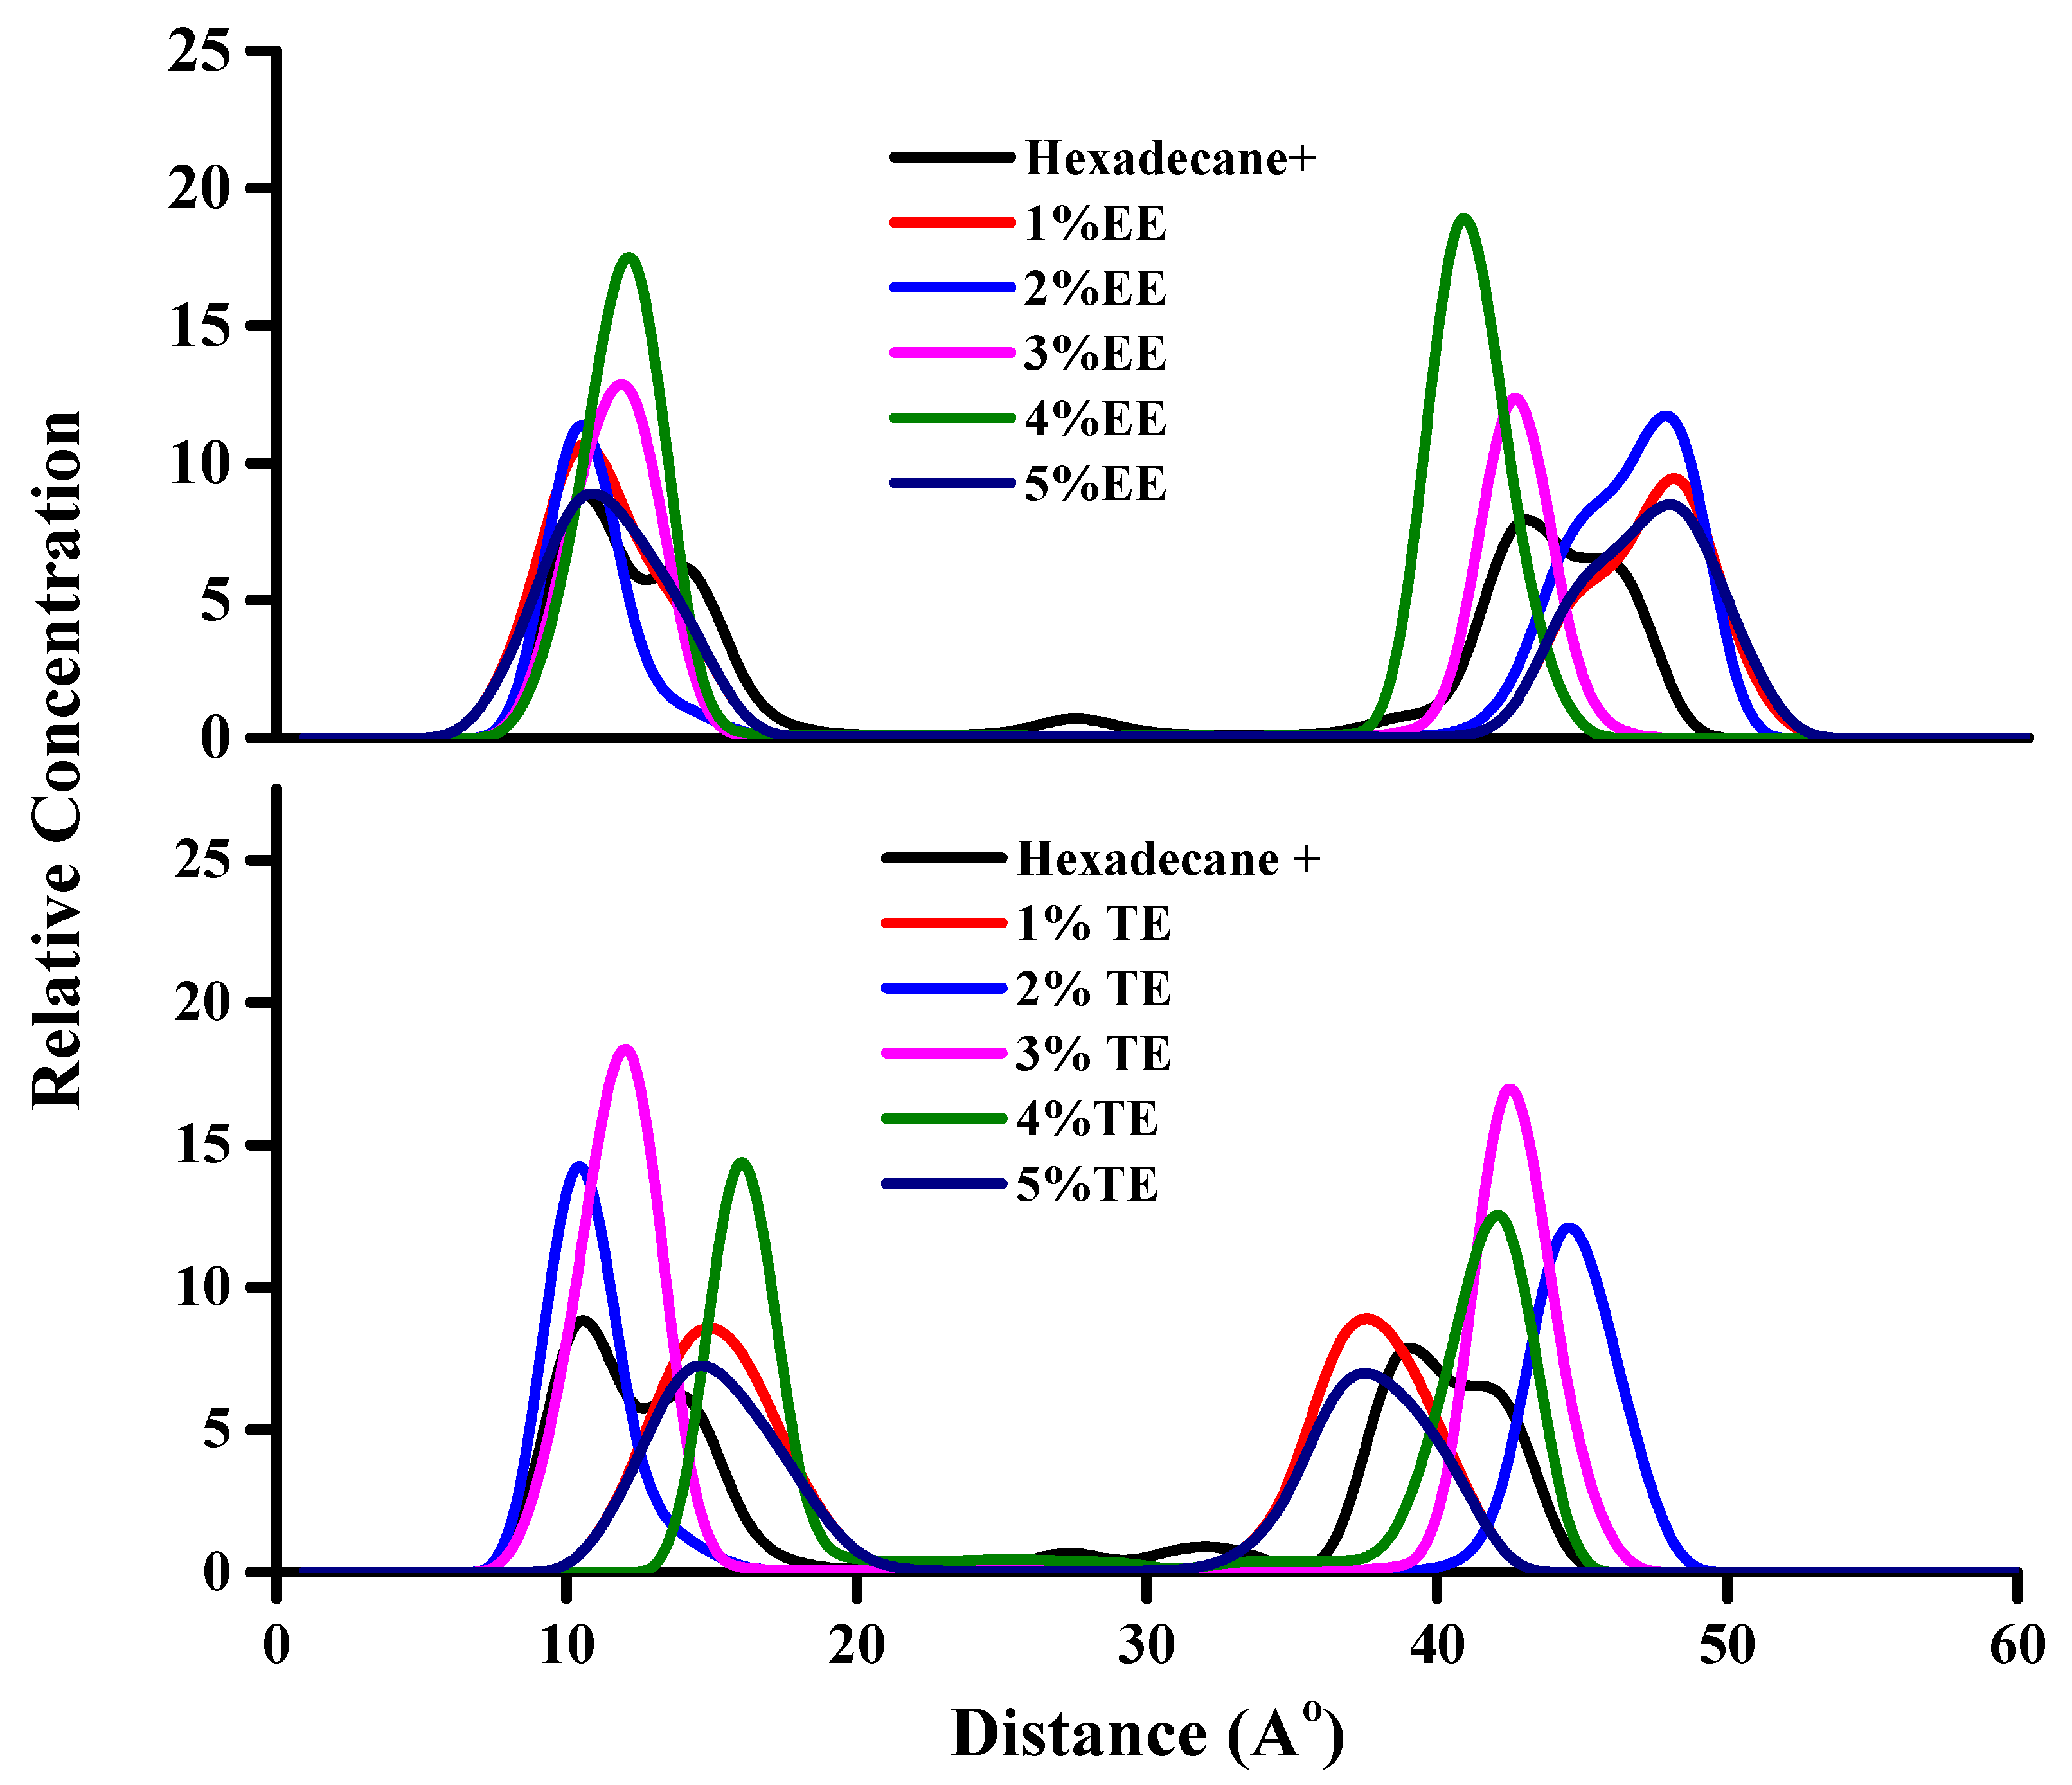
The nature of relative concentration distribution curves gave information about the Boltzmann distribution of the adsorbed and desorbed state of the entrained fluid within the walls. Bimodal curves suggest that the flux of molecules between adsorbed and desorbed states was high, resulting in higher friction and wear, as in the case of MO, while a single peak distribution of ester blends suggests stable SAMs.
(6)
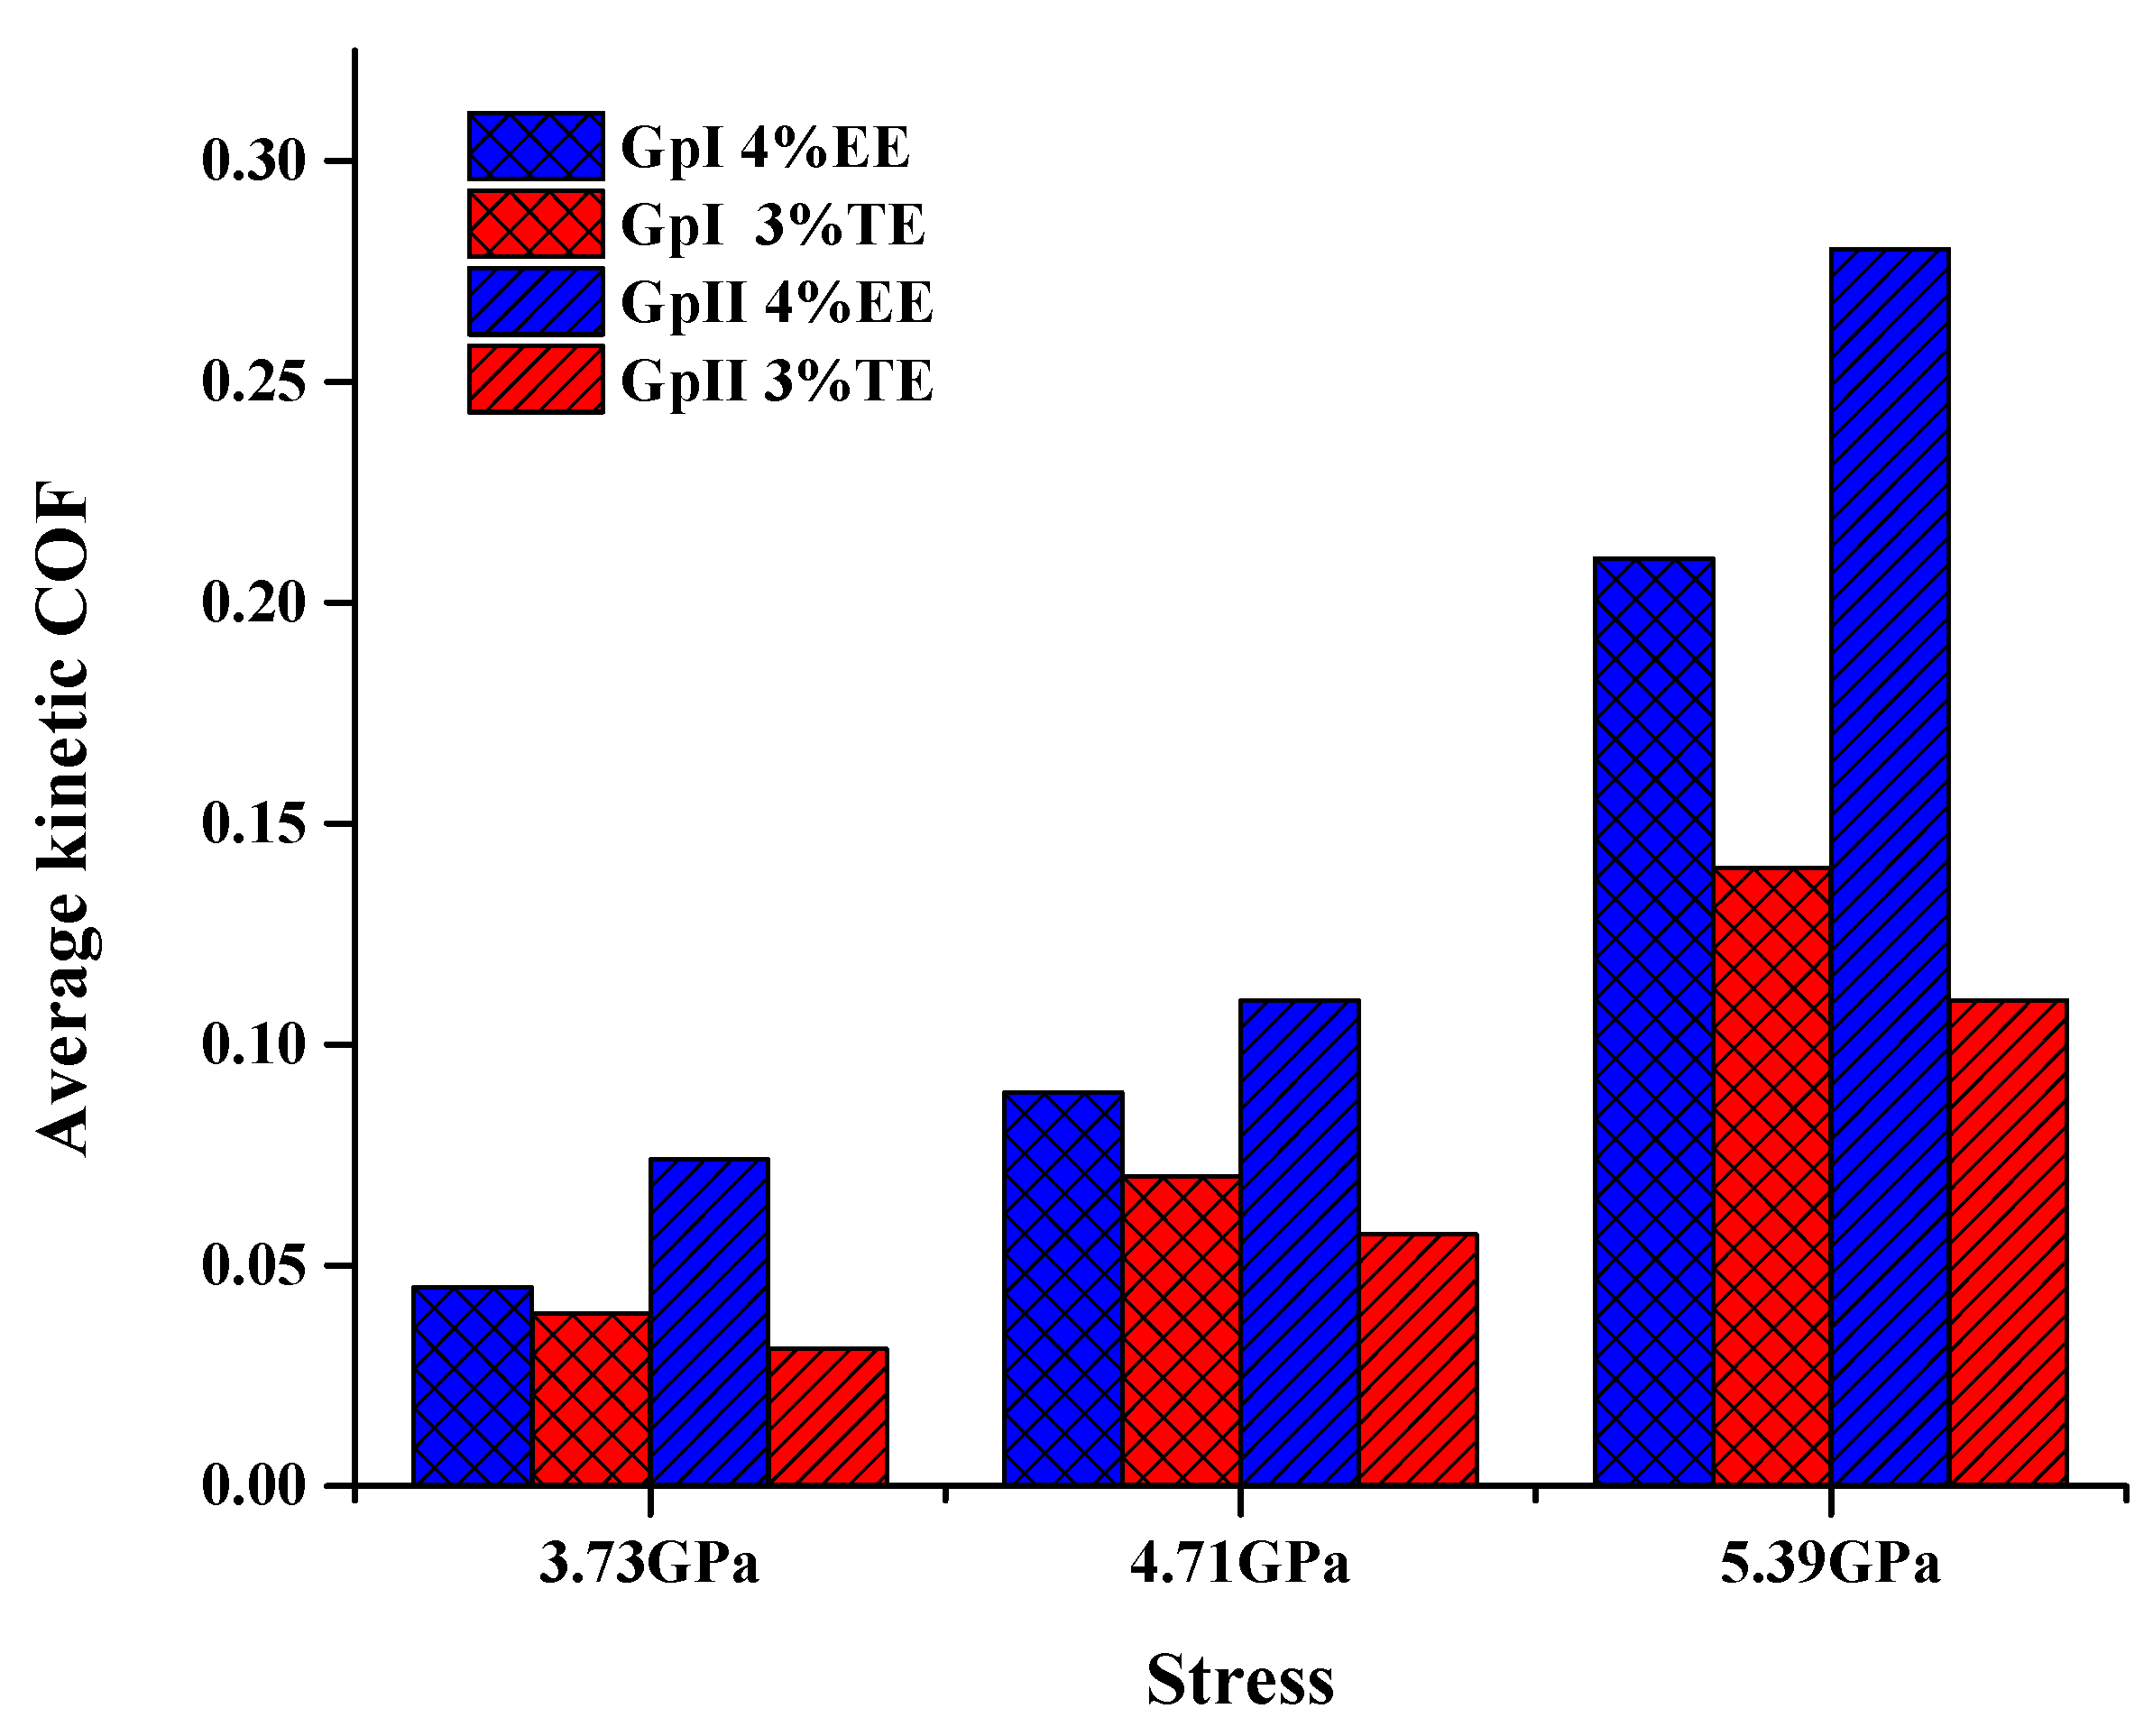
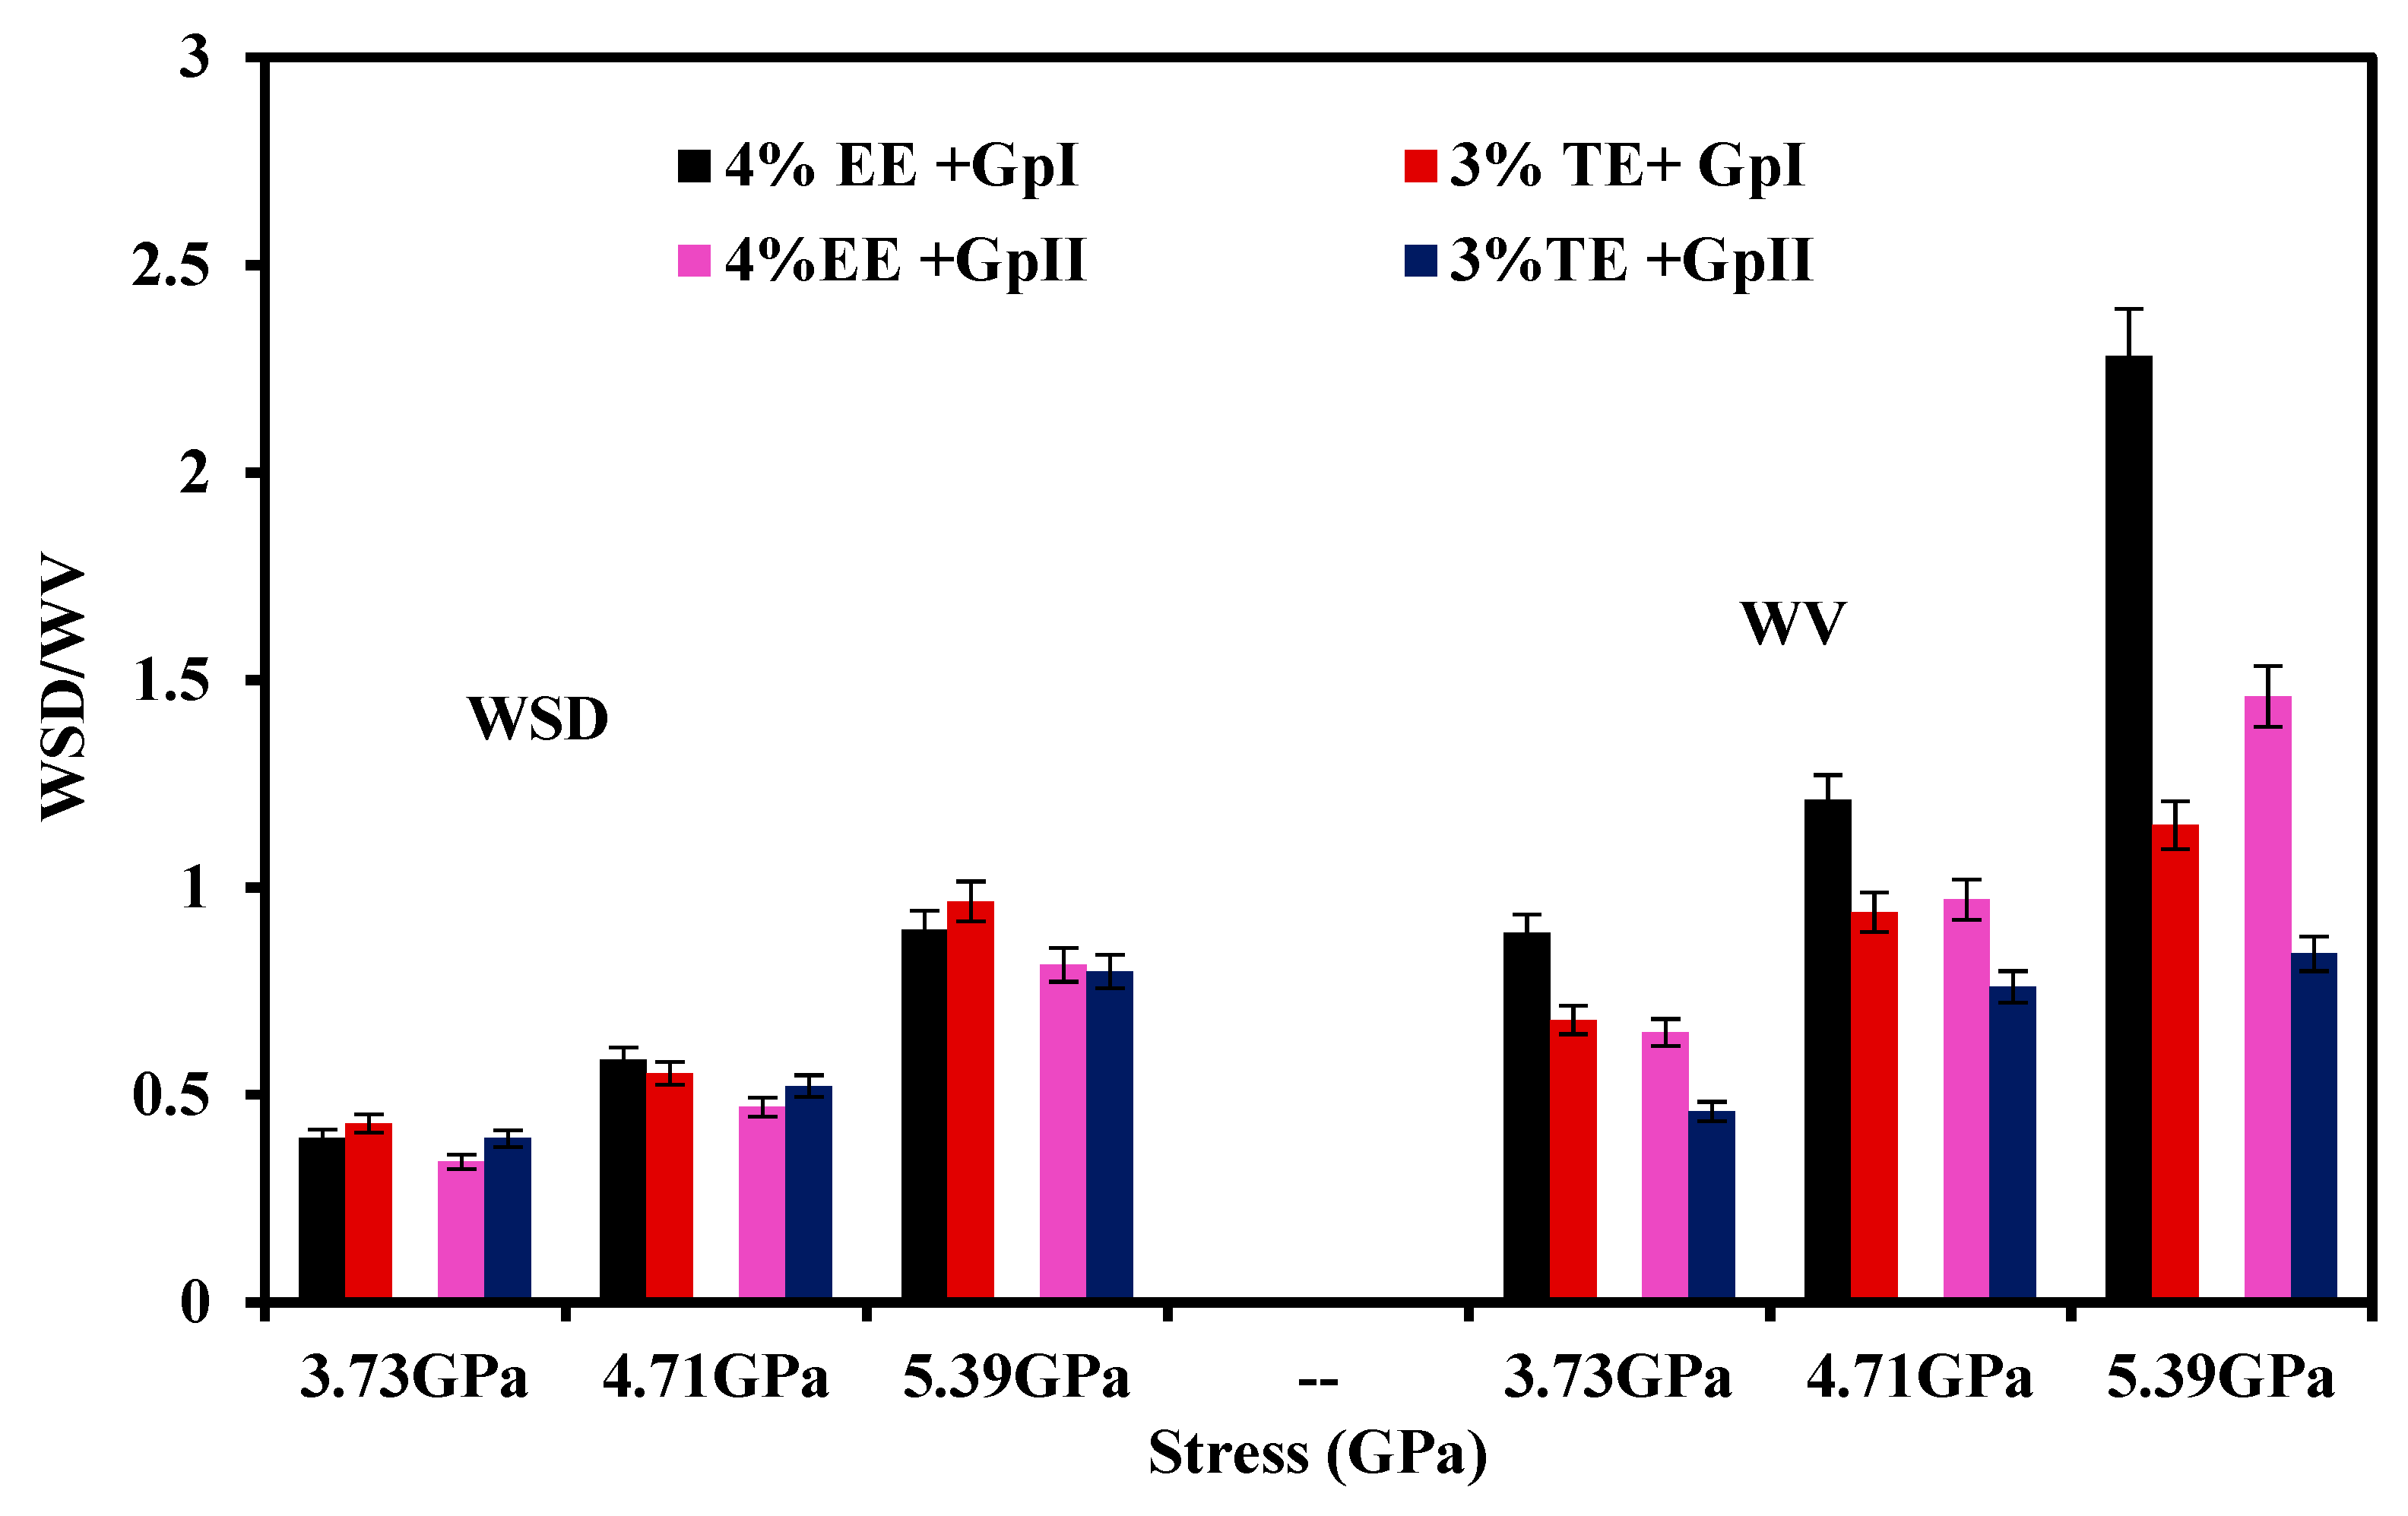
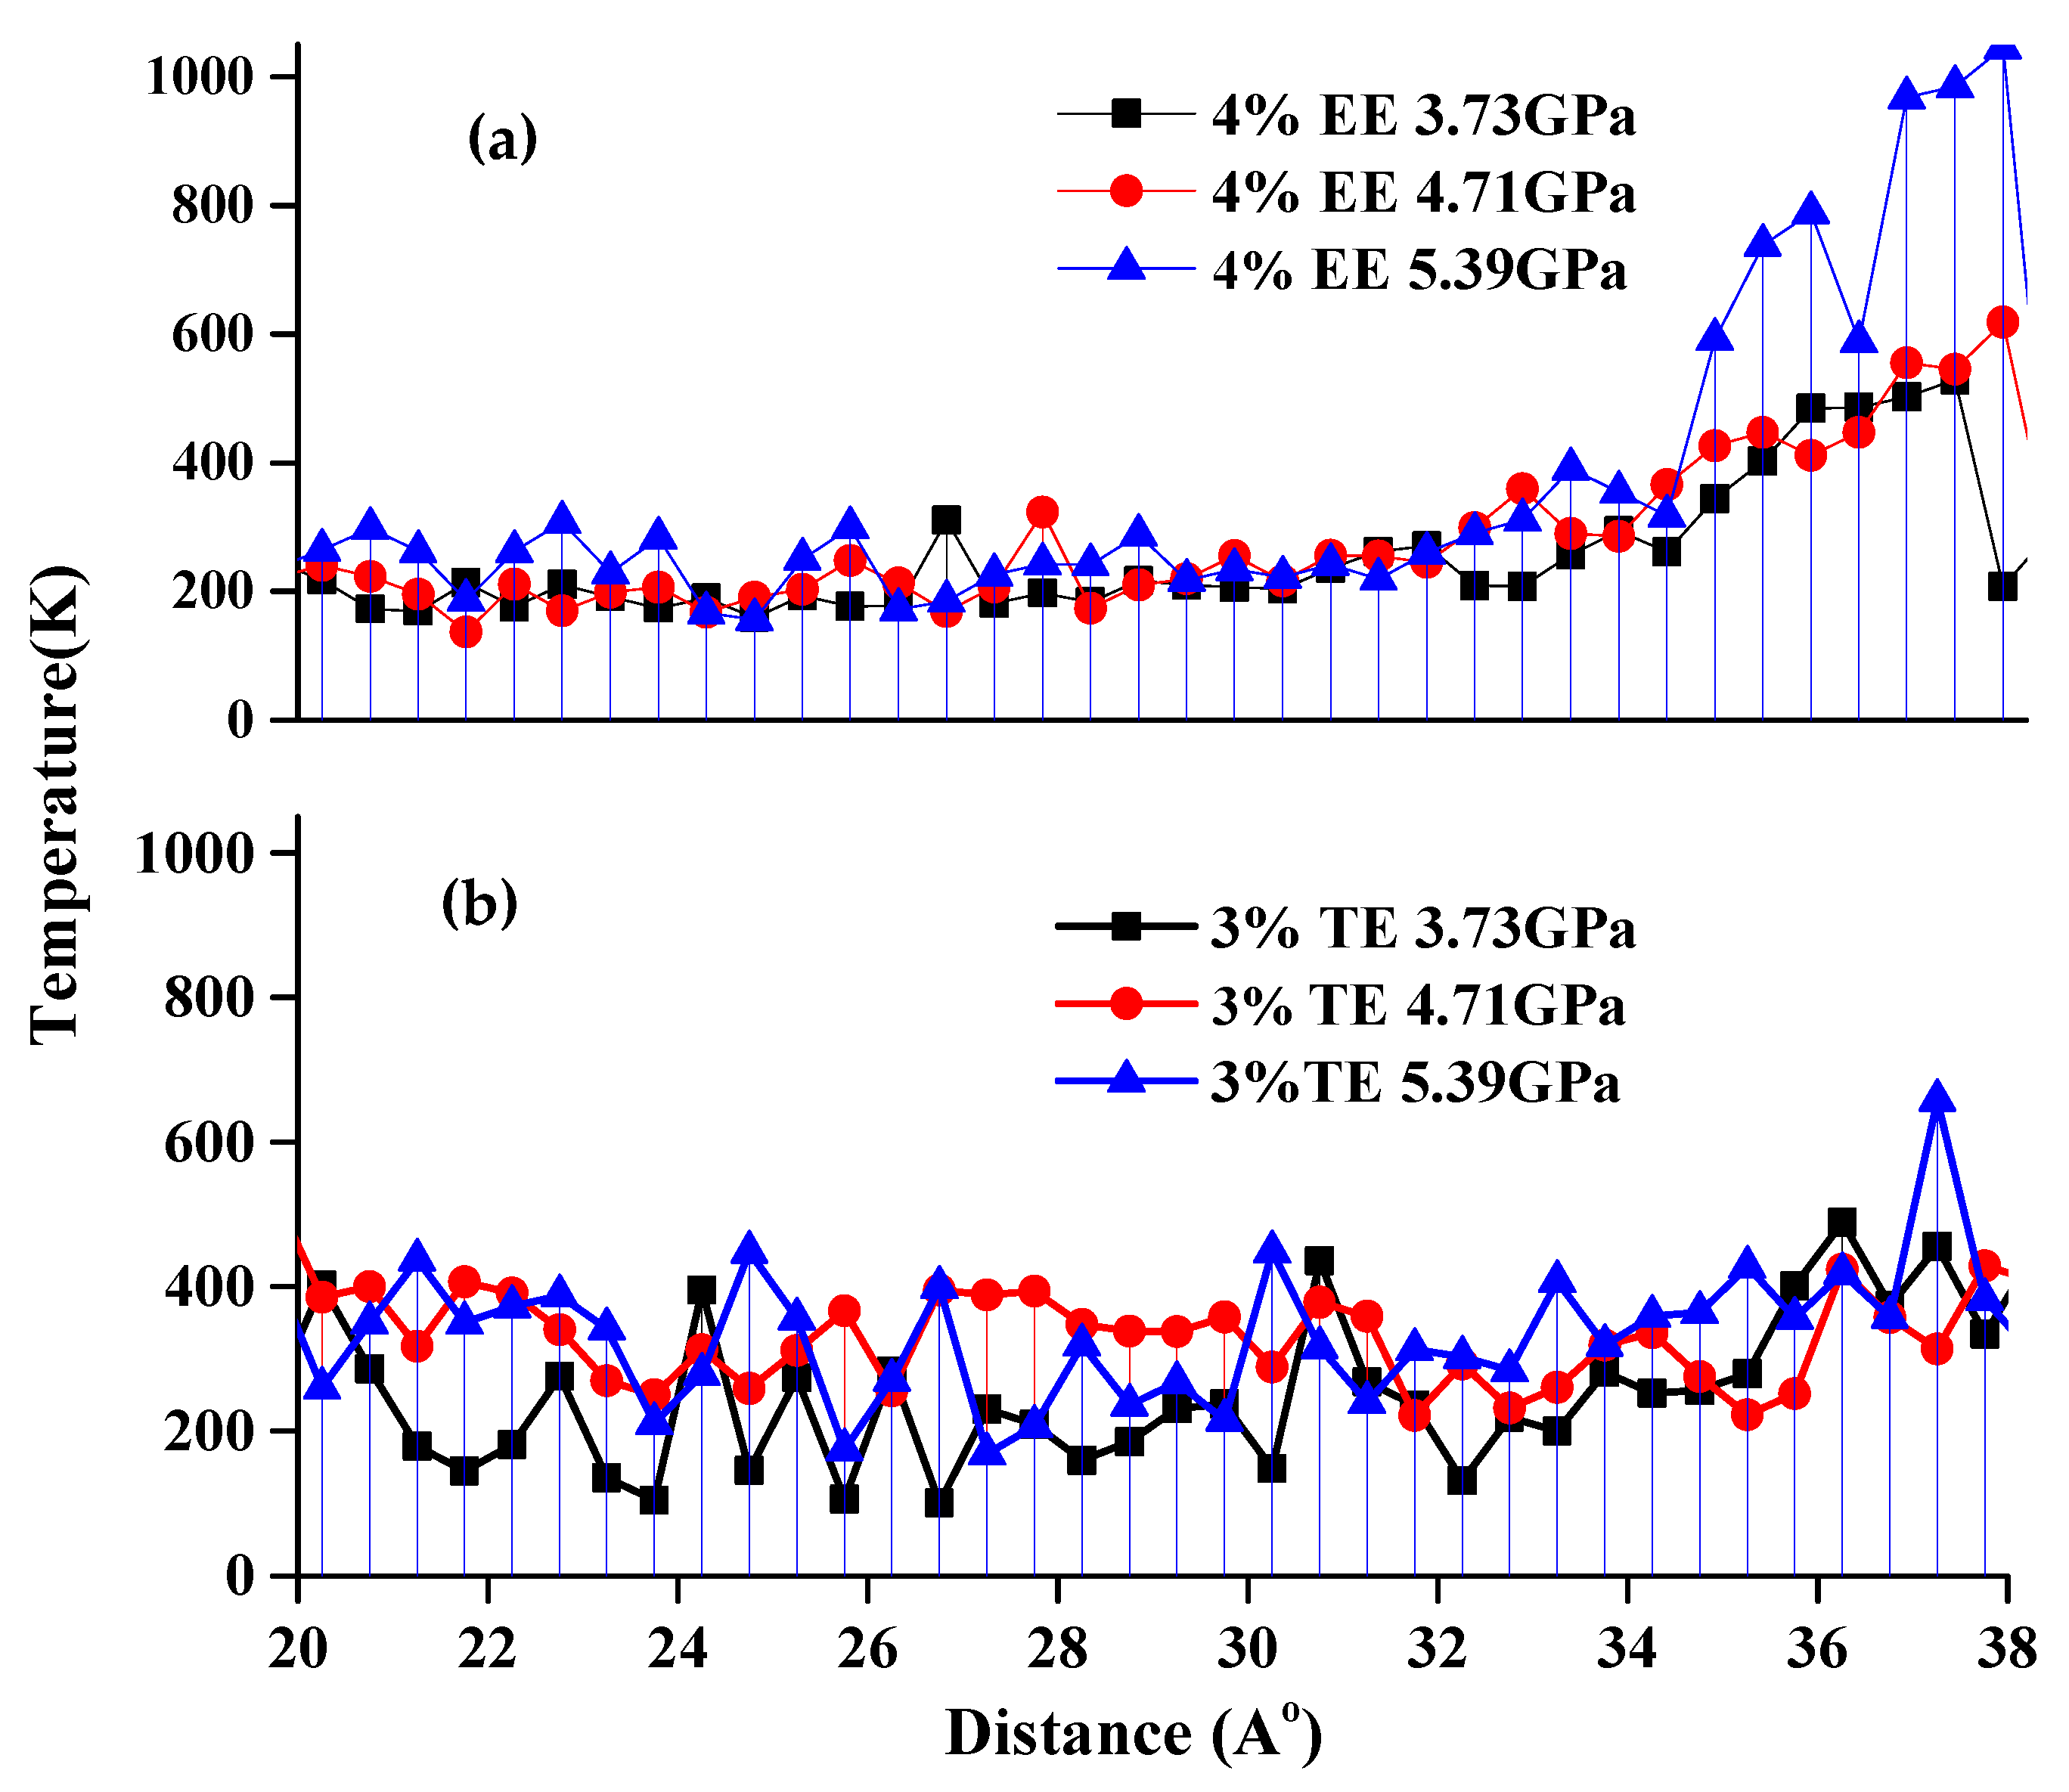
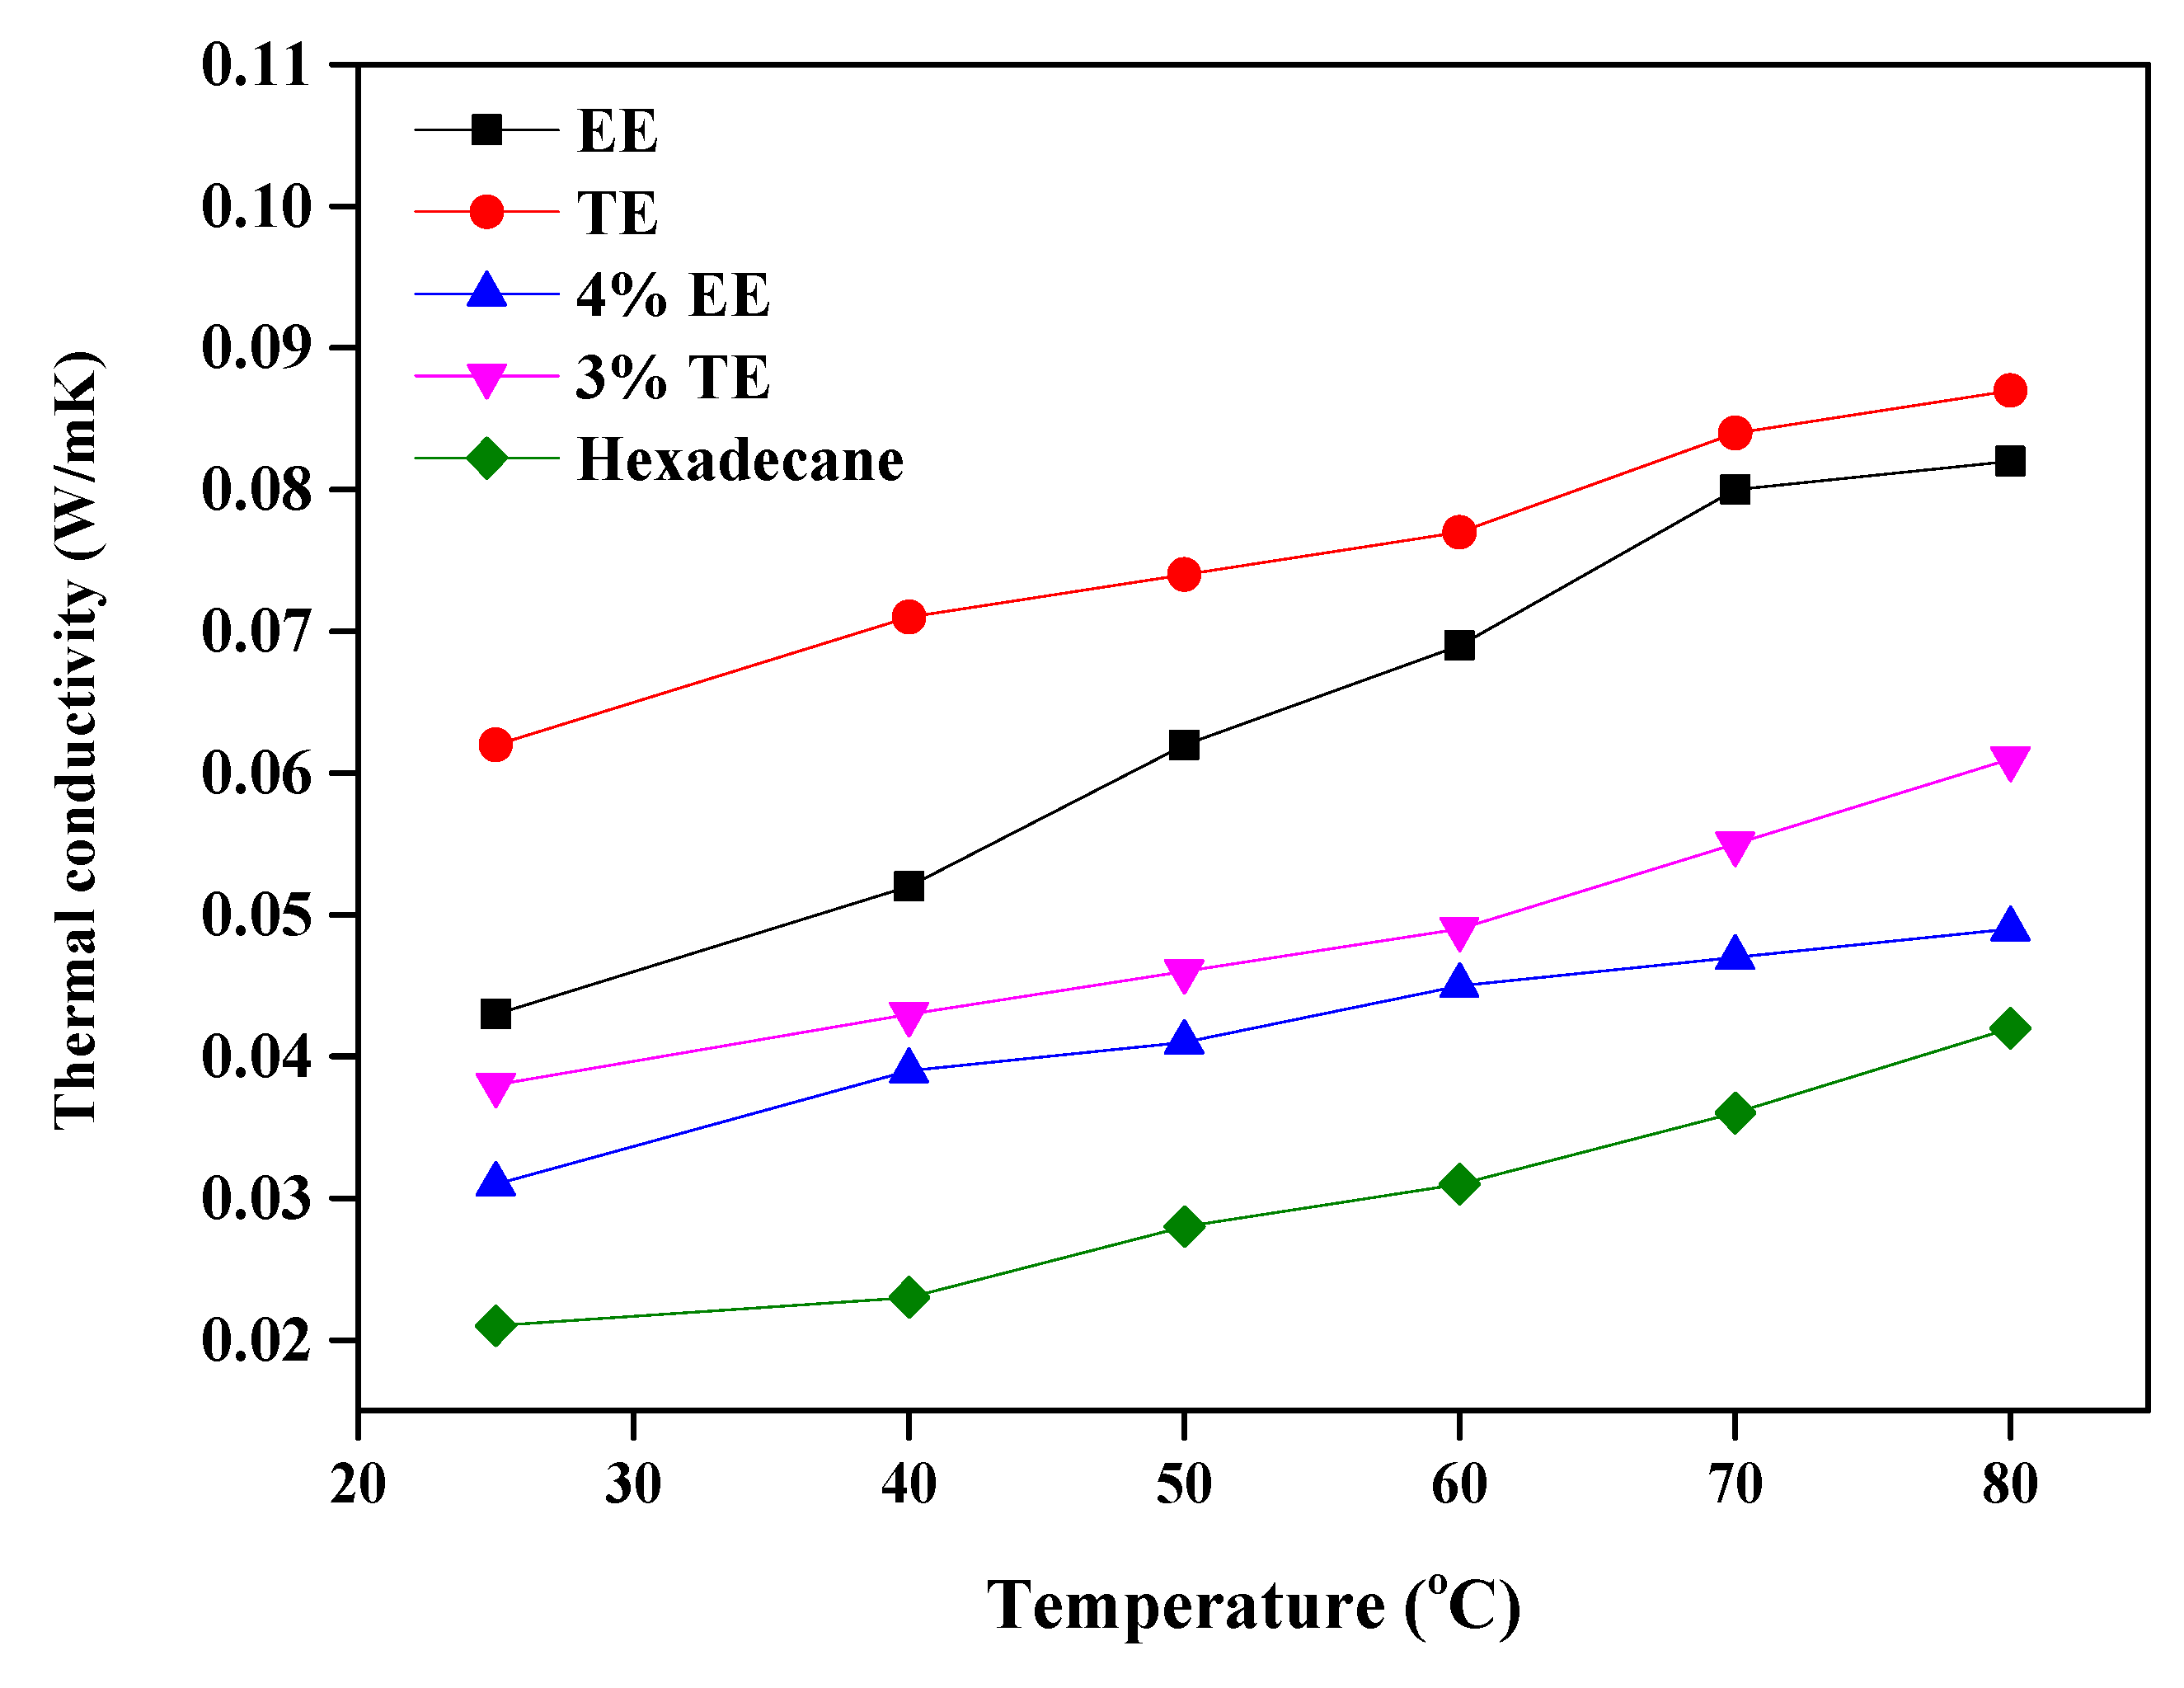
Tribological properties under varying stresses indicated a weakening of the non-bonding forces, accompanied by elevated temperatures, near the walls due to slip heating which caused an increase in friction and wear. Optimized TE blends, with their higher thermal conductivity, can distribute the heat within the film and displayed better tribological behavior than EE under all conditions of stress. TE also has potential value as an additive for booster dosing of commercial engine oil for improved tribological performance.
Further, our work also opens up a new gateway for future studies to understand how non-linearity in the dynamic behavior of fluids containing deliberately introduced imperfections such as heteroatoms in strained rings might relate to the interaction of these heteroatoms with defects at the substrate-lubricant interface [32].

Supplementary Materials

The following supporting information can be downloaded at: https://www.mdpi.com/article/10.3390/lubricants11030144/s1.

Author Contributions

Conceptualization, methodology, investigation, software, validation, writing—original draf N.S.; Investigation, data curation, formal analysis S.K.; Supervision, writing—review and editing, resources, project administration G.D.T.; Conceptualization, supervision, writing—review and editing, resources, formal analysis, project administration A.R. All authors have read and agreed to the published version of the manuscript.

Funding

This research received no external funding.

Institutional Review Board Statement

Not applicable.

Informed Consent Statement

Not applicable.

Data Availability Statement

Data is contained within the article or supplementary material.

Conflicts of Interest

The authors declare no conflict of interest.

References

  1. Sharma, N.; Bari, S.K.; Nagendramma, P.; Thakre, G.D.; Ray, A. 3 Tribological Investigations. Green Tribol. Emerg. Technol. Appl. 2021, 71. [Google Scholar]
  2. Suhane, A.; Sarviya, R.; Siddiqui, A.; Khaira, H. Optimization of wear performance of castor oil based lubricant using Taguchi technique. Mater Today Proc. 2017, 4, 2095–2104. [Google Scholar] [CrossRef]
  3. Nagendramma, P. Study of pentaerythritol tetraoleate ester as industrial gear oil. Lubr. Sci. 2011, 23, 355–362. [Google Scholar] [CrossRef]
  4. Aziz, N.A.M.; Robiah, Y.; Umer, R. Temperature effect on tribological properties of polyol ester-based environmentally adapted lubricant. Tribol. Int. 2016, 93, 43–49. [Google Scholar] [CrossRef]
  5. Erhan, S.Z.; Asadauskas, S. Lubricant base stocks from vegetable oils. Ind. Crop. Prod. 2000, 11, 277–282. [Google Scholar] [CrossRef]
  6. Farfán-Cabrera, L.I.; Gallardo-Hernández, E.A.; Vite-Torres, M.; Laguna-Camacho, J.R. Frictional behavior of a wet clutch using blends of automatic transmission fluid (ATF) and biolubricant (Jatropha oil) in a pin-on-disk tester. Tribol. Trans. 2015, 58, 941–946. [Google Scholar] [CrossRef]
  7. Fox, N.J.; Stachowiak, G.W. Vegetable oil-based lubricants: A review of oxidation. Tribol. Int. 2007, 40, 1035–1046. [Google Scholar] [CrossRef]
  8. Havet, L.; Blouet, J.; Valloire, F.R.; Brasseur, E.; Slomka, D. Tribological characteristics of some environmentally friendly lubricants. Wear 2011, 248, 140–146. [Google Scholar] [CrossRef]
  9. Habibullah, M.; Masjuki, H.H.; Kalam, M.A.; Gulzar, M.; Arslan, A.; Zahid, R. Tribological characteristics of Calophyllum inophyllum–based TMP (trimethylolpropane) ester as energy-saving and biodegradable lubricant. Tribol. Trans. 2015, 58, 1002–1011. [Google Scholar] [CrossRef]
  10. Karmakar, G.; Ghosh, P.; Sharma, B.K. Chemically modifying vegetable oils to prepare green lubricants. Lubricants 2017, 5, 44. [Google Scholar] [CrossRef] [Green Version]
  11. Shah, R.; Woydt, M.; Zhang, S. The economic and environmental significance of sustainable lubricants. Lubricants 2021, 9, 21. [Google Scholar] [CrossRef]
  12. Faes, J.; González, R.; Blanco, D.; Fernández-González, A.; Hernández-Battez, A.; Iglesias, P.; Viesca, J.L. Methyltrioctylammonium Octadecanoate as Lubricant Additive to Different Base Oils. Lubricants 2022, 10, 128. [Google Scholar] [CrossRef]
  13. Karmakar, G.; Dey, K.; Ghosh, P.; Sharma, B.K.; Erhan, S.Z. A short review on polymeric biomaterials as additives for lubricants. Polymers 2021, 13, 1333. [Google Scholar] [CrossRef] [PubMed]
  14. Cañellas, G.; Emeric, A.; Combarros, M.; Navarro, A.; Beltran, L.; Vilaseca, M.; Vives, J. Tribological Performance of Esters, Friction Modifier and Antiwear Additives for Electric Vehicle Applications. Lubricants 2023, 11, 109. [Google Scholar] [CrossRef]
  15. Liaocheng Ruijie Chemical Co., Ltd. Available online: http://www.made-in-china.com (accessed on 14 March 2023).
  16. Cook, B.A.; Brown, T.W. Ester Based Metal Working Lubricants. US Patent 4178260, 11 December 1979. [Google Scholar]
  17. Kawasaki, H. Biodegradable Lubricating Oil Composition. EP 1 707 617 A1, 2990107 (JP). 4 October 2006. [Google Scholar]
  18. Heikal, E.K.; Elmelawy, M.; Khalil, S.A.; Elbasuny, N. Manufacturing of environment friendly biolubricants from vegetable oils. Egypt. J. Pet. 2017, 26, 53–59. [Google Scholar] [CrossRef] [Green Version]
  19. Kamalakar, K.; Rajak, A.K.; Prasad, R.B.; Karuna, M.S. Rubber seed oil-based biolubricant base stocks: A potential source for hydraulic oils. Ind. Crop. Prod. 2013, 51, 249–257. [Google Scholar] [CrossRef]
  20. Maleque, M.A.; Masjuki, H.H.; Sapuan, S.M. Vegetable based biodegradable lubricating oil additives. Ind. Lubr. Tribol. 2003, 55, 137–143. [Google Scholar] [CrossRef]
  21. Panchal, T.M.; Patel, A.; Chauhan, D.; Thomas, M.; Patel, J.V. A methodological review on bio-lubricants from vegetable oil-based resources. Renew. Sustain. Energy Rev. 2017, 70, 65–70. [Google Scholar] [CrossRef]
  22. Mobarak, H.M.; Mohamad, E.N.; Masjuki, H.H.; Kalam, M.A.; Al Mahmud, K.A.; Habibullah, M.; Ashraful, A.M. The prospects of bio lubricants as alternatives in automotive applications. Renew. Sustain. Energy Rev. 2014, 33, 34–43. [Google Scholar] [CrossRef]
  23. Zulkifli, N.W.; Azman, S.S.; Kalam, M.A.; Masjuki, H.H.; Yunus, R.; Gulzar, M. Lubricity of bio-based lubricant derived from different chemically modified fatty acid methyl ester. Tribol. Int. 2016, 93, 555–562. [Google Scholar] [CrossRef]
  24. Jayadas, N.; Nair, K. Coconut oil as base oil for industrial lubricants-evaluation and modification of thermal, oxidative and low temperature properties. Tribol. Int. 2006, 39, 873–878. [Google Scholar] [CrossRef]
  25. Ting, C.C.; Chen, C.C. Viscosity and working efficiency analysis of soybean oil-based bio-lubricants. Measurement 2011, 44, 1337–1341. [Google Scholar] [CrossRef]
  26. Hamid, H.A.; Yunus, R.; Rashid, U.; Choong, T.S.; Ali, S.; Syam, A.M. Synthesis of high oleic palm oil-based trimethylolpropane esters in a vacuum operated pulsed loop reactor. Fuel 2016, 166, 560–566. [Google Scholar] [CrossRef]
  27. Kodali, D.R. High performance ester lubricants from natural oils. Ind. Lubr. Tribol. 2002, 54, 165–170. [Google Scholar] [CrossRef]
  28. Salih, N.; Jumat, S.; Emad. Y.; The physicochemical and tribological properties of oleic acid-based trimester biolubricants. Ind. Crop. Prod. 2011, 34, 1089–1096. [Google Scholar] [CrossRef]
  29. Sharma, N.; Thakre, G.D.; Ray, A. Hitherto unexplored three-membered heterocyclic rings favorably alter tribological properties of fatty acid linear esters. Tribol. Trans. 2021, 64, 996–1021. [Google Scholar] [CrossRef]
  30. Sharma, N.; Kumar, S.; Thakre, G.D.; Ray, A. Novel synthetic ‘Triangle Ester’ Lubricants: Useful Correlations for Wetting and Tribological Phenomena over Common Engineering Substrates. Tribol. Trans. 2022, 66, 1–18. [Google Scholar] [CrossRef]
  31. Liu, Y.; Li, Z.; Li, G.; Tang, L. Friction and wear behavior of Ni-based alloy coatings with different amount of WC–TiC ceramic particles. J. Mater. Sci. 2023, 58, 1116–1126. [Google Scholar] [CrossRef]
  32. Bucolo, M.; Buscarino, A.; Famoso, C.; Fortuna, L.; Gagliano, S. Imperfections in integrated devices allow the emergence of unexpected strange attractors in electronic circuits. IEEE Access 2021, 9, 29573–29583. [Google Scholar] [CrossRef]
Figure 1. Representative model system of confined fluid between FeO (100) surfaces.
Lubricants 11 00144 g001
Figure 2. COF obtained with the prepared blends.
Lubricants 11 00144 g002
Figure 3. Wear obtained with Gp I base oil.
Lubricants 11 00144 g003
Figure 4. Wear obtained with Gp II base oil.
Lubricants 11 00144 g004
Figure 5. NMR of blank mineral oil.
Lubricants 11 00144 g005
Figure 6. (a) Hexadecane at different time duration before and after dynamics. (b) 4%EE blend at different time duration before and after dynamics. (c) 5%EE blend at different time duration before and after dynamics. (d) 3%TE blend at different time duration before and after dynamics. (e) 4%TE blend at different time duration before and after dynamics.
Lubricants 11 00144 g006aLubricants 11 00144 g006b
Figure 7. Relative concentration distribution of fluid molecules.
Lubricants 11 00144 g007
Figure 8. Adsorption and Intermolecular energy of blends.
Lubricants 11 00144 g008
Figure 9. Relative components of energy at the end of the simulation.
Lubricants 11 00144 g009
Figure 10. Self-diffusion coefficient of EE and TE blends.
Lubricants 11 00144 g010
Figure 11. COF of optimized blends concentration at different stresses.
Lubricants 11 00144 g011
Figure 12. WSD/WV of optimized blends concentration at different stresses.
Lubricants 11 00144 g012
Figure 13. (a) Non-bonded energy contribution. (b) Non-bonded energy contribution of EE. (c) Non-bonded energy contribution of TE. (d) Self-diffusion coefficient of EE and TE under different stresses.
Lubricants 11 00144 g013
Figure 14. Temperature profile of (a) EE and (b) TE under applied stresses.
Lubricants 11 00144 g014
Figure 15. Thermal Conductivity of blends and pure lubricants.
Lubricants 11 00144 g015
Figure 16. FTIR Spectra of blends of commercial engine oil with triangle esters.
Lubricants 11 00144 g016
Figure 17. Friction plot of optimized blends in CEO.
Lubricants 11 00144 g017
Figure 18. Wear attributes of CEO and its blends.
Lubricants 11 00144 g018
Figure 19. SEM/EDAX profiles of the used balls lubricated with CEO and its blends.
Lubricants 11 00144 g019
Table 1. Simulation model details of prepared blends.
Blend Composition
in Hexadecane
Density
(g/cm3)
Number of Molecules of Hexadecane for 1 Molecule of EE/TECell Size
(Å × Å × Å)
1% EE0.85825048.0 × 48.0 × 48.0
2% EE0.85912037.7 × 37.7 × 37.7
3% EE0.8628033.0 × 33.0 × 33.0
4% EE0.8696030.0 × 30.0 × 30.0
5% EE0.8705028.3 × 28.3 × 28.3
1% TE0.87025047.8 × 47.8 × 47.8
2% TE0.87312037.5 × 37.5 × 37.5
3% TE0.8788032.8 × 32.8 × 32.8
4% TE0.8796029.9 × 29.9 × 29.9
5% TE0.8815028.2 × 28.2 × 28.2
Table 2. Viscosity of TE blends in Gp I and Gp II base oil.
BlendKinematic Viscosity (cSt)Viscosity Index (VI)
40 °C100 °C
1% TE + Gp I32.845.72115.05
2% TE + Gp I34.655.73104.84
3% TE + Gp I39.696.1197.95
4% TE + Gp I38.825.7789.67
5% TE + Gp I37.795.9880.67
1% TE + Gp II32.345.84124.78
2% TE + Gp II34.485.23117.08
3% TE + Gp II36.635.98106.76
4% TE + Gp II31.144.92106.12
5% TE + Gp II30.315.16104.44
Table 3. Viscosity of EE blends in Gp I and Gp II base oil.
BlendKinematic Viscosity (cSt)Viscosity Index (VI)
40 °C100 °C
Gp I30.425.52109.61
1% EE + Gp I34.395.88105.79
2% EE + Gp I34.035.62104.63
3% EE + Gp I34.095.62102.25
4% EE + Gp I34.225.6895.54
5% EE + Gp I31.625.66111.23
Gp II30.475.36119.40
1% EE + Gp II30.615.27114.14
2% EE + Gp II30.725.38104.76
3% EE + Gp II30.885.21102.87
4% EE + Gp II31.025.13102.85
5% EE + Gp II30.305.37119.61
Table 4. Bond lengths of heteroatomic moieties in pure and blended states.
Change in
C-O Bond Length (Å)
Change in
C-S Bond Length (Å)
Pure EE/TE1.43 to 1.471.81 to 1.83
Blend of 4% EE/3%TE1.81 to 2.531.43 to 1.59
Disclaimer/Publisher’s Note: The statements, opinions and data contained in all publications are solely those of the individual author(s) and contributor(s) and not of MDPI and/or the editor(s). MDPI and/or the editor(s) disclaim responsibility for any injury to people or property resulting from any ideas, methods, instructions or products referred to in the content.

