Article

Effect of Characteristic Parameters and Distribution of Friction Pair Surface Texture on Lubrication Properties

School of Mechanical and Precision Instrument Engineering, Xi’an University of Technology, Xi’an 710048, China
*
Author to whom correspondence should be addressed.
Lubricants 2023, 11(3), 139; https://doi.org/10.3390/lubricants11030139
Submission received: 28 February 2023 / Revised: 10 March 2023 / Accepted: 13 March 2023 / Published: 14 March 2023

Abstract

:
Based on the basic mechanism and bionics principle that texture affects the dynamic pressure effect of lubricating medium, a V-shaped texture that converges along the sliding direction is designed. Through numerical simulation, the optimal geometric parameters and distribution of the V-shaped and textures are obtained. A textured surface with various texture features is prepared using a nanosecond ultraviolet laser with bearing steel as substrate. Tribological experiments with friction and wear tester are performed to investigate the effect of characteristic parameters and distribution of surface texture on the lubrication performance and the lubrication properties are compared and analyzed with that of circular texture. Hence, this investigation provides a research direction to improve the lubrication performance between frictional pairs under fluid lubrication condition to reduce the frictional wear of mechanical systems. The results show that under the conditions of optimal parameters, due to the effect of convergence and extrusion on the flow of lubrication medium, the V-shape texture is better than the circular texture in improving the lubrication performance. The optimal characteristic parameters of V-shape texture are: 60° for the angle between the two wings, 0.53 for shape parameter, 25.9% for area ratio, 13 μm depth, 60% texture area coverage ratio, and the inlet of flow field of the texture distribution position.

1. Introduction

Friction is prevalent in the movement of mechanical mechanisms, having a great impact on the utilization of energy [1,2]. According to a survey, 30% of energy consumption in industrialized countries is caused by mechanical friction losses [3,4], and serious wear and tear greatly reduces the service life of equipment, including lubrication failure [5,6]. Moreover, excessive wear [7,8] is the main cause of important safety accidents in machinery and equipment. With the development of modern processing technology, the processed workpiece can be generated according to different production requirements with specific characteristics and morphological features with regular shapes [9,10], which can improve the tribological properties or other properties of the friction subsurface, while a certain regular and directional distribution of the surface texture can not only increase the storage of lubricating fluid [11,12], but also improve the quality of lubricating oil film generation, thereby increasing its load-bearing capacity, in turn improving the lubricating effect and enhancing the anti-wear performance [13,14]. The surface texture formed by the process can accommodate the abrasive particles generated during the operation of the machinery and reduce the wear of the workpiece [15,16]. Surface texturing technology has been applied to mechanical components, such as mechanical seals, engine cylinders, and sliding bearings [17,18]. However, due to the significant influence of texture shape and geometrical parameters on the tribological performance of friction subsets, the system performance can be adversely affected if the surface texture is improperly designed instead [19,20]. Therefore, one of the important research directions in recent years has been to study the influence law of the shape, geometric parameters, and distribution of the texture on the friction reduction effect, so as to optimize the characteristic parameters of the surface texture [21,22].
Elaborate structures with excellent tribological properties [23] have been developed by organisms during the evolution of the race of things and have become a source of innovative designs in bionic tribology [24,25]. Based on this bionic idea, the hydrophobic microstructure on the surface of a lotus leaf [26] and the V-shaped groove structure on the outer surface of shark skin [27] were discovered and borrowed, which can greatly reduce the resistance generated by seawater to shark swimming. For the study of such bionic structures, hydrophobic properties and excellent tribological properties of machined surfaces can be achieved [28,29]. Long et al. [30] studied six different leaves and concluded that the leaf vein bionic texture exhibited excellent friction and wear reduction properties in the absence of lubrication. Tu [31] improved the texture shape by the optimization algorithm to improve the bearing capacity, and the optimal shape after optimization for different operating conditions is a “V” shaped texture. Abdel-Aal [32] systematically summarized the relationship between the functional characteristics possessed by the surfaces of different terrestrial vertebrates and their tribological properties. Pattnayak et al. [33] applied a combination of biomimetic fish texture and micro-pits to a plain bearing and found that the combination of the two could significantly improve the static and dynamic characteristics of the plain bearing. Shen and Khonsari [34] used a quadratic programming numerical optimization algorithm to compare the shape of the texture under unidirectional and bidirectional sliding conditions with a regular shaped texture, finding that the optimal shape under unidirectional sliding is a “V”-like texture with a flat front end, while bidirectional sliding consists of a trapezoidal shape pair, and the improvement of lubrication performance is attributed to the high pressure generated at the front end of the texture by the convergence effect. Shen et al. [35] systematically investigated the effect of herringbone texture parameters on the tribological performance and proposed a V-shaped arrangement to significantly improve the lubrication performance of the texture. Sharma et al. [36] conducted a comparative study of V-shaped projecting bearing, tough fossil deformed bearing and non-deformed bearing by numerical simulation analysis to analyze the effect of considering eccentricity ratio, texture distribution, texture height and texture depth on two types of texture bearings. The simulation results show that the projecting texture bearing has the largest load carrying capacity and the largest friction coefficient in the full texture region and the front half texture region compared with the non-texture bearing, and that the projecting and tough fossil texture bearings have the largest performance enhancement rates in the full texture region and the rear half region at eccentricity ratios of 0.4 and 0.8 for the texture height and texture depth, respectively. In recent years, applied research based on bionics [37] has been demonstrated in various fields, and significant breakthroughs have been made in mechanical seals and drag reduction technologies in aerospace [38,39], among others.
At present, most of the research on V-shaped texture uses a numerical optimization algorithm to derive the V-shaped surface texture and numerical simulation to study its unidirectional sliding lubrication characteristics, but there is no detailed and systematic analysis of the characteristic parameters of V-shaped texture, shape parameters, distribution, density of texture surface, and surface coverage on the lubrication performance. Theoretical and experimental analyses have not been combined. In this paper, inspired by the drag reduction effect of fish scales on the outer skin of different species of fish, a V-shaped texture is designed to enhance the hydrodynamic effect of the texture by changing the structural parameters to regulate the convergence interval along the flow direction of the lubricating fluid, and the influence of the surface density, geometric parameters, distribution, and surface coverage of the V-shaped texture on the lubrication performance is studied through numerical simulation and friction wear (pin-to-disc) tests. The theoretical analysis of the V-shaped texture systematically provides a theoretical basis for the rational design of the surface micro-texture and the influence of the distribution characteristics of the texture on the lubrication characteristics, in addition to a research direction to improve the lubrication performance between the friction pairs in the fluid lubrication state to reduce the frictional wear of the mechanical system.

2. Simulation Analysis of Theoretical Mode Shapes and Calculation Methods

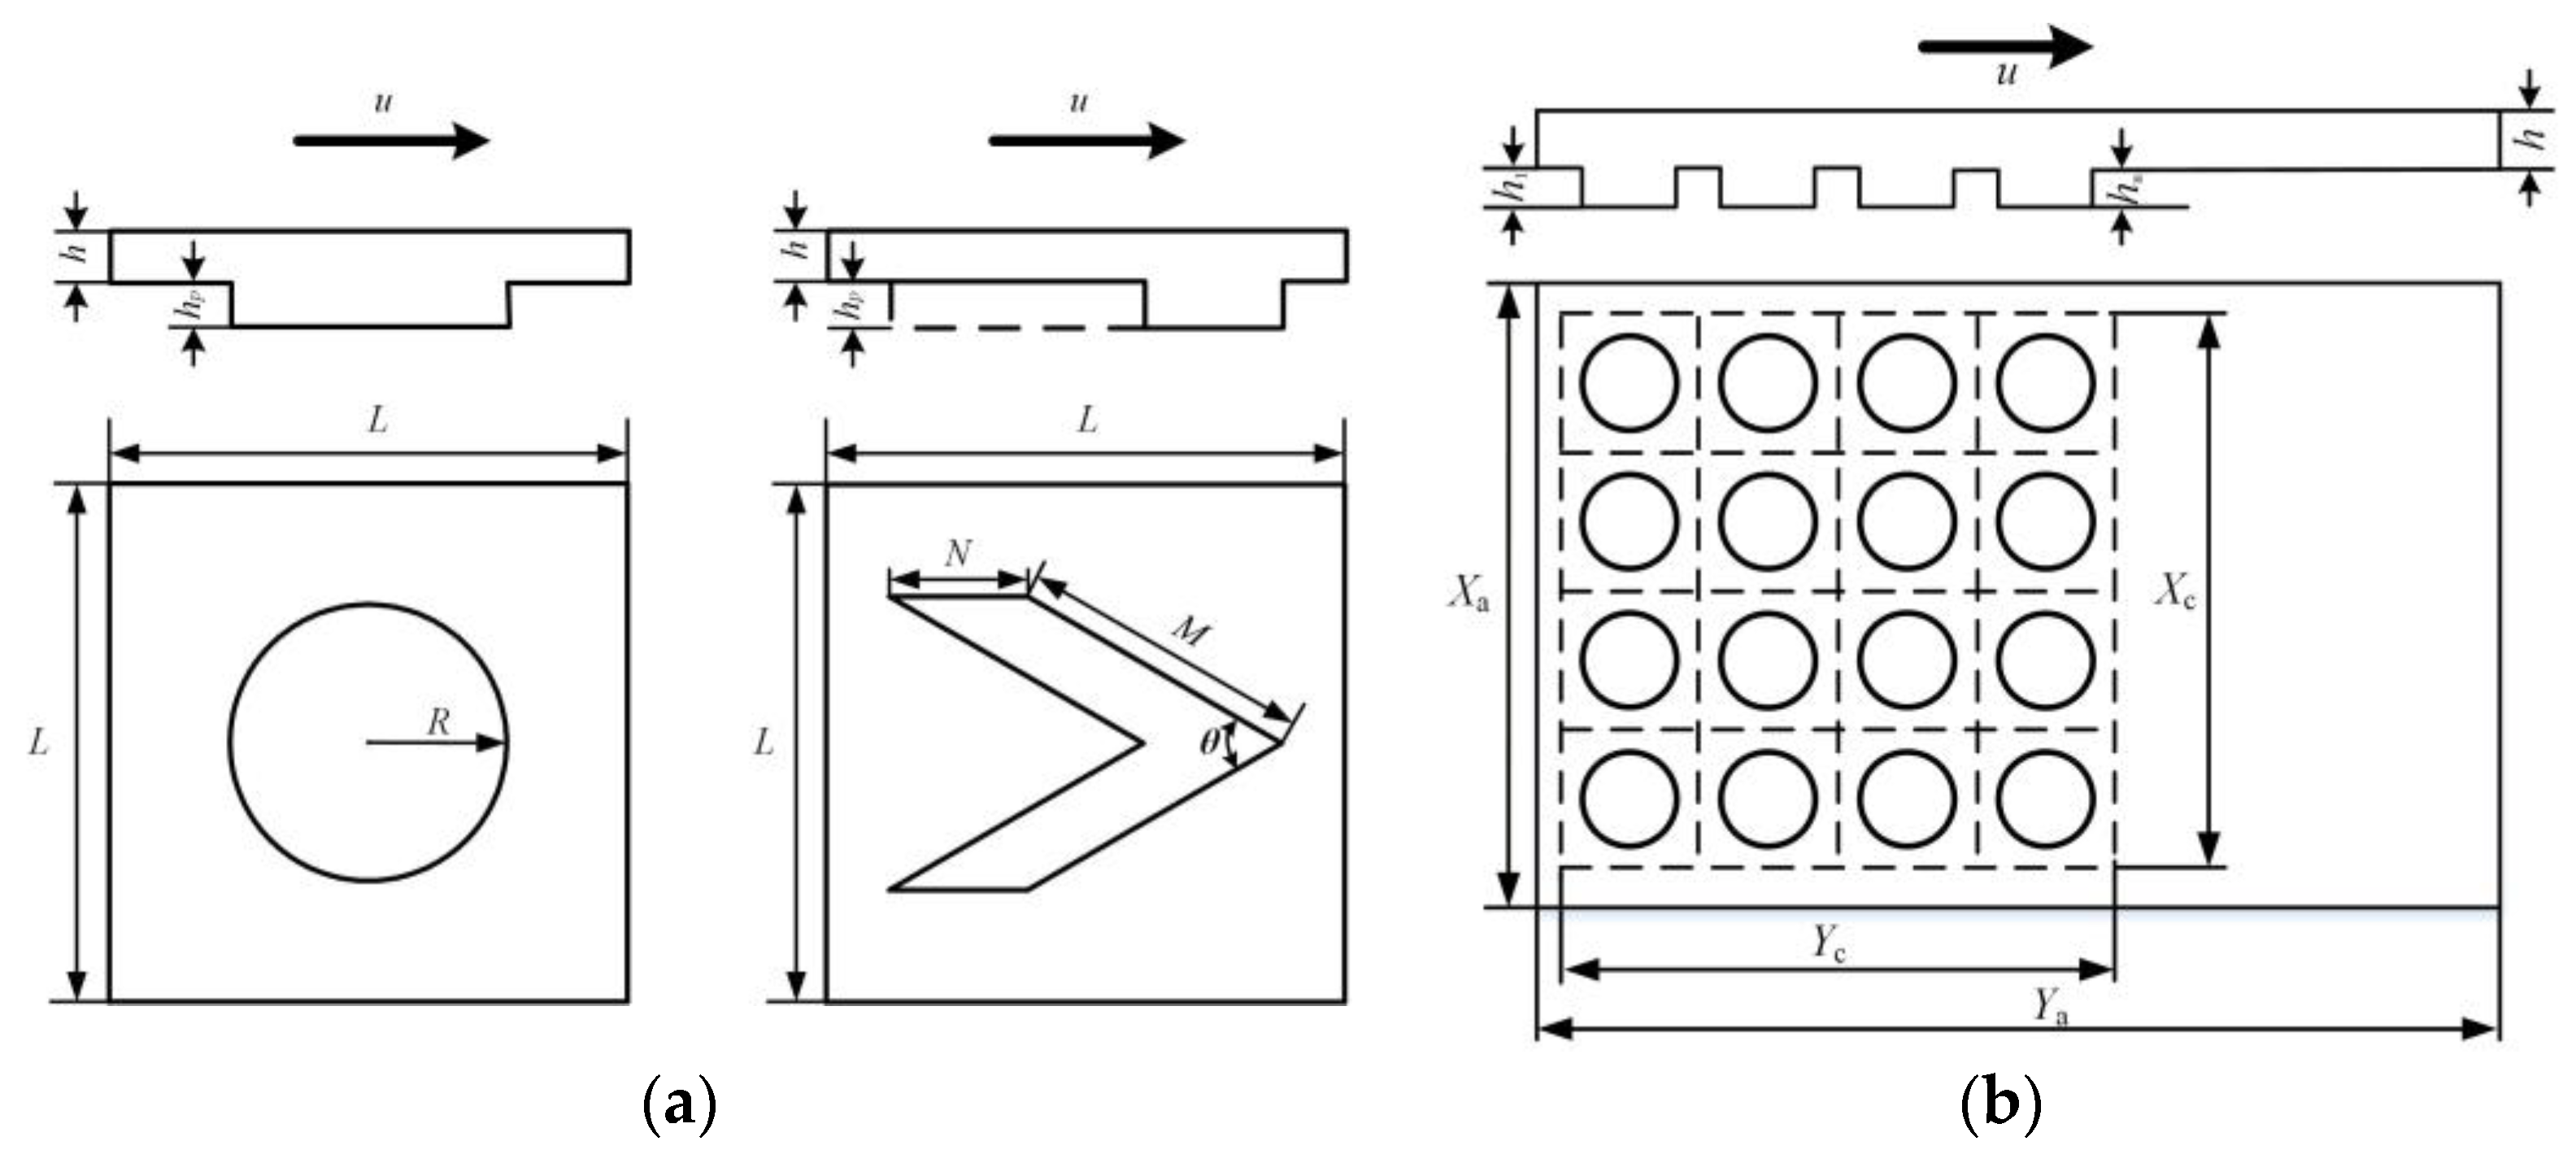
2.1. Calculating the Mode Shape

The optimization of the texture characteristics is carried out by using a single V-shaped and circular micro-texture shown in Figure 1a. The texture parameters are optimal in that the texture is an ordered array with regular distribution, so the flow field entrance and exit walls perpendicular to the sliding direction are set as periodic boundaries, and the two walls parallel to the sliding direction are set as symmetric boundaries. The surface texture mode shape shown in Figure 1b is used to study the overall distribution characteristics of the texture and the law of surface coverage affecting the lubrication performance, and the entrance/exit boundary perpendicular to the sliding direction is set as the pressure inlet/outlet boundary in the calculation.
As shown in Figure 1a, the parameters of the texture mode shape are: L is the side length of the square calculation cell, h is the thickness of the lubricant film in the characteristic region of no texture between the two friction subsets, hp is the characteristic depth of the texture, u is the velocity of the relative motion between the two friction subsets, R is the radius of the circular texture, D is the diameter of the circular texture, M and N are the side length and width of the V-shaped texture, respectively, while the parameter α is introduced and defined as the ratio of the V The ratio of the width N of the V-shaped texture to the side length M, and θ is the angle between the two wings of the V-shaped texture, where the circular and V-shaped texture area rates Sp are as follows:
s p = π R 2 L 2
s p = M N sin θ 2 L 2
As shown in Figure 1b, the local texture basin mode shape parameters are as follows: Xa, Yb and Xt, Yt are the calculated basin and surface texture lengths along the x and y directions, respectively, h and hi are the thickness of the lubricant film in the untextured region between the two friction subsets and the texture depth at different distribution locations along the x direction, respectively (i = 1, 2, 3, ..., n), u is the relative motion speed between the two friction pairs. The area of the texture area is At = Xt − Yt, and the area of the whole basin is Aa = Xa − Ya, so the coverage of texture Ar = At/Aa.

2.2. Mathematical Mode Shapes

In this paper, computational fluid dynamics (CFD) software is used to solve the N-S equation, and lubricant is used as the lubricator. Since the lubricant film produces cavitation, the cavitation effect is considered in the calculation process, and the cavitation mode shape considers the lubricating medium as a fluid mixed with two phases (gas phase and liquid phase). Thus, the continuity equation and momentum equation of the mixed lubricating fluid can be written as:
t ( ρ m ) + ( ρ m v m ) = 0
t ( ρ m v m ) + ( ρ m v m v m ) = p + [ μ m ( v m + v m T ) ] + ρ m g
The mixing density of the lubricating fluid is:
ρ m = α v ρ v + ( 1 α v ) ρ l
t ( α v ρ v ) + ( α v ρ v v m ) = R e R c
where αv is the volume fraction of the gas phase in the mixed lubricating fluid; p is the pressure of the lubricating film; vm is the velocity of motion of the mixed lubricating fluid; μm is the dynamic viscosity of the mixed lubricating fluid; ρl is the density of the liquid phase lubricating fluid; and ρv is the density of the gas phase lubricating fluid.
The cavitation effect resulting from the abrupt change of the flow field gap due to microtexture is described by the Schnerr–Sauer cavitation mode shape, and the cavitation pressure is the saturated vapor pressure of the lubricating fluid pc = 3540 Pa. The equations of the source phase Re and Rc are:
R e = ρ v ρ l ρ m α ( 1 α ) 3 R B 2 3 p c p ρ l
For pc > p,
R c = ρ v ρ l ρ m α ( 1 α ) 3 R B 2 3 p p c ρ l
For pc < p, the bubble radius RB is determined by the following equation:
R B = ( α 1 α 3 4 π 1 n 0 ) 1 3
where n0 is the bubble number density constant, and the default value of n0 = 1013 is used in the calculation.

2.3. Boundary Conditions and Solution-Related Notes

According to the boundary lubrication conditions analyzed by the numerical simulation of Wang et al. [40]. Fluent software is used for calculation, the upper wall surface is set as the moving wall surface, the speed is set to 1 m/s, the oil film thickness is h = 10 μm in the non-texture area between the two frictional pairs, the lubricating medium parameters are set to: kinematic viscosity 0.046 cSt, density 833.3 kg/m3, mixture multiphase flow mold, and Schnerr–Sauer cavitation mold are selected to predict the cavitation phenomenon caused by texture characteristics, and the cavitation pressure is set to 3540 Pa. The pressure-velocity coupling calculation method is chosen as Simple discrete algorithm, and the first-order windward format is chosen as the differential format.

3. Sample Preparation and Tribological Tests

Specimens with different distribution characteristics and shapes were prepared on metal surfaces by nanosecond laser processing. A pin-to-disk test was performed on the prepared specimens using a friction and wear tester to investigate the influence of the texture characteristics and distribution on the friction and lubrication properties.

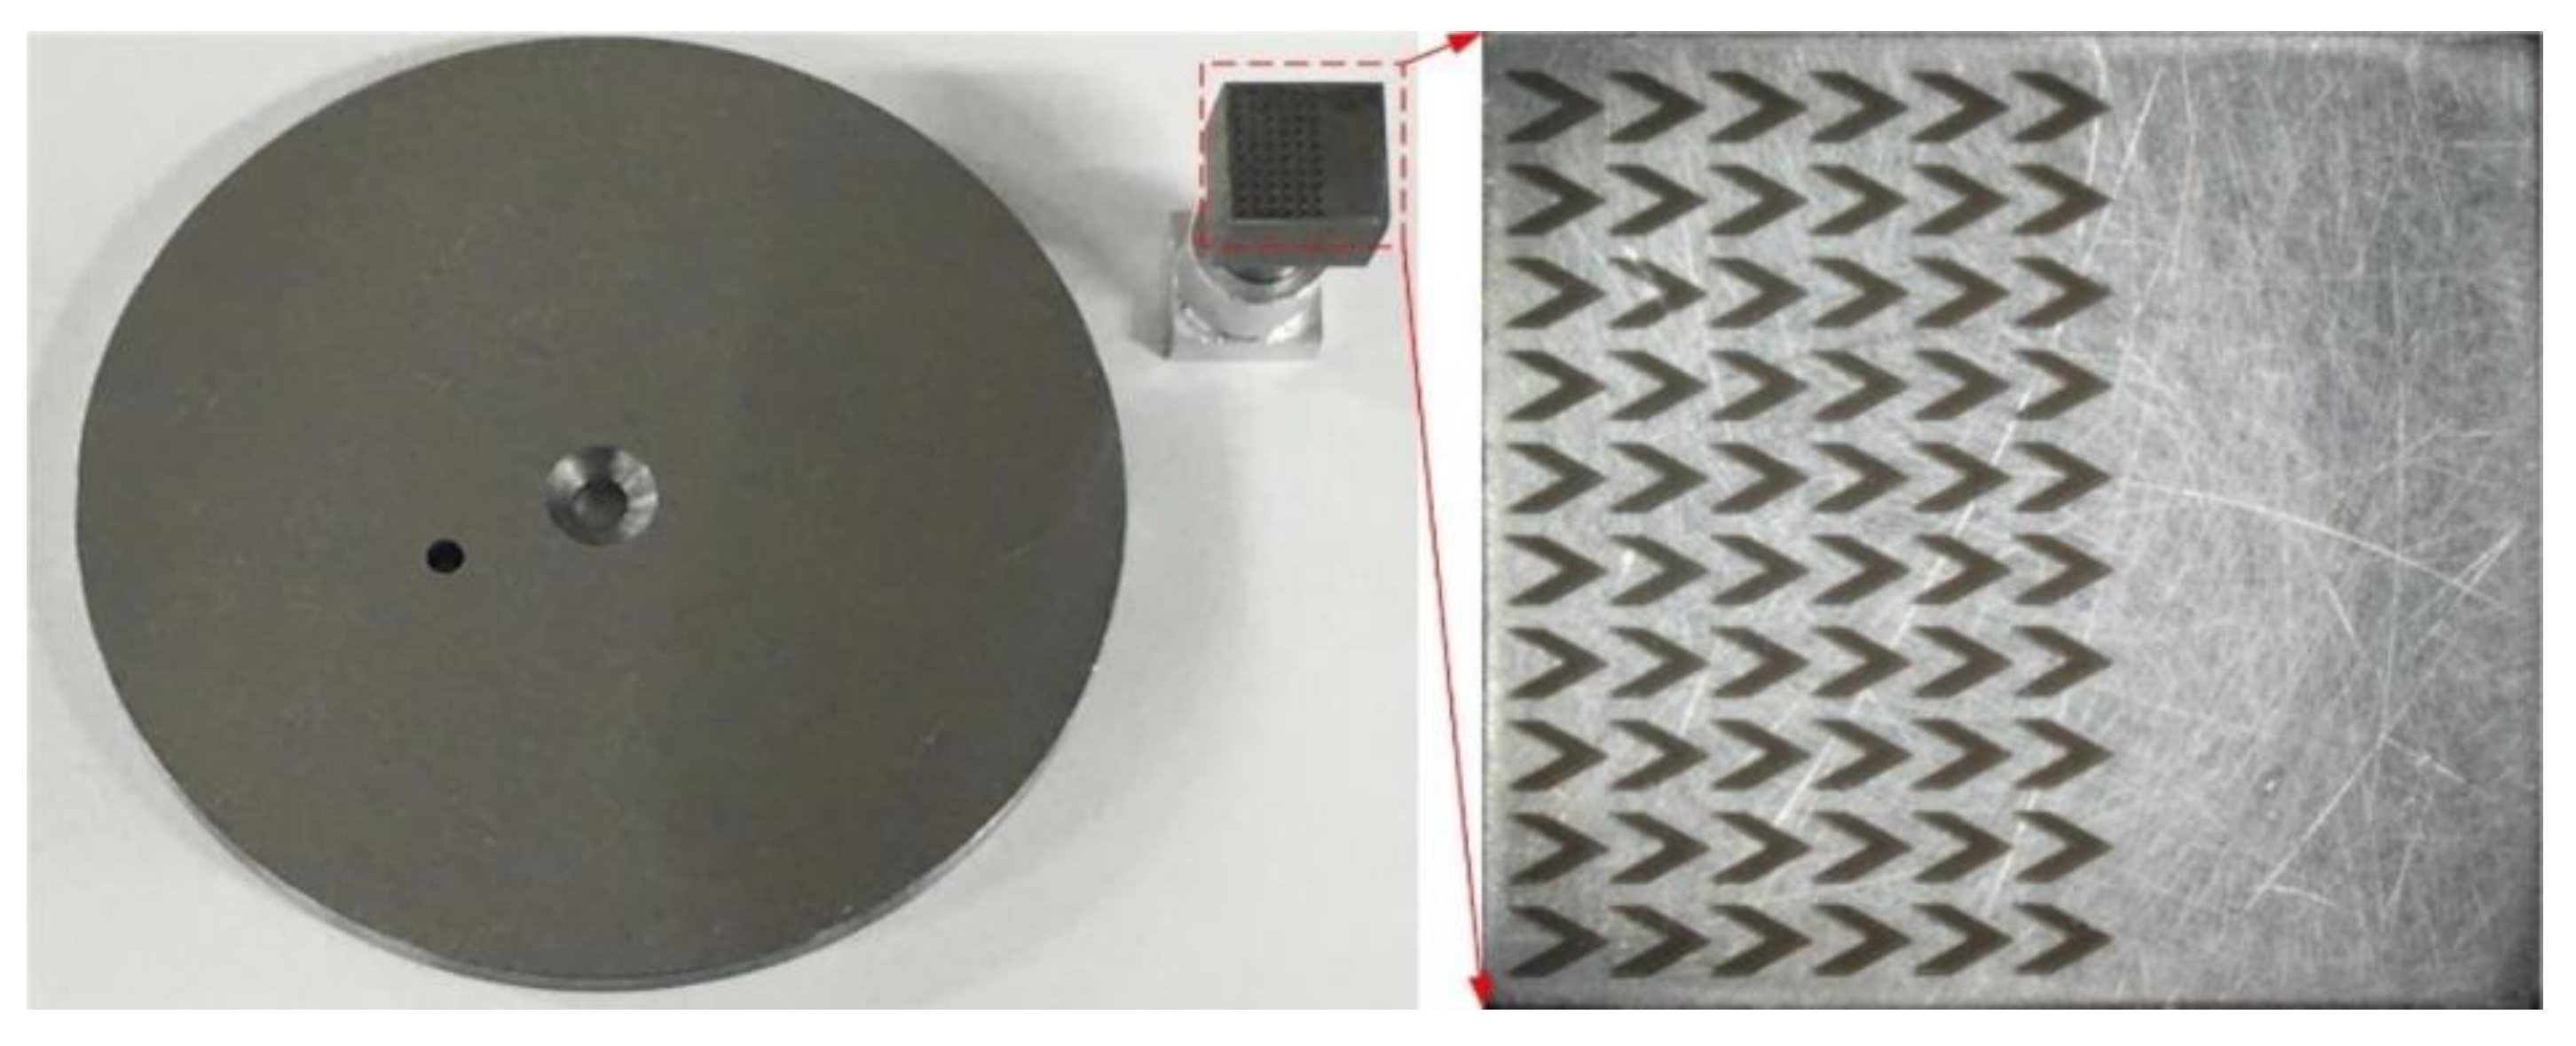
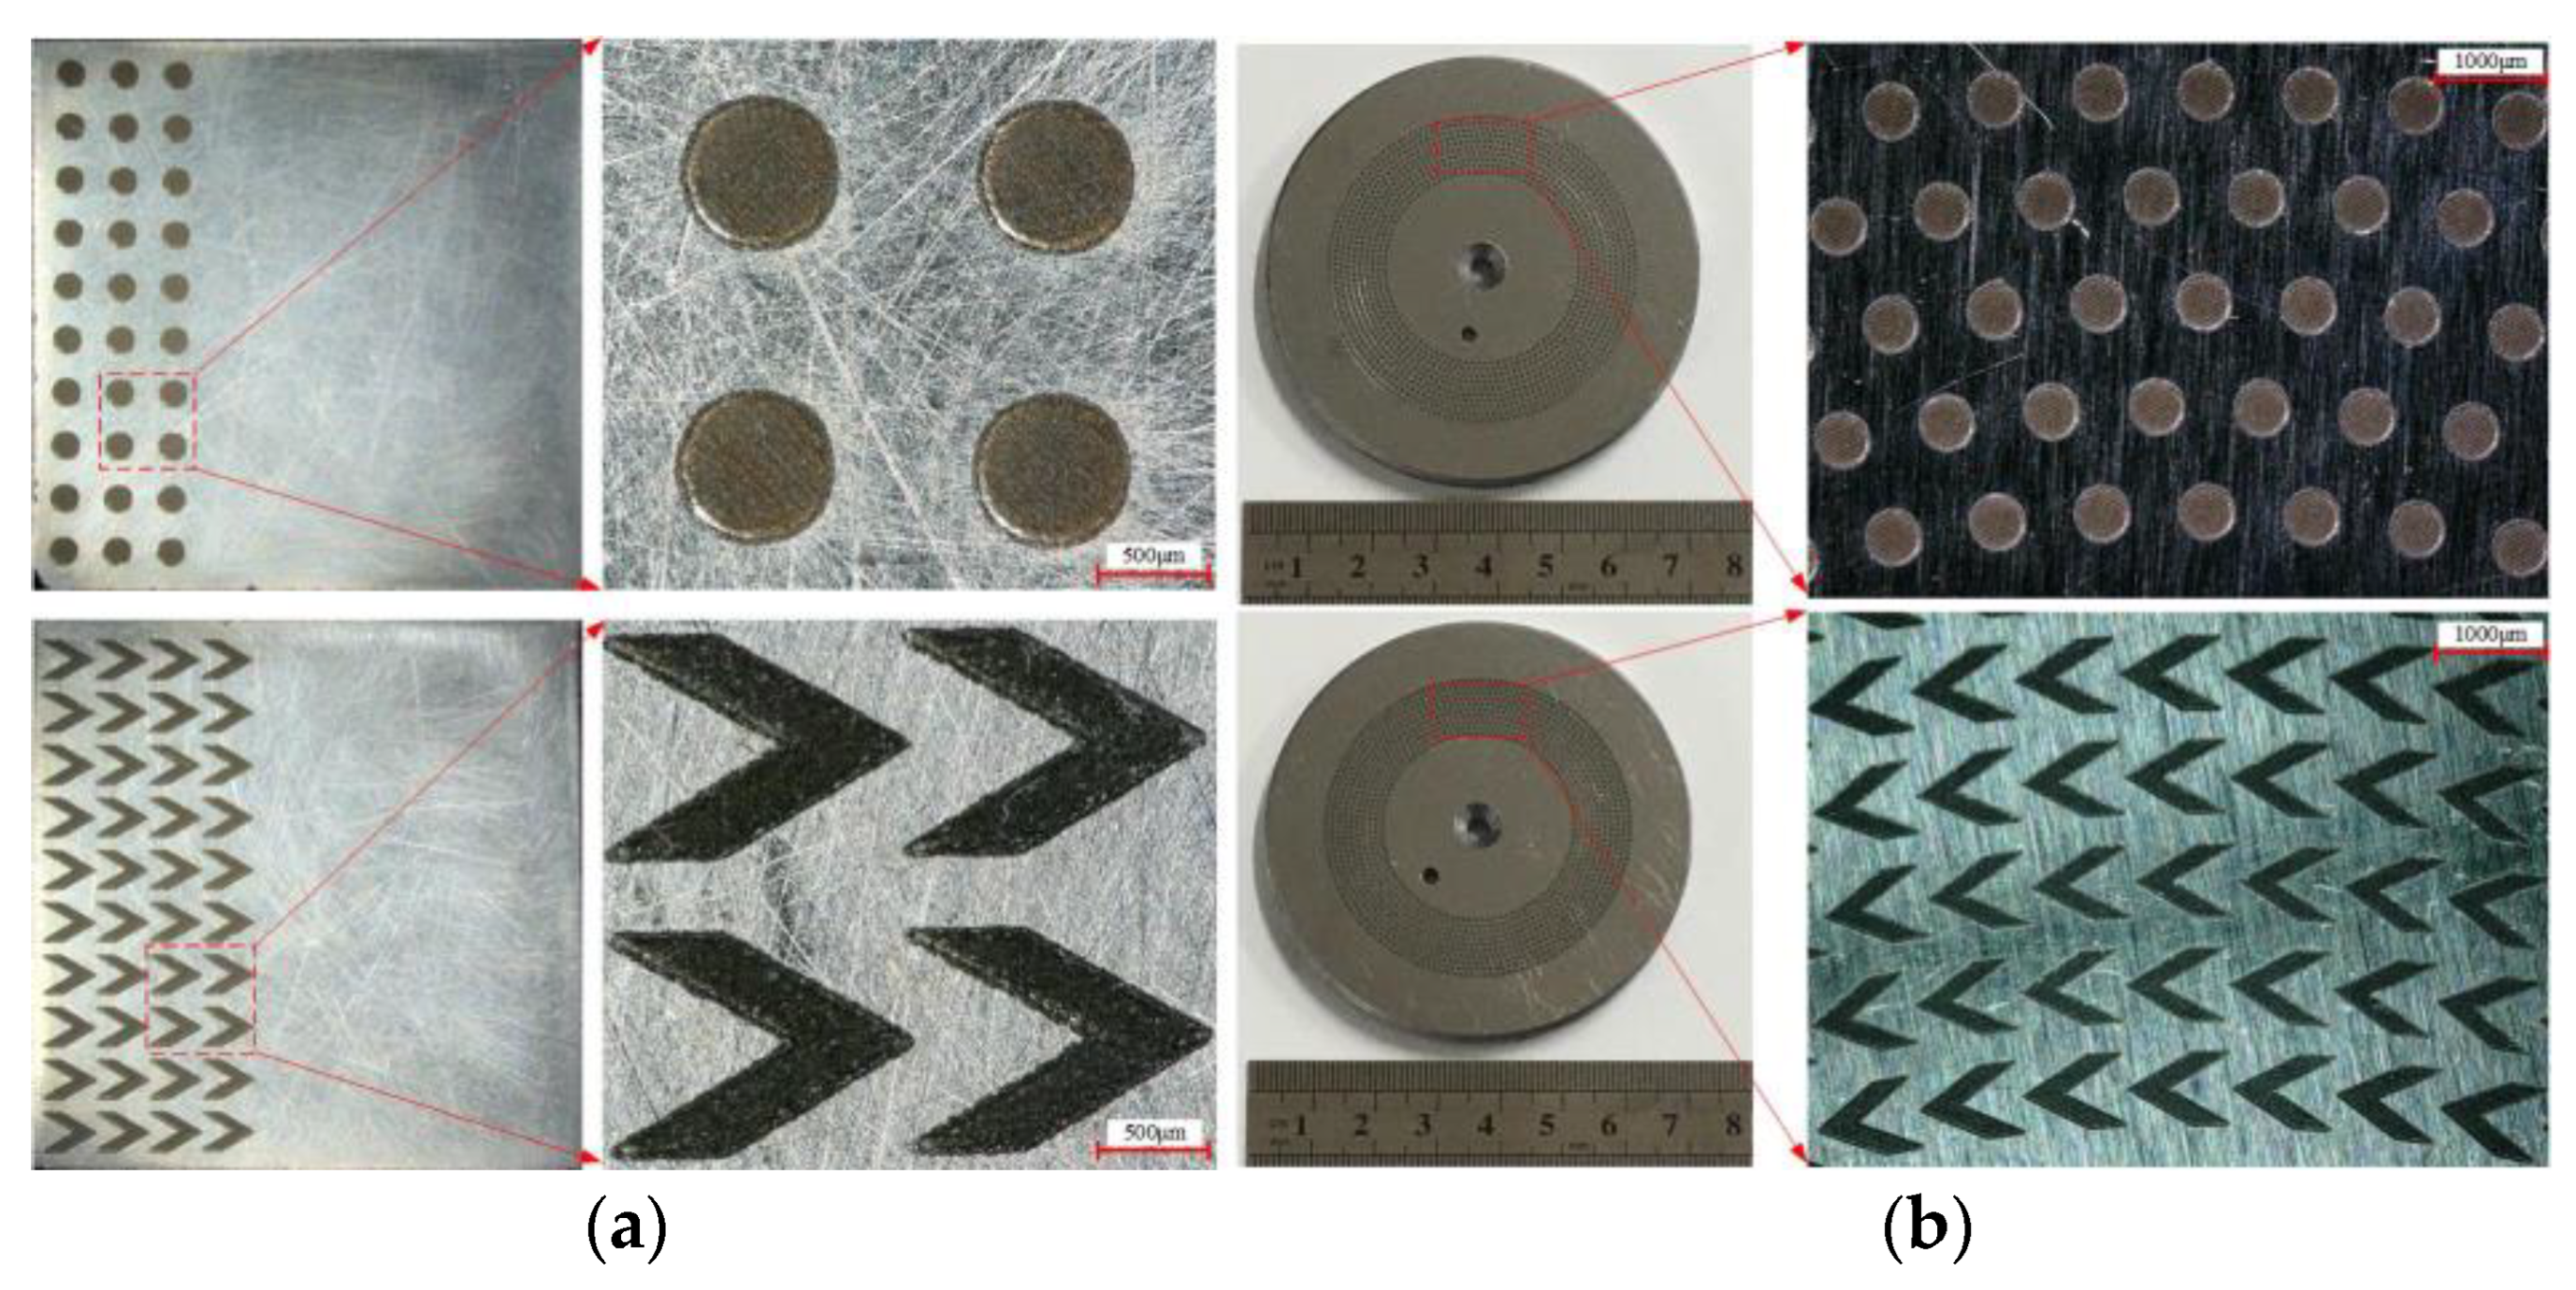
3.1. Sample Surface Texture Preparation

In this test, the higher strength carbon structural steel C45 was selected as the upper test piece material, and the upper test piece was the pin head; the bearing steel GCr15 was selected as the lower test piece material, and the lower test piece was the base chassis. The lower specimen is 69.85 mm in diameter and 6.60 mm in thickness, and the upper specimen is a cubic block with a side length of 10 mm. The surface was ground and polished with 600 mesh, 800 mesh, 1200 mesh, and 2000 mesh sandpaper respectively, followed by ultrasonic cleaning in anhydrous ethanol for 5 min, and then the specimens were dried with heated nitrogen gas. After the treatment was completed, the surface roughness was measured with an average value of Ra = 0.03 μm.
The process parameters for laser processing of the texture: maximum laser power of 7 W, laser wavelength of 355 nm, laser spot processing diameter of 50 μm, laser repetition frequency set to 20 KHz, laser power magnitude set to 60%, laser pulse width < 25 ns, laser scan line spacing set to 0.005 mm, and laser energy density of 5.61 J/cm2. The laser scanning speed for obtaining a specific texture depth was determined through the test as 145 mm/s and 130 mm/s for processing a texture of 8 μm depth on the upper and lower specimen surfaces respectively; when the processed texture. Figure 2 and Figure 3 show the actual picture of the upper and lower specimens and the laser-processed surface structure of the specimens, respectively.

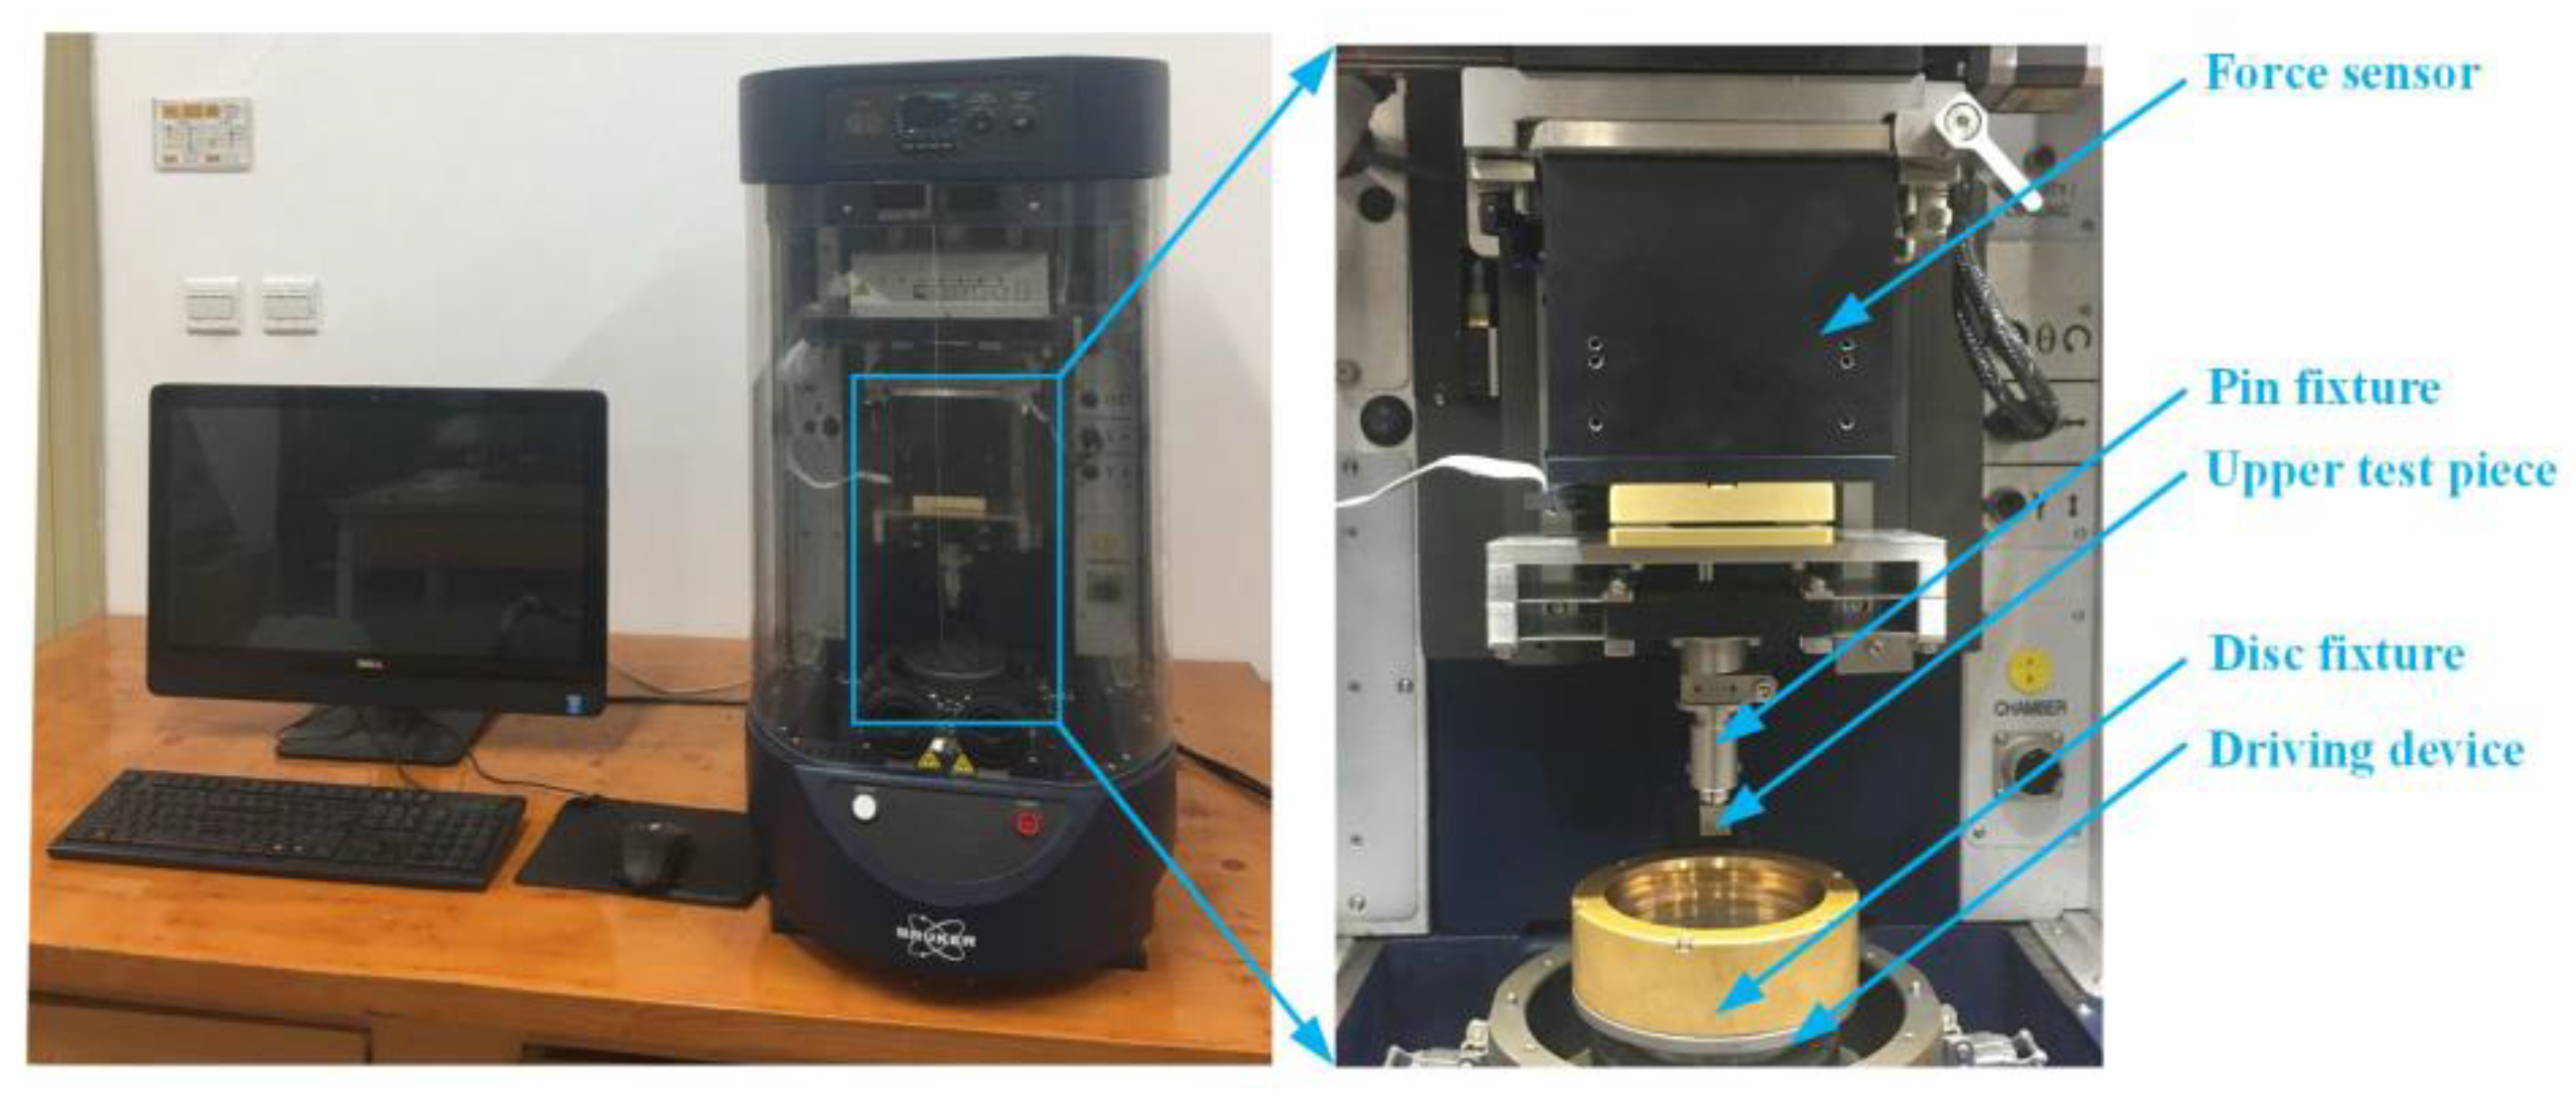
3.2. Textured Surface Friction Performance Test

For the tribological performance test, the UMT-2 shaped tribological wear tester was selected, as shown in Figure 4. Table 1 shows the device parameters of UMT-2. For the upper test piece, the surface of the pin head was machined, and the machining range was a square with a side length of 10 mm. For the lower test piece, the surface of the base plate was machined, and the machining range was a circular area with a radius of 15~25 mm, and the width of the machining was 10 mm. This parameter setting was used to ensure that the relative motion speed between the two friction pairs remained the same when conducting the tribological wear test, and both were 1 m/s, with a test duration of 1200 s and a lubricant dynamic viscosity of 0.03833 Pas. Tribological tests were conducted in a room temperature environment.
In order to ensure that the whole test process is in a state of hydrodynamic lubrication, the lubrication method is oil pool lubrication. Before each test, lubricating oil is added to the clamped oil box so that the lubricating oil is completely immersed in the whole sample disc. During the test, the oil sealing box can keep most of the lubricating oil stored in the oil box to continuously supply oil at the contact interface. At the same time, in order to ensure that the lubricating oil fully permeates into the processed texture pit, the test was carried out after each addition of lubricating oil and standing for 10 min.
The tribological tests on the textured surfaces were conducted by analyzing the performance of the designed circular texture and investigating the single directionality. After polishing and cleaning the surface of the specimen, several sets of textures with the same geometrical characteristics and arranged along the array were processed, and then tribological tests were conducted to investigate the influence of the shape, size, processing position (top/bottom specimen) and distribution (inlet/middle/outlet of the flow field) of the textures on the friction and lubrication characteristics. In order to improve the accuracy of the test data and to reduce the errors caused by the wear and tear between the equipment and the specimens, each set of tests was repeated three times before the data were analyzed.

4. Simulation Results and Analysis

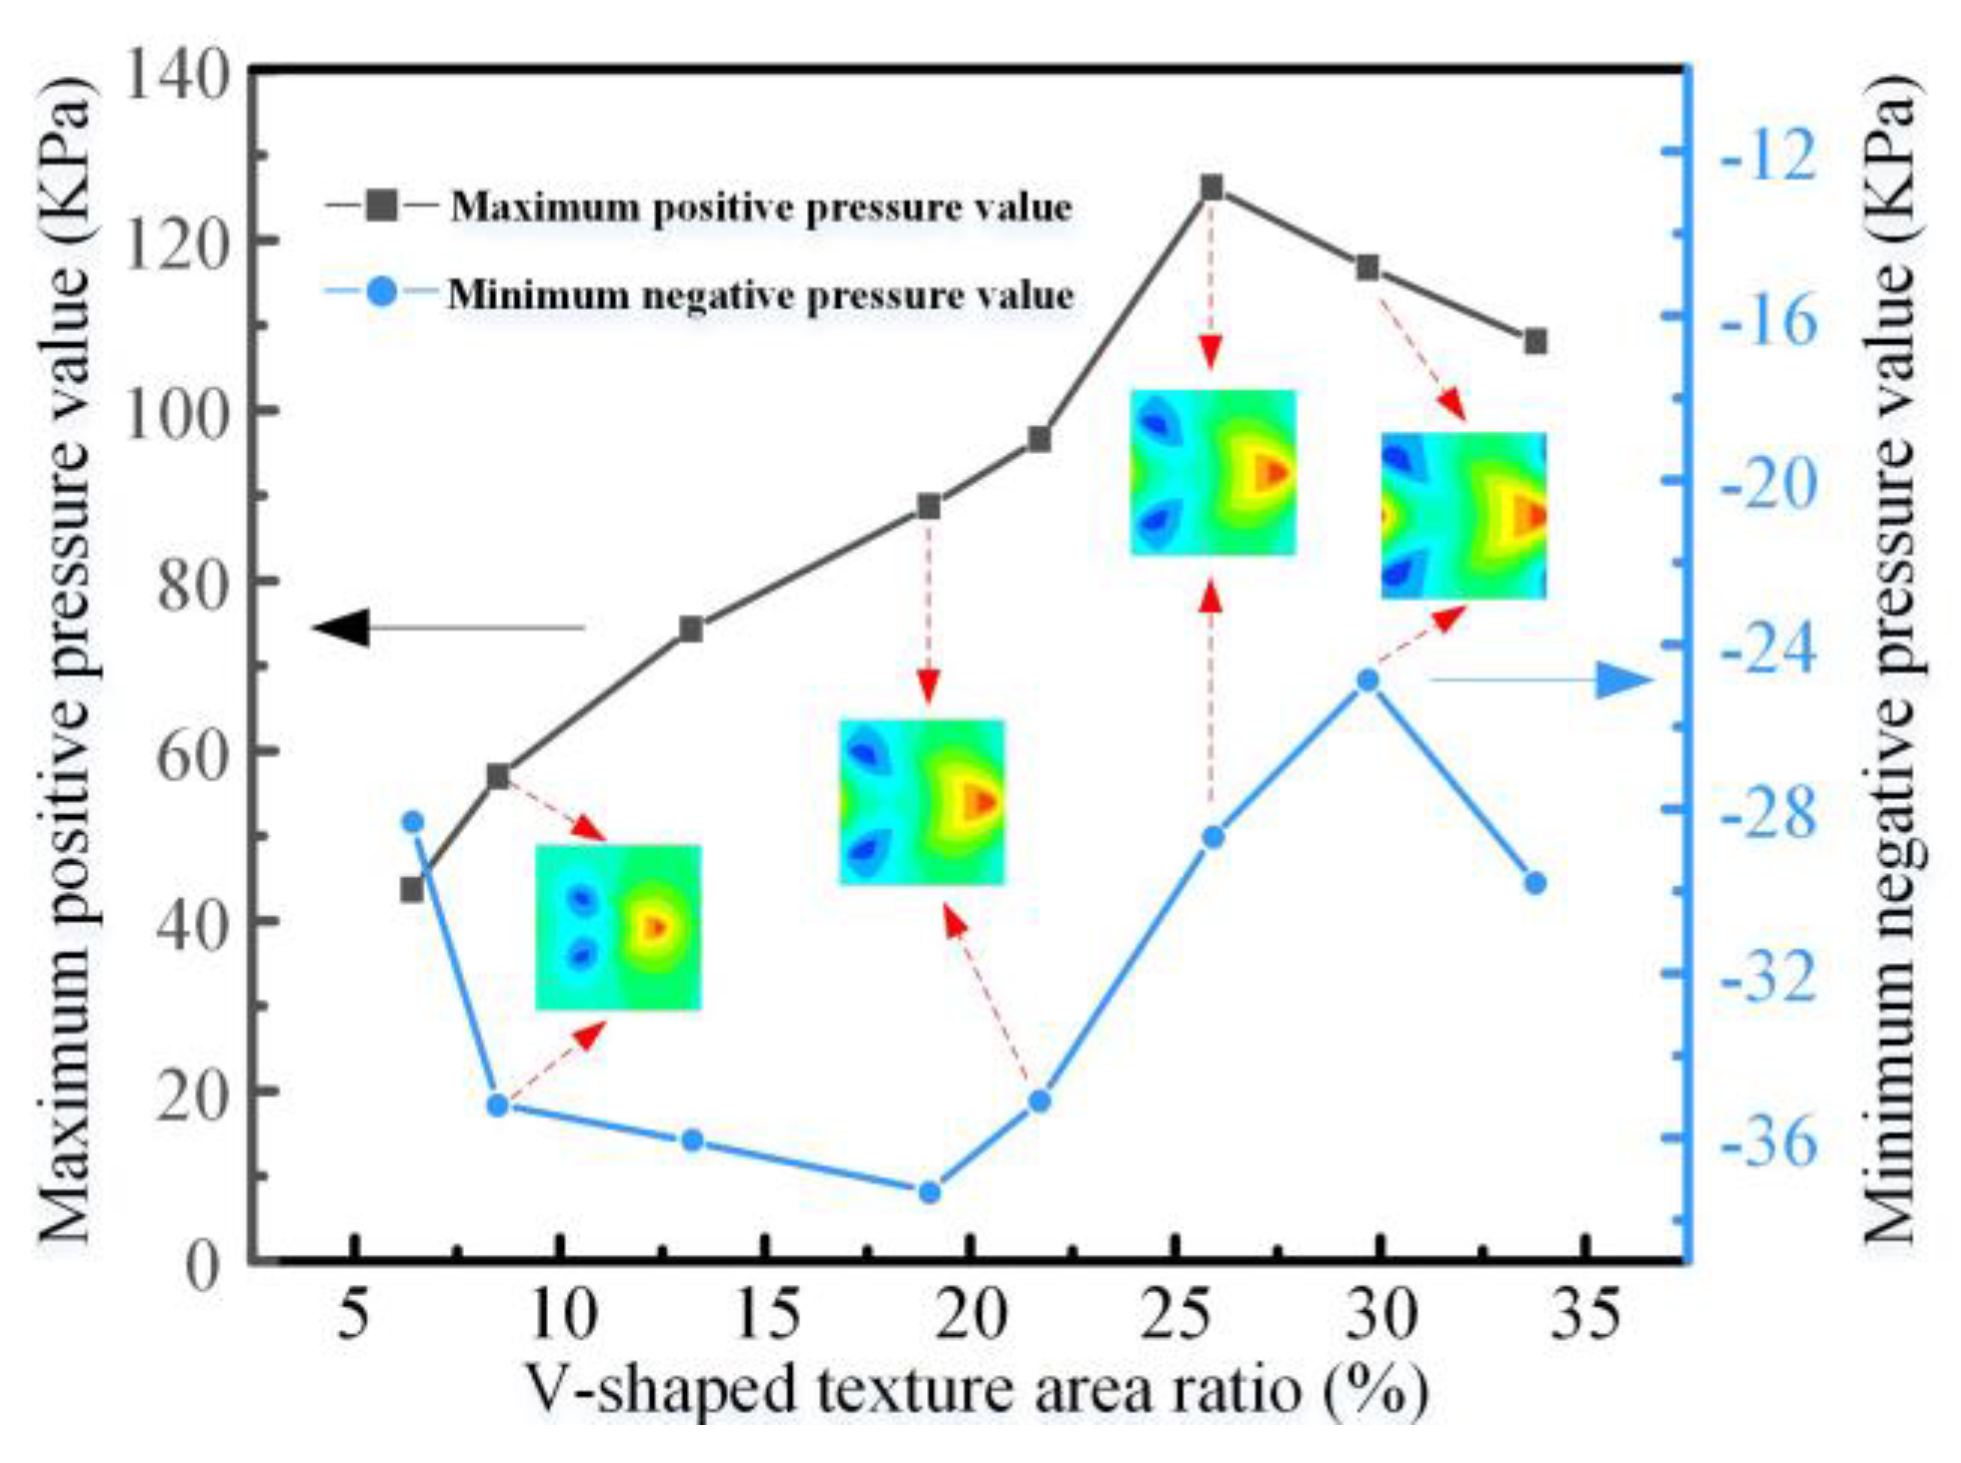
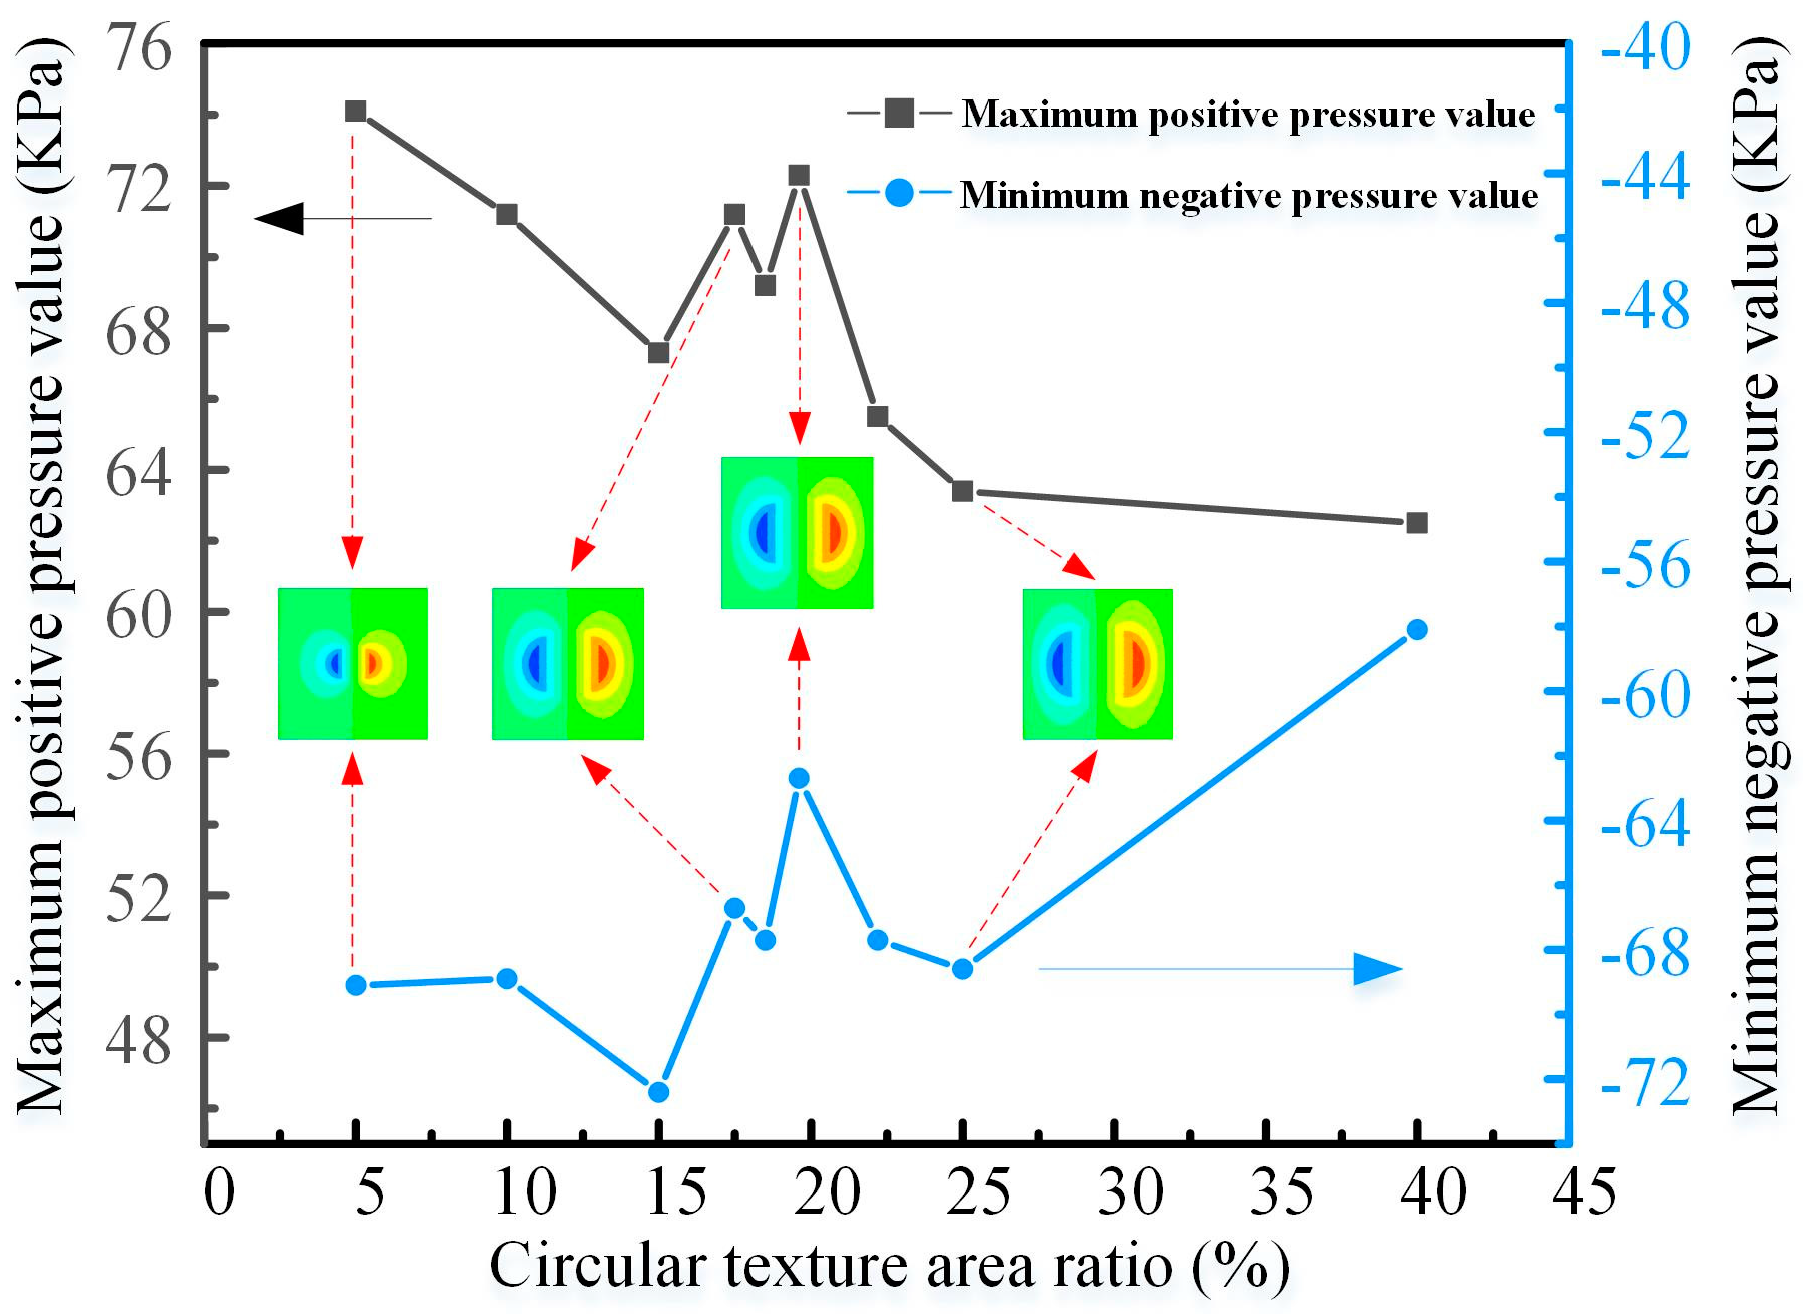
4.1. Effect of Texture Area Ratio on Lubrication Performance

By changing the V-shaped texture edge length M and width N to set the texture area rate Sp to 6.4%, 8.5%, 13.2%, 19.0%, 21.7%, 25.9%, 29.7%, 33.8%, and other parameters, namely depth hp = 13 μm and two wing angle θ = 60°, the effect of surface texture area rate on the lubricity performance of the specimen was analyzed. The calculation results are shown in Figure 5.
From Figure 5, it can be seen that the maximum positive pressure value increases gradually with the increase of V-shaped texture area ratio on the processing surface, and this trend was due to the enhanced convergence of the lubricating medium on the V-shaped texture surface along the edges of the texture shape. The V-shaped texture area rate increases to a certain extent, the maximum positive pressure value changed to a decreasing trend, probably because the negative pressure value also increased to a certain extent, the positive and negative pressure interaction to cancel, the maximum interference effect and making a change in the trend. When Sp = 25.9% the maximum positive pressure reached the maximum, the change curve of the maximum positive and negative pressure value of V-shaped texture with the change rate of texture was analyzed. When the V-shaped texture area rate reached 25.9%, the specimen surface has the best dynamic pressure effect.
In order to investigate the optimal area rate of circular texture to ensure that the comparison of the lubrication performance of V-shaped texture and circular texture was carried out at their respective optimal parameters, the area rate of circular texture was set to 5%, 10%, 15%, 17.5%, 18.5%, 20%, 22.5%, 25%, and 40%, respectively, and the other parameters were: circular texture diameter D = 500 μm; depth was taken as the optimal depth of hp = 8 μm. The calculation results are shown in Figure 6. Similarly, from the maximum positive and negative pressure values with the variation curve of the texture area rate, combined with the pressure clouds at different area rates, it can be concluded that the circular texture has the best dynamic pressure effect corresponding to an area rate of 20%.

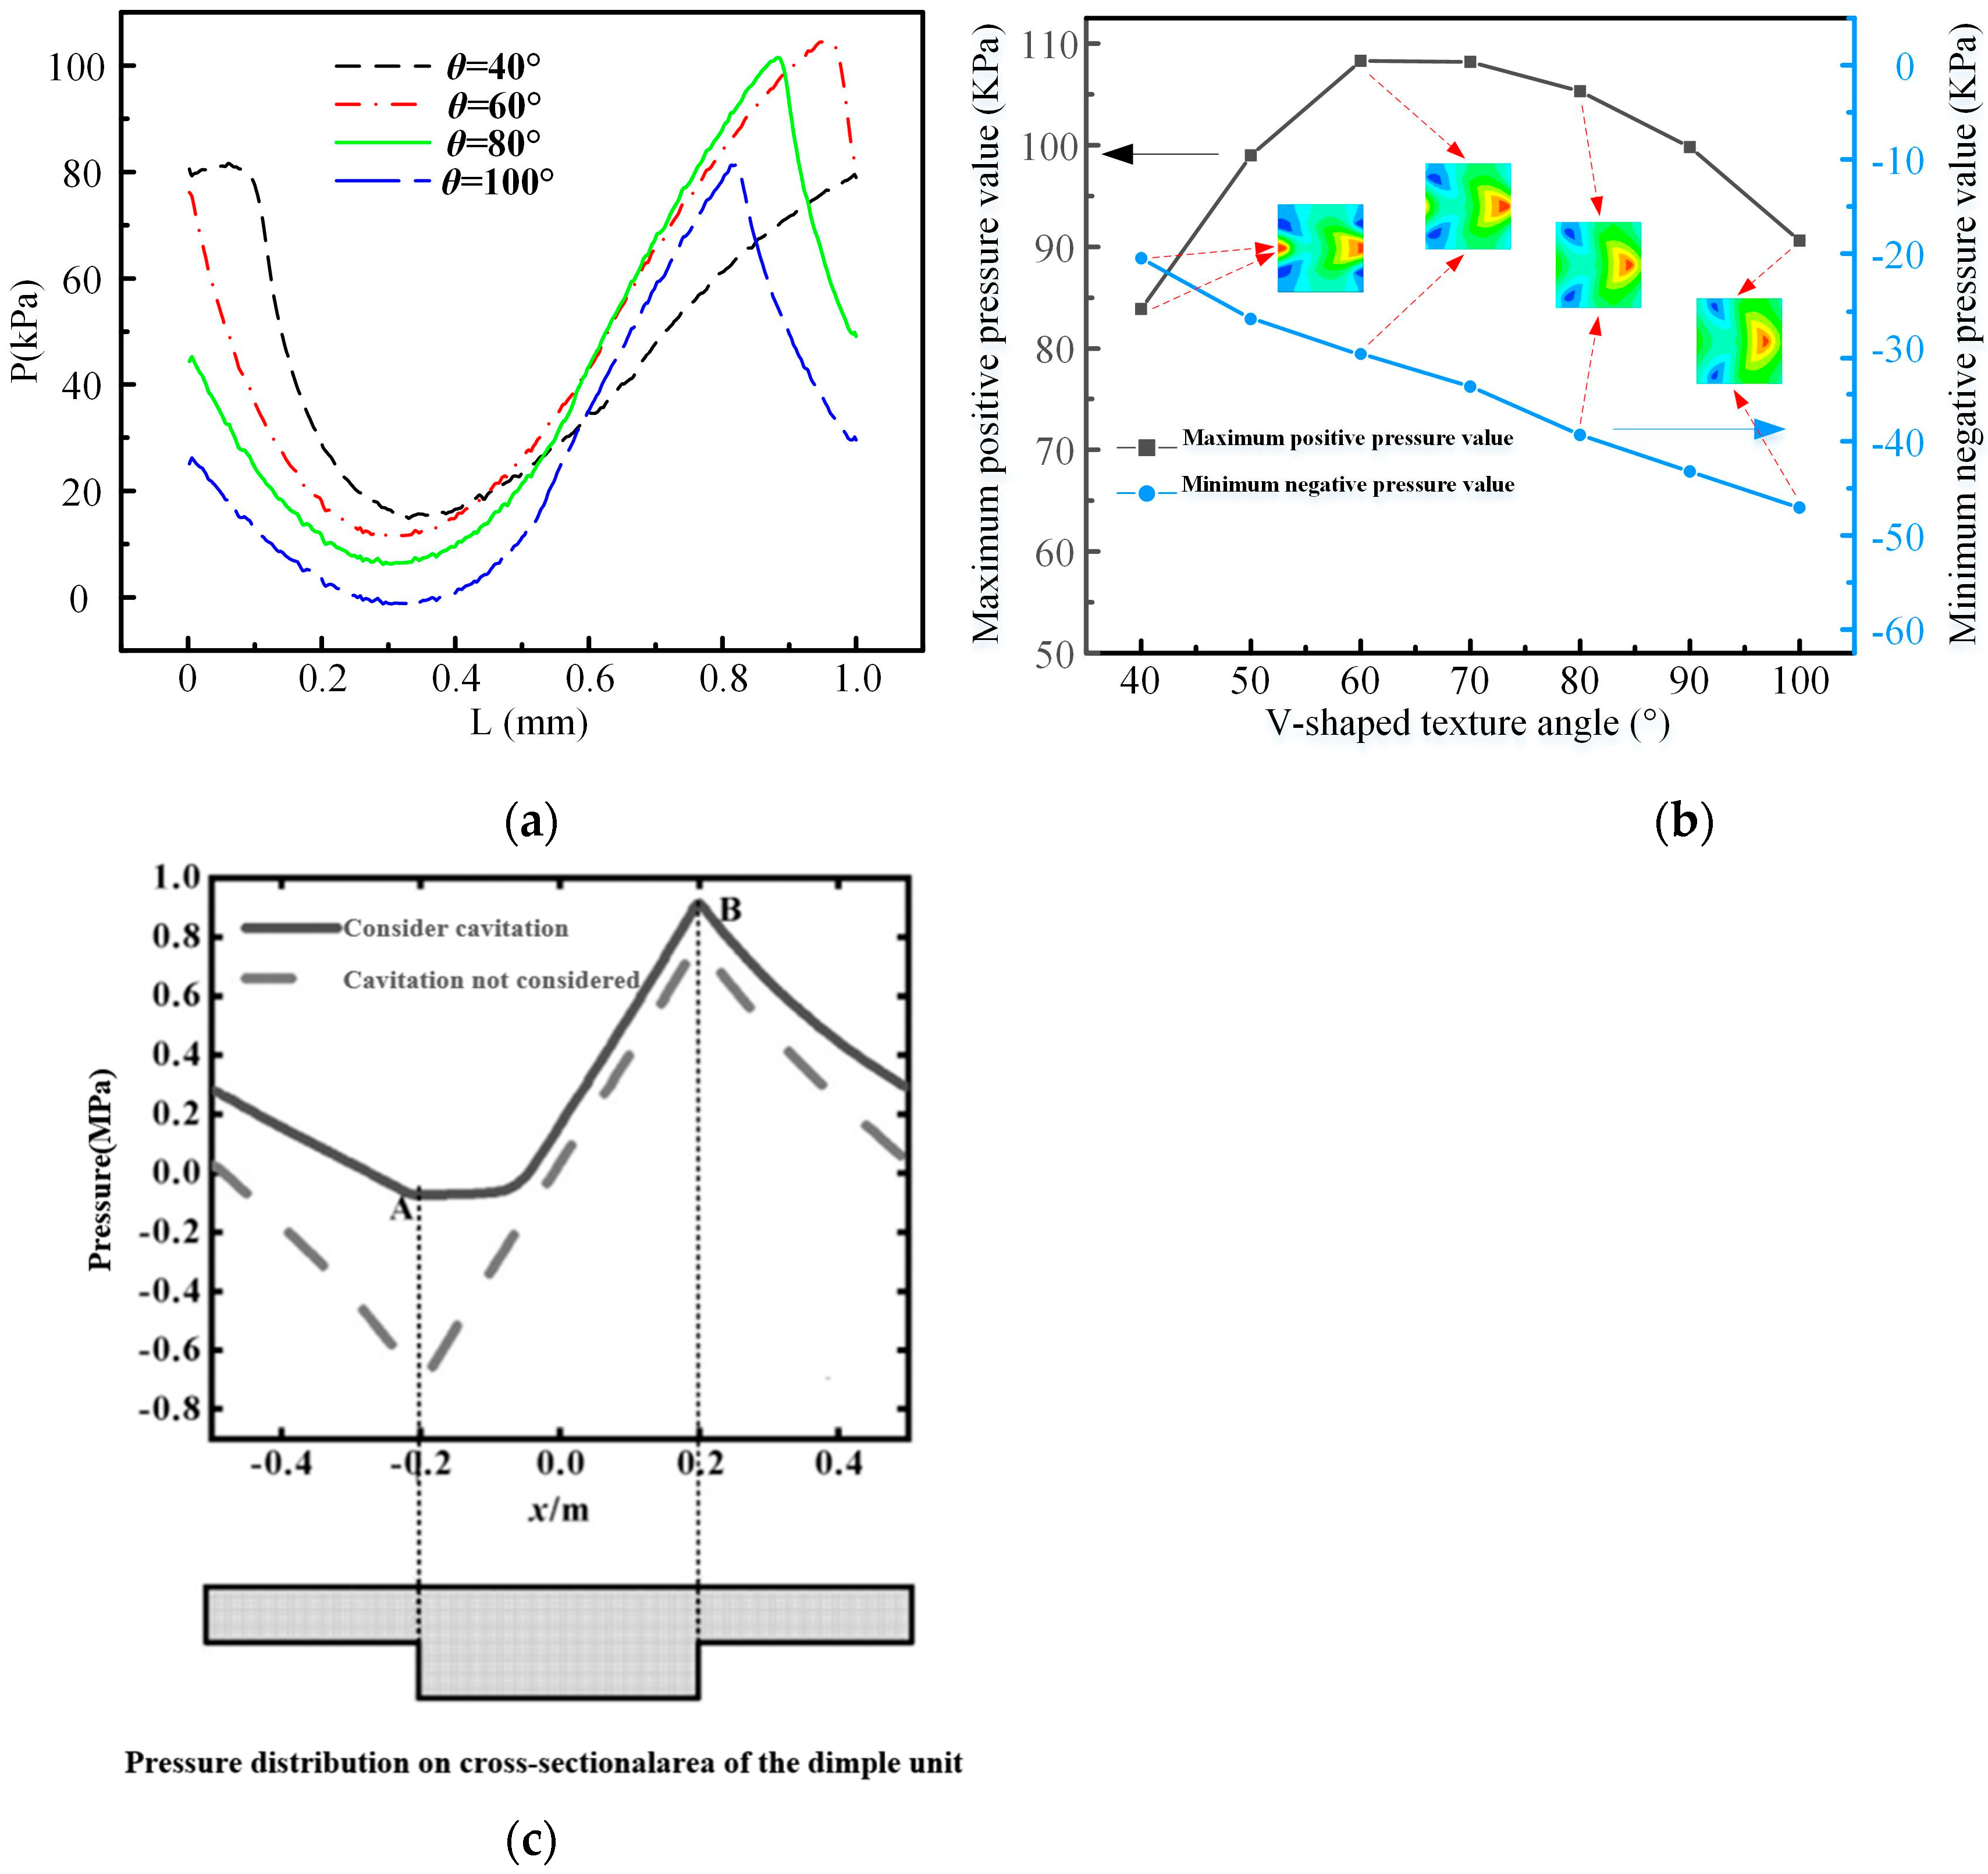
4.2. Influence of the Angle between the Two Wings of the Texture on the Lubrication Performance

The angle θ between the two wings of the texture was set to 40°, 50°, 60°, 70°, 80°, 90°, and 100°, and the effect on the pressure and lubrication characteristics of the flow field formed in lubrication was studied by changing the angle of the V-shaped texture. Other parameters were: Sp = 25.9%, hp = 13 μm, and the shape parameter α = 0.53 of the texture, and the calculation results are shown in Figure 7.
By comparison with Figure 7c, it can be seen that the flow field pressure change curve obtained by the simulation results in this paper has the same trend as the pressure change curve obtained by the simulation results in published papers, which proves that the numerical simulation program is correct.
From the pressure distribution cloud chart, it can be seen that, with the increase of the edge length angle θ, the V-shaped texture negative pressure zone spacing also increased, and the negative pressure area appeared to reduce the trend, with the positive pressure zone area of the proportion of the first increase, and subsequent decrease in the trend. This was due to θ smaller V-shaped texture and parallel to the sliding direction of the distribution of the longitudinal texture on the lubrication characteristics of the friction pair was similar, when the lubricating medium flowing through the texture was mainly guided by the V-shaped texture two wing length, and that supported by the fluid shear resistance was smaller, so the V-shaped vertex position of the extrusion effect was weakened, resulting in the area of positive pressure zone and the maximum positive pressure value was smaller. When θ was larger, the V-shaped texture and perpendicular to the sliding direction of the distribution of the transverse texture of the dynamic pressure effect was approximate, at this time for the flow of lubricating medium obstruction to be greater than its guiding effect. The V-shaped apex position of the squeeze effect was enhanced, but the θ angle was too large when the lubricating medium flow through the texture characteristic of the flow distance was reduced, resulting in the V-shaped apex position of the squeeze effect having a tendency to reduce. Thus, there was the best dynamic pressure characteristics of the V-shaped texture edge length angle. In Figure 7, it can be seen that when θ = 60°, the center section of the maximum value of positive pressure, and the area of positive pressure area accounted for the largest, thus contributing to improve the lubrication characteristics.

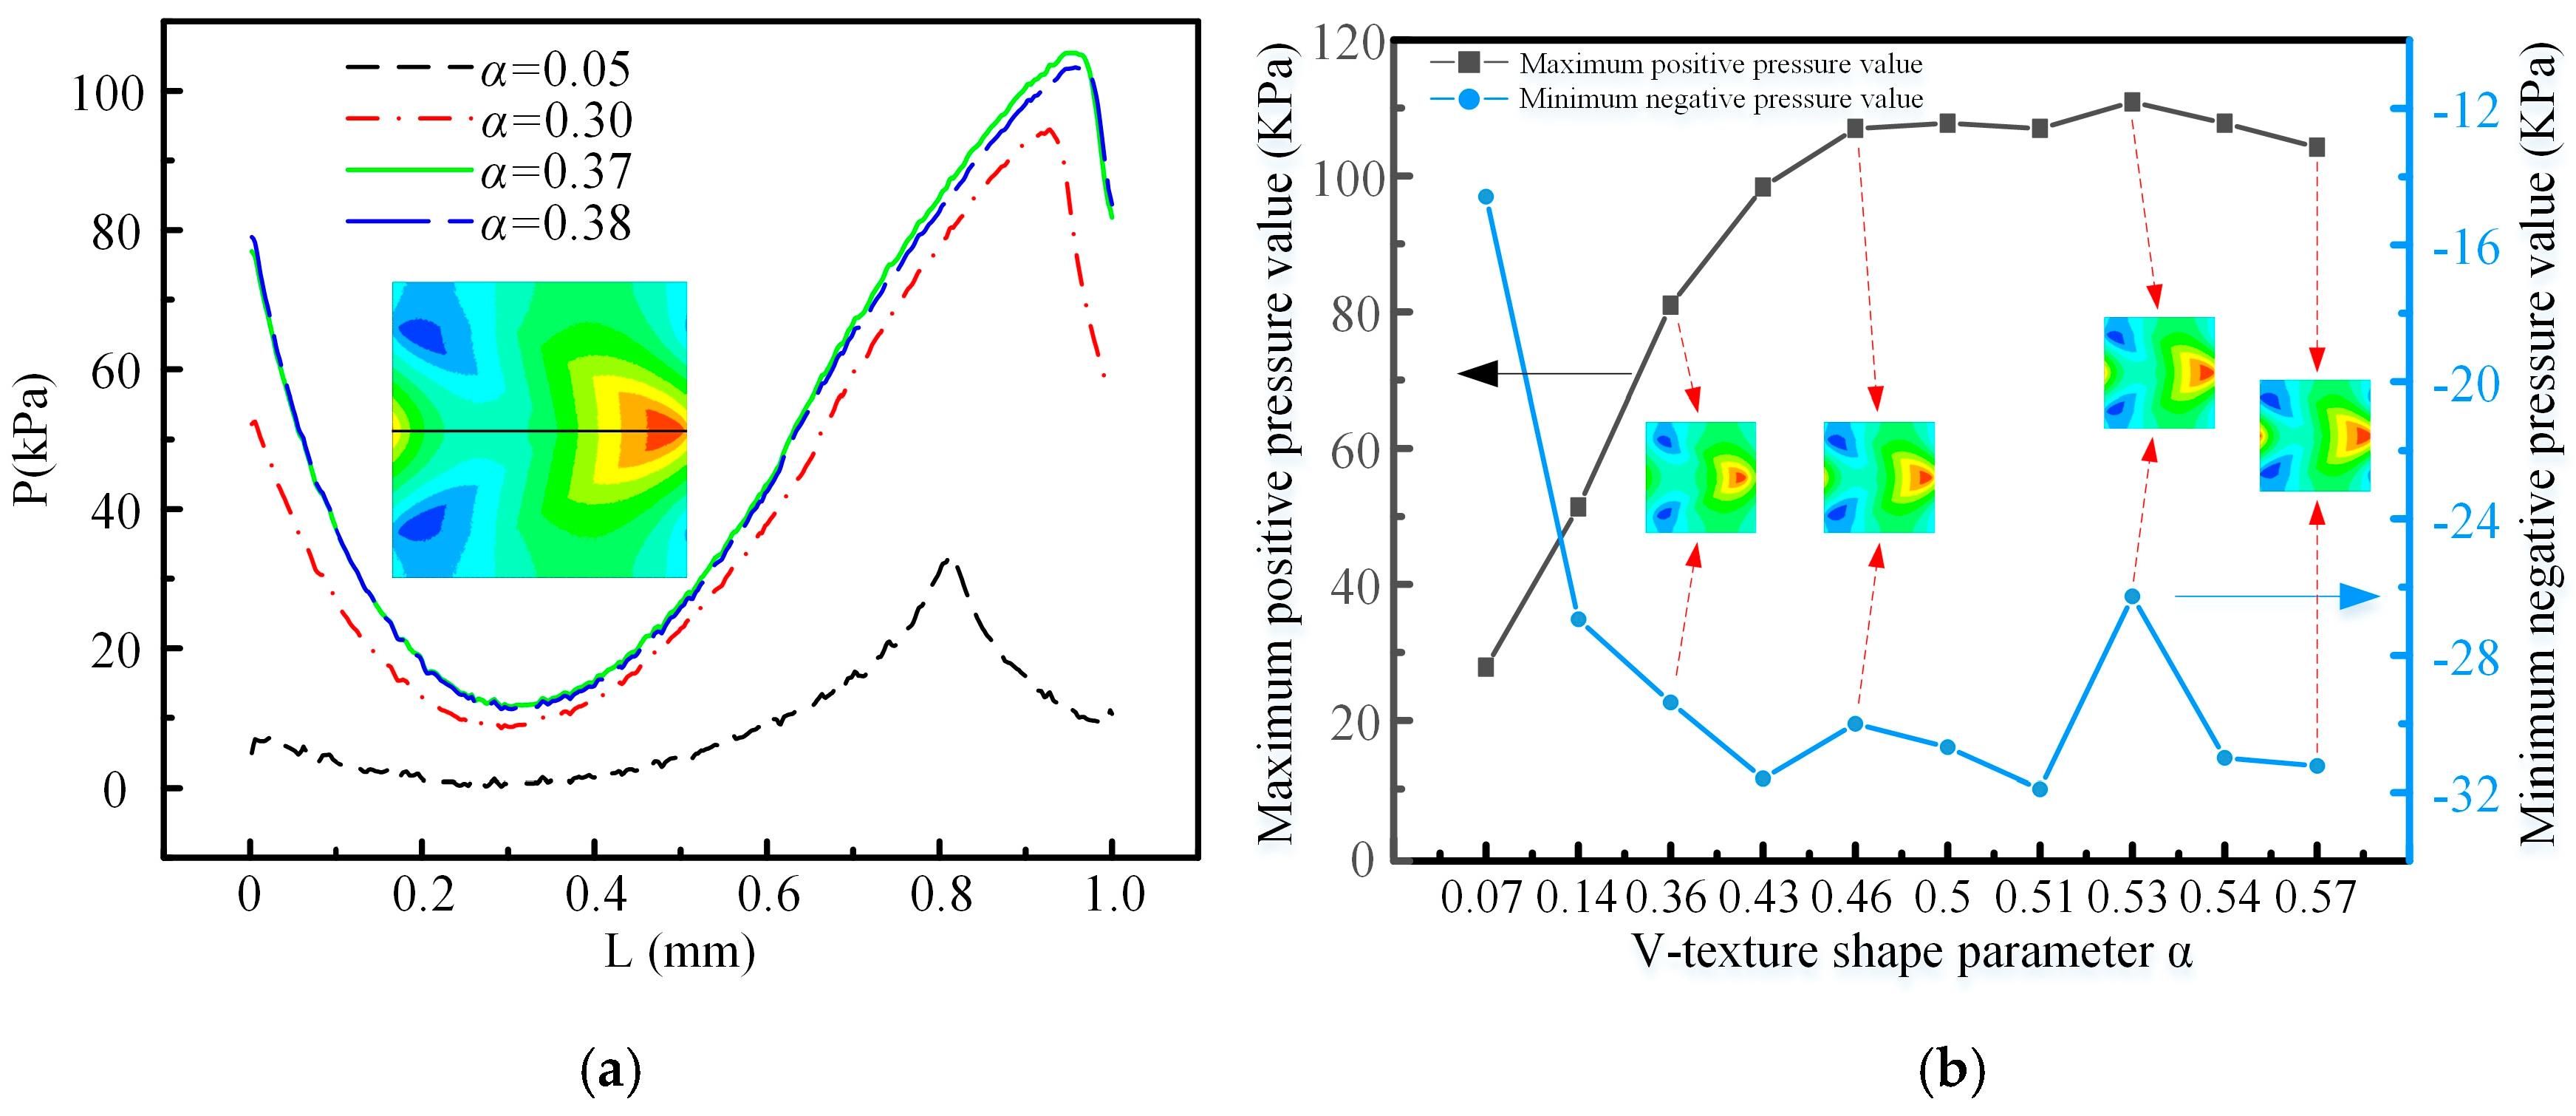
4.3. Influence of Texture Shape Parameters on Lubrication Performance

In order to study the effect of specific parameters of the texture shape on the lubrication performance, the experimental design was to keep the side length M of the V-shaped texture constant and to calculate by changing the value of the texture width N. The V-shaped texture shape parameters were designed as 0.07, 0.14, 0.36, 0.43, 0.46, 0.5, 0.51, 0.53, and 0.57 to study its effect on the pressure distribution of the flow field formed in the lubrication characteristics and lubrication performance. Other parameters were: Sp = 25.9%, hp = 13 μm, θ = 60°, M = 700 μm, and the calculation results are shown in Figure 8.
As could be seen from Figure 8, the V-shaped texture formed two areas of positive and negative pressure. In the process of friction lubrication, when the lubricating medium flowed through the V-shaped texture two wing entrance position, would flow into the texture gap, so the lubricating medium in the flow through the V-shaped texture entrance position, the formation of two separate negative pressure area, as the lubricating medium continues to flow into the V-shaped texture, the V-shaped texture along the side direction of the pressure was also increasing, when the pressure increased to a certain extent, in the V-shaped texture at the apex position to form a positive pressure region. Due to the shape of the V-shaped texture itself, its two wings of the expansion of the edge could guide the flow of lubricating medium along the edge length direction. The lubricating medium constantly infiltrated the V-shaped texture in the apex of the location of the collection, with the accumulation of lubricating medium thus forming the extrusion effect, further improving the lubrication performance. By observing the texture pressure distribution cloud and analysis of the positive and negative pressure values, the results showed that the maximum positive pressure value and the formation of positive pressure area were much larger than the negative pressure value of the two negative pressure area and negative area, which was due to the continuous flow of lubricating medium produced by the extrusion effect of lubricating medium and the formation of the test piece surface dynamic pressure effect, and because the positive pressure value was higher than the negative pressure value, which then offset the balance. There was still some positive residual pressure. This part of the positive pressure applied to the oil film, i.e., the two frictional vice separations, improved its lubrication performance.
Figure 8a shows the pressure variation curves of the central section of the V-shaped texture with different shape parameters, and the following results could be obtained through the analysis of the variation curves. Combined with the maximum positive and negative pressure change curves under different shape parameters shown in Figure 8b, when the shape parameter α of the V-shaped texture reached 0.53, the pressure in its central section was maximum, and the texture characteristics at this time could support the extrusion effect of the lubricating medium to provide the maximum load-bearing force for the oil film formed between the two friction pairs.

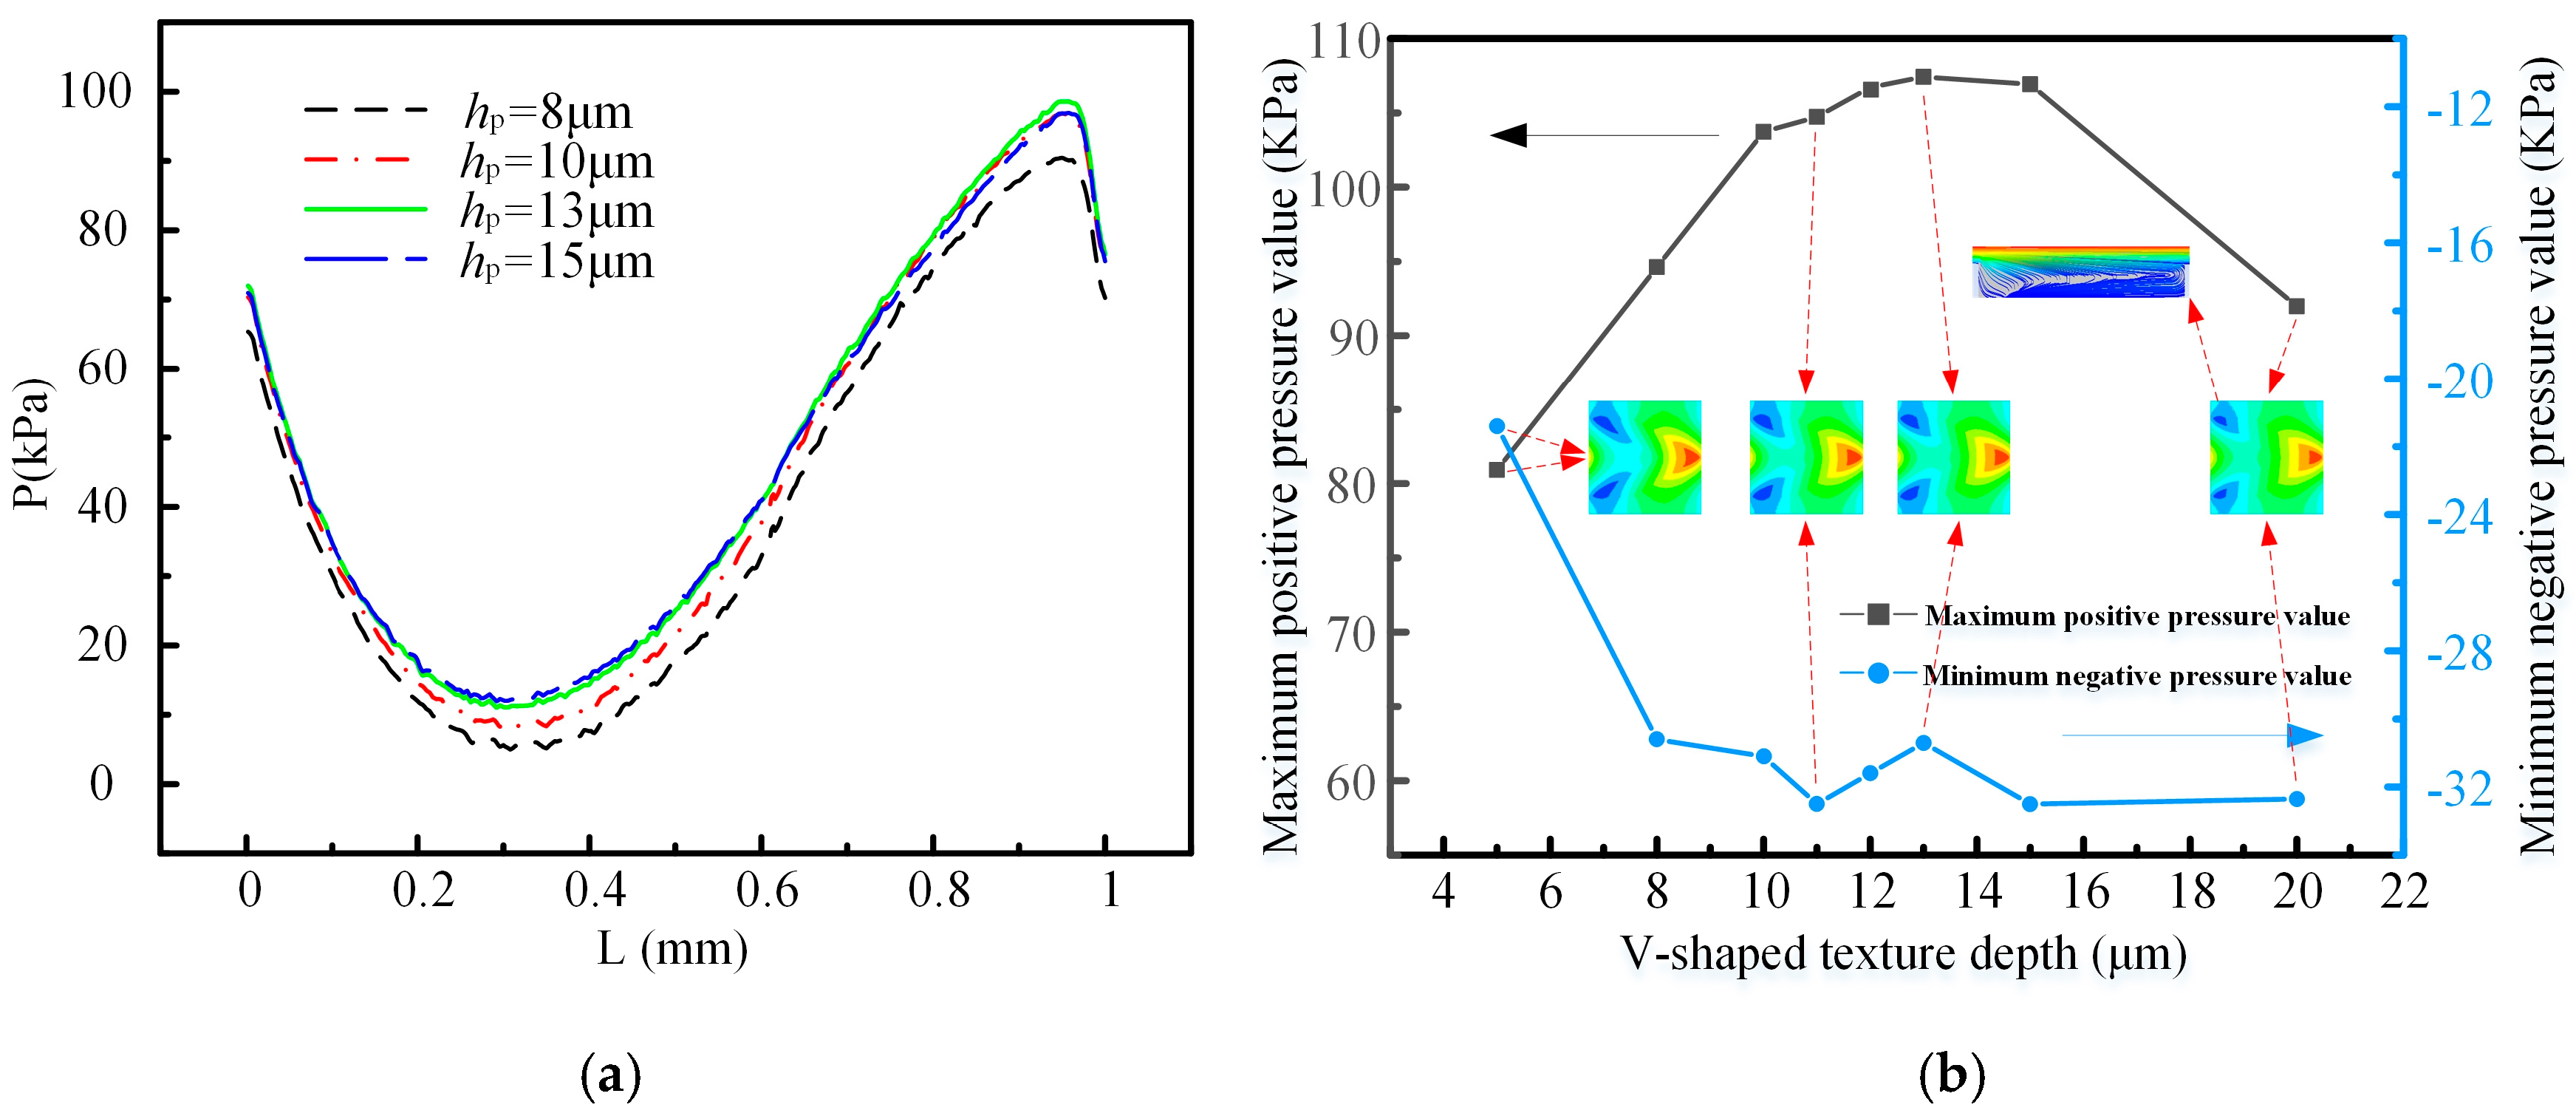
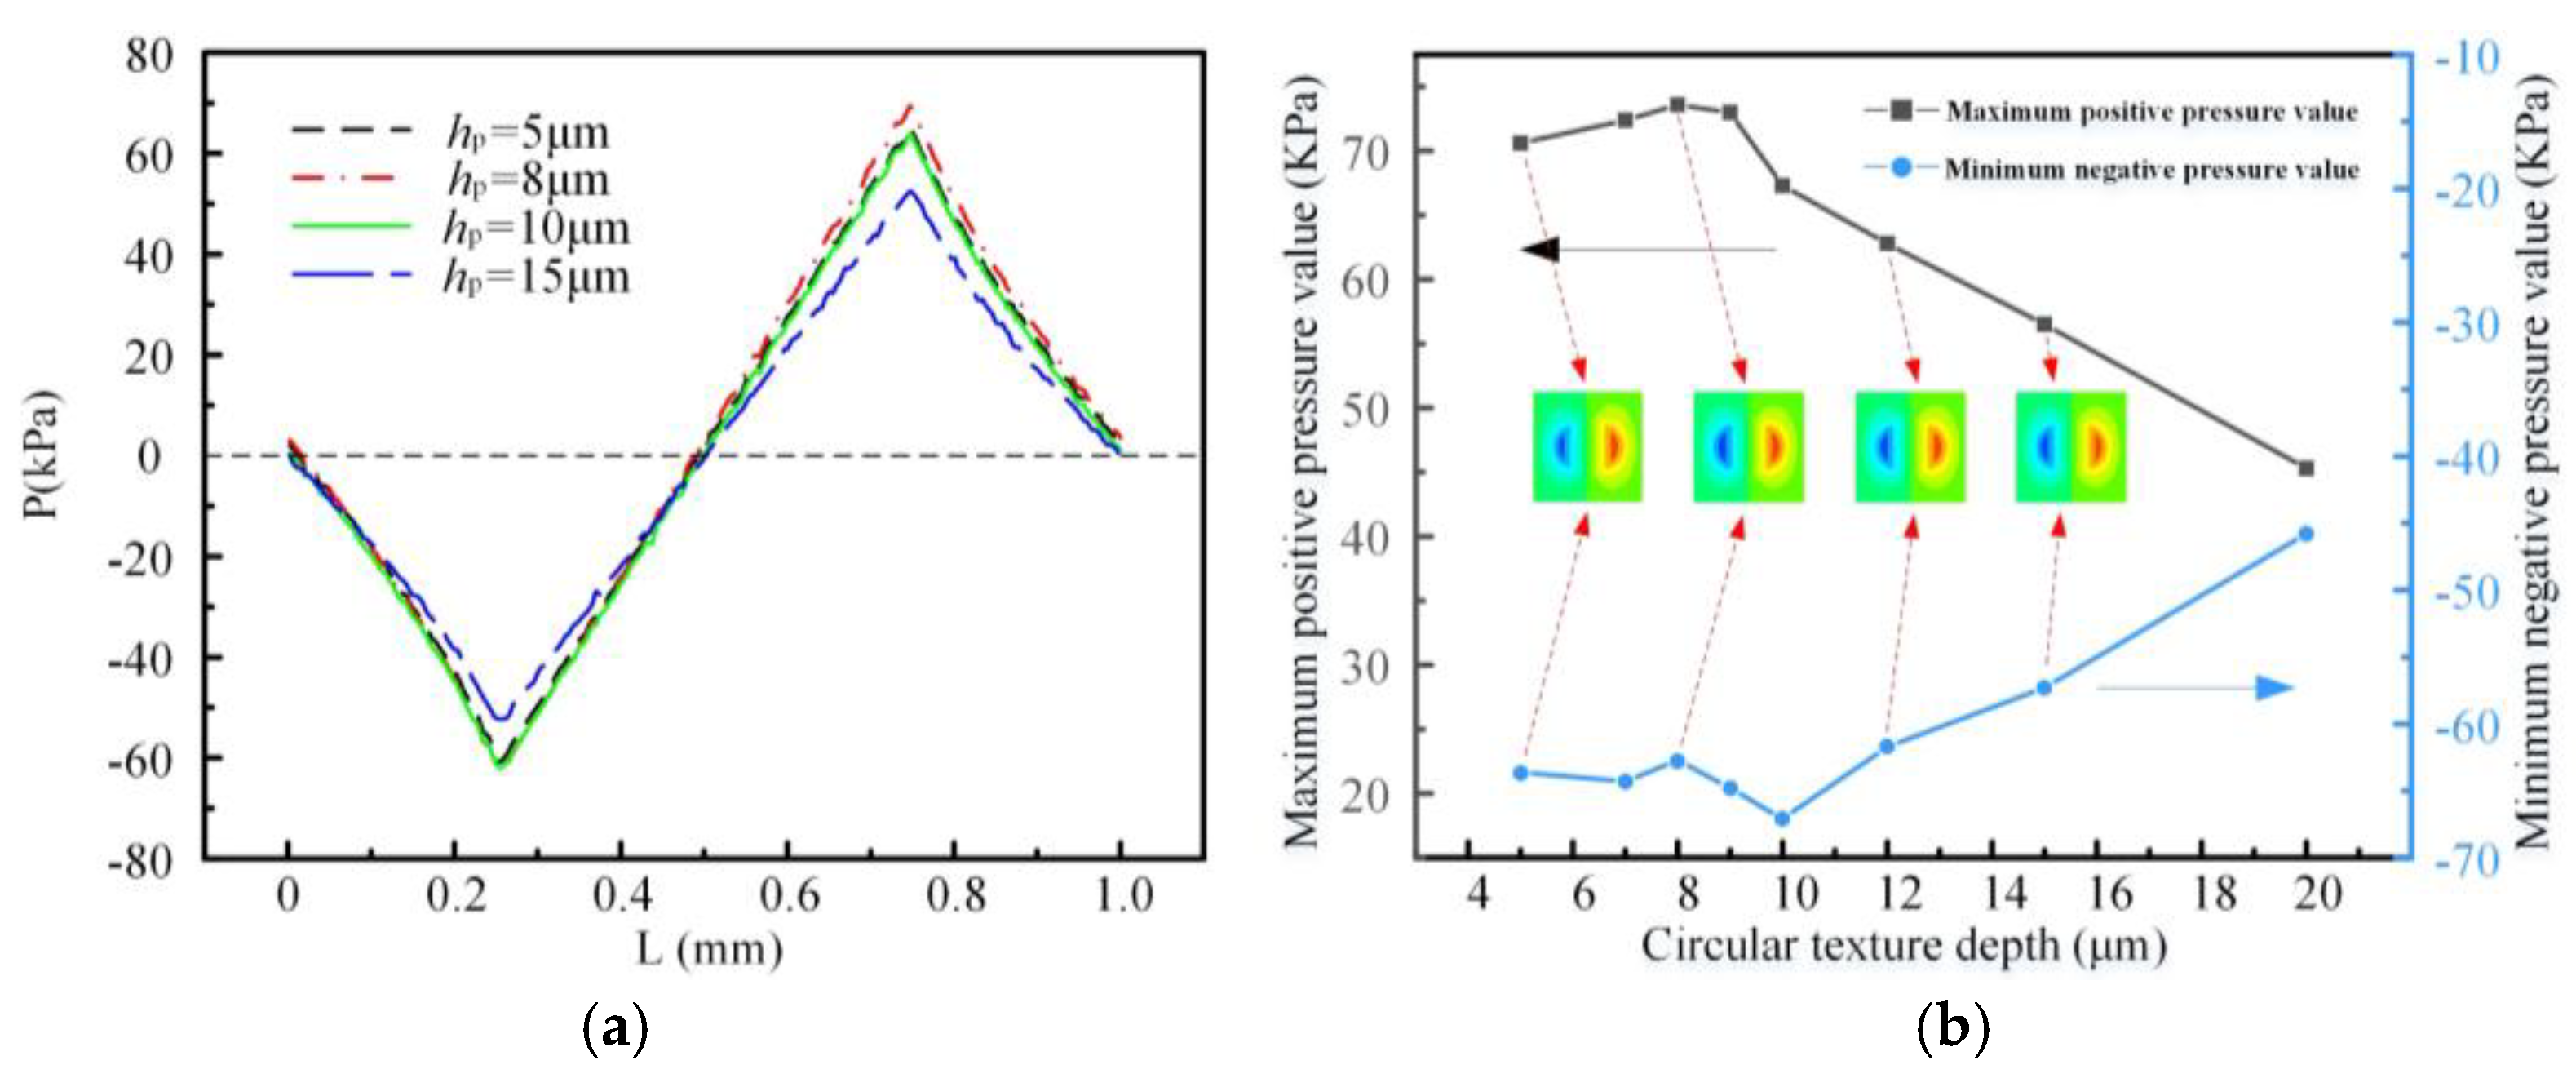
4.4. Effect of Texture Depth on Flow Field Pressure Distribution

The texture depths were designed as 5 μm, 8 μm, 10 μm, 11 μm, 12 μm, 13 μm, 14 μm, 15 μm, and 20 μm to study the effect of texture depth on the pressure distribution and lubrication characteristics of the flow field. Other parameters were: Sp = 25.9%, hp = 13 μm, θ = 60°, and the calculated results are shown in Figure 9.
As can be seen from Figure 9, the maximum positive pressure value increases with the increase of the texture depth, reaching a maximum at a texture depth of 13 μm, and then decreased. The reason for this phenomenon was that if the texture depth was too small, the effect on the lubrication gap was small, and thus the hydrodynamic pressure effect was weak, but when the depth was too large, vortices were generated at the bottom of the texture (as shown in the velocity flow diagram at the bottom of the inlet of the two wings of the texture at a depth of 20 μm), and the excessive vortices consumed energy and reduced the flow speed, resulting in a dragging effect. Therefore, the V-shaped texture could be optimized for lubrication at the optimum texture depth of 13 μm.
As can be seen from Figure 10, the circular texture depth was also optimized in order to ensure that the lubrication performance of the V-shaped texture and the circular texture was compared at their respective optimum parameters. The circular texture depths were set to 5 μm, 7 μm, 8 μm, 9 μm, 10 μm, 12 μm, 15 μm, and 20 μm, respectively, and other parameters were: circular texture diameter D = 500 μm, Sp = 20%. The calculation results show that the circular texture has the best dynamic pressure effect corresponding to a depth of 8 μm.

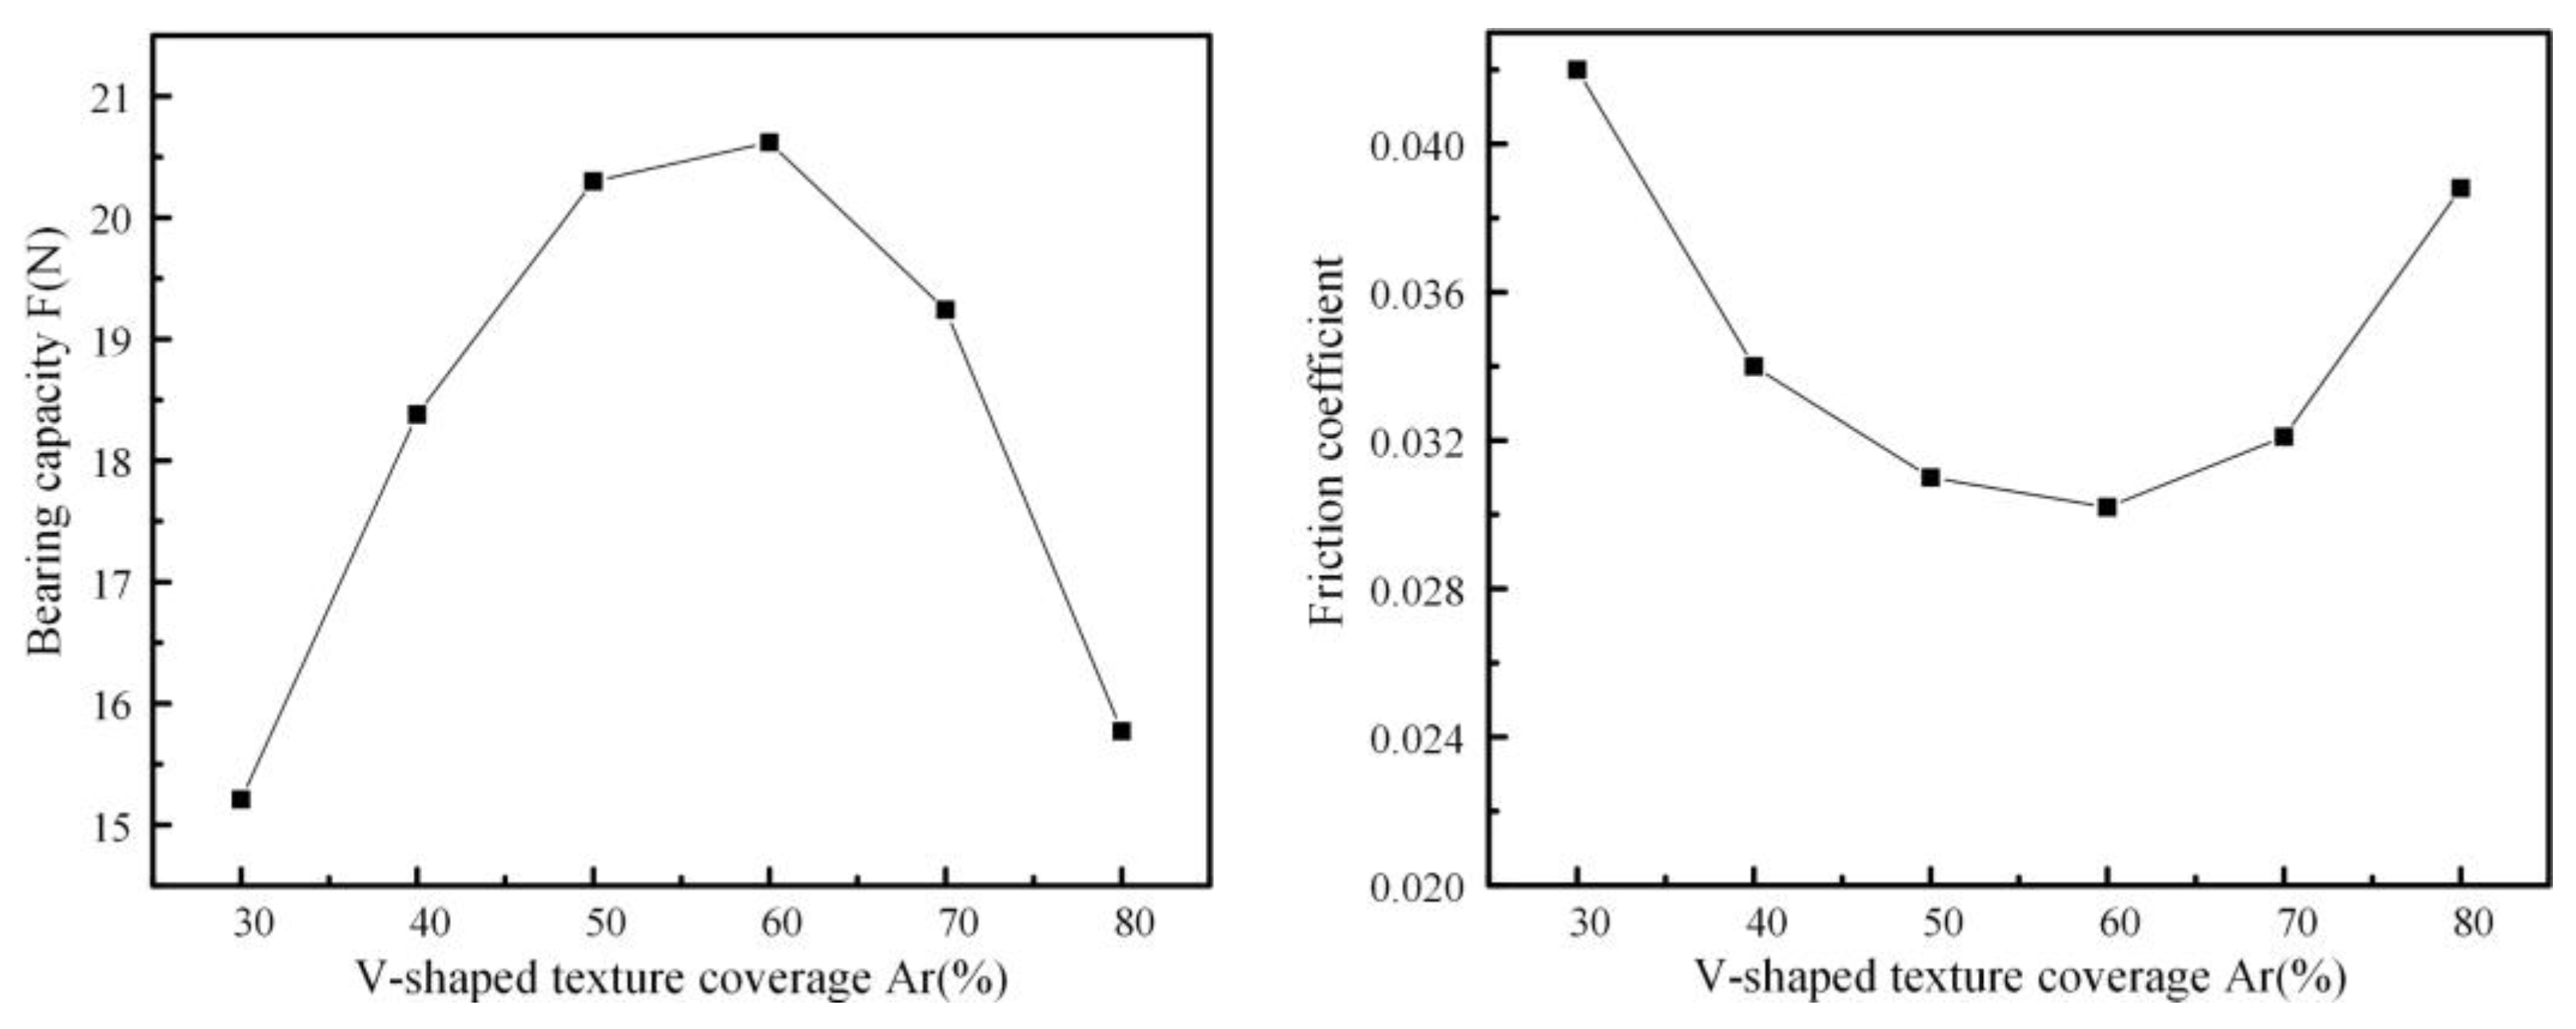
4.5. Influence of the Coverage of the Texture Area on the Lubrication Performance of the Friction Subsurface

The texture coverage affected the lubrication gap gradient effect induced by the texture, and thus there existed an optimized texture coverage. The texture area coverages of 30%, 40%, 50%, 60%, 70%, and 80% were calculated to investigate their effects on the pressure distribution and lubrication performance of the flow field formed during the lubrication process. Other parameters were: α = 0.53, Sp = 25.9%, hp = 13 μm, θ = 60°, and the location of the texture distribution was the entrance of the flow field.
A cloud plot of the V-shaped texture pressure distribution and the cross-sectional pressure variation curves at different coverage rates were shown in Figure 11. From the figure, it can be seen that the presence of the texture array generated a set of positive pressures superimposed on the pressure curve. The positive pressure was generated by the pooling effect of the two flanking edges of the V-shaped texture, which eventually produced an extrusion effect at the location of the apex of the V-shaped texture by the continuous influx of lubricating medium. The positive pressure region was formed at the apex of each V-shaped texture distributed along the surface of the specimen in the array and perpendicular to the sliding direction, and each positive pressure region was separated from each other, thus providing more pressure to the convergence gap formed by the V-shaped texture distributed along the sliding direction. Analysis of the cross-sectional pressure changed in Figure 9 can be performed, i.e., he V-shaped texture cross-sectional pressure value with the increase in texture coverage, and its tendency to increase relatively slowly. The reason for this change was that the increase in texture coverage made the lubricating medium flow through the texture area generated by the high-pressure area and the low-pressure area between the spacing was reduced. When the texture coverage was too large, the cross-sectional pressure value of the peak would become smaller, which was due to the influence of the lubricating medium flow in and out or the low-pressure dispersion wedge, resulting in the loss of positive pressure, which could be inferred from the large texture coverage leading to the loss of positive pressure, directly affecting the oil film between the two interfaces bearing capacity, making the lubrication effect worse.
Figure 12 shows the change curves of oil film bearing capacity and friction coefficient between two interfaces of relative motion under lubrication conditions with different coverage of V-shaped texture. In addition, the texture coverage of the circular texture used as a comparison was optimized, and the results showed that when the proportion of circular texture surface was 50%, it could provide the maximum oil film bearing capacity to separate the two opposing motion interfaces, corresponding to the smallest friction coefficient and the best lubrication characteristics.

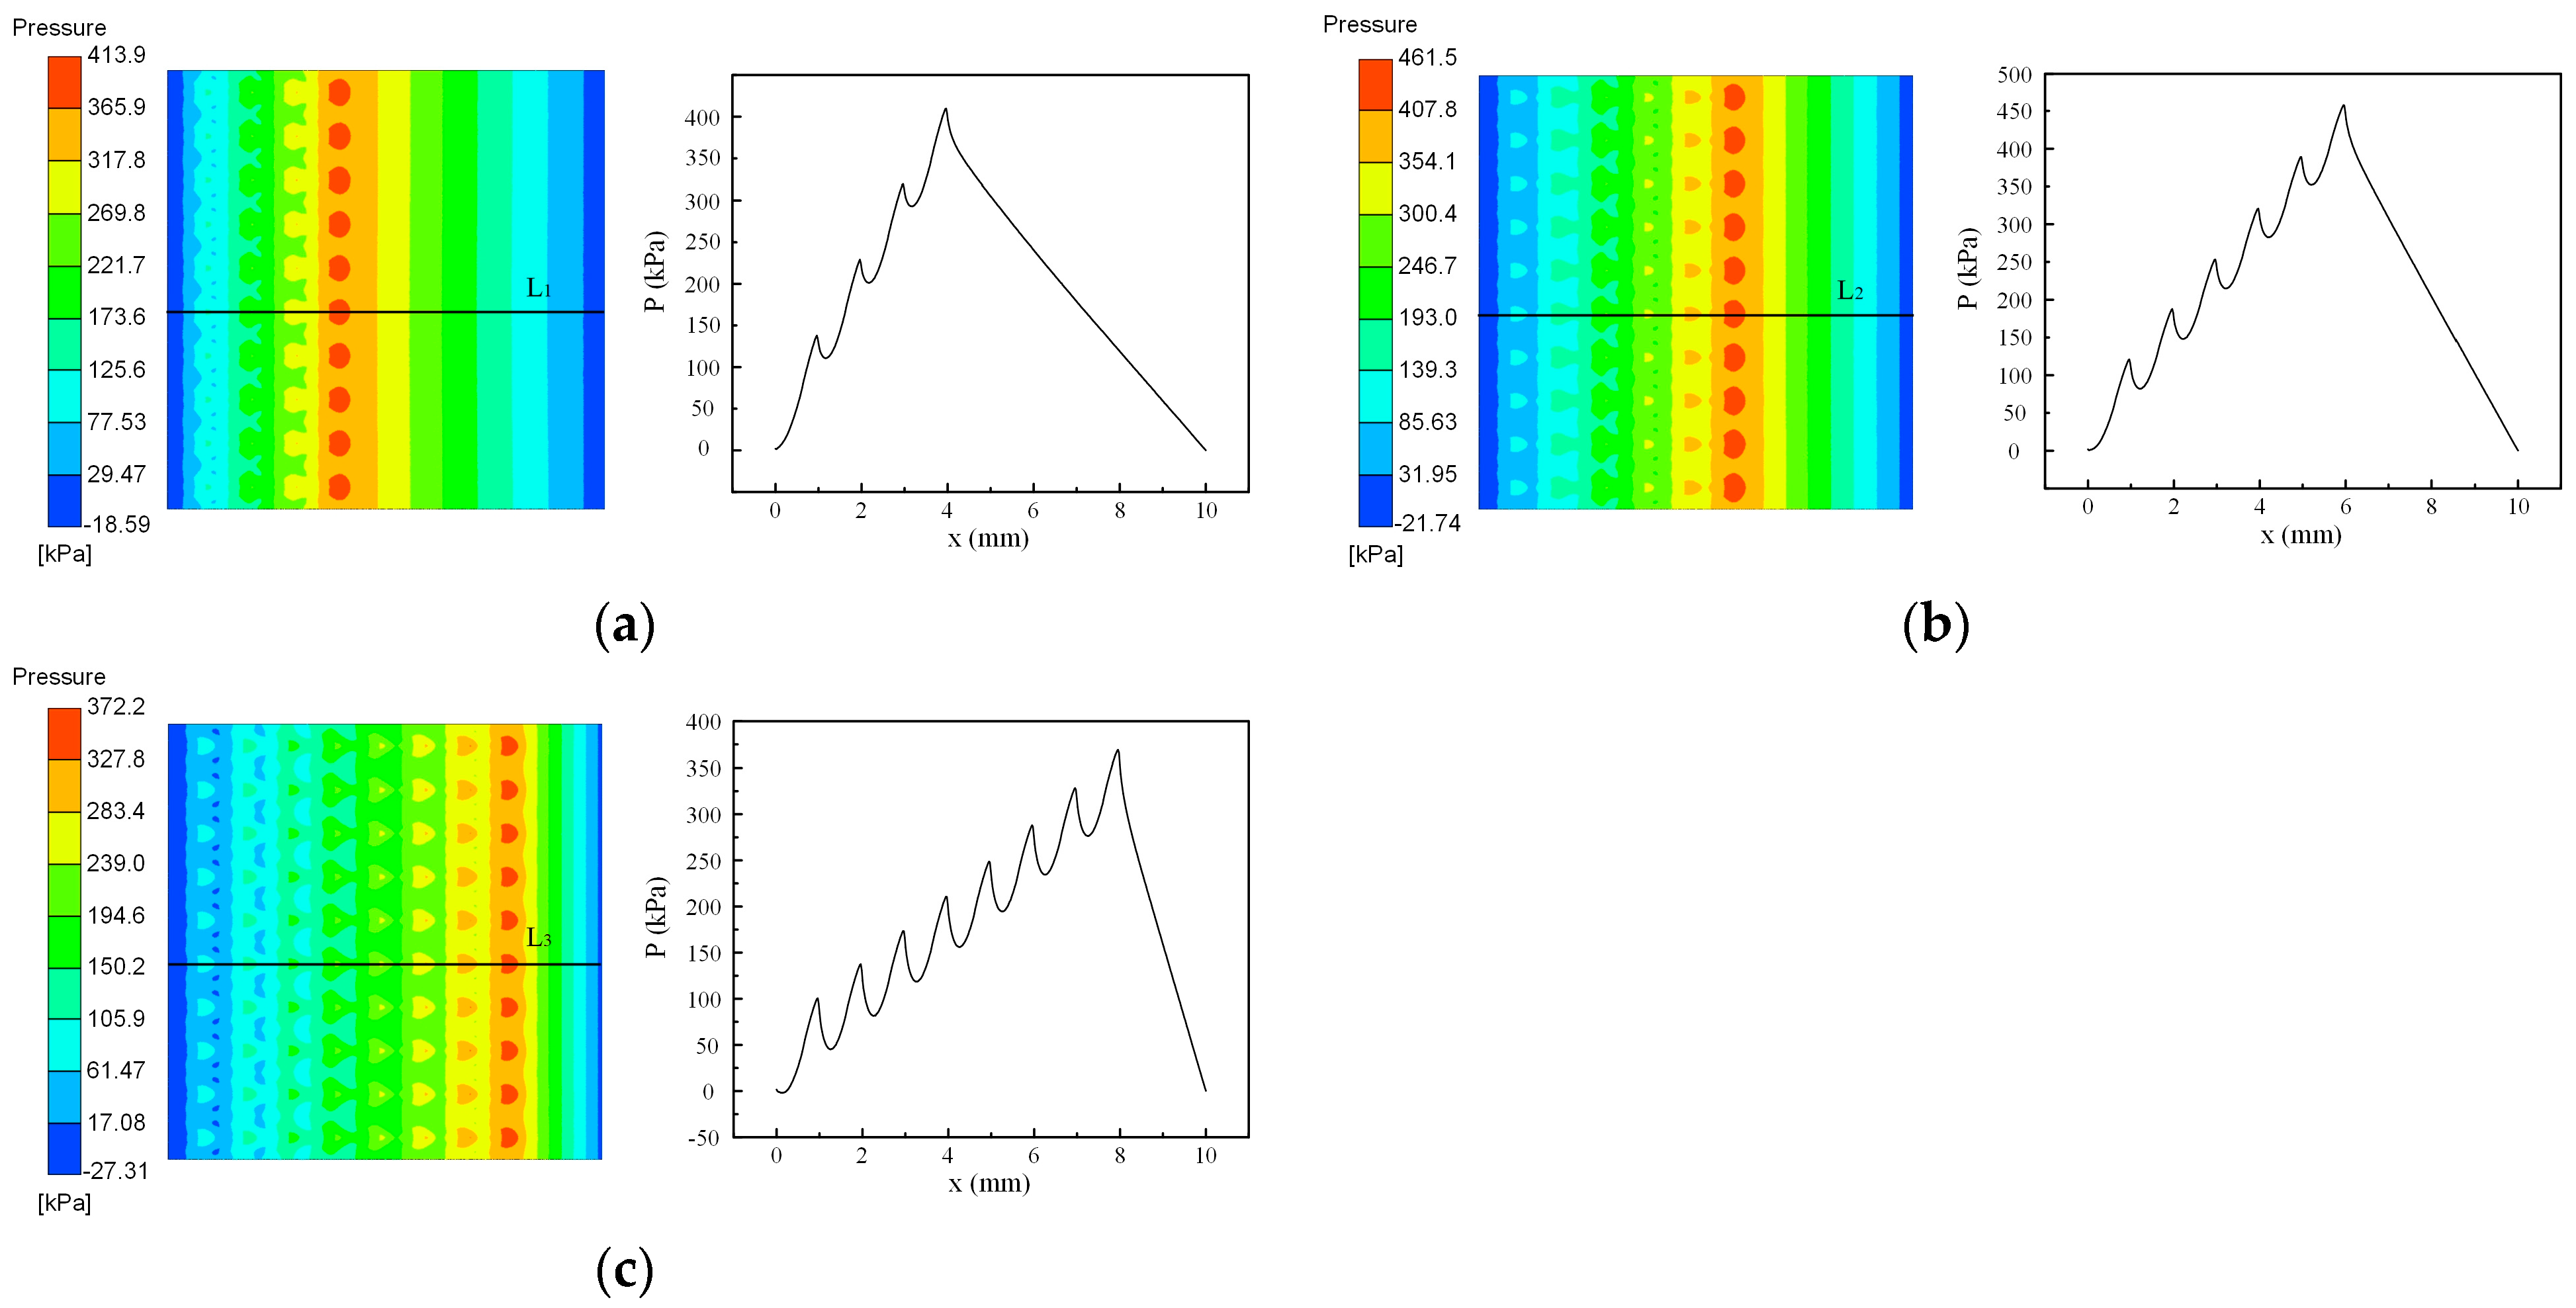
4.6. Influence of the Distribution Position of the Texture on the Lubrication Performance

The distribution position of the texture on the friction subsurface also has a significant effect on the change of the lubrication gap gradient generated by the texture. Therefore, the distribution positions of the texture were set to the flow field entrance, center and exit positions, and the effects of the V-shaped texture with different distribution positions on the lubrication performance and flow field pressure distribution were studied. The other parameters were: α = 0.53, Sp = 25.9%, hp = 13 μm, and θ = 60°, and the texture coverage was 60%. The calculated results are shown in Figure 13 and Figure 14.
Comparing the pressure change curve of the cross-section in Figure 13, it could be concluded that under the condition of constant texture coverage, as the texture distribution on the surface of the specimen approached the exit position of the flow field, the positive pressure area would be disturbed by the low-pressure area formed by the two flanks, and thus the positive pressure value tended to decrease along the sliding direction. From the pressure distribution cloud shown in Figure 13, we can see that the lubricating medium in the V-shaped texture formation of the negative pressure area of the two wings of the area of the proportion of the texture distribution positioned closer to the exit position gradually increased, when the positive and negative pressure offset effect was also correspondingly enhanced. Thus, it would make the lubrication surface of the oil film bearing capacity present a trend of reduction. When the distribution of the texture characteristics is located away from the inlet position of the flow field, the lubrication surface of the oil film in the sliding direction of the convergence effect was weakened, such that the dynamic pressure between the two interfaces led to reducing the fluid, making the friction lubrication performance worse. With the texture distribution position just in the lubricating medium formed at the entrance of the flow field, the two relative motions of the interface between the lubricating medium because of the shape of the V-shaped texture characteristics of the obvious convergence compression phenomenon, for the texture convergence gap dynamic pressure has an enhanced effect; and when the texture distribution is near the exit position, the lubricating medium in the flow of the texture dispersion gap, the formation of a larger negative pressure area, and smaller negative pressure value are observed to occur. Therefore, the lubrication effect was better when the texture was distributed in the inlet position, as shown in Figure 14.

5. Test Results and Discussion

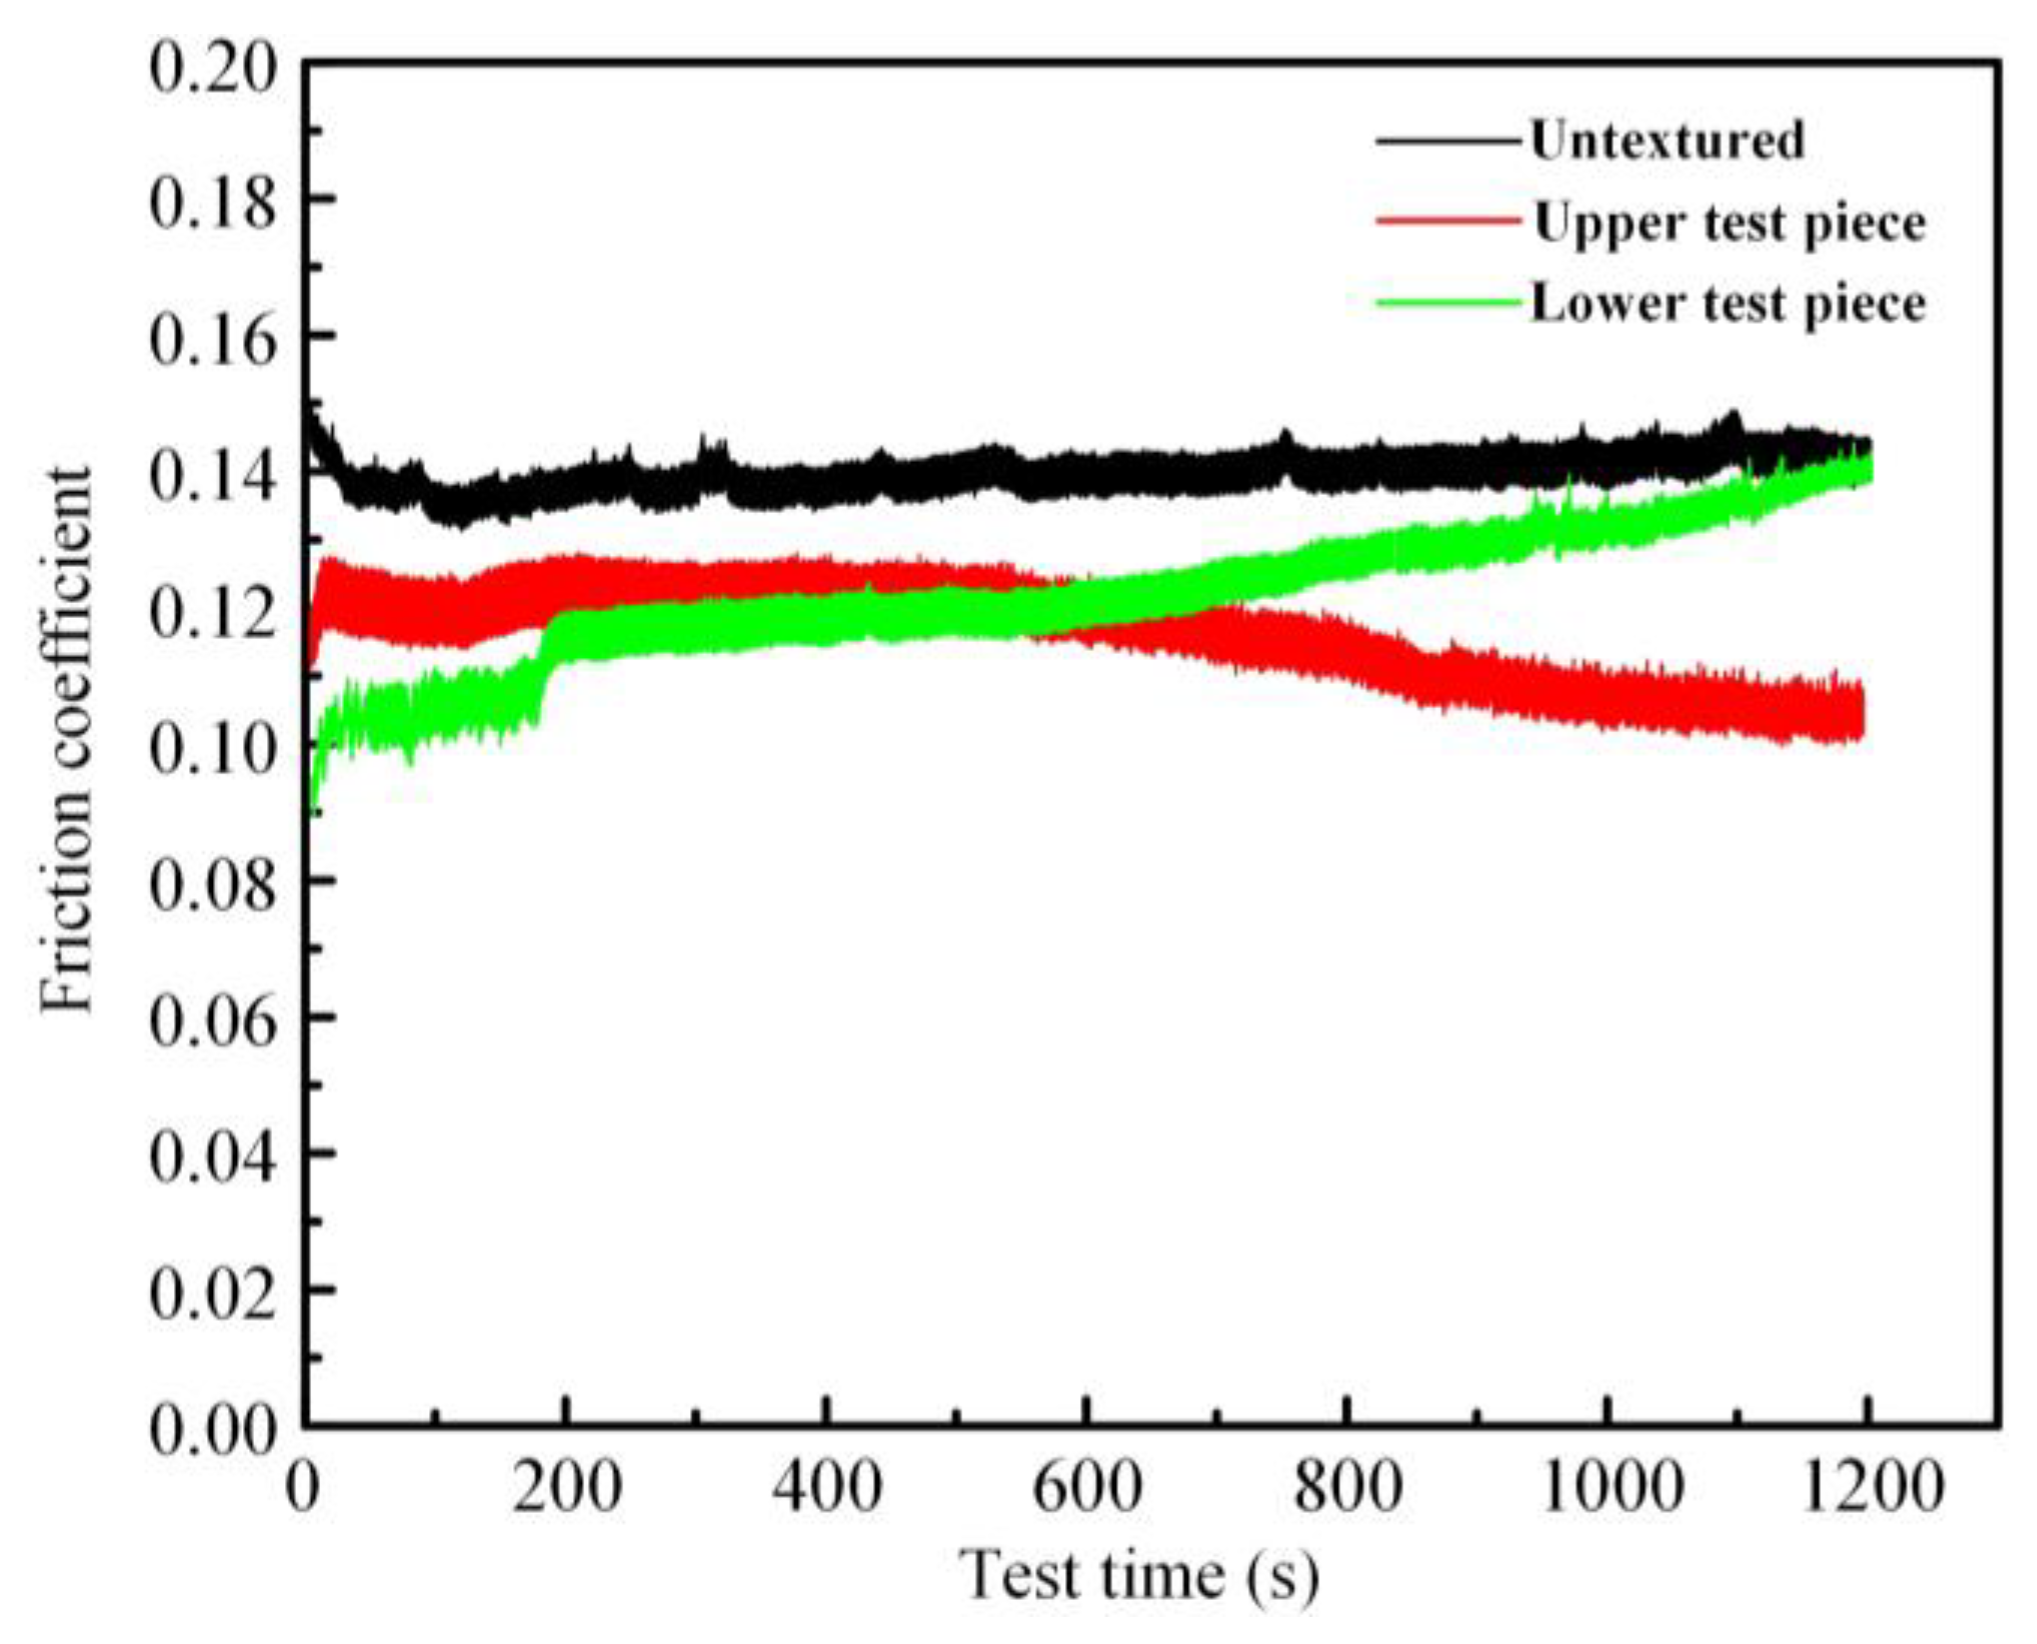
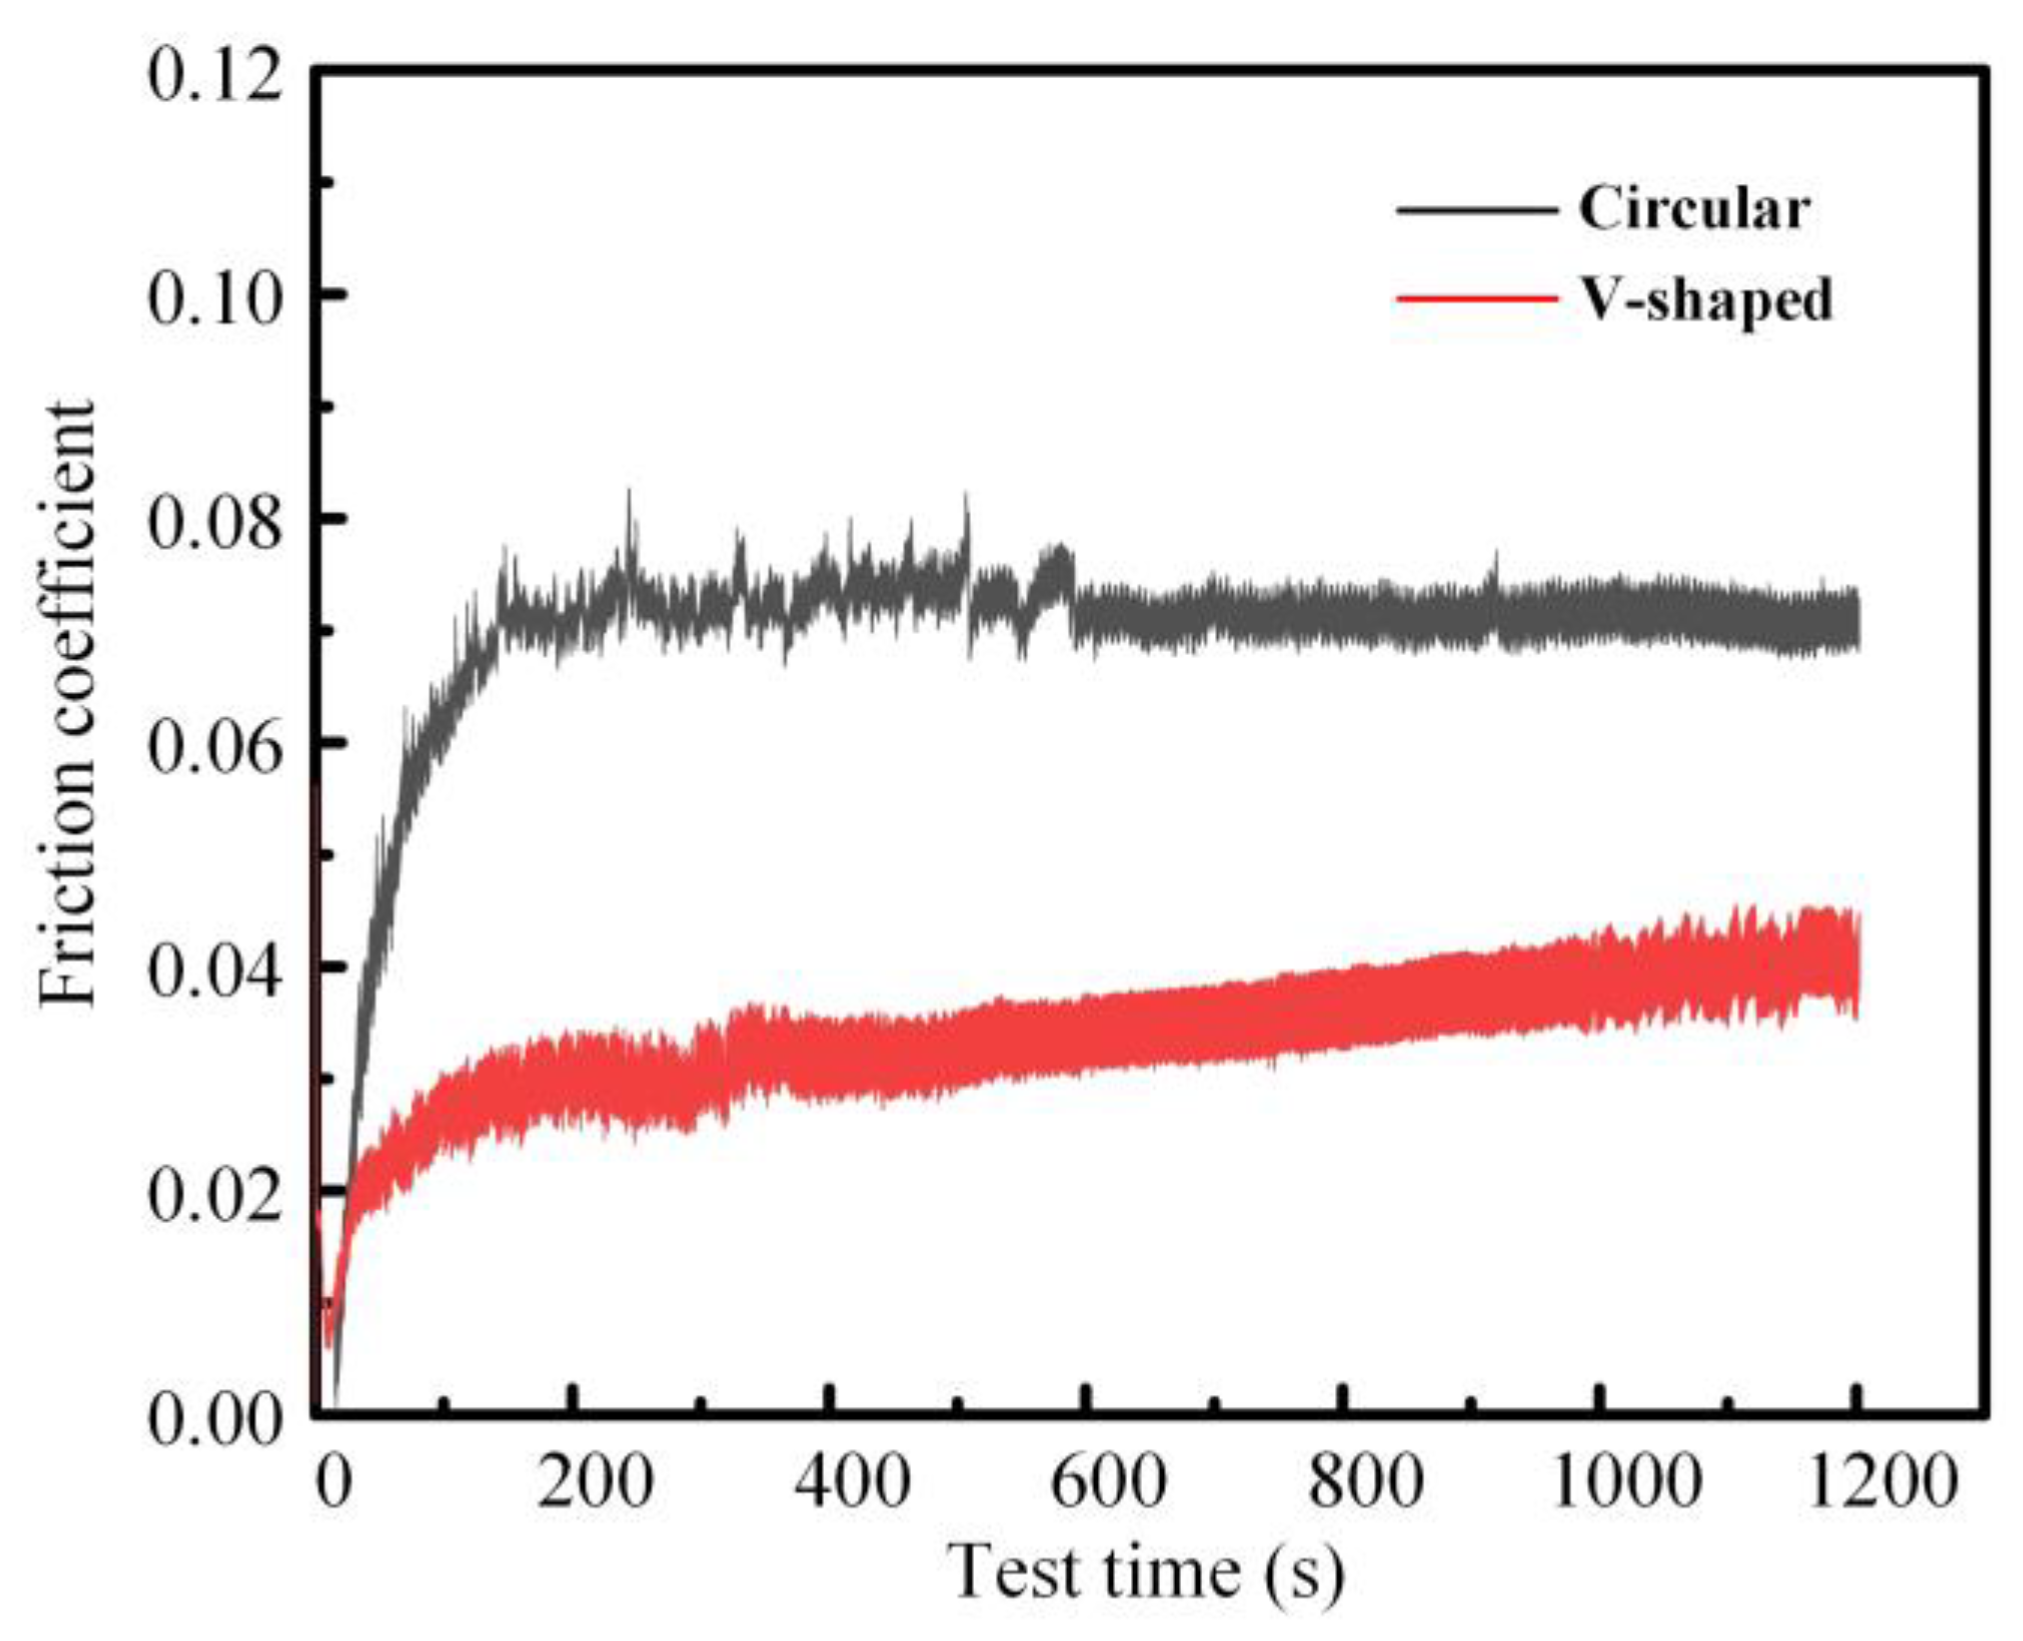
5.1. Effect of Texture Shape on Friction Coefficient

In order to study the effect of texture shape on the friction coefficient, the geometric characteristics of the V-shaped texture were set as follows: texture shape parameters α = 0.53, Sp = 25.9%, hp = 13 μm, θ = 60°, the offset distance of the pin head from the center of the disk was set to 20 mm, and the coverage of the texture characteristics in the texture structured area of the upper and lower specimen surfaces were 100%.
The test time for each group of tests was set to 20 min. During the test, the sampling frequency was set to 100 Hz. In order to reduce the error during the test, the single test results with the overall trend error within 5% of the average friction coefficient curve of each group measured under the same test conditions were taken as the research object after multiple groups of tests. Analyzing the trend of the V-texture friction coefficient curve shown in Figure 15 and comparing different friction coefficients, it could be concluded that in the pin-to-disk test, the friction coefficient was the smallest when only the V-texture was processed on the bottom surface of the upper test piece, and there was also a trend of decreasing the friction coefficient as the friction lubrication test was carried out. The friction coefficient decreased because after a period of testing, the friction and wear between the interface of the two relative movements tended to stabilize, and with the formation of a more stable lubricant film at the contact position, the oil film bearing capacity also increased, for the lubrication medium and the test piece surface between the fluid dynamic pressure has a certain enhancement effect. It is worth noting that when the crater of V-shaped texture was on the surface of the upper test piece, the dynamic pressure generated by the lubricating medium had a favorable effect on the formation, so there was a trend that the friction coefficient decreased with the increase of the test length, and when the crater of V-shaped texture was prepared only on the surface of the lower test piece, the friction coefficient was less than the test friction coefficient of the untextured surface but greater than the test friction coefficient of the upper test piece after the texture treatment. From the test results, it could be seen that the specimens with V-shaped texture on the contact surface showed good friction reduction performance in the pin-to-disk test. In addition, the friction coefficient was smaller, and the lubrication effect was better when the texture crater was prepared on the upper specimen surface.

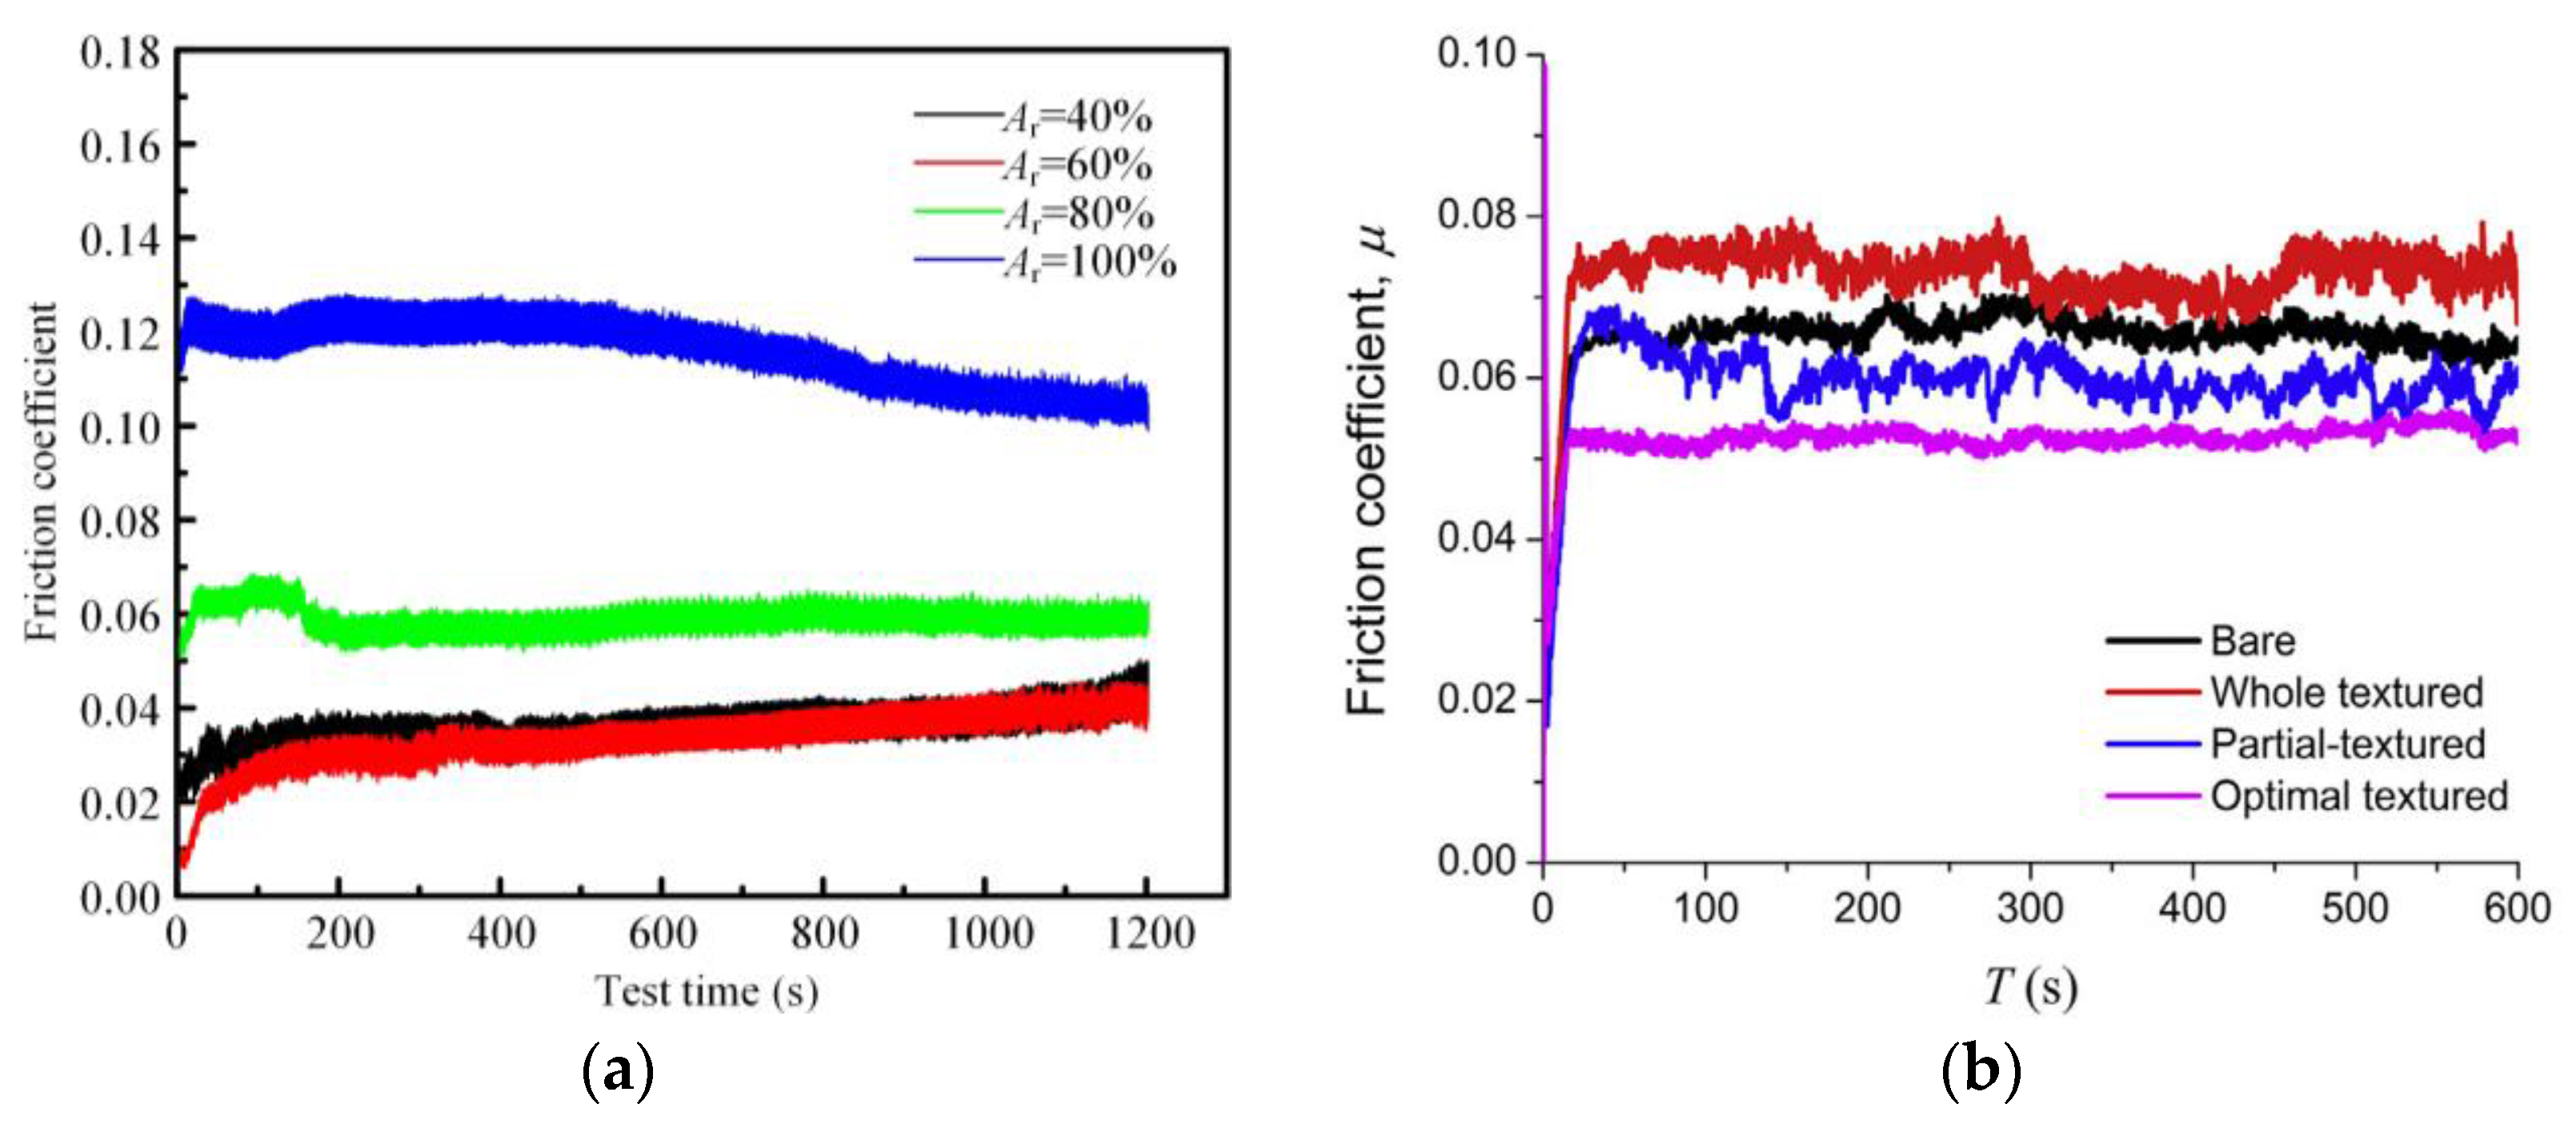
5.2. Effect of Texture Surface Coverage on the Friction Coefficient

The effect of texture coverage on the friction coefficient was studied, in which the bottom surface of the upper specimen was taken as the texture structured surface and the parameters in the test were set as follows: V-shaped texture coverage was set to 40%, 60%, 80%, and 100%, respectively. The test results and published articles are shown in Figure 16.
By comparison with Figure 16b, it can be seen that the texture friction coefficients obtained by the test results in this paper under different surface coverage rates have the same trend as the test results in published papers, which proves the correctness of the test results in this paper.
As could be seen from Figure 16, the friction coefficient on the surface of the fully texture friction subsurface was significantly higher than the partially texture surface. A possible reason for this was that the full texture could be equated to jut a simple increase in the lubrication gap, which did not have a macroscopic lubrication gap gradient effect when the texture was distributed in the lubricant inlet position. The partially distributed texture enhanced the convergence of the oil wedge, and the convergence of the lubricant film and squeezing effect was obvious, thus producing a larger fluid dynamic pressure, thus showing a better friction reduction effect. When the texture coverage was less than 60%, the friction coefficient tended to increase, which was because the texture coverage was too small to enhance the wedge of the lubricant. Thus, the experimental results showed that there was an optimum texture coverage of 60% for the V-shaped texture for the best lubrication effect, which was consistent with the numerical simulation results.

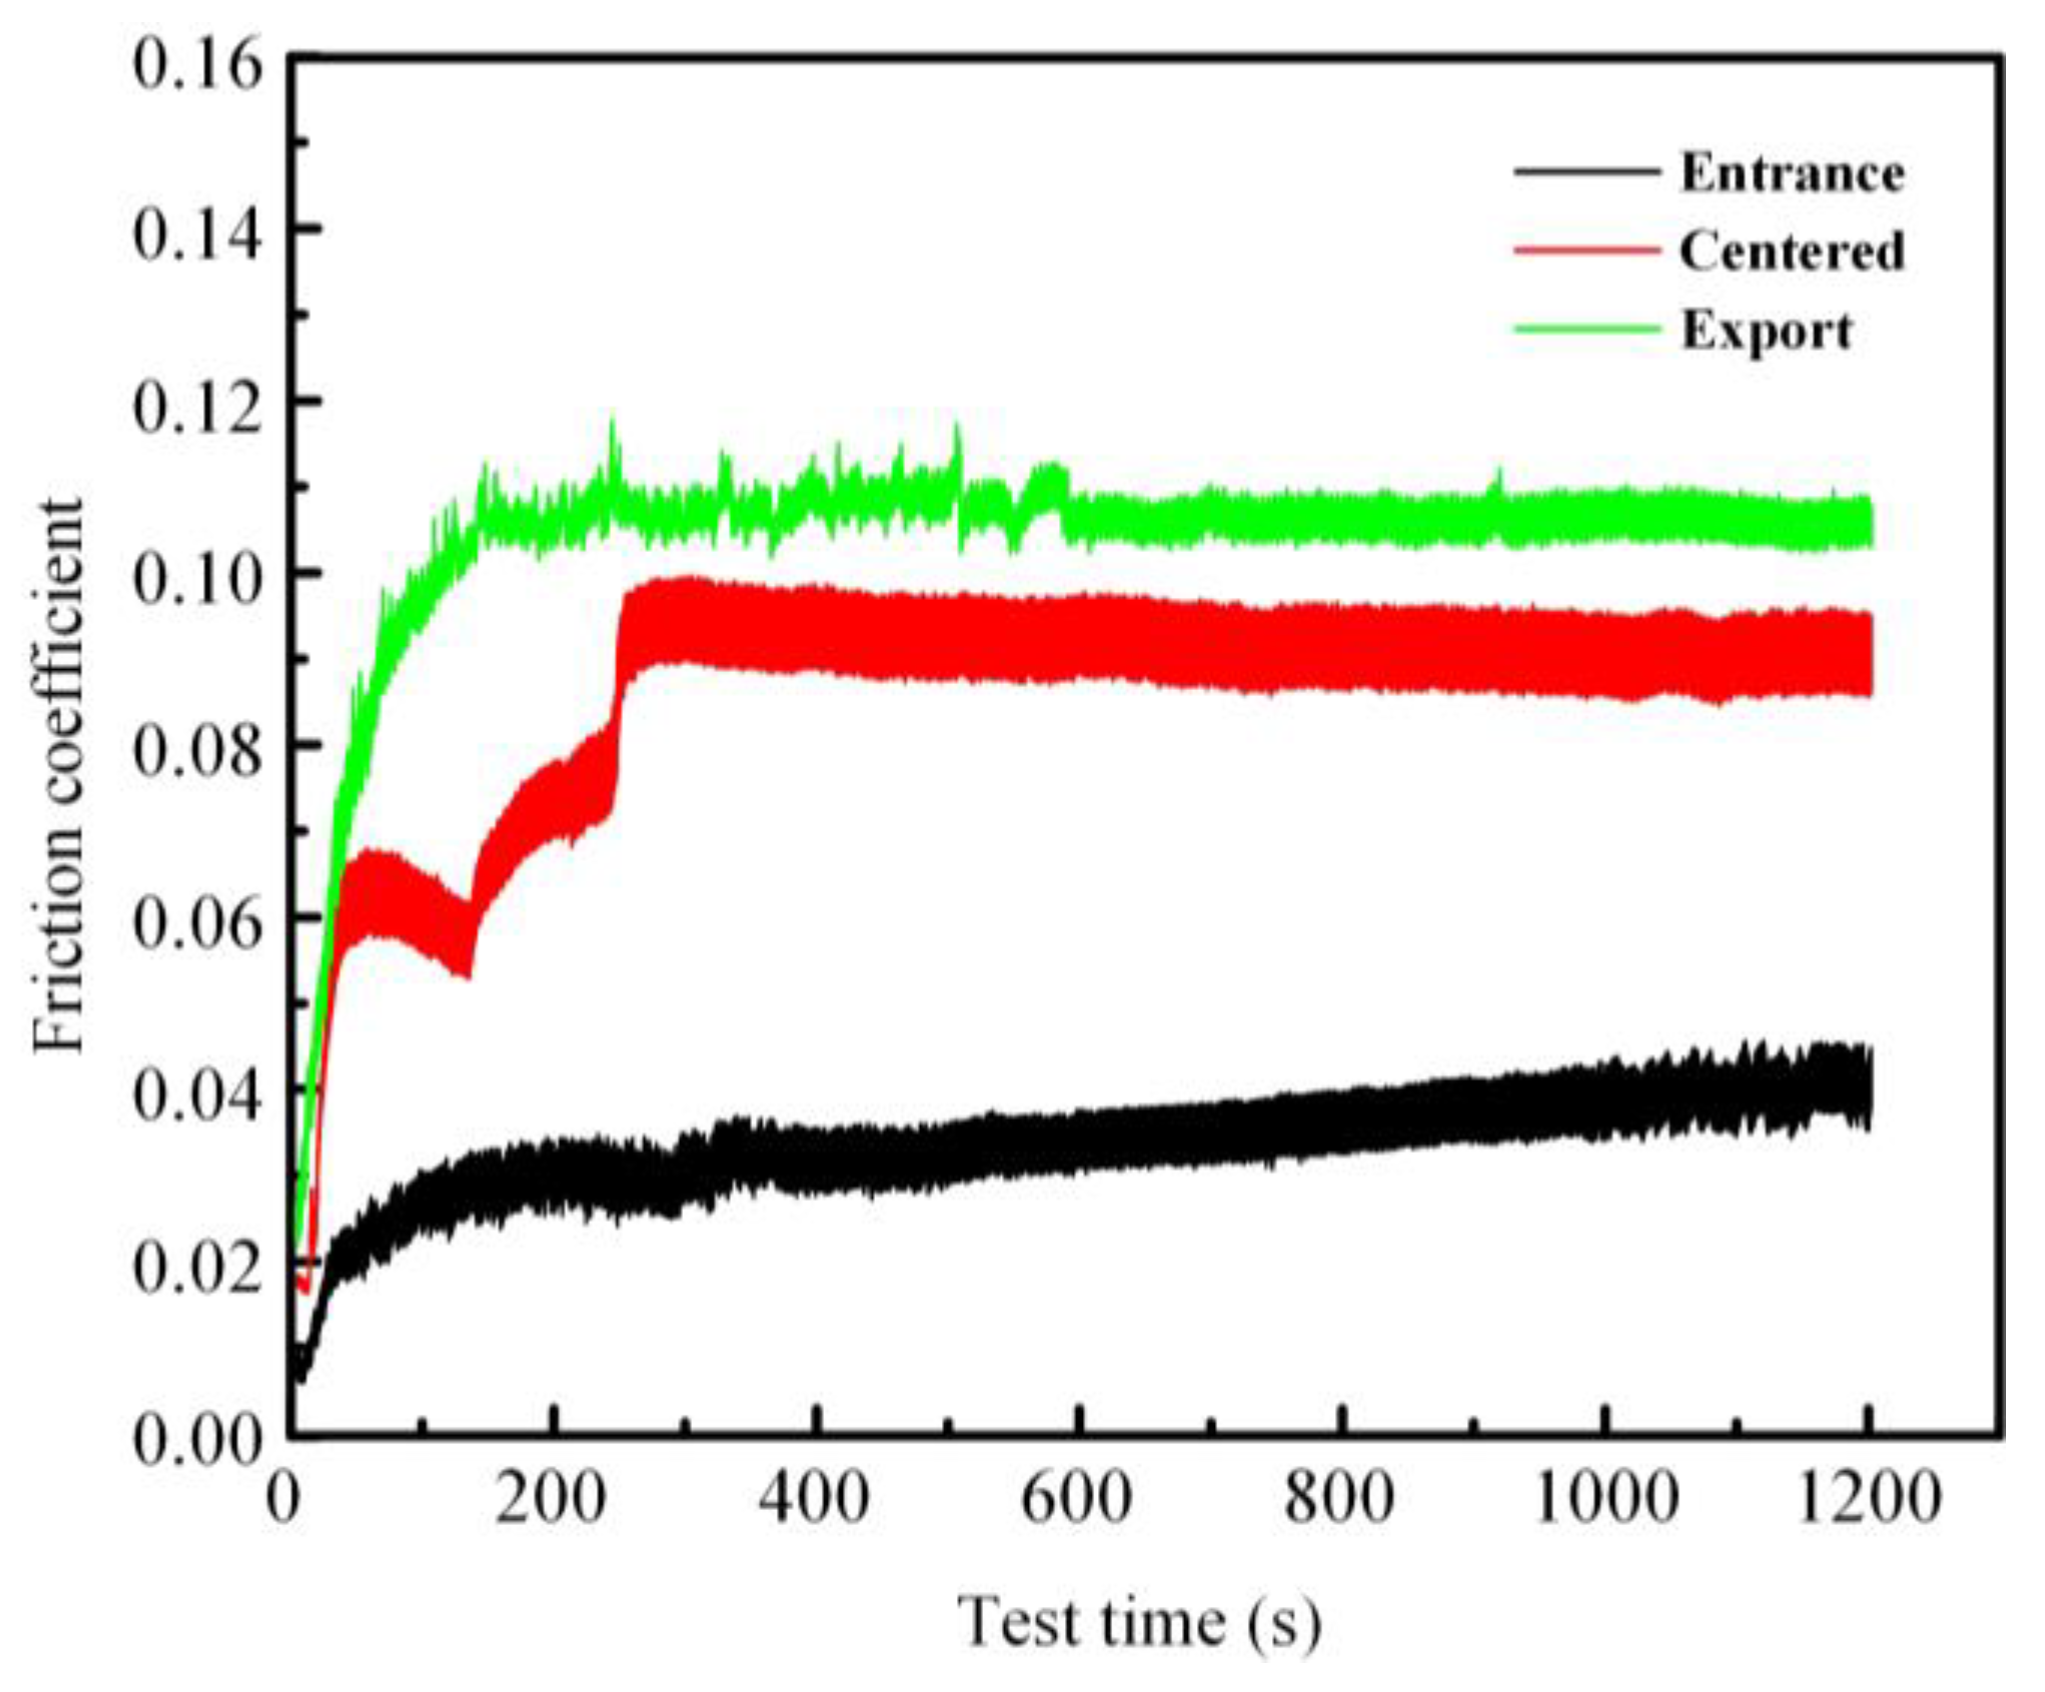
5.3. The Effect of Texture Distribution Position on the Friction Coefficient

In this group of tests, the texture structure was selected for the bottom surface of the upper test piece, texture structure processing position for the lubricating medium inlet, centered and outlet position for the test, in order to study the texture structure distribution position on the lubrication performance of the shadow, where the V-shaped texture structure coverage is 60%. Experimental test results are shown in Figure 17.
As can be seen from Figure 17, the friction coefficient was obviously the smallest when the texture was located at the inlet of the lubricating medium, the largest when the texture was located at the outlet, and the friction coefficient was in between when the texture was located in the middle position, and the experimental test results were in full agreement with the simulation results. The reason was that the influence of the texture on the lubricating oil wedge was different when the texture was located at different positions. When the texture was located at the entrance, it enhanced the convergence effect of the lubricating oil wedge. When the texture was located at the exit position, it has a negative effect on the convergence of the oil wedge.
In order to compare the effect of the V-shaped texture designed in this paper and the commonly used circular texture on the lubrication effect, the samples were prepared with the optimal texture parameters of the V-shaped texture and the circular texture, and the experimental tests were conducted under the optimal texture distribution characteristics (the texture was processed on the upper specimen surface and the distribution position was both at the entrance position). The results are shown in Figure 18. It can be seen that the V-shaped texture designed in this paper has a better lubrication effect than the circular texture under the respective optimal texture parameters and distribution characteristics.

6. Conclusions

  • Under the optimal parameter conditions, the V-shape texture designed in this paper has better lubrication characteristics than the circular texture commonly studied today, because V-shape texture has pooling and squeezing effects on the flow of lubricating medium, which is more conducive to the formation of fluid dynamic pressure.
  • V-shape texture has more abundant control parameters. The converging and squeezing effect of the V-shape texture on the lubricating medium can be optimized by optimizing the characteristic parameters, such as the angle between the two wings, shape parameter, and area ratio depth of V-shape texture, so as to achieve the best lubrication effect. The results of simulation and test show that when the V-shaped texture area rate Sp = 25.9%, the angle between the two wings θ = 60°, the shape parameter α = 0.53, and the depth hp = 8 um, the hydrodynamic pressure effect is the strongest, the vortex effect at the bottom is the weakest, and the bearing capacity provided by the oil film is the largest.
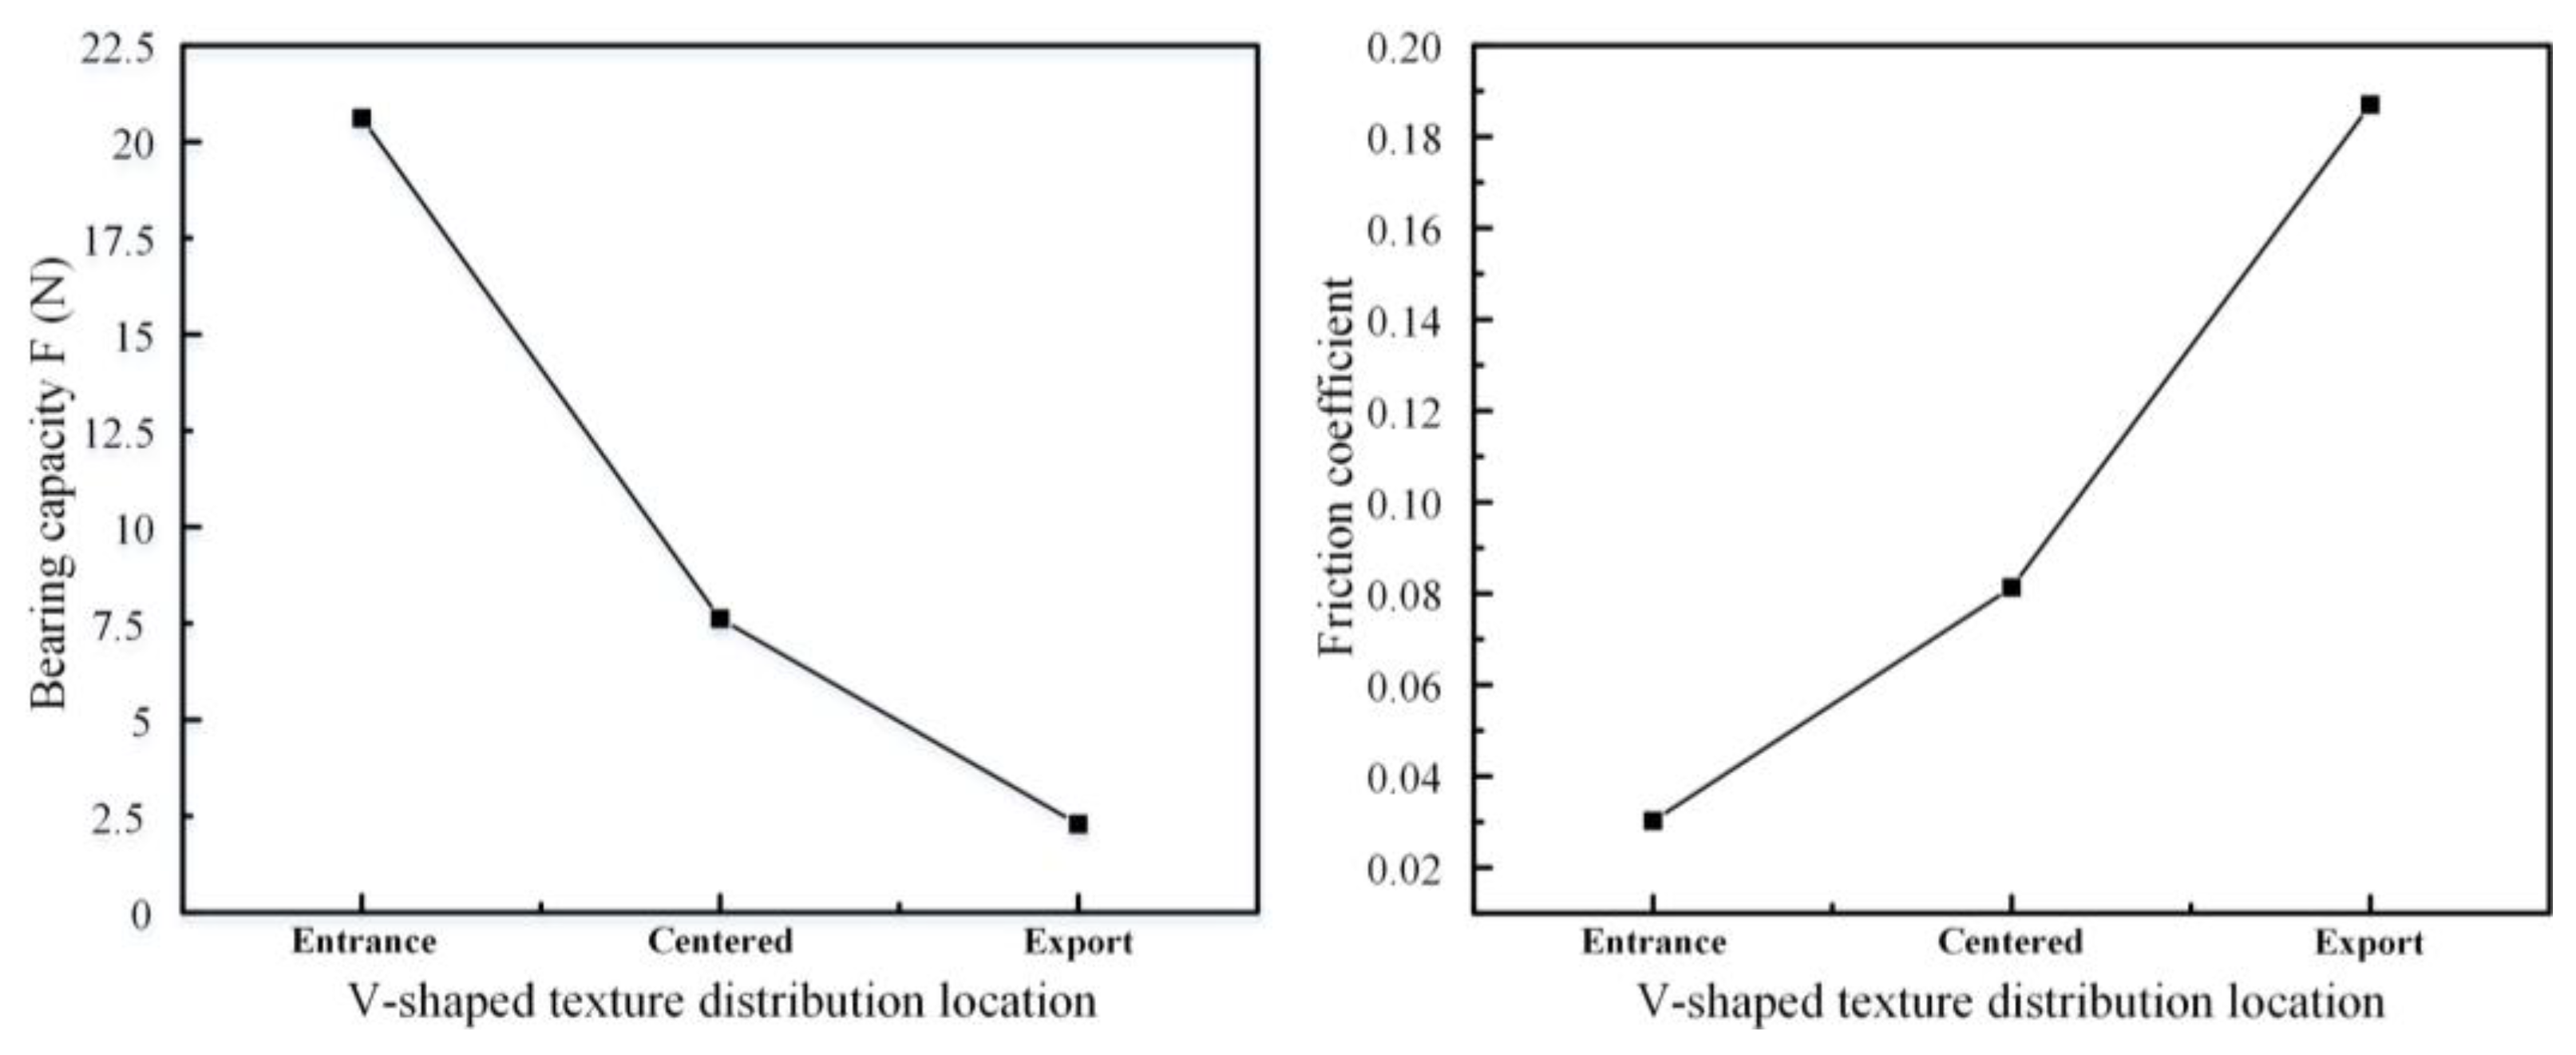
  • The distribution position of texture and the coverage rate of texture area affect the change of flow field clearance of lubricating medium, thus affecting the cavitation effect and the distribution state of high and low pressure in the flow process of lubricating medium. Under the condition that the texture position is at the entrance of flow field and the coverage rate of texture area is 60%, part of the distributed texture enhances the convergence effect of the oil wedge and has obvious convergence and extrusion effects on the lubricating oil film. As a result, the fluid dynamic pressure is greater, so it shows better antifriction effect and has the best lubrication effect.
  • Systematic theoretical research and analysis of V-shape texture provides a theoretical basis for the rational design of surface micro-texture and the influence of texture distribution characteristics on lubrication characteristics, and provides a research direction for improving lubrication performance between friction pairs under fluid lubrication and reducing the friction and wear of mechanical systems.

Author Contributions

Conceptualization and methodology, H.Q., G.G., S.Y., Q.W. and L.C.; formal analysis, H.Q. and Q.W.; supervision, H.Q. and Q.W.; writing—original draft preparation, H.Q.; writing—review and editing, H.Q., G.G. and S.Y. All authors have read and agreed to the published version of the manuscript.

Funding

This research has been Supported by the National Natural Science Foundation of China (Grant No. 51775431, 52075439 and 51905423).

Data Availability Statement

The data presented in this study are available on request from the corresponding author.

Conflicts of Interest

The authors declare no conflict of interest.

References

  1. Luo, J.B. Investigation on the origin of friction and superlutbricity. Chin. Sci. Bull. 2020, 65, 2966–2978. [Google Scholar] [CrossRef]
  2. Holmberg, K.; Erdemir, A. Influence of tribology on global energy consumption, costs and emissions. Friction 2017, 5, 263–284. [Google Scholar] [CrossRef] [Green Version]
  3. Zhao, L.X.; Zhang, B.L.; Liu, Y.; Liu, Y. State of the art for improving tribological performance based on of surface texturing technology. Tribology 2022, 42, 202–224. [Google Scholar]
  4. Gropper, D.; Wang, L.; Harvey, T.J. Hydrodynamic lubrication of textured surfaces: A review of modeling techniques and key findings. Tribol. Int. 2016, 94, 509–529. [Google Scholar] [CrossRef] [Green Version]
  5. Yu, R.F.; Chen, W. Research progress and prospect of surface texturing in industrial tribology. J. Mech. Eng. 2017, 53, 100–110. [Google Scholar] [CrossRef]
  6. Ramesh, A.; Akram, W.; Mishra, S.P.; Cannon, A.H.; Polycarpou, A.A.; King, W.P. Friction characteristics of microtextured surfaces under mixed and hydrodynamic lubrication. Tribol. Int. 2013, 57, 170–179. [Google Scholar] [CrossRef]
  7. Adjemout, M.; Andrieux, A.; Bouyer, J.; Brunetière, N.; Marcos, G.; Czerwiec, T. Influence of the real dimple shape on the performance of a textured mechanical seal. Tribol. Int. 2017, 115, 409–416. [Google Scholar] [CrossRef]
  8. Nandakumar, M.B.; Jagadish, G.B.; Harshad, N.; Jagadish, G.B. Experimental investigation of the effect of laser texturing on the used IC Engine Piston skirt. Mater. Today Proc. 2018, 5, 2773–2780. [Google Scholar] [CrossRef]
  9. Kumar, A.; Sharma, S.C. Textured conical hybrid journal bearing with ER lubricant behavior. Tribol. Int. 2019, 129, 363–376. [Google Scholar] [CrossRef]
  10. Zhang, H.; Dong, G.N.; Hua, M.; Guo, F.F.; Chin, K.S. Parametric design of surface textures on journal bearing. Ind. Lubr. Tribol. 2015, 67, 359–369. [Google Scholar] [CrossRef]
  11. Grabon, W.; Pawlus, P.; Wos, S.; Koszela, W.; Wieczorowski, M. Effects of honed cylinder liner surface texture on tribological properties of piston ring-liner assembly in short time tests. Tribol. Int. 2016, 113, 137–148. [Google Scholar] [CrossRef]
  12. Winkler, A.; Bartz, M.; Wartzack, S. Numerical Wear Modeling in the Mixed and Boundary Lubrication Regime. Lubricants 2022, 10, 334. [Google Scholar] [CrossRef]
  13. Zhang, H.; Liu, Y.; Hua, M.; Zhang, D.Y.; Qin, L.G.; Dong, G.N. An optimization research on the coverage of micro-textures arranged on bearing sliders. Tribol. Int. 2018, 128, 231–239. [Google Scholar] [CrossRef]
  14. Yu, H.W.; Huang, W.; Wang, X.L. Dimple patterns design for different circumstances. Lubr. Sci. 2013, 25, 67–78. [Google Scholar] [CrossRef]
  15. Chen, P.; Xiang, X.; Shao, T.M.; La, Y.Q.; Li, J.L. Effect of triangular texture on the tribological performance of die steel with TiN coatings under lubricated sliding condition. Appl. Surf. Sci. 2016, 389, 361–368. [Google Scholar] [CrossRef]
  16. Zhang, H.; Liu, Y.; Hafezi, M.; Hua, M.; Dong, G.N. A distribution design for circular concave textures on sectorial thrust bearing pads. Tribol. Int. 2020, 149, 105733. [Google Scholar] [CrossRef]
  17. Wang, Y.J.; Jacobs, G.; König, F.; Zhang, S.; Goeldel, V.S. Investigation of microflow effects in textures on hydrodynamic performance of journal bearings using CFD simulations. Lubricants 2023, 11, 20. [Google Scholar] [CrossRef]
  18. Shi, G.Q.; Yu, X.D.; Meng, H.; Zhao, F.H.; Wang, J.F.; Jiao, J.H.; Jiang, H. Effect of surface modification on friction characteristics of sliding bearings: A review. Tribol. Int. 2023, 177, 107937. [Google Scholar] [CrossRef]
  19. Antoszewski, B.; Kurp, P. Effect of Surface Texture on the Sliding Pair Lubrication Efficiency. Lubricants 2022, 10, 80. [Google Scholar] [CrossRef]
  20. Singh, N.; Awasthi, R.K. Influence of surface textures on the dynamic stability and performance parameters of hydrodynamic two-lobe journal bearings. Proc. Inst. Mech. Eng. Part J J. Eng. Tribol. 2022, 236, 1589–1602. [Google Scholar] [CrossRef]
  21. Nsilani Kouediatouka, A.; Ma, Q.; Liu, Q.; Mawignon, F.J.; Rafique, F.; Dong, G. Design Methodology and Application of Surface Texture: A Review. Coatings 2022, 12, 1015. [Google Scholar] [CrossRef]
  22. Hou, Q.M.; Yang, X.F.; Cheng, J.; Wang, S.R.; Duan, D.R.; Xiao, J.P.; Li, W.Y. Optimization of performance parameters and mechanism of bionic texture on friction surface. Coatings 2020, 10, 171. [Google Scholar] [CrossRef] [Green Version]
  23. Tian, G.Z.; Zhang, Y.S.; Feng, X.M.; Hu, Y.S. Focus on bioinspired textured surfaces toward fluid drag reduction: Recent progresses and challenges. Adv. Eng. Mater. 2022, 24, 2100696. [Google Scholar] [CrossRef]
  24. Chen, L.P.; Zhang, Y.C.; Cui, Y.H.; Wang, J.; Wang, M.F. Effects of Snake-Bioinspired Surface Texture on the Finger-Sealing Performance under Varied Working Conditions. Machines 2022, 10, 569. [Google Scholar] [CrossRef]
  25. Liu, Y.; Zhang, H.; Dai, S.J.; Dong, G.N. Designing a bioinspired scaly textured surface for improving the tribological behaviors of starved lubrication. Tribol. Int. 2022, 173, 107594. [Google Scholar] [CrossRef]
  26. Balani, K.; Batista, R.G.; Lahiri, D.; Agarwal, A. The hydrophobicity of a lotus leaf: A nanomechanical and computational approach. Nanotechnology 2009, 20, 305707. [Google Scholar] [CrossRef] [Green Version]
  27. Mo, M.T.; Zhao, W.J.; Chen, Z.F.; Zhixiang, Z.; Xuedong, W.; Qunji, X. Research status of marine drag reduction technologies. Tribology 2015, 35, 505–515. [Google Scholar]
  28. Liang, Y.N.; Wang, C.Y.; Zhang, Z.Y.; Zhang, Z.P.; Wang, W.; Xing, H.; Guan, T.Y.; Gao, D.R. Simulation Study on Bearing Lubrication Mechanism and Friction Characteristics of the Biomimetic Non-Smooth Surface of a Cross-Scale, Second-Order Compound Microstructure. Lubricants 2023, 11, 77. [Google Scholar] [CrossRef]
  29. Uddin, M.S.; Liu, Y.W. Design and optimization of a new geometric texture shape for the enhancement of hydrodynamic lubrication performance of parallel slider surfaces. Biosurf. Biotribol. 2016, 2, 59–69. [Google Scholar] [CrossRef] [Green Version]
  30. Long, R.S.; Zhao, C.; Zhang, Y.M.; Wang, Y.B.; Wang, Y.Y. Effect of vein-bionic surface textures on the tribological behavior of cylindrical roller thrust bearing under starved lubrication. Sci. Rep.-UK. 2021, 11, 21238. [Google Scholar] [CrossRef]
  31. Tu, Z.R.; Meng, X.K.; Ma, Y.; Peng, X.D. Shape optimization of hydrodynamic textured surfaces for enhancing load-carrying capacity based on level set method. Tribol. Int. 2021, 162, 107136. [Google Scholar]
  32. Abdel-Aal, H.A. Surface structure and tribology of legless squamate reptiles. J. Mech. Behav. Biomed. 2018, 79, 354–398. [Google Scholar] [CrossRef] [PubMed]
  33. Pattnayak, M.R.; Pandey, R.K.; Dutt, J.K. Performance improvement of an oil-lubricated journal bearing using bionic-textures fused micro-pockets. J. Tribol. 2021, 144, 041804. [Google Scholar] [CrossRef]
  34. Shen, C.; Khonsari, M.M. Numerical optimization of texture shape for parallel surfaces under unidirectional and bidirectional sliding. Tribol. Int. 2015, 82, 1–11. [Google Scholar] [CrossRef]
  35. Shen, Z.; Wang, F.; Chen, Z.; Ruan, X.; Zeng, H.; Wang, J.; An, Y.; Fan, X. Numerical simulation of lubrication performance on chevron textured surface under hydrodynamic lubrication. Tribol. Int. 2021, 154, 106704. [Google Scholar] [CrossRef]
  36. Sharma, S.; Sharma, A.; Jamwal, G.; Awasthi, R.K. The effect of V-shape protruded and dimple textured on the load-carrying capacity and coefficient of friction of hydrodynamic journal bearing: A comparative numerical study. Proc. Inst. Mech. Eng. Part J J. Eng. Tribol. 2020, 235, 997–1011. [Google Scholar] [CrossRef]
  37. Miao, C.W.; Guo, Z.W.; Yuan, C.Q. Effects of bionic multi-scales groove textures on surface tribological properties. Chin. Surf. Sci. 2019, 32, 22–30. [Google Scholar]
  38. Goblas, D.G.; Fatu, A.; Maoui, A.; Hajjam, M. Manufacturing textured surfaces: State of art and recent developments. Proc. Inst. Mech. Eng. Part J J. Eng. Tribol. 2015, 229, 3–29. [Google Scholar]
  39. Ahmed, A.; Masjuki, H.H.; Varman, M.; Kalam, M.A.; Mahmud, K.A.H. An overview of geometrical parameters of surface texturing for piston/cylinder assembly and mechanical seals. Meccanica 2016, 51, 9–23. [Google Scholar] [CrossRef]
  40. Wang, J.H.; Yan, Z.J.; Shen, Z.Y.; Pan, X.X. Three-dimensional CFD Analysis of the Influence of Surface Texture Morphology Parameters on Lubrication Performance. Lub. Eng. 2021, 46, 37–43+60. [Google Scholar]
  41. Zhang, H.; Hua, M.; Dong, G.N.; Zhang, D.Y.; Chin, K.S. A mixed lubrication model for studying tribological behaviors of surface texturing. Tribol. Int. 2016, 93, 583–592. [Google Scholar] [CrossRef]
Figure 1. Calculation model diagram. (a) Different shapes of micro-texture models (b) Texture distribution model.
Lubricants 11 00139 g001
Figure 2. Picture of upper and lower specimens.
Lubricants 11 00139 g002
Figure 3. Textures etched through laser processing on the test piece. (a) Upper test piece (b) lower test piece.
Lubricants 11 00139 g003
Figure 4. Friction and wear testing machine.
Lubricants 11 00139 g004
Figure 5. Maximum positive and negative pressure value change curve of V−shaped texture under different area ratios.
Lubricants 11 00139 g005
Figure 6. Maximum positive and negative pressure value and pressure change curve of circular texture under different area ratios.
Lubricants 11 00139 g006
Figure 7. Maximum positive and negative pressure value and pressure change curve of V−shaped texture with different angles between sides: (a) Maximum positive and negative pressure value change curve; (b) Center section pressure variation curve; (c) Pressure distribution on cross-sectionalarea of the dimple unit provided by Wang et al. [40].
Lubricants 11 00139 g007
Figure 8. Maximum positive and negative pressure value and pressure change curve of V−shaped texture under different shape parameters: (a) Pressure variation curve of central section; (b) Maximum positive and negative pressure value change curve.
Lubricants 11 00139 g008
Figure 9. Maximum positive and negative pressure value and pressure change curve of V−shaped texture with different depths: (a) Pressure variation curve of central section; (b) Maximum positive and negative pressure value change curve.
Lubricants 11 00139 g009
Figure 10. Maximum positive and negative pressure value and pressure change curve of circular texture with different depths: (a) Pressure variation curve of central section; (b) Maximum positive and negative pressure value change curve.
Lubricants 11 00139 g010
Figure 11. Pressure distribution cloud diagram (left) and cross−sectional pressure change curve (right) of V−shaped texture under different coverage. (L1/L2/L3 are the cross-sectional center value) (a) A = 40%; (b) A = 60%; (c) A = 80%.
Lubricants 11 00139 g011
Figure 12. Bearing capacity of oil film and friction coefficient variation curves of V−shaped texture under different coverage.
Lubricants 11 00139 g012
Figure 13. Pressure distribution cloud diagram (left) and cross−sectional pressure change curve (right) of V−shaped texture at different distribution positions. (L4/L5 are the cross-sectional center value) (a) Textures arranged at the center of friction surface (b) Textures arranged at the exit.
Lubricants 11 00139 g013
Figure 14. Bearing capacity of oil film and friction coefficient variation curves of V−shaped texture at different distribution positions.
Lubricants 11 00139 g014
Figure 15. Friction coefficient curves of V−shaped texture.
Lubricants 11 00139 g015
Figure 16. (a) Friction coefficient curves of surface V−shaped textures with different coverage; (b) Different coverage test results provided by Zhang et al. [41].
Lubricants 11 00139 g016
Figure 17. Friction coefficient curves of V−shaped texture with different distribution positions.
Lubricants 11 00139 g017
Figure 18. Friction coefficient curves of textures with different shapes at the entrance.
Lubricants 11 00139 g018
Table 1. UMT-2 friction and wear testing machine parameters.
NameScope of WorkAccuracy
Sensor0–200 N10 mN
Vertical displacement mechanism0–10 mm/s0.1 mm/s
Horizontal displacement mechanism0–10 mm/s0.1 mm/s
Principal axis of rotation0–5000 rev/min0.1 rev/min
Disclaimer/Publisher’s Note: The statements, opinions and data contained in all publications are solely those of the individual author(s) and contributor(s) and not of MDPI and/or the editor(s). MDPI and/or the editor(s) disclaim responsibility for any injury to people or property resulting from any ideas, methods, instructions or products referred to in the content.

