Study on Adhesion Force of Graphene under Cylinder–Plane Contact


1
School of Mechanical and Automotive Engineering, South China University of Technology, Guangzhou 510640, China
2
School of Electrical Engineering, Guangzhou Railway Polytechnic, Guangzhou 510430, China
*
Author to whom correspondence should be addressed.
Lubricants 2023, 11(3), 126; https://doi.org/10.3390/lubricants11030126
Submission received: 16 February 2023
/
Revised: 4 March 2023
/
Accepted: 9 March 2023
/
Published: 10 March 2023
(This article belongs to the Special Issue Assessment of Adhesive Wear)
Abstract
:There are many cylinder–plane contacts in microaccelerators, microgyroscopes, and RF switches. Adhesion is one of the main factors affecting the manufacture and use of these micro–nano devices, but its research is insufficient. Graphene is expected to be used in these fields due to its excellent electrical and mechanical properties. Therefore, it is significant to research the adhesion force of graphene under cylinder–plane. Firstly, the meniscus formation process was introduced using the variable-water-contact-angle method. Secondly, the adhesion force of the graphene surface was measured with a cylindrical atomic-force-microscope probe. Finally, the contact area was considered as a number of nanoscale cylinders in contact with the plane, and the adhesion force of the cylinder–plane model was obtained. The results showed that there was a maximum adhesion force at a relative humidity of 65%. The adhesion force was evidently not time-dependent when the relative humidity was below 45%, because the meniscus cannot be formed on the graphene surface at low relative humidity. While the graphene contact surface formed a meniscus for higher relative humidity, and the adhesion force-versus-time curves first increased and then decreased to stability. Moreover, the relationship between adhesion force and substrate contact angle, roughness, relative humidity, and dwell time was established, and the number of cylinders was determined. The error between the modified theoretical model and the experimental values was only 6%.
1. Introduction
Graphene has a broad application prospect in the fields of microelectronics, nanoelectrical systems (NEMS), and sensors because it has high conductivity, mechanical strength, and stiffness [1,2]. For example, graphene has been used for chip communication due to its high-frequency bandwidth [3]. Graphene can not only be used as an electrode in the microthruster of nanosatellites, but also significantly enhances damping and improves system performance [4]. In addition, graphene was transferred to a SiOx/Si substrate to fabricate field-effect transistors [5]. It was proposed that adhesion was an important issue to be considered in the processing and use of these micro–nano devices [6,7]. Therefore, it is necessary to research the influencing factors of the adhesion force of graphene surface [8,9].
The atomic-force microscope (AFM) can be used to scan the sample surface topography and detect adhesion force [10,11]. When the AFM probe is improved into different geometries, it can detect the adhesion force of the sphere–plane, cone–plane, projectile–plane, and cylinder–plane [12]. The effect of dwell time and the material properties on the adhesion force can also be studied by AFM [13]. AFM has become a mature method for the study of adhesion force [3].
Adhesion force was found to have a strong dependence on relative humidity (RH) for SiO2 but not on the hydrophobic sample [14]. In general, when there was a meniscus in the contact area, the capillary force dominated the adhesion force [15]. Lai et al. [16] pointed out that when RH was low, meniscus formation was mainly due to capillary condensation, and when RH was high, liquid flow on the sample surface played the main role in meniscus formation. Obata et al. [17] proposed a micromanipulation method to change the adhesion force through adjusting the volume of the liquid bridge, because the smaller volume of the meniscus liquid led to a larger adhesion force. The dynamic growth of the meniscus was determined by the condensation of water vapor and the evaporation of water [18]. Weeks et al. [19] directly measured that the meniscus volume increased with the increase in RH. Therefore, the correlation between RH and adhesion force needs to be studied.
In terms of experimental research, the change in the adhesion force of cylindrical fiber in oblique contact with different liquids was studied by an AFM experiment, but the situation in which there is no space between the cylindrical fiber and the plane has not studied [20]. Yang et al. [21] found that capillary condensation in the nanochamber increased with the increase in humidity, and it was proved that the modified Kelvin equation was still practical at the nano scale. The influence factors of adhesion force of silicon on cylinder–plane contact were studied, it was shown that the actual contact area was not equal to the apparent contact area [22]. Moreover, Çolak et al. [23] used a cylinder–plane probe to measure the adhesion force of silicon surfaces with different roughness. It was found that the adhesion force is strongly dependent on RH, there is a maximum value at RH = 70%, and the smoother the surface corresponds to less adhesion force. Although there are a few experimental studies on the adhesion of cylinder–plane contact at present, the mechanism of change in adhesion needs further study.
Theoretically, the capillarity force of two planes was also obtained based on the volume-change law of the liquid bridge [24]. The change rule of adhesion force under different geometric contacts was calculated according to the different meniscus radius of the liquid bridge, and it was found that when the liquid-bridge volume increased, the adhesion force of the plane–plane contact increased faster than other contact models [25]. De Souza et al. [26] showed that the greater the difference between the two contact angles of the top and bottom surfaces, the lower the adhesion force. In addition, subdividing the liquid bridge between two planes into countless smaller liquid bridges increased the total adhesion force, and the capillary force of the hydrophobic surface could even change from repulsion to attraction [27]. The above studies refer to the adhesion force of the plane–plane model, which is different from the cylinder–plane contact, because the liquid bridge may exist around the cylinder, not just below the upper plane. Butt et al. [28] combines cone–plane contact with cylinder–plane contact, and uses cylinder–plane contact to calculate the value and change in adhesion under high humidity (RH ≥ 86%). However, these calculation results have not been verified by experiments. Depending on the type of contact, for the cone, the adhesion increases with RH; for the cylinder, it decreases; and for the sphere, it is relatively constant [29].
In comb microaccelerators and micromachined gyroscopes, one of the main factors leading to the failure of MEMS devices is the lateral adhesion between the combs, and the adhesion between the comb and substrate; evidently, the cylinder–plane contact is more common [30,31]. RF MEMS switches are a new type of MEMS device, and the adhesion force of the contact points is also an important indicator of design and use [32]. These kinds of adhesion sensors can reduce the adhesion force by heating, but the adhesion mechanism in the atmosphere is insufficiently studied at present [33]. It can be seen that in the manufacture and use of micro–nano devices, cylinder–plane contact has a wide range of application scenarios. Graphene was expected to be used in these fields due to its excellent electrical and mechanical properties [34,35]. Compared with other contact types, its adhesion mechanism and theoretical model are usually ignored. Therefore, the relationship between the time dependence and RH of cylinder–plane contact in the atmospheric environment is urgent and critical.
The dwell time was an important factor affecting adhesion. It was reported that the adhesion-force-versus-time curve had a maximum value and then reached equilibrium in a certain range of RH [36]. At 10–80% of RH, the contact-time-dependence of the adhesion force was logarithmic, but did not depend on the RH of 90% [37]. Lai et al. [38] pointed out that silica/graphene adhesion force had no time dependence in the atmospheric environment. Sirghi [39] demonstrated that the meniscus force increased with the contact time, and the characteristic time for the meniscus to reach thermodynamic equilibrium was 10 ms. However, the above relationship between dwell time and adhesion fore sometimes is inconsistent, and there are few studies on the effect of dwell time on cylinder–plane adhesion force at present.
In this paper, based on the cylinder–plane contact model, the surface-adhesion force of graphene was measured using a cylindrical AFM probe. First, the formation process of the meniscus in the contact area of the cylindrical AFM probe was introduced with the variable-water-contact-angle (VWCA) method, and the adhesion force as a function of dwell time and the RH under cylinder–plane contact were studied. Finally, the theoretical calculation model was modified in combination with the roughness calculation model of the van der Waals (vdW) force with the modified Rumpf model.
2. Materials and Methods
2.1. Preparation of Experiment
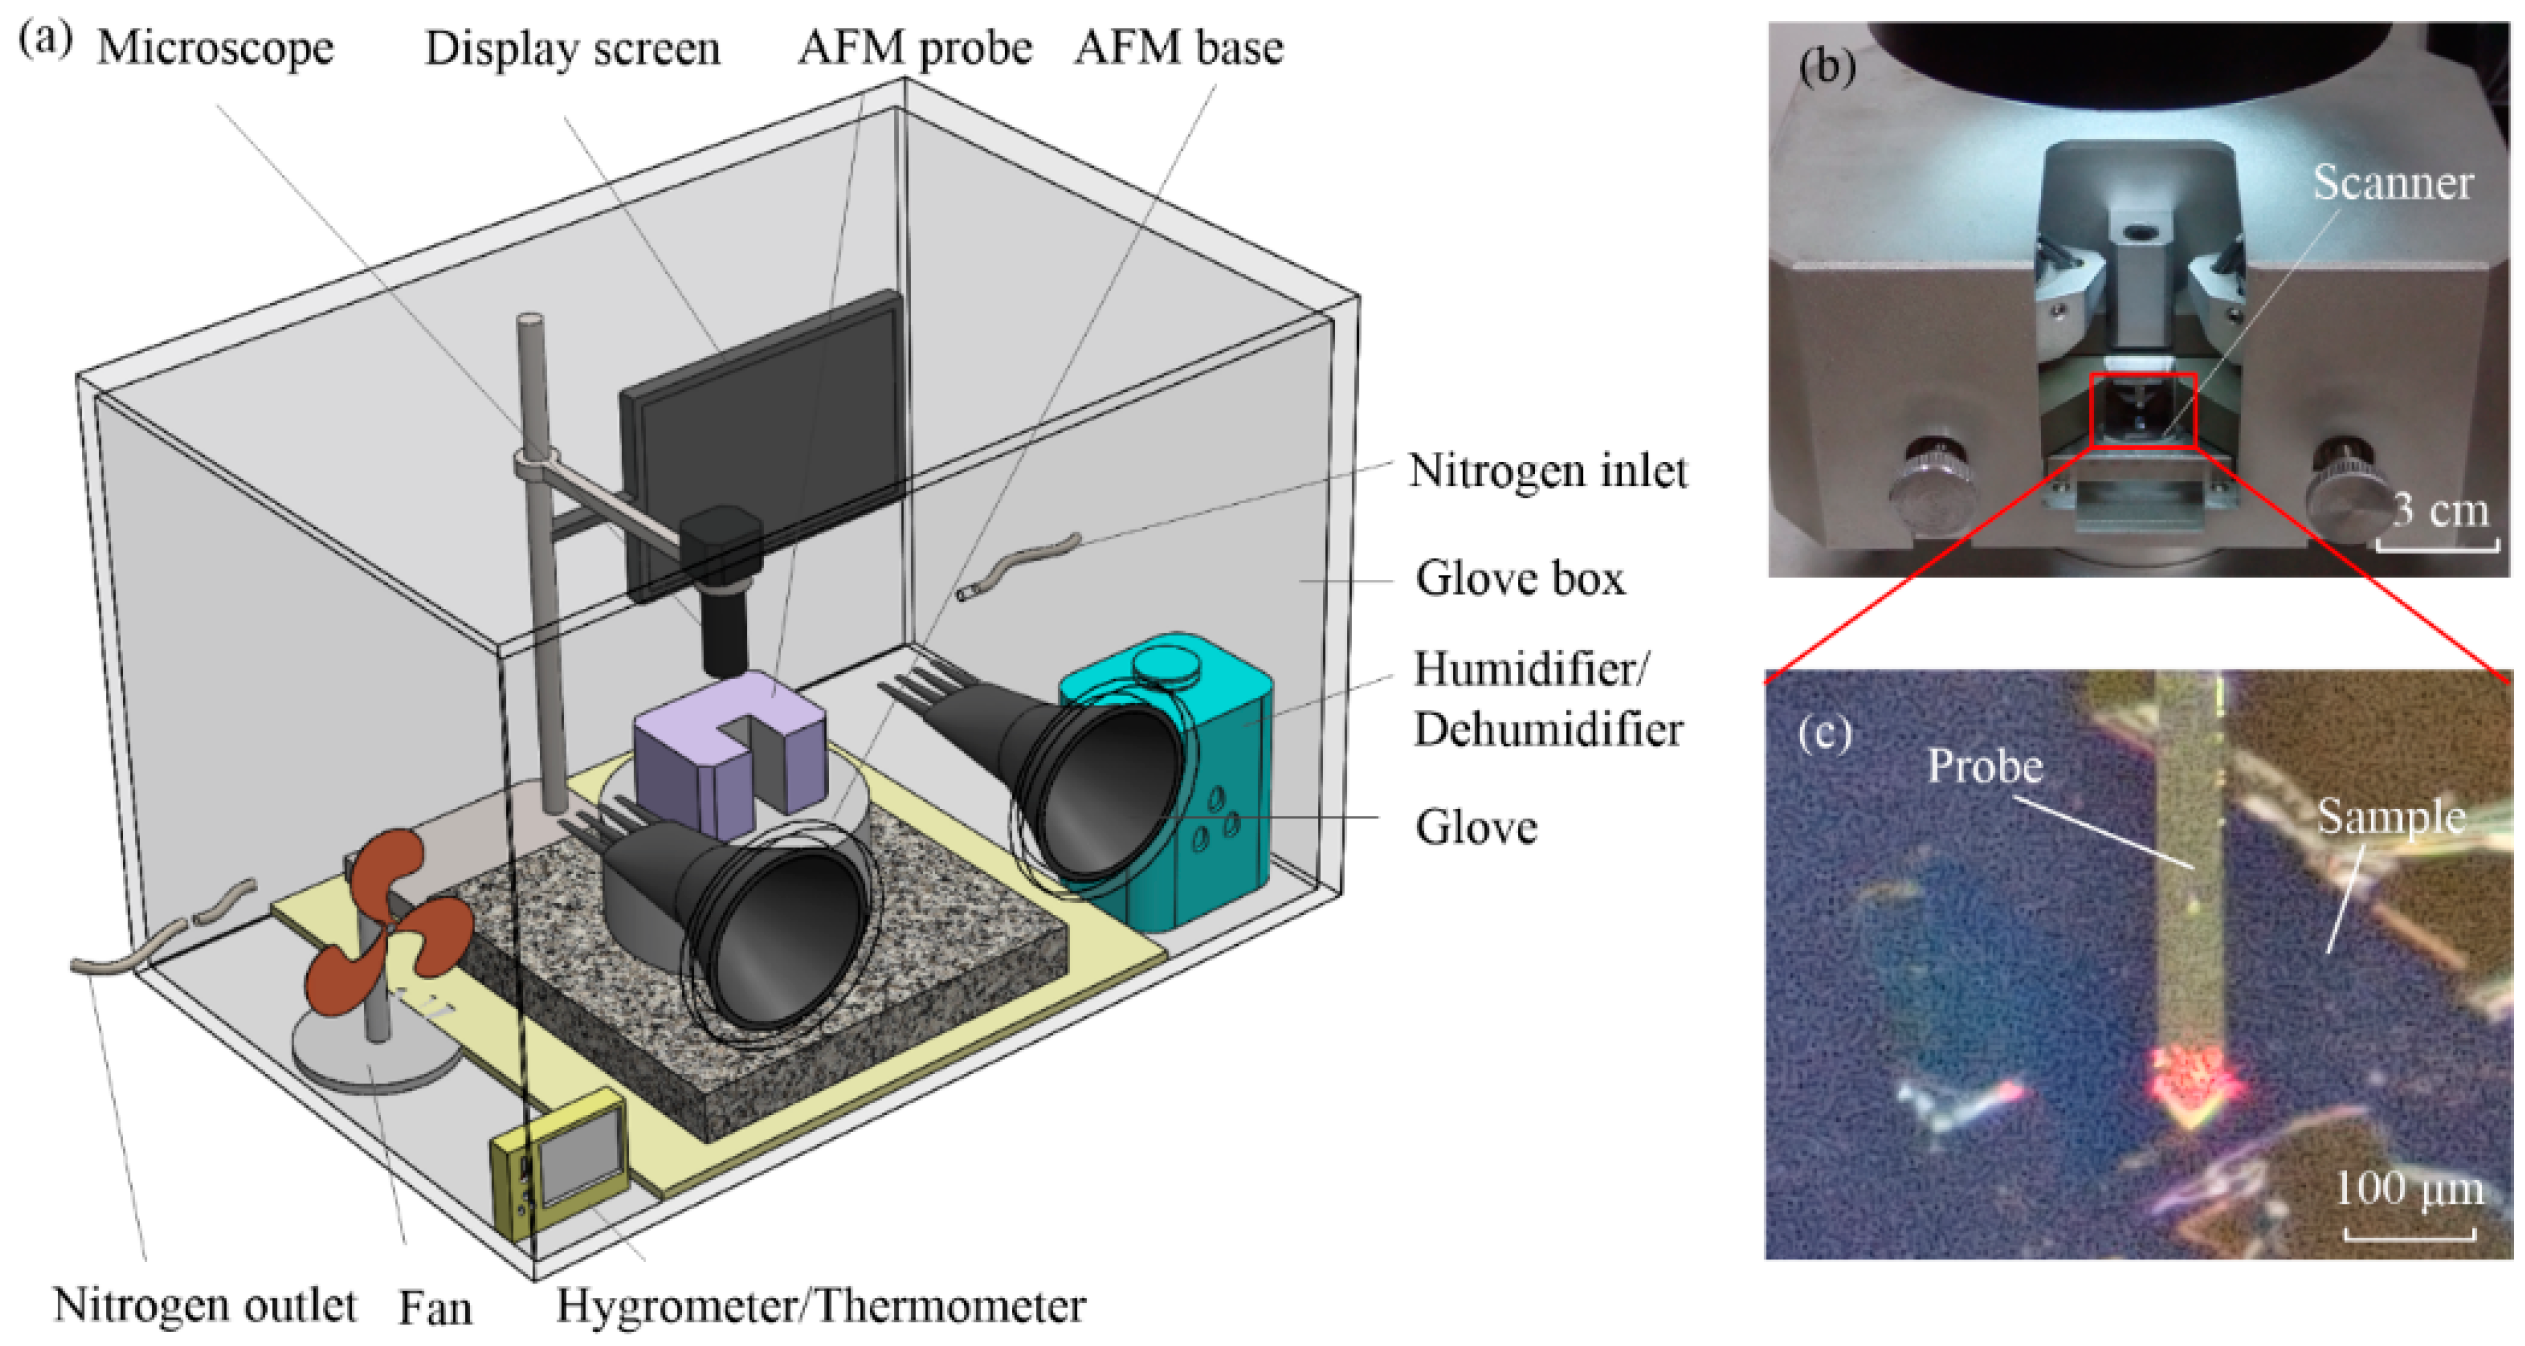
As shown in Figure 1, an experimental setup with a cylindrical AFM probe for measuring adhesion force was used. It mainly included the atomic-force microscope (CSPM-4000 AFM), high-resolution industrial microscope, glove box, and humidifier/dehumidifier. In this paper, monolayer graphene samples on silica were prepared by the mechanical method and then placed into the glove box. The RH was adjusted by humidification, dehumidification, or drying nitrogen. In the experiment, the adhesion force with continuously increasing dwell times were measured under five RH conditions, namely RH 45%, 55%, 65%, 75%, and 85%. The experimental temperature was set as 26 ± 2 °C. Figure 1b showed the AFM scanning probe, and Figure 1c was the adhesion-force measurement area, which could be observed by microscope.
In this paper, the single-point-force-curve collection method is used to avoid friction and position changes on the sample surface during scanning. After adjusting the RH in the glove box to a set value, the sample and the AFM probe were kept at this RH for 1 h. Moreover, the maximum Z-direction voltage was set to −110 V, the set dwell time started from 0 s, the interval of each force curve was set to 100 ms, and force curves at the same humidity were measured 100 times.
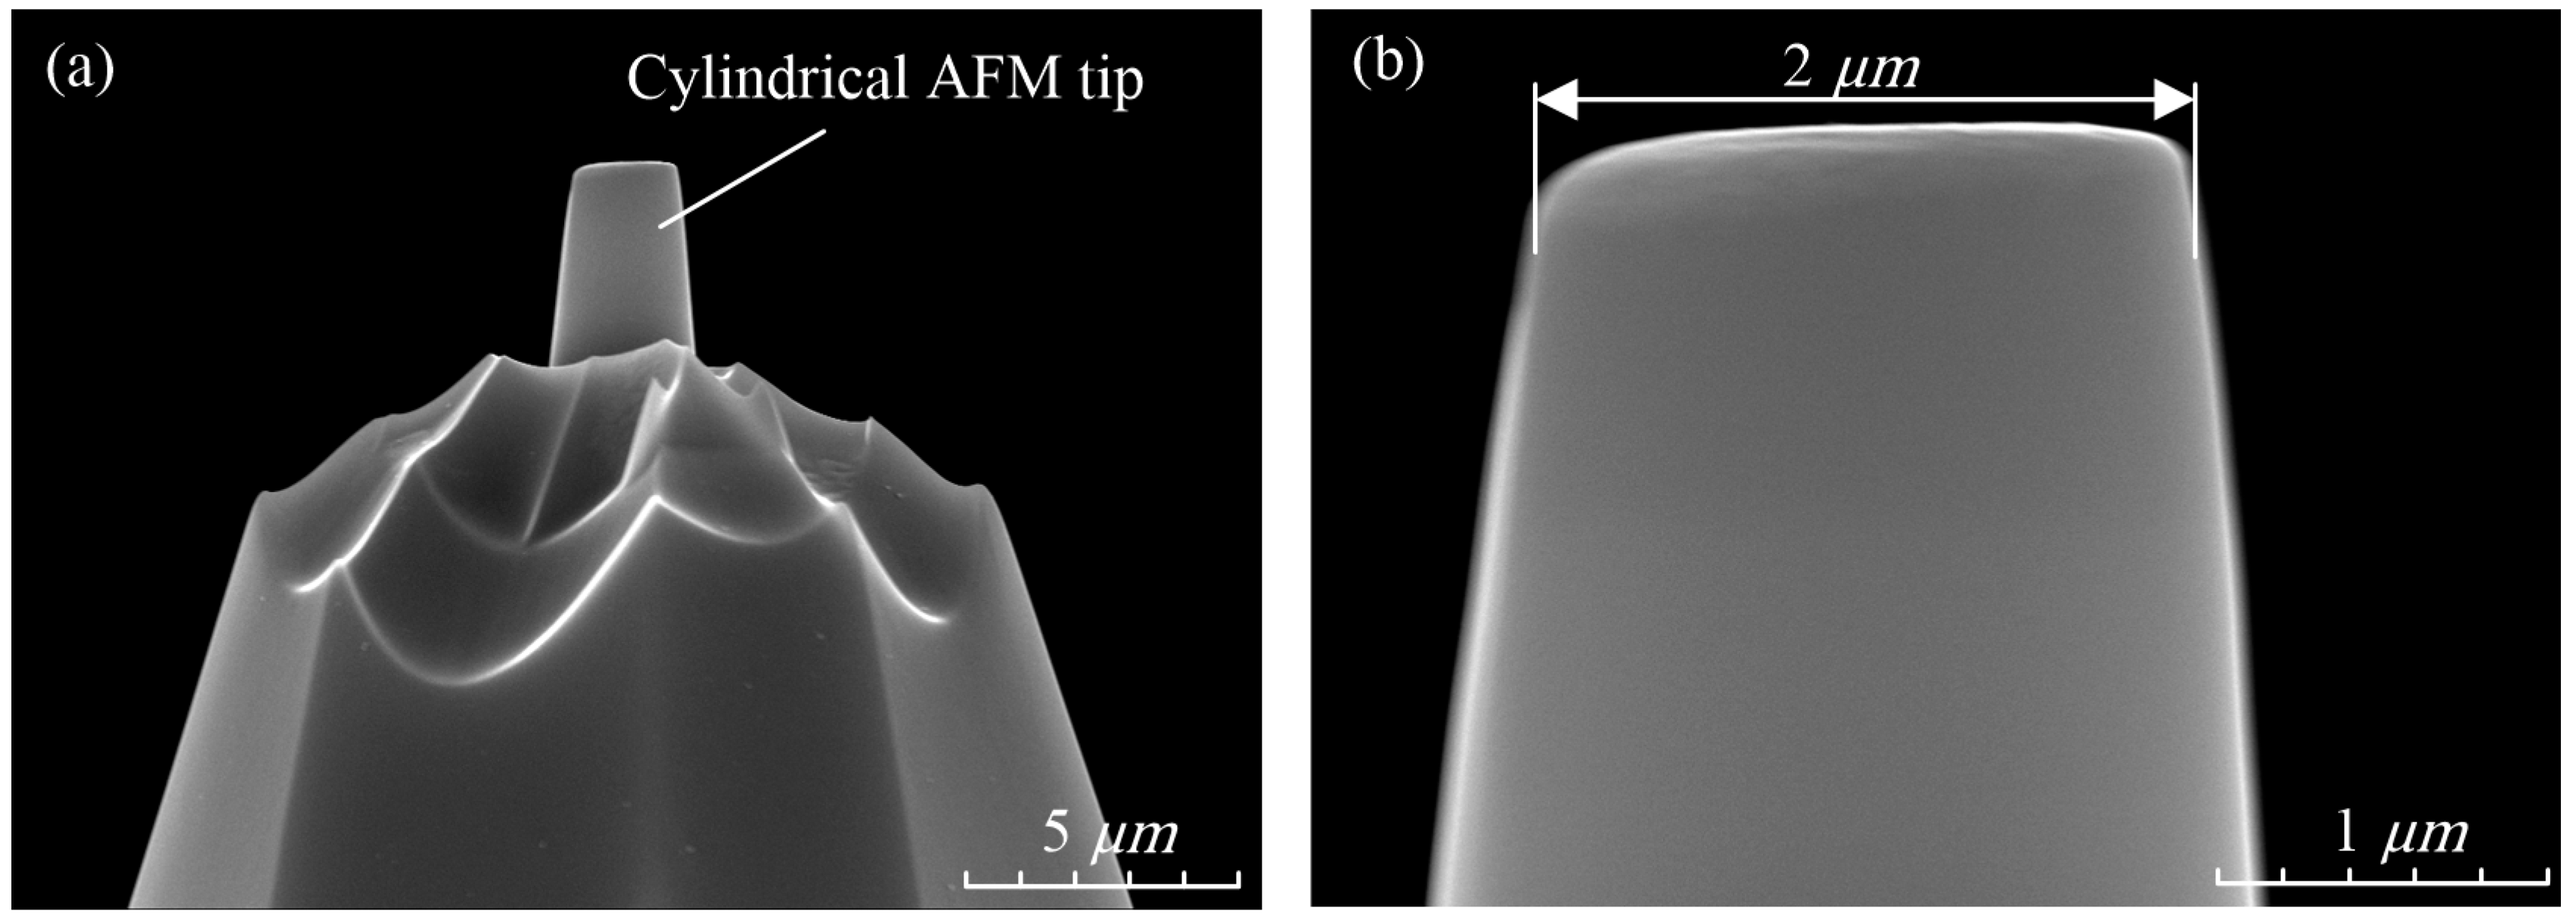
Figure 2 shows the cylindrical AFM tip SEM. The probe type is SD-PL2-CONTR, and the materials of tip and cantilever are silicon. The laser-reflection surface of the probe cantilever was coated with a 30 nm aluminum layer, which could completely reflect the laser into the laser receiver. From the enlarged view in Figure 2b, it can be seen that the diameter of the cylindrical tip is 2 μm.
2.2. Characterization Methods
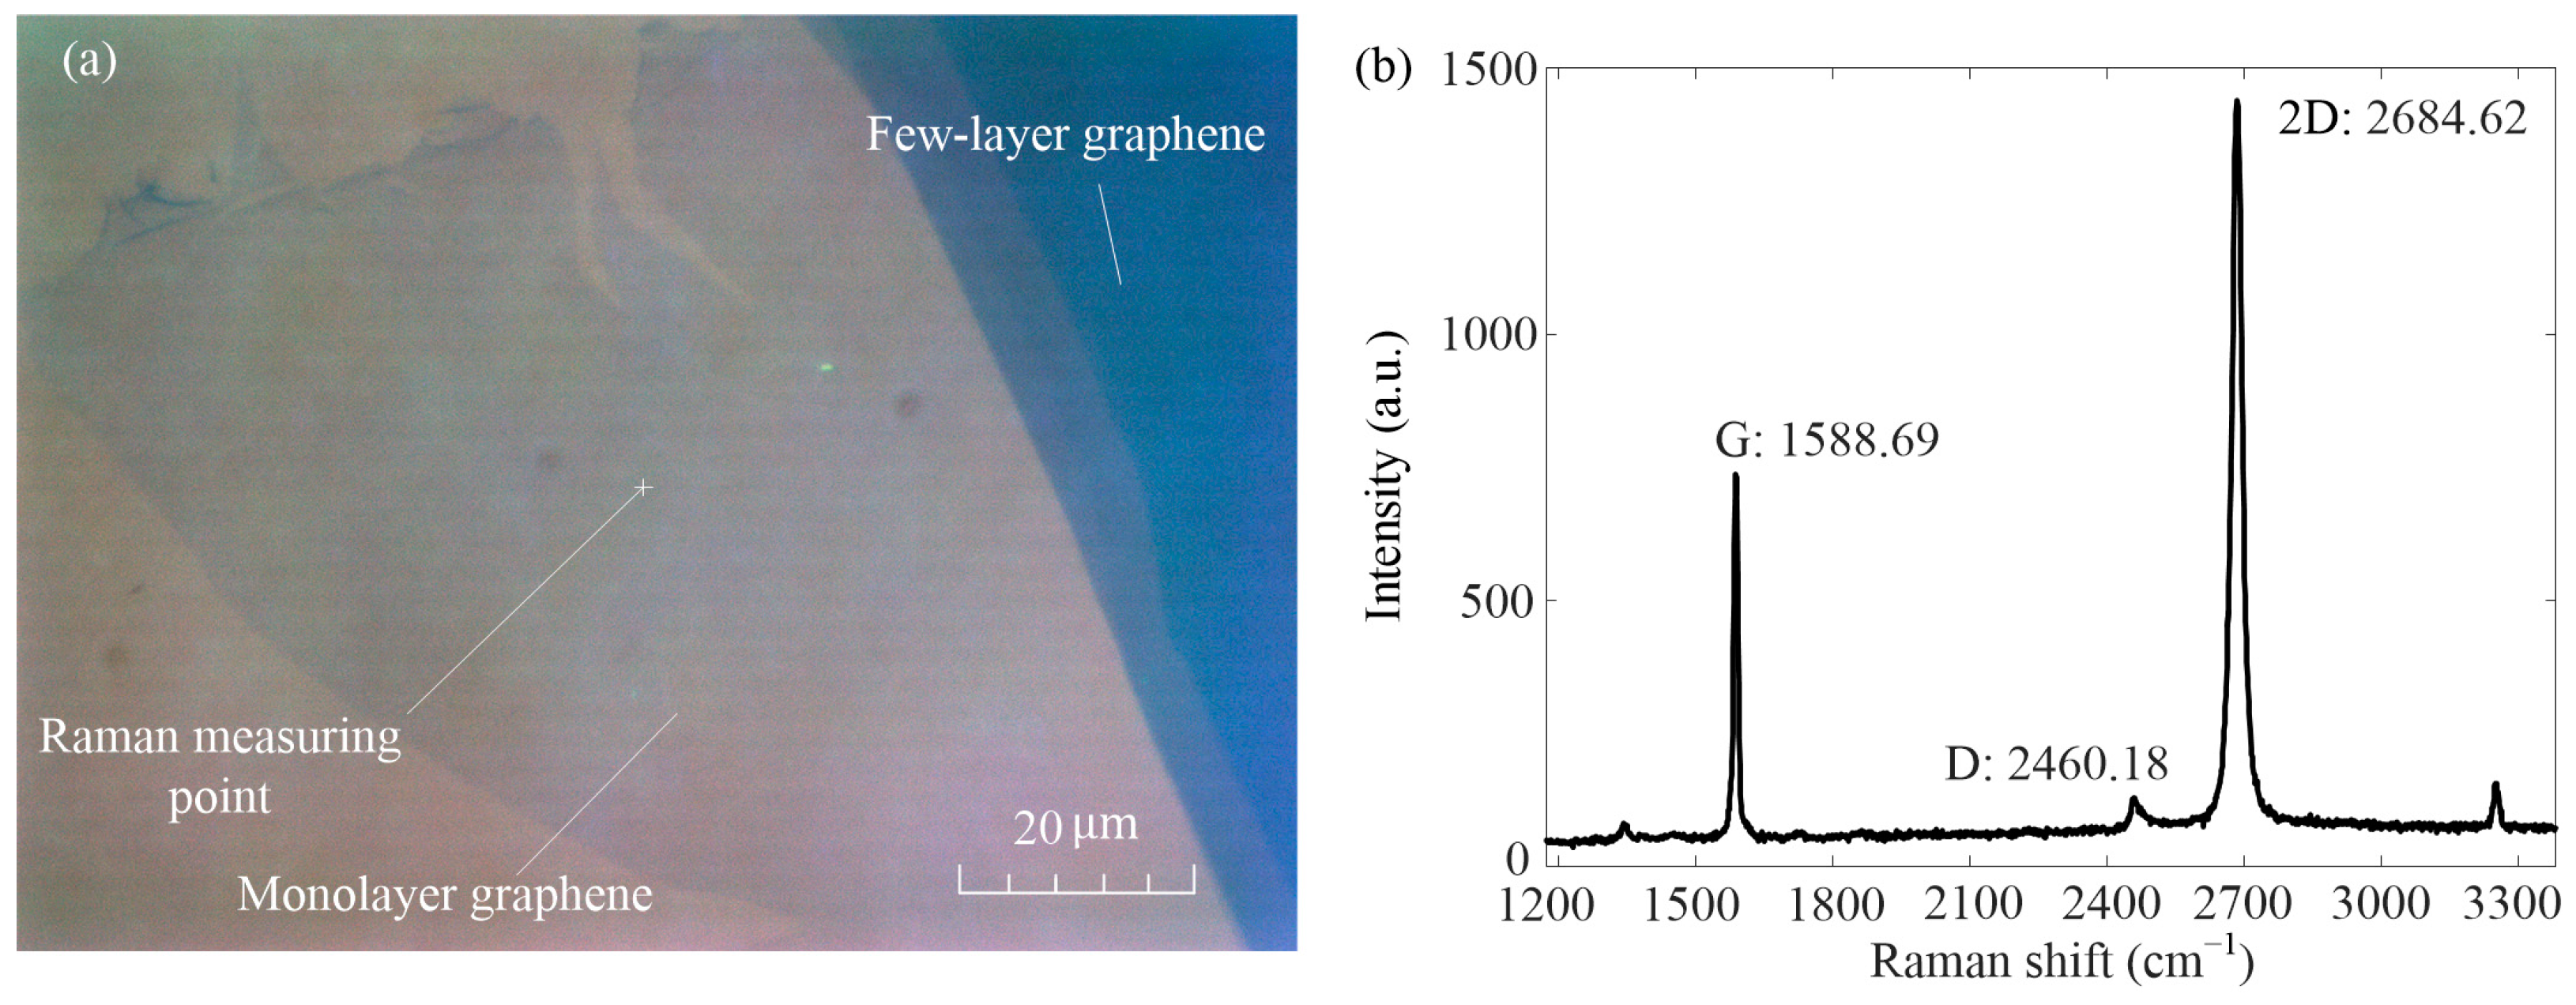
In this paper, silica-based monolayer graphene was prepared by the mechanical method [36]. The image of the tested sample under a polarizing microscope is shown in Figure 3a. The monolayer graphene in the picture is light blue, and the darker color is few-layer graphene. It shows that the area of graphene is more than 6000 square microns, which makes it easier to measure adhesion force. The laser confocal micro-Raman spectrometer (HJY LabRAM Aramis, Horiba Jobin Yvon, Paris, France) was used to measure the Raman measuring point in Figure 3a. The measured Raman laser wavelength was 532 nm, and the Raman spectrum is shown in Figure 3b. It can be seen that the G peak of the Raman measurement point is 1588.69 and the 2D peak is 2684.62, and the intensity ratio of both is less than 0.7. Therefore, it can be judged that the Raman measurement point is a monolayer graphene [40,41].
2.3. Measurement Method
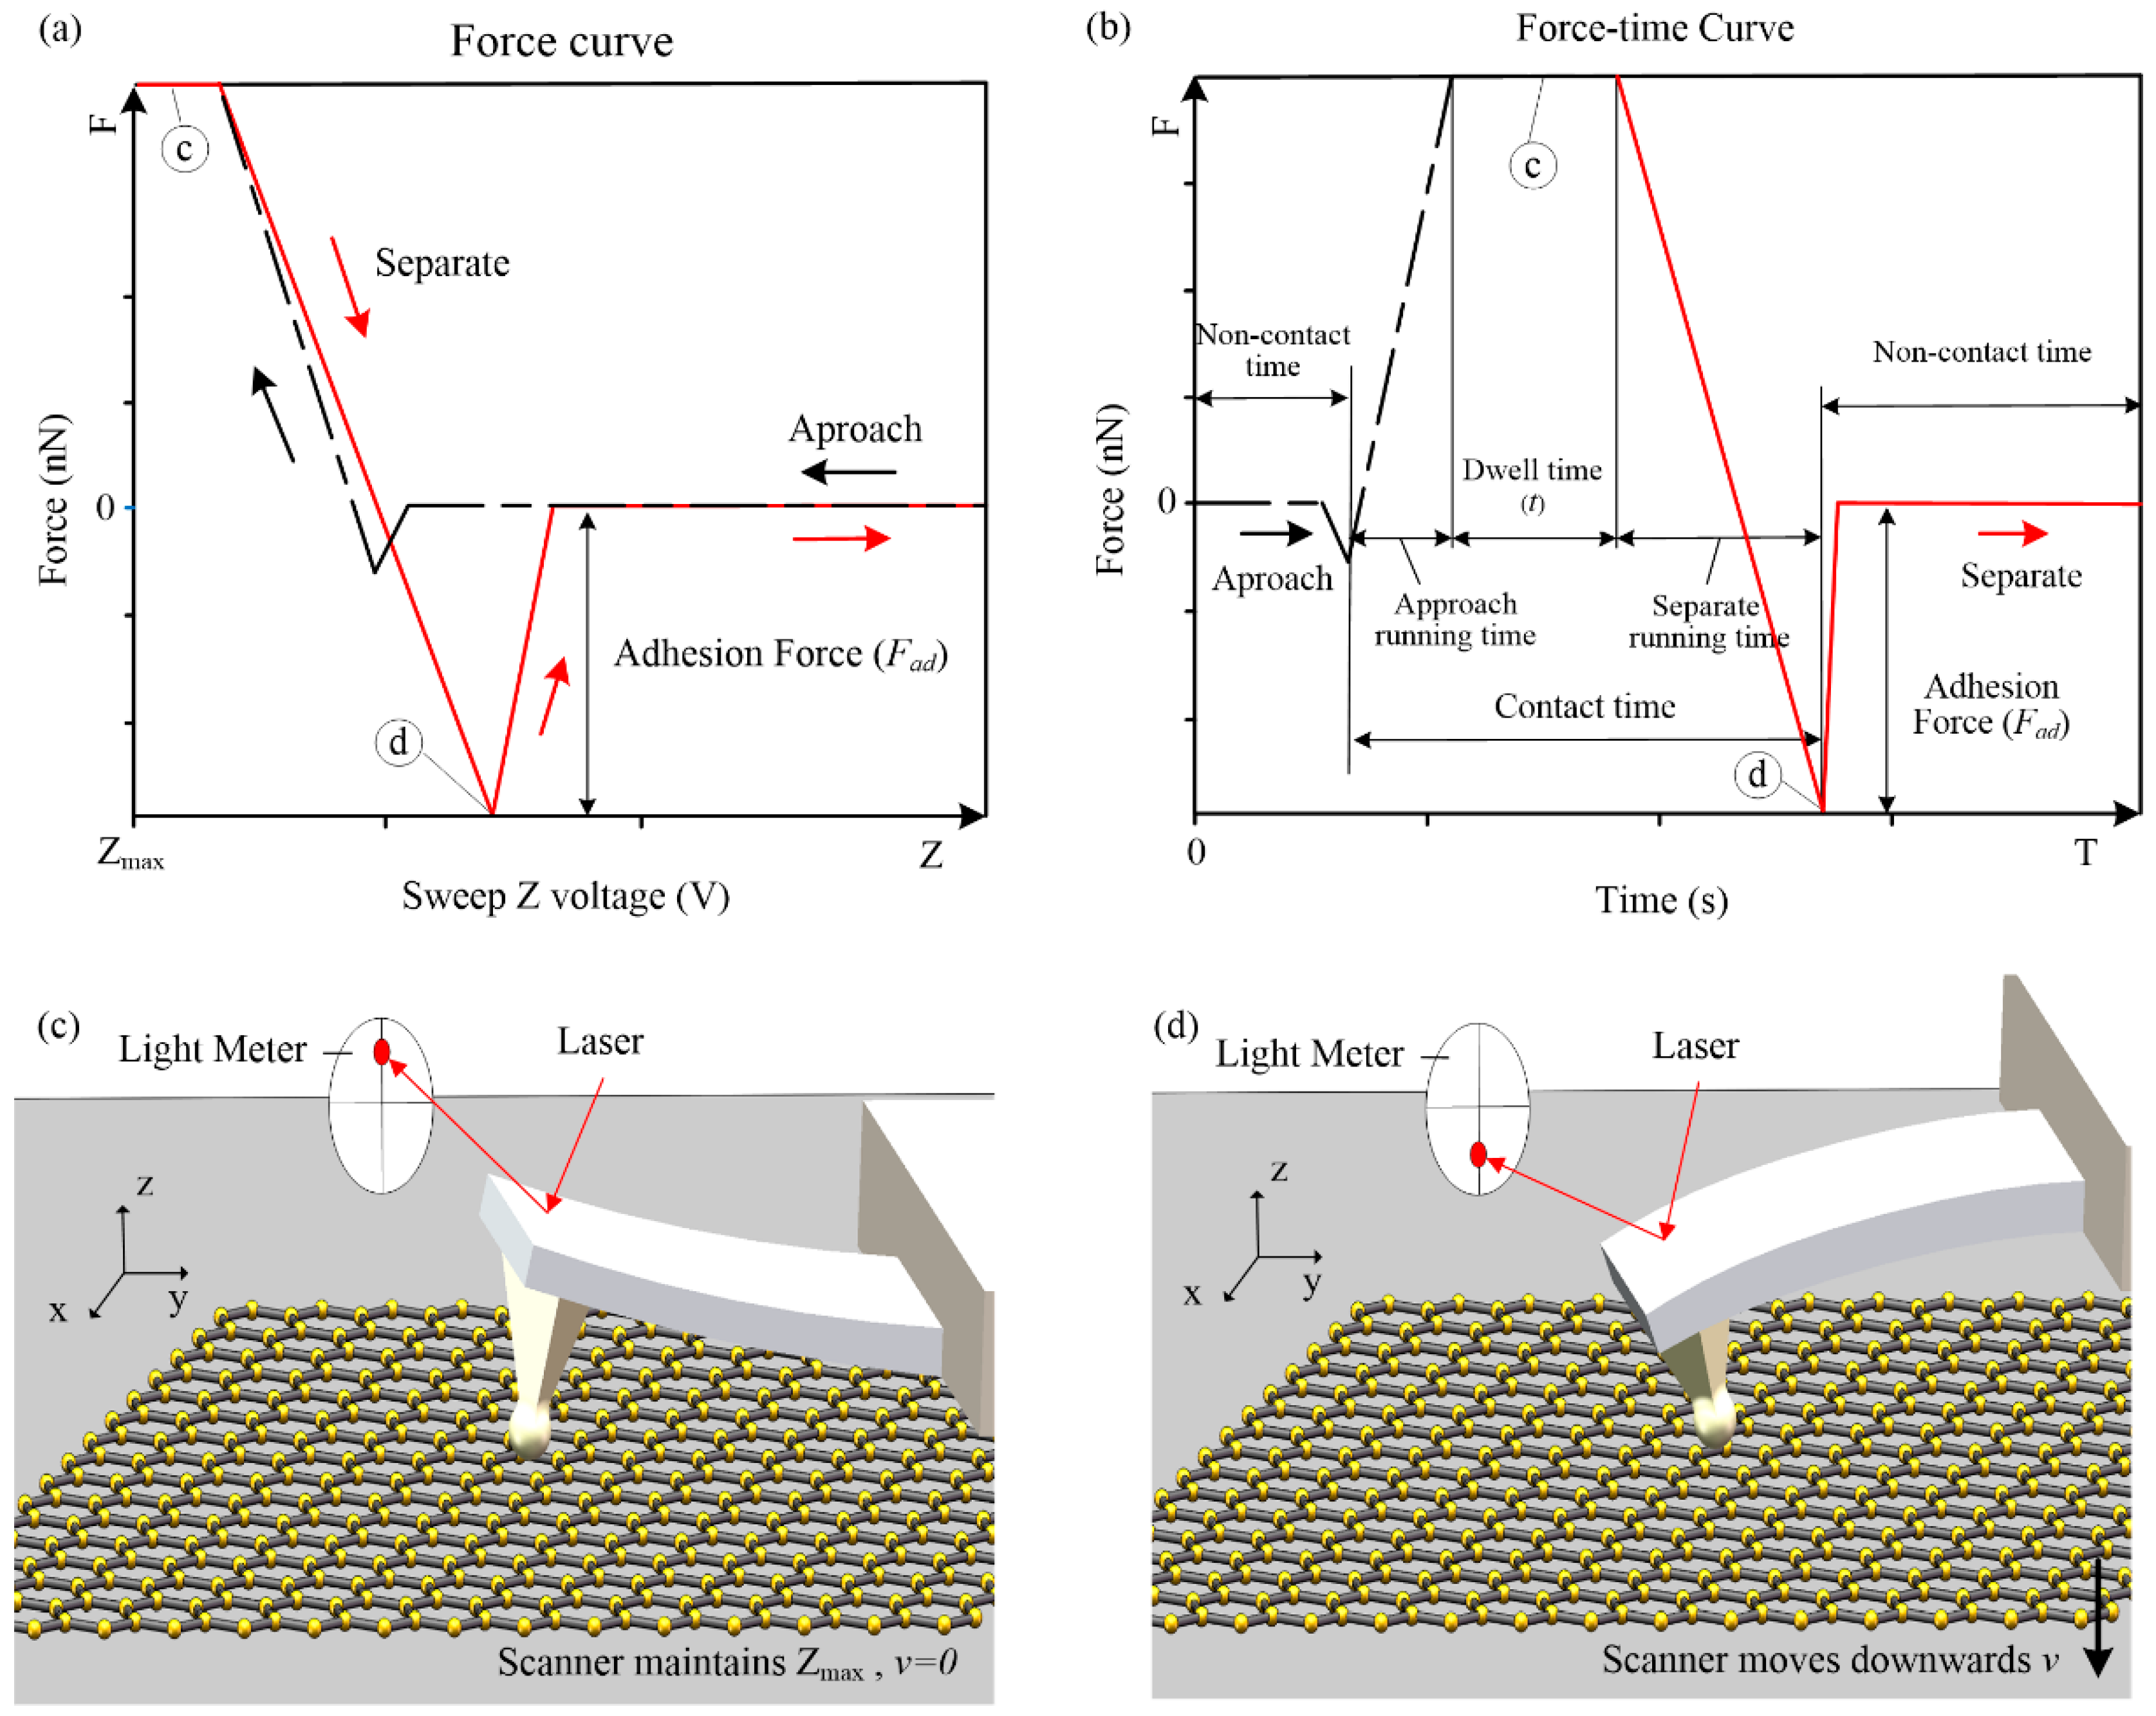
The adhesion force can be calculated by the force curve (see Figure 4a), and the force–time curve can know the running process of the AFM measurement (see Figure 4b). The force curve was measured by detecting the laser displacement, and the displacement of the probe cantilever and the adhesion force were obtained. The black lines in Figure 4a,b represent the sample approach process of the AFM probe. The sample moves upwards to cause the AFM probe cantilever to bend upwards, and the maximum Z-direction voltage was maintained until the set dwell time was reached (see Figure 4c). The red lines in Figure 4a,b represent the separation of the scanner and the probe. The sample moved downwards and the probe began to separate from the sample. During the separation process, the adhesion force made the AFM probe cantilever bend downward, and the force curve appeared as a large negative value (see Figure 4d). Contact time includes: approach running time, dwell time, and separation running time. It should be noted that during the approach running time, the cylindrical probe was in contact with the sample surface, the condensation of water was initiated, and the AFM would not collect data within the dwell time.
3. Theoretical Model
3.1. Change Process of the Meniscus
Weeks et al. [19] used a silicon nitride AFM tip with a static contact angle of 61° to directly measure the image of meniscus equilibrium at RH = 60% and RH = 90%. It was shown that the tip-contact angle was close to zero, and the two contact angles were not consistent. This suggests that the contact angle can be gradually reduced to allow the surface energy to reach equilibrium. Shi et al. [36] pointed out that the growth process of the meniscus was a dynamic change process of the material-contact angle, and the adhesion force-versus-time curves had a maximum value under the cone–plane contact.
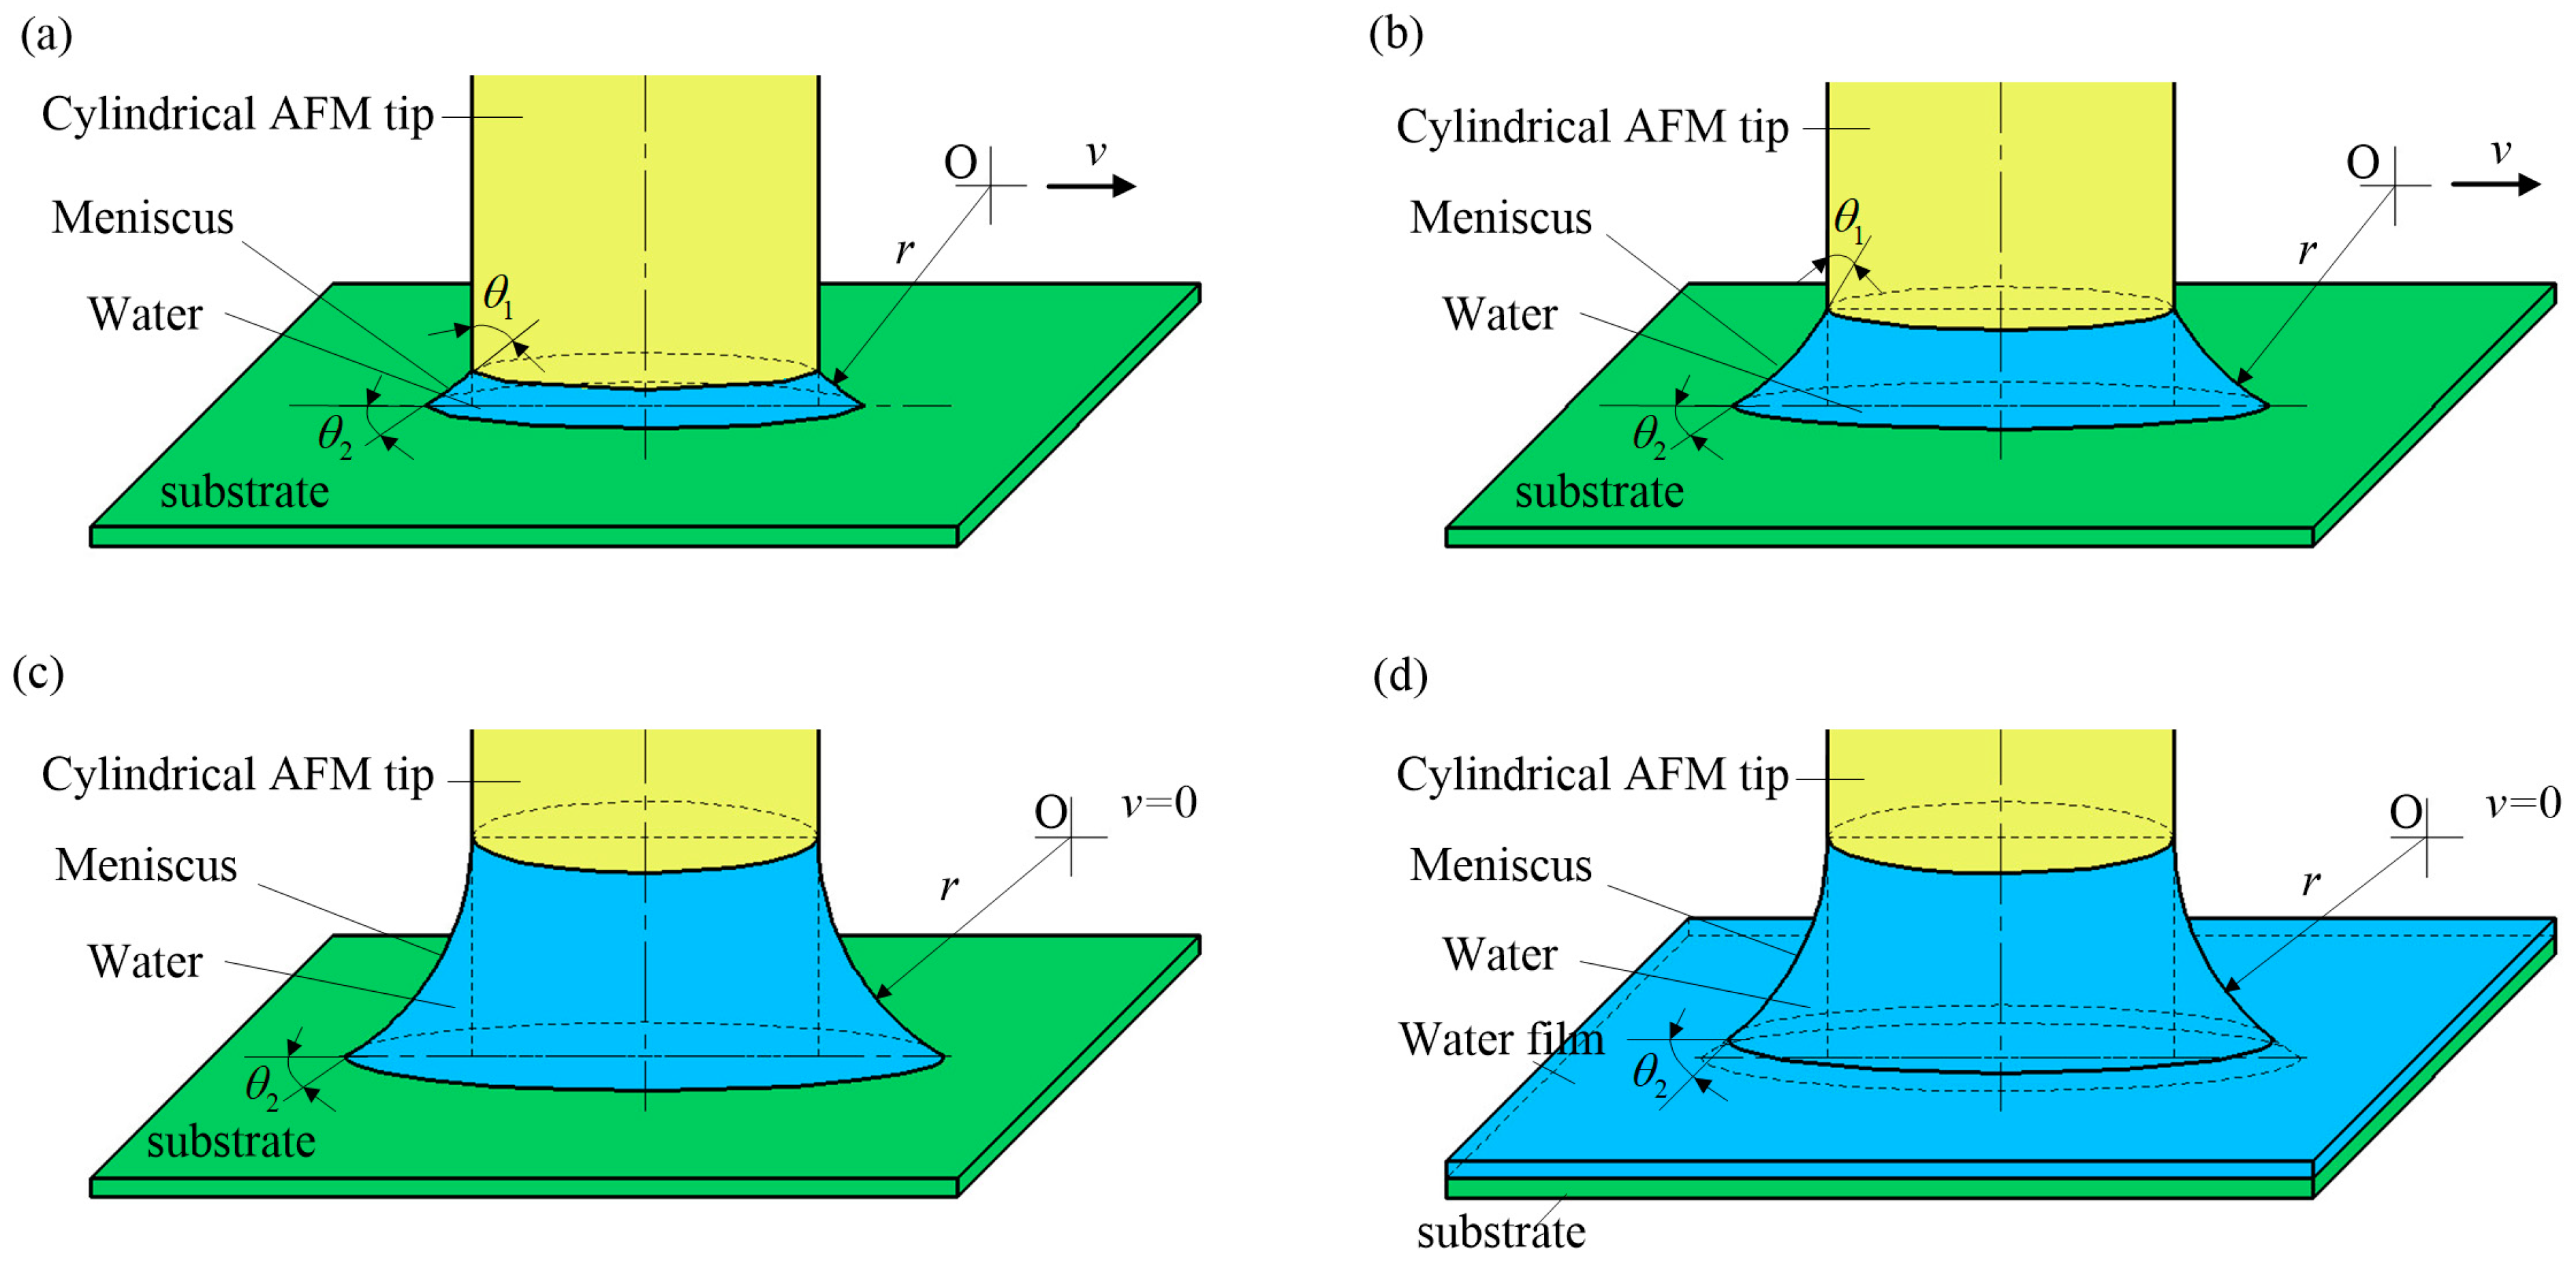
Figure 5 shows the change in meniscus and variable-water-contact-angle (VWCA) between the AFM cylindrical probe and the sample. θ1 is the VWCA of the cylindrical probe, and θ2 is the VWCA of the sample surface. Figure 5a shows that θ2 and the Kelvin radius r remained unchanged, and the meniscus was formed by condensation at the periphery of the cylindrical. The initial angle of θ1 was 90° and it gradually decreased with the increase in the meniscus. An increased meniscus results from water condensation [42]. As shown in Figure 5b, the center of the Kelvin circle moved horizontally outward until the Kelvin circle was tangent to the cylinder (see Figure 5c). After forming a complete meniscus, as the dwell time increased, the sample surface continued to condense to form a water film [43], leading to θ2 increase (see Figure 5d). In general, the thickness of the water film depends on the RH and hydrophilicity of the substrate [44,45].
3.2. Van der Waals Force under Cylinder–Plane Contact
When two solids contact under normal load, the adhesion force attracts the two surfaces together. The sources of adhesion force may include vdW force generated on the contact surface, capillary force generated by meniscus pressure, electrostatic force generated by electric charge, and double-electric-layer force possibly generated in the liquid between the contact surfaces, etc. The total energy of adhesion is the work required to separate the two surfaces from equilibrium to an infinite distance [28,44]. In this paper, the experiment was carried out in an atmospheric environment with high RH. Generally, electrostatic force and double-electric-layer force were small and could be ignored, so the adhesion force only needed to consider vdW force and capillary force.
3.3. Theoretical Capillary Force under Cylinder–Plane Contact
Generally, if there is a meniscus on the surface of two contact samples, the main sources of capillary force Fc include capillary pressure Fp caused by pressure in the meniscus, and liquid-surface-tension Fs. For rotationally symmetric geometry, the equation for calculating capillary force is
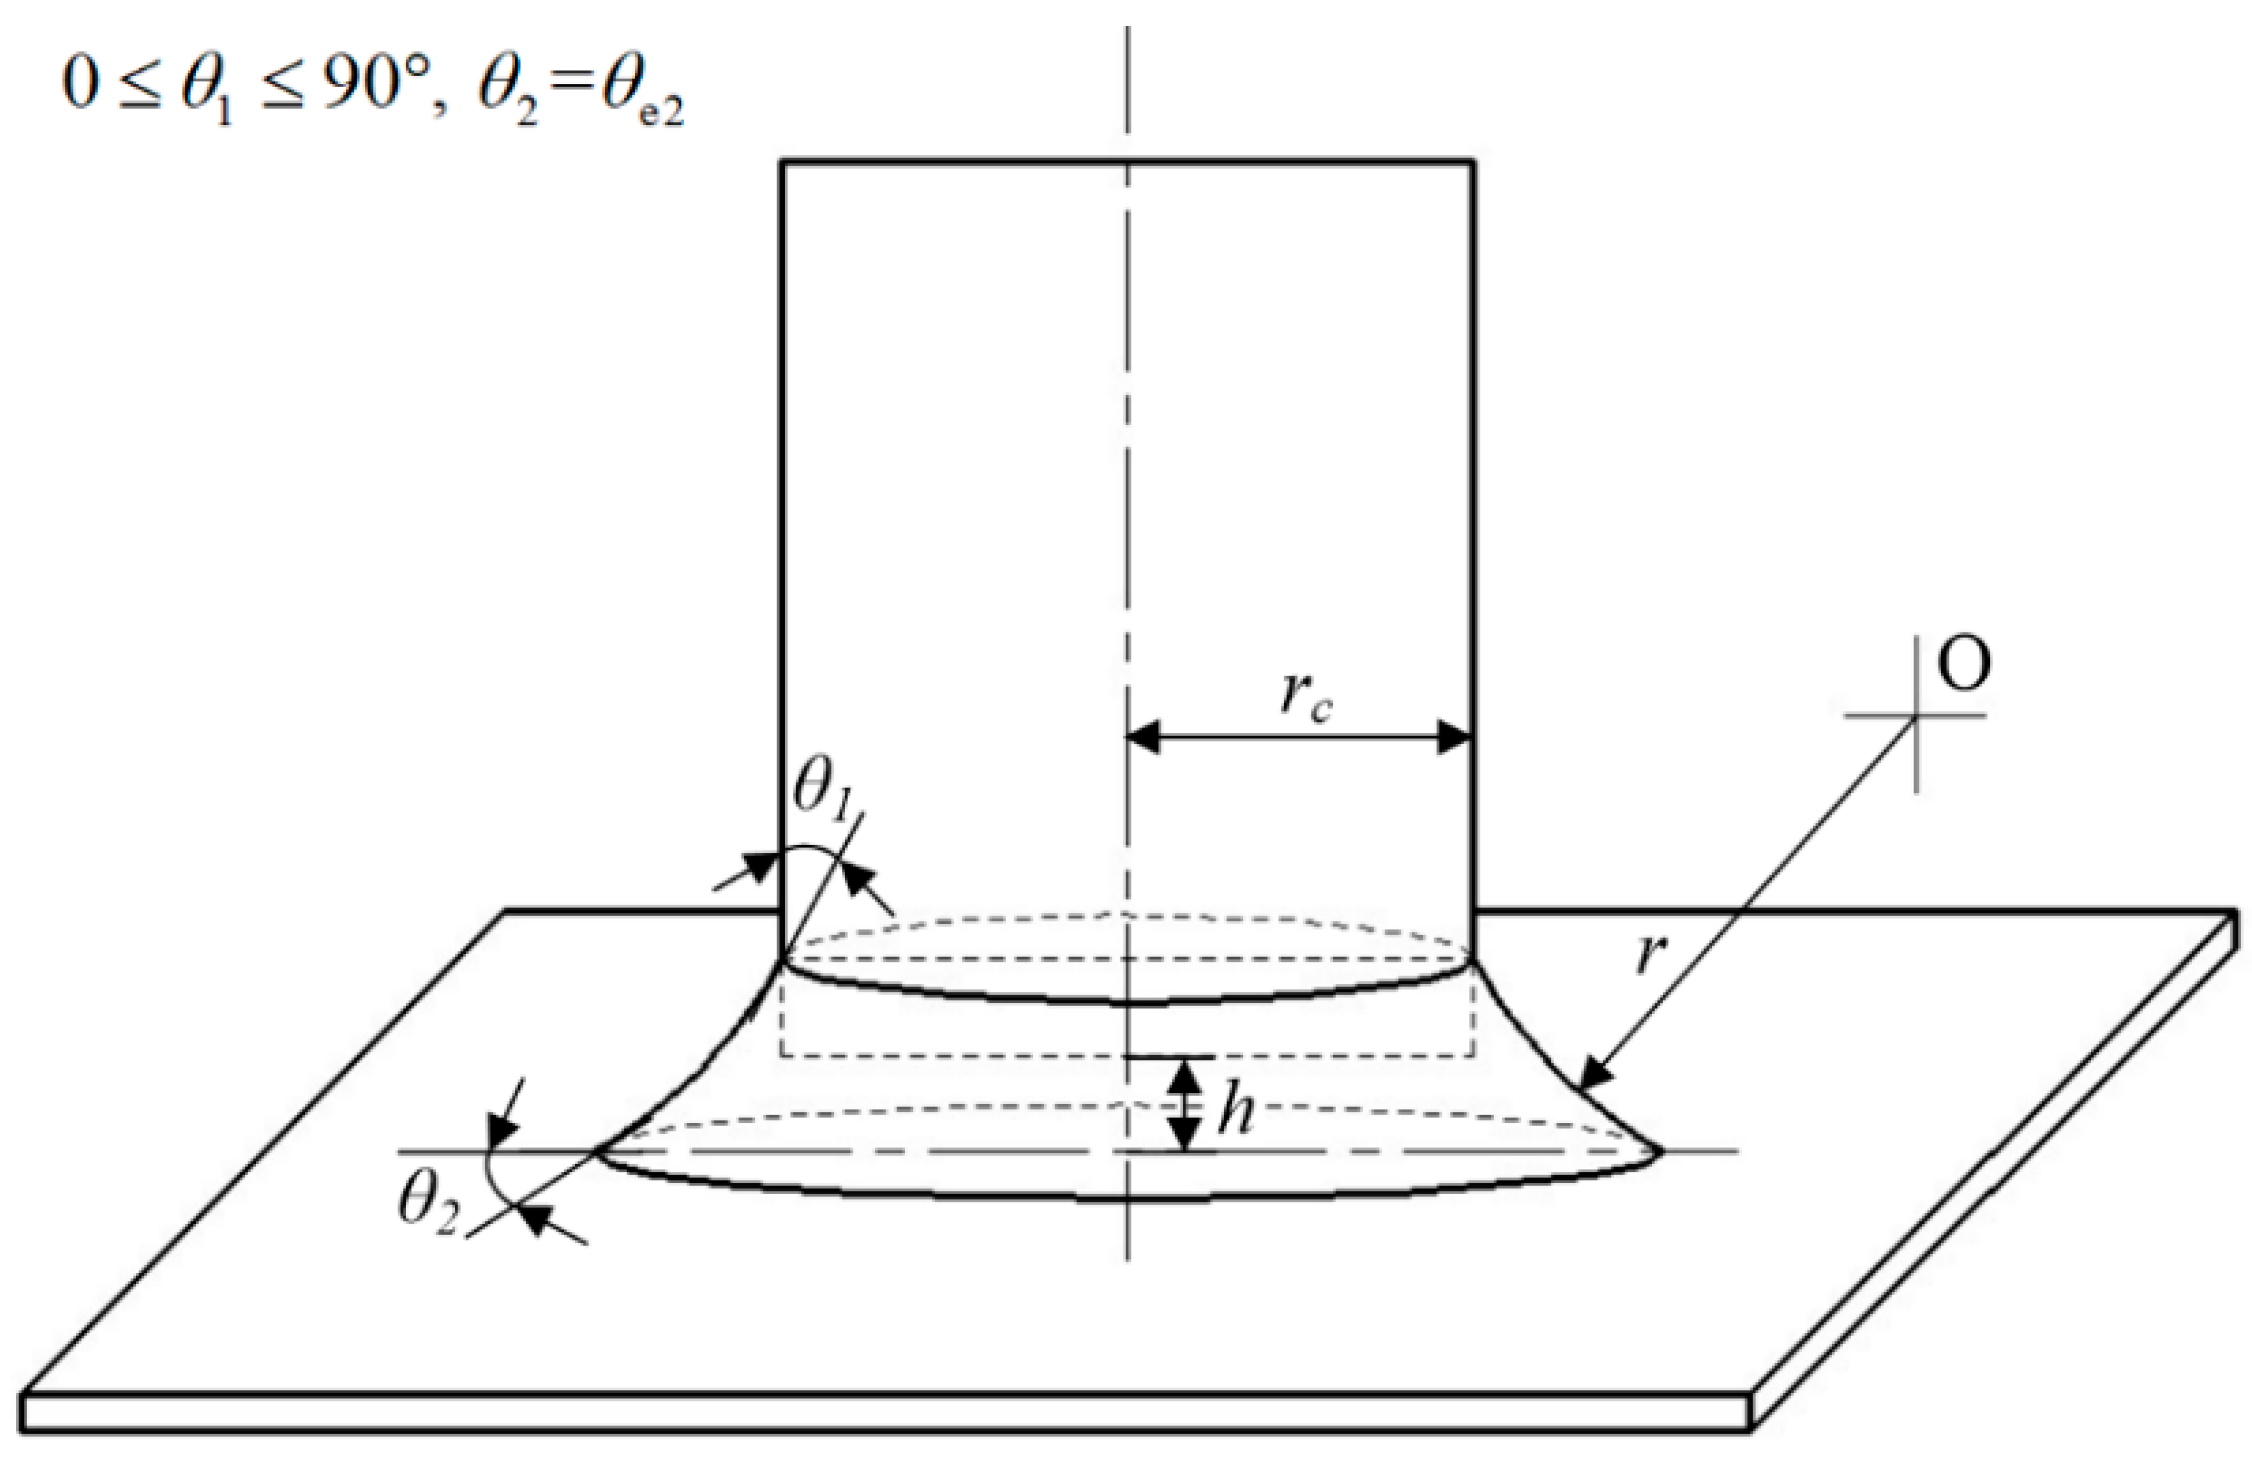
As shown in Figure 6, under cylinder–plane contact, Fp is affected by Laplace pressure ΔP between two phases. The Young-Laplace equation relates ΔP to the azimuthal radius rc and Kelvin radius r of the meniscus. The Young–Laplace equation is given by [29]:
where γL is the surface tension of liquid and r can be calculated using the Kelvin equation [28].
For cylinder–plane contact (see Figure 6), the pressure surface of the cylindrical probe is circular. Therefore, the capillary pressure FP is
In addition, FS is the surface tension, and the action direction of the adhesion force is vertical, so it is necessary to decompose the surface tension on the meniscus in the vertical direction; therefore, the FS calculation equation is [29]:
Therefore, the relationship between the capillary force Fc and VWCA θ1 can be derived from Equations (3)–(5):
4. Experimental and Theoretical Results
4.1. The Variation Rule of Graphene Adhesion Force with the Dwell Time under Cylinder–Plane Contact
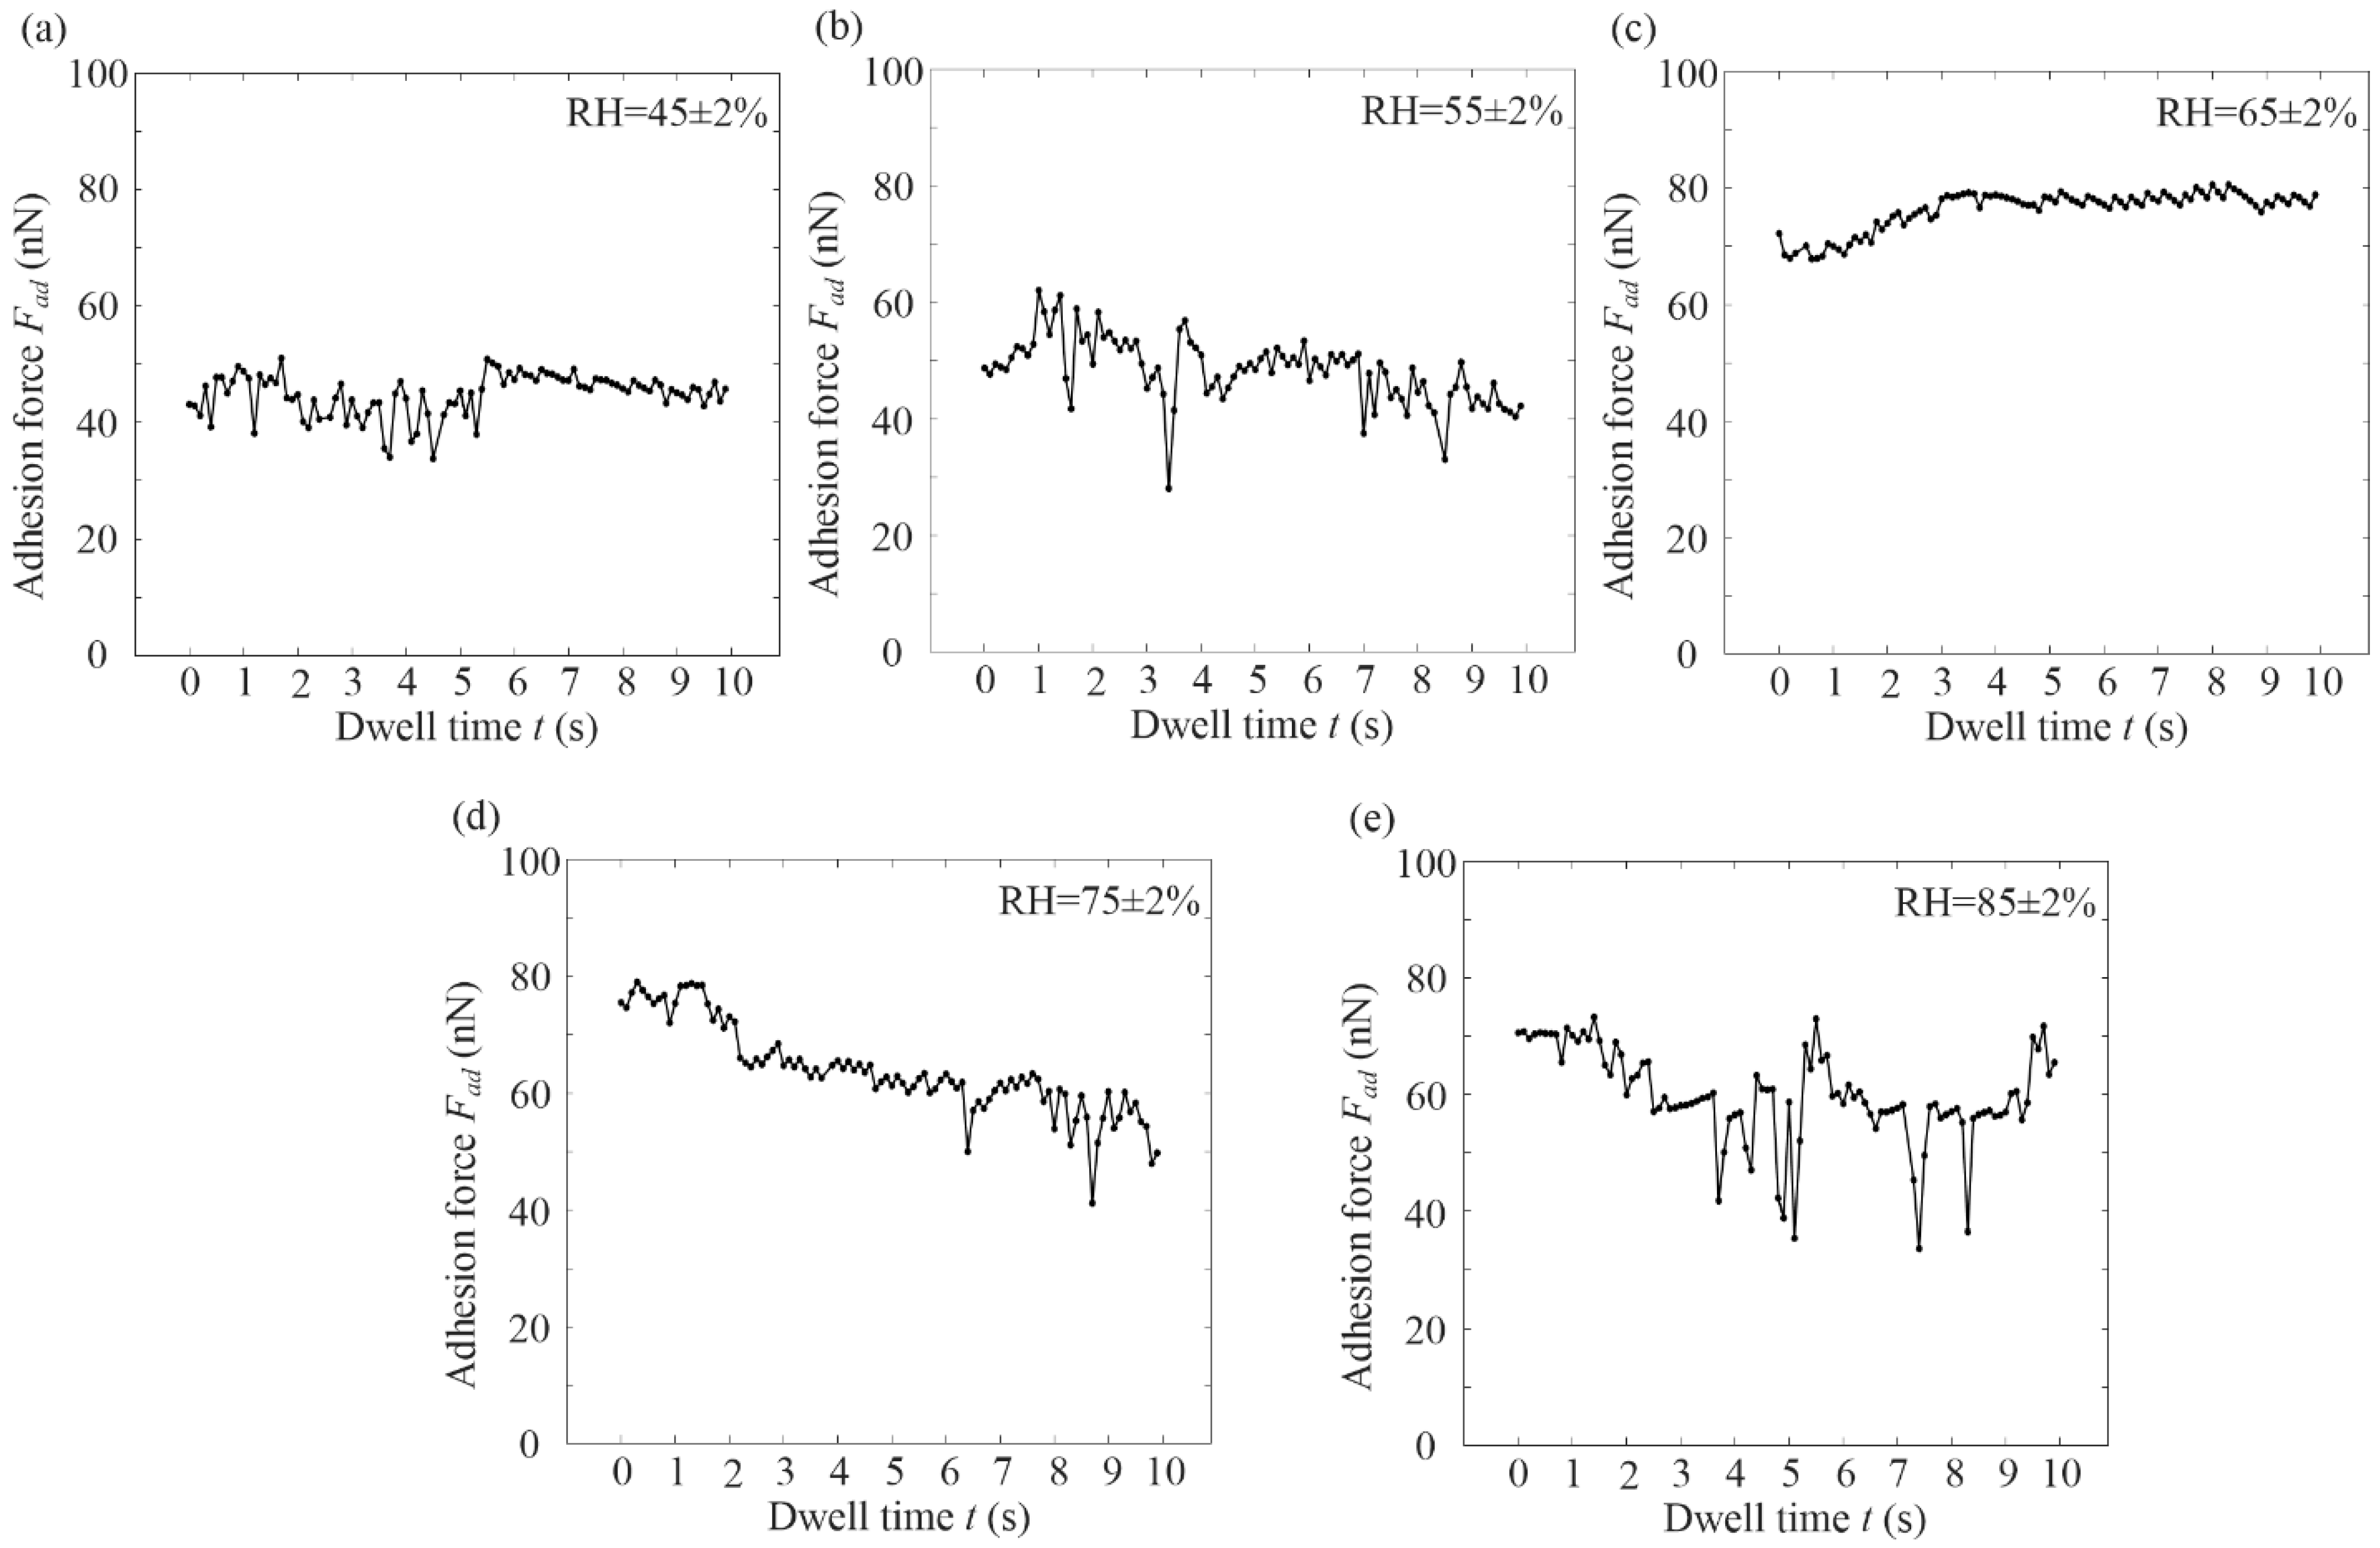
Figure 7 shows the variation rule of graphene adhesion force with the dwell time at different RH under cylinder–plane contact. It was shown that when RH was 45% and 55% (see Figure 7a,b), the adhesion force value was small (40–50 nN), which tended to be stable. When RH was 65%, the adhesion curve showed a significant increase in dwell time, and had a maximum value and stabilized (see Figure 7c). The maximum adhesion force was 80.58 nN, which increased by 29.78% when RH was 55%. When RH was 75–85% (see Figure 7d,e), the adhesion force curve slowly decreased and finally stabilized.
It can be seen that the graphene adhesion force did not change significantly with the dwell time under cylinder–plane contact at RH ≤ 45%. Graphene adhesion force became time-dependent after RH was above 45%. The effect of dwell time on adhesion force at different humidities was not entirely consistent. When RH was 55% and 65%, the adhesion force-versus-time curve had a maximum value and tended to be stable. When RH was 75% and 85%, the adhesion force-versus-time curve decreased with dwell time and tended to be stable. It can be concluded that the higher the RH, the faster the meniscus was formed on the graphene surface. The increase in adhesion force with dwell time was not observed at high RH, possibly because the meniscus formation time was shorter than the approach running time. As the dwell time increased, the adhesion force gradually became stable.
4.2. Variation Rule of Graphene Adhesion Force with the Relative Humidity under Cylinder–Plane Contact
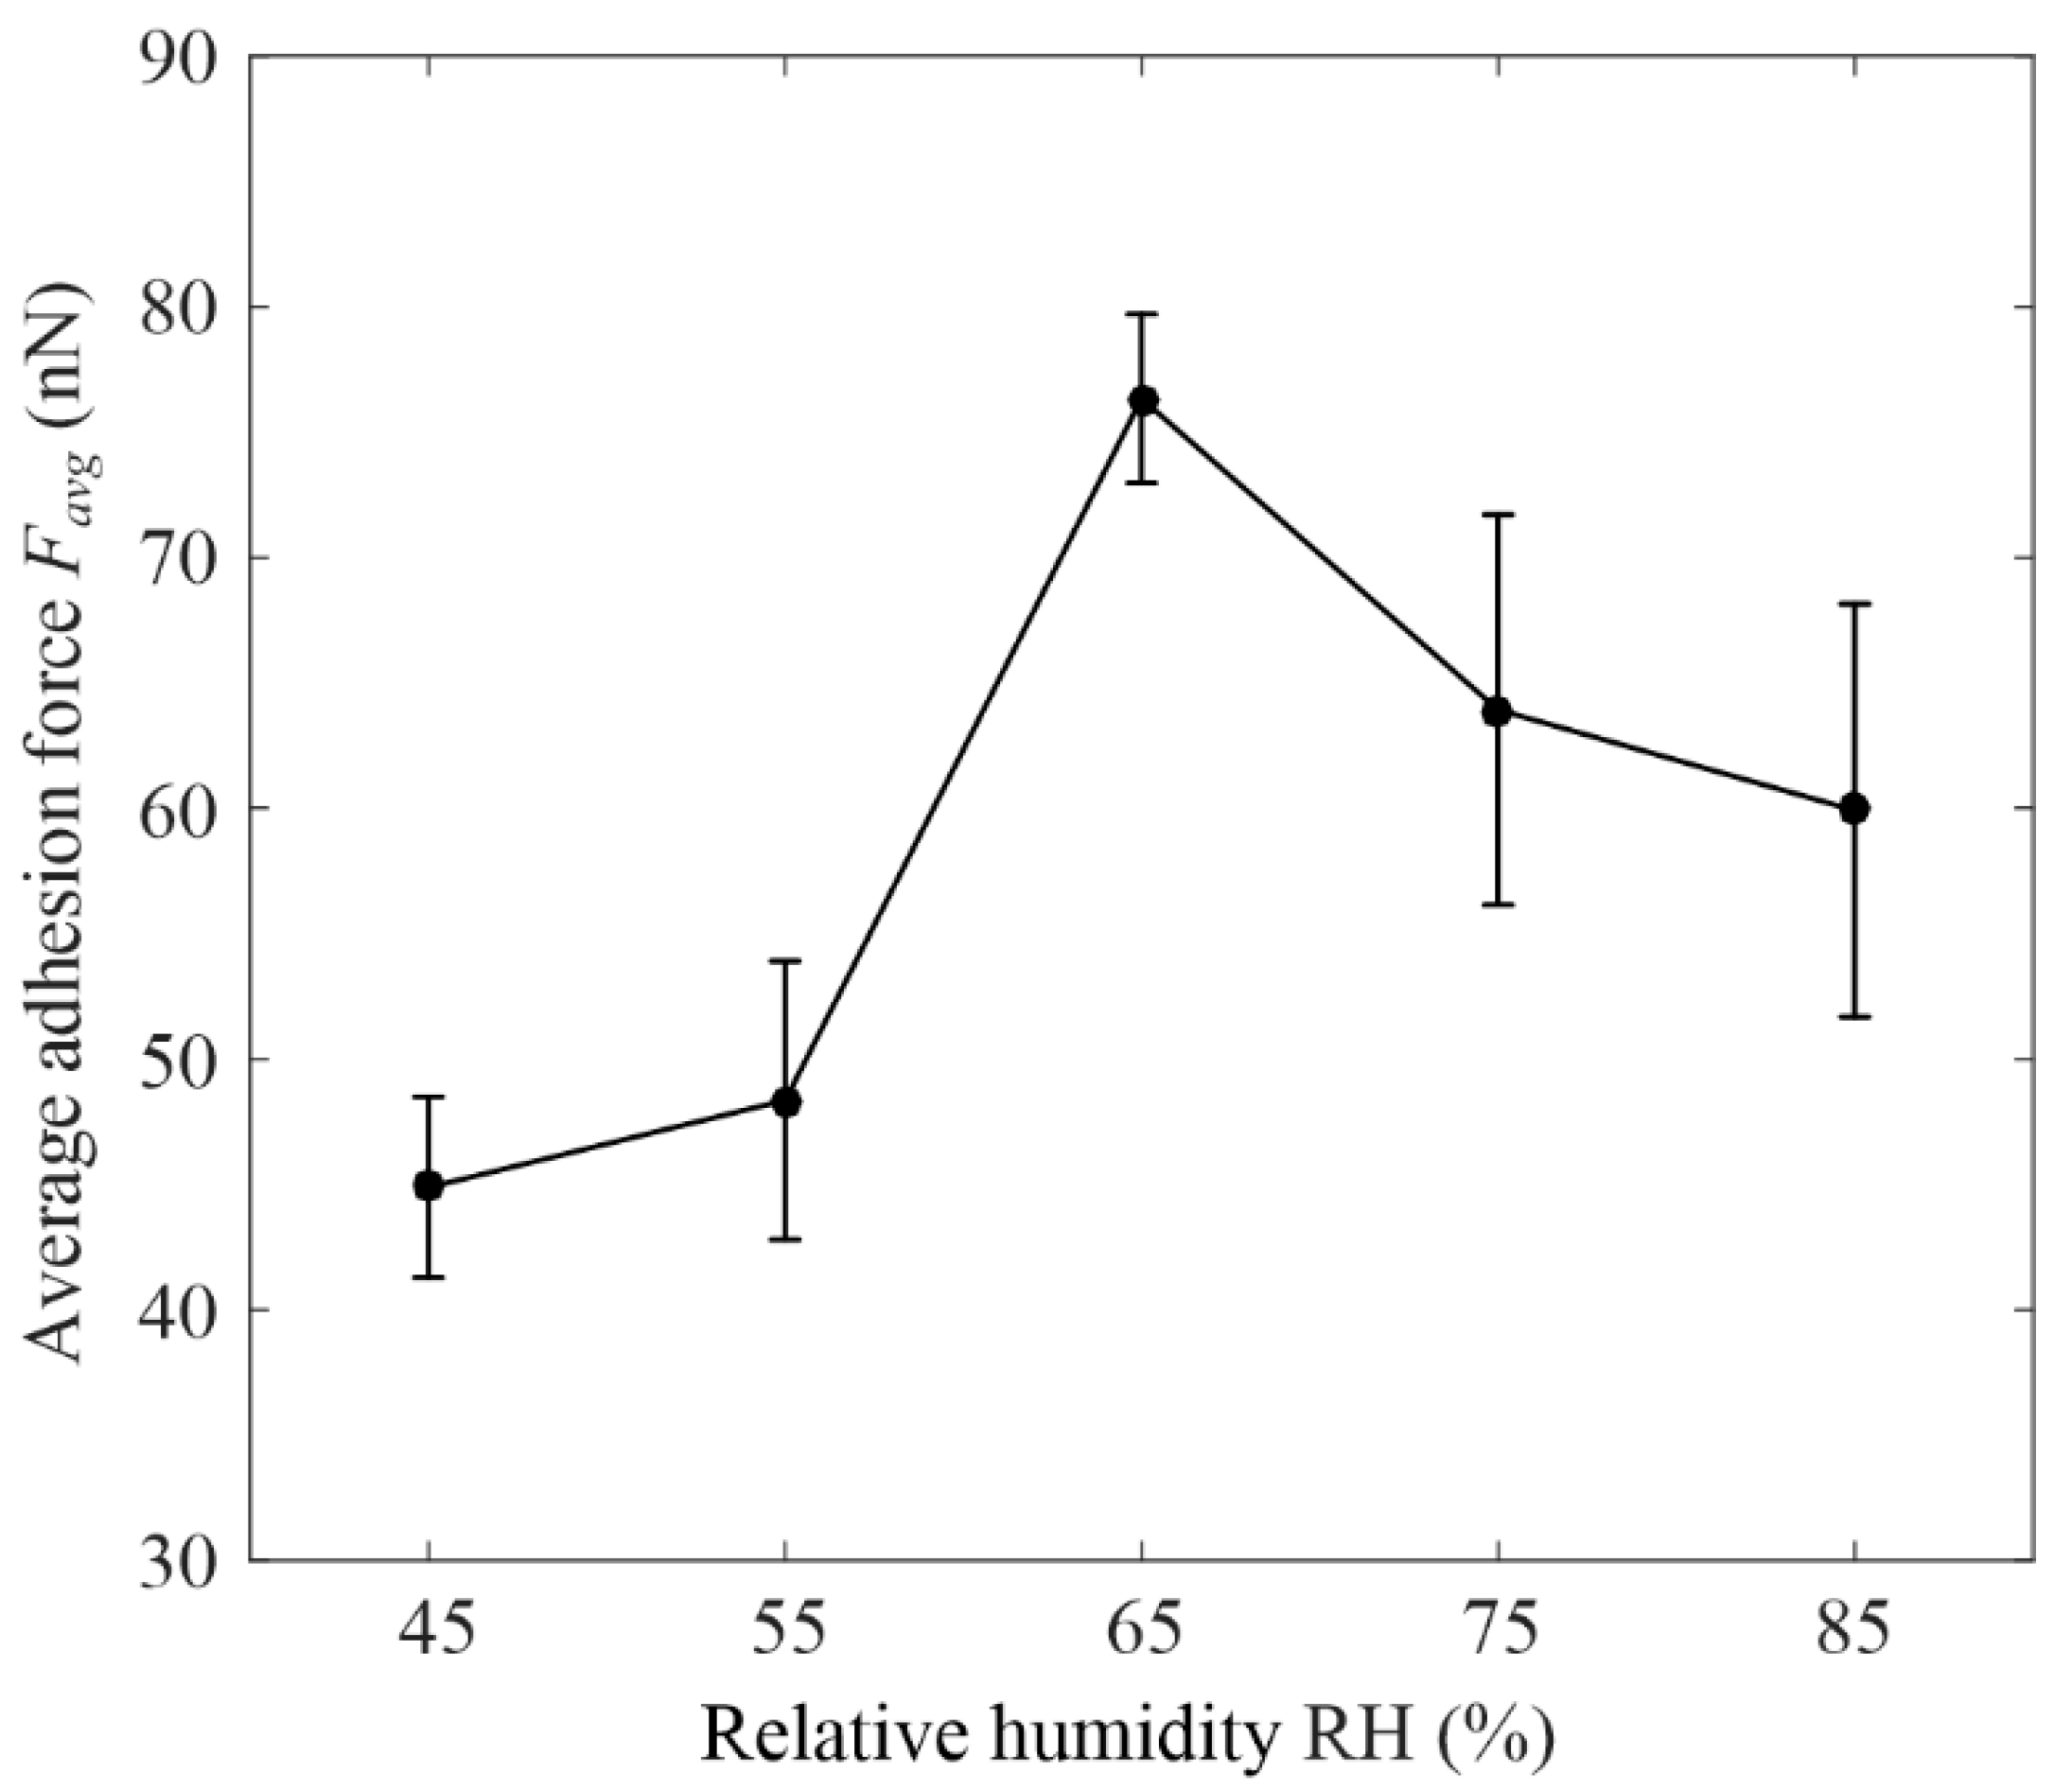
Figure 8 shows the variation rule of graphene adhesion force with the relative humidity under cylinder–plane contact. The data in the figure were obtained by solving the mean and variance of adhesion forces for each RH in Figure 7. It was shown that when RH ≤ 55%, the graphene adhesion force and RH curves was stable, and its variance was less than 10 nN. This may be because a meniscus did not form, and the adhesion force was dominated by other forces, such as the vdW force, which was independent of RH [29]. When 55% ≤ RH ≤ 75%, the graphene adhesion force increased rapidly with increasing RH, reaching a peak at 76.34 ± 3.37 nN, when the RH was 65%. The rapid increase in adhesion force was related to the formation of a meniscus. The size of the meniscus increased with the increase in RH, so the graphene adhesion force increased rapidly. When RH ≥ 75%, the graphene adhesion force decreased with increased RH because a water film formed on the surface of the graphene.
The water film was composed of a hydration layer, a water bridge, and nucleation [46]. At a low RH, there was only a hydration layer or a small water-bridge layer, so the size of the meniscus was not affected by the thickness of the water film. As the thickness of the water film increased at a high RH, the water bridge layer flowed towards the meniscus, resulting in the surface of the sample in the contact area being filled with water and the adhesion force being reduced.
4.3. Theoretical Results
It can be seen from Figure 2 that the radius of the cylindrical probe was 1 μm, but when using the above theory to calculate, the influence of the surface roughness of the cylindrical probe and graphene must be considered, and the actual contact area should be much less than 2 μm. In this paper, the surface roughness r2 ≈ 2 nm of graphene was measured by AFM, and the contact area was considered to be a number of nanoscale cylinders in contact with the plane. The number of cylinders was kc and the radius was rc. In this paper, the radius rc was given as 10 nm. Meanwhile, the Hamaker constant , D0 = 0.165 nm [47]. According to Equation (2), it was found that . Due to the adhesion in the atmospheric environment, was used as the reference value.
Therefore, Equations (1) and (6) can be changed to:
According to Equation (6), the magnitude of the adhesion force does not include the parameters θ2. It means that the adhesion force is independent of the contact angle of the substrate. However, it was reported that the more hydrophilic the substrate, the greater the adhesion force [48,49]. Therefore, it is necessary to add θ2 into the parameter kc. In addition, the higher RH, the larger the number of meniscus, so kc is proportional to RH [44]. Ultimately, we combined the roughness calculation model of the vdW force with the modified Rumpf model [50], and based on experimental data, the number of cylinders kc was determined:
where P/P0 is the current RH value and θ2 is the VWCA of the substrate sample surface.
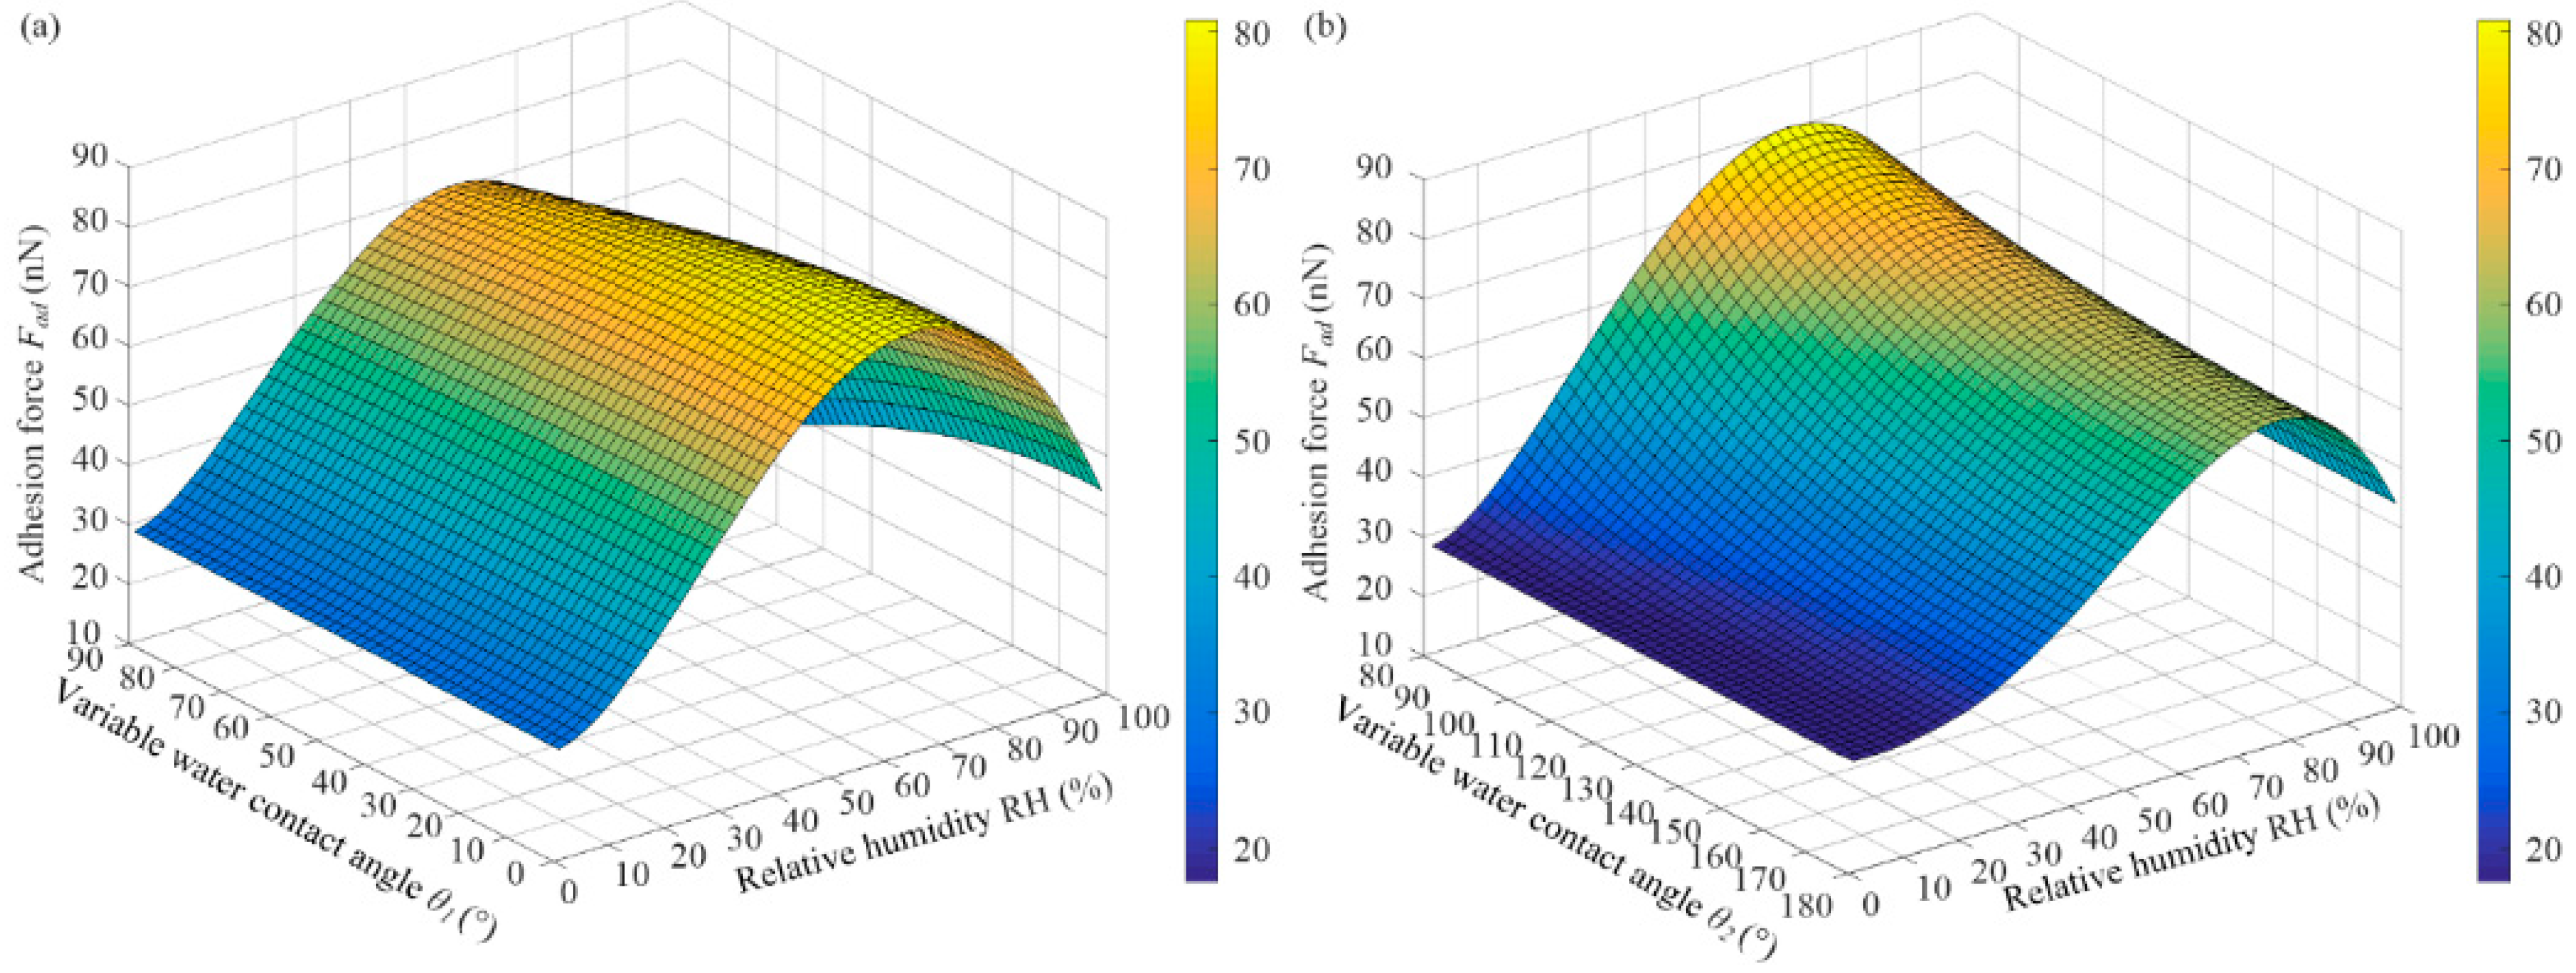
Figure 9 shows the variation rule of the theoretical graphene adhesion force with VWCA. The function with the adhesion force and VWCA θ1 was obtained from Equations (8) and (9). is the graphene static contact angle, and water-surface tension is γL = 71.99 mN/m [21]. In the initial stage, θ2 remained unchanged, and VWCA θ1 decreased from 90° to 0° with the increase in the meniscus (see Figure 5a–c). When RH remained unchanged, the graphene adhesion force increased with the decreasing VWCA θ1, but the rate of increase decreased gradually (see Figure 9a).
With the increase in RH or dwell time, a water film appeared on the surface of the graphene, a water film condensed on the graphene surface, and the water film could change from an ice-like state to a liquid state [9]. The more hydrophilic the sample, the easier it was to form a water film on the surface. The rise in the water film caused the VWCA θ2 on the graphene surface to increase from 80° to 180°, resulting in a decrease in adhesion force, and the adhesion force eventually became stable (see Figure 9b).
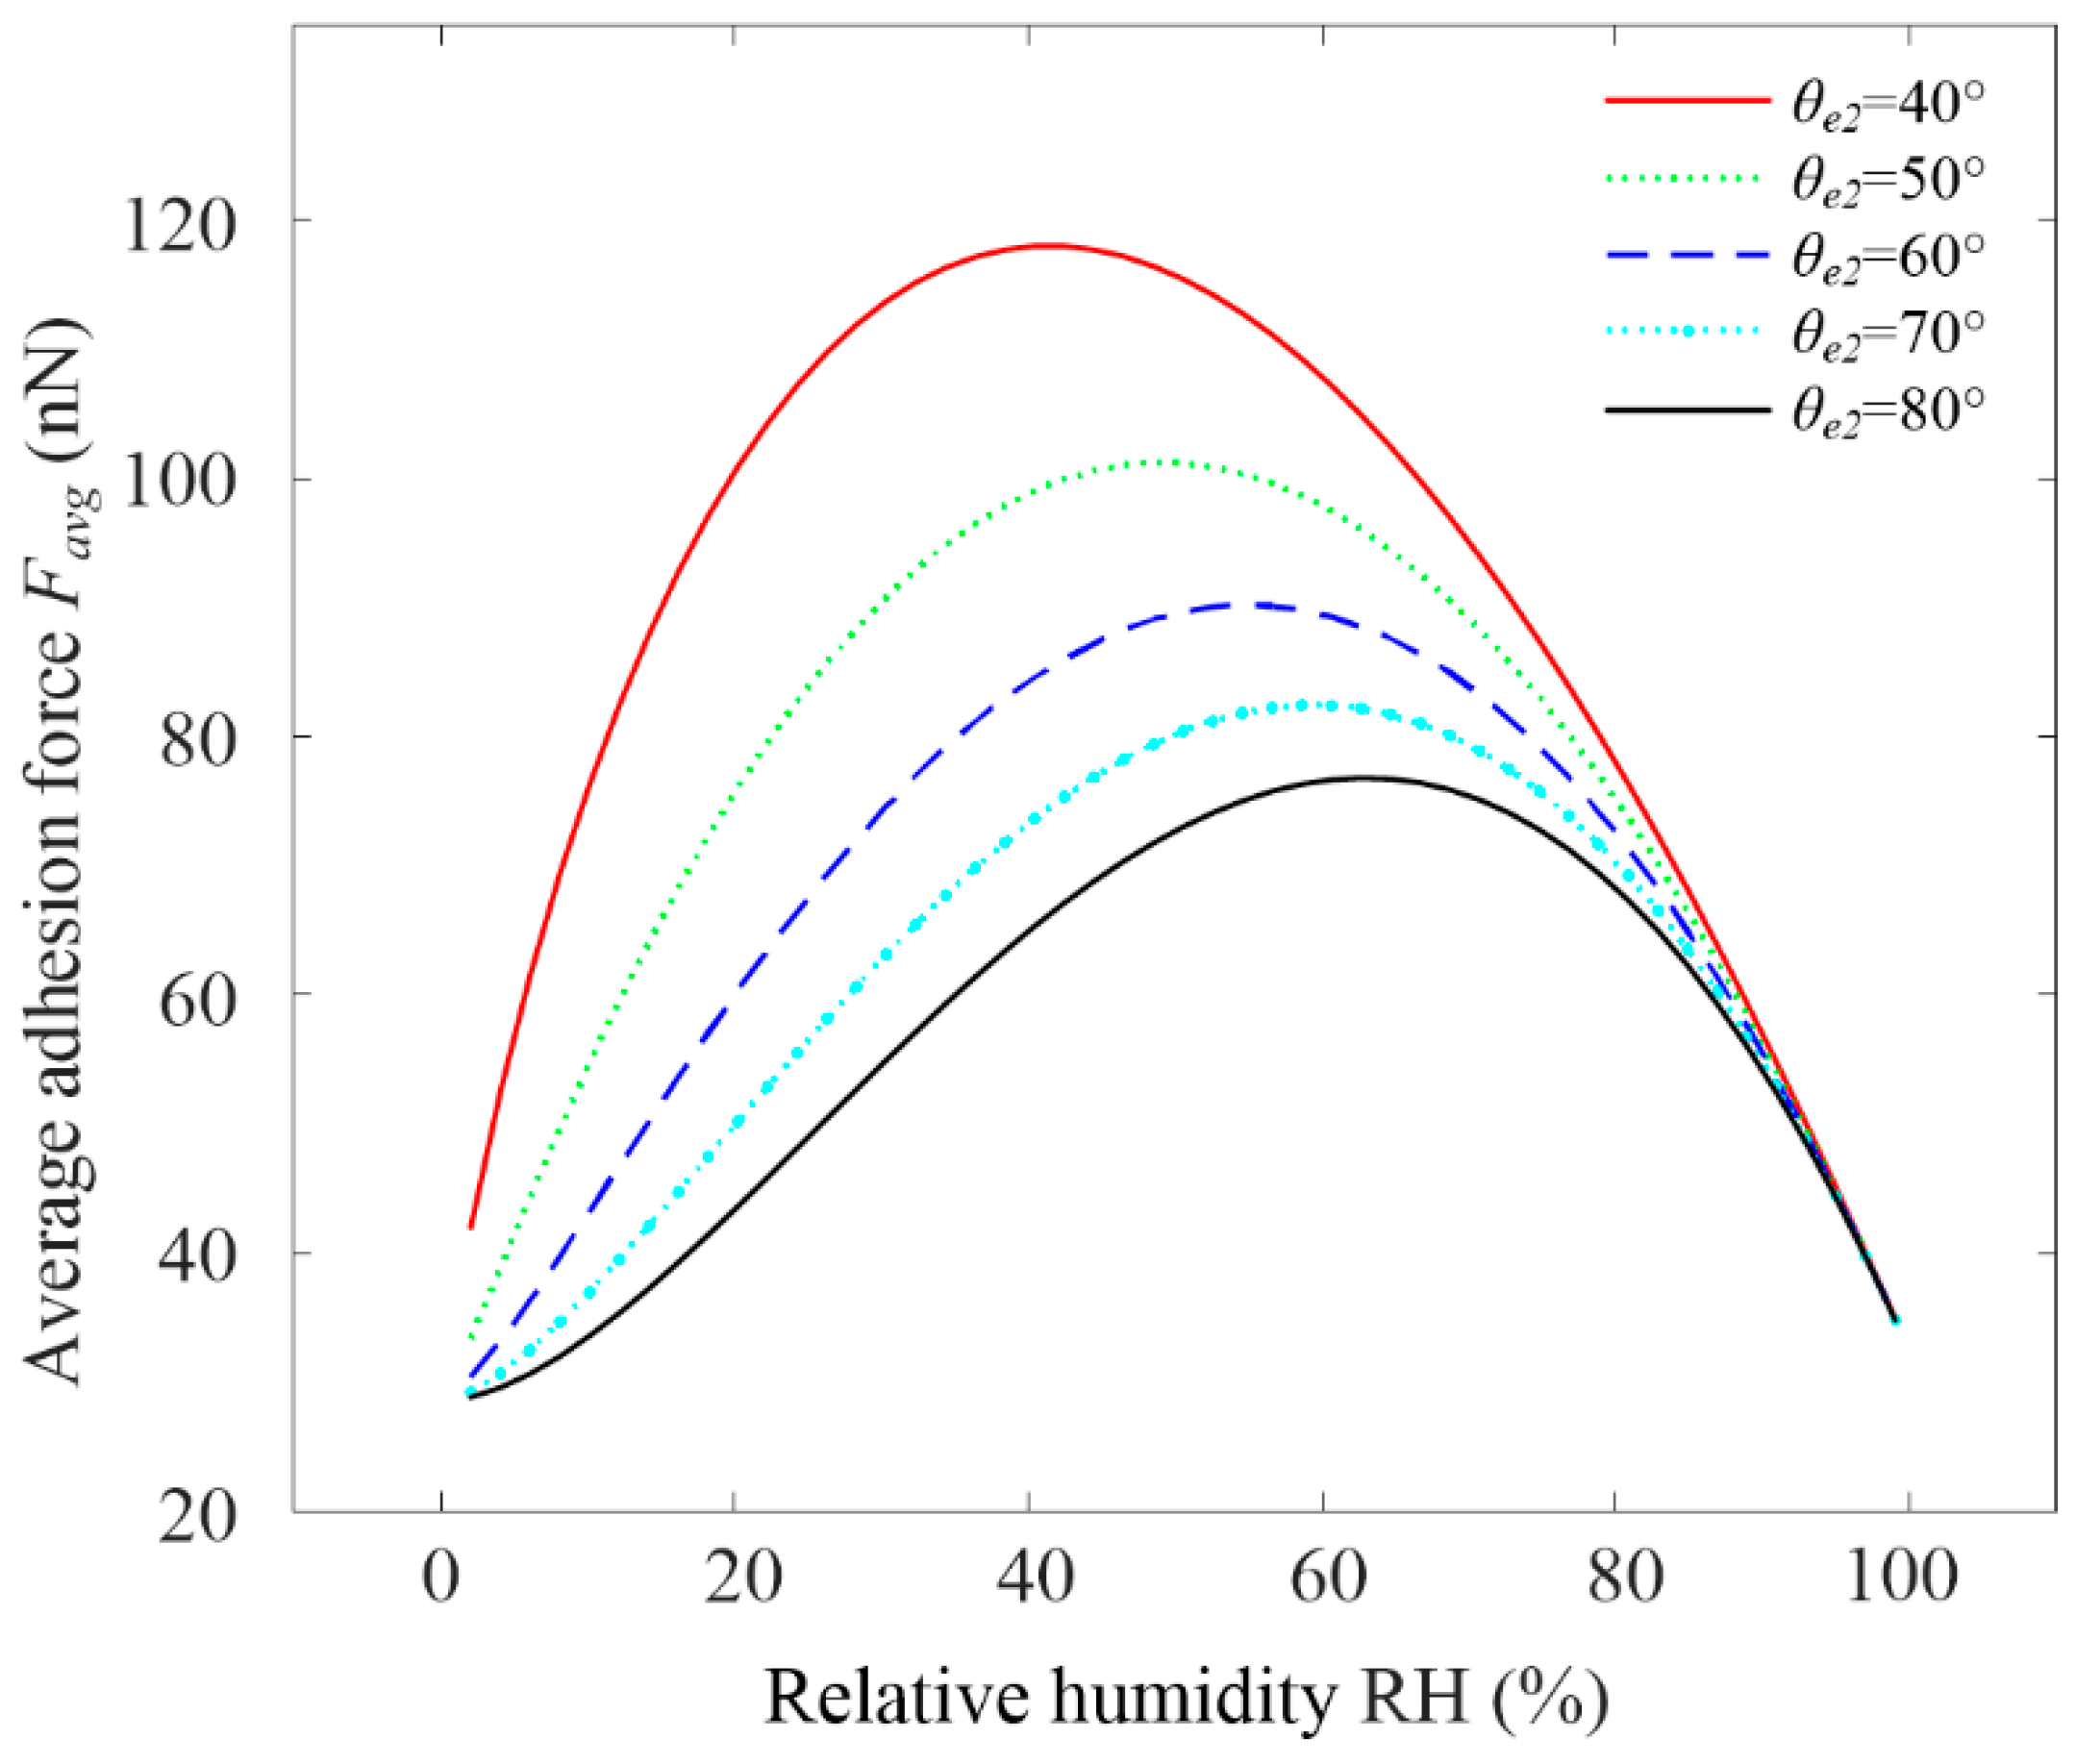
Figure 10 shows the variation rule of the theoretical graphene adhesion force with a static contact angle θe2 and RH. The average adhesion force Favg in the figure refers to the average of all adhesion forces when decreased from 90° to 0° under a certain RH. the adhesion force of graphene increased with the RH and had a maximum value. The adhesion force of the small static contact angle θe2 was higher than the corresponding value of the large static contact angle θe2, because the smaller the static contact angle θe2, the more hydrophilic it was. Moreover, the peak adhesion force for the smaller static contact angle θe2 appeared at lower a RH, which was consistent with the actual measurement in some of the relevant literature [12,49]. It should be noted that chemical reaction or group adsorption on the contact surface was not considered.
4.4. Comparison of Experimental and Theoretical Results
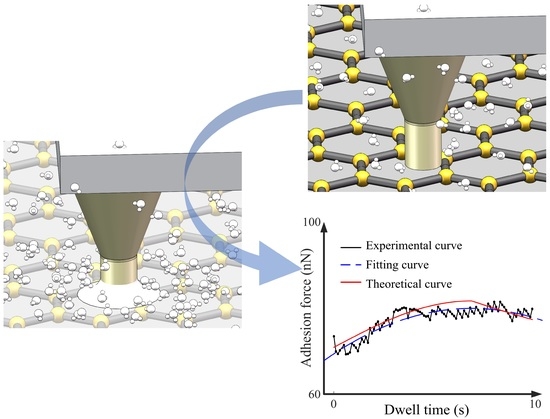
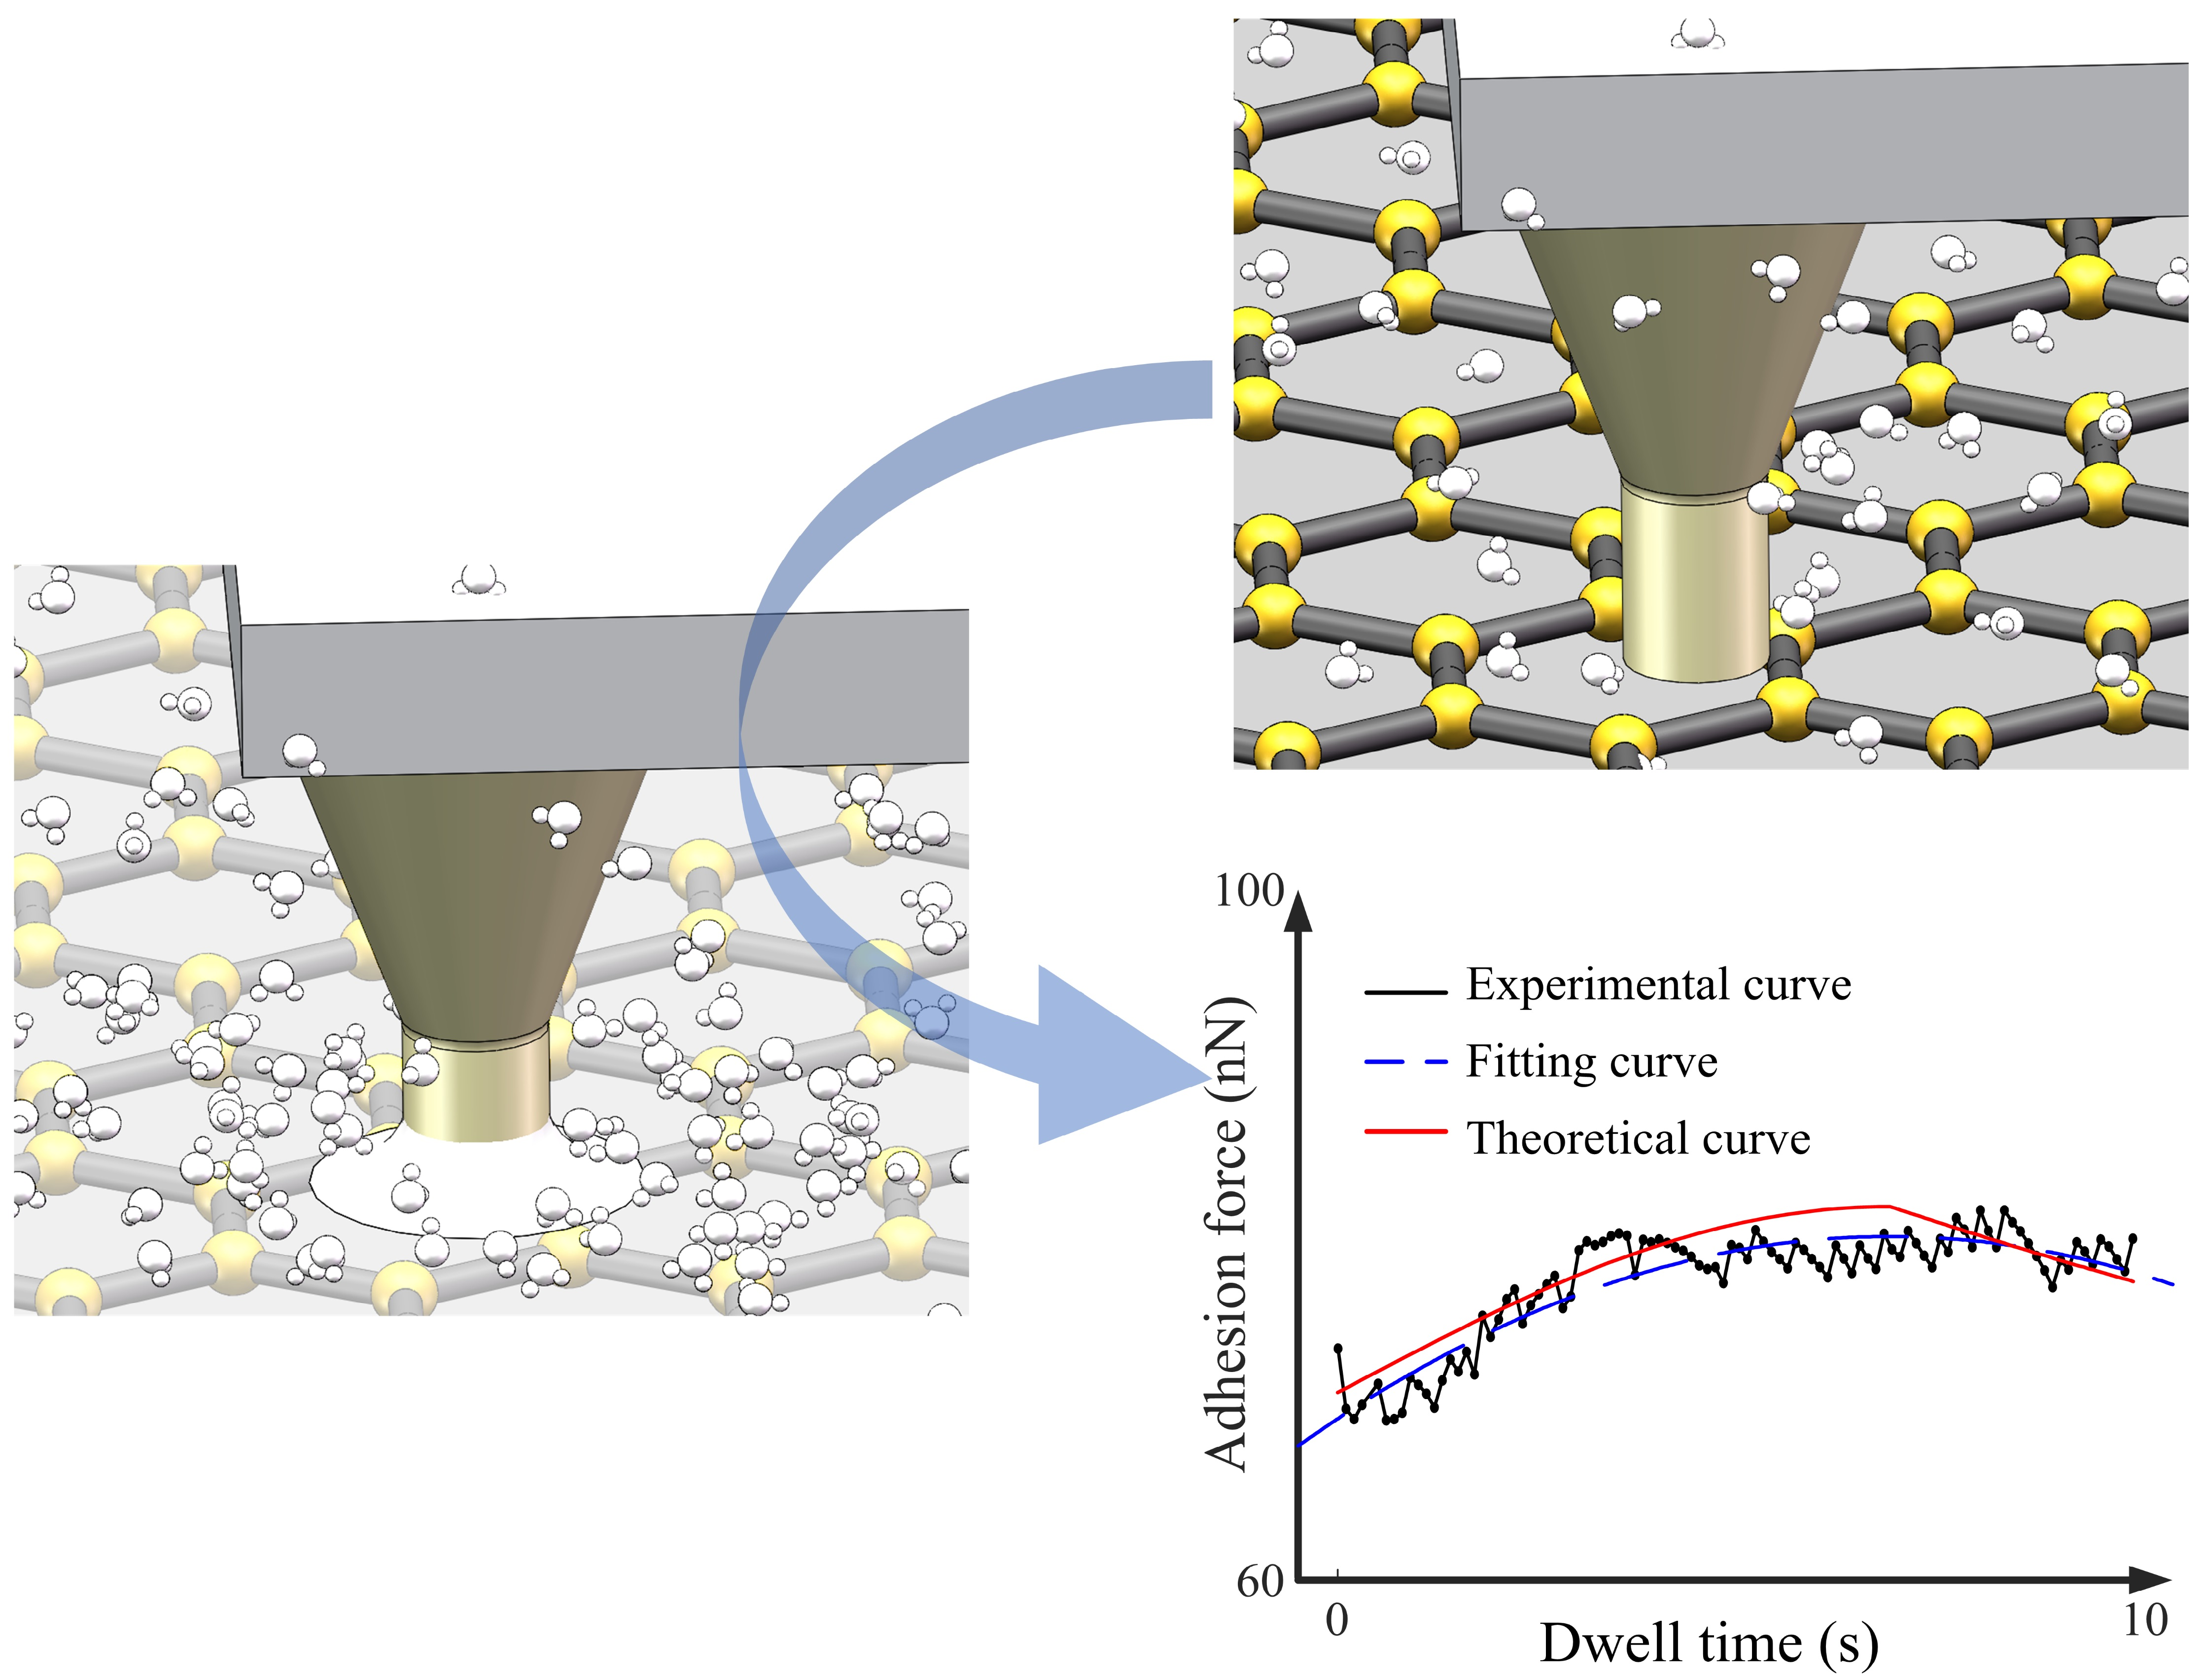
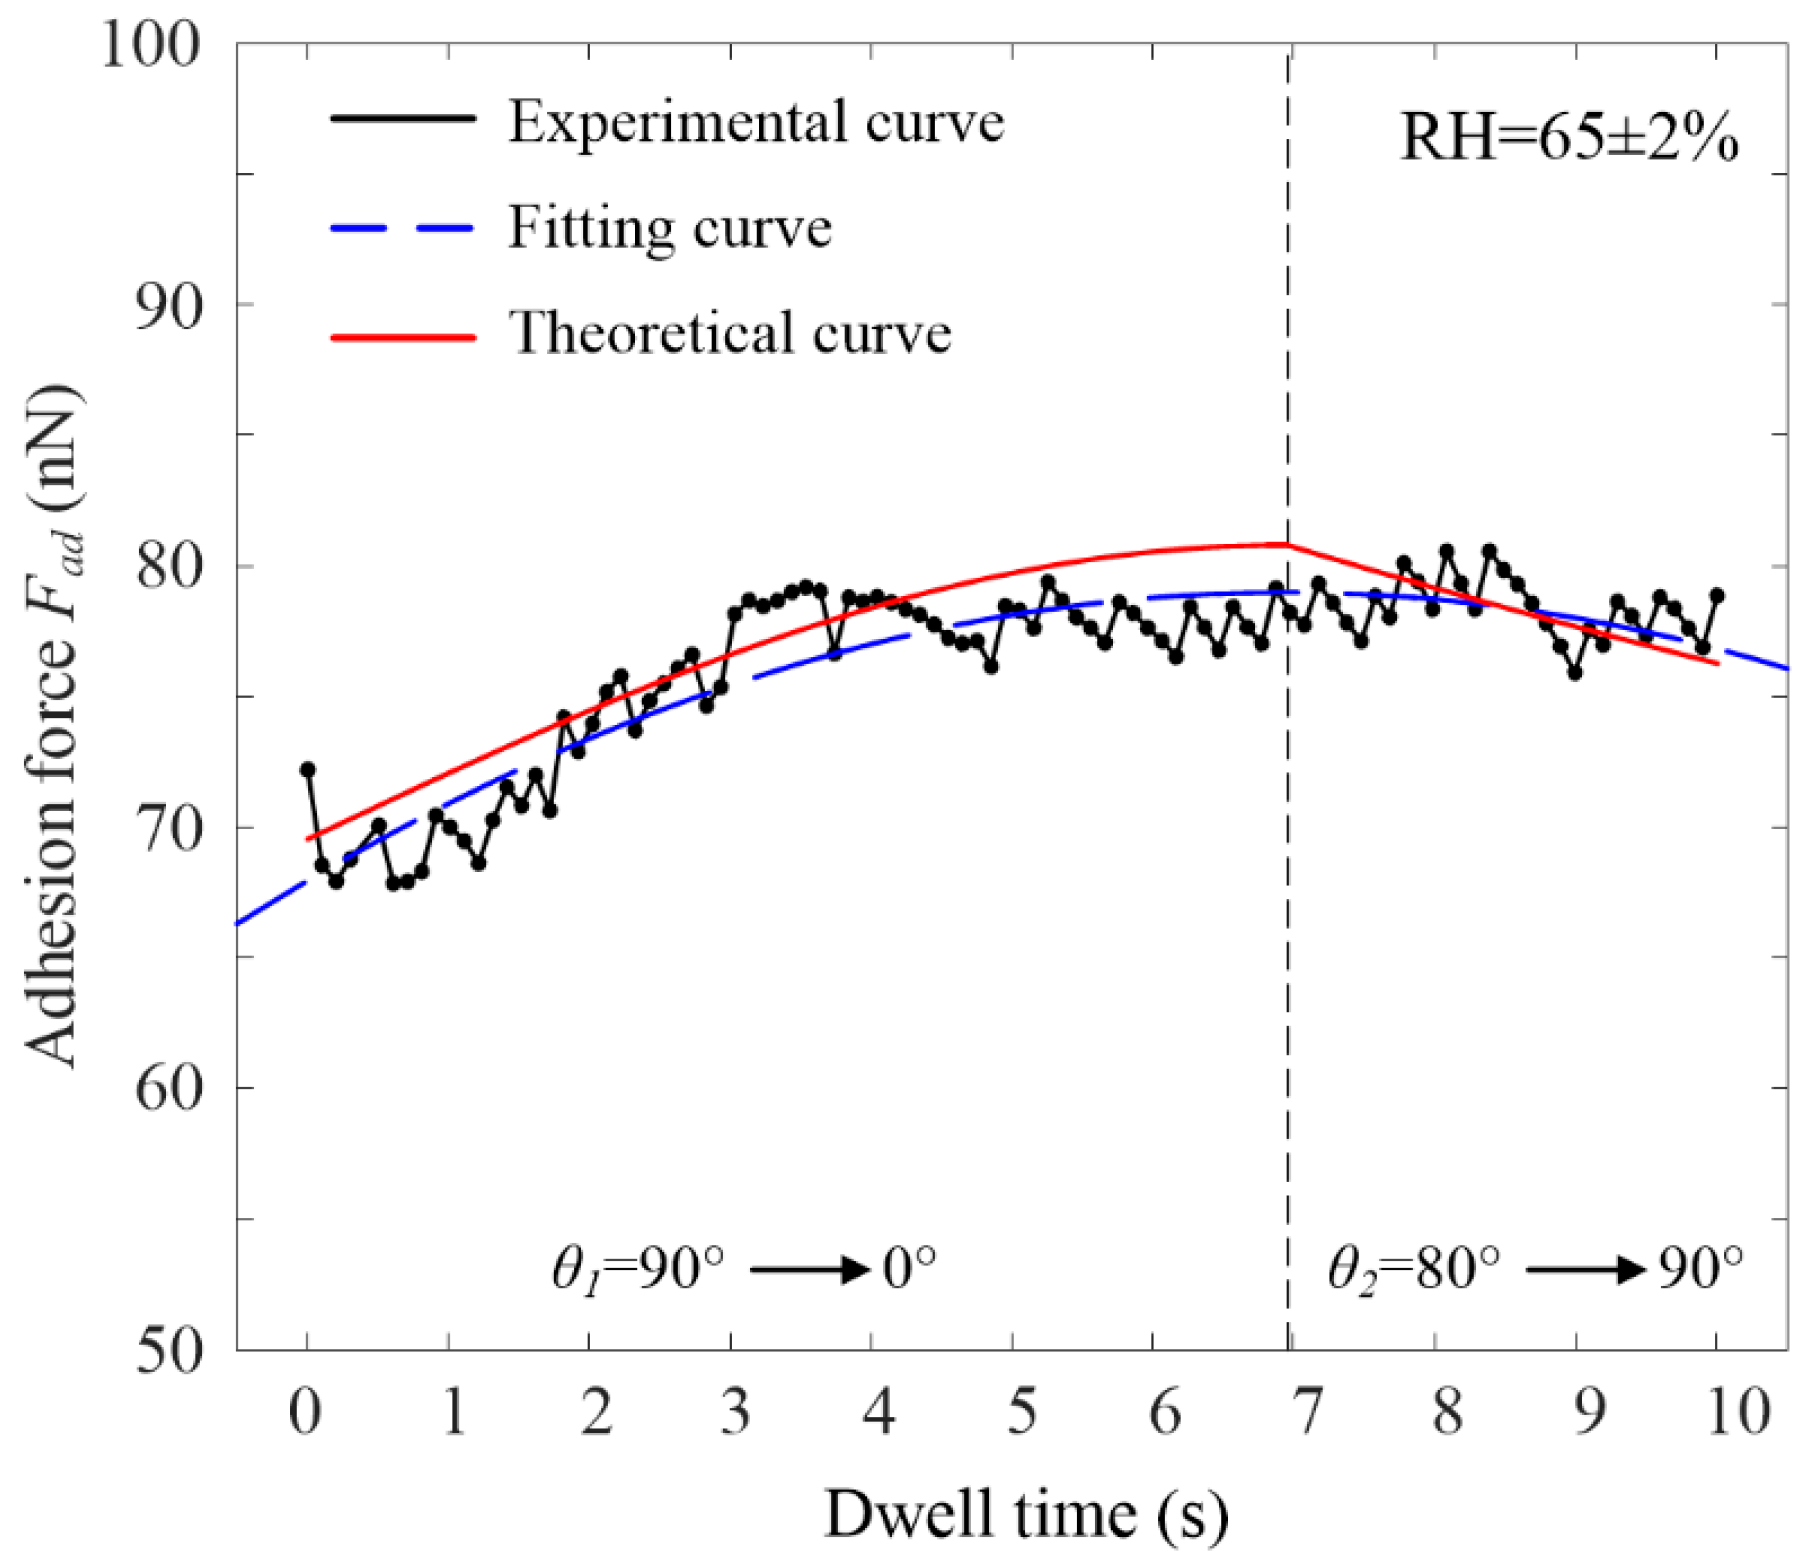
Figure 11 is a comparison of experimental and theoretical adhesion forces under cylinder–plane contact. In this work, the adhesion force of graphene was compared when the RH was 65%. The experimental value was fitted by the quadratic fitting method, and the equation is:
According to the fitting equation, its symmetry axis is t0 = 6.93 s. At the same time, the relationship between VWCA θ1, VWCA θ2, and dwell time t was established according to the change in adhesion force:
Its initial conditions were: t = 0, θ1 = 90°; t = 6.93, θ1 = 0°, θ2 = 80°; t = 10, and θ2 = 90°. It was calculated that k1 = −0.23, b1 = 1.57, k2 = 0.057, and b2 = 1. The relationship between dwell time and adhesion force can be obtained from Equations (8), (9) and (11) (see Figure 11). As seen in the figure, when the dwell time was in the range of 0–6.93 s, the meniscus was in the growth stage, θ1 decreased from 90° to 0°, and the adhesion force increased until it peaked at the dwell time of 6.93 s. When the dwell time was in the range of 6.93–10 s, a water film could be generated on the graphene surface, which increased θ2 from 80° to 90°, and the adhesion decreased. The fitting degree of the fitted curve was 82%, and the maximum error between the theoretical curve and the experimental curve was only about 6%.
5. Conclusions
When two surfaces are pressed under high pressure or the cylinder contacts a plane at a micro and nano scale, the adhesion force of the cylinder–plane contact needs to be studied. Moreover, the effect of dwell time on adhesion force under cylinder–plane contact is also unclear. Therefore, based on the variable-water-contact-angle (VWCA) and the roughness theory related to the vdW force, the effect of dwell time and RH on the graphene adhesion force under cylinder–plane contact was studied. The main conclusions are:
- At a low relative humidity (RH < 45%) under cylinder–plane contact, dwell time had little effect on graphene adhesion force. When RH was 55% and 65%, the adhesion force-versus-time curve had a maximum value and eventually tended to be stable. When RH was 75% and 85%, the adhesion force-versus-time curve decreased and tended to be stable.
- Meniscus cannot be formed at low RH. At RH > 55%, the meniscus condensed in the cylinder’s contact area. First, the VWCA of graphene was 80° and remained constant. The VWCA of the cylindrical probe decreased when the Kelvin circle moved horizontally outward until it was tangent to the cylinder. Finally, when the RH was high, a water film formed on the surface of the graphene, causing the VWCA of graphene to increase, resulting in a decrease in adhesion force.
- Theoretically, it is necessary to consider the influence of the roughness of the cylindrical probe and the graphene surface. Therefore, the contact area was considered to be a number of nanoscale cylinders in contact with the plane. Finally, combining the roughness calculation model of the vdW force with the modified Rumpf model, the adhesion force model of the cylinder–plane contact was obtained in terms of dwell time and VWCA. The maximum error between the theoretical curve and the experimental curve was only about 6%.
Author Contributions
Conceptualization, K.S. and M.H.; methodology, K.S.; software, K.S.; validation, K.S.; formal analysis, K.S.; investigation, K.S.; resources, K.S., P.H. and M.H.; data curation, K.S.; writing—original draft preparation, K.S.; writing—review and editing, K.S. and M.H.; visualization, K.S. and M.H.; supervision, P.H. and M.H.; project administration, P.H. and M.H.; funding acquisition, P.H. and M.H. All authors have read and agreed to the published version of the manuscript.
Funding
This research was funded by the National Natural Science Foundation of China, grant number 51575190, and the Basic and Applied Basic Research Foundation of Guangdong Province (2020A1515111200).
Institutional Review Board Statement
Not applicable.
Informed Consent Statement
Not applicable.
Data Availability Statement
Not applicable.
Conflicts of Interest
The authors declare no conflict of interest.
References
- Novoselov, K.S.; Fal’ko, V.I.; Colombo, L.; Gellert, P.R.; Schwab, M.G.; Kim, K. A roadmap for graphene. Nature 2012, 490, 192–200. [Google Scholar] [CrossRef] [PubMed]
- Yu, W.; Sisi, L.; Haiyan, Y.; Jie, L. Progress in the functional modification of graphene/graphene oxide: A review. RSC Adv. 2020, 10, 15328–15345. [Google Scholar] [CrossRef]
- Xia, F.; Mueller, T.; Lin, Y.M.; Valdes-Garcia, A.; Avouris, P. Ultrafast graphene photodetector. Nat. Nanotechnol. 2009, 4, 839–843. [Google Scholar] [CrossRef] [Green Version]
- Markandan, K.; Zhang, Z.; Chin, J.; Cheah, K.H.; Tang, H.-B. Fabrication and preliminary testing of hydroxylammonium nitrate (HAN)-based ceramic microthruster for potential application of nanosatellites in constellation formation flying. Microsyst. Technol. 2019, 25, 4209–4217. [Google Scholar] [CrossRef] [Green Version]
- Lv, C.; Hu, C.; Luo, J.; Liu, S.; Qiao, Y.; Zhang, Z.; Song, J.; Shi, Y.; Cai, J.; Watanabe, A. Recent advances in graphene-based humidity sensors. Nanomaterials 2019, 9, 422. [Google Scholar] [CrossRef] [PubMed] [Green Version]
- Zhao, Y.-P.; Wang, L.S.; Yu, T.X. Mechanics of adhesion in MEMS—A review. J. Adhesion Sci. Technol. 2003, 17, 519–546. [Google Scholar] [CrossRef]
- Melios, C.; Giusca, C.E.; Panchal, V.; Kazakova, O. Water on graphene: Review of recent progress. 2D Mater. 2018, 5, 022001. [Google Scholar] [CrossRef] [Green Version]
- Pourzand, H.; Tabib-Azar, M. Graphene thickness dependent adhesion force and its correlation to surface roughness. Appl. Phys. Lett. 2014, 104, 171603. [Google Scholar] [CrossRef] [Green Version]
- Lai, T.M.; Zhu, T.; Chen, Y.G.; Guo, M.L. Different evolution behaviors of adhesion force with relative humidity at silica/silica and silica/graphene interfaces studied using atomic force microscopy. Langmuir 2021, 37, 13075–13084. [Google Scholar] [CrossRef]
- Zhu, J.; Deng, H.; Xue, W.; Wang, Q. Effect of low temperature oxygen plasma treatment on microstructure and adhesion force of graphene. Appl. Surf. Sci. 2018, 428, 941–947. [Google Scholar] [CrossRef]
- Wei, Z.; Sun, Y.; Ding, W.; Wang, Z. The formation of liquid bridge in different operating modes of AFM. Sci. China Phys. Mech. 2016, 59, 694611. [Google Scholar] [CrossRef]
- Butt, H.-J.; Cappella, B.; Kappl, M. Force measurements with the atomic force microscope: Technique, interpretation and applications. Surf. Sci. Rep. 2005, 59, 1–152. [Google Scholar] [CrossRef] [Green Version]
- Dos Santos Ferreira, O.; Gelinck, E.; de Graaf, D.; Fischer, H. Adhesion experiments using an AFM—Parameters of influence. Appl. Surf. Sci. 2010, 257, 48–55. [Google Scholar] [CrossRef]
- Xiao, X.D.; Qian, L.M. Investigation of humidity-dependent capillary force. Langmuir 2000, 16, 8153–8158. [Google Scholar] [CrossRef]
- Butt, H.J.; Farshchi-Tabrizi, M.; Kappl, M. Using capillary forces to determine the geometry of nanocontacts. J. Appl. Phys. 2006, 131, 184702. [Google Scholar] [CrossRef]
- Lai, T.; Li, P. Direct Evidence of a Radius of Collection Area for Thin Film Flow in Liquid Bridge Formation by Repeated Contacts Using AFM. Langmuir 2019, 35, 6585–6593. [Google Scholar] [CrossRef]
- Obata, K.J.; Motokado, T.; Saito, S.; Takahashi, K. A scheme for micro-manipulation based on capillary force. J. Fluid Mech. 2004, 498, 113–121. [Google Scholar] [CrossRef]
- Rabinovich, Y.I.; Singh, A.; Hahn, M.; Brown, S.; Moudgil, B. Kinetics of liquid annulus formation and capillary forces. Langmuir 2011, 27, 13514–13523. [Google Scholar] [CrossRef]
- Weeks, B.L.; Vaughn, M.W.; Deyoreo, J.J. Direct imaging of meniscus formation in atomic force microscopy using environmental scanning electron microscopy. Langmuir 2005, 21, 8096–8098. [Google Scholar] [CrossRef]
- Qian, J.; Gao, H. Scaling effects of wet adhesion in biological attachment systems. Acta Biomater. 2006, 2, 51–58. [Google Scholar] [CrossRef]
- Yang, Q.; Sun, P.Z.; Fumagalli, L.; Stebunov, Y.V.; Haigh, S.J.; Zhou, Z.W.; Grigorieva, I.V.; Wang, F.C.; Geim, A.K. Capillary condensation under atomic-scale confinement. Nature 2020, 588, 250–253. [Google Scholar] [CrossRef]
- Lai, T.; Huang, P. Study on microscale adhesion between solid surfaces with scanning probe. Sci. China Technol. Sci. 2013, 56, 2934–2952. [Google Scholar] [CrossRef]
- Çolak, A.; Wormeester, H.; Zandvliet, H.J.W.; Poelsema, B. Surface adhesion and its dependence on surface roughness and humidity measured with a flat tip. Appl. Surf. Sci. 2012, 258, 6938–6942. [Google Scholar] [CrossRef]
- Boucher, E.A.; Evans, M.J.B.; McGarry, S. Capillary phenomena. XX. Fluid bridges between horizontal solid plates in a gravitational field. J. Colloid Interf. Sci. 1982, 89, 154–165. [Google Scholar] [CrossRef]
- Tselishchev, Y.G.; Val’Tsifer, V.A. Influence of the type of contact between particles joined by a liquid bridge on the capillary cohesive forces. Colloid J. 2003, 65, 385–389. [Google Scholar] [CrossRef]
- De Souza, E.J.; Brinkmann, M.; Mohrdieck, C.; Crosby, A.; Arzt, E. Capillary Forces between Chemically Different Substrates. Langmuir 2008, 24, 10161–10168. [Google Scholar] [CrossRef]
- De Souza, E.J.; Brinkmann, M.; Mohrdieck, C.; Arzt, E. Enhancement of Capillary Forces by Multiple Liquid Bridges. Langmuir 2008, 24, 8813–8820. [Google Scholar] [CrossRef] [PubMed]
- Butt, H.J.; Kappl, M. Normal capillary forces. Adv. Colloid Interfac. 2009, 146, 48–60. [Google Scholar] [CrossRef] [PubMed]
- Farshchi-Tabrizia, M.; Kappl, M.; Butt, H.-J. Influence of humidity on adhesion: An atomic force microscope study. J. Adhes. Sci. Technol. 2008, 22, 181–203. [Google Scholar] [CrossRef]
- van Spengen, W.M. The Electrostatic Actuation of MEMS with High Voltage Amplifiers. Falco Systems Application Note: 2018. Available online: http://www.falco-systems.com/the_electrostatic_actuation_of_MEMS_with_high_voltage_amplifiers.html (accessed on 1 October 2022).
- Spengen, W.M.V.; Puers, R.; Wolf, I.D. A physical model to predict stiction in MEMS. J. Micromech. Microeng. 2002, 12, 702–713. [Google Scholar] [CrossRef]
- Wang, L.-F.; Huang, Q.-A.; Han, L. RF MEMS Switch. In Microbial Toxins; Springer: Singapore, 2017; pp. 1–38. [Google Scholar] [CrossRef]
- Gkouzou, A.; Kokorian, J.; Janssen, G.C.A.M.; van Spengen, W.M. Controlling adhesion between multi-asperity contacting surfaces in MEMS devices by local heating. J. Micromech. Microeng. 2016, 26, 095020. [Google Scholar] [CrossRef] [Green Version]
- Zang, X.; Zhou, Q.; Chang, J.; Liu, Y.; Lin, L. Graphene and carbon nanotube (CNT) in MEMS/NEMS applications. Microelectron. Eng. 2015, 132, 192–206. [Google Scholar] [CrossRef]
- Fan, X.; Forsberg, F.; Smith, A.D.; Schröder, S.; Wagner, S.; Rödjegård, H.; Fischer, A.C.; Östling, M.; Lemme, M.C.; Niklaus, F. Graphene ribbons with suspended masses as transducers in ultra-small nanoelectromechanical accelerometers. Nat. Electron. 2019, 2, 394–404. [Google Scholar] [CrossRef] [Green Version]
- Shi, K.; Hu, M.F.; Huang, P. Influences of relative humidity and dwell time on silica/graphene adhesion force of a cone-plane contact. Langmuir 2022, 38, 12432–12440. [Google Scholar] [CrossRef] [PubMed]
- Lai, T.M.; Chen, M.; Zhang, Y.T. Contact time dependence of adhesion force at silica/silica interface on AFM: Influence of relative humidity and contact history. Appl. Surf. Sci. 2022, 600, 154175. [Google Scholar] [CrossRef]
- Lai, T.; Guo, M.; Chen, Y.; Zhu, T. Shielding effect of hydrophobic graphene on contact time dependence of adhesion force and instability with repeated contacts at silica/silica interface. J. Adhesion 2022, 99, 449–472. [Google Scholar] [CrossRef]
- Sirghi, L. Transport mechanisms in capillary condensation of water at a single-asperity nanoscopic contact. Langmuir 2012, 28, 2558–2566. [Google Scholar] [CrossRef]
- Malard, L.M.; Pimenta, M.A.; Dresselhaus, G.; Dresselhaus, M.S. Raman spectroscopy in graphene. Phys. Rep. 2009, 473, 51–87. [Google Scholar] [CrossRef]
- Ferrari, A.C.; Meyer, J.C.; Scardaci, V.; Casiraghi, C.; Lazzeri, M.; Mauri, F.; Piscanec, S.; Jiang, D.; Novoselov, K.S.; Roth, S.; et al. Raman spectrum of graphene and graphene layers. Phys. Rev. Lett. 2006, 97, 187401. [Google Scholar] [CrossRef] [Green Version]
- Wei, Z.; Zhao, Y.P. Growth of liquid bridge in AFM. J. Phy. D Appl. Phys. 2007, 40, 4368–4375. [Google Scholar] [CrossRef]
- Tang, B.Y.; Tang, C.; Chen, L.; Xiao, C.; Rosenkranz, A.; Qian, L.M. Nanoscopic humidity-dependent adhesion behaviors of 2D materials. Appl. Surf. Sci. 2022, 572, 151394. [Google Scholar] [CrossRef]
- Bazrafshan, M.; de Rooij, M.B.; Schipper, D.J. Adhesive force model at a rough interface in the presence of thin water films: The role of relative humidity. Int. J. Mech. Sci. 2018, 140, 471–485. [Google Scholar] [CrossRef]
- Sun, Y.; Li, Y.; Dong, X.; Bu, X.; Drelich, J.W. Spreading and adhesion forces for water droplets on methylated glass surfaces. Colloids Surf. A Physicochem. Eng. Asp. 2020, 591, 124562. [Google Scholar] [CrossRef]
- Uhlig, M.R.; Garcia, R. In Situ Atomic-Scale Imaging of Interfacial Water under 3D Nanoscale Confinement. Nano Lett. 2021, 21, 5593–5598. [Google Scholar] [CrossRef] [PubMed]
- Chiou, Y.C.; Olukan, T.A.; Almahri, M.A.; Apostoleris, H.; Chiu, C.H.; Lai, C.Y.; Lu, J.Y.; Santos, S.; Almansouri, I.; Chiesa, M. Direct measurement of the magnitude of the van der waals interaction of single and multilayer graphene. Langmuir 2018, 34, 12335–12343. [Google Scholar] [CrossRef]
- Sedin, D.L.; Rowlen, K.L. Adhesion forces measured by atomic force microscopy in humid air. Anal. Chem. 2000, 72, 2183–2189. [Google Scholar] [CrossRef]
- Harrison, A.J.; Corti, D.S.; Beaudoin, S.P. Capillary forces in nanoparticle adhesion: A review of AFM methods. Part. Sci. Technol. 2015, 33, 526–538. [Google Scholar] [CrossRef]
- Rabinovich, Y.I.; Adler, J.J.; Ata, A.; Singh, R.K.; Moudgil, B.M. Adhesion between Nanoscale Rough Surfaces. J. Colloid Interf. Sci. 2000, 232, 10–16. [Google Scholar] [CrossRef]
Figure 1.
Experimental equipment. (a) Three-dimensional view of the experimental equipment. (b) AFM scanning probe. (c) Adhesion-force measurement area.
Figure 1.
Experimental equipment. (a) Three-dimensional view of the experimental equipment. (b) AFM scanning probe. (c) Adhesion-force measurement area.

Figure 2.
The cylindrical AFM tip SEM. (a) The cylindrical AFM tip. (b) Enlarged view of cylindrical AFM tip.
Figure 2.
The cylindrical AFM tip SEM. (a) The cylindrical AFM tip. (b) Enlarged view of cylindrical AFM tip.

Figure 3.
Optical schematic diagram of graphene under polarizing microscope and Raman spectrum diagram of monolayer graphene. (a) Schematic optical diagram of graphene sample under polarizing microscope. (b) Raman spectra of monolayer graphene.
Figure 3.
Optical schematic diagram of graphene under polarizing microscope and Raman spectrum diagram of monolayer graphene. (a) Schematic optical diagram of graphene sample under polarizing microscope. (b) Raman spectra of monolayer graphene.

Figure 4.
Force curve, force–time curve, and AFM measurement 3D diagram. (a) Force curve. (b) Force–time curve. (c) The AFM probe during the dwell time. (d) AFM probe separated from the sample. The c, d in figures (a) and (b), reflected in figures (c) and (d).
Figure 4.
Force curve, force–time curve, and AFM measurement 3D diagram. (a) Force curve. (b) Force–time curve. (c) The AFM probe during the dwell time. (d) AFM probe separated from the sample. The c, d in figures (a) and (b), reflected in figures (c) and (d).

Figure 5.
The change in meniscus and VWCA between AFM cylindrical probe and sample, where θ1 is the VWCA of the cylindrical probe and θ2 is the VWCA of the sample surface. θe2 is the static contact angle of the sample. (a) . (b) . (c) . (d) .
Figure 5.
The change in meniscus and VWCA between AFM cylindrical probe and sample, where θ1 is the VWCA of the cylindrical probe and θ2 is the VWCA of the sample surface. θe2 is the static contact angle of the sample. (a) . (b) . (c) . (d) .

Figure 6.
Theoretical capillary force under cylinder–plane contact.

Figure 7.
(a–e) Variation rule of graphene adhesion force with the dwell time at different RH under cylinder–plane contact.
Figure 7.
(a–e) Variation rule of graphene adhesion force with the dwell time at different RH under cylinder–plane contact.

Figure 8.
Variation rule of graphene adhesion force with the relative humidity under cylinder–plane contact.
Figure 8.
Variation rule of graphene adhesion force with the relative humidity under cylinder–plane contact.

Figure 9.
Variation rule of theoretical graphene adhesion force with VWCA. (a) Adhesion force Fad versus (). (b) Adhesion force Fad versus ().
Figure 9.
Variation rule of theoretical graphene adhesion force with VWCA. (a) Adhesion force Fad versus (). (b) Adhesion force Fad versus ().

Figure 10.
Variation rule of theoretical graphene adhesion force with static contact angle θe2 and RH.
Figure 10.
Variation rule of theoretical graphene adhesion force with static contact angle θe2 and RH.

Figure 11.
Comparison of experimental and theoretical adhesion force under cylinder–plane contact. ().
Figure 11.
Comparison of experimental and theoretical adhesion force under cylinder–plane contact. ().

Disclaimer/Publisher’s Note: The statements, opinions and data contained in all publications are solely those of the individual author(s) and contributor(s) and not of MDPI and/or the editor(s). MDPI and/or the editor(s) disclaim responsibility for any injury to people or property resulting from any ideas, methods, instructions or products referred to in the content. |
© 2023 by the authors. Licensee MDPI, Basel, Switzerland. This article is an open access article distributed under the terms and conditions of the Creative Commons Attribution (CC BY) license (https://creativecommons.org/licenses/by/4.0/).
Share and Cite
MDPI and ACS Style
Shi, K.; Hu, M.; Huang, P. Study on Adhesion Force of Graphene under Cylinder–Plane Contact. Lubricants 2023, 11, 126. https://doi.org/10.3390/lubricants11030126
AMA Style
Shi K, Hu M, Huang P. Study on Adhesion Force of Graphene under Cylinder–Plane Contact. Lubricants. 2023; 11(3):126. https://doi.org/10.3390/lubricants11030126
Chicago/Turabian StyleShi, Kai, Manfeng Hu, and Ping Huang. 2023. "Study on Adhesion Force of Graphene under Cylinder–Plane Contact" Lubricants 11, no. 3: 126. https://doi.org/10.3390/lubricants11030126
Note that from the first issue of 2016, this journal uses article numbers instead of page numbers. See further details here.