1. Introduction
Although intensive research has been carried out on White Etching Cracks (WECs) for several years, these rolling bearing failures are still difficult to predict in general. Consequently, there are still open questions that require more investigations through research. For practical applications, the focus is on risk assessment, based on operating conditions, rolling bearing material and lubricants.
In [
1], it was demonstrated that on the rolling bearing test machine FE8 at specific conditions, the time to failure is strongly dependent on the lubricant chemistry. By adding a single additive, preliminary fatigue failures could be induced with WEC after only 40 h, i.e., after less than 2 days. The chemical surface analysis showed strong differences between the “PASS OIL” and “FAIL OIL” samples, even before the failure became visible. It would not be credible to use the surface analysis method to predict WEC failures based on just two samples, but with more than 100 tested oil formulations, a tremendous opportunity presents itself.
An influence of oil composition on rolling bearing fatigue life under a Hydrogen atmosphere at Elastohydrodynamic lubrication (EHL) regime was reported by Endo et al. [
2]. It was shown that the fatigue life was massively reduced under a Hydrogen atmosphere compared to air, and that “passive films and phosphate films effectively prolonged rolling fatigue life in hydrogen” (both formed by lubricant additives). Tanaka et al. [
3] demonstrated that even base oils of lubricants and their water content could be a possible source of Hydrogen. He concluded that the “the amount of hydrogen permeated in the steel during rolling depends on the formation of tribo-films at contacting surface and on the water content in the oils”. The right balance between tribo-film generation and Hydrogen separation to avoid or provoke Hydrogen-assisted rolling contact fatigue (HARCF) is required. The general findings regarding “Triboelectrochemistry” are reviewed in [
4]; here, the additional influencing factor of electrical potential on the tribo-films is also discussed.
Tribo-films have also been referred to as a “Tribo(protection)layer” [
5] or part of the “tribo mutated zone” [
6]. These “near surface material” zones at stressed rolling bearings were investigated via high resolution methods such as Focused Ion Beam Scanning Electron Microscope (FIB-SEM) [
1], Transmission Electron Microscopy (TEM) [
5,
7,
8,
9], Secondary Neutral Mass Spectrometry (SNMS) [
1,
5,
10], Electron Probe Microanalysis (EPMA) [
9] and X-ray Photoelectron Spectroscopy (XPS) [
1,
5]. In particular, the resulting tribo-films on roller thrust bearings (type 81212) after 80 h at low speed under mixed friction conditions on an FE8 test rig were subject to detailed analysis [
5,
8,
9]. The high-resolution analysis via TEM/FIB-SEM, XPS and/or SNMS is now state of the art for the academical investigations of tribological layers. The phenomenon of lubricant additive-built tribological layers (tribo-films) is not limited to rolling bearings. The mostly low-concentration lubricant additives generally have a great influence on the tribological layer and the lifetime. This is well known for simple rolling contact test rigs, e.g., MPR [
11], or for complex contacts such as gears, as reported by L’Hostis et al. [
12].
Niste et al. [
13] investigated the effect of temperature on a zinc dialkyl dithiophospate (ZDDP)-generated tribo-film. The performance of the layer under a Hydrogen atmosphere was dependent on temperature. The 1% ZDDP in a poly-α-olefine (PAO) were, at 333 K, simply not reactive enough to generate a uniform tribo-film in the contact. At 393 K, a dense phosphate layer was built, but the wear protection was detrimental. An optimum between fatigue life under Hydrogen atmosphere (dense layer) and wear protection at the given rolling contact test conditions was detected at 363 K. This example illustrates that the same additive, depending on the operating conditions, e.g., the temperature, can lead to different tribo-films.
The formation of WECs in rolling bearings seems to be the same complex based on the reviews of Evans et al. [
14,
15]. The analysis of WECs via high-resolution methods is mainly concentrated on the microstructural changes in the material structure [
16,
17,
18,
19,
20,
21,
22,
23]. Viewed from a certain distance, the damage patterns and WEC formation appear to be the same regardless of the origin of the damage: two-roller Rolling Contact Fatigue (RCF) test [
16], four-roller RCF test with additional Hydrogen pre-loading [
17], radial rolling bearing out of application [
18,
19,
20,
21], cylindrical roller thrust bearing from test rig [
22] or angular contact ball bearings from a test rig with and without Hydrogen pre-loading [
23]. It can be concluded that the possibilities of generating WECs in RCF and rolling bearing test benches are manifold and state of the art, as shown in [
1,
2,
16,
17,
22,
23,
24,
25,
26,
27,
28,
29,
30,
31,
32,
33,
34,
35,
36].
Liang et al. [
37] proposed a model to predict WEC failures based on the fatigue stresses and Hydrogen content of the material. Unfortunately, Hydrogen exposure during operations has rarely been demonstrated. Kuerten [
38] demonstrated that HARCF failures also occur without Hydrogen preloading of the parts. In this study, the lubricant itself was the source of Hydrogen. If the lubricant formulation could cause WECs, it would depend greatly on the type of contact and operating conditions [
24,
25,
26]. Furthermore, the criticality of the lubricants in terms of WEC lifetime can change depending on the test level [
24,
25].
A strong influence of lubricant formulation on fatigue lifetime was detected by Bein [
39] on the cylindrical roller thrust bearing (CRTB) 812012 TN in a RCF test on the FE8 test rig. The operating conditions were mixed friction conditions but less wear-critical than in [
5,
8,
9]. The higher number of load cycles lead to more RCF relevance. The tested commercial vehicle oils showed strong differences in time to fatigue failure. In particular, three so-called “tractor oils” (UTTO) and an engine oil failed early. Surborg [
28] adapted the test conditions to assess gear box oils for passenger cars. Based on these investigations, the failure mode of the bearings was identified as RCF failure with WEC [
1,
28]. It was shown that the oil additivation is key to inducing WEC failure at the given test conditions. The focus regarding lubricating oil additives was on ZDDP and several alkyl-sulfonates. As a result, the FE8 test rig has been used much more frequently than the micro-pitting rig (MPR) [
29] or RCF tribometers [
30] to study the lubricant effect on WECs [
31,
32,
33,
34]. The test conditions were also adapted to higher viscous oils, e.g., industrial gear box oils, with a good failure repeatability [
32]. Richardson [
25] and Wranik [
33] published a more detailed analysis of the tribo-film on the raceways of the CRTB. The SEM/EDX investigations of [
25] surprisingly showed that the more WEC-critical additive combinations formed thicker Ca-dominated tribo-films (>100 nm) than on the specimen with Zn-S-tribo-films which did not fail. The higher criticality was attributed to a higher heterogeneity of the “patchy” tribo-film. This is based on the idea that Hydrogen, from oil and water traces, can enter the material structure at nascent surfaces as shown in figure 17a at [
15]. In [
33], the WEC failures were provoked with ZDDP but not Ca-sulfonate containing oil (PAO). Instead of Calcium-Sulfonate with Calcium-Carbonate with higher Total Base Number (Ca-Sulfonate (ob)), a Dicyclohexylamine (DCHA) was used. The combination of ZDDP and DCHA was confirmed as WEC-critical on FE8 pitting test conditions in [
33,
34]. The reference oil in [
33] was the pure base oil without additional additives. Logically, no Ca-dominated tribo-film was demonstrated in [
33] with any specimen. The EDX mapping shows a Zinc-Oxygen dominated tribo-film with Phosphorous and Sulfur at the “expected to fail” washer after the short running time of 3 h (app. 10% of expected time to failure). The reference part, tested with PAO, showed an Oxygen dominated tribo-film after the same amount of time. The more sensitive SNMS analysis (Zn not reported) showed an approx. 25 nm thin tribo-film with S, P, O, C, H and OH. The signals were normalized to the Fe signal. At the reference part, only traces of H, C and OH in approx. the first 10 nm were detected. Pape [
35,
36] used Secondary-Ion Mass Spectroscopy (SIMS) to investigate the boundary layer of thrust bearing washers after testing on an FE8 test rig. The oil was a proven WEC-critical formulation which contained ZDDP in addition to other additives, e.g., Ca-Sulfonate (ob). Different layer thicknesses of Ca-containing tribo-films were detected. The layer structure depended on the test conditions and frictional conditions on the raceway. The detections of a “Ca
+ and CaO
− enriched tribo-film” was assumed to be a possible Hydrogen source caused by the interaction of this tribo-film with water as in figure 36 at [
36]. Similar to in [
33], an inhomogeneous tribo-film was detected. “In contrast, with both bearings run at lower temperatures, several secondary ion signals show inhomogeneous distributions inside the raceway much more pronounced for the bearing, where a tendency for white etching cracks was observed.”
The strong dependency of failure mode on the lubricant-dependent tribo-film of FE8 specimens in general is the reason that tests to review or reanalyze the specimens have been carried out in recent years. In particular, the Schaeffler FE8-25 test stage (
Table 1) has been used for many oil tests in several different internal projects. As of yet, a systematic (fast) analysis of the tribo-film composition on the specimen has generally not been integrated into the standardized process of FE8 failure analysis. The problem, therefore, solely lies in the statement that the final failure mode was determined, e.g., by a material structure analysis, without knowing in detail what occurs on the surface.
Only a few dozen specimens were described in view of roughness and chemical composition of the surface. Due to the large number of test specimens “collected” over some years, it was necessary to use less time-consuming but informative methods to characterize the tribo-film. The results reported in this paper show the potential of the commonly used and widespread methods “micro-X-ray fluorescence spectroscopy” and “attenuated total reflection Fourier transformation infrared-spectroscopy”.
The main purpose of developing this smart measurement method of thrust bearing washers is to create a comprehensive database to obtain a clear correlation of the results, the failure mode and the chemical composition of the tribo-film.
2. Materials and Methods
2.1. The FE8 Testing Method
The FE8 test rig [
40] is usually used to test standardized test setups according to the DIN standards DIN51819-02 [
41] or DIN51819-03 [
42]. The aim is to test lubricants (oils and greases) according to their general behavior, i.e., the anti-wear behavior of specific additives. In this context, a test procedure was established to investigate the mixed friction behavior of point and line contacts. The DIN standards specify the details of how to evaluate lubricating oils and greases in different bearing types:
Angular contact ball bearing (relevant for grease tests);
Tapered roller bearing (relevant for grease tests);
Cylindrical thrust roller bearing (relevant for oil tests).
Figure 1 describes the general setup of a standardized FE8 test rig.
Furthermore, the FE8 test rig is used for testing different types of bearings, i.e., Angular Contact Ball Bearings (ACBB) and Tapered Roller Bearings (TRB), either for grease or oil lubrication. The focus is the mixed friction behavior of these lubricants, since in this solid body contact area, the working principles of additives play a crucial role.
Since the lambda values in the tests often are below 1, the tribo-films solely protect the surfaces against premature failures, such as abrasive or adhesive wear.
On the other hand, different studies [
1,
5,
8,
9,
10,
11,
12,
13,
14,
15,
16,
17,
18,
19,
20,
21,
22,
23,
24,
25,
26,
27,
28,
29,
30,
31,
32,
33,
34,
35,
36,
37,
38,
39] report rolling bearing failure mechanisms where the additives even contribute to specific failure patterns if further influence factors, such as specific friction energy, temperature or a specific bearing type, are combined.
FE8-25 tests with the cylindrical roller thrust bearing 81212 exhibit different failure modes depending on the lubricant chemistry. In addition to the harsh test conditions of mixed friction at high speeds and slippage, this bearing type exhibits special kinematic conditions that lead to different values of frictional energy across the raceway. The main failure mechanisms of this test are sub-surface fatigue damage due to White Etching Cracks (WECs) and/or surface-initiated fatigue damage (SIF).
Therefore, because the requirements for the investigation of lubricants have significantly increased in recent years, several new test methods have been developed and refined to investigate these failure modes, such as WEC or SIF, i.e., in the form of micropitting.
As reported in [
43], the development of the FE8-25 test stage was carried out due to low-viscosity transmission oils, which presented a high risk of inducing these aforementioned failure modes, such as the SIF (mainly observed as grey-staining formation) at slippage and mixed friction conditions. As described in [
43], it is crucial to distinguish these premature failure mechanisms, such as WEC and SIF, from rolling contact fatigue, defined in [
44]. This sub-surface-initiated failure mode of rolling contact fatigue is not in the scope of any FE8 investigation.
The reasons for this research gap are the trend towards low-viscosity gear oils with different additives and the constant increase in power in motor vehicles on the one hand, and on the other hand, high-viscosity oils in different industrial applications, i.e., wind gearboxes containing new types of additives, which must be assessed regarding their individual risk. In the FE8-25, this leads to a critical situation of oil viscosities below a value of less than 5 mm2/s at 100 °C, combined with hertzian stress above 1900 MPa, high slippage and solid body contact all happening simultaneously. The maximum of shear stress is therefore shifted close to the surface. For this reason, the role of additives becomes crucial to define the performance of the rolling bearing. The potential risk of forming WECs or SIF failure patterns under these test conditions is high.
Because of these requirements for the investigation of lubricants, different test stages on the FE8 test rig were derived to simulate each corresponding failure mode individually (see
Table 1). The main target was to create WEC-critical test conditions, independently of the lubricant characteristics, such as the viscosity class.
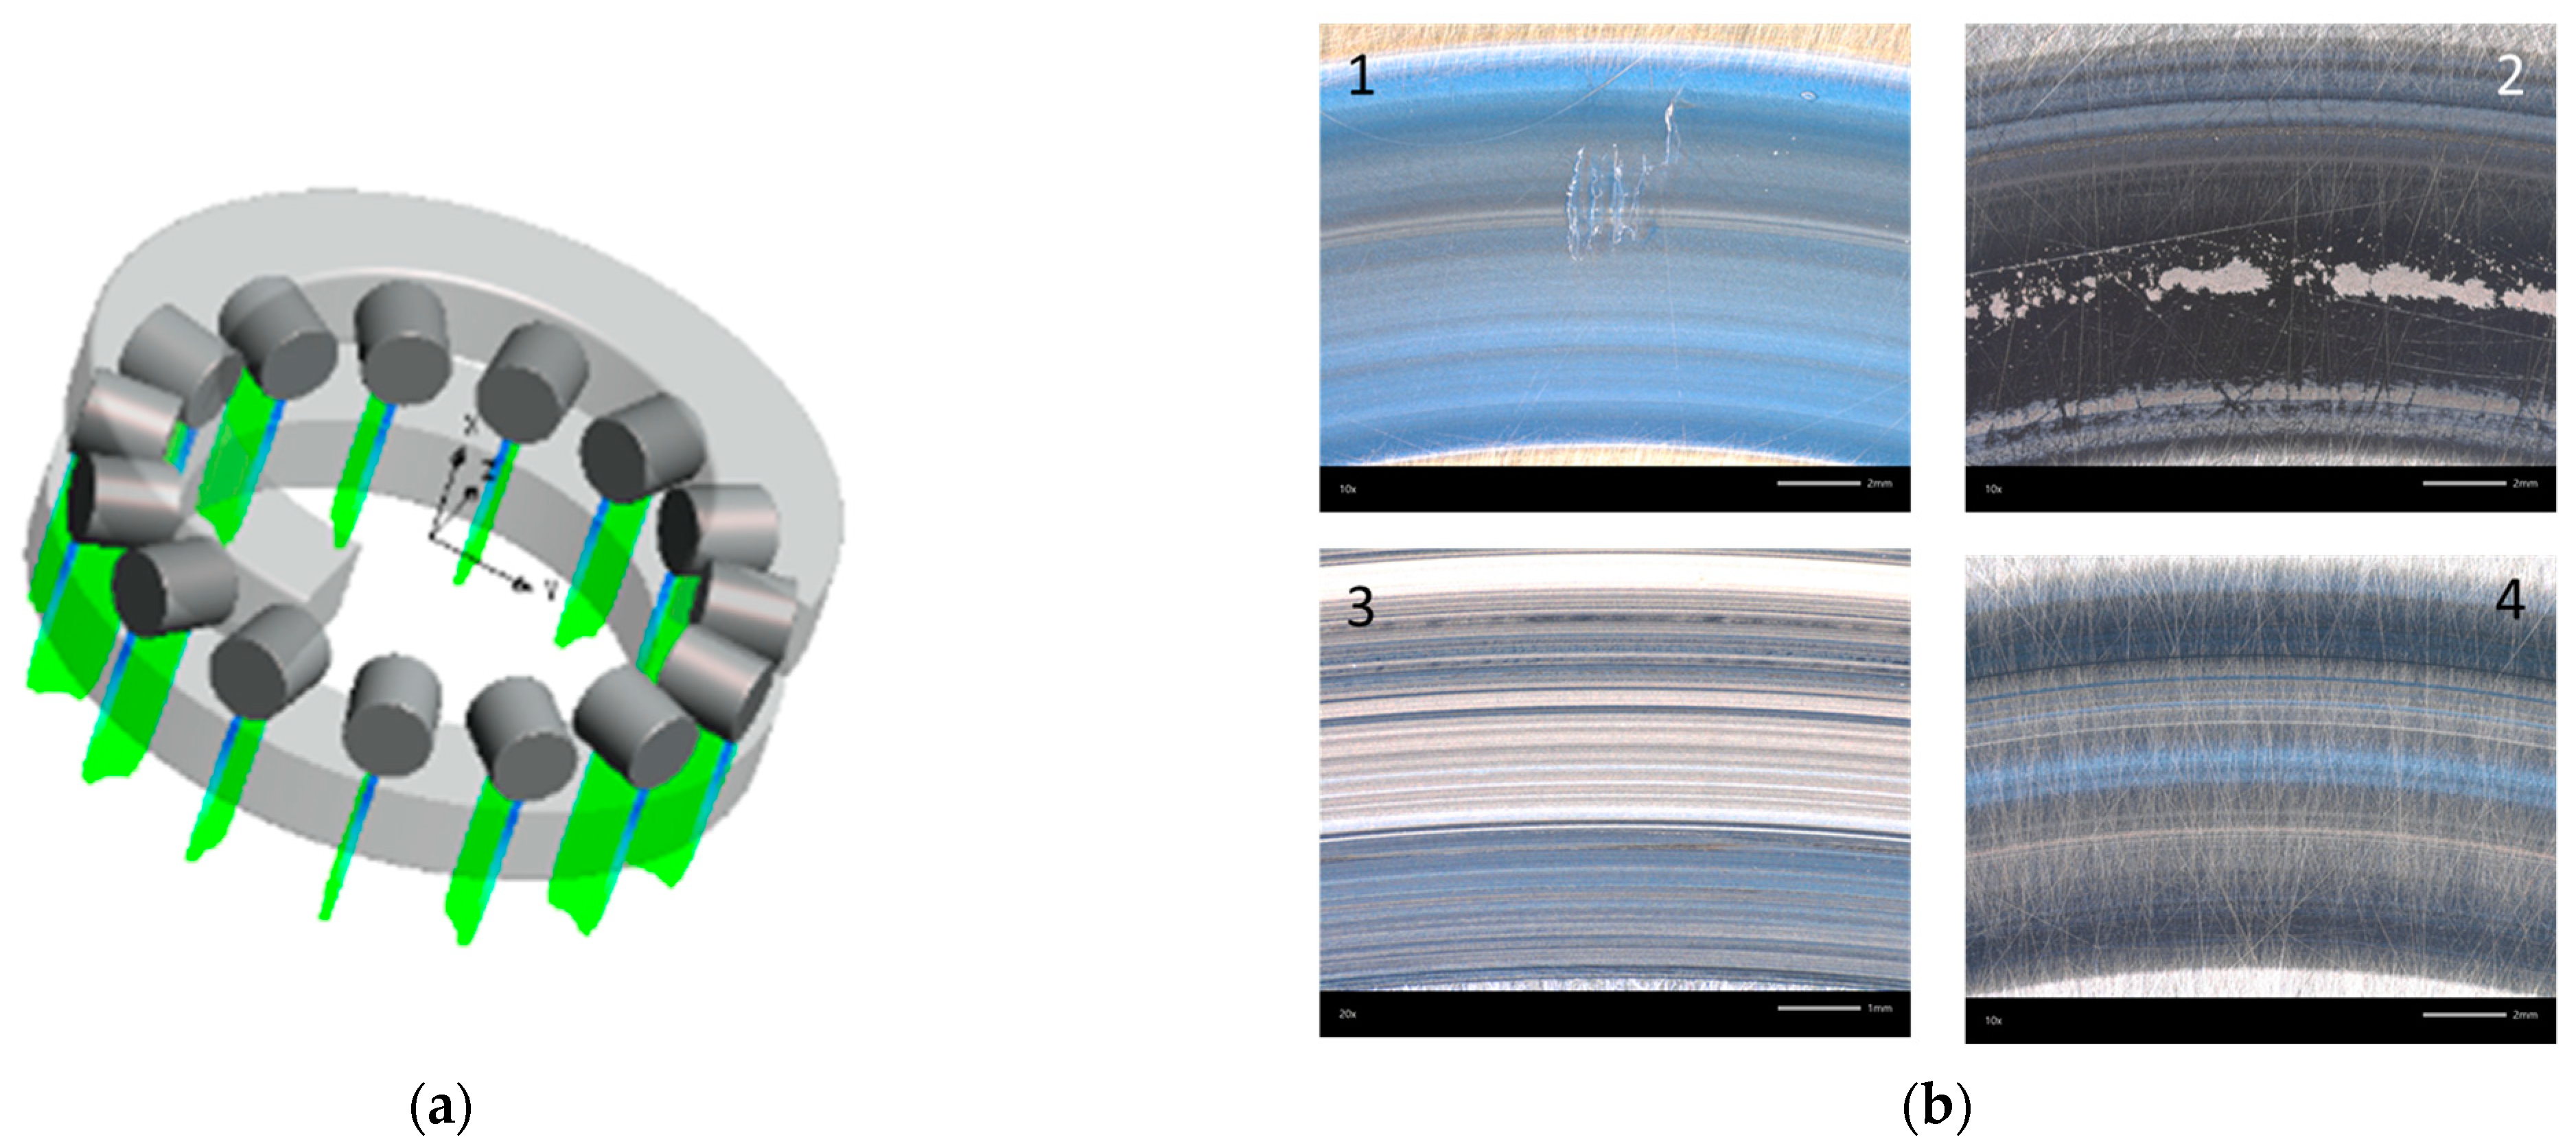
The basis of the investigations were extensive test series over a period of more than 7 years with a variety of different types of lubricants (240 test runs/480 bearings), which created an extensive database of differently additized oils and distinguishable results, at FE8-25 test conditions. The main results of this FE8-25 investigation, shown in
Figure 2b, can be classified as:
WEC at several running times;
SIF at several running times;
Wear (potentially with secondary fatigue failure);
No failure (test suspended).
The various stress zones with different energy inputs perpendicular to the raceway of a washer after a FE8-25 test run can often be easily recognized visually. Together with the different surface pattern, this could be an opportunity to perform advanced surface analysis.
2.2. Surface Analysis Techniques
After the Schaeffler FE8-25/32 test runs, the tribo-films generated on the raceway side of the tested cylindrical roller thrust bearings were characterized using the two spatially resolved spectroscopic analysis methods µXRF and ATR FTIR microscopy to determine the actual respective chemical composition of the generated tribo-films.
Both methods are non-destructive, so it was possible to analyze the entire washer without any mechanical sample preparation. Before the analysis, it was only necessary to clean the sample by rinsing off lubricant residues on the surface with a suitable organic solvent, e.g., n-heptane (CAS No. 142-82-5).
In the majority of known publications, the characterization of the tribo-films is described using complex, expensive and time-consuming methods such as FIB-SEM [
1], EPMA [
9], TEM [
5,
7,
8,
9], XPS [
1,
5] or SNMS [
1,
5,
10], often used in combination. These analysis methods are rarely available in industry, but mainly at research institutes and universities.
In contrast, the two analysis methods applied to the characterization of the formed tribo-films in this publication are significantly more commonly widespread in industry.
Both µXRF and ATR FTIR microscopy are fast and comparatively cheap surface analysis techniques.
2.2.1. X-ray Fluorescence Analysis
X-ray fluorescence analysis (XRF) is an important method for element analysis [
45] and entails a fast multi-elemental non-destructive analysis [
46].
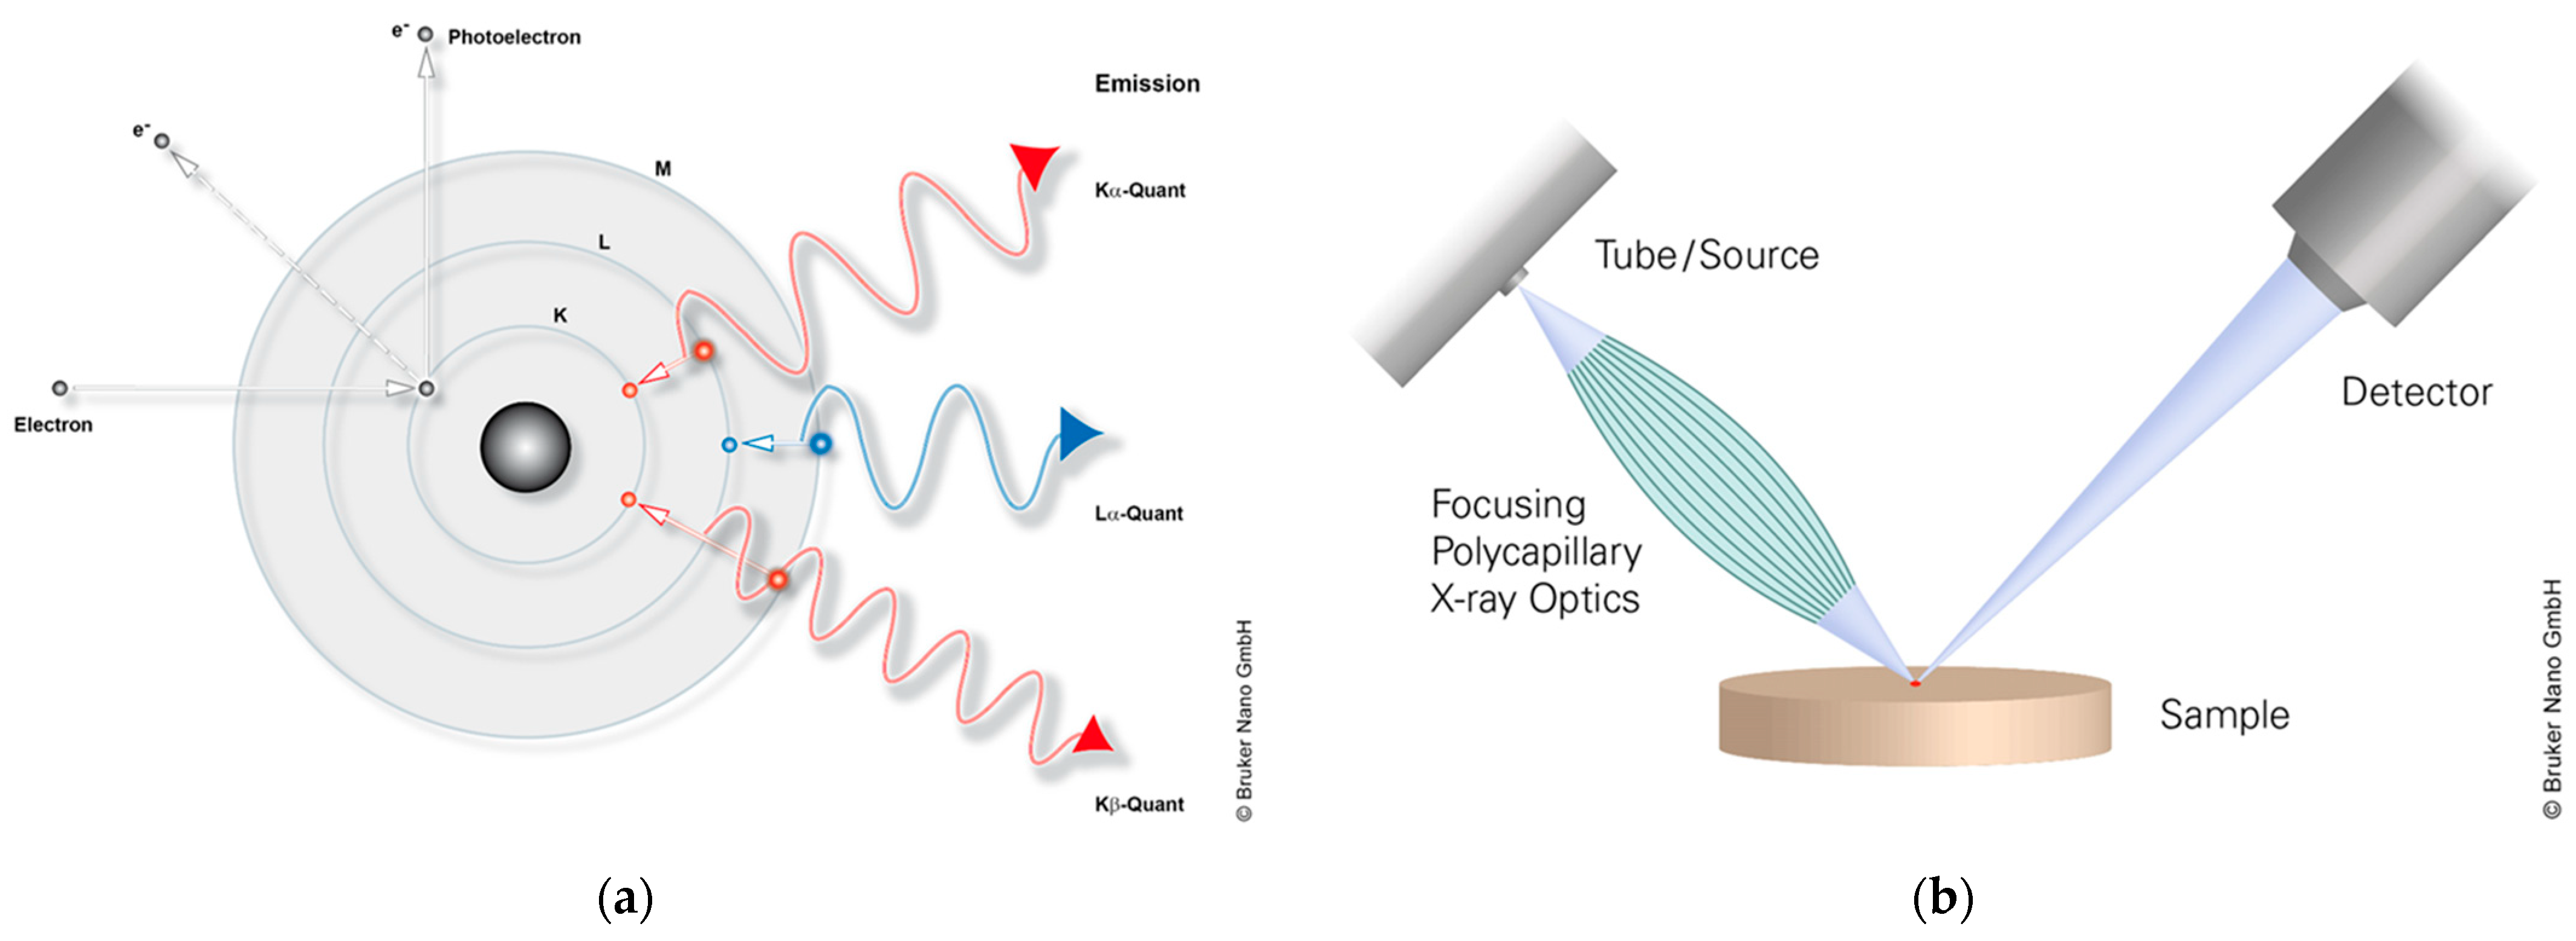
The basis of XRF is an excitation and relaxation process within the atomic electron shell. In atomic physics, fluorescence is generally defined as a two-stage process in which the electrons of an atom transition into an excited state by an external energy transfer which then returns to the initial ground state by spontaneous emission of a photon. One characteristic of X-ray fluorescence is that the excitation occurs with distinctly higher energies and that the emitted fluorescence radiation lies within the X-ray range. The emergence of X-ray fluorescence radiation is shown in
Figure 3 [
47].
A more detailed description of the emergence of X-ray fluorescence radiation and its detection process is given in [
47].
The quality of the spectrum and therefore the analytical results depend strongly on the fluorescence intensity and the time of measurement, since “the registration of an X-ray spectrum is a temporary accumulation process, which is subject to statistical laws” [
47].
Furthermore, the depth of information depends both on the X-ray tube parameters and on the energy of the X-ray fluorescence radiation of the examined element and its absorption in the sample, i.e., on the composition of the sample matrix.
The reason for this is that the X-rays have different interaction with the sample material. The most important interactions are absorption and scattering. This absorption, which means the interaction of the radiation with the sample matrix, is responsible for the information depth, which is defined as the “depth from which a photon produced within the sample can reach the detector with certain probability” [
45].
For X-ray fluorescence spectroscopy, two different methods including different detectors are known: the wavelength dispersive X-ray fluorescence spectroscopy (WD-XRF) and the energy dispersive X-ray fluorescence spectroscopy (ED-XRF).
The micro-X-ray fluorescence spectroscopy (µXRF) is a special application of ED-XRF.
The µXRF spectrometer needs to be very light-intensive, since only a very small sample area (spot size) is irradiated and only a small fluorescence intensity can be expected.
By using X-ray optics and high-brilliance X-ray sources, it is possible to focus the X-ray beam onto small sample areas to obtain sufficient fluorescence intensity also from areas of interest on specimen [
45]. Hence, µXRF is used for the determination of element distributions on areas (mapping) and is the method of choice for sensitive and non-destructive element analysis.
To determine the element composition of the generated tribo-films on the washer surface, the element analyses shown in this publication were performed using a µXRF. It should be noted that the µXRF is not only sensitive to tribo-films, but the information also obtained is also from a “volume element” due to the depth of information. This means the detected element concentrations are near the surface.
As noted earlier, the information depths of XRF are element-dependent and, among other things, also depend heavily on the sample matrix and the excitation energy (X-ray tube parameters). The depth of information is limited by the substrate, here through hardened 100Cr6, which is represented by Iron (Fe). For our chosen mapping parameters, Fe has an information depth about 15 µm. The resulting information depth of our analyzed elements of tribo-film was about 915 nm for Phosphorus (P) and 1190 nm for Sulfur (S).
In the aforementioned cited publications regarding the characterization of tribo-films, analyses are described with complex, expensive and time-consuming methods such as SEM-EDX or EPMA, i.e., [
1,
9,
25].
For the analytical characterization, we deliberately chose analysis methods that are widely used in the industry and are easily accessible. In addition, µXRF (excitation by X-rays) has clear advantages over methods such as SEM-EDX or EPMA (excitation by electron beam). The greatest advantages, in addition to being significantly more cost-effective, are the possibility of being able to carry out non-destructive element mappings on relatively large areas in a relatively short time (12 h mapping duration for a complete washer surface with the mapping parameters selected in
Table 2) by using the µXRF, and without a complex sample preparation.
In addition, the µXRF has a higher sensitivity and therefore a significantly lower limit of detections (LOD) compared to SEM-EDX or EPMA: LODµXRF < 20 ppm vs. LODSEM-EDX typically in the range of 0.1% independent of the atomic number.
However, SEM-EDX has a significantly higher resolution due to a smaller spot size and lower information depth than the µXRF. Furthermore, due to the high vacuum, all elements from Boron (B) can be detected using SEM-EDX or EPMA, whereas with µXRF only all elements from Sodium (Na) upwards can be detected. A more detailed description of the theoretical background is given in [
45,
46,
47].
The characterization of the formed tribo-films in this publication was performed using the energy dispersive micro-X-ray fluorescence spectrometer (µXRF) M4 Tornado (Bruker Nano GmbH).
With the µXRF, spatially resolved analysis (mappings) of elements with an atomic number greater than or equal to atomic number 11 (Sodium (Na)) can be carried out. It is equipped with a micro-focus X-ray tube with a Rhodium (Rh) anode and a Beryllium (Be) side window. The detection of X-ray fluorescence radiation is performed by a silicon drift detector (SDD) with a 30 mm
2 sensitive area and an energy resolution smaller than 145 eV. The high spatial resolution is made possible by a poly-capillary X-ray optic exciting beam focused down to 25 µm, which creates an X-ray spot of smaller than 25 µm [
46]. The measurement principle is shown in
Figure 3b.
The determination of the element distribution on the raceway side of the washer was analyzed by multi-element mapping of the entire area of the bearing surface. The quality of the element distributions obtained through the measurement is strongly determined by the various mapping parameters [
45]. The mapping parameters, such as the measurement time (per pixel and total), the X-ray tube parameters and the distance between each pixel that were chosen for the characterization of the tribo-film are shown in
Table 2.
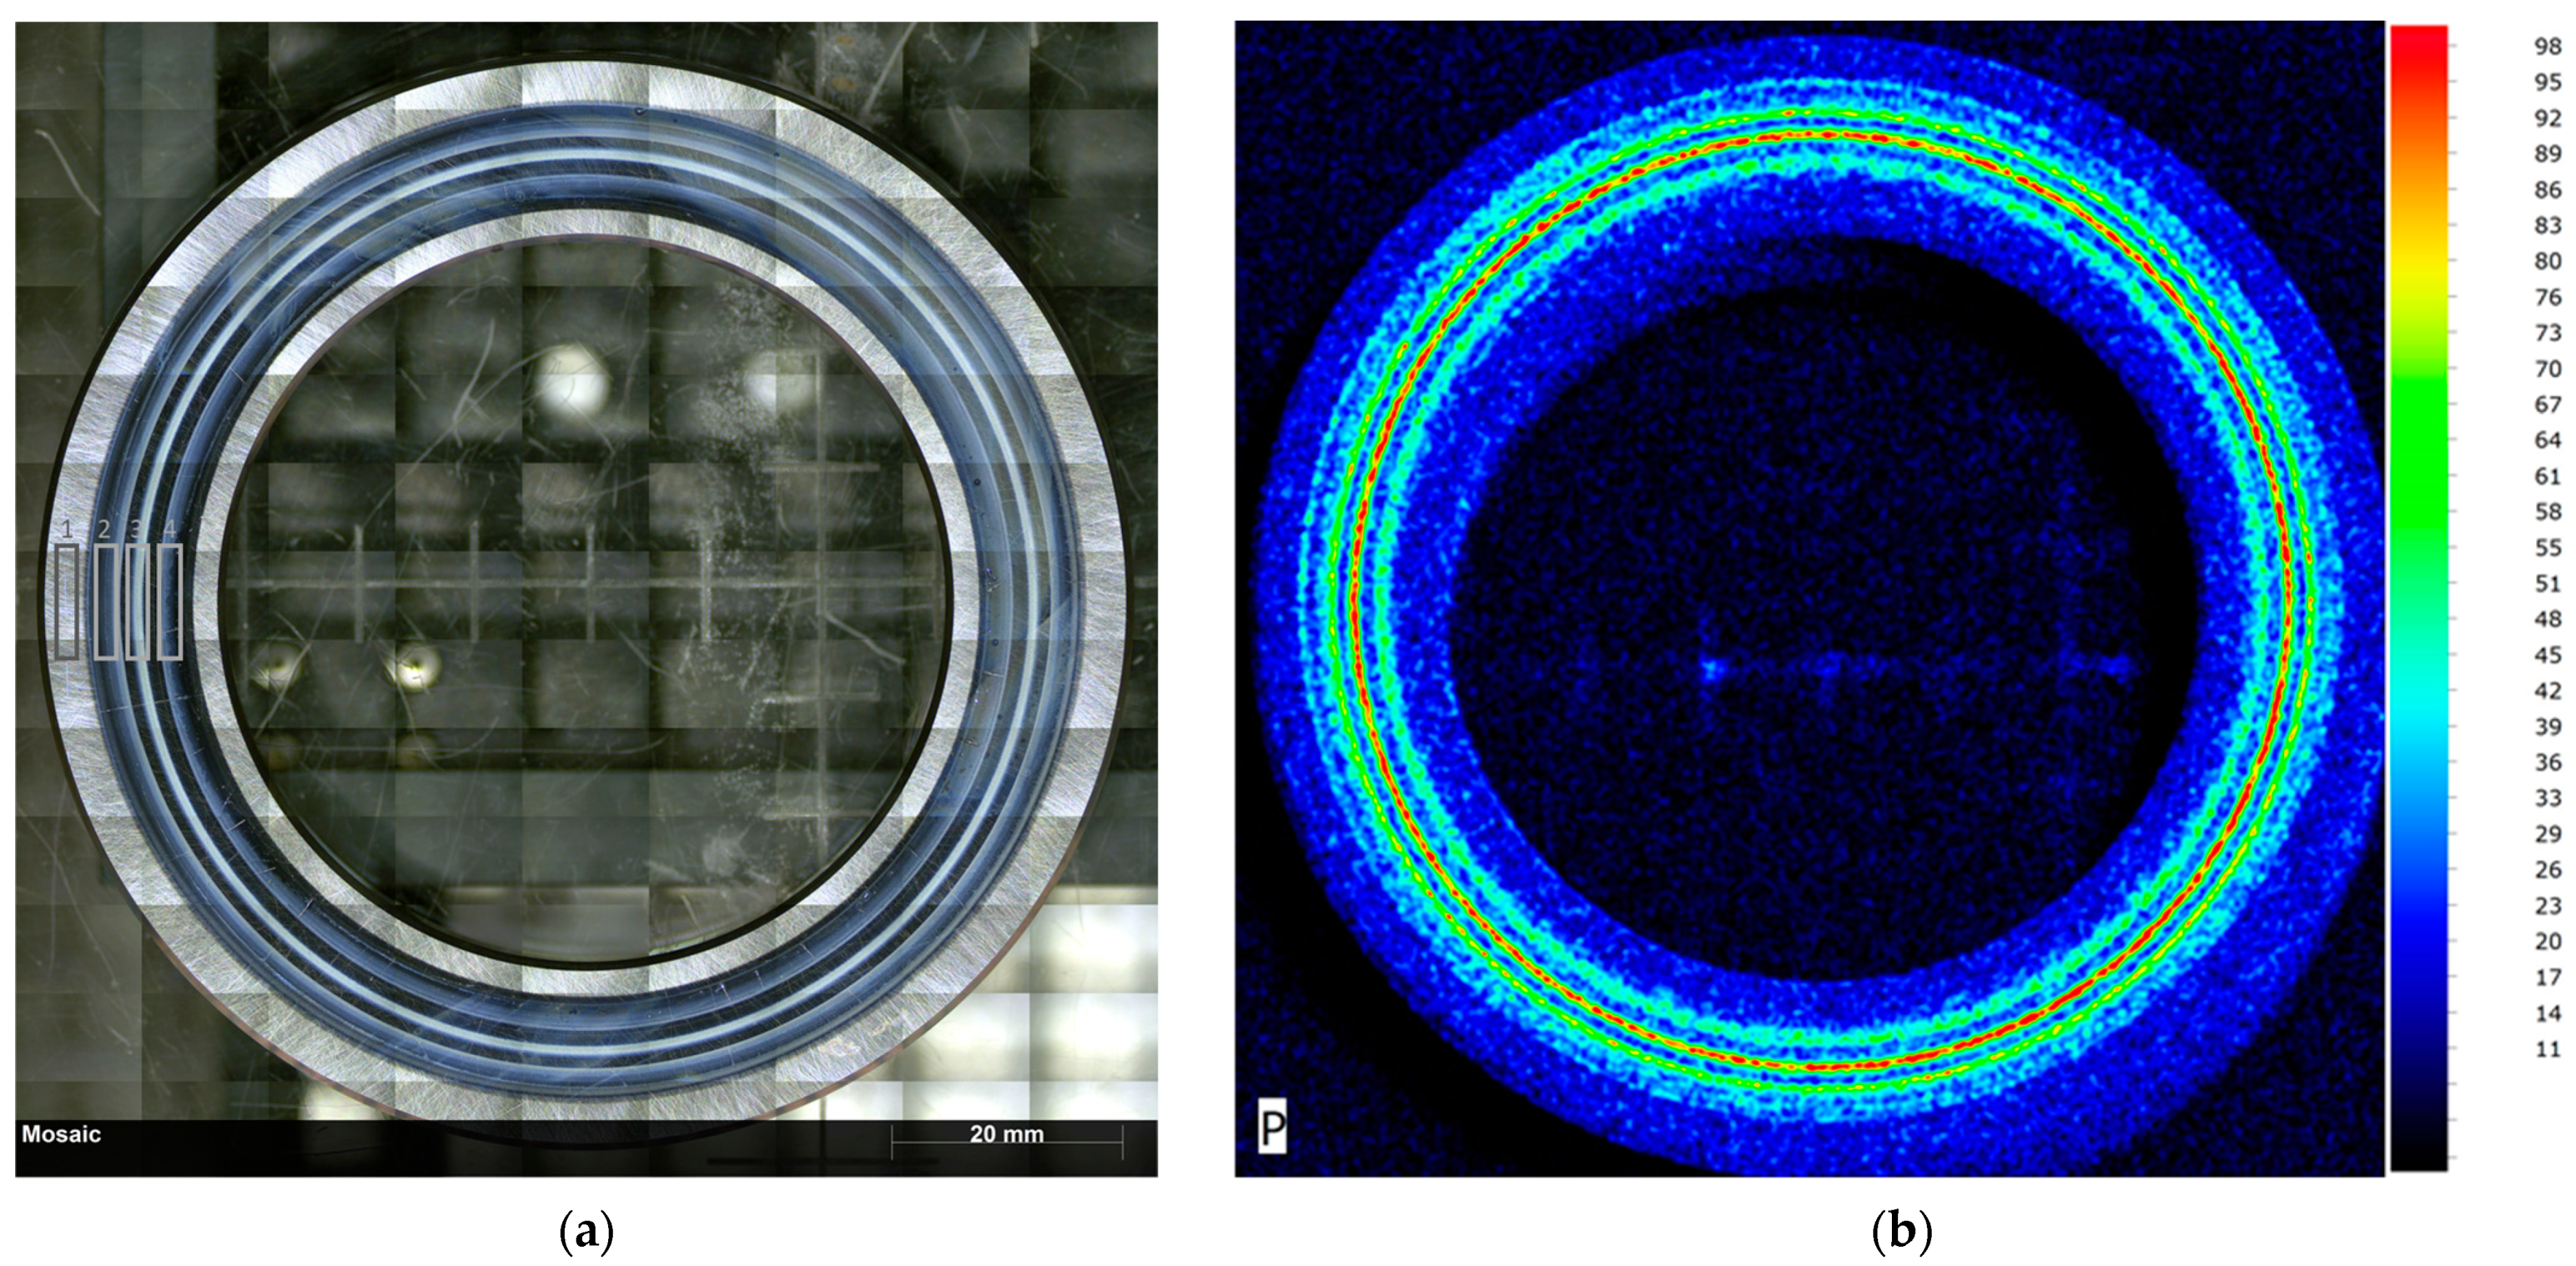
An example of a mosaic image (a) and the corresponding element distribution (b) of one of the washers studied are shown in
Figure 4. The mapping area was set on the mosaic image for the complete sample; in other words, on the complete surface of the raceway side of the tested cylindrical roller thrust bearings.
The raceway area and the generated tribo-films on the washer surface are often visually clearly recognizable. It is evident that the determined element distribution correlates with the visually recognizable areas in and outside the raceway and that these tribo-films are rotationally symmetrical. These zones with different local energy input are concentric to the center of the washer.
The element mapping shown in
Figure 4b shows the intensity distribution as absolute intensities (normalized to the highest intensity of the complete map) of the element Phosphorus (P) in a false color element display. The false color presentation offers a better separation of sample areas with different composition [
46].
With the used color scale, in this image section the pixel with the highest intensity is displayed in red and the pixel with the lowest intensity is displayed in black.
For the quantification of element mappings, we decided not to quantify the complete mapping data by binning pixels for quantification using the so-called software module M-Quant, but to set various objects in the HyperMap to quantify these regions of interest (ROI) only. The sum spectra of these ROI are quantified by an evaluation model using standardless analysis based on fundamental parameter (FP) models. This method is significantly less time-consuming than the quantification of the complete mapping data. The selected areas for the quantification of ROI on the washer surface are shown in
Figure 4a.
2.2.2. Fourier Transformation Infrared Spectroscopy
The second surface analysis technique used in this publication to characterize the tribo-films is infrared (IR) spectroscopy, specifically Fourier Transformation Infrared Spectroscopy (FTIR). FTIR spectroscopy is based on the fact that most molecules absorb light in the IR region of the electromagnetic spectrum and convert the absorbed energy into molecular vibrations. These molecular vibrations lead to an IR spectrum that serves as a characteristic “molecular fingerprint” and from which statements about the chemical structure of the sample being examined can be made.
In FTIR spectroscopy, the position and intensity of the absorption bands of a substance (structure groups or functional groups) are extremely substance-specific. The possibility of direct analysis of functional groups, which is often much more difficult or impossible with other analysis methods, is the essential feature of IR spectroscopy and justifies its significance as one of the most important methods of instrumental analysis [
48].
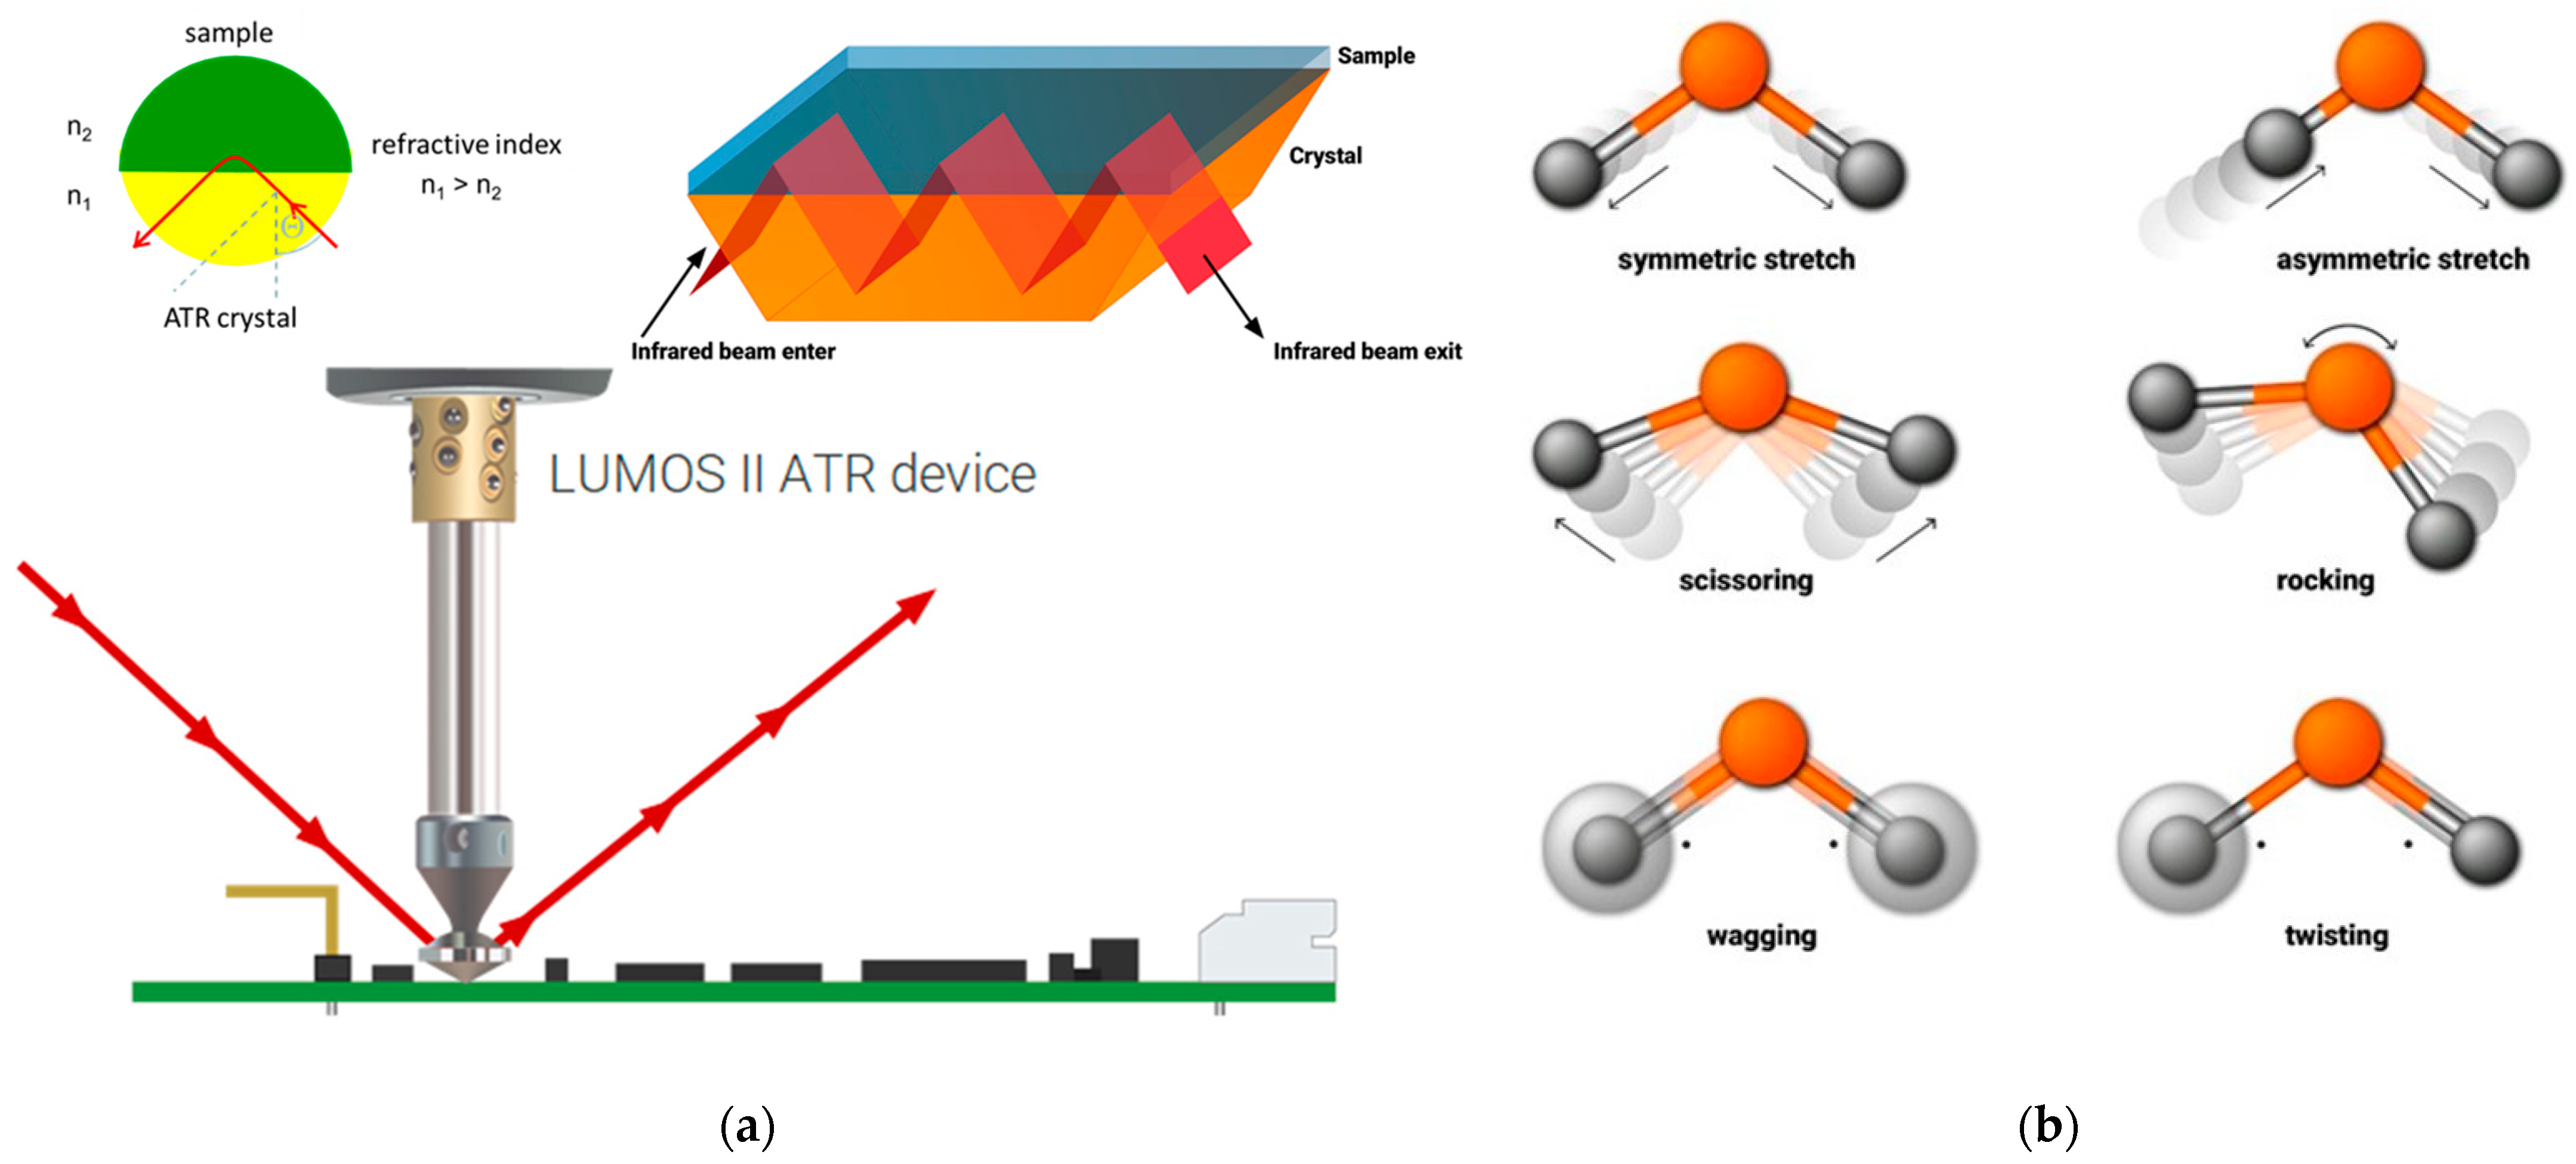
However, the excitation of a molecule to rotate or the transition to a state of higher rotational energy can only take place if the molecule as a whole has a dipole moment or a dipole moment is induced during an oscillation [
48]. This means that only molecules made up of different types of atoms are IR-active (See
Figure 5).
In FTIR spectroscopy, there are various methods and recording techniques.
Attenuated total reflection (ATR) is a non-destructive surface analysis technique and has become the most popular technique for measuring FTIR spectra [
48].
The measuring principle of the ATR technique is that optical absorption spectra can be easily obtained by looking at the interaction of the totally reflected light emerging from the optically dense medium with the optically thin medium.
As shown schematically in
Figure 5a, the sample surface is brought into contact with the internal reflection element (IRE), with IR radiation being absorbed by the sample at each reflection point [
48]. Materials with a high refractive index for the IRE are for example Germanium (Ge), diamond or zinc selenide (ZnSe) [
48].
Germanium (Ge) is best suited for characterizing the tribo-films, since its refractive index is the highest of any commonly used ATR crystal. That means that it is best suited for surface investigations, since the effective penetration depth of the evanescent wave is smaller and is only a few wavelengths. The penetration depth depends on wavelength and the angle of incidence of the radiation. It is important to mention that longer-wavelength radiation penetrates deeper into the sample, so in an ATR FTIR spectrum, bands at longer wavelengths (lower wavenumbers) are more intense than those at shorter wavelengths (larger wavenumbers) [
48].
Spatially resolved FTIR analyses (mappings) of sample surfaces that require evaluating the chemical distribution of a sample by creating chemical images are possible by using a FTIR microscope, as in the coupling of an optical microscope to an FTIR spectrometer.
The used Mercury–Cadmium–Telluride (MCT) detector and the high-precision stage allow a spatial resolution down to 5 µm. For mapping the ROI on the sample surface, a grid of several measurement points with defined distance and a fitting aperture was chosen [
49]. More information on the technical details and functional principle of the components is described in [
49,
50].
The characterization of the specimen surfaces was performed using the ATR FTIR microscope LUMOS (Bruker Optics GmbH) by a spatially resolved analysis of organic and inorganic species of the tribo-films.
It is equipped with a piezo-driven, pressure-controlled Germanium (Ge) ATR crystal integrated with the 8× Cassegrain objective. The detection is performed by a mid-band LN
2-MCT detector (single-element detector, liquid-nitrogen-cooled) with a spectral range of 6000–600 cm
−1. The technical specifications and mapping parameters are shown in
Table 3.
The ATR FTIR microscopy on the raceway side of the washer was analyzed by mapping a grid of 13 × 13 measurement points both in the circumferential and transverse to the direction of the raceway of the thrust bearing surface (
Figure 6a). As with µXRF, the quality of the measurement data is strongly dependent on the selected mapping parameters.
The mapping of specific functional groups, which is probably the most widespread method in terms of analysis and presentation of the ATR FTIR mapping data, whereby parameters obtained from the absorption bands of interest as a function of the position within the image are displayed, was not used to evaluate the mapping data in this case. Rather, the measuring points were evaluated line-by-line as a sum spectrum in order not to lose any spectral information of the fingerprint area.
The grid of the 13 × 13 measurement points was adapted to the specimen geometry (see
Figure 6a). The obtained ATR FTIR spectra were processed as follows:
Calculation of the sum spectrum of the spectra of the 13 measurement points of each row;
Performing atmospheric compensation;
Smoothing of the sum spectra;
Performing baseline correction (concave rubber band method, 10 iterations, 128 baseline points).
In the IR spectra processed in this way, the seven IR band regions defined below (see
Figure 6b) were evaluated (
Table 4).
Based on these surface analysis results, including failure mode and time to failure, the tribo-films are discussed in the chapter “Results”.
3. Results
In this paper, the subsequent analysis of 11 washers from several 81212 CTRBs (material of washers and rollers = 100Cr6 martensitic hardened and stabilized) is reported. The specimens are a selection of failed parts with or without WEC in the material structure, as well as failure-free parts after a successful test run. The bearing test runs were carried out between 2012 and 2022.
The test specimens, including the test conditions and the tested oil formulation, are listed in
Table 5. A distinction was made between fully formulated automotive oils (Aut#), industrial oils (Ind#) and model oils (Mod#). The reference oil (REF) is also a fully formulated automotive lubricant which was used as a low reference formulation for FE8-25 and the similar FE8 pitting test listed in
Table 1. It should be noted that the so-called reference oils stated in the various publications were not identical. Therefore, in
Table 5, the element contents of the oil formulations are listed to provide more detailed information.
In the literature, the fully formulated WEC critical oil on FE8-pitting tests are often reduced to a “2 additives in a base oil” system. This has been practiced by several researchers, e.g., in [
1,
25,
28,
29,
31,
33,
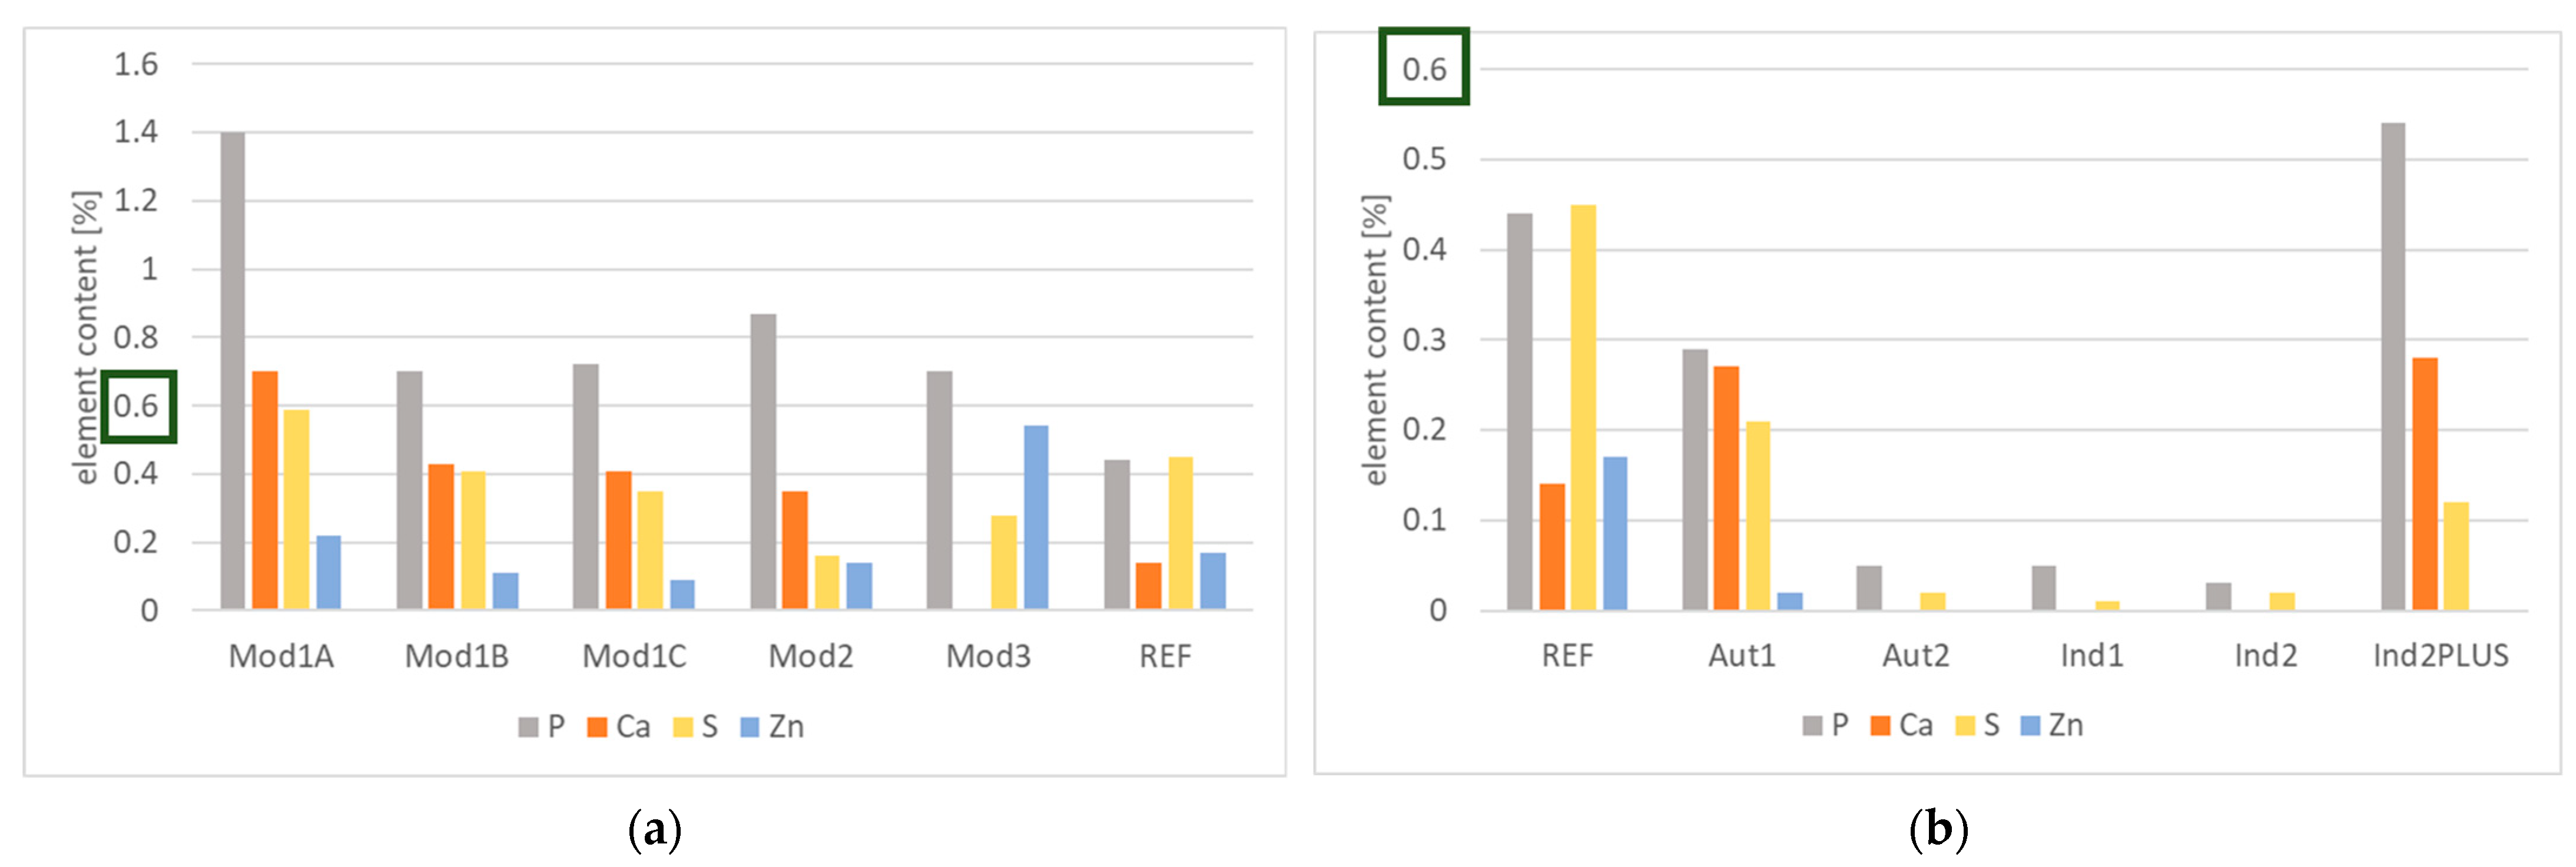
35]. The model oils Mod1 to Mod3 are such simplified lubricant compositions. The simplified formulations were equally effective in inducing WEC in the test as the reference oil. It was detected that not only was the time to failure similar, but the tribo-films also show strong similarities. In the diagram
Figure 7a, the Phosphorous (P), Sulfur (S), Calcium (Ca) and Zinc (Zn) content of the outer raceway area measured by µXRF are compared. The reference oil causes a P and S dominated comparably intensive tribo-film. The tribo-films of the model oil specimens are P-dominated. This is the least common denominator of these WEC-failed parts. The other elements are dependent on the actual oil formulation. Ca, S and Zn contents strongly vary with oil formulation. The element ratio in the tribo-film is similar for the identical oil formulation Mod1. This is also valid for the infrared (IR) spectra of these films. Each of the Mod1 specimen spectra is dominated by the band at 04 (see
Table 3) at app. 1500 cm
−1 and a sharper peak at 05. This is assumed to be a combination of amorphous Calcium-Carbonate (ACC) and Phosphates, but hints of Hydrocarbons 02, Water 01 and Sulfates 05 are also visible. A detailed breakdown is not reputable with the time-saving analysis methods chosen.
By changing (reduction) of additive concentration at Mod2, the time to failure was still low. The Phosphorus content was at the same level as on Mod1 specimens, but the Sulfur content was approx. halved. In the IR spectrum, the band 04 was strongly reduced and the band 05 was more undefined and broader.
As expected, the sample Mod3, which was tested with a Ca-free oil, contained no Ca on the surface. On the other hand, the Zn content of the tribo-film was higher here than on any other specimen. The IR spectrum had no significant bands at 04, and the band at 05 was less sharp and the maximum slightly shifted from 1095 cm
−1 to 1163 cm
−1. This hints at more Sulfur compounds, beside the Phosphates, in the tribo-film. On all Mod specimens, a significant absorption, reduced transmission, was detected in the IR spectra. In general, this can be attributed to the higher number of molecules on the surface, i.e., thick or dense tribo-film, according to Beer’s Law [
48].
The oil formulation used for the specimens REF and Aut1 is slightly different. Both contain Ca-sulfonate (ob) and ZDDP, but the concentrations differ and the additional additives are not identical. In the diagram
Figure 7b, the surface element contents of samples REF, Aut1 and Aut2 are compared. The REF sample shows a P- and S-dominated tribo-film. The Ca content is lower than at the Ca containing Mod samples. The IR spectrum of the sample REF surface shows the same two dominating bands as in the Mod1 spectra. In contrast to the Mod spectra, band 04 dominates and band 05 is reduced. Despite the significantly longer run time of Aut1, the maximum absorbance (concentration) is the same as the sample REF. This maximum is caused by the band area 04. In contrast, the band area 05 is lower in intensity than in the sample REF.
The tribo-film of the failure-free specimen Aut2 has a surprisingly low element concentration. The elements P and S are detectable in concentrations well below 0.1%. The same result is obtained in the IR analysis; the absorbance is on a low level, with dominating bands 02 and 05. This hints at a thin tribo-film.
As previously described in the Methods section, the higher viscous industrial gear box oils were tested with FE8-32 (see
Table 1) to obtain mixed friction conditions in the rolling contact with an oil of ISO-VG 320. The specimens Ind1 and Ind2, tested with fully formulated oils of different manufacturers, showed comparable tribo-films (see
Figure 7b). This fits with the comparable oil formulation of Ind1 and Ind2 (
Table 5). Both tribo-films showed low concentrations of P and S. The elements Zn and Ca were below the detection limit. In the IR spectra of both specimen surfaces, similar bands with low absorbance at 02, 05 and 06 were present. The band 06 showed the most intensive absorbance. Both specimens were WEC-free after the test run. The specimen Ind2PLUS was tested with the same oil as Ind2, but additionally, Ca-sulfonate (ob) was mixed in the fully formulated oil before the test run. The tribo-film of this specimen was completely different to the original Ind2. The P content was over 0.5%, a factor of more than 10 compared to Ind2. Additionally, the Ca, and the S content also increased (
Figure 7b). The IR spectrum was then dominated by the band 05 and at region 04 there were only small intensities. The absorption also increased. This, together with the higher element content, could lead to thicker or much denser tribo-films in the specimen Ind2PLUS. It is particularly noteworthy that the addition of the additive does not produce a typical layer analogous to Mod1, but a layer containing Phosphorus is produced although the Phosphorus content of the oil used remained the same. This means that the addition of the Ca-sulfonate (ob) makes an already existing additive form a more intensive, Phosphorus-dominated tribo-film.
4. Discussion
A higher Hydrogen release from the lubricating oil into the material structure at thicker tribo-films contradicts expectations. In [
13], the dense phosphate film protected against the penetration of Hydrogen into the material from a pure Hydrogen atmosphere. For the FE8-WEC-failure mode, it is more realistic that the stored Hydrogen in the tribo-film, as detected in [
33], is the origin of the H-loading of the material. Additionally, the presence of several oxidation states of Phosphorous [
36] hints at possible Hydrogen release inside the tribo-film. The tribo-film under the harsh FE8-25/32 test conditions is certainly not static. This would explain why not only the over-rolling frequency but also the ratio between contact time and no-contact time have an influence on time to WEC failure [
53]. Thus, at the FE8-25/32 test conditions, it would be expected that the H-loading happens during contact by stressing the tribo-film. On the other hand, Hydrogen effusion and temperature-induced regeneration of the tribo-film will occur during the non-contact phase.
The following findings were obtained during the surface analytical post-test examination of the test specimens:
Similar oil formulations lead to similar tribo-films at identical test conditions.
The tribo-films of specimens that passed without damages are thin and Sulfur–Phosphorous based.
The tribo-films on WEC-failed parts are not identical.
All WEC-failed specimens have thick, Phosphorous-dominated tribo-films.
Interaction of additives, i.e., with fluid contaminants, lead to changes in tribo-films.
The statement formulated by Paracelsus, “The dose makes the poison” (dosis sola facit venenum), also seems to apply to Phosphorous-based tribo-films. Thin, dense films are quite effective as a Hydrogen barrier as reported in [
2], but massive layers act as Hydrogen sources under certain frictional conditions, as in FE8-pitting tests.
The formation of certain tribological layers (tribo-films) on the raceway results from an interaction of the surface with the lubricant chemistry under the local frictional energies. These tribo-films were characterized using the two analysis methods, µXRF and ATR FTIR microscopy, developed and available at Schaeffler.
The project objective was to characterize the resulting tribo-films of different oils that showed significantly different surface damage patterns in tribological contact as a result of the FE8-25 test run. The aim was to show a possible correlation of the different damage patterns with the structure of the tribo-films analyzed by µXRF and ATR-FTIR microscopy. This gave rise to several use cases; for example, to predict the damage risk of a bearing based on the tribological layer formed on the surface without having to perform the test run until the final damage escalation. Through the results obtained, we see the opportunity to shorten the testing times significantly. Hundreds of hours of test time could be replaced in the future by predicting the failure mode just by analyzing the resulting tribo-film after a short test time. This will be the basis of further developments using existing test bearings from previous FE8-25 test runs with different oils and damage patterns.


