

Revealing the Binarity of HD 36030—One of the Hottest Flare Stars

1
Astronomical Institute of the Czech Academy of Sciences, Fričova 298, 25165 Ondřejov, Czech Republic
2
Astroserver.org, Főtér 1, 8533 Malomsok, Hungary
3
Institute of Physics of the Czech Academy of Sciences, Na Slovance 1999/2, 18200 Prague, Czech Republic
4
Special Astrophysical Observatory of the Russian Academy of Sciences, 369167 Nizhnii Arkhyz, Russia
*
Author to whom correspondence should be addressed.
Galaxies 2023, 11(2), 55; https://doi.org/10.3390/galaxies11020055
Submission received: 14 March 2023
/
Revised: 1 April 2023
/
Accepted: 10 April 2023
/
Published: 12 April 2023
(This article belongs to the Special Issue Theory and Observation of Active B-type Stars)
Abstract
:The Kepler and TESS space missions significantly expanded our knowledge of what types of stars display flaring activity by recording a vast amount of super-flares from solar-like stars, as well as detecting flares from hotter stars of A-F spectral types. Currently, we know that flaring occurs in the stars as hot as B-type ones. However, the structures of atmospheres of hot B-A stars crucially differ from the ones of late types, and thus the occurrence of flaring in B-A type stars requires some extension of our theoretical views of flare formation and therefore a detailed study of individual objects. Here we present the results of our spectral and photometric study of HD 36030, which is a B9 V star with flares detected by the TESS satellite. The spectra we acquired suggest that the star is in a binary system with a low-mass secondary component, but the light curve lacks any signs of periodic variability related to orbital motion or surface magnetic fields. Because of that, we argue that the flares originate due to magnetic interaction between the components of the system.
1. Introduction
Stars classified as B-type span a very wide range of temperatures (from 25,000 to 11,000 K) and masses (from 50 for B0 Ia0 down to 3.5 for B9 V). They usually display the variability related to changes of the photospheric structure, e.g., pulsations of different varieties [1], such as: slowly pulsating B-type stars (SPB) [2,3], variables of the Cephei type [4], variables of the Cygni type [5], or classical Be (CBe) stars [6]. Less frequently, B-type stars show variability related to extended atmospheres and outflows, usually observed in peculiar B-type stars, such as B[e] [7,8] or luminous blue variables (LBVs) [9,10]. Quite unexpectedly, some B stars have also been shown to manifest very energetic stellar flares (e.g., [11] and references therein)—unpredictable dramatic increases in brightness for a few dozen minutes.
Such flaring activity is a well-known effect that is often seen both on the Sun and on so-called flare stars. Energetic flaring events are attributed to the release of the energy stored in coronal magnetic fields in magnetic reconnection events that accelerate the particles (electrons and ions) to high energies, thus heating dense regions of the stellar atmosphere and generating the flare-like emission in a wide range of frequencies, from radio to gamma-rays [12,13].
Although the majority of flare stars were found among objects of late spectral types, primarily cool K-M type red dwarfs [14,15], such outbursts were also detected in some hot B–A type stars, both in the optical range [16,17,18] and in X-rays [19,20]. In cool stars (F5 and later), the flares are linked with strong magnetic fields produced by a dynamo mechanism working in sufficiently deep outer convection zones [21]. On the other hand, the interiors of hot early-type stars are mostly radiative, with no convective motions to power the dynamo, and therefore magnetic field production is not expected in them, and other explanations of the eruptive activity are needed.
Pedersen et al. [22] suggested that all flaring hot stars are parts of binary systems and that the flares occur on unresolved cool components. However, Švanda and Karlický [23] and Bai and Esamdin [24] found that the frequency distribution of flare energies for A-type stars is steeper (with more flares having large energies) than the one for stars of later spectral types. It may suggest that the nature of flares on hot stars is indeed different, and they are not occurring on their colder companions. Balona [17,18] studied the variability of flaring B-A type stars and argued that rotational modulation seen in them confirms the presence of strong surface magnetic fields. One more possible mechanism for the flares may be related to magnetic interaction between the components in a close binary system, as was suggested by Yanagida et al. [20] for the pre-main sequence stars HD 47777 and HD 261902.
Currently, more than one hundred hot flaring B-A type stars are known from observations of the Kepler and TESS missions [11,17,18]. Van Doorsselaere et al. [25] demonstrated that about 2.45% of all B-A stars display detectable flares. However, the nature of their flares is still elusive. Thus, the study of these stars, and their possible binarity, is of utmost importance.
This paper is devoted to the spectral and photometric study of HD 360301, classified as B9 V [26] and belonging to the galactic open cluster ASCC 21 (or [KPR2005] 21 [27,28]). For the first time, HD 36030 was mentioned as a flare star in Maryeva et al. [11], where the authors searched for flare stars among confirmed members of galactic open clusters using high-cadence photometry from the TESS mission. Maryeva et al. [11] found eight B-A type flaring objects; among them, HD 36030 was the hottest. Independently, Balona [18] and Yang et al. [29] also selected HD 36030 as a flare star while searching for flares in TESS data. Despite being included in a couple dozens of catalogs, and being detected as an X-ray source by the Swift X-ray Telescope (XRT) [30]), to date HD 36030 lacks any specific studies devoted to it.
In Section 2, we present new spectral data, their analysis, and the results of atmospheric modeling using the Tlusty code. In Section 3, we perform the analysis of photometric data on different time scales, and in Section 4, we discuss the results, the parameters of the second component, and the nature of flares. Finally, short conclusions are given in Section 5.
2. Spectroscopy of HD 36030
2.1. Observations
To clarify the nature of HD 36030 flaring activity, we initiated its spectral monitoring at the Perek 2 m telescope of the Ondřejov observatory of the Astronomical Institute of the Czech Academy of Sciences. High-resolution spectra of HD 36030 were obtained with the Ondřejov echelle spectrograph (OES) [31,32] during the autumn of 2021 and spring of 2022 (Table 1). The OES provides a wavelength range of 3750–9200 Å and a spectral resolving power of 50,000. The spectra were reduced using a dedicated IDL-based package. After primary reduction, all spectra were normalized and corrected for barycentric velocity.
Hydrogen lines in the acquired OES spectra have profiles with broad wings, with the width of the lines comparable to an echelle spectral order. For this reason, for the spectral normalization in the H region we used the medium resolution spectrum of HD 36030 covering a 6250–6740 Å range acquired using the Coudé spectrograph (; Slechta and Skoda [33]), which was also obtained at the Perek 2-m telescope on 20 September 2020. The spectrum was reduced using an IDL-based package, in the same way as described in Maryeva et al. [34]. Unfortunately, we have medium-resolution spectra only for the H region, so we could not perform the same routine for the orders containing other hydrogen lines. For them, we performed manual continuum drawing, and thus the normalization in these regions is less robust.
2.2. Spectral Analysis
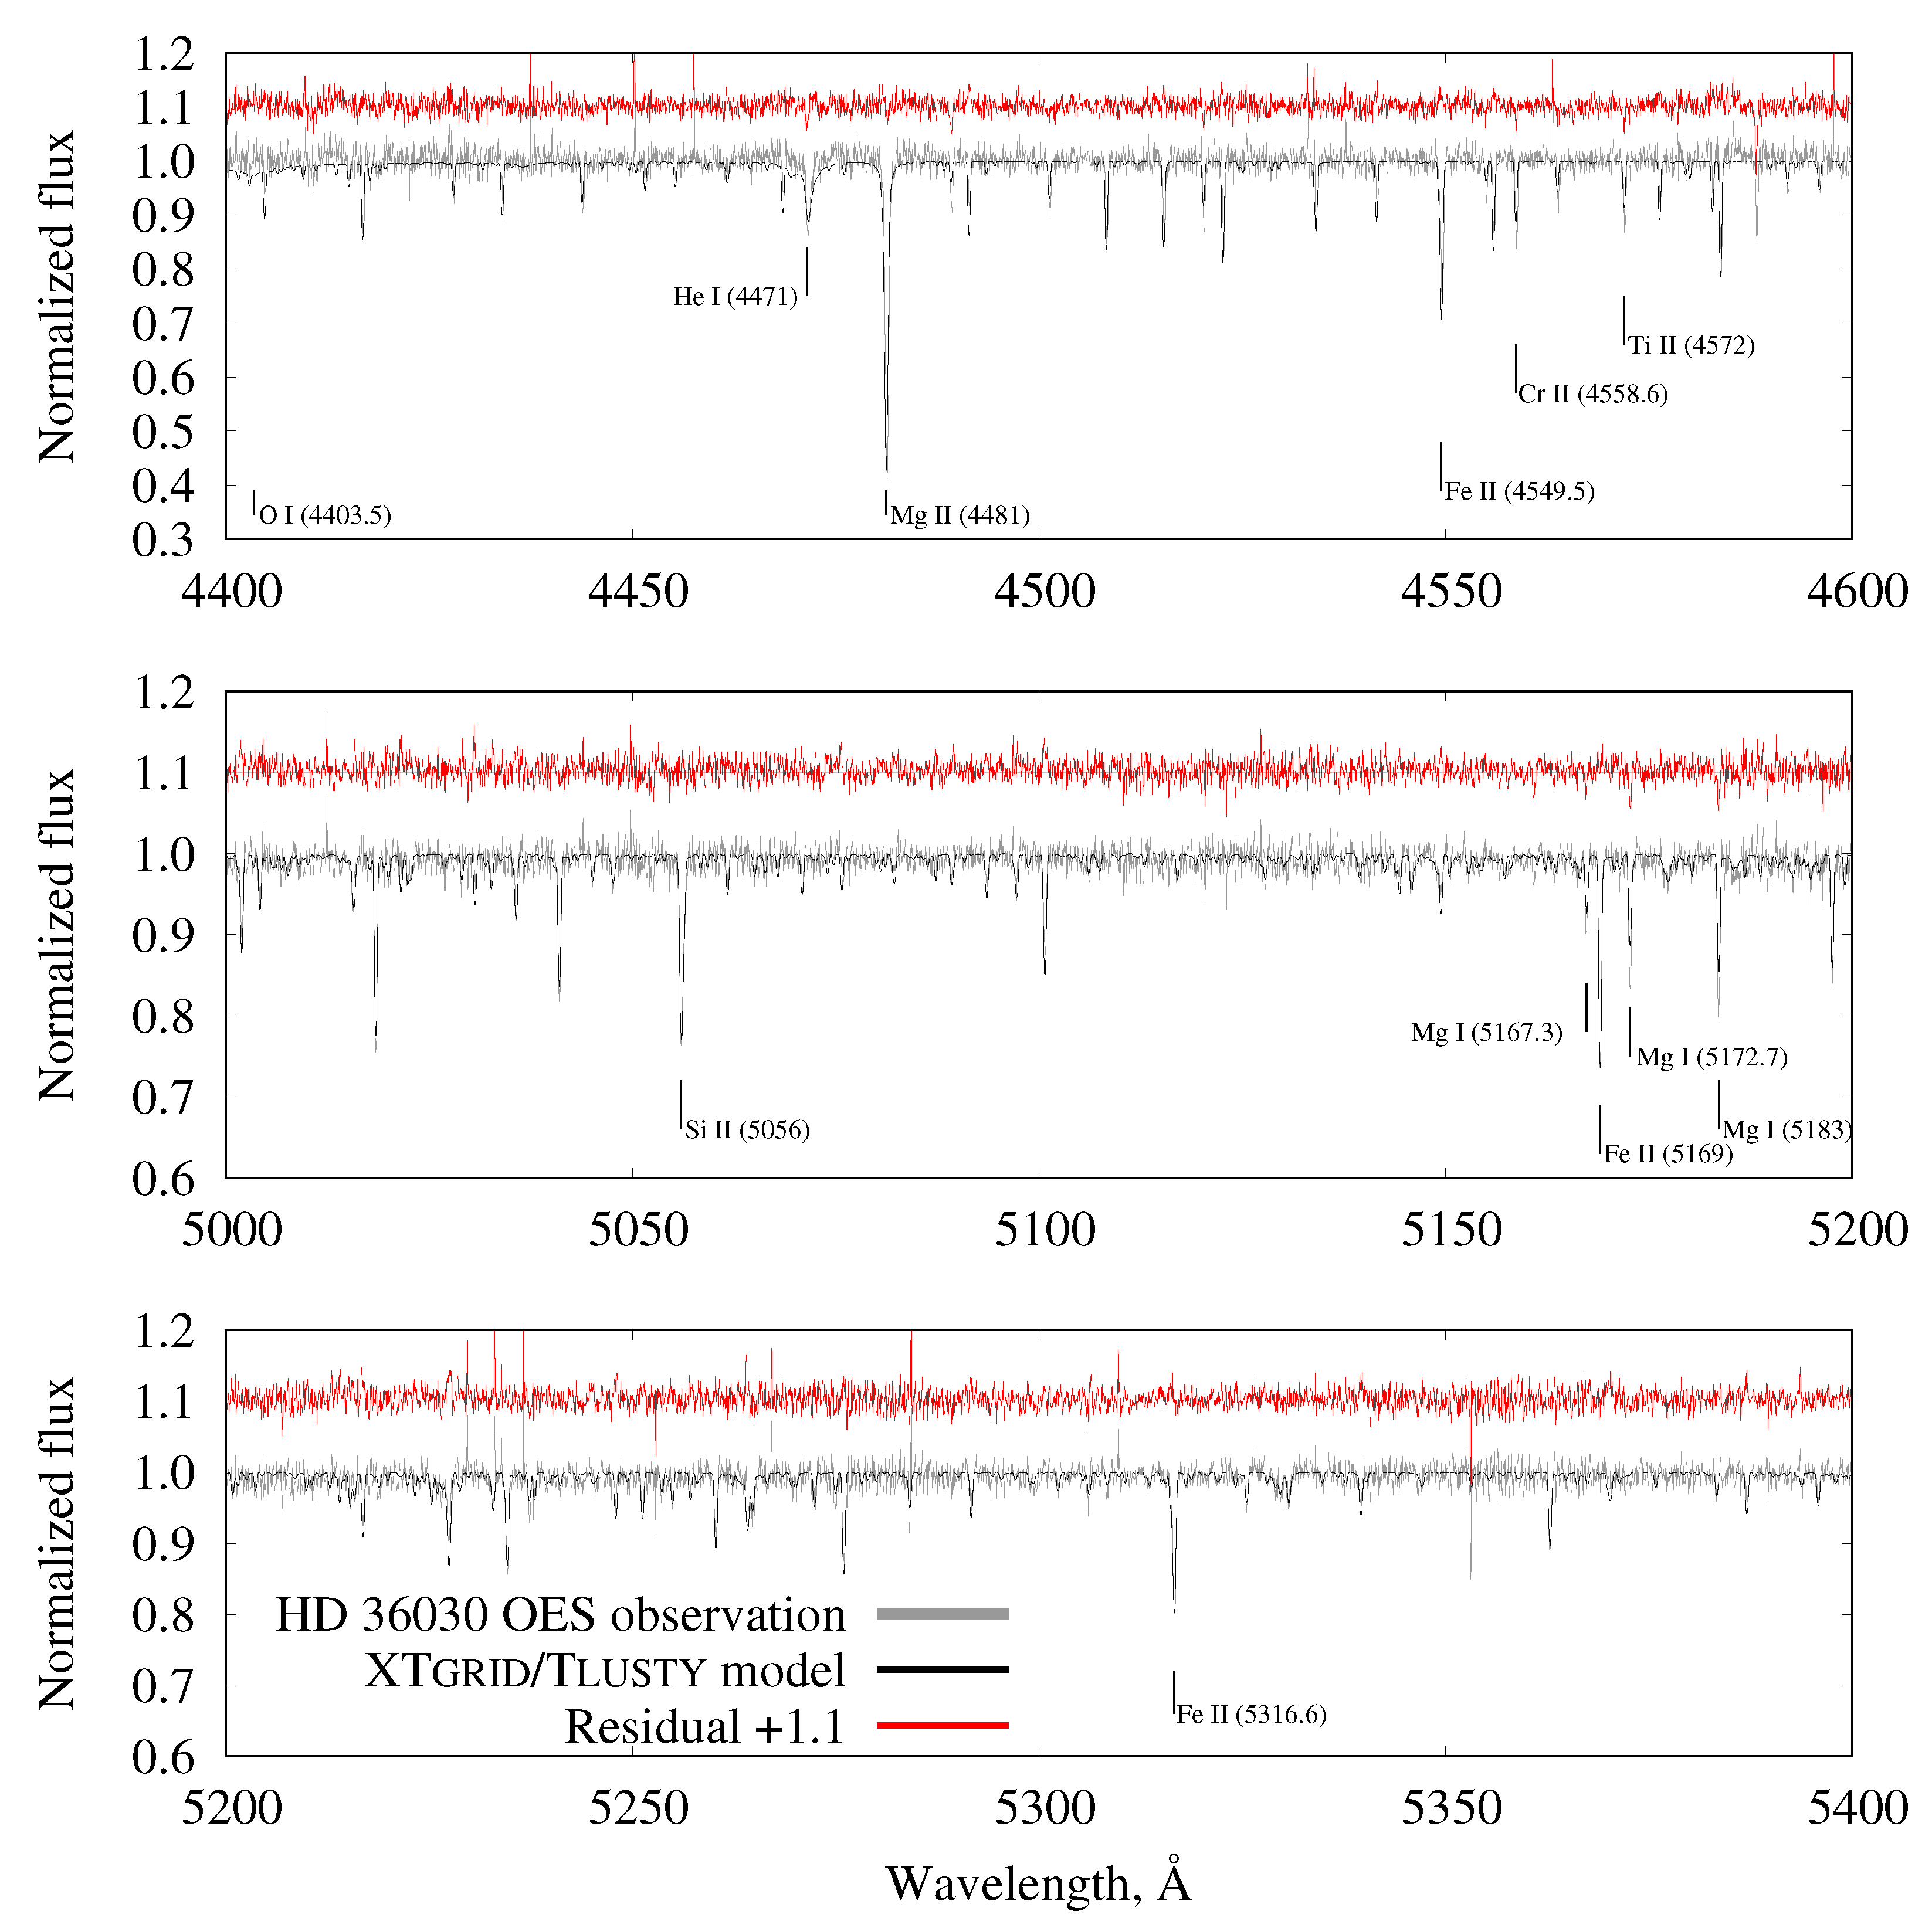
In the spectrum of HD 36030, there is a strong Mg II line, Ca II doublet, Mg I triplet, as well as a number of Fe II lines. All the lines in the spectrum besides the hydrogen lines are narrow. As it was noted above, the hydrogen lines show prominent Voigt profiles, which are a signature of the Stark effect (Figure 1). It is possible to also detect the lines of He I , which is a piece of evidence that the star is hotter than A0 [35]. Figure 2 shows a comparison of the HD 36030’s spectrum with ones of B9 V and A0 V stars.
We estimated the reddening by comparing the photometric data from the Tycho-2 catalogue [40] ( mag and mag) with the intrinsic color for a B9 star2 ( mag; Pecaut and Mamajek [41]) as mag. Then, assuming the distance to its host cluster ASCC 21 to be pc [28], the absolute magnitude of HD 36030 is mag. It is fainter than the expected absolute magnitude of a B9 dwarf ( = 0.5 mag from the table of Pecaut and Mamajek [41]). However, the location of HD 36030 in the Hertzsprung–Russell (HR) diagram for ASCC 21 cluster (Figure 3) accurately corresponds to the Main Sequence, and therefore we consider HD 36030 to be a B9 dwarf (B9 V), in agreement with Houk and Swift [26].
Lines in the spectrum of HD 36030 clearly display a shift from night to night. We measured radial velocities (RVs) of selected lines (collected in Table 2). For the RV measurements, we used Gaussian profile fittings, and, for the case of hydrogen lines, we measured the positions of the narrow central absorptions. As Table 2 shows, the lines of different elements and ions differ in RV. RVs of Mg II and O I lines are higher than those of other lines, but all the lines demonstrate the same pattern of variability. Figure 4 shows average RVs, and those of the interstellar Na I , measured in the same way as a reference. The scatter of the RV values is from 6 up to 45 km s, and they clearly show that HD 36030 is a binary system. However, we do not see any lines of the secondary component in the spectrum, so we classified HD 36030 as a single-lined spectroscopic binary (SB1) system.
2.3. Spectral Analysis with XTgrid
To determine the atmospheric parameters of HD 36030 in local thermodynamic equilibrium (LTE), we fitted its OES observations with synthetic spectra calculated from Tlusty (v207) model atmospheres [44,45,46]. The models include opacities from H, He, C, N, O, Ne, Mg, Si, P, S, and Fe. The spectral analysis was done with a steepest-descent spectral analysis procedure, implemented in the XTgrid code [47]. The procedure is a global fitting method that simultaneously reproduces all line profiles with a single atmosphere model. XTgrid starts with an input model and, by successive approximations, it calculates new model atmospheres and their corresponding synthetic spectra iteratively in the direction of decreasing . The procedure adjusts the atomic data and microphysics to the changing conditions in the atmosphere as the iterations move across the parameter space. Once the fitting procedure reaches the global minimum, statistical errors are calculated by changing each parameter in one dimension until the variation corresponds to the 60% confidence. To avoid local minima, the procedure returns to the descent part if a better fit is found during the error analysis. Our models evaluated the conditions for convection, but the convective gradients indicated there are no convective layers in the atmosphere. We have made attempts to calculate non-LTE models and evaluate departures from the LTE approximation; however, all such models met numerical instabilities and failed. A non-LTE analysis will require the latest version of Tlusty (v208) and will be reported in a forthcoming publication.
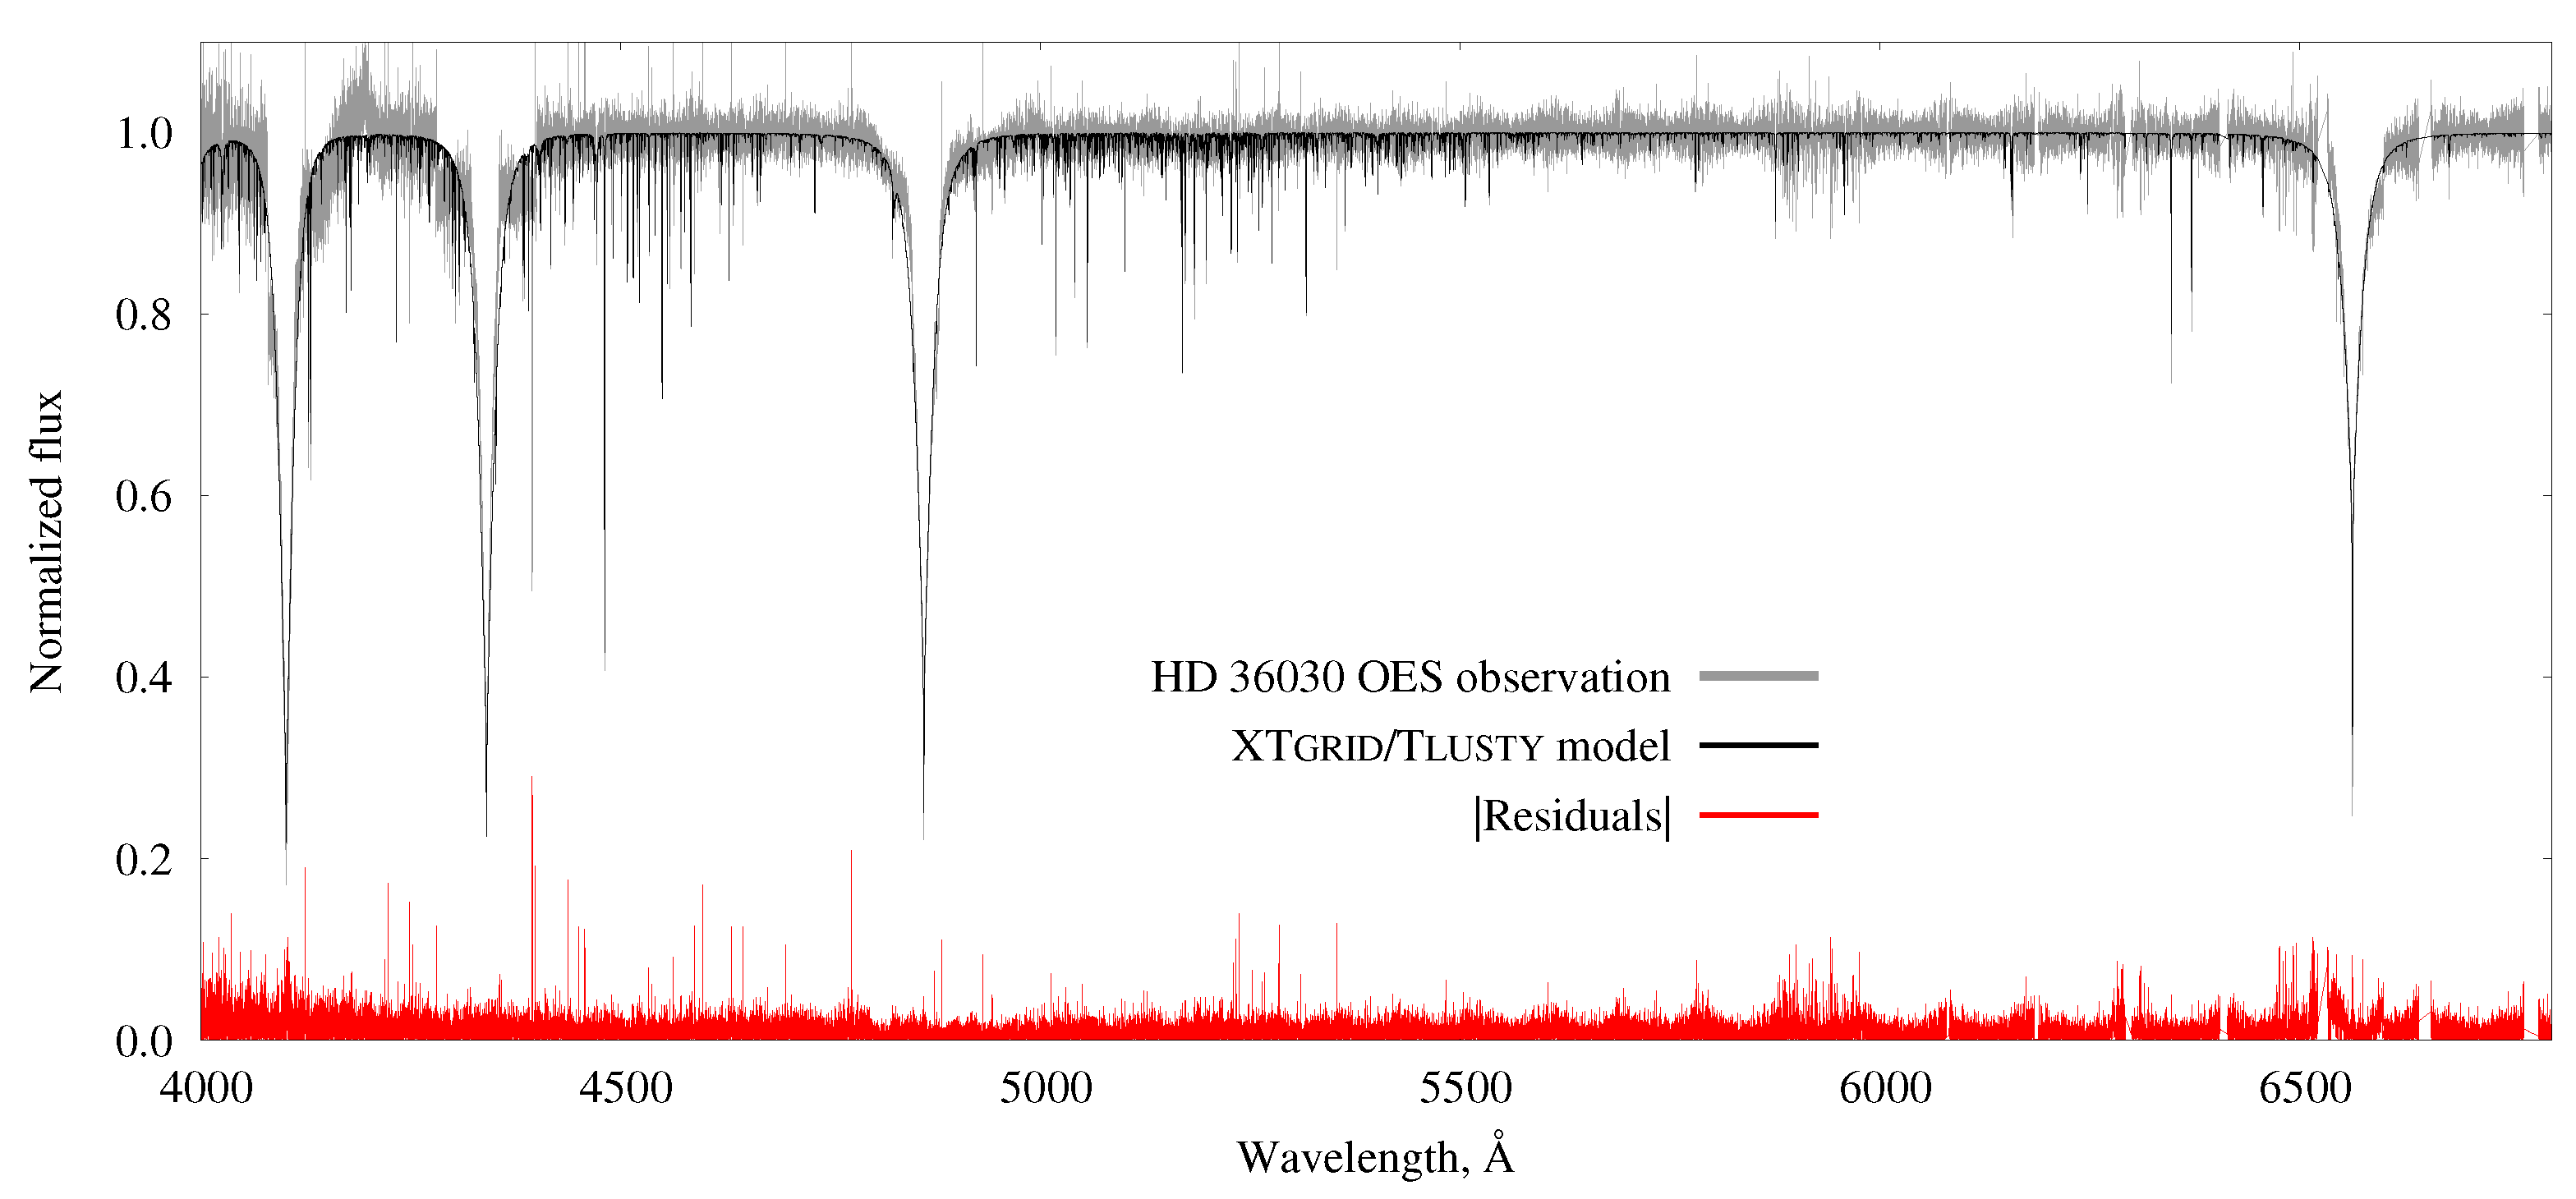
The spectroscopic parameters obtained from Tlusty LTE models are summarized in Table 3, and the best fit is shown in Figure 5 and Figure 6. The large error of measurement is mostly due to uncertainties in the continuum normalization of the broad hydrogen lines. Such big uncertainties in and give us a broad range of a possible mass of the star, . However, the position of HD 36030 in the HR diagram (Figure 3) is consistent with .
To check the validity of Tlusty models, we have repeated the analysis with interpolated Atlas9 LTE models from the BOSZ spectral library [48]. The Atlas9 models confirmed the effective temperature and surface gravity within error bars, but the BOSZ library was calculated for scaled solar metallicities; therefore, it is not suitable to derive individual element abundances for further comparisons.
3. Photometry
In order to investigate the short time scale photometric variability of HD 36030, we used the data from the Transiting Exoplanet Survey Satellite (TESS; Ricker et al. [49]). HD 36030 was observed by TESS twice during its ongoing operation, in Sector 6 (11 December 2018–7 January 2019) of the prime mission, and Sector 32 (19 November 2020–17 December 2020) of the extended mission. We downloaded the data products for these observations produced by the TESS Science Processing Operations Center pipeline (SPOC; Jenkins et al. [50]) and available at the Barbara A. Mikulski Archive for Space Telescopes (MAST)3 public data archive. We used the data products for the Long Cadence data, having 1800 s effective exposure during the prime mission, and 600 s—during the extended mission. In order to minimize the instrumental effects that are abundant in TESS data, we decided to use pre-search data conditioning simple aperture photometry (PDCSAP) light curves, which are corrected for instrumental trends using singular value decomposition, as well as for flux contributions from nearby objects in crowded fields [50]. We also filtered out the measurements marked with bad quality flags. We did not apply any additional detrending or pre-processing to the data, and the resulting light curves are shown in Figure 7.
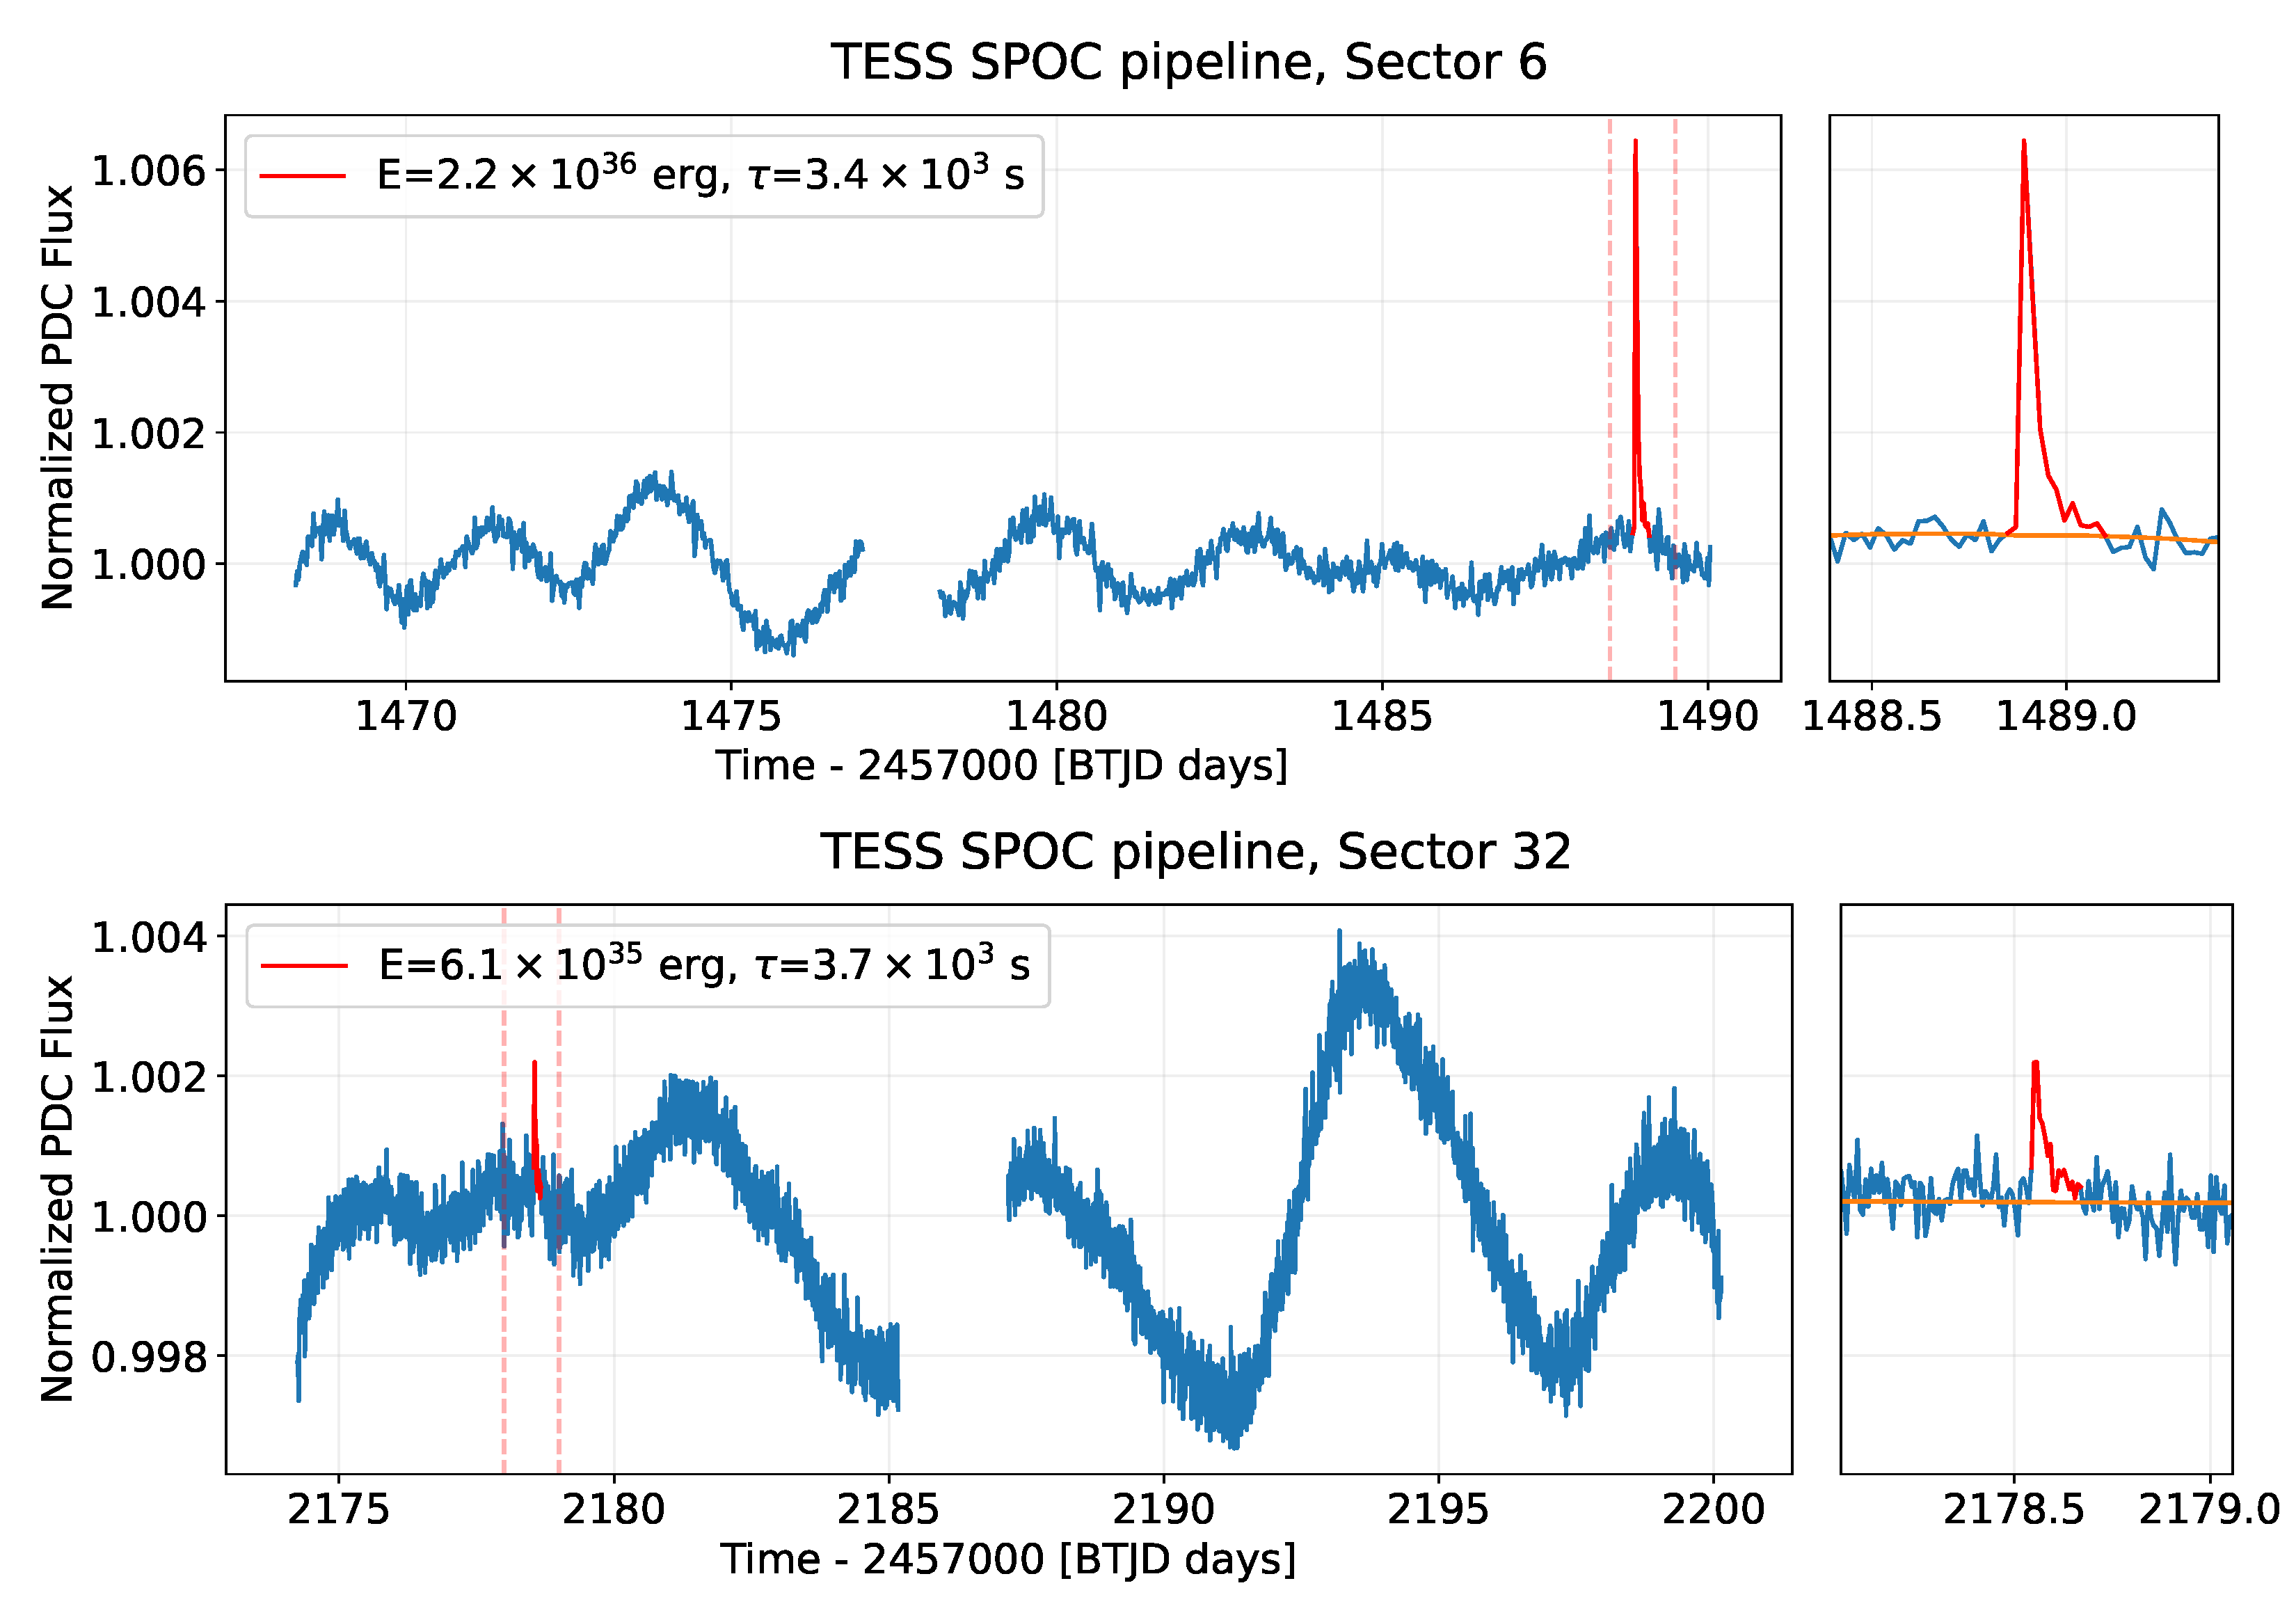
The light curve from Sector 6 shows a strong flare that has already been reported by Maryeva et al. [11] and Balona [18]. Visual inspection of Sector 32 also revealed a flare of smaller amplitude but similar duration. Both flares are shown in Figure 7. We characterized them by subtracting the smooth quiescent emission and integrating the flare profile to get its total fluence and fitted the fading part with an exponential function to get the characteristic duration, which we define as an e-folding time.
We also estimated the total energetics of the flares by integrating the flare profile after subtraction of a smooth trend of a star’ quiescent emission. In order to correct for the fact that the majority of both the star and flare emission is outside of the TESS sensitivity range, we applied the bolometric corrections by convolving the spectrum of the star as well as flare spectrum with the sensitivity curve of TESS. As the temperatures of flares on the hot stars are not known yet, as a conservative estimate, following Shibayama et al. [51] and Günther et al. [15], we assumed the flares to have a blackbody spectrum with K, whereas for the star we used the spectral energy distribution of the best fitting Tlusty model derived in Section 2.3. Then we used these bolometric corrections to convert the relative amplitude of the flare to its relative total fluence, and, knowing the luminosity of HD 36030, we converted them to absolute values. The resulting flare energies are shown in Figure 7.
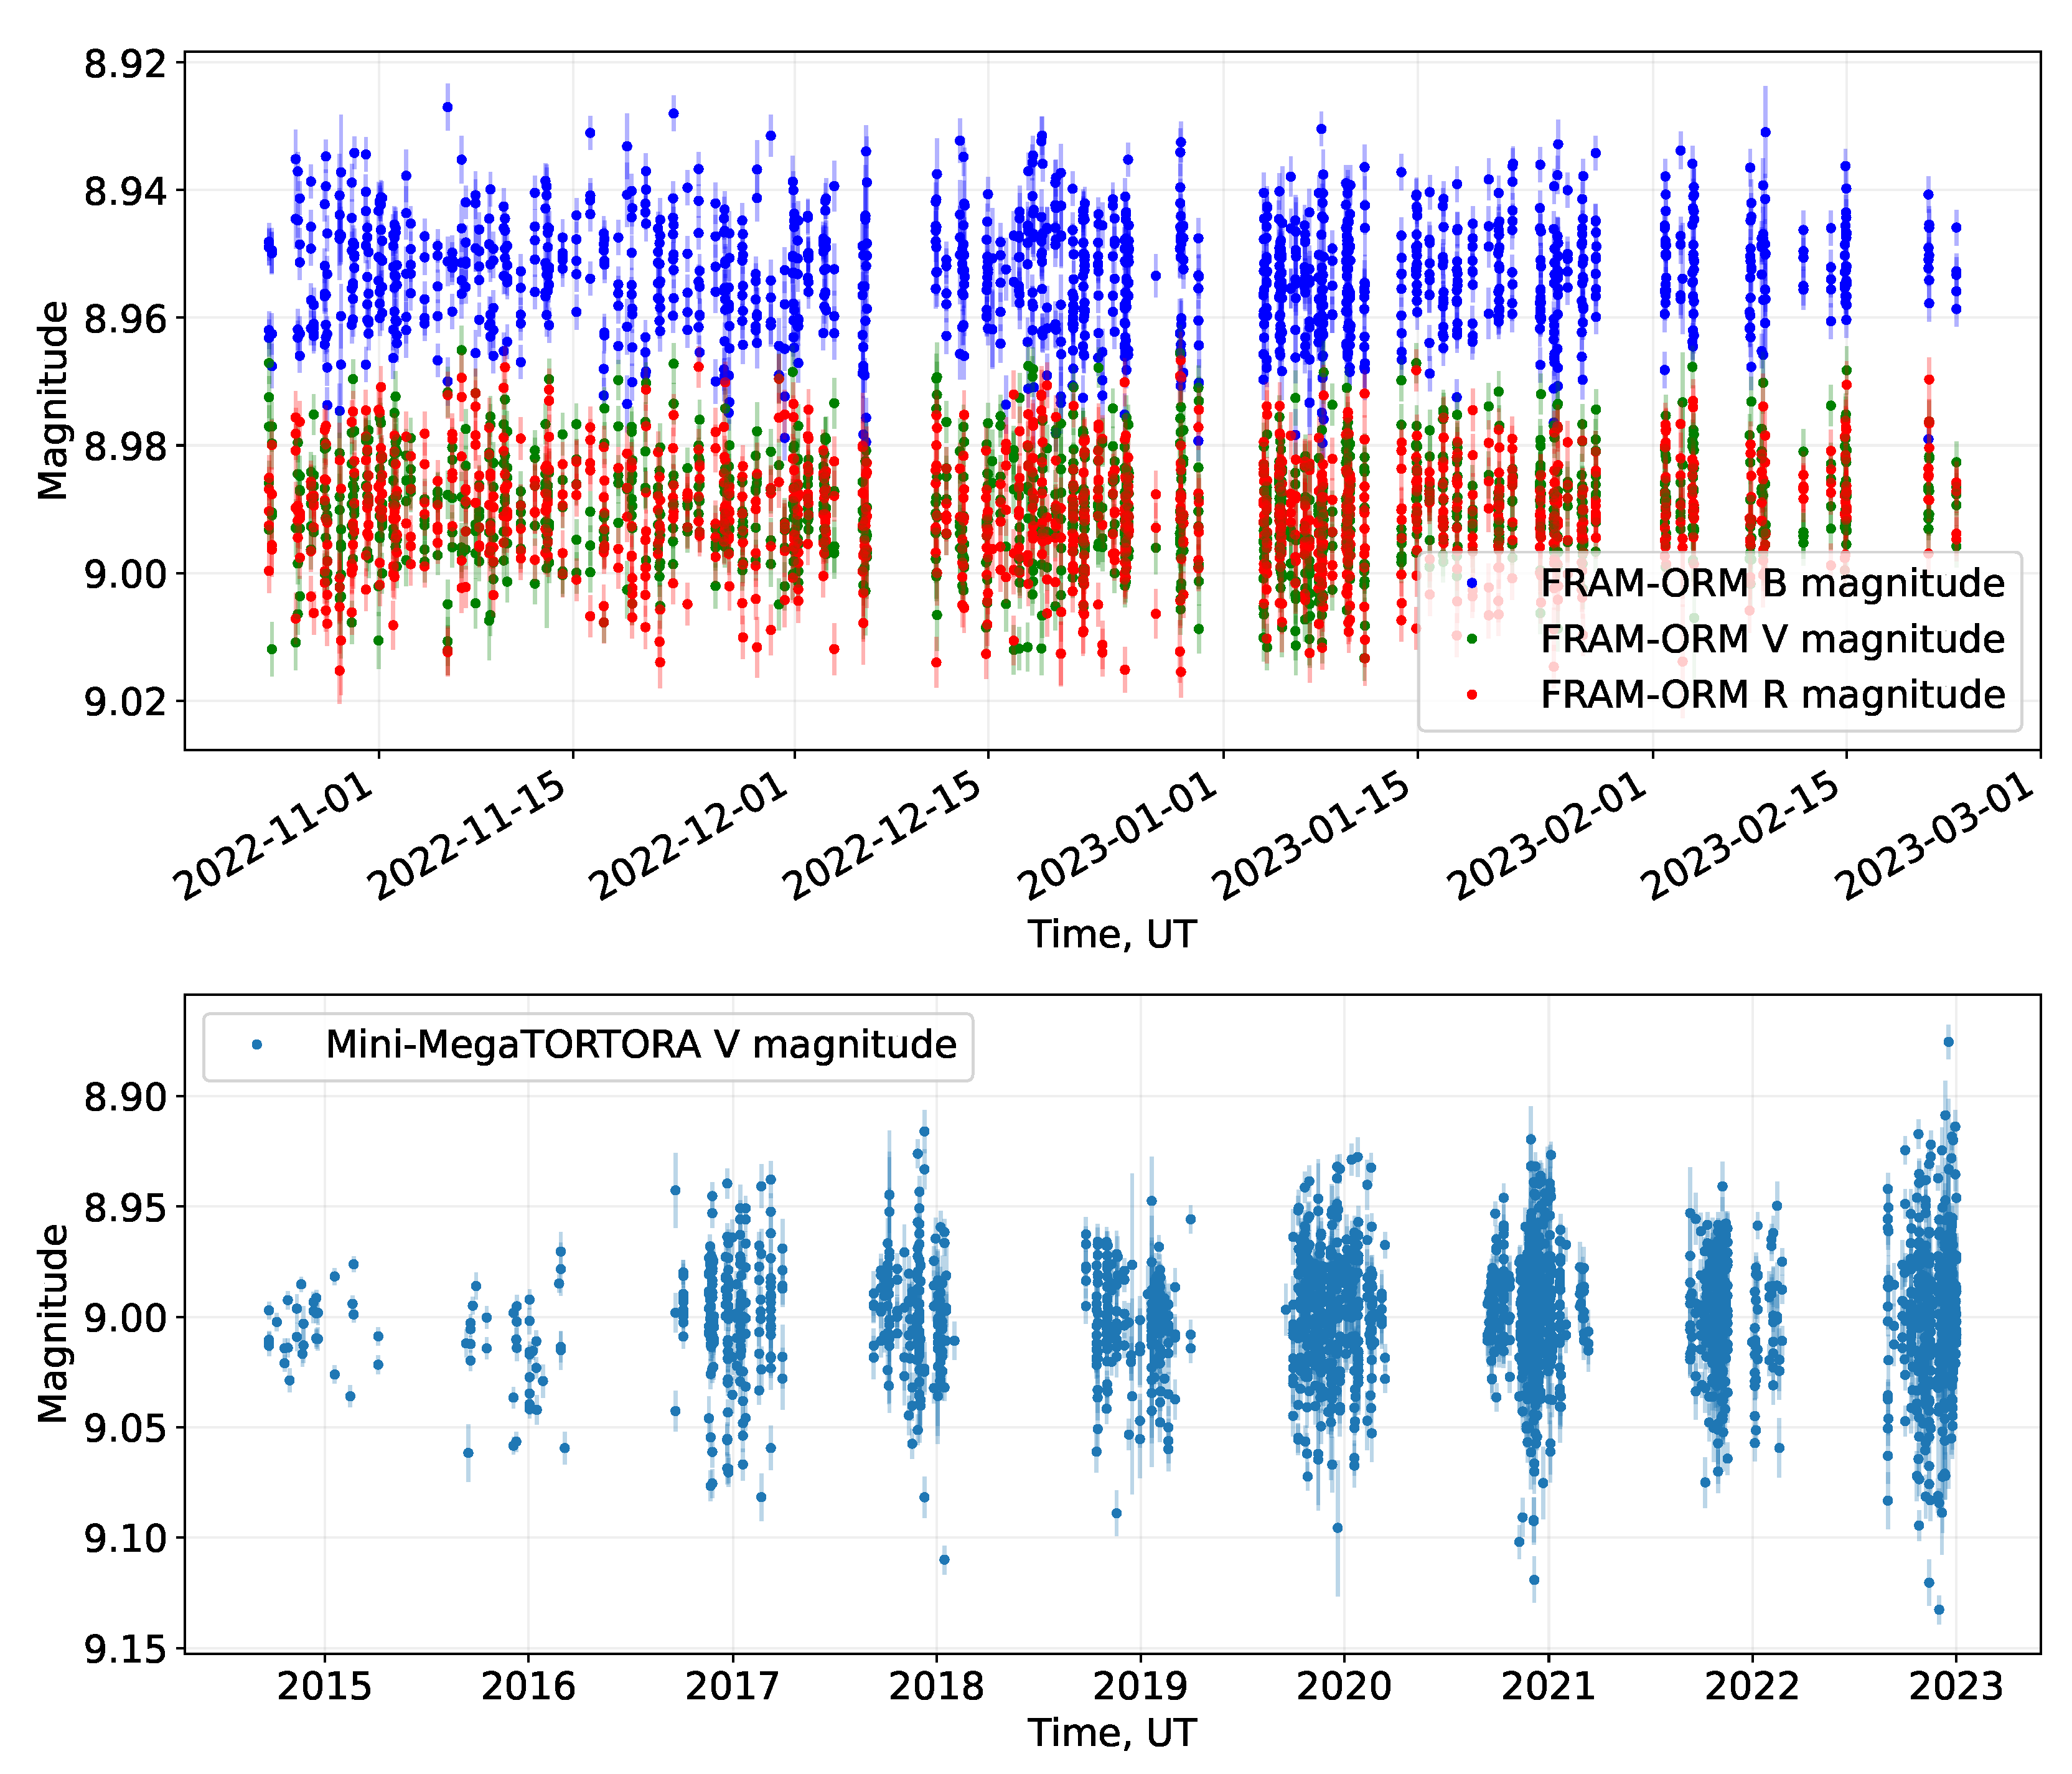
In mid-October 2022, we also initiated a series of photometric observations of HD 36030 on FRAM-ORM, which is a 10-inch Meade f/6.3 Schmidt–Cassegrain telescope with custom Moravian Instruments G2-1600 CCD installed in the Roque de Los Muchachos Observatory, La Palma. The data were acquired in Johnson–Cousins B (20 s exposures), V, and R filters (10 s exposures) to avoid saturation due to the brightness of the star and then automatically processed by a dedicated Python pipeline based on the STDPipe package [52], which includes bias and dark current subtraction, flat-fielding, cosmic ray removal, astrometric calibration, aperture (with a 5-pixel radius) photometry, and photometric calibration using the catalog of synthetic photometry based on Gaia DR3 low-resolution XP spectra [53]. The resulting light curve is shown in the upper panel of Figure 8.
Finally, in order to assess the longer time scale variability of HD 36030, we acquired its photometry from the data archive of Mini-MegaTORTORA [54], which is a nine-channel wide-field optical monitoring system with high temporal resolution, operated since mid-2014 and located at the Special Astrophysical Observatory, Nizhny Arkhyz, Russia. As part of its systematic observations of the northern sky, primarily targeted at the detection and characterization of optical transients on a sub-second time scale, it acquires deeper “survey” images with 20 to 60 s exposures in white light, covering every point of the northern sky on average several times per night. These images are processed by a dedicated pipeline that, apart from standard calibration steps, determines the effective photometric system of every frame and then employs this information to derive the colors of every star and re-calibrate the measurements to a Johnson V filter [55]. The resulting measurements are published online on the dedicated portal4. The data for HD 36030 have been extracted from the Mini-MegaTORTORA archive and passed through quality cuts in order to filter out the points corresponding to bad weather intervals and images where photometric calibration was too noisy. This resulted in more than 2300 points with good V magnitudes for the star, spanning more than 8 years since mid-2014.
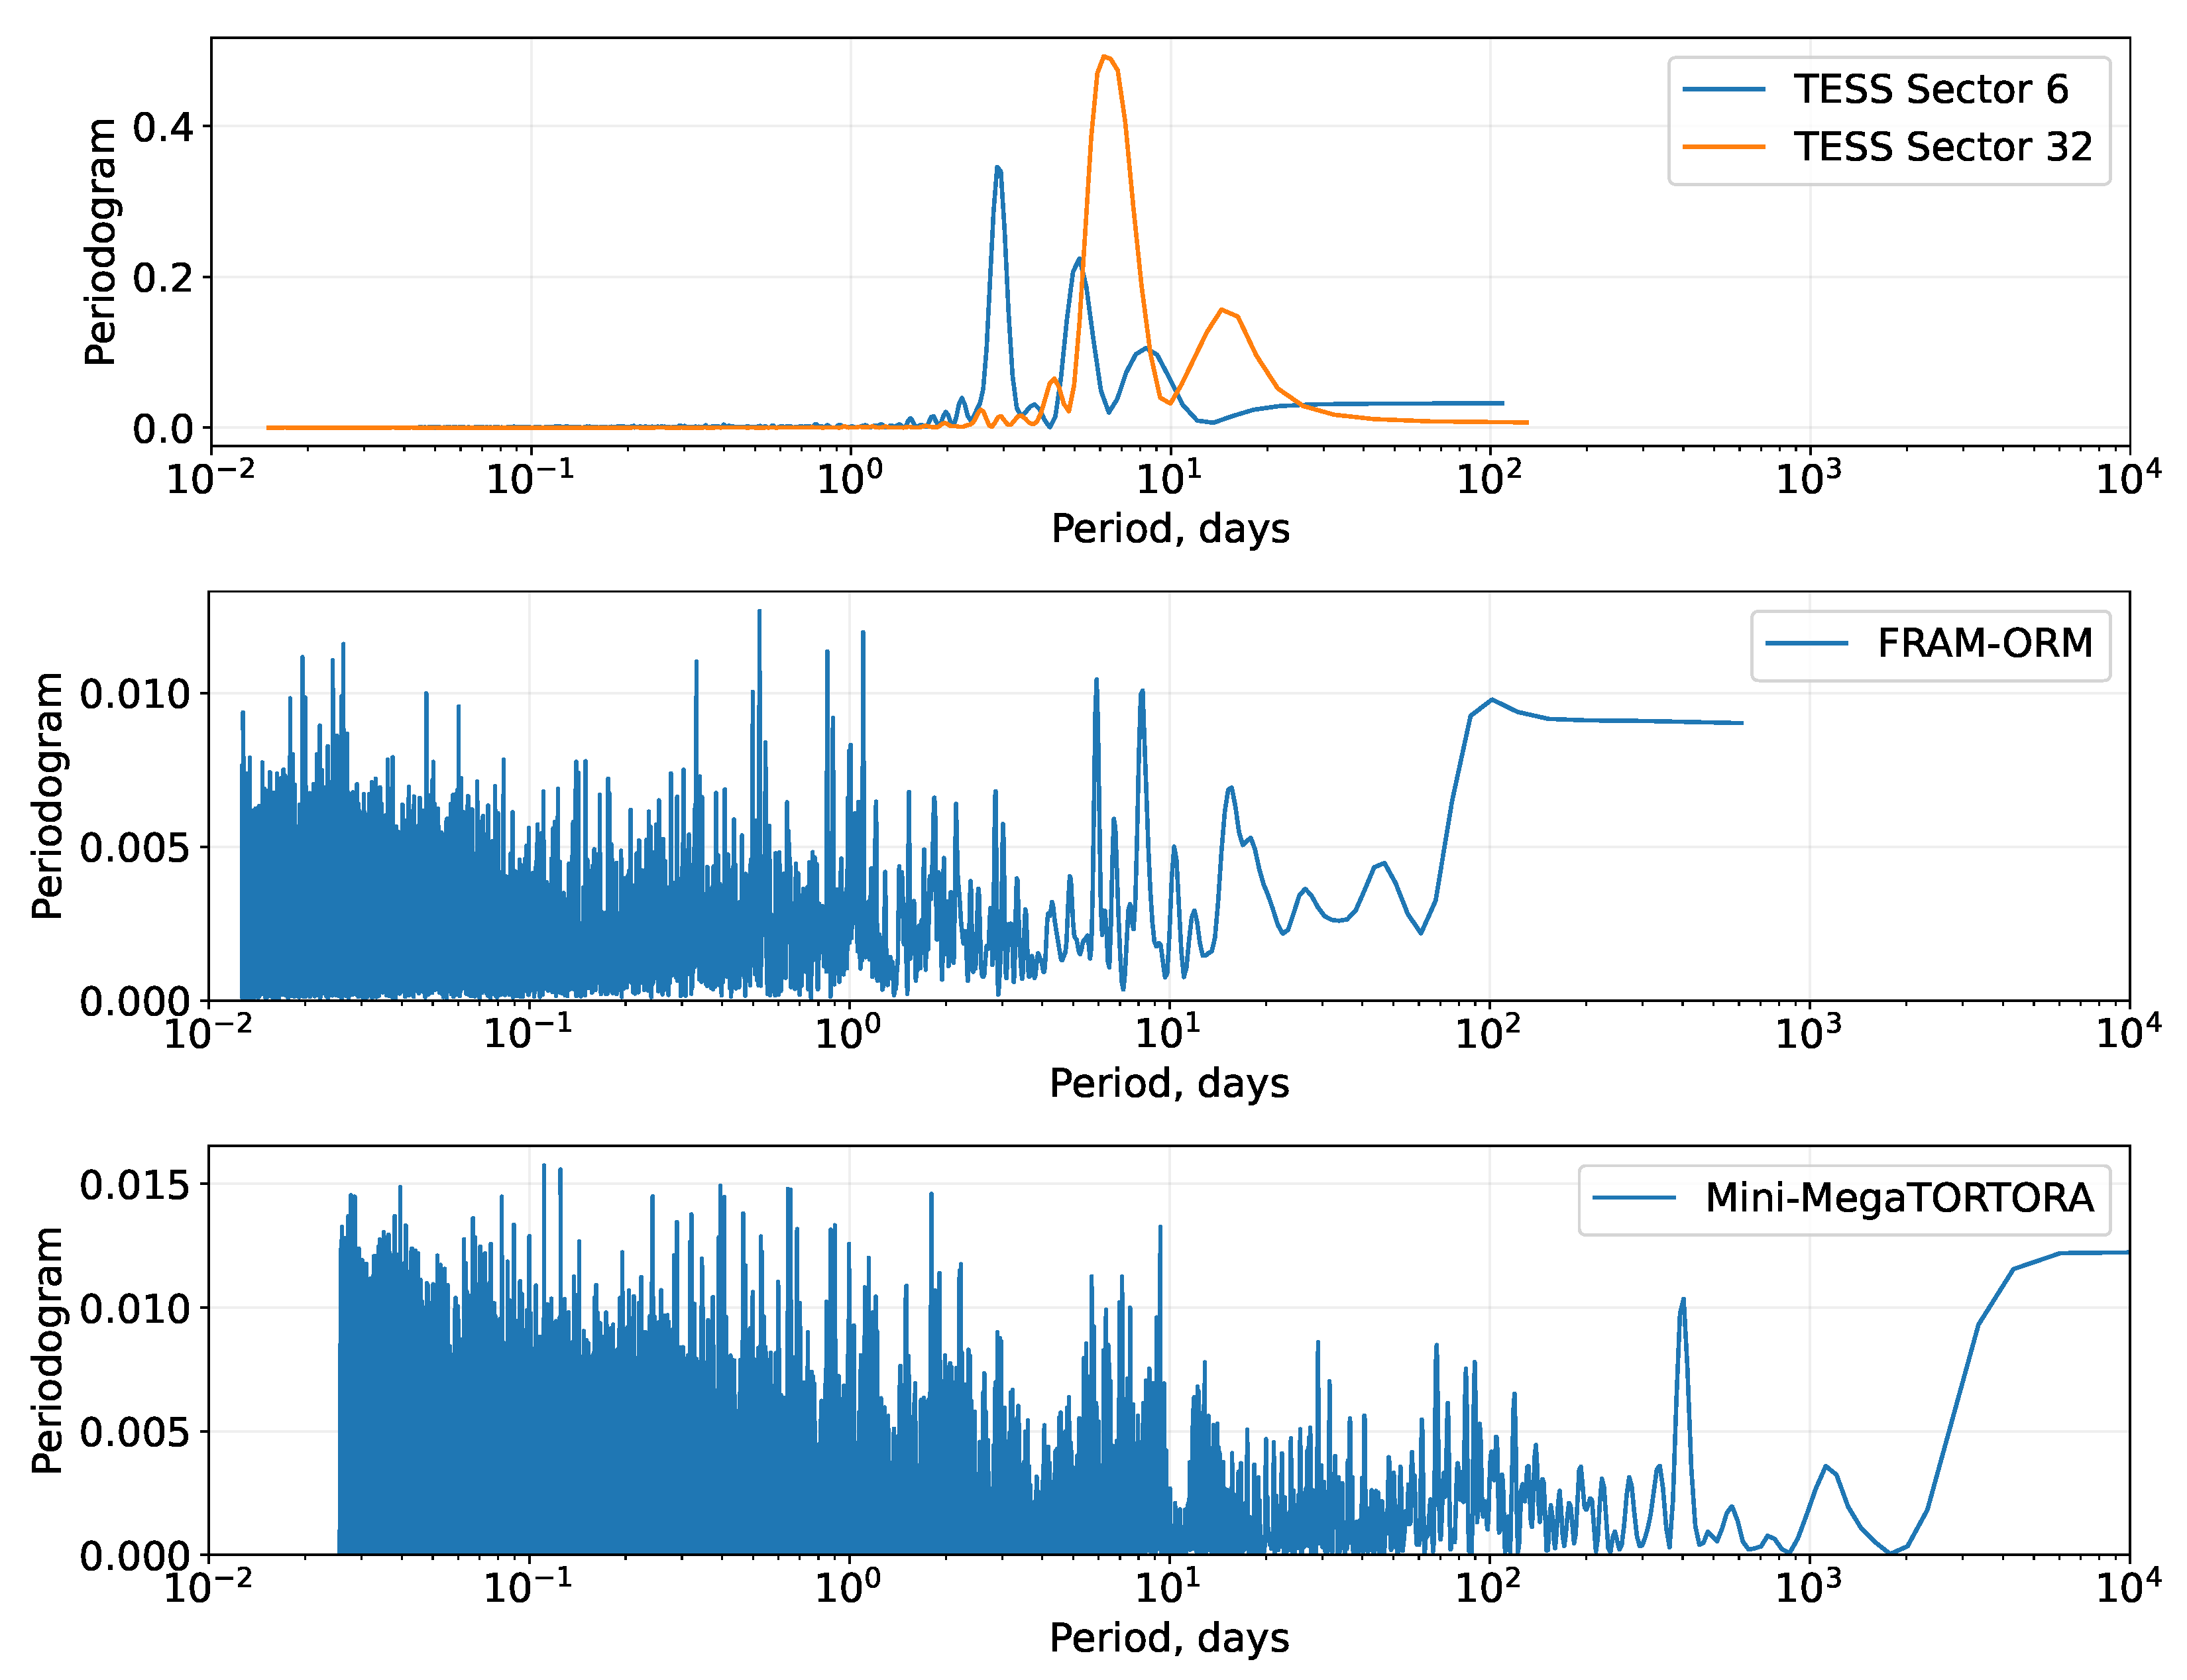
The light curves from both TESS sectors display prominent oscillating patterns, but with sufficiently different amplitudes and characteristic time scales. The upper panel of Figure 9 shows the Lomb–Scargle periodogram [56,57] of both light curves. There are no common peaks visible. Thus, we may attribute the oscillations to residual instrumental effects not fully corrected by the data processing, or probably to some complex pulsational pattern of the star. We also computed the periodograms of the FRAM-ORM and Mini-MegaTORTORA light curves. For the former, we used the approach of VanderPlas and Ivezić [58] to get the combined periodogram of the measurements in all three colors. The periodograms are also shown in Figure 9. They display no prominent peaks or structures common to all light curves, and so we may conclude that we see no signs of any photometric periodicity in HD 36030.
4. Discussion
Our new spectroscopic data clearly display changes in the RV of HD 36030 across different epochs of observations. It directly testifies to the binarity of the star, which is thus an SB1 binary, as there are no spectral signatures of a second component in the spectrum. Although our data are too scarce to measure the orbital period, from Figure 4 we may constrain it as follows. The fastest change we see it is about 10 km s between two consecutive nights, with a total spread of velocities of about 38 km s. Thus, the period should not exceed about 8 days, which gives the mass function of a second component . Thus, it favors a low-mass companion on an orbit with low to moderate inclination, which is consistent with the absence of eclipses in the light curve. The semi-major axis of the orbit is cm assuming the total system mass of and the period shorter than 8 days. Further spectral monitoring is necessary in order to better constrain the parameters of the second component of the system, as well as orbital parameters.
On the other hand, we do not see any signs of periodic variations in the light curves (see Figure 7 and Figure 9) on these time scales, apart from quasi-periodic structures in the TESS data, with both periods and amplitudes varying both within the spans of individual observations and between different epochs, which we cannot attribute to the binary period. Their frequencies are also lower than the ones of rotational modulation seen in B-type stars in both Kepler [59] and TESS [60] data, so we assume that these oscillations are also not a signature of stellar rotation that might appear due to, e.g., starspots on the surface of HD 36030, but most probably they are a signature of uncorrected systematic effects in the data (see, e.g., Hattori et al. [61]).
We detected two flares on HD 36030 in the TESS data from two sectors, i.e., one in each 27-day series of continuous observations separated by nearly two years, meaning that these flares are not some extreme events but occur regularly. It is consistent with the detection of repeating flares on hot stars by Yang et al. [29]. The energies of these flares5, and erg, place them among the most energetic ones detected by Balona [18] and Yang et al. [29] (see Figure 10). This fact makes it highly improbable that the flares originate from the low-mass companion6 of HD 36030, which may only be a late-type, low-luminosity star due to the absence of any spectroscopic signature from it and a very low value of its mass function, which implies its low mass for reasonable range of values of the system’ inclination angle. On the other hand, our modeling of HD 36030 suggests that it lacks the convective layers that may produce magnetic fields. There are no conclusive signs of surface magnetic fields—no strict periodicity in the light curve disfavors the presence of starspots; however, quasi-periodic patterns seen in Figure 7, if they are not instrumental in nature, may in principle be the manifestation of short-lived spots on HD 36030 surface—but in the absence of convection, the formation of such spots may be unrealistic. The star also lacks any signs of peculiarities in its spectra, such as additional emission components in hydrogen lines that might be a sign of a circumstellar outflow or disk that might help generate the magnetic fields due to star–disk interaction. However, the presence of a low-mass companion star, most probably possessing significant magnetic fields, on a close orbit around HD 36030 may be the source of magnetic fields spanning across the system and both storing the energy enough for powering the flares and maybe inducing the starspots on HD 36030 surface.
Thus, we may conclude that the only mechanism that may produce the magnetic fields necessary for powering the energetic flares may be the interaction between components inside the binary system.
5. Conclusions
We performed a dedicated study of HD 36030, which was the hottest flare star detected by Maryeva et al. [11]. We found one more flare in the TESS data that confirmed the repeating nature of the flaring. We initiated a spectroscopic monitoring of the star in order to better understand the physics behind these flares. The spectra did not display any peculiarities and suggest that HD 36030 is a normal main-sequence B9 V star. On the other hand, we clearly detected radial velocity changes between different epochs of observations, thus confirming the binarity of the star. We did not detect any coherent variability in the light curve of the star, so we could not estimate the period of the orbital motion of the star or confirm the presence of the spots on its surface. The latter may be a sign of the absence of strong surface magnetic fields on HD 36030. Thus, the question of the origin of magnetic field powering the strong flares from HD 36030 is still open, and we favor the magnetic interaction with a second low-mass component in a binary system as their cause.
Author Contributions
O.M. proposed the concept of the study, performed observations on the Perek 2-m telescope, reduced the spectroscopic material, and performed spectral analysis; P.N. performed numerical modeling of the stellar atmosphere using Tlusty code; S.K. performed photometric monitoring, reduction, and analysis of photometric data, and estimated the properties of flares. All authors participated in the discussion of the results and preparation of the manuscript. All authors have read and agreed to the published version of the manuscript.
Funding
This research received funding from the European Union’s Framework Programme for Research and Innovation Horizon 2020 (2014–2020) under the Marie Skłodowska-Curie Grant Agreement No. 823734 (POEMS project). The Astronomical Institute in Ondřejov is supported by the project RVO:67985815. P.N. acknowledges support from the Grant Agency of the Czech Republic (GAČR 22-34467S) and from the Polish National Science Centre under projects No. UMO-2017/26/E/ST9/00703 and UMO-2017/25/B/ST9/02218. S.K. acknowledges support from the European Structural and Investment Fund and the Czech Ministry of Education, Youth and Sports (Project CoGraDS—CZ.02.1.01/0.0/0.0/15_003/0000437). This research has used the services of www.Astroserver.org. The operation of the robotic telescope FRAM-ORM is supported by the grant of the Ministry of Education of the Czech Republic LM2018102. The operation of the Mini-MegaTORTORA was supported under the Ministry of Science and Higher Education of the Russian Federation grant 075-15-2022-262 (13.MNPMU.21.0003). This paper includes data collected by the TESS mission, which are publicly available from the MikulskiArchive for Space Telescopes (MAST). Funding for the TESS mission is provided by NASA’s Science Mission directorate. This research was made by using of the SIMBAD database and the VizieR catalogue access tool, both operated at CDS, Strasbourg, France.
Institutional Review Board Statement
Not applicable.
Informed Consent Statement
Not applicable.
Data Availability Statement
The data presented in this study are available on request from the corresponding author, or available in publicly accessible data archives as specified in the manuscript text.
Acknowledgments
The authors acknowledge the help from Suryani Guha with observations with Coudé spectrograph at the Perek 2 m telescope.
Conflicts of Interest
The authors declare no conflict of interest.
Abbreviations
The following abbreviations are used in this manuscript:
| IDL | Interactive data language |
| LBV | Luminous blue variable |
| LTE | Local thermodynamic equilibrium |
| OES | Ondřejov echelle epectrograph |
| RV | Radial velocity |
| SB1 | single-lined spectroscopic binary |
| TESS | Transiting Exoplanet Survey Satellite |
| 1 | RA ; Dec . |
| 2 | Up to date table of colors and effective temperatures of stars from Pecaut and Mamajek [41] is available at https://www.pas.rochester.edu/~emamajek/EEM_dwarf_UBVIJHK_colors_Teff.txt accessed on 10 March 2023. |
| 3 | https://archive.stsci.edu accessed on 10 March 2023. |
| 4 | http://survey.favor2.info/ accessed on 10 March 2023. |
| 5 | We must note that our estimation of flare energies is a conservative one, as it assumes their temperatures to be 9000 K, which may not be a good approximation, as the effective temperature of the star itself is above that. Moreover, there are signatures that the temperatures of superflares even on cool stars may be significantly larger than that [62]. Thus, the actual energies of the flares we detected may also be significantly larger. |
| 6 | The same argument also holds against any other similar source in the field of HD 36030 that may occasionally pollute the large aperture of TESS. |
References
- McNamara, B.J.; Jackiewicz, J.; McKeever, J. The Classification of Kepler B-star Variables. Astron. J. 2012, 143, 101. [Google Scholar] [CrossRef] [Green Version]
- Waelkens, C. Slowly pulsating B stars. Astron. Astrophys. 1991, 246, 453. [Google Scholar] [CrossRef] [Green Version]
- Waelkens, C. Slowly Pulsating B Stars. In International Astronomical Union Colloquium; Cambridge University Press: Cambridge, UK, 1993; p. 180. [Google Scholar]
- Stankov, A.; Handler, G. Catalog of Galactic β Cephei Stars. Astrophys. J. Suppl. Ser. 2005, 158, 193–216. [Google Scholar] [CrossRef]
- Saio, H.; Georgy, C.; Meynet, G. Evolution of blue supergiants and α Cygni variables: Puzzling CNO surface abundances. Mon. Not. R. Astron. Soc. 2013, 433, 1246–1257. [Google Scholar] [CrossRef] [Green Version]
- Rivinius, T.; Carciofi, A.C.; Martayan, C. Classical Be stars. Rapidly rotating B stars with viscous Keplerian decretion disks. Astron. Astrophys. Rev. 2013, 21, 69. [Google Scholar] [CrossRef] [Green Version]
- Krtičková, I.; Krtička, J. An ultraviolet study of B[e] stars: Evidence for pulsations, luminous blue variable type variations and processes in envelopes. Mon. Not. R. Astron. Soc. 2018, 477, 236–253. [Google Scholar] [CrossRef] [Green Version]
- Kraus, M. A Census of B[e] Supergiants. Galaxies 2019, 7, 83. [Google Scholar] [CrossRef] [Green Version]
- Lobel, A.; Groh, J.H.; Martayan, C.; Frémat, Y.; Torres Dozinel, K.; Raskin, G.; Van Winckel, H.; Prins, S.; Pessemier, W.; Waelkens, C.; et al. Modelling the asymmetric wind of the luminous blue variable binary MWC 314. Astron. Astrophys. 2013, 559, A16. [Google Scholar] [CrossRef]
- Clark, J.S.; Najarro, F.; Negueruela, I.; Ritchie, B.W.; Urbaneja, M.A.; Howarth, I.D. On the nature of the galactic early-B hypergiants. Astron. Astrophys. 2012, 541, A145. [Google Scholar] [CrossRef] [Green Version]
- Maryeva, O.; Bicz, K.; Xia, C.; Baratella, M.; Čechvala, P.; Vida, K. Flare stars in nearby Galactic open clusters based on TESS data. Contrib. Astron. Obs. Skaln. Pleso 2021, 51, 78–97. [Google Scholar] [CrossRef]
- Priest, E.; Forbes, T. Magnetic Reconnection; Cambridge University Press: Cambridge, UK, 2000; p. 612. [Google Scholar]
- Benz, A.O.; Güdel, M. Physical Processes in Magnetically Driven Flares on the Sun, Stars, and Young Stellar Objects. Annu. Rev. Astron. Astrophys. 2010, 48, 241–287. [Google Scholar] [CrossRef]
- Gershberg, R.E. Time scales and energy of flares on red dwarf stars (a review). Mem. Della Soc. Astron. Ital. 1989, 60, 263–287. [Google Scholar]
- Günther, M.N.; Zhan, Z.; Seager, S.; Rimmer, P.B.; Ranjan, S.; Stassun, K.G.; Oelkers, R.J.; Daylan, T.; Newton, E.; Kristiansen, M.H.; et al. Stellar Flares from the First TESS Data Release: Exploring a New Sample of M Dwarfs. Astron. J. 2020, 159, 60. [Google Scholar] [CrossRef] [Green Version]
- Schaefer, B.E. Flashes from Normal Stars. Astrophys. J. 1989, 337, 927. [Google Scholar] [CrossRef]
- Balona, L.A. Kepler observations of flaring in A-F type stars. Mon. Not. R. Astron. Soc. 2012, 423, 3420–3429. [Google Scholar] [CrossRef] [Green Version]
- Balona, L.A. Spots and flares in hot main sequence stars observed by Kepler, K2 and TESS. Front. Astron. Space Sci. 2021, 8, 32. [Google Scholar] [CrossRef]
- Schmitt, J.H.M.M.; Guedel, M.; Predehl, P. Spatially resolved X-ray and radio observations of Castor A+B+C. Astron. Astrophys. 1994, 287, 843–851. [Google Scholar]
- Yanagida, T.; Ezoe, Y.; Kawaharada, M.; Kokubun, M.; Makishima, K. Large X-ray Flares from B-Type Stars, HD261902 and HD47777, in NGC2264 Observed with CHANDRA. In Proceedings of the Active OB-Stars: Laboratories for Stellar and Circumstellar Physics, ASP Conference Series, Sapporo, Japan, 29 August–2 September 2005; Okazaki, A.T., Owocki, S.P., Stefl, S., Eds.; Astronomical Society of the Pacific: San Francisco, CA, USA, 2007; Volume 361, p. 533. [Google Scholar]
- Rosner, R.; Vaiana, G.S. Stellar Coronae from Einstein: Observations and Theory. In X-ray Astronomy; Giacconi, R., Setti, G., Eds.; NATO Advanced Study Institutes Series; Springer: Dordrecht, The Netherlands, 1980; Volume 60, p. 129. [Google Scholar] [CrossRef]
- Pedersen, M.G.; Antoci, V.; Korhonen, H.; White, T.R.; Jessen-Hansen, J.; Lehtinen, J.; Nikbakhsh, S.; Viuho, J. Do A-type stars flare? Mon. Not. R. Astron. Soc. 2017, 466, 3060–3076. [Google Scholar] [CrossRef] [Green Version]
- Švanda, M.; Karlický, M. Flares on A-type Stars: Evidence for Heating of Solar Corona by Nanoflares? Astrophys. J. 2016, 831, 9. [Google Scholar] [CrossRef] [Green Version]
- Bai, J.Y.; Esamdin, A. Flare Properties of A-type Stars in Kepler Data. Astrophys. J. 2020, 905, 110. [Google Scholar] [CrossRef]
- Van Doorsselaere, T.; Shariati, H.; Debosscher, J. Stellar Flares Observed in Long-cadence Data from the Kepler Mission. Astrophys. J. Suppl. Ser. 2017, 232, 26. [Google Scholar] [CrossRef] [Green Version]
- Houk, N.; Swift, C. Michigan catalogue of two-dimensional spectral types for the HD Stars, Vol. 5. Mich. Spectr. Surv. 1999, 5. [Google Scholar]
- Kharchenko, N.V.; Piskunov, A.E.; Röser, S.; Schilbach, E.; Scholz, R.D. 109 new Galactic open clusters. Astron. Astrophys. 2005, 440, 403–408. [Google Scholar] [CrossRef] [Green Version]
- Cantat-Gaudin, T.; Jordi, C.; Vallenari, A.; Bragaglia, A.; Balaguer-Núñez, L.; Soubiran, C.; Bossini, D.; Moitinho, A.; Castro-Ginard, A.; Krone-Martins, A.; et al. A Gaia DR2 view of the open cluster population in the Milky Way. Astron. Astrophys. 2018, 618, A93. [Google Scholar] [CrossRef] [Green Version]
- Yang, Z.; Zhang, L.; Meng, G.; Han, X.L.; Misra, P.; Yang, J.; Pi, Q. Properties of flare events based on light curves from the TESS survey. Astron. Astrophys. 2023, 669, A15. [Google Scholar] [CrossRef]
- Evans, P.A.; Page, K.L.; Osborne, J.P.; Beardmore, A.P.; Willingale, R.; Burrows, D.N.; Kennea, J.A.; Perri, M.; Capalbi, M.; Tagliaferri, G.; et al. 2SXPS: An Improved and Expanded Swift X-Ray Telescope Point-source Catalog. Astrophys. J. Suppl. Ser. 2020, 247, 54. [Google Scholar] [CrossRef] [Green Version]
- Koubský, P.; Mayer, P.; Čáp, J.; Žďárský, F.; Zeman, J.; Pína, L.; Melich, Z. Ondřejov Echelle Spectrograph—OES. Publ. Astron. Inst. Czechoslov. Acad. Sci. 2004, 92, 37–43. [Google Scholar]
- Kabáth, P.; Skarka, M.; Sabotta, S.; Guenther, E.; Jones, D.; Klocová, T.; Šubjak, J.; Žák, J.; Špoková, M.; Blažek, M.; et al. Ondřejov Echelle Spectrograph, Ground Based Support Facility for Exoplanet Missions. Publ. Astron. Soc. Pac. 2020, 132, 035002. [Google Scholar] [CrossRef] [Green Version]
- Slechta, M.; Skoda, P. 2-meter telescope devices: Coudé slit spectrograph and HEROS. Publ. Astron. Inst. Czechoslov. Acad. Sci. 2002, 90, 1–4. [Google Scholar]
- Maryeva, O.V.; Karpov, S.V.; Kniazev, A.Y.; Gvaramadze, V.V. How long can luminous blue variables sleep? A long-term photometric variability and spectral study of the Galactic candidate luminous blue variable MN 112. Mon. Not. R. Astron. Soc. 2022, 513, 5752–5765. [Google Scholar] [CrossRef]
- Gray, R.O.; Corbally, C.J. Stellar Spectral Classification; Princeton University Press: Princeton, NJ, USA, 2009. [Google Scholar]
- Simón-Díaz, S.; Castro, N.; Garcia, M.; Herrero, A.; Markova, N. The IACOB spectroscopic database of Northern Galactic OB stars. Bull. De La Soc. R. Des Sci. De Liege 2011, 80, 514–518. [Google Scholar]
- Simón-Díaz, S.; Garcia, M.; Herrero, A.; Maíz Apellániz, J.; Negueruela, I. The IACOB Project: Synergies for the Gaia Era. arXiv 2011, arXiv:1109.2665. [Google Scholar]
- Simón-Díaz, S.; Negueruela, I.; Maíz Apellániz, J.; Castro, N.; Herrero, A.; Garcia, M.; Pérez-Prieto, J.A.; Caon, N.; Alacid, J.M.; Camacho, I.; et al. The IACOB spectroscopic database: Recent updates and first data release. arXiv 2015, arXiv:1504.04257. [Google Scholar]
- Prugniel, P.; Soubiran, C. A database of high and medium-resolution stellar spectra. Astron. Astrophys. 2001, 369, 1048–1057. [Google Scholar] [CrossRef]
- Høg, E.; Fabricius, C.; Makarov, V.V.; Urban, S.; Corbin, T.; Wycoff, G.; Bastian, U.; Schwekendiek, P.; Wicenec, A. The Tycho-2 catalogue of the 2.5 million brightest stars. Astron. Astrophys. 2000, 355, L27–L30. [Google Scholar]
- Pecaut, M.J.; Mamajek, E.E. Intrinsic Colors, Temperatures, and Bolometric Corrections of Pre-main-sequence Stars. Astrophys. J. Suppl. Ser. 2013, 208, 9. [Google Scholar] [CrossRef]
- Chen, Y.; Girardi, L.; Bressan, A.; Marigo, P.; Barbieri, M.; Kong, X. Improving PARSEC models for very low mass stars. Mon. Not. R. Astron. Soc. 2014, 444, 2525–2543. [Google Scholar] [CrossRef]
- Bossini, D.; Vallenari, A.; Bragaglia, A.; Cantat-Gaudin, T.; Sordo, R.; Balaguer-Núñez, L.; Jordi, C.; Moitinho, A.; Soubiran, C.; Casamiquela, L.; et al. Age determination for 269 Gaia DR2 open clusters. Astron. Astrophys. 2019, 623, A108. [Google Scholar] [CrossRef] [Green Version]
- Hubeny, I.; Lanz, T. Non-LTE Line-blanketed Model Atmospheres of Hot Stars. I. Hybrid Complete Linearization/Accelerated Lambda Iteration Method. Astrophys. J. 1995, 439, 875. [Google Scholar] [CrossRef]
- Lanz, T.; Hubeny, I. A Grid of NLTE Line-blanketed Model Atmospheres of Early B-Type Stars. Astrophys. J. Suppl. Ser. 2007, 169, 83–104. [Google Scholar] [CrossRef] [Green Version]
- Hubeny, I.; Lanz, T. TLUSTY User’s Guide III: Operational Manual. arXiv 2017. [Google Scholar] [CrossRef]
- Németh, P.; Kawka, A.; Vennes, S. A selection of hot subluminous stars in the GALEX survey—II. Subdwarf atmospheric parameters. Mon. Not. R. Astron. Soc. 2012, 427, 2180–2211. [Google Scholar] [CrossRef] [Green Version]
- Bohlin, R.C.; Mészáros, S.; Fleming, S.W.; Gordon, K.D.; Koekemoer, A.M.; Kovács, J. A New Stellar Atmosphere Grid and Comparisons with HST/STIS CALSPEC Flux Distributions. Astron. J. 2017, 153, 234. [Google Scholar] [CrossRef] [Green Version]
- Ricker, G.R.; Winn, J.N.; Vanderspek, R.; Latham, D.W.; Bakos, G.Á.; Bean, J.L.; Berta-Thompson, Z.K.; Brown, T.M.; Buchhave, L.; Butler, N.R.; et al. Transiting Exoplanet Survey Satellite (TESS). J. Astron. Telesc. Instru. Syst. 2015, 1, 014003. [Google Scholar] [CrossRef] [Green Version]
- Jenkins, J.M.; Twicken, J.D.; McCauliff, S.; Campbell, J.; Sanderfer, D.; Lung, D.; Mansouri-Samani, M.; Girouard, F.; Tenenbaum, P.; Klaus, T.; et al. The TESS science processing operations center. In Proceedings of the Software and Cyberinfrastructure for Astronomy IV, Edinburgh, UK, 26–30 June 2016; Chiozzi, G., Guzman, J.C., Eds.; Society of Photo-Optical Instrumentation Engineers (SPIE): Edinburgh, UK, 2016; Volume 9913, p. 99133E. [Google Scholar] [CrossRef] [Green Version]
- Shibayama, T.; Maehara, H.; Notsu, S.; Notsu, Y.; Nagao, T.; Honda, S.; Ishii, T.T.; Nogami, D.; Shibata, K. Superflares on Solar-type Stars Observed with Kepler. I. Statistical Properties of Superflares. Astrophys. J. Suppl. Ser. 2013, 209, 5. [Google Scholar] [CrossRef] [Green Version]
- Karpov, S. STDPipe: Simple Transient Detection Pipeline. Astrophysics Source Code Library, Record ascl:2112.006. 2021. Available online: https://ascl.net/2112.006 (accessed on 10 March 2023).
- Gaia Collaboration; Montegriffo, P.; Bellazzini, M.; De Angeli, F.; Andrae, R.; Barstow, M.A.; Bossini, D.; Bragaglia, A.; Burgess, P.W.; Cacciari, C.; et al. Gaia Data Release 3: The Galaxy in your preferred colours. Synthetic photometry from Gaia low-resolution spectra. arXiv 2022. [CrossRef]
- Beskin, G.M.; Karpov, S.V.; Biryukov, A.V.; Bondar, S.F.; Ivanov, E.A.; Katkova, E.V.; Orekhova, N.V.; Perkov, A.V.; Sasyuk, V.V. Wide-field optical monitoring with Mini-MegaTORTORA (MMT-9) multichannel high temporal resolution telescope. Astrophys. Bull. 2017, 72, 81–92. [Google Scholar] [CrossRef]
- Karpov, S.; Beskin, G.; Biryukov, A.; Bondar, S.; Ivanov, E.; Katkova, E.; Orekhova, N.; Perkov, A.; Sasyuk, V. Photometric calibration of a wide-field sky survey data from Mini-MegaTORTORA. Astron. Nachrichten 2018, 339, 375–381. [Google Scholar] [CrossRef]
- Lomb, N.R. Least-Squares Frequency Analysis of Unequally Spaced Data. Astrophys. Space Sci. 1976, 39, 447–462. [Google Scholar] [CrossRef]
- Scargle, J.D. Studies in astronomical time series analysis. II. Statistical aspects of spectral analysis of unevenly spaced data. Astrophys. J. 1982, 263, 835–853. [Google Scholar] [CrossRef]
- VanderPlas, J.T.; Ivezić, Ž. Periodograms for Multiband Astronomical Time Series. Astrophys. J. 2015, 812, 18. [Google Scholar] [CrossRef]
- Balona, L.A. Rotational modulation in B stars observed by the Kepler K2 mission. Mon. Not. R. Astron. Soc. 2016, 457, 3724–3731. [Google Scholar] [CrossRef] [Green Version]
- Balona, L.A.; Handler, G.; Chowdhury, S.; Ozuyar, D.; Engelbrecht, C.A.; Mirouh, G.M.; Wade, G.A.; David-Uraz, A.; Cantiello, M. Rotational modulation in TESS B stars. Mon. Not. R. Astron. Soc. 2019, 485, 3457–3469. [Google Scholar] [CrossRef]
- Hattori, S.; Foreman-Mackey, D.; Hogg, D.W.; Montet, B.T.; Angus, R.; Pritchard, T.A.; Curtis, J.L.; Schölkopf, B. The unpopular Package: A Data-driven Approach to Detrending TESS Full-frame Image Light Curves. Astron. J. 2022, 163, 284. [Google Scholar] [CrossRef]
- Howard, W.S.; Corbett, H.; Law, N.M.; Ratzloff, J.K.; Galliher, N.; Glazier, A.L.; Gonzalez, R.; Vasquez Soto, A.; Fors, O.; del Ser, D.; et al. EvryFlare. III. Temperature Evolution and Habitability Impacts of Dozens of Superflares Observed Simultaneously by Evryscope and TESS. Astrophys. J. 2020, 902, 115. [Google Scholar] [CrossRef]
- Gaia Collaboration; Brown, A.G.A.; Vallenari, A.; Prusti, T.; de Bruijne, J.H.J.; Babusiaux, C.; Bailer-Jones, C.A.L.; Biermann, M.; Evans, D.W.; Eyer, L.; et al. Gaia Data Release 2. Summary of the contents and survey properties. Astron. Astrophys. 2018, 616, A1. [Google Scholar] [CrossRef] [Green Version]
Figure 1.
Comparison of broad wings hydrogen lines and narrow of Mg II observed in the spectrum of HD 36030.
Figure 1.
Comparison of broad wings hydrogen lines and narrow of Mg II observed in the spectrum of HD 36030.

Figure 2.
Comparison of HD 36030 spectrum with the ones of B9 V and A0 V stars. Spectra of HD 18538 and HD 19065 are taken from IACOB database [36,37,38] (spectral resolution is R = 85,000), whereas the spectrum of HD 195198 is from [39] (R = 42,000). Unnamed lines correspond to Fe II.

Figure 3.
Hertzsprung–Russell diagram for the ASCC 21 cluster based on Gaia photometric data and compared with PARSEC isochrones [42] for the solar metallicity Z = 0.014. Age of the cluster (10.8 Myr) is taken from Bossini et al. [43]. Red circle shows the position of HD 36030.

Figure 4.
Radial velocity curve for HD 36030. Red dots display average values for radial velocity for different lines listed in Table 2 for a given night. Error bars represent the spread of individual line velocities. For comparison, black dots show the average velocity of the NaI interstellar doublet.

Figure 5.
Normalized spectrum (grey line) of HD 36030 taken on 29 October 2021 with OES spectrograph compared with the best-fitting Tlusty model (black line). The absolute values of the residuals between observed and synthetic spectra are shown in red.
Figure 5.
Normalized spectrum (grey line) of HD 36030 taken on 29 October 2021 with OES spectrograph compared with the best-fitting Tlusty model (black line). The absolute values of the residuals between observed and synthetic spectra are shown in red.

Figure 6.
Selected intervals from Figure 5.
Figure 6.
Selected intervals from Figure 5.

Figure 7.
TESS light curves (blue lines) of HD 36030 for two sectors when the object was observed. Visually selected flares in both sectors are highlighted in red and also shown in the separate panels on the right. The total energies of the flares as well as their durations are also shown. Orange lines represent the smooth interpolation of a quiescent light curve behaviour during the flare, used for removing background contribution from its energy.

Figure 8.
Light curves of HD 36030 from FRAM-ORM (upper panel) and Mini-MegaTORTORA (lower panel). FRAM-ORM observed the star in three Johnson–Cousins photometric filters, whereas Mini-MegaTORTORA data are in white light and re-calibrated to Johnson V bandpass. Both light curves lack any signs of systematic variability or statistically significant flares.

Figure 9.
Lomb–Scargle periodograms of HD 36030 light curves from TESS, FRAM-ORM, and Mini-MegaTORTORA. For TESS, the data for both sectors are shown in the upper panel. The peaks there supposedly correspond to uncorrected instrumental effects in the light curves. The middle panel shows the multiband periodogram [58] for the FRAM-ORM light curve, and the lower panel shows the periodogram of Mini-MegaTORTORA data. There are no high-significance peaks visible in both of the latter panels.

Figure 10.
Energies of the flares of HD 36030 (red circles) in comparison with the ones detected by Yang et al. [29], as a function of the effective temperatures of the stars. The temperatures are originating from Gaia DR2 [63] and are underestimated for the hottest objects. The colors of the dots represent the density of points.


Table 1.
Log of HD 36030 observations at Perek 2 m telescope.
| Date | Exposure [s] | Sp. Range [ÅÅ] | Instrument |
|---|---|---|---|
| 19 Sep 2020 | 3600 | 6250–6740 | Coudé |
| 24 Oct 2021 | 5200 | 3750–9200 | OES |
| 29 Oct 2021 | 5200 | 3750–9200 | OES |
| 6 Jan 2022 | 5200 | 3750–9200 | OES |
| 2 Feb 2022 | 3750–9200 | OES | |
| 10 Mar 2022 | 3750–9200 | OES | |
| 11 Mar 2022 | 3750–9200 | OES | |
| 18 Mar 2022 | 5200 | 3750–9200 | OES |
Table 2.
Radial velocity measurements for different lines on different nights; Avg is average values for radial velocity. The colons after values mark the data with lower accuracy of position determination.
Table 2.
Radial velocity measurements for different lines on different nights; Avg is average values for radial velocity. The colons after values mark the data with lower accuracy of position determination.
| Time, JD-2450000 | ||||||||
|---|---|---|---|---|---|---|---|---|
| 9512.463 | 9517.464 | 9586.371 | 9613.234 | 9628.234 | 9649.242 | 9650.239 | 9657.250 | |
| SiII 4128.05 | 21.26 | 7.35 | 44.53 | 45.61 | 42.53 | 37.62 | 27.39 | 35.31 |
| SiII 4130.89 | 21.38 | 6.08 | 42.73 | 42.74 | 42.78 | 36.76 | 25.79 | 38.09 |
| FeII 4173.45 | 24.71 | 6.17 | 43.38 | 46.39 | 45.07 | 37.99 | 29.35 | —– |
| FeII 4233.17 | 19.55 | 5.53 | 43.25 | 45.08 | 43.40 | 36.20 | 27.51 | 30.84 |
| H 4340.46 | 20.90 | 4.89 | 41.99 | 42.87 | 43.36 | 38.13 | 27.30 | 22.44 |
| MgII 4481.13 | 27.91 | 12.49 | 50.22 | 50.94 | 49.62 | 42.80 | 33.23 | 38.11 |
| FeII 4508.29 | 20.93 | 5.05 | 44.73 | 44.03 | 42.33 | 35.62 | 26.79 | —– |
| FeII 4515.34 | 21.28 | 5.71 | 44.66 | 42.45 | 44.85 | 36.23 | 26.38 | 32.61 |
| FeII 4522.63 | 23.46 | 7.39 | 46.31 | 46.10 | 44.30 | 36.18 | 26.59 | —– |
| FeII 4549.47 | 24.81 | 8.55 | 47.36 | 47.38 | 46.01 | 39.46 | 29.39 | 36.36 |
| FeII 4555.89 | 22.38 | 5.94 | 43.32 | 45.34 | 43.85 | 37.01 | 26.06 | 31.53 |
| FeII 4583.83 | 22.67 | 6.07 | 43.86 | 44.88 | 43.46 | 36.80 | 27.50 | 33.81 |
| CrII 4588.20 | 20.39 | 6.64 | 45.12 | 44.18 | 44.73 | 36.67 | 26.42 | 30.59 |
| FeII 4629.33 | 20.62 | 5.47 | 44.98 | 43.82 | 42.56 | 36.69 | 26.55 | 29.68 |
| H 4861.32 | 21.70 | 5.63 | 44.51 | 45.16 | 44.30 | 36.38 | 27.23 | 25.98 |
| FeII 4923.92 | 22.13 | 5.95 | 45.11 | 45.21 | 43.15 | 36.97 | 27.57 | 30.14 |
| FeII 5018.44 | 22.00 | 6.52 | 44.92 | 44.76 | 44.00 | 36.79 | 27.83 | 31.05 |
| SiII 5041.03 | 20.91 | 6.32 | 42.70 | 44.29 | 42.67 | 36.25 | 26.98 | 30.38 |
| SiII 5055.98 | 26.04 | 10.63 | 47.98 | 50.36 | 47.87 | 41.70: | 32.30 | 35.37 |
| FeII 5100.73 | 21.90 | 6.55 | 44.71 | 45.12 | 44.78 | 36.76 | 27.72 | 33.09 |
| FeII 5169.03 | 21.08 | 5.51 | 43.81 | 44.09 | 43.33 | 37.20 | 26.70 | 30.81 |
| MgI 5172.68 | 21.90 | 7.20 | 45.38 | 45.56 | 44.21 | 36.98 | 28.01 | 31.29 |
| MgI 5183.60 | 22.55 | 5.94 | 44.42 | 45.90 | 44.59 | 36.94 | 28.05 | 31.03 |
| FeII 5197.57 | 22.46 | 5.67 | 43.52 | 43.66 | 42.24 | 36.93 | 26.73 | 30.18 |
| FeII 5275.99 | 23.09 | 6.38 | 42.87 | 46.52: | 42.09 | 34.90 | 26.02 | 32.96 |
| FeII 5316.62 | 22.64 | 7.90 | 45.74 | 45.18 | 44.90 | 37.40 | 28.14 | 33.12 |
| FeII 5362.87 | 21.55 | 5.46 | 43.33 | 45.05 | 43.59 | 36.20 | 27.05 | 30.11 |
| SiII 6347.09 | 20.44 | 5.18 | 42.55 | 42.56 | 42.20 | 35.66 | 25.80 | 29.80 |
| SiII 6371.36 | 21.61 | 6.10 | —– | 44.44 | 43.67 | 36.53 | 27.15 | 30.10 |
| H 6562.79 | 21.68 | 6.14 | 46.75 | 45.92 | 43.88 | 37.15 | 27.34 | 31.29 |
| MgII 7877.13 | —– | 0.89 | 39.54 | —– | 41.64 | 34.30 | 23.38 | 24.77 |
| MgII 7896.37 | —– | −2.87 | 43.00 | 44.15 | 41.05 | 35.66 | 24.90 | —— |
| OI 8446.35 | 28.33 | 12.08 | 49.48 | 48.55 | 49.32 | 40.71 | 32.85 | 34.61 |
| Avg | ||||||||
| NaI 5889.95 | 18.60 | 17.03 | 19.38 | 19.47 | 20.10 | 20.36 | 20.03 | 20.51 |
| NaI 5895.92 | 19.32 | 18.56 | 20.69 | 19.92 | 20.56 | 20.90 | 20.38 | 19.89 |
Table 3.
Surface parameters of HD 36030 from the analysis of the OES spectra.
| Parameter | Value | ||
|---|---|---|---|
| (K) | 11,900 ± 1100 | ||
| (cm s) | 4.69 ± 0.15 | ||
| v (km s) | 15.00 ± 0.94 | ||
| Abundance | by number | mass fraction | solar fraction |
| H (reference) | 1 | 9.16 × 10 | 0 |
| He | −1.75 ± 0.32 | 6.49 × 10 | −0.68 |
| C | <−2.3 | <4.60 × 10 | <−0.8 |
| N | <−1.9 | <1.36 × 10 | <−0.2 |
| O | −3.25 ± 0.02 | 8.11 × 10 | 0.06 |
| Ne | <−2 | <1.50 × 10 | <−0.03 |
| Na | −5.42 ± 73 | 7.89 × 10 | 0.34 |
| Mg | −4.39 ± 0.04 | 9.00 × 10 | 0.01 |
| Al | −5.89 ± 0.49 | 3.19 × 10 | −0.34 |
| Si | −4.21 ± 0.08 | 1.59 × 10 | 0.28 |
| Ca | <−5.48 | <7.3 × 10 | <−0.04 |
| Ti | −7.00 ± 0.11 | 4.38 × 10 | 0.05 |
| Cr | −6.11 ± 0.21 | 3.67 × 10 | 0.25 |
| Mn | −6.94 ± 0.88 | 5.73 × 10 | −0.37 |
| Fe | <−4.13 | <3.74 × 10 | <0.37 |
| Ni | <−5 | <5.34 × 10 | <0.78 |
Disclaimer/Publisher’s Note: The statements, opinions and data contained in all publications are solely those of the individual author(s) and contributor(s) and not of MDPI and/or the editor(s). MDPI and/or the editor(s) disclaim responsibility for any injury to people or property resulting from any ideas, methods, instructions or products referred to in the content. |
© 2023 by the authors. Licensee MDPI, Basel, Switzerland. This article is an open access article distributed under the terms and conditions of the Creative Commons Attribution (CC BY) license (https://creativecommons.org/licenses/by/4.0/).
Share and Cite
MDPI and ACS Style
Maryeva, O.; Németh, P.; Karpov, S. Revealing the Binarity of HD 36030—One of the Hottest Flare Stars. Galaxies 2023, 11, 55. https://doi.org/10.3390/galaxies11020055
AMA Style
Maryeva O, Németh P, Karpov S. Revealing the Binarity of HD 36030—One of the Hottest Flare Stars. Galaxies. 2023; 11(2):55. https://doi.org/10.3390/galaxies11020055
Chicago/Turabian StyleMaryeva, Olga, Péter Németh, and Sergey Karpov. 2023. "Revealing the Binarity of HD 36030—One of the Hottest Flare Stars" Galaxies 11, no. 2: 55. https://doi.org/10.3390/galaxies11020055
Note that from the first issue of 2016, this journal uses article numbers instead of page numbers. See further details here.