Article

Hydrodynamic Simulations of a Relativistic Jet Interacting with the Intracluster Medium: Application to Cygnus A

1
Center for Astrophysics|Harvard & Smithsonian, 60 Garden St., Cambridge, MA 02138, USA
2
International Centre for Radio Astronomy Research, University of Western Australia, 35 Stirling Hwy, Crawley, WA 6009, Australia
3
Institute of Astrophysics, National Taiwan University, Taipei 10617, Taiwan
4
Physics Division, National Center for Theoretical Sciences, Taipei 10617, Taiwan
5
School of Physics and Astronomy, University of Minnesota Twin Cities, Minneapolis, MN 55455, USA
*
Author to whom correspondence should be addressed.
Galaxies 2023, 11(2), 51; https://doi.org/10.3390/galaxies11020051
Submission received: 19 January 2023 / Revised: 6 March 2023 / Accepted: 9 March 2023 / Published: 23 March 2023
(This article belongs to the Special Issue New Perspectives on Radio Galaxy Dynamics)

Abstract

:
The Fanaroff–Riley Class II radio galaxy Cygnus A hosts jets that produce radio emission, X-ray cavities, cocoon shocks, and X-ray hotspots, where the jet interacts with the ICM. Surrounding one hotspot is a peculiar “hole” feature, which appears as a deficit in X-ray emission. We used relativistic hydrodynamic simulations of a collimated jet interacting with an inclined interface between lobe and cluster plasma to model the basic processes that may lead to such a feature. We found that the jet reflects off of the interface into a broad, turbulent flow back out into the lobe, which is dominated by gas stripped from the interface at first and from the intracluster medium itself at later times. We produced simple models of X-ray emission from the ICM, the hotspot, and the reflected jet to show that a hole of emission surrounding the hotspot as seen in Cygnus A may be produced by Doppler de-boosting of the emission from the reflected jet, as seen by an observer with a sight line nearly along the axis of the outgoing material.

1. Introduction

Due to its proximity and power, the Fanaroff–Riley Class II radio galaxy (FRII) [1], Cygnus A, has served as the archetype of powerful radio galaxies [2]. With its remarkable radio properties, Cygnus A is hosted by the central galaxy of a massive cluster, where the radio AGN has been pumping about 10 46 erg s 1 through jets into the intracluster medium (ICM) over the past 20 Myr [3,4]. Demonstrating the impact a radio galaxy can have on its environment, Cygnus A provides a prime example of radio mode AGN feedback [5,6,7]
Deep Chandra X-ray observations have been used to probe the impacts of Cygnus A on its surroundings, revealing a complex structure created by the radio outburst. This includes X-ray cavities, cocoon shocks, and X-ray hotspots, which are found in a number of other cluster central radio galaxies [6,8,9]. Cygnus A also has a unique “X-ray jet”, thought to be inverse-Compton radiation scattered by energetic particles that are relics of the jets accumulated over time [10]. These features are shown in the Chandra image of Cygnus A in Figure 1, left panel. Regions of more diffuse enhanced X-ray emission from its lobes are well correlated with enhancements in radio emission, supporting the case that relativistic electrons spread throughout the lobes also produce significant levels of more diffuse inverse-Compton X-ray emission [11,12,13].
Another novel feature revealed by the deep Chandra observations of Cygnus A is a roughly circular X-ray “hole”, 4 kpc in radius, in the region surrounding Hotspot E in the eastern lobe [13] (see Figure 1, right panel). To account for the X-ray deficit over the hole, the inverse-Compton emission seen in the rest of the lobe must be reduced or absent from a region elongated along our line of sight, with a depth exceeding its diameter by at least a factor of 1.7  [13]. Assuming that the hotspot is formed where the jet strikes the ICM [14], the implication is that, after striking the shocked ICM, jet plasma flows back into the lobe, displacing relativistic plasma from the hole region. The jet is likely to have encountered one or more strong shocks in the hotspot, causing a significant population of electrons to be accelerated to relativistic energies, as required to produce the observed synchrotron self-Compton X-ray emission from the hotspot [15]. However, as pointed out originally by [13], if the outflow from the hotspot is directed away from the Earth at sufficient speed, Doppler beaming can reduce the inverse-Compton X-ray emission directed towards the Earth enough to create the apparent hole. Such Doppler de-boosting would similarly produce a hole in the radio band, which is also observed [13].
This paper discusses simulations of the encounter between the jet and ICM at Hotspot E in Cygnus A, in an effort to test the Doppler de-boosting hypothesis for the presence of the hole suggested by [13]. A hydrodynamic code was employed to simulate an unmagnetized, relativistic jet flowing through a low-density lobe before it encounters the inclined interface between the lobe and the far denser ICM. Details of the simulations are described in Section 2, including the physical model of the fluid (Section 2.1), the numerical code (Section 2.2), and the setup of the flow model (Section 2.3). The analysis of the results is presented in Section 3, and we present and discuss our conclusions in Section 4.

2. Methods

2.1. Physics

The mass, momentum, and energy conservation laws of a special relativistic fluid are
ν ( ρ U ν ) = 0 ,
ν T μ ν = 0 ,
where the Einstein summation convention is employed over repeated indices here and throughout this work. The stress–energy tensor for an ideal relativistic fluid is
T μ ν = ρ h U μ U ν / c 2 + p η μ ν .
In these equations, ρ and p are the proper mass density and the pressure, U ν is the four-velocity, η μ ν is the metric tensor (signature , + , + , + ) for Minkowski spacetime, c is the speed of light, and h is the specific enthalpy, given by
h = c 2 + ϵ + p ρ
where ϵ is the specific thermal energy. Note that, although the GAMER code [16] that we used for our simulation runs carries out calculations in units where c = 1 , we included the factors of c here for completeness.
This set of equations is closed by an equation of state (EOS) h ( ρ , p ) ; the EOS that we employed in this work is the Taub–Mathews (TM) EOS [17,18,19], which is an approximation to the Synge model, the exact EOS for an ideal, non-degenerate gas composed of a single-particle species [20]. The TM EOS is given by
h TM c 2 = 2.5 k B T m c 2 + 2.25 k B T m c 2 2 + 1
where k B is the Boltzmann constant, T is the gas temperature, and m is the mass per particle in the fluid. The use of the TM EOS enables the relativistic and non-relativistic gas phases to be combined into a single, realistic simulation, which cannot be achieved with a standard polytropic EOS with a single value for the ratio of specific heats Γ . For the TM EOS, Γ 5 / 3 for a non-relativistic fluid and Γ 4 / 3 for a relativistic fluid, and the transition between the phases occurs near k B T m c 2 (see Figure 1 of [16]).

2.2. Code

To perform our simulation runs, we used GAMER [21], an adaptive mesh refinement (AMR) astrophysical hydrodynamic code, which has a module for special relativistic hydrodynamics (SRHD) [16]. Since we were operating in a regime where both relativistic and non-relativistic gases are present in the same simulation, there is the risk of catastrophic cancellation in a number of expressions when evolving the numerical versions of Equations (1)–(3). GAMER avoids these cancellations by evolving the equation for the reduced energy density separately and computing Lorentz factors using the four-velocity U ν , rather than the three-velocity v i . For more details about the SRHD solver in GAMER, we refer the reader to Section 2 of [16]. In our simulations, we used the Harten–Lax–van Leer with Contact (HLLC) solver [22] to solve the Riemann problem and employed the piecewise parabolic method (PPM) [23] for state estimation.

2.3. Simulation Setup

Our simulation setup consisted of a cubical domain 20 kpc on a side (with coordinates in the range [−10, 10] kpc), divided between two gas phases in pressure equilibrium, “ICM” (the thermal plasma) and “lobe” (the relativistic plasma surrounding the X-ray jet). The interface between the two phases is a plane extending from end to end along the z-axis. To test the specific hypothesis that the jet reflecting off of the shocked ICM surrounding the lobe produces the hole, we assumed that the interface is inclined with respect to the trajectory of the jet. A jet hitting the ICM at a right angle would slowly bore into it without reflection. This inclination is determined by an angle θ from the y-axis of the simulation box. For all of the simulations, the plane of the interface passes through the point ( x 0 , y 0 ) = ( 7 , 0 ) kpc. The interface between the ICM and lobe phases is not abrupt, but the density ρ ( x ) continuously transitions from one to the other using the functional form:
x = ( x x 0 ) cos θ ( y y 0 ) sin θ
ρ ( x ) = ρ ICM , 0 + ρ lobe , 0 e x / w 1 + e x / w
where x is the distance perpendicular to the interface, ρ ICM , 0 and ρ lobe , 0 are the densities of the ICM and lobe far away from the interface, respectively, and w is a parameter controlling the width of the interface in the direction perpendicular to the plane separating the two phases. The parameters for the interface for the “fiducial” setup are given in Table 1. The lobe phase is 10 6 -times less dense and 10 6 -times hotter than the ICM phase, such that its gas is a fully relativistic plasma with Γ = 4 / 3 , whereas the ICM is non-relativistic with Γ = 5 / 3 .
The jet enters the domain at the y boundary. Its plasma is 10-times more dense than that of the lobe and in pressure equilibrium with it. It enters the domain with a radius of r jet , with a velocity entirely in the + y -direction. The rest of the y boundary is set to a “diode” boundary condition, where the gradient of physical quantities is zero across the interface, but the fluid is only permitted to flow outward. The boundary conditions on the other sides of the domain, in the ± x , + y , and ± z , are “outflow”, where the gradient of physical quantities is zero across the interface. Figure 2 shows a rough schematic of the geometry of the interface and the jet.
We determined the velocity of the jet using the equation for the jet power P jet by computing the energy flux through an area d A i (via Equations (1)–(4)):
P jet = [ ( γ 1 ) ρ c 2 + γ ( ρ ϵ + p ) ] U i d A i
where γ = 1 / 1 β 2 is the Lorentz factor and β = v / c . We assumed P jet = 4.427 × 10 45 erg s 1 , based on the observations of [4]. Given the values of ρ jet , r jet , and p and assuming Γ = 4 / 3 inside the jet, we can derive a constant jet velocity of v 0.976 c or γ β 4.482 .
However, some observations of FR-II jets [24] suggest that the “spine” of the jet (central part) is moving faster than its “sheath” (outer parts). To achieve this, we simply assumed that the velocity profile with a cylindrical radius outward from the jet center is linear:
U y ( r ) = U s r r jet + U 0
Using Equations (8) and (9), we assumed U s = 4.482 c and found U 0 = 7.342 c such that the mass-weighted average U y γ β c = 4.482 c .
The simulations also evolved passive scalar fields ρ c for each of the four components, c: “ICM”, “lobe”, “interface”, and “jet”. The first three fields are defined in the following manner at the beginning of the simulation:
ρ ICM / ρ = ρ 0.4 ρ ICM , 0 0.4 ρ ICM , 0 if 0.4 ρ ICM , 0 < ρ < 0.8 ρ ICM , 0 0 if ρ 0.4 ρ ICM , 0 1 if ρ 0.8 ρ ICM , 0
ρ lobe / ρ = 2.5 ρ lobe , 0 ρ 1.25 ρ lobe , 0 if 1.25 ρ lobe , 0 < ρ < 2.5 ρ lobe , 0 0 if ρ 2.5 ρ lobe , 0 1 if ρ 1.25 ρ lobe , 0
ρ int = ρ ρ ICM ρ lobe
whereas the gas continuously injected within the jet has ρ = ρ jet = ρ jet , 0 at its entry point. These fields are advected along with the gas.
We refined the adaptive mesh on the gradients of the density ρ , pressure P, and Lorentz factor γ , which ensured that the ICM/lobe interface, the incident jet, and the reflected jet were all adequately resolved. The base grid had 64 cells on a side, and we employed 5 levels of refinement above the base grid level, yielding the smallest cell size of Δ x = 9.765 pc. We investigate the dependence of our conclusions on the effects of resolution in Appendix A.

3. Results

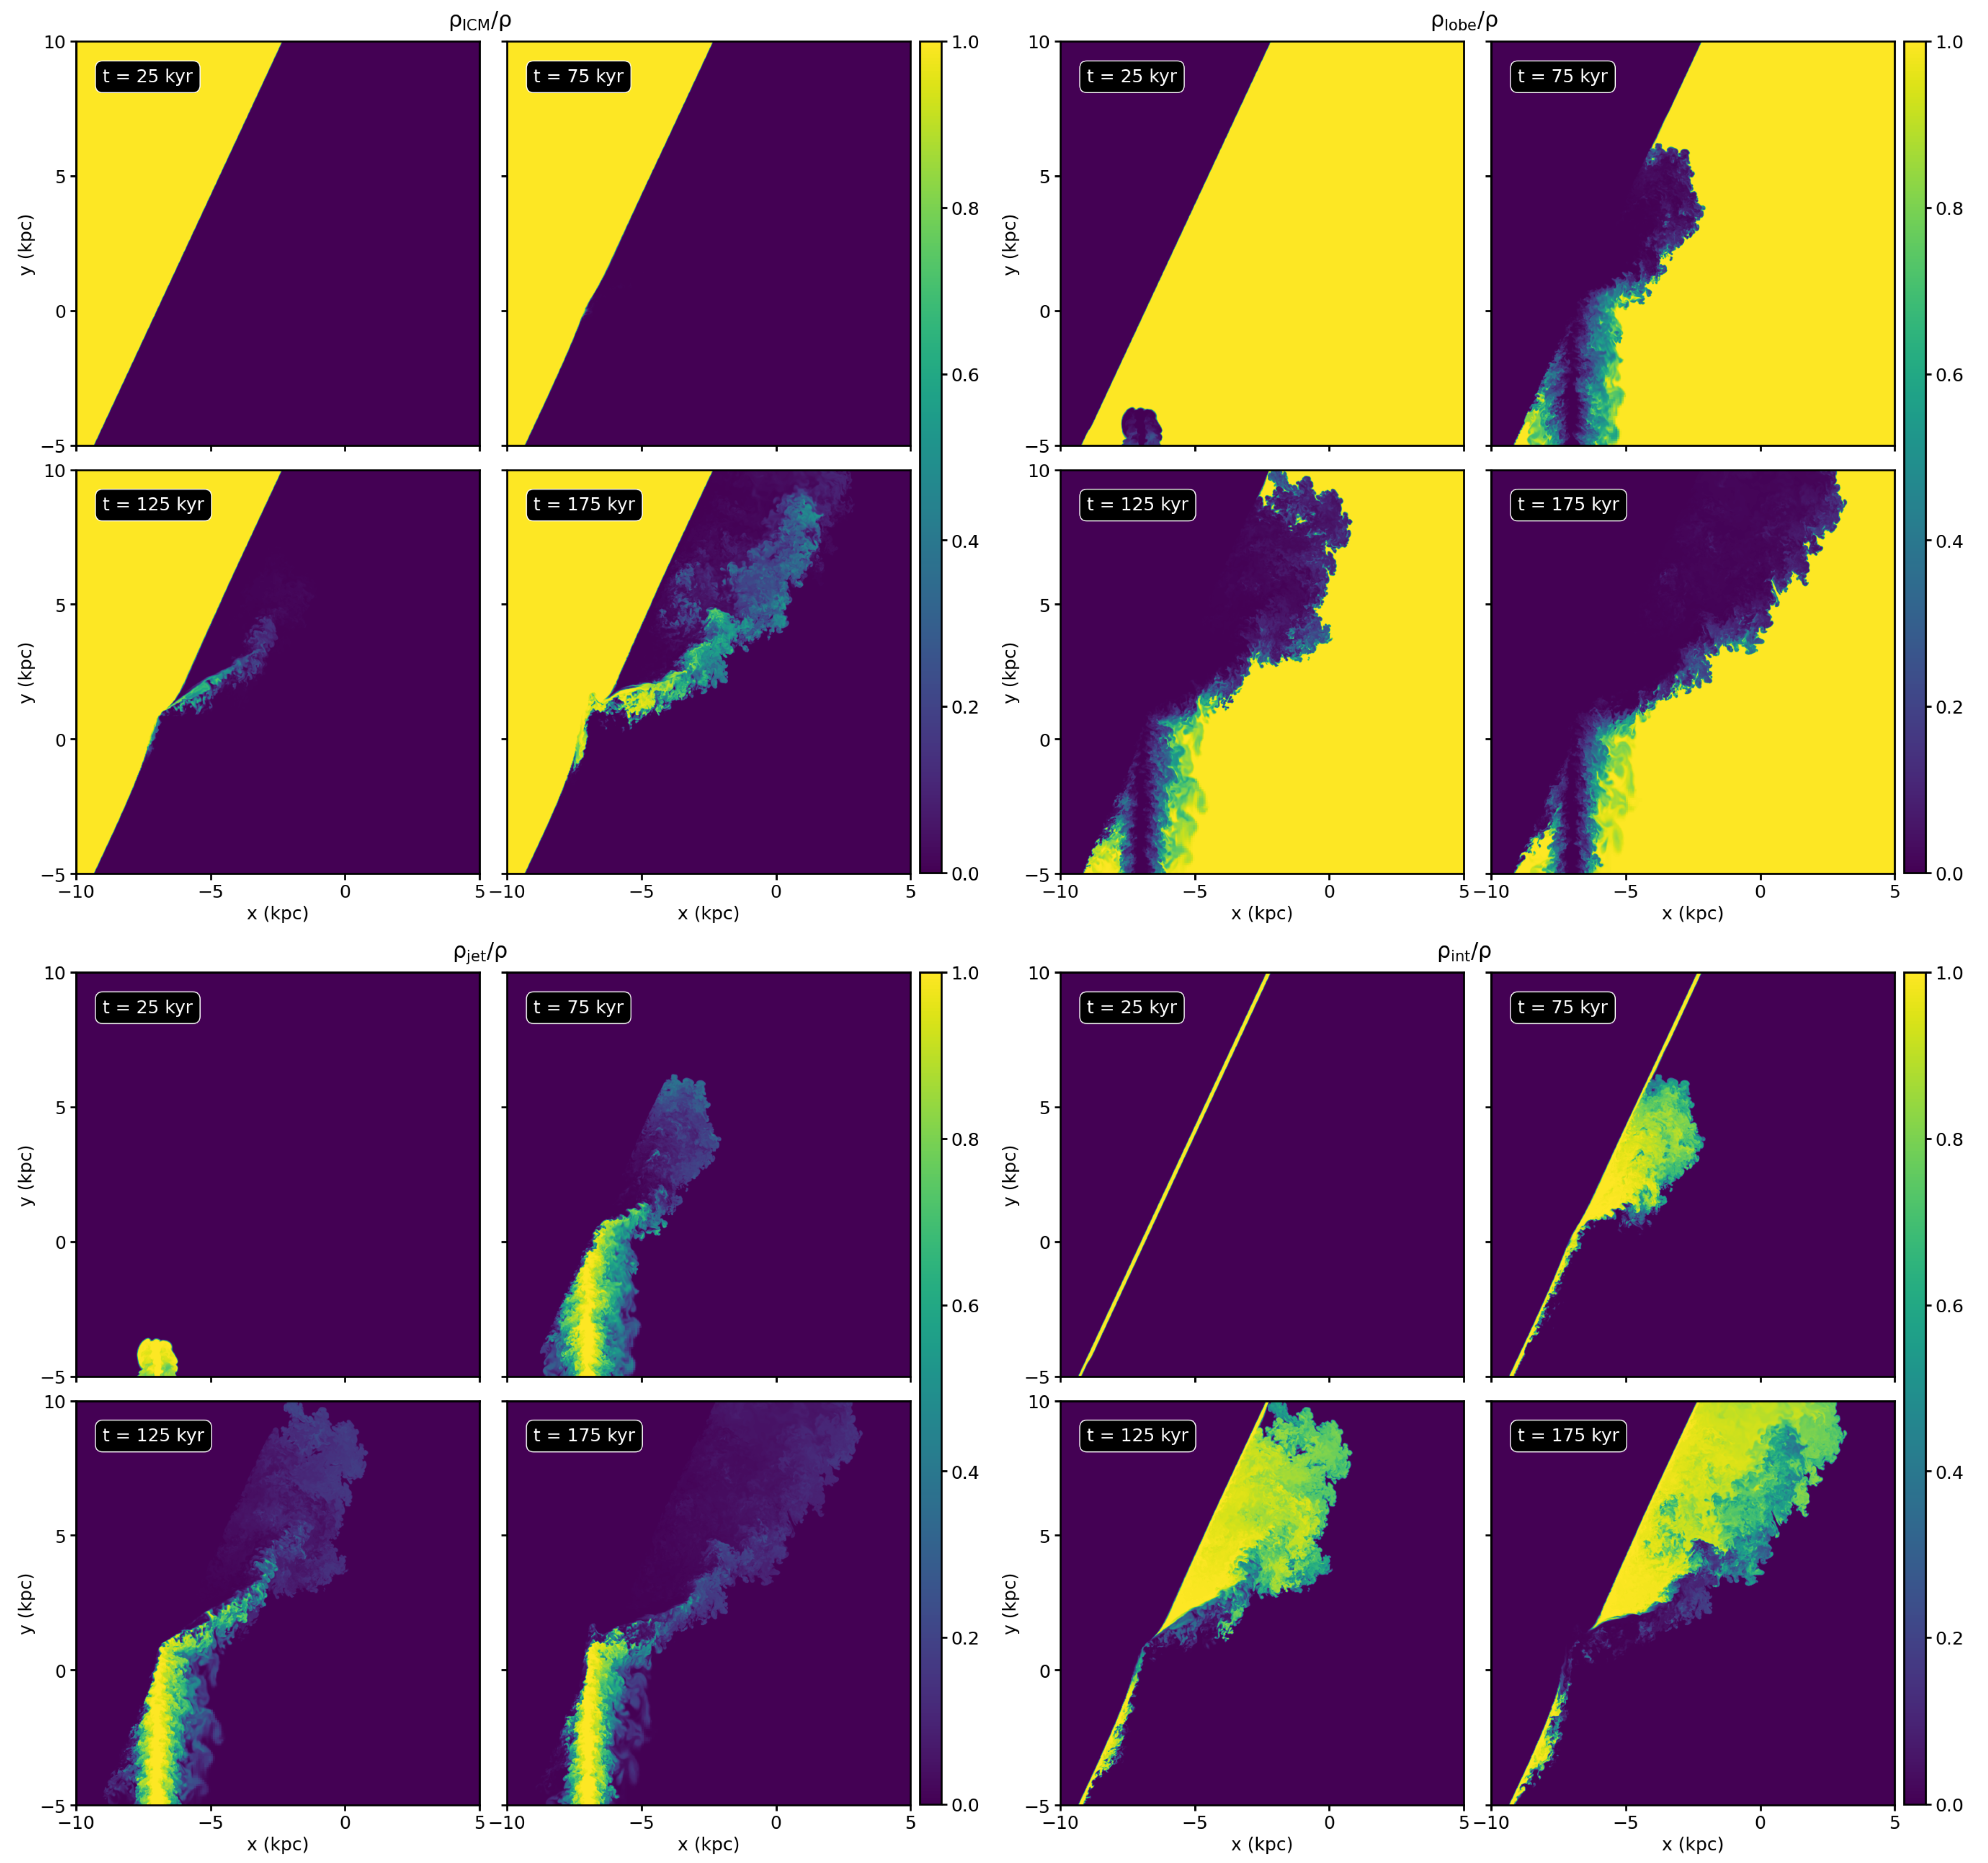
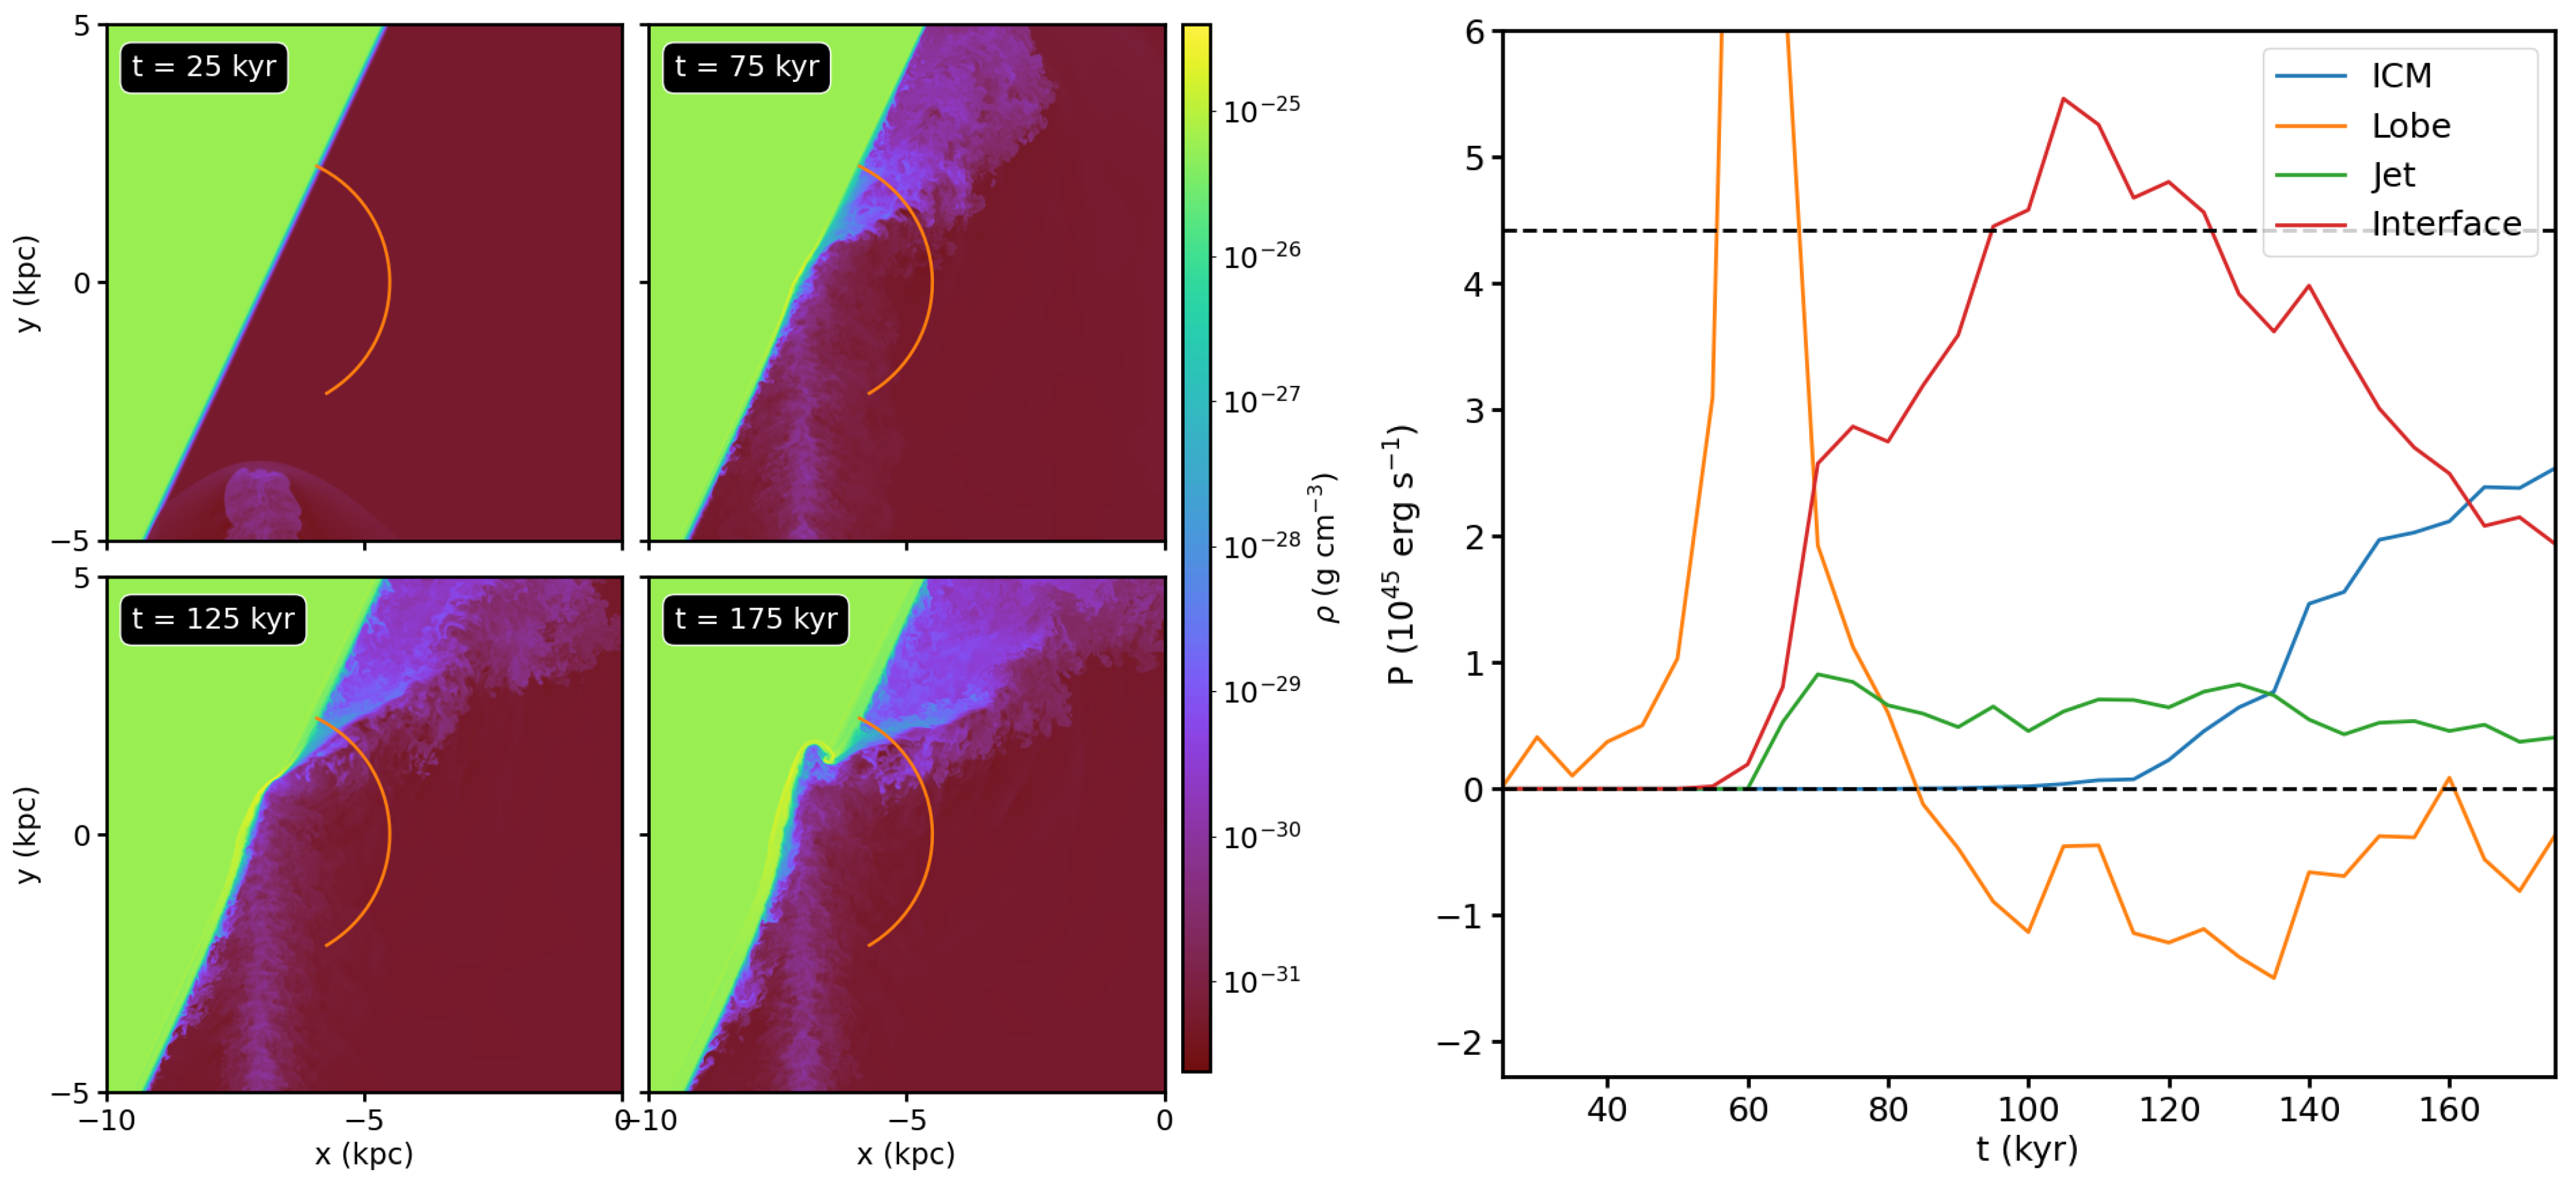
3.1. Fiducial Run: Slices

We begin by describing our fiducial simulation, using the parameters detailed in Table 1. Slices through the center of the simulation domain in the density and pressure are shown in Figure 3 and in the velocity magnitude and ratio of specific heats, Γ , in Figure 4. The jet approaches the interface from the lower-left part of the domain, remaining fairly collimated at early times and driving a shock in front of it. At approximately t = 50 kyr into the simulation, the jet collides with the interface. The reflected jet continues onward, continuing to drive a shock ahead of it. The reflected jet is highly turbulent. At the location of the collision of the jet with the interface, the gas pressure increases by ∼2–3 orders of magnitude after t 100 kyr (right panels of Figure 3), producing a “hotspot”, where it hits the interface.
The reflected jet maintains a significant speed of β γ 1.3–2.1 near the point of collision with the interface; at distances larger than ∼5 kpc, it becomes extremely turbulent and slows. At t 125 kyr, the incoming jet begins to burrow a hole into the ICM. As a result, the reflected jet begins to tilt downward. As this process occurs gradually, the result is that the outgoing material fans out into a flow directed to the right.
What is perhaps most interesting about the reflected jet flow is that, very early on in its evolution, it consists mostly of material that has been stripped off of the interface. This is seen in the right panels of Figure 4, where the ratio of specific heats in much of the outflow from the hotspot is close to 5/3, the value in the nonrelativistic ICM gas. Figure 5 shows slices of the four passive scalar fields at the same epochs plotted in Figure 3 and Figure 4. Initially, the reflected jet is comprised mostly of jet material, but slowly, the composition begins to include more “interface” gas. At t 125 kyr, the incoming jet begins to strip material from the ICM itself and drive it out into the lobe. The amount of lobe material in the reflected jet is negligible throughout the simulation. As shown in the right panel of Figure 4, the stripped material is heated up as it is driven outward from the interface by thermalizing its kinetic energy or mixing with lobe plasma and becomes nearly relativistic as the ratio of specific heats approaches Γ = 4 / 3 .

3.2. Fiducial Run: Jet Power

Another way to measure the impact and composition of the reflected jet is to compute its power by integrating the flux of energy over a suitable surface. For this, we used Equation (8) and took the surface integral over a portion of the sphere with a radius of 5 kpc, centered on the initial point of impact of the jet on the ICM, which extends in angle from the ICM/lobe interface down to 30 below the x-axis on the negative side of the y-axis (see the left panels of Figure 6 for the location of this surface drawn on slices of the gas density for several epochs). We computed the jet power associated with each of the passive scalars ρ c by integrating P jet , c for each component separately. The resulting jet power in each component as a function of time is shown in the right panel of Figure 6.
The early power peak carried in the lobe gas (orange) occurs as the shock ahead of the jet crosses the surface where the power is measured. There is also a modest peak at 60 kyr in the power carried by the jet fluid (green). However, the great bulk of the power is carried across the surface in plasma from the interface (red) from t 60–160 kyr and at very late times ( t 160 Gyr) from the ICM (blue), both ablated from the vicinity of the hotspot. The total power flowing across this surface is comparable to the power injected via the jet (upper dashed line).
At late times, most of the kinetic power in these flows will be converted to thermal energy, and the gas pressure will be approximately uniform, so that the volume occupied by each gas phase will be nearly proportional to the total energy injected with that phase. Thus, the results in Figure 6 imply that most of the volume of the lobe will eventually be occupied by the ablated interface and ICM gas.

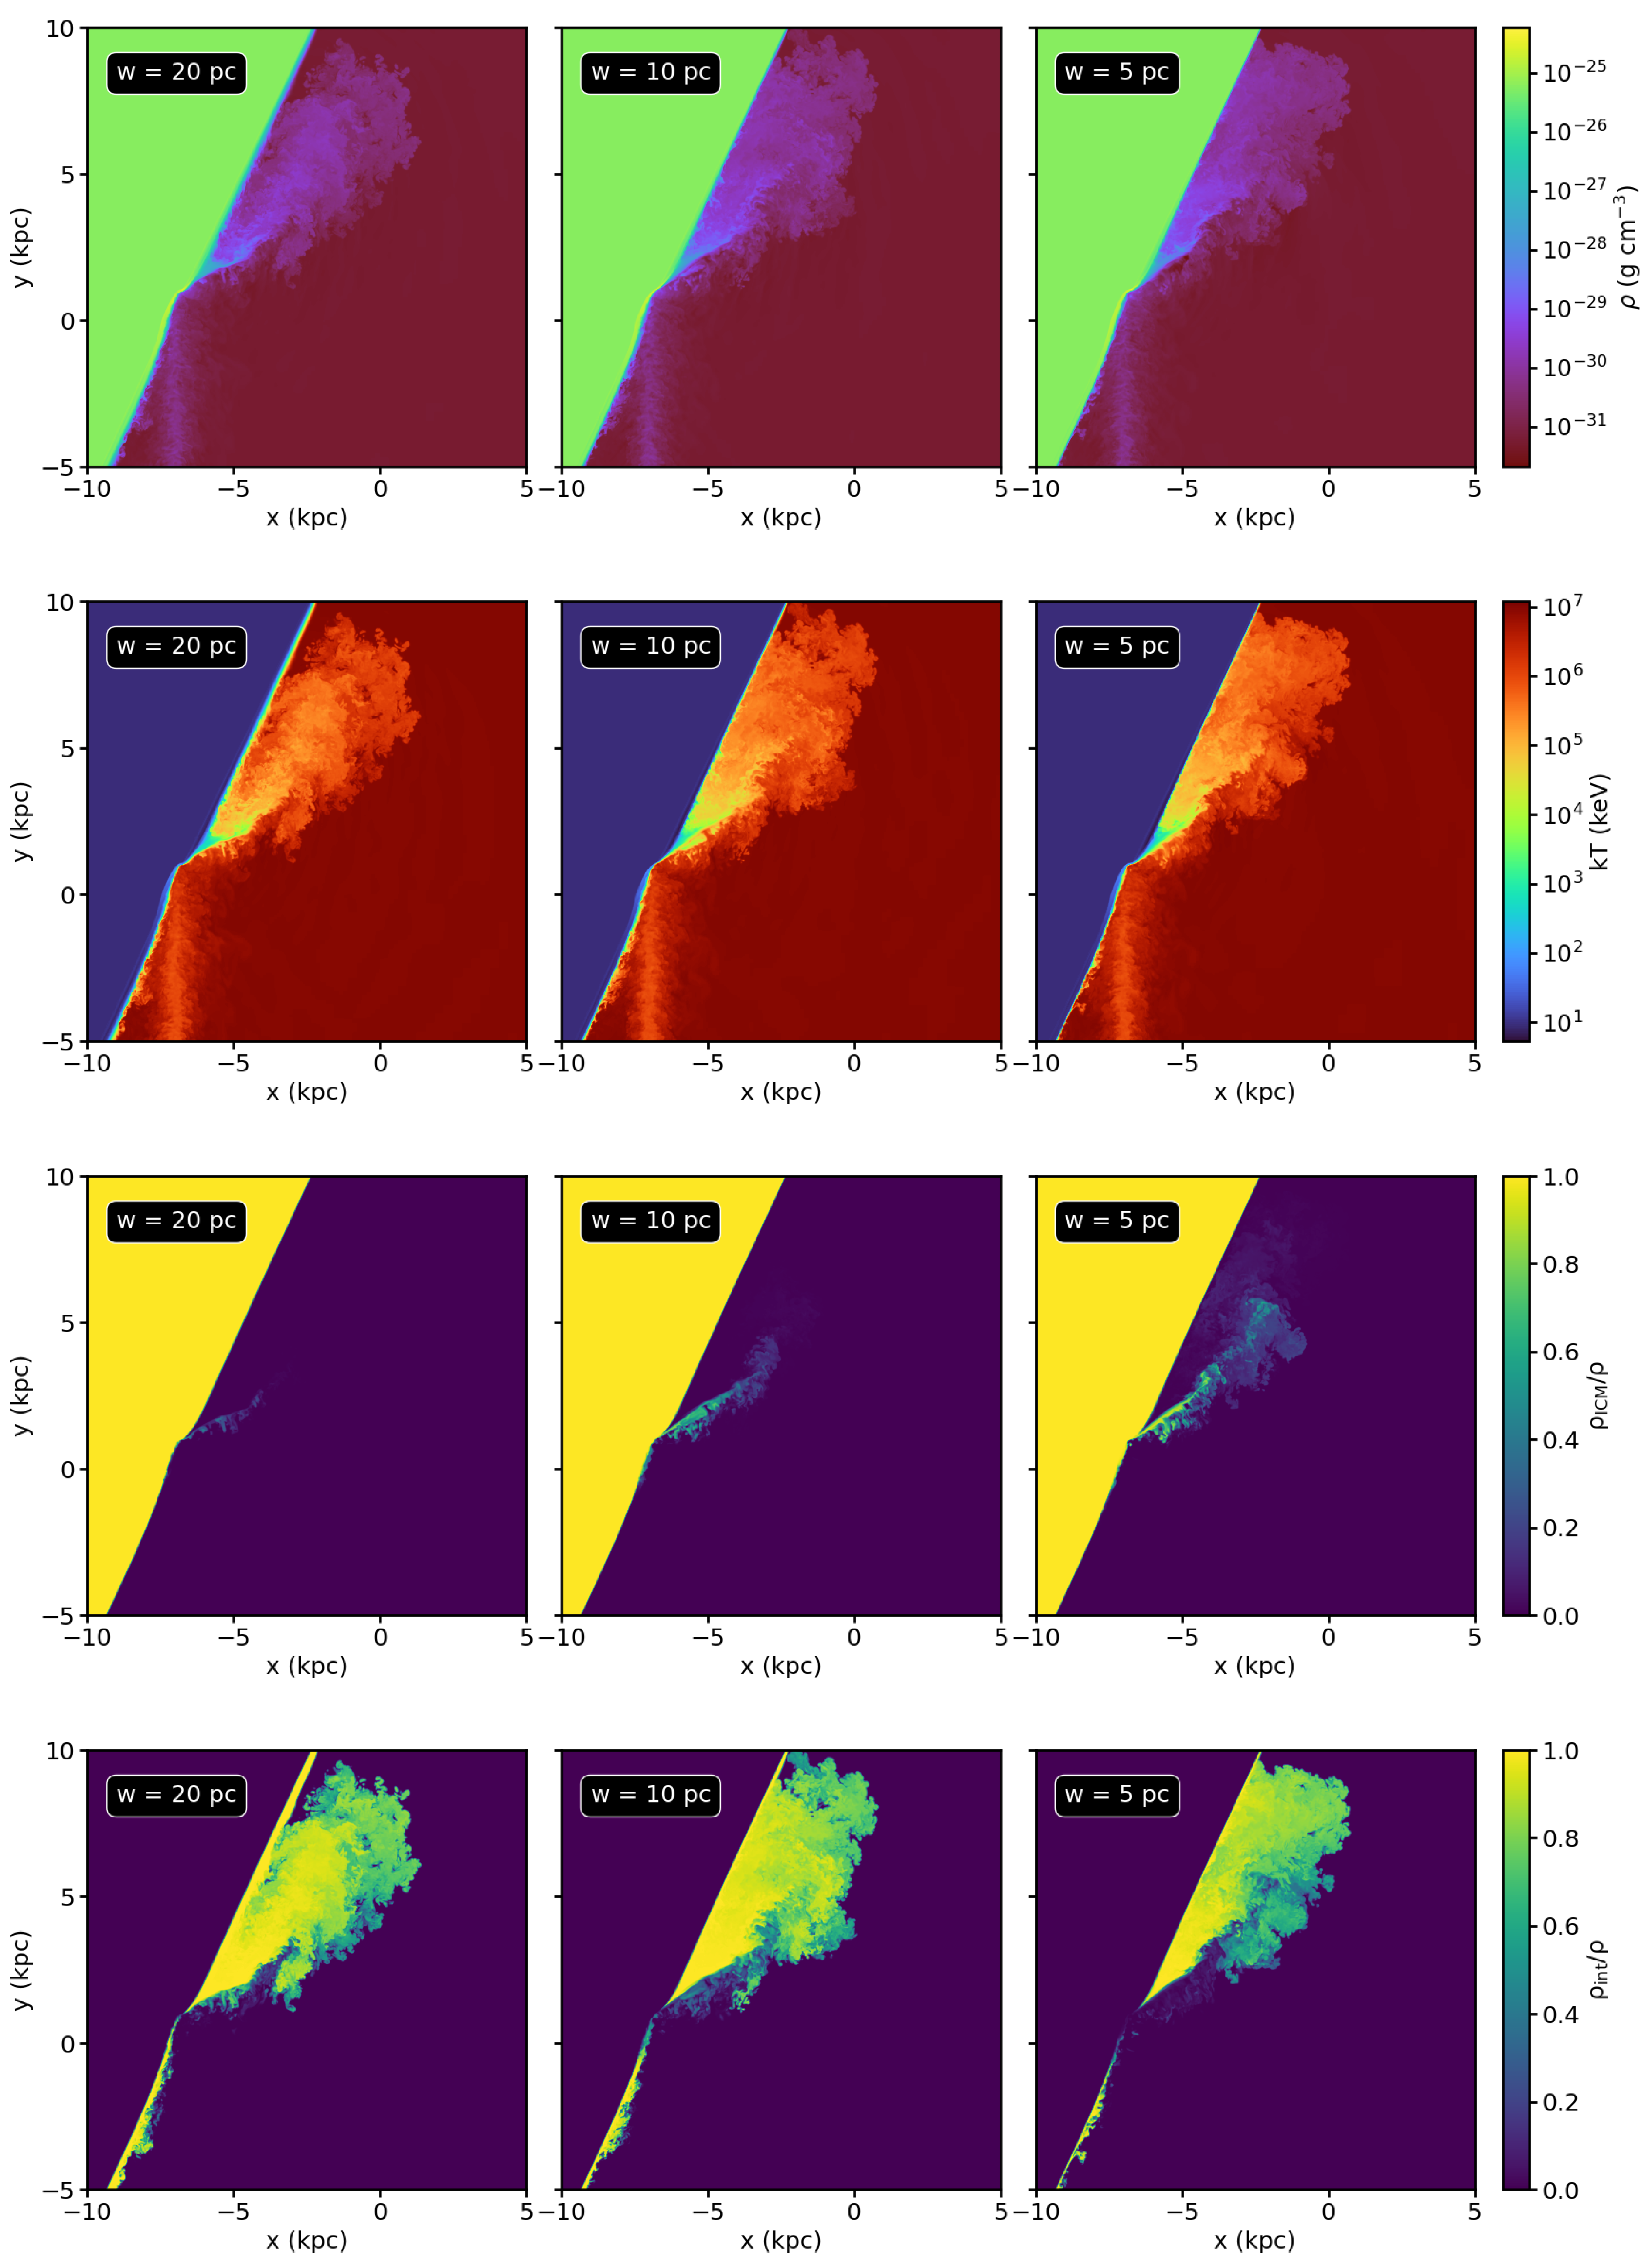
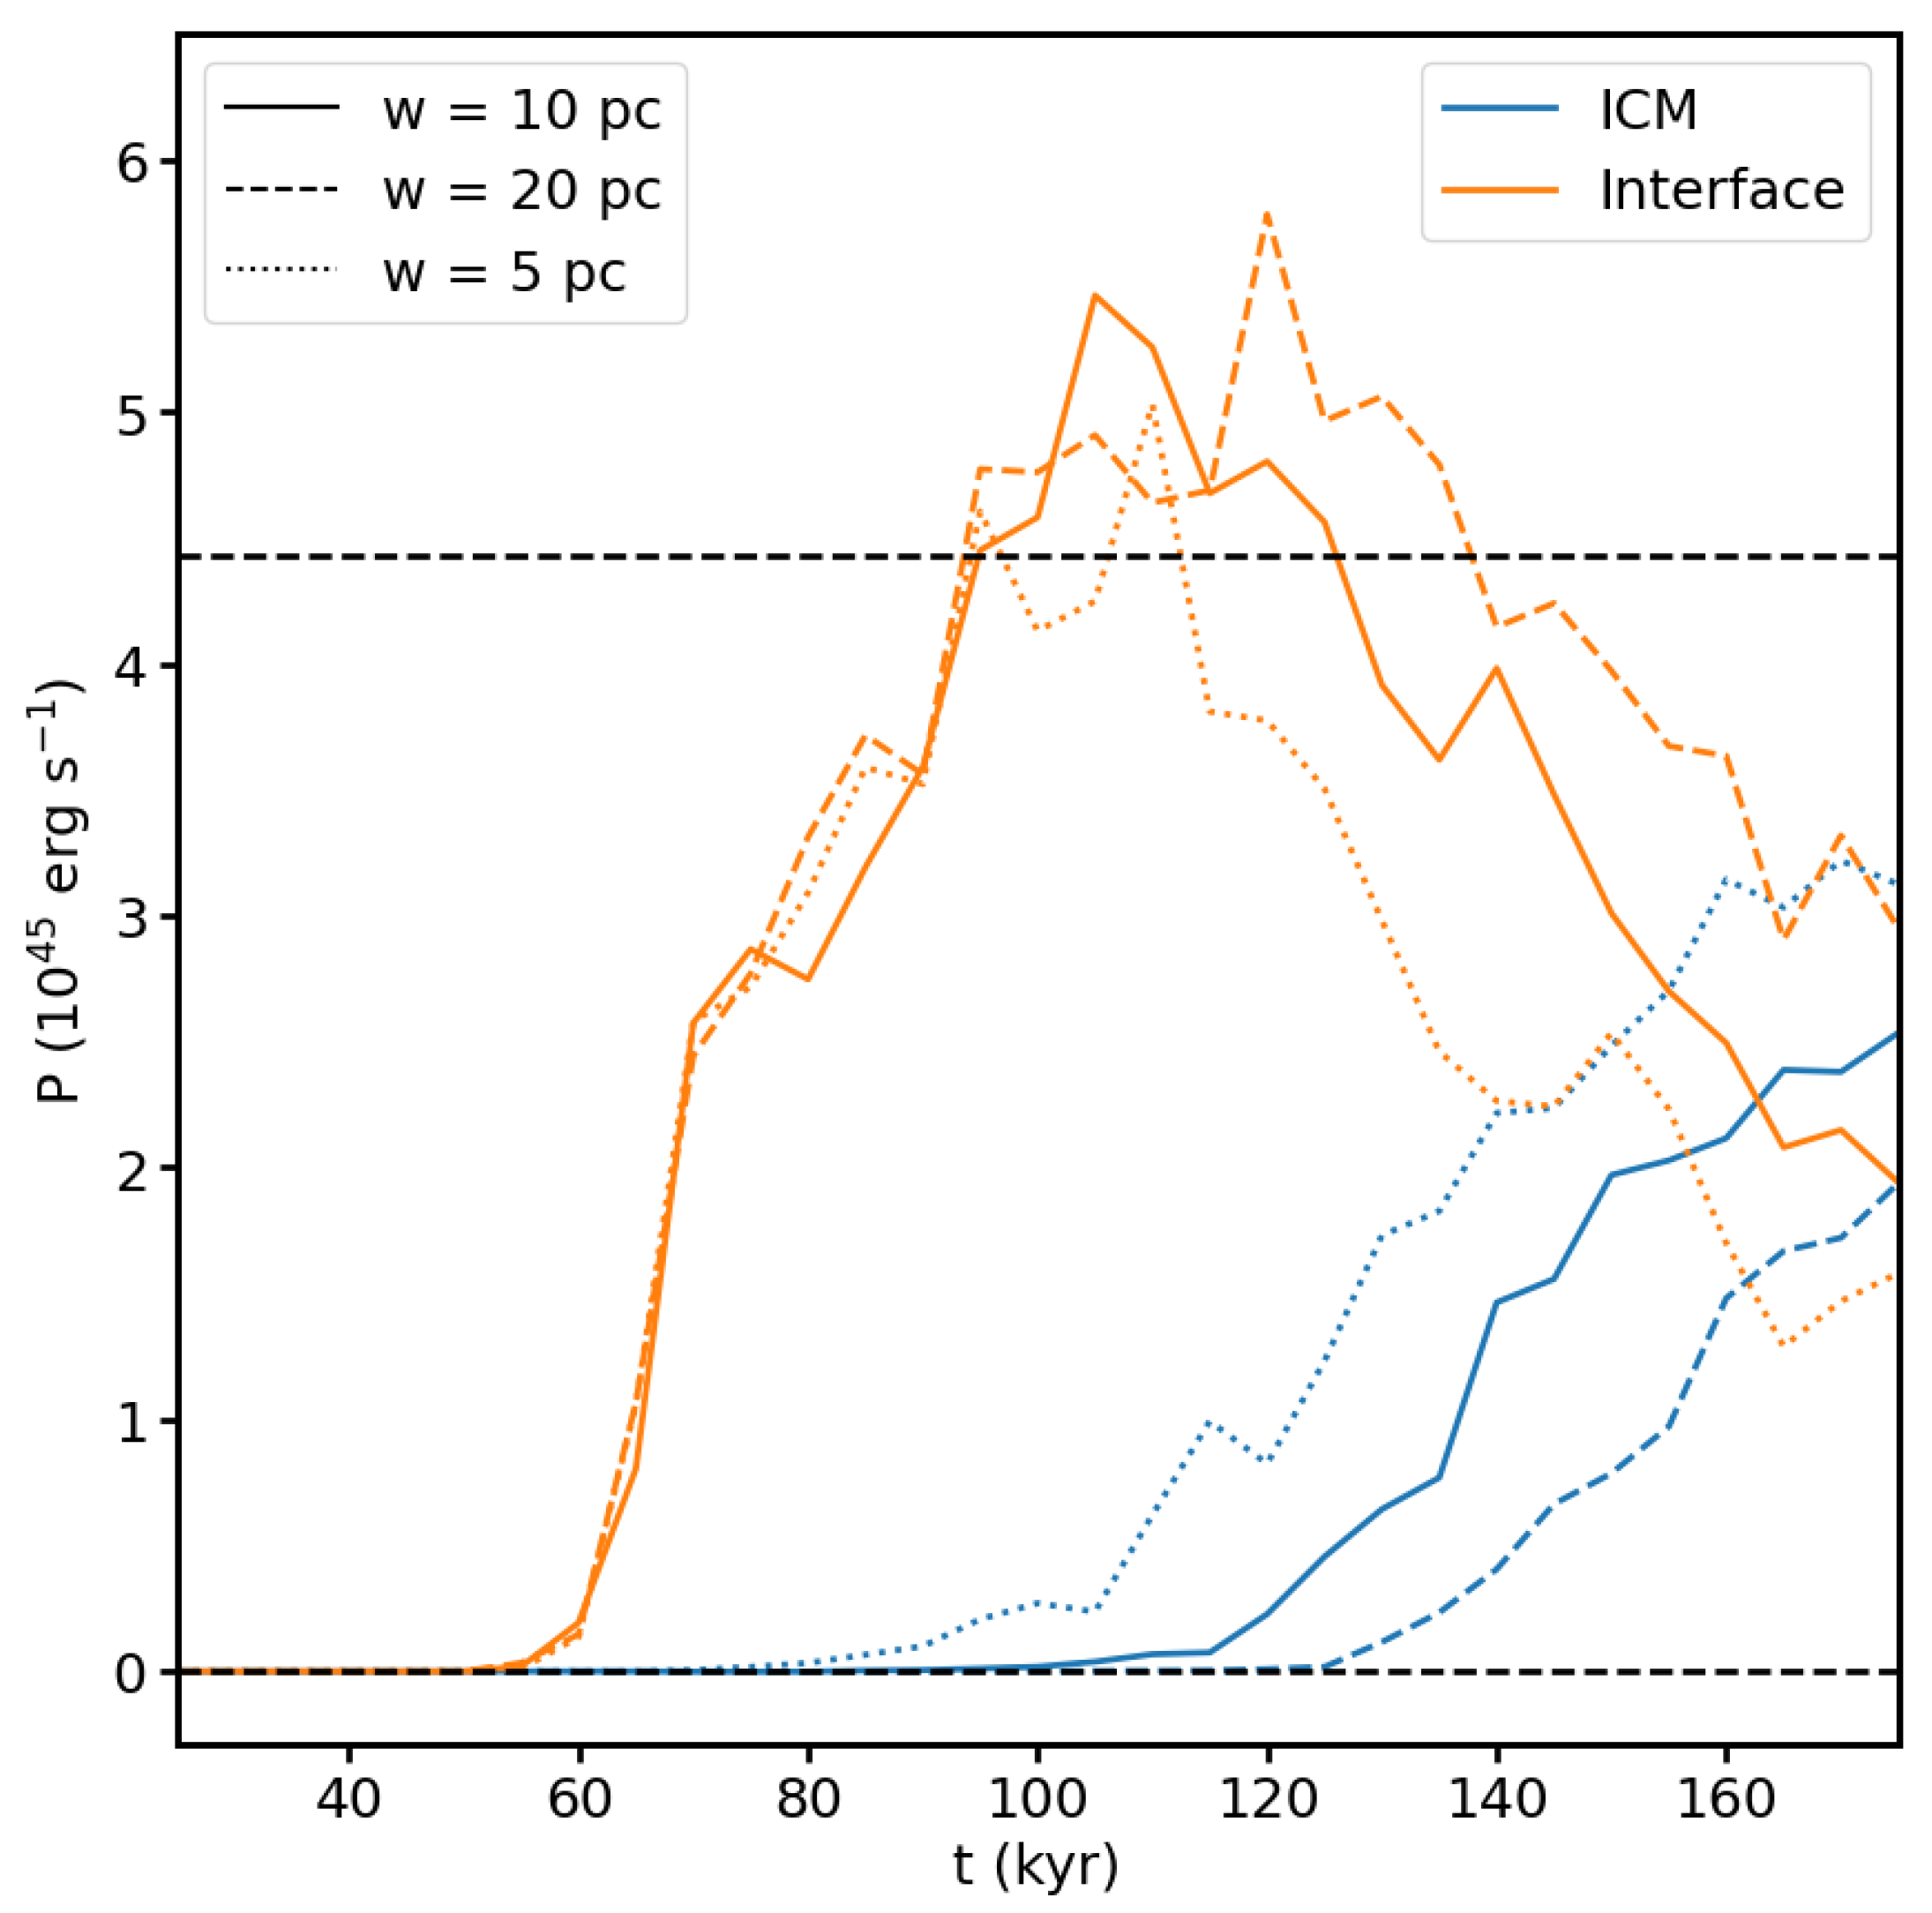
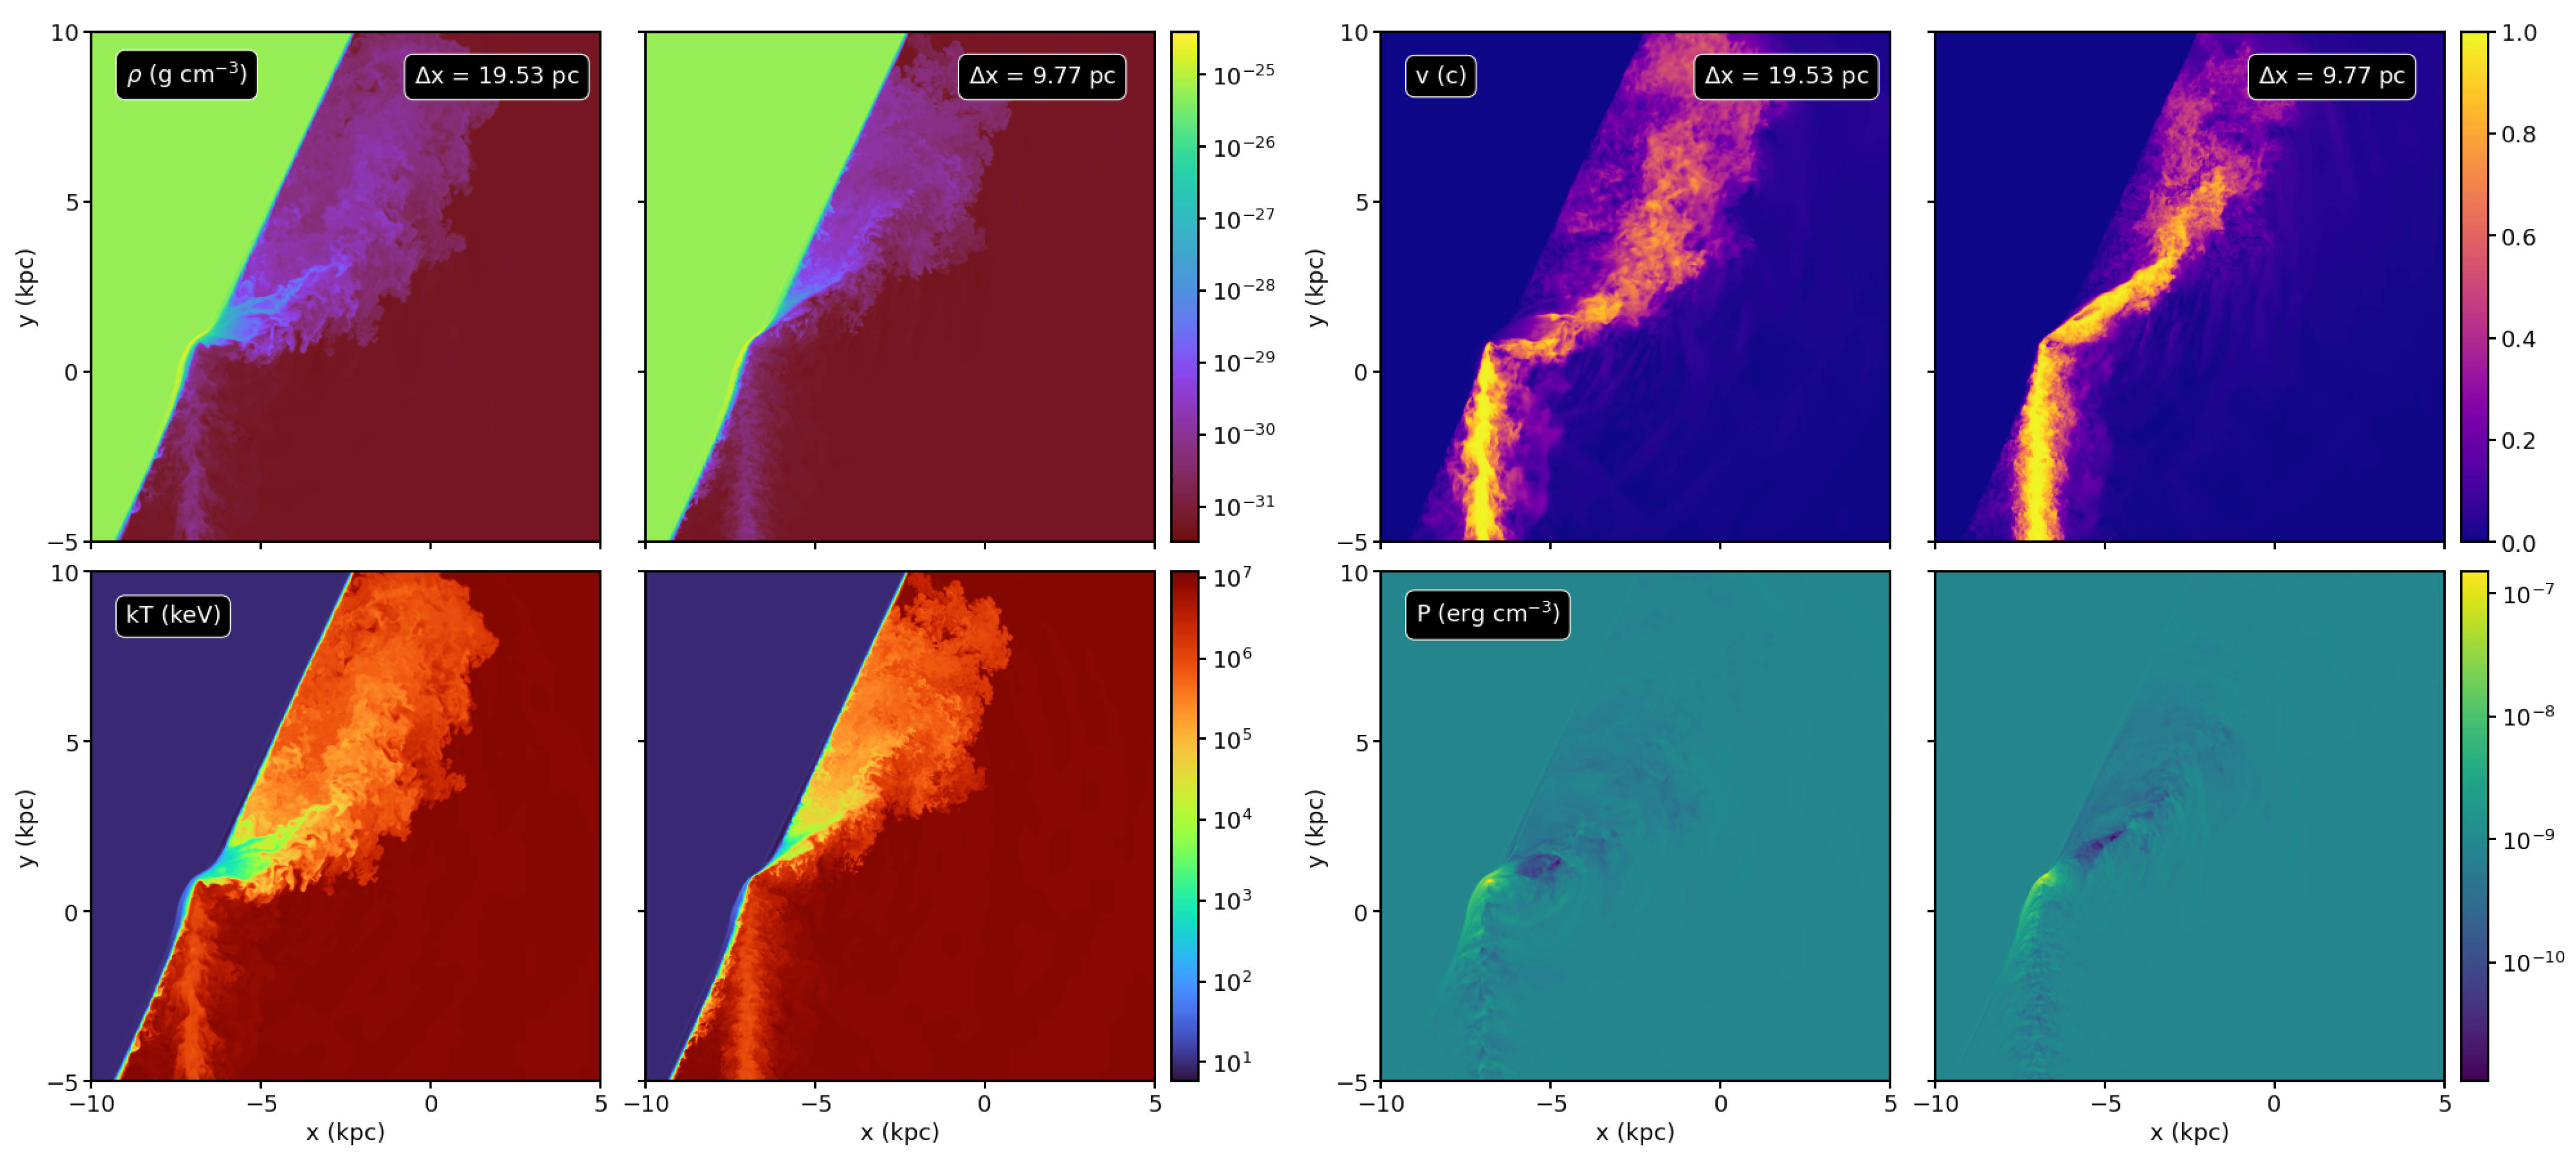
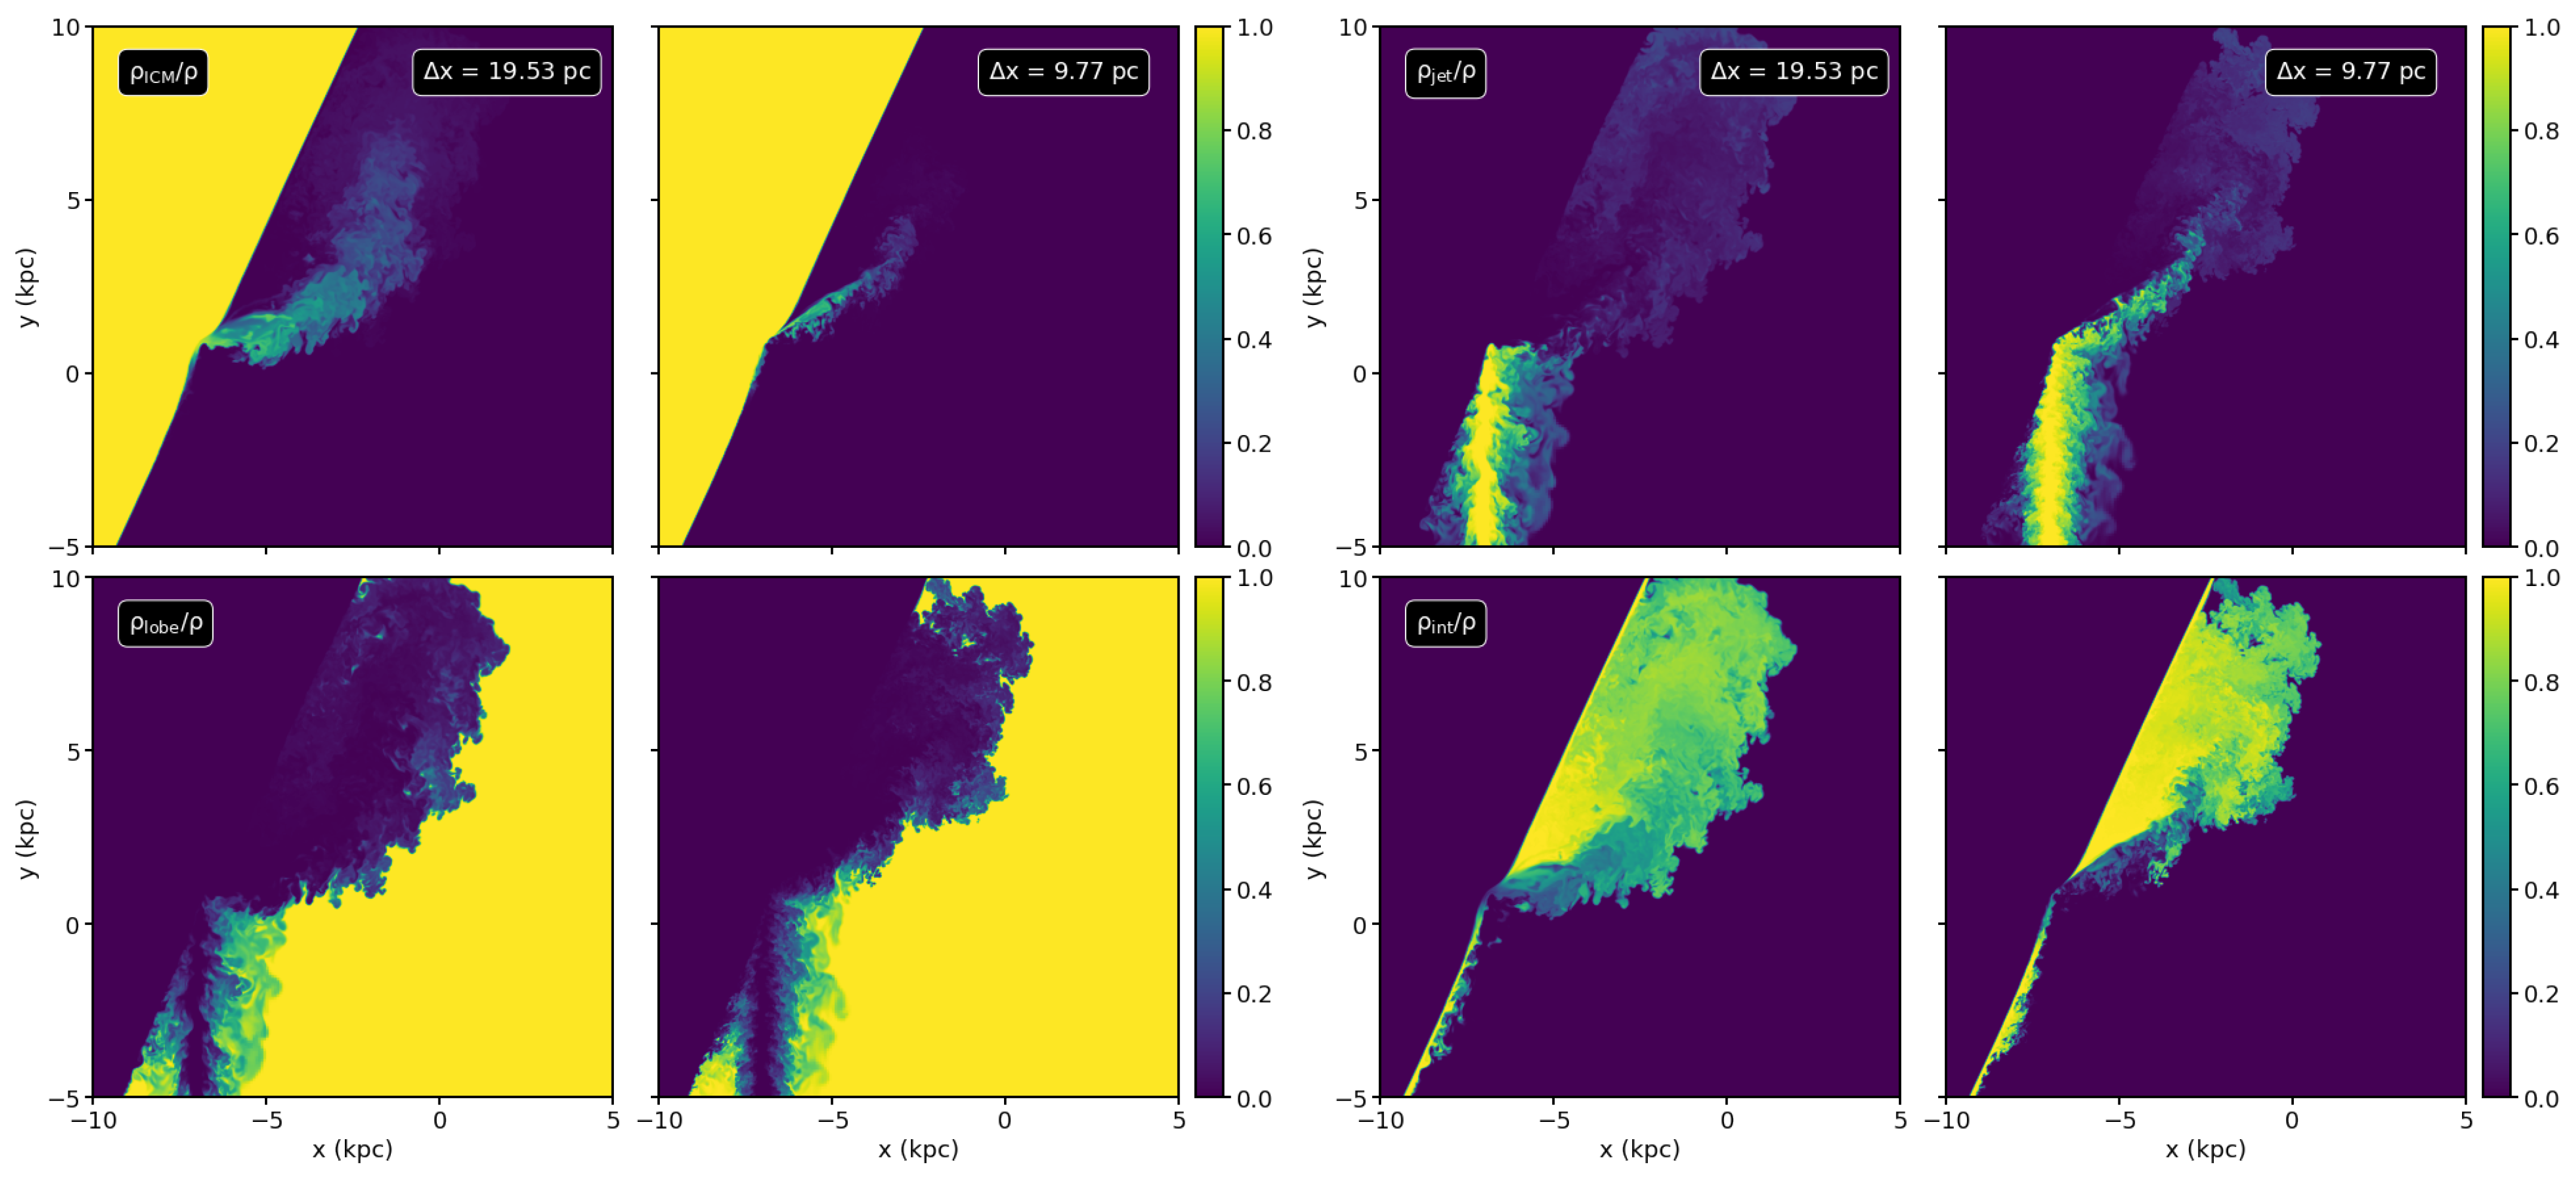
3.3. Varying the Width of the Interface

In this section, we considered the effects of varying the width of the interface between the ICM and the lobe. Our fiducial simulation had a width parameter w = 10 pc; we also performed simulations with w = 20 pc and w = 5 pc. The results of this investigation are shown in Figure 7 and Figure 8. In the first figure, we show slices of density, temperature, ICM, and interface material at t = 125 kyr. The panels show that varying the interface over this range does not affect the evolution of the reflected jet substantially; the main effect is to drive more material from the ICM off at earlier epochs if the width is smaller. This is also shown in Figure 8, which shows the energy fluxes of the ICM and interface material through the same surface as in Figure 6. The wider the interface, the later the turnover from an interface-dominated flow to an ICM-dominated one is, and vice versa.

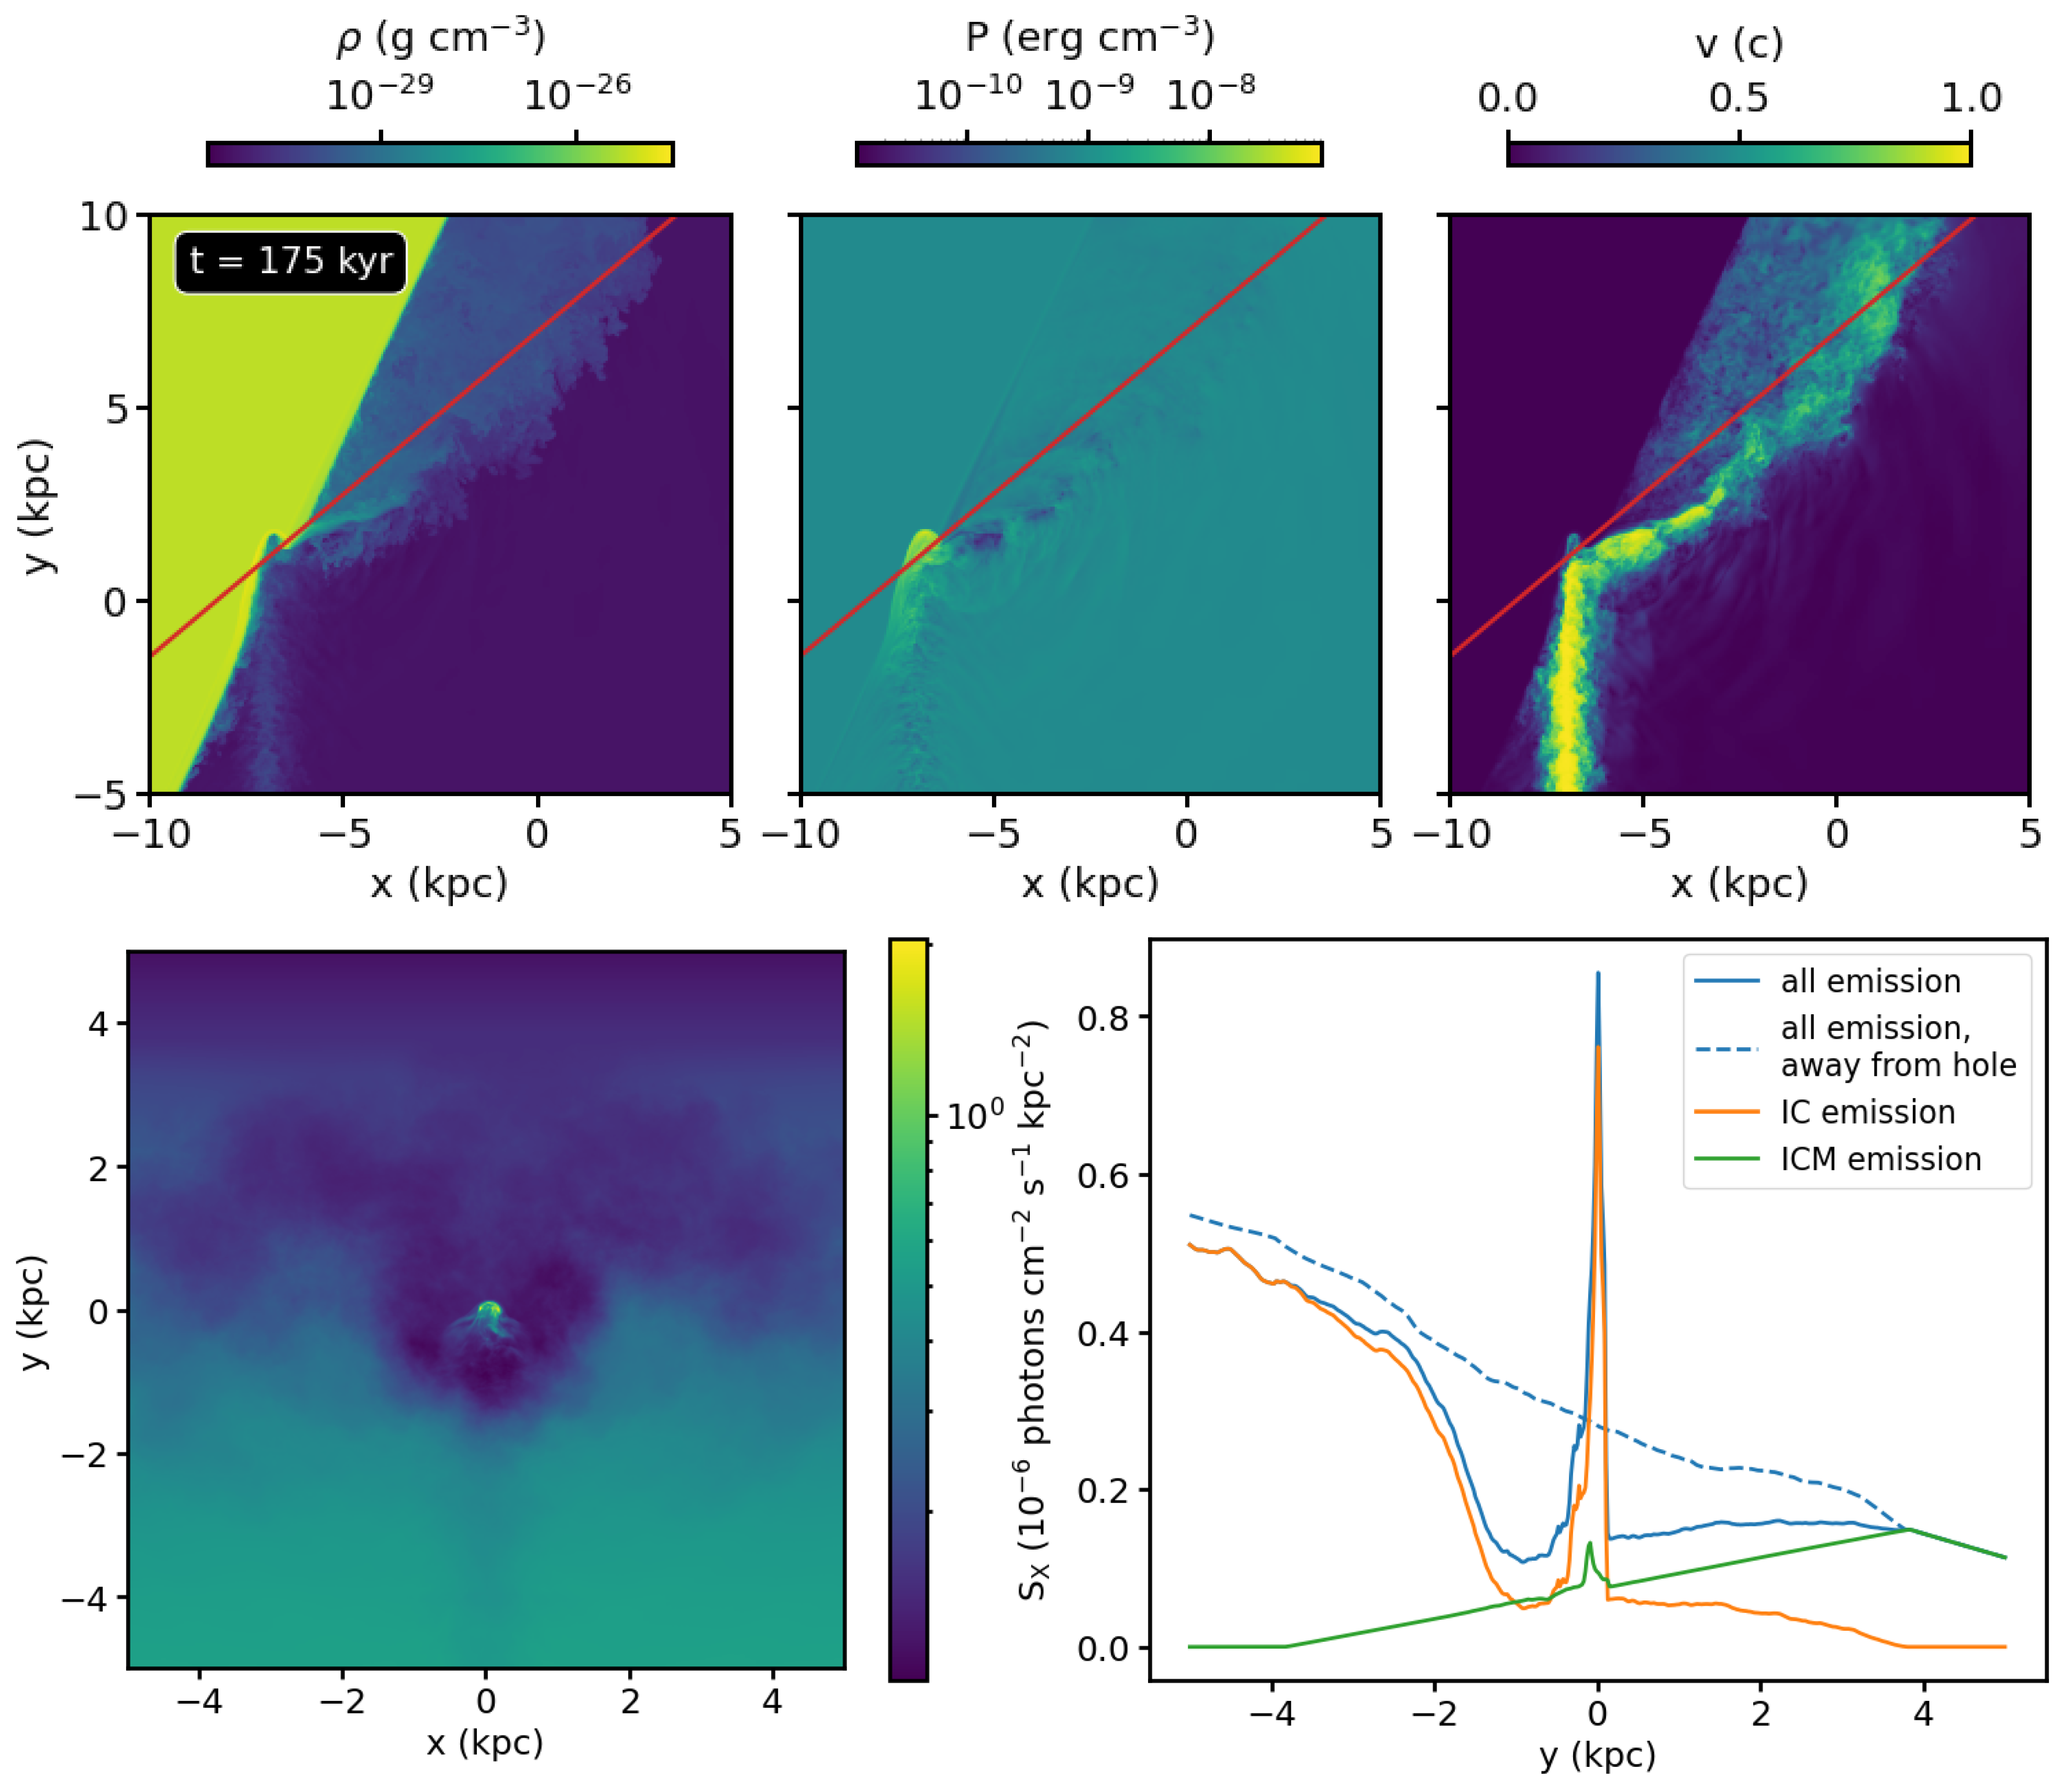
3.4. Carving a Hole: Projected X-ray Emission

In this section, we considered whether Doppler beaming can account for the apparent hole around Hotspot E. As discussed in the Introduction, the energetic electrons responsible for radio synchrotron and inverse-Compton emission from the hotspot are likely accelerated to high energies in the shocks encountered there. For a magnetic field strength of 200 μ G , comparable to that in Hotspots A and D [15], electrons with γ 1000 produce synchrotron emission at ∼1 GHz, and their synchrotron cooling times are ∼600,000 yr (inverse-Compton cooling times are much longer). Depending on the source of seed photons, electrons with γ in the range 1000–10,000 are required to produce the inverse-Compton emission from the hotspots and lobe observed at ∼1 keV. At flow speeds comparable to c, the relativistic plasma passes through Hotspot E in ≲1000 yr, so that the radiating electrons lose little energy during their time in the hotspot. Thus, the primary source of the relativistic electrons responsible for radio and X-ray emission from the lobe is the particle acceleration that occurs in the hotspots [14].
With a comparable population of relativistic electrons per unit volume, the plasma flowing out of Hotspot E is expected to produce comparable radio and X-ray emission per unit volume to the other plasma in this vicinity.
We modeled the X-ray emission from the region around the hotspot as follows: the ICM gas was modeled to have thermal emission assuming an Astrophysical Plasma Emission Code (APEC) [25] v3.0.9 model, where we assumed the ICM has metallicity Z = 0.3 Z . For the relativistic plasma, we assumed that it emits in the X-rays primarily via inverse-Compton scattering of cosmic microwave background photons (IC-CMB). For this component, we adopted a simple model where the emission is proportional to the energy density of the plasma for gas, which satisfies k T m e c 2 . Following [12], we assumed this emission is of power-law form S 0 ( E ) E α with α = 0.7 , and we scaled the emission so that its surface brightness roughly matches that in the lobe in Cygnus A. We then adopted a sight line n ^ , which roughly intersects the hotspot and traverses through the reflected jet (top panels of Figure 9). Given the sight line, we can compute the Doppler boosting factor:
D = 1 γ ( 1 β · n ^ )
and multiply the factor D 3 α [26] by the emission at every point. We computed the total emission of both components in the 0.5–7.0 keV band and projected along the chosen sight line.
The total projected emission in the vicinity of the pressure hotspot along the line of sight is shown in the bottom-left panel of Figure 9. The bright hotspot appears in the center of the image, surrounded by a cavity in emission roughly 4 kpc in diameter, produced by the Doppler de-boosting of the reflected jet along the sight line. The bottom-right panel of Figure 9 shows profiles taken along the y-axis of the map at x = 0, showing the total emission (blue) along this profile and the IC (orange) and ICM (green) emission separately. A dashed blue line shows the total emission profile at another location on the x-axis, far away from the hotspot and the hole that surrounds it, showing that the hole creates a significant deficit of emission. The resulting hole is roughly a factor of two smaller in diameter than the observed feature in Cygnus A, but the simulation qualitatively reproduces the general features. Note that the overall decrease in brightness with increasing y is partly due to the decreasing lengths of the sight lines within the lobe, an artifact of the rectangular simulation box.

4. Discussion and Conclusions

The nearby FRII radio galaxy Cygnus A exhibits hotspots of emission at the point of interaction of its jets with the interface between the expanding lobe plasma that surrounds the jets and the ICM, as is typical for such sources. In deep Chandra X-ray observations of Cygnus A, Reference [13] identified a “hole” in the emission surrounding one of the hotspots and suggested that it was produced by Doppler de-boosting of a reflected jet moving away from the hotspot and from the observer along the line of sight.
In this work, we presented relativistic hydrodynamic simulations of an FRII jet impinging on the interface between a relativistic plasma in the lobe surrounding the jet and the ICM, using a simple plane-parallel model for the interface with the axis of the jet inclined to the interface. The interaction of the highly collimated jet with the interface produces a high-pressure “hotspot” and a turbulent reflected jet that fans out into the lobe and fills it with somewhat denser gas, first from the interface transition region and, at later times, from the ICM itself. The amount of material in the reflected jet from the incident jet itself is always negligible, except immediately after the initial collision, as the low-density plasma from the jet mixes with the much more dense material in the interface and ICM. This indicates that the interaction of the jet with the ICM will fill the lobe with relatively energetic ions originating from the ICM, as proposed by [14]. This general behavior is not affected significantly by varying the width of the interface. If viewed along a line of sight approximately aligned with the reflected jet, with the latter moving away from the observer, the emission from this gas surrounding the hotspot is Doppler de-boosted, producing a cavity or “hole” of emission surrounding the hotspot, as seen in Cygnus A.
This simple scenario qualitatively reproduces the essential features of the hotspot and its surrounding hole. Future work will include a more accurate representation of the gas physics, including magnetic fields, which are expected to be dynamically significant in and near the hotspot, as well as acceleration of relativistic particles by internal shocks in the jet. The inclusion of magnetic fields and a more accurate model for particle acceleration will also permit more sophisticated models of the radio synchrotron and X-ray synchrotron self-Compton emission from the hotspot and surrounding region. The flow onward from Hotspot E does not appear sufficiently well collimated to produce Hotspot D [13], although the collimation will be altered by the inclusion of magnetic fields. A model including magnetic fields, along with a curved interface to allow the production of multiple hotspots, will be required to test this hypothesis.
Models of relativistic jets interacting with inclined or curved lobe/ICM interfaces may also be applied to other observed interactions, such as the eastern jet of Cygnus A and the FRII source 3C 220.1, which shows a jet potentially deflected against an interface at multiple locations [27].

Author Contributions

Conceptualization, P.E.J.N. and J.A.Z.; methodology, P.E.J.N. and J.A.Z.; software, J.A.Z., P.-H.T. and H.-Y.S.; validation, J.A.Z.; formal analysis, J.A.Z. and P.E.J.N.; investigation, J.A.Z. and P.E.J.N.; resources, J.A.Z.; data curation, J.A.Z.; writing—original draft preparation, J.A.Z. and P.E.J.N.; writing—review and editing, J.A.Z., P.E.J.N., P.-H.T., H.-Y.S. and T.W.J.; visualization, J.A.Z.; funding acquisition, J.A.Z. All authors have read and agreed to the published version of the manuscript.

Funding

J.A.Z. and P.E.J.N. are funded by the Chandra X-ray Center, which is operated by the Smithsonian Astrophysical Observatory for and on behalf of NASA under Contract NAS8-03060. P.-S.T. and H.-Y.S. are supported by the National Science and Technology Council (NSTC) of Taiwan under Grant No. NSTC 111-2628-M-002-005-MY4 and No. NSTC 108-2112-M-002-023-MY3. T.W.J. is supported by NSF Grant AST2205885 to the University of Minnesota.

Data Availability Statement

Simulation data will be made available upon reasonable request to the authors.

Acknowledgments

The simulations were run on the Pleiades supercomputer at NASA/Ames Research Center. Software packages used in this work include: GAMER (https://github.com/gamer-project/gamer, accessed on 8 March 2023) [16,21,28]; AstroPy (https://www.astropy.org, accessed on 8 March 2023) [29]; Matplotlib (https://matplotlib.org, accessed on 8 March 2023) [30]; NumPy (https://www.numpy.org, accessed on 8 March 2023) [31]; yt (https://yt-project.org, accessed on 8 March 2023) [32].

Conflicts of Interest

The authors declare no conflict of interest.

Appendix A. Resolution Test

In this Appendix, we present a comparison between our fiducial simulation with a finest cell width of Δ x 10 pc and an otherwise identical simulation with a finest cell width of Δ x 20 pc (one less level of refinement). With a coarser spatial resolution, features that vary on short length scales such as the narrow interface and the velocity profile of the jet are most affected. Plasma of different entropies and origins (mass scalars) is also mixed on coarser length scales. Slices of various quantities at t = 125 kyr in the two simulations are shown in Figure A1 and Figure A2 to illustrate these effects.
Qualitatively, the main features of the fiducial simulation are reproduced in the coarser-resolution version—a turbulent reflected jet that consists initially mostly of material stripped from the interface and, at later times, incorporates more material from the ICM itself. The reflected jet is somewhat more collimated near the interface in the higher-resolution simulation and contains more jet material, indicating that the mixing of the latter with the interface material is more complete at lower resolution.
Figure A1. Comparison of the fiducial simulation at two different spatial resolutions at t = 125 kyr. (Left panels) Slices through the center of the simulation domain of density and temperature. (Right panels) Slices of velocity magnitude and pressure. Each panel is 15 kpc on a side, zoomed in slightly to focus on the parts of the simulation most affected by the jet.
Galaxies 11 00051 g0a1
Figure A2. Comparison of the fiducial simulation at two different spatial resolutions at t = 125 kyr. Panels show slices through the center of the simulation domain of the four different mass scalars. Each panel is 15 kpc on a side, zoomed in slightly to focus on the parts of the simulation most affected by the jet.
Galaxies 11 00051 g0a2

References

  1. Fanaroff, B.L.; Riley, J.M. The morphology of extragalactic radio sources of high and low luminosity. Mon. Not. R. Astron. Soc. 1974, 167, 31P–36P. [Google Scholar] [CrossRef] [Green Version]
  2. Carilli, C.L.; Barthel, P.D. Cygnus A. Astron. Astrophys. Rev. 1996, 7, 1–54. [Google Scholar] [CrossRef]
  3. Godfrey, L.E.H.; Shabala, S.S. AGN Jet Kinetic Power and the Energy Budget of Radio Galaxy Lobes. Astrophys. J. 2013, 767, 12. [Google Scholar] [CrossRef] [Green Version]
  4. Snios, B.; Nulsen, P.E.J.; Wise, M.W.; de Vries, M.; Birkinshaw, M.; Worrall, D.M.; Duffy, R.T.; Kraft, R.P.; McNamara, B.R.; Carilli, C.; et al. The Cocoon Shocks of Cygnus A: Pressures and Their Implications for the Jets and Lobes. Astrophys. J. 2018, 855, 71. [Google Scholar] [CrossRef] [Green Version]
  5. Croton, D.J.; Springel, V.; White, S.D.M.; De Lucia, G.; Frenk, C.S.; Gao, L.; Jenkins, A.; Kauffmann, G.; Navarro, J.F.; Yoshida, N. The many lives of active galactic nuclei: Cooling flows, black holes and the luminosities and colours of galaxies. Mon. Not. R. Astron. Soc. 2006, 365, 11–28. [Google Scholar] [CrossRef] [Green Version]
  6. McNamara, B.R.; Nulsen, P.E.J. Heating Hot Atmospheres with Active Galactic Nuclei. Annu. Rev. Astron. Astrophys. 2007, 45, 117–175. [Google Scholar] [CrossRef] [Green Version]
  7. Fabian, A.C. Observational Evidence of Active Galactic Nuclei Feedback. Annu. Rev. Astron. Astrophys. 2012, 50, 455–489. [Google Scholar] [CrossRef] [Green Version]
  8. Gitti, M.; Brighenti, F.; McNamara, B.R. Evidence for AGN Feedback in Galaxy Clusters and Groups. Adv. Astron. 2012, 2012, 950641. [Google Scholar] [CrossRef] [Green Version]
  9. Hardcastle, M.J.; Croston, J.H. Radio galaxies and feedback from AGN jets. New Astron. Rev. 2020, 88, 101539. [Google Scholar] [CrossRef]
  10. Steenbrugge, K.C.; Blundell, K.M.; Duffy, P. Multiwavelength study of Cygnus A-II. X-ray inverse-Compton emission from a relic counterjet and implications for jet duty cycles. Mon. Not. R. Astron. Soc. 2008, 388, 1465–1472. [Google Scholar] [CrossRef] [Green Version]
  11. Croston, J.H.; Hardcastle, M.J.; Harris, D.E.; Belsole, E.; Birkinshaw, M.; Worrall, D.M. An X-ray Study of Magnetic Field Strengths and Particle Content in the Lobes of FR II Radio Sources. Astrophys. J. 2005, 626, 733–747. [Google Scholar] [CrossRef] [Green Version]
  12. de Vries, M.N.; Wise, M.W.; Huppenkothen, D.; Nulsen, P.E.J.; Snios, B.; Hardcastle, M.J.; Birkinshaw, M.; Worrall, D.M.; Duffy, R.T.; McNamara, B.R. Detection of non-thermal X-ray emission in the lobes and jets of Cygnus A. Mon. Not. R. Astron. Soc. 2018, 478, 4010–4029. [Google Scholar] [CrossRef] [Green Version]
  13. Snios, B.; Johnson, A.C.; Nulsen, P.E.J.; Kraft, R.P.; de Vries, M.; Perley, R.A.; Sebokolodi, L.; Wise, M.W. The X-ray Cavity Around Hotspot E in Cygnus A: Tunneled by a Deflected Jet. Astrophys. J. 2020, 891, 173. [Google Scholar] [CrossRef]
  14. Blandford, R.D.; Rees, M.J. A “twin-exhaust” model for double radio sources. Mon. Not. R. Astron. Soc. 1974, 169, 395–415. [Google Scholar] [CrossRef]
  15. Harris, D.E.; Carilli, C.L.; Perley, R.A. X-ray emission from the radio hotspots of Cygnus A. Nature 1994, 367, 713–716. [Google Scholar] [CrossRef]
  16. Tseng, P.H.; Schive, H.Y.; Chiueh, T. An adaptive mesh, GPU-accelerated, and error minimized special relativistic hydrodynamics code. Mon. Not. R. Astron. Soc. 2021, 504, 3298–3315. [Google Scholar] [CrossRef]
  17. Taub, A.H. Relativistic Rankine-Hugoniot Equations. Phys. Rev. 1948, 74, 328–334. [Google Scholar] [CrossRef]
  18. Mathews, W.G. The Hydromagnetic Free Expansion of a Relativistic Gas. Astrophys. J. 1971, 165, 147. [Google Scholar] [CrossRef]
  19. Mignone, A.; Bodo, G. An HLLC Riemann solver for relativistic flows—I. Hydrodynamics. Mon. Not. R. Astron. Soc. 2005, 364, 126–136. [Google Scholar] [CrossRef] [Green Version]
  20. Synge, J.L.; Morse, P.M. The Relativistic Gas. Phys. Today 1958, 11, 56. [Google Scholar] [CrossRef]
  21. Schive, H.Y.; ZuHone, J.A.; Goldbaum, N.J.; Turk, M.J.; Gaspari, M.; Cheng, C.Y. GAMER-2: A GPU-accelerated adaptive mesh refinement code—Accuracy, performance, and scalability. Mon. Not. R. Astron. Soc. 2018, 481, 4815–4840. [Google Scholar] [CrossRef] [Green Version]
  22. Toro, E.F.; Spruce, M.; Speares, W. Restoration of the contact surface in the HLL-Riemann solver. Shock Waves 1994, 4, 25–34. [Google Scholar] [CrossRef]
  23. Colella, P.; Woodward, P.R. The Piecewise Parabolic Method (PPM) for Gas-Dynamical Simulations. J. Comput. Phys. 1984, 54, 174–201. [Google Scholar] [CrossRef] [Green Version]
  24. Worrall, D.M. The X-ray jets of active galaxies. Astron. Astrophys. Rev. 2009, 17, 1–46. [Google Scholar] [CrossRef] [Green Version]
  25. Smith, R.K.; Brickhouse, N.S.; Liedahl, D.A.; Raymond, J.C. Collisional Plasma Models with APEC/APED: Emission-Line Diagnostics of Hydrogen-like and Helium-like Ions. Astrophys. J. 2001, 556, L91–L95. [Google Scholar] [CrossRef] [Green Version]
  26. Lind, K.R.; Blandford, R.D. Semidynamical models of radio jets: Relativistic beaming and source counts. Astrophys. J. 1985, 295, 358–367. [Google Scholar] [CrossRef]
  27. Liu, W.; Sun, M.; Nulsen, P.E.J.; Worrall, D.M.; Birkinshaw, M.; Sarazin, C.; Forman, W.R.; Jones, C.; Ge, C. AGN feedback in the FR II galaxy 3C 220.1. Mon. Not. R. Astron. Soc. 2020, 492, 3156–3168. [Google Scholar] [CrossRef]
  28. Schive, H.Y.; Tsai, Y.C.; Chiueh, T. GAMER: A Graphic Processing Unit Accelerated Adaptive-Mesh-Refinement Code for Astrophysics. Astrophys. J. Suppl. Ser. 2010, 186, 457–484. [Google Scholar] [CrossRef] [Green Version]
  29. Robitaille, T.P. et al. [Astropy Collaboration] Astropy: A community Python package for astronomy. Astron. Astrophys. 2013, 558, A33. [Google Scholar] [CrossRef]
  30. Hunter, J.D. Matplotlib: A 2D graphics environment. Comput. Sci. Eng. 2007, 9, 90–95. [Google Scholar] [CrossRef]
  31. Harris, C.R.; Millman, K.J.; van der Walt, S.J.; Gommers, R.; Virtanen, P.; Cournapeau, D.; Wieser, E.; Taylor, J.; Berg, S.; Smith, N.J.; et al. Array programming with NumPy. Nature 2020, 585, 357–362. [Google Scholar] [CrossRef] [PubMed]
  32. Turk, M.J.; Smith, B.D.; Oishi, J.S.; Skory, S.; Skillman, S.W.; Abel, T.; Norman, M.L. yt: A Multi-code Analysis Toolkit for Astrophysical Simulation Data. Astrophys. J. 2011, 192, 9. [Google Scholar] [CrossRef]
Figure 1. Exposure-corrected Chandra observation of Cygnus A in the 0.5–7 keV band. (Left panel) Entire region containing the shocked ICM, hotspots, X-ray jet, and AGN. (Right panel) Zoom-in (shown in the left panel) of Hotspots D and E, showing in more detail the emission hole surrounding Hotspot E. The contrast in the right panel has been altered for clarity. Reproduced using the same data as [13].
Galaxies 11 00051 g001
Figure 2. Schematic of the simulation setup, showing the ICM and lobe regions divided by a sharp interface tilted with respect to the coordinate axes, along with the trajectory of the jet.
Galaxies 11 00051 g002
Figure 3. Density (left) and pressure (right) slices through the center of the simulation domain for the “fiducial” simulation, at four different epochs. Each panel is 15 kpc on a side, zoomed in slightly to focus on the parts of the simulation most affected by the jet.
Galaxies 11 00051 g003
Figure 4. Velocity magnitude (left) and ratio of specific heats, Γ , (right) on slices through the center of the simulation domain for the “fiducial” simulation, at four different epochs. Each panel is 15 kpc on a side, zoomed in slightly to focus on the parts of the simulation most affected by the jet.
Galaxies 11 00051 g004
Figure 5. Slices through the center of the simulation domain of the four different passive scalar fields for the “fiducial” simulation at four different epochs: “ICM” (top-left panels), “lobe” (top-right panels), “jet” (bottom-left panels), and “interface” (bottom-right panels) Each panel is 15 kpc on a side, zoomed in slightly to focus on the parts of the simulation most affected by the jet.
Galaxies 11 00051 g005
Figure 6. The kinetic and thermal power of the reflected jet in the “fiducial” simulation flowing through a portion of a spherical surface with a radius of 5 kpc, centered on the location where the jet collides with the interface. (Left panels) Slices through the gas density at several epochs, showing the location of the surface in that slice in orange. (Right panel) The power in the ICM, lobe, interface, and jet components flowing through the surface as a function of time.
Galaxies 11 00051 g006
Figure 7. Slices at t = 125 kyr, showing the effect of varying the width of the interface. First row: density, second row: temperature, third row: “ICM” passive scalar, fourth row: “interface” passive scalar. Each panel is 15 kpc on a side, zoomed in slightly to focus on the parts of the simulation most affected by the jet.
Galaxies 11 00051 g007
Figure 8. The power in ICM, lobe, interface, and jet components flowing through the surface (shown in the left panels of Figure 6) as a function of time, for the simulations with varying interface widths w.
Galaxies 11 00051 g008
Figure 9. The appearance of a hole in X-ray emission due to Doppler de-boosting from the reflected jet. (Top panels) Slices through the gas density, pressure, and velocity magnitude at t = 175 kyr, showing the line of sight of the projection in the bottom panels with a red line. (Bottom-left panel) The projected X-ray surface brightness from all components along the chosen sight line, showing a hole of emission surrounding a hotspot. (Bottom-right panel) Profiles taken through the center along the y-axis of the map at x = 0, showing separate IC-CMB and ICM thermal emission, as well as total emission in the hole region and away from the hole.
Galaxies 11 00051 g009
Table 1. Parameters for the “fiducial” simulation.
ParameterValue
ρ ICM , 0 5.66 × 10 26  g cm 3
k T ICM , 0 9.52 keV
ρ lobe , 0 5.66 × 10 32  g cm 3
p 8.6 × 10 10  erg cm 3
w10 pc
ρ jet , 0 5.66 × 10 31  g cm 3
r jet 0.25 kpc
P jet 4.427 × 10 45  erg s 1
θ 25
U s −4.482c
U 0 7.342c
Disclaimer/Publisher’s Note: The statements, opinions and data contained in all publications are solely those of the individual author(s) and contributor(s) and not of MDPI and/or the editor(s). MDPI and/or the editor(s) disclaim responsibility for any injury to people or property resulting from any ideas, methods, instructions or products referred to in the content.

