Article

HINOTORI and Its Perspectives in the Black-Hole Jet Study

1
Graduate School of Sciences and Technology for Innovation, Yamaguchi University, 1677-1 Yoshida, Yamaguchi 753-8512, Yamaguchi, Japan
2
The Research Institute for Time Studies, Yamaguchi University, 1677-1 Yoshida, Yamaguchi 753-8511, Yamaguchi, Japan
3
Amanogawa Galaxy Astronomy Research Center, Graduate School of Science and Engineering, Kagoshima University, 1-21-24 Korimoto, Kagoshima 890-8580, Kagoshima, Japan
4
Center for General Education, Institute for Comprehensive Education, Kagoshima University, 1-21-24 Korimoto, Kagoshima 890-8580, Kagoshima, Japan
5
Graduate School of Science, Osaka Metropolitan University, 1-1 Gakuen-cho, Nakaku, Sakai 599-8531, Osaka, Japan
6
Nobeyama Radio Observatory, National Astronomical Observatory of Japan, 462-2 Nobeyama, Minamimaki, Minamisaku 384-1305, Nagano, Japan
7
Mizusawa VLBI Observatory, National Astronomical Observatory of Japan, 2-12 Hoshigaoka-cho, Mizusawa-ku, Oshu 023-0861, Iwate, Japan
8
Graduate School of Education, Joetsu University of Education, 1 Yamayashiki-machi, Joetsu 943-8512, Niigata, Japan
9
National Astronomical Observatory of Japan, 2-21-1 Osawa, Mitaka 181-8588, Tokyo, Japan
10
Department of Physics and Astronomy, Faculty of Science, Kagoshima University, 1-21-24 Korimoto, Kagoshima 890-8580, Kagoshima, Japan
*
Author to whom correspondence should be addressed.
These authors contributed equally to this work.
Galaxies 2023, 11(1), 30; https://doi.org/10.3390/galaxies11010030
Submission received: 19 December 2022 / Revised: 4 February 2023 / Accepted: 9 February 2023 / Published: 13 February 2023
(This article belongs to the Special Issue Challenges in Understanding Black Hole Powered Jets with VLBI)

Abstract

:
Simultaneous multi-band very long baseline interferometry (VLBI) observations at millimeter wavelengths have huge potential for various science cases. However, there exist difficulties in expanding the scientific targets, as the sensitivity of radio telescopes at millimeter wavelengths is typically lower compared to that at centimeter wavelengths. In order to realize high-sensitivity mm-VLBI observations in the East Asia region, we are promoting the HINOTORI (Hybrid Installation project in NObeyama, Triple-band ORIented) project, which aims to launch the wide-band and simultaneous triple-band (22/43/86 GHz) VLBI system with the Nobeyama 45 m Radio Telescope (NRO45). The simultaneous 22/43 GHz observation mode has already been operated for the open-use program. We have recently completed the performance evaluation of the receiver and observing system at 86 GHz. In addition, a new wide-band VLBI back-end system has been installed on the NRO45 and the performance of this receiving system has been found to be sufficient to meet scientific requirements. Currently, we are performing commissioning observations to establish regular VLBI operation with simultaneous triple-band mode together with the Korean VLBI Network. The participation of the NRO45 is expected to strengthen the mm-VLBI observation network in the East Asia region and to be a very powerful addition with respect to the science of of black hole jets.

1. Introduction

The millimeter wavelengths are a very crucial band for the recent very long baseline interferometry (VLBI) observations, both technically and scientifically. Because VLBI observation at (shorter) millimeter wavelength (mm-VLBI) is able to achieve significantly higher angular resolution, it can provide information on the physical and chemical conditions of molecular gases in the circumstellar environment around evolved stars as well as in the circumnuclear environment around super-massive black-holes (SMBHs) via their emission lines or absorption lines (e.g., [1,2]). Moreover, it allows emissions of the most upstream relativistic jets ejected from SMBHs to be observed by reducing the effect of synchrotron self-absorption [3]. Although the importance of mm-VLBI is scientifically significant, there are a number of difficulties, such as lower sensitivity of receivers and shorter coherence times, compared to centimeter wavelengths. Additionally, extreme objects such as the relativistic jets from SMBHs become fainter at higher frequencies because of their nonthermal emission mechanism.
The Korean VLBI Network (KVN; ref. [4]), operated by the Korea Astronomy and Space Science Institute (KASI), overcomes such difficulties in mm-VLBI observation through the development of a simultaneous multi-band observation system at millimeter wavelengths [5,6], enabling employment of the frequency phase transfer technique (e.g., [7,8,9]). On the other hand, the participation of a large radio telescope with higher sensitivity at mm-wavelengths in the VLBI observation is essential to enhancing the science of mm-VLBI.
The Nobeyama 45 m Radio Telescope (hereinafter referred to as NRO45) [10] is operated by the National Astronomical Observatory of Japan (NAOJ), and is one of the most powerful radio telescopes in the world at millimeter wavelengths. Currently, three main frequency bands, namely, 23 GHz, 43 GHz, and 86–112 GHz (i.e., λ = 13 mm, 7 mm, and ∼3 mm) are available with the NRO45. The NRO45 is available to all astronomers during the winter season (November to May). Historically, the NRO45 has participated in several VLBI sessions, including mm-VLBI observations. Additionally, 86 GHz VLBI observations have been conducted using the baseline between the NRO45 and the TRAO telescope in Korea [11]. The station position of the NRO45 has been regularly measured and confirmed to possess substantial accuracy for VLBI observation. Previously, the NRO45 routinely participated in 13mm and 7mm VLBI observations together with the VLBI Exploration of Radio Astrometry (VERA; ref. [12]) operated by the NAOJ; these were based on VERA open-use observations, KVN, and VERA Array (KaVA; ref. [13]), currently a key station in the framework of the East Asia VLBI Network (EAVN; ref. [14]). Furthermore, the NRO45, as a high sensitivity radio telescope (especially at mm-wavelengths), is expected to play a crucial role in the current framework of EAVN as well as global VLBI experiments.
The HINOTORI (Hybrid Installation project in NObeyama, Triple-band ORIented) project is currently being pursued as a collaborative project aiming to equip the NRO45 with simultaneous triple-band (22/43/86 GHz) single-dish and VLBI observation capabilities, and is led by six universities and institutes: Kagoshima University, Yamaguchi University, Osaka Metropolitan University, Ibaraki University, NAOJ, and KASI.
In the remainder of this paper, we describe the simultaneous triple-band observation system launched by the HINOTORI project in Section 2. Section 3 and Section 4 report performance evaluation results for the 86 GHz receiver refurbished by HINOTORI and the observing system at 86 GHz, respectively. In Section 5, the newly launched VLBI back-end system for simultaneous triple-band VLBI observation is introduced. Finally, in Section 6 we summarize this new observation system and present its scientific merit and prospects, in particular for the study of black hole jet astrophysics.

2. Simultaneous Triple-Band Observation System in the NRO45

Figure 1 shows the schematic diagram of the optics and the placement of receivers in triple-band observation mode for both single-dish and VLBI in the NRO45. We use the 22 GHz band receiver (H22) and 43 GHz band receiver (H40) in the existing system, and either receiver can be selected by changing the combination of the mirrors already mounted at #8 and #9 in Figure 1.
In order to realize a simultaneous triple-band observation mode, 43/86 GHz and 22/43 GHz frequency separation filters (the perforated plate) were developed for HINOTORI [15]. The frequency response characteristics of the 22/43 GHz filter as measured by Okada et al. [16] showed an observable range of 21.8–23.8 GHz and 42.0–44.0 GHz. The frequency response characteristics of the 43/86 GHz filter have been simulated as well, showing an observable frequency range of 82–88 GHz [15]. These filters were installed at #8 (43/86 GHz) and #9 (22/43 GHz), and the 86 GHz band receiver decommissioned by the NRO45 in 2017 was refurbished/relocated.
This allows one or more of the three types of 22/43/86 GHz receivers to be selected for simultaneous observation by changing the combination of Mirror/Filter/Through (the latter meaning that neither the mirror nor the filter is selected) at #8 and #9, as shown in Table 1. A performance evaluation and commissioning of simultaneous 22/43 GHz observation mode has been carried out, and both single-dish and VLBI observation with this mode have been part of the regular operation in the framework of the open-use program [16].

3. Performance of 86-GHz SIS Receiver

In order to establish a triple-band simultaneous observing mode in the NRO45, the 86 GHz receiver with a superconductor–insulator–superconductor (SIS) double-side band (2SB) mixer, which was decommissioned at the NRO45 in 2017, was refurbished and installed. Until its decommissioning this receiver allowed for simultaneous dual-beam observation, and was called the TZ receiver [17]; however, HINOTORI uses only one of the two beams. The block diagram of the refurbished TZ receiver is shown in Figure 2.
Each of the two orthogonal polarizations (horizontal/vertical) of the RF signal is split into the upper-side (USB: 97.654–101.654 GHz) and lower-side (LSB: 85.654–89.654 GHz) bands, then converted to the intermediate frequency (IF) of 4–8 GHz by inputting the local frequency of 93.654 GHz generated by the harmonic mixer (= 6 × 15.609 GHz here, though it is tunable). This signal is further converted to the IF of 2–4 GHz by the “New IF system” developed by the NRO45, as indicated in Figure 2, then input to the digital back-end. In addition, two orthogonal polarizations need to be converted to two circular polarizations (i.e., left- and right-handed circular polarizations) to perform VLBI observations with KVN, as well as with other VLBI stations in the near future, at 86 GHz. Currently, we have prepared two conversion methods: (1) mounting a quarter- λ plate in front of the feed horns and (2) software conversion during the post-correlation procedure.
In this section, we report a performance evaluation of the the receiver noise temperature ( T rx ) and the image rejection ratio (IRR) of the refurbished TZ receiver (86 GHz). The performance of the SIS-mixer drastically changes around the gap bias due to nonlinear I–V characteristics (e.g., [18]). Because the frequency range of the USB signal is outside the frequency response band that passes through the 43/86 filter (#9, shown in Figure 1), we report the results of evaluation on the LSB signal.

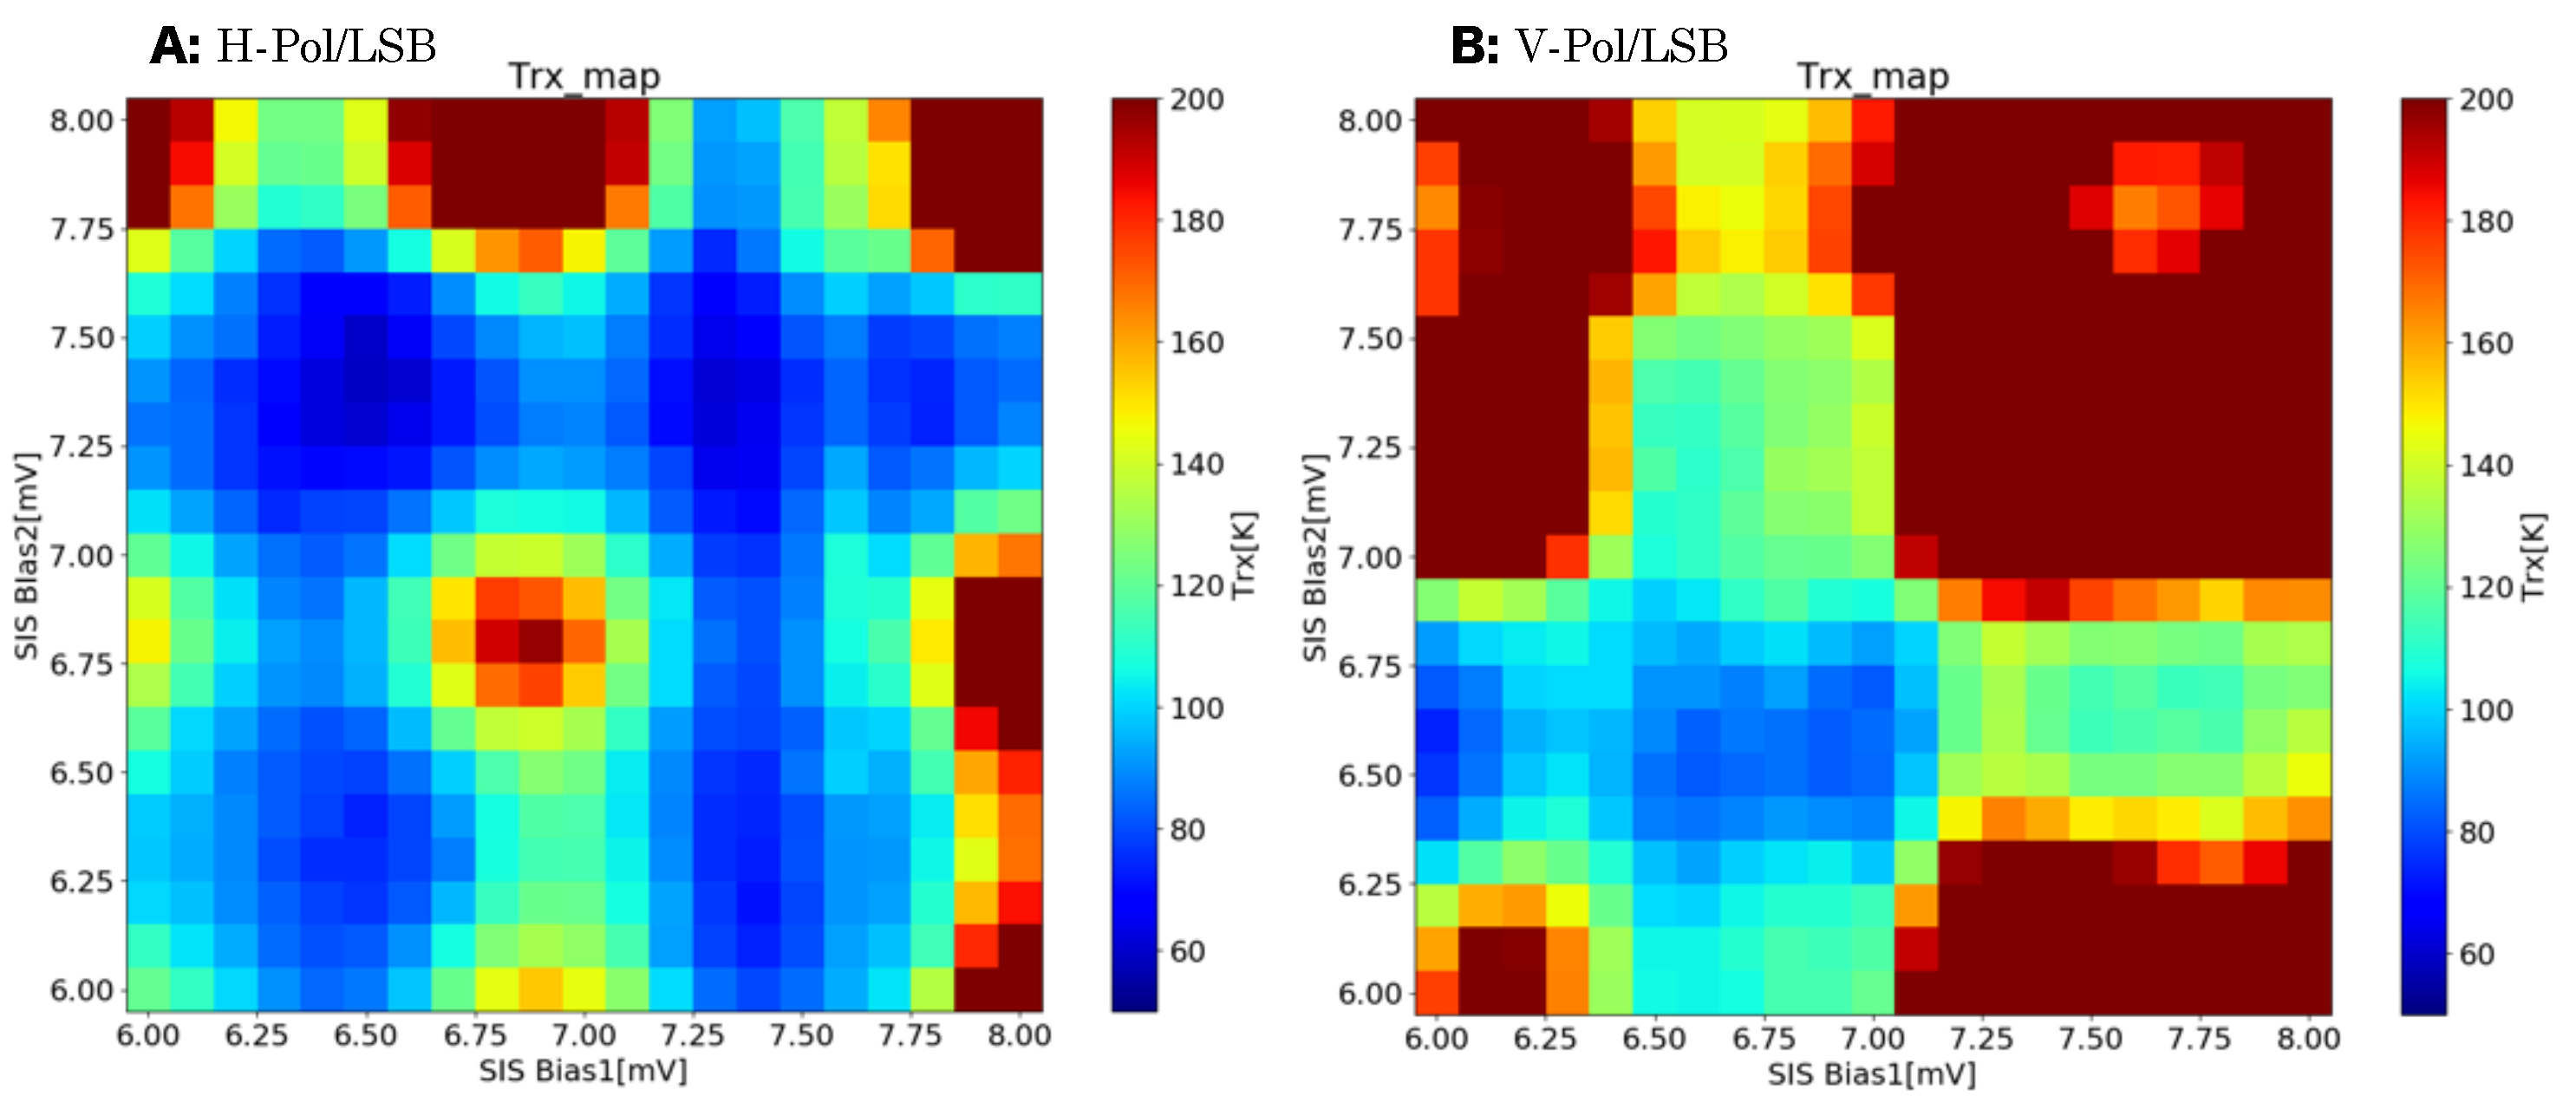
3.1. Measurement of Optimal SIS-Bias and T rx

The TZ receiver uses an SIS mixer, which requires the application of two different SIS-Bias values, one for each of the horizontal and vertical polarizations. The performance of the TZ receiver (mainly its T rx and IRR) is greatly affected by these bias values, making it necessary to find the optimal values that can achieve the highest performance for the receiver.
The results of the search for the optimal bias values of the SIS mixer used in the TZ receiver and the T rx measured at the IF of 4–8 GHz band by the chopper wheel method (Hot: 300 K; Cold: 77 K) are shown in Figure 3. We performed the measurements using a frequency separation filter mounted at #8, as shown in Figure 1, on 20–23 October 2020. In this measurement, the optimal SIS-bias values were searched in the range of 6–8 mV in steps of 0.1 mV; each measurement took 6 seconds, and was repeated for a total of 21 × 21 points.
Figure 3 shows the resulting map of the T rx values obtained without the frequency separation filter for each combination of SIS biases 1 and 2. The optimal bias values are clearly found around the local minima of T rx , showing less than 100 K in these two maps for both horizontal (A) and vertical (B) polarizations. The T rx values at optimal bias measured both without and with the frequency separation filter (Through/Filter) are summarized in Table 2. It can be seen that the difference in T rx without and with the filter is approximately 40 K for both orthogonal polarizations.

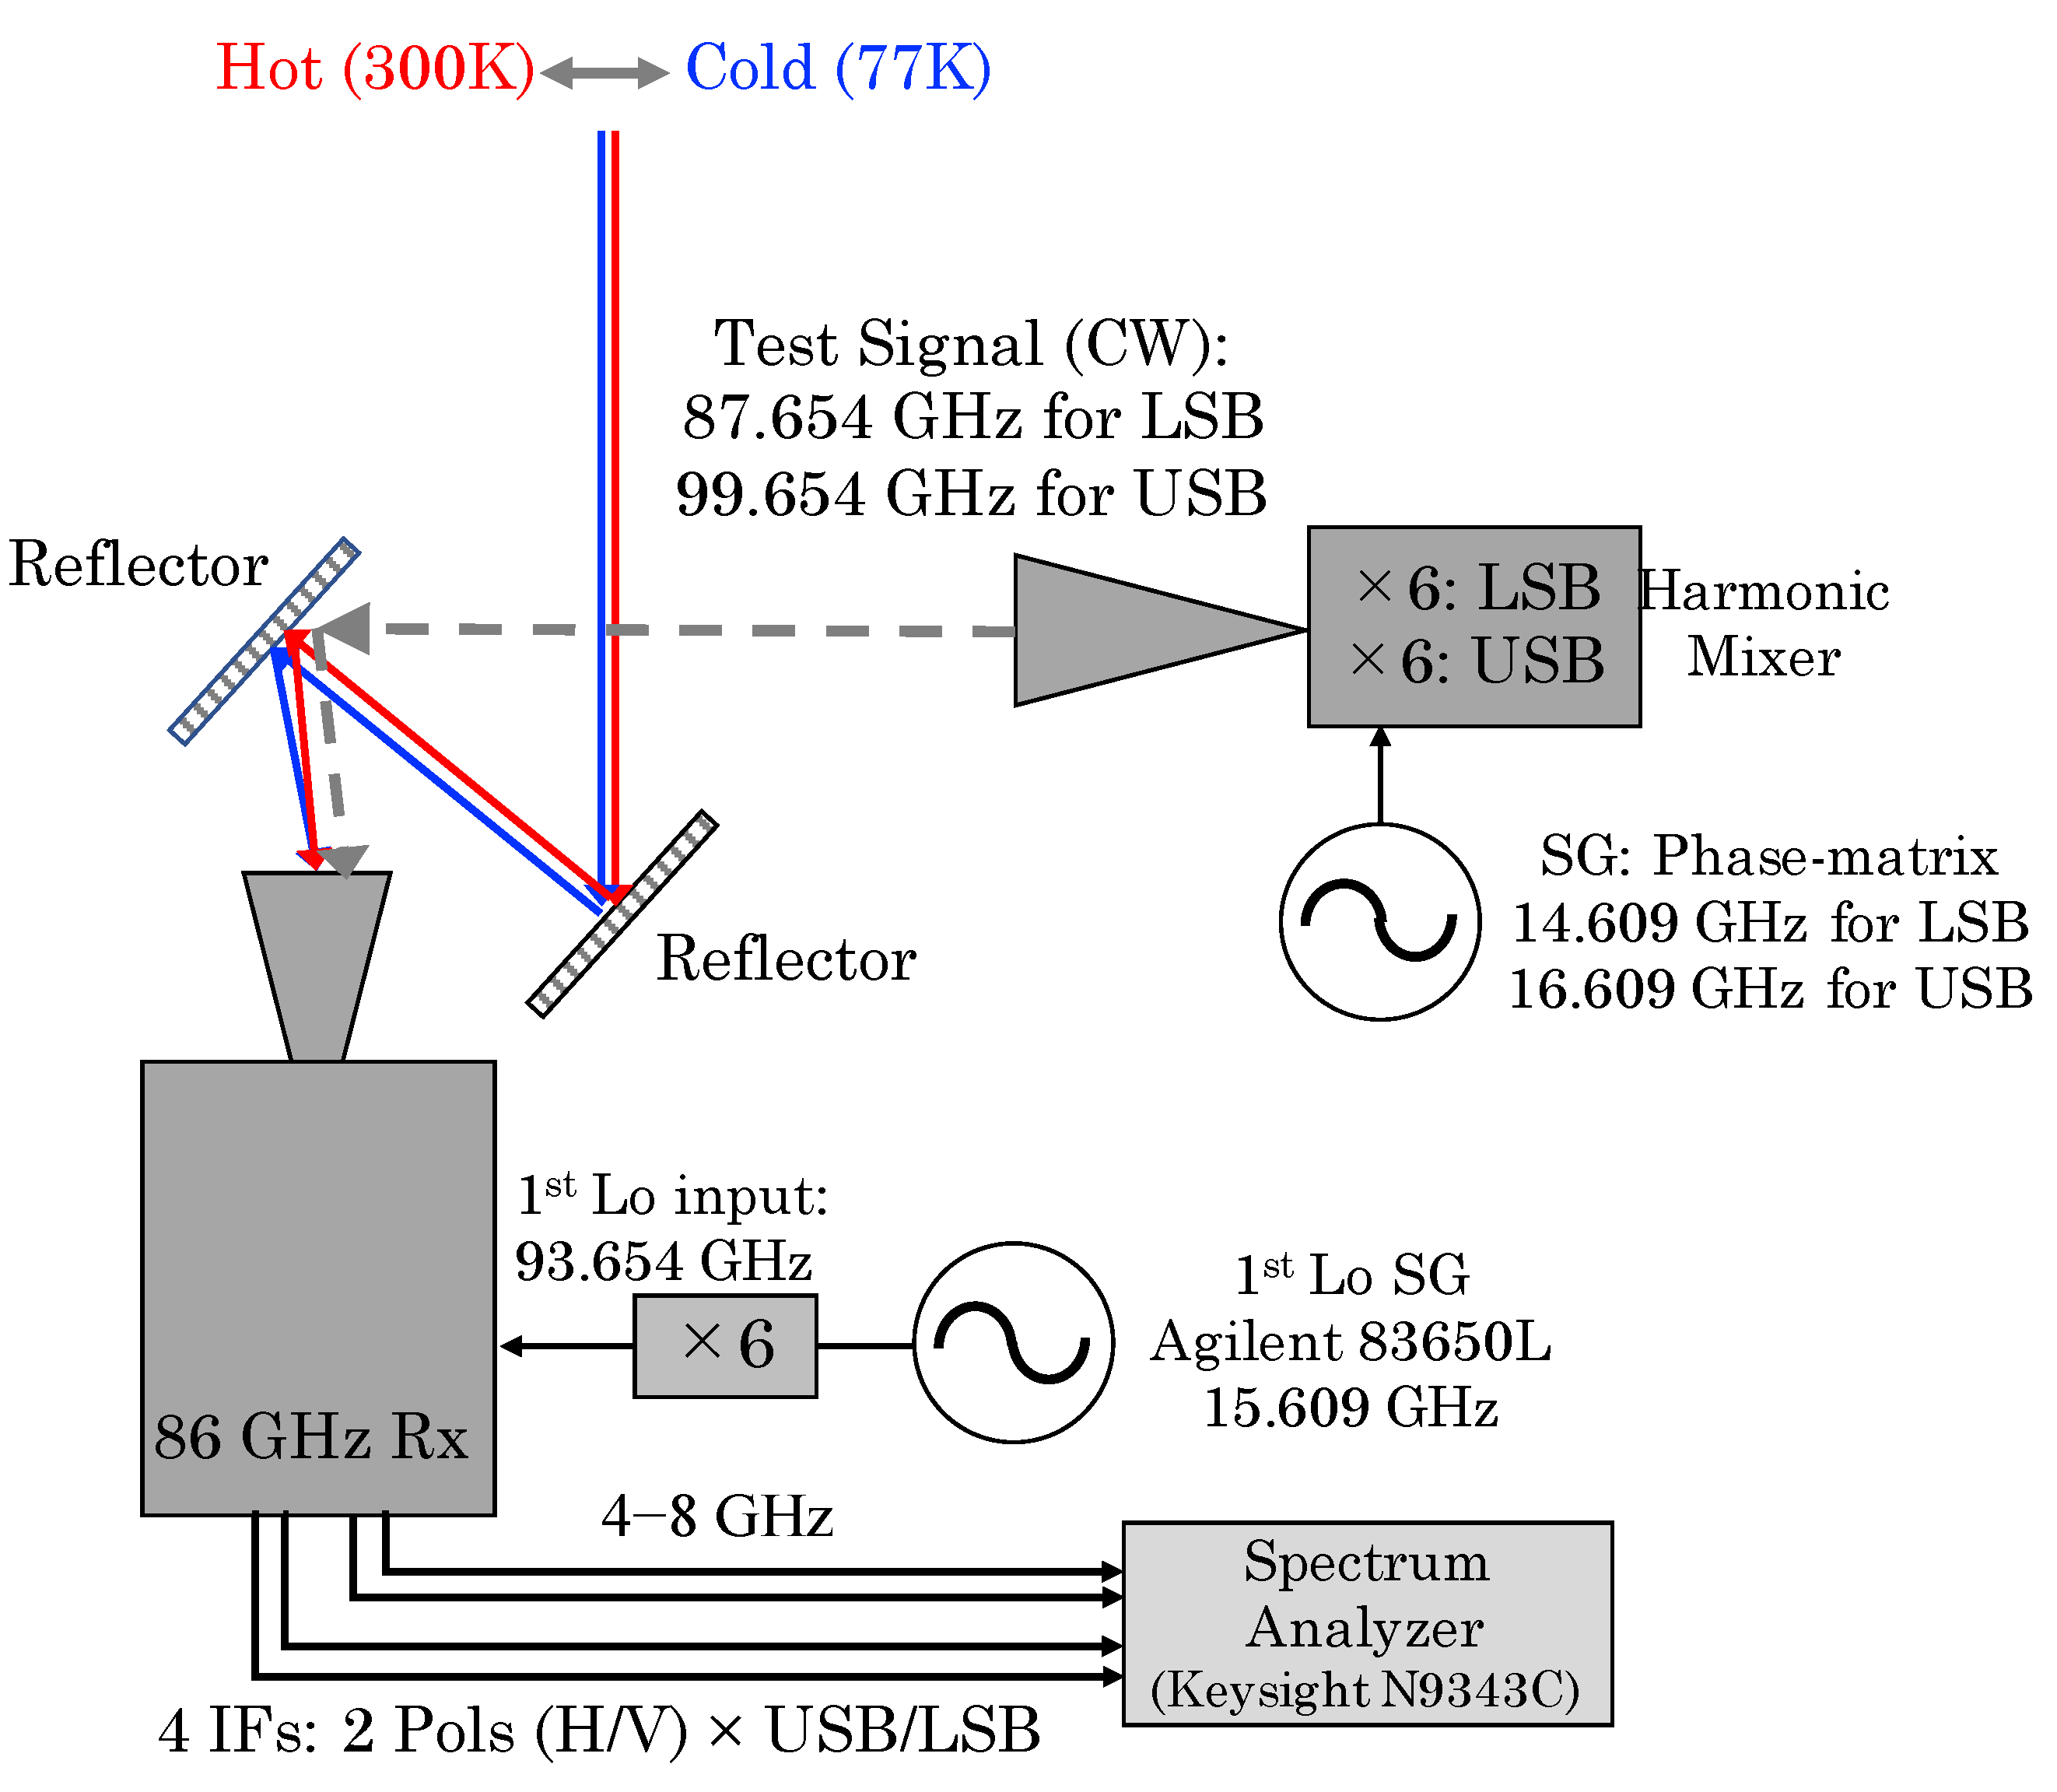
3.2. Measurement of IRR

In the triple-band simultaneous observation mode of the NRO45, the output from the LSB of the TZ receiver is received as an RF signal. This frequency range can be tuned by changing the local signal frequency within the available frequency band characteristics of the frequency separation filter at 43/86 GHz. However, part of the signal input to the LSB in the IF band leaks into the USB, as well as vice versa, due to the characteristics of frequency conversion by the 2SB mixer used in this receiver.
In order to evaluate the performance of the receiver, the IRR is a crucial quantity that indicates the intensity ratio of the incoming correct RF signal to the intensity of the signal leaking in from the opposite-side band. In order to search for the optimal SIS-Bias values at LSB while achieving the IRR of >10 dB which satisfies the scientific requirements of HINOTORI, we measured the IRR on 29 May 2022 using the measurement system shown in Figure 4. Carrier wave (CW) signals at 99.654 GHz and 87.654 GHz were produced via six-fold multiplication of the frequency output from the signal generator and input as the test signals for USB and LSB, respectively. These test signals are frequency-converted to 6 GHz at the IF bandwidth. In this measurement, we performed intensity calibration using the chopper-wheel method. In this measurement, the frequency separation filter mounted at #8 was not used (i.e., measurements were performed in ’Through’ mode).
Referring to the T rx map obtained based on the measurement in Section 3.1, the respective search ranges of the SIS bias for horizontal and vertical polarizations in this measurement were set as shown in Table 3 and using a step size of 0.1 mV. Figure 5 shows the IRR map obtained from the measurement against the combination of 7 × 7 points for SIS-biases 1 and 2 for each polarization. It can be seen that the scientific requirement of IRR > 10 dB is achieved at the measurement points of 84% and 78% in the search range for horizontal and vertical polarizations, respectively.

4. Performance of 86-GHz Observing System

In this section, we report the performance evaluation results of the 86 GHz observation system in the NRO45’s triple-band simultaneous observation mode led by HINOTORI. In order to evaluate the performance of this receiving system, we first measured the beam squint, which is the difference between the pointing centers of the 43 GHz and 86 GHz receivers, then adjusted the position of 86 GHz receiver accordingly. The equation provided in Section 4.1 shows the relationship between a pointing offset and the position offset of the 86 GHz receiver for the NRO45. Then, the beam pattern, main beam efficiency, and antenna aperture efficiency were measured. In addition, the phase stability was measured in order to confirm that the capability of the receiving system is sufficient for conducting VLBI observation at 86 GHz. However, all of the results shown here were obtained for the vertical polarization signal except for the measurement of the phase stability. Further detailed measurements for horizontal polarization are planned.

4.1. Adjustment of the Optimal Receiver Position for the Removal of Beam Squint

The NRO45 is equipped with a number of receivers in the receiver cabin; the positions of the feed horns for each receiver where the RF signals collected by the main reflector can reach, their paths, the number of mirrors along the route, and their reflection angles are all different. Therefore, it is necessary to measure the misalignment of the optical axis for each receiving system and adjust the position of the receiver. In the NRO45, because the H40 receiver of the 43 GHz receiving system used in HINOTORI is aligned with the optical axis, it is possible remove the beam squint by adjusting the receiver position of the 86 GHz receiving system such that the pointing direction of the system is aligned with that of the 43 GHz receiving system. Therefore, we measured the pointing deviations ( d A z , d E l ) in arc-seconds in the directions of both the azimuth ( A z ) and elevation ( E l ), then adjusted the position of the 86 GHz receiver. The difference between the optical axis and the position of 86 GHz receiver ( d X , d Y ) in mm is defined by following equation:
d X d Y = 1.24 × cos ( E l + 30 ) sin ( E l + 30 ) sin ( E l + 30 ) cos ( E l + 30 ) d A z d E l
Table 4 shows a summary of these observations, including the date and the system noise temperature ( T sys ) at the time the observation was performed, together with the results after adjustment of the optical axis. This measurement was made by cross-scan observation of the SiO maser sources (spectroscopic observation). Figure 6 shows the pointing variation for both the 43 GHz and 86 GHz observation systems during measurements with triple-band simultaneous observation mode; for this measurement, the frequency separation filters were mounted at #8 and #9.
The beam squint measured after adjustment of the TZ receiver position is sufficiently small compared to the beam size of the 86 GHz receiving system of the NRO45 (see Section 4.2), which achieves the science requirement.

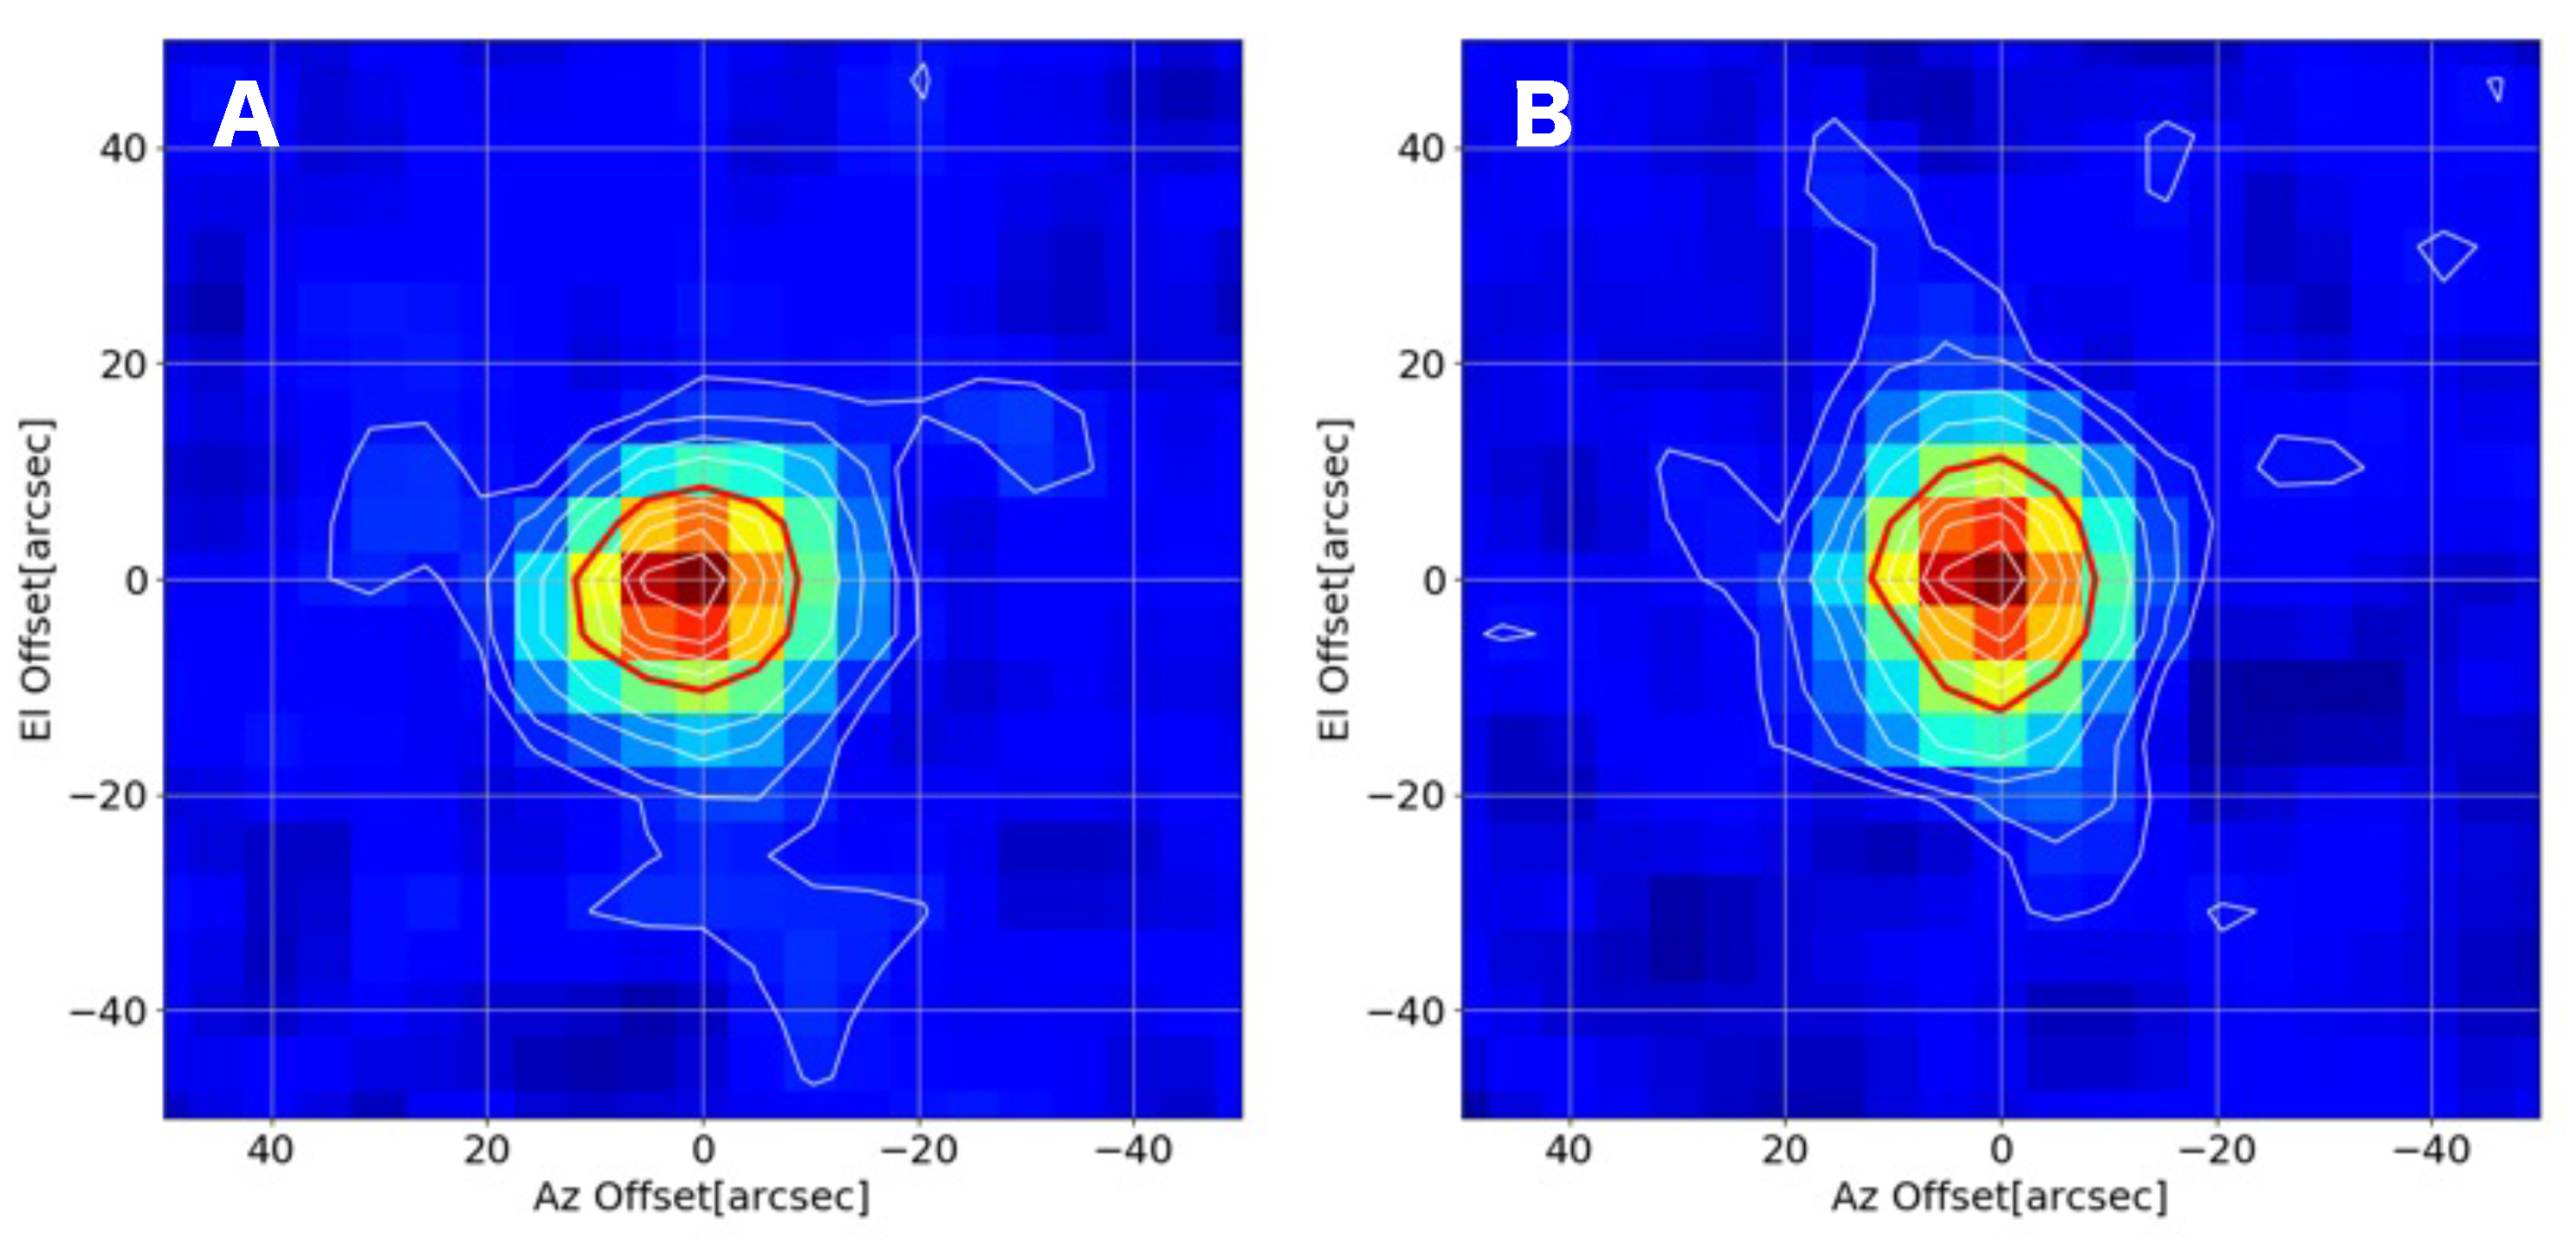
4.2. Measurement of Beam Pattern, Main Beam, and Antenna Aperture Efficiencies

We measured the beam pattern by performing on-the-fly (OTF) mapping observations of the 86 GHz SiO maser sources on 24 June 2020. A summary of the measurement observations is shown in Table 5, along with the beam sizes in the A z and E l directions, while the beam shapes obtained with and without the frequency separation filter are indicated in Figure 7. The average beam size with and without the filter was obtained from the results shown in Table 5 as 19.0 ± 1.6 ″ and 20.7 ± 1.6 ″, respectively. The results of this measurement show that the filter causes a difference in the beam size of approximately 1″.
Measurements of the main beam efficiency ( η mb ) and antenna aperture efficiency ( η a ) were performed using cross-scan observations for Mars (continuum observation). We conducted these measurements without the frequency separation filter on 8 December 2019 and with the filter on 30 June 2020. The observation summary and results for each measurement are shown in Table 6. For both η mb and η a , the values obtained with the filter were about 8–11% lower than those without the filter. However, when taking measurement error into account it can be concluded that no significant differences are seen between the measurements with and without the filter.
The results of the performance evaluation of the 86-GHz receiving system used for HINOTORI show that η mb , η a , and beam pattern were not significantly different from those of the system previously used in the open-use NRO45 program.1 As such, we can conclude that he system has sufficient performance for scientific observations with the triple-band simultaneous observation mode using the frequency separation filter.

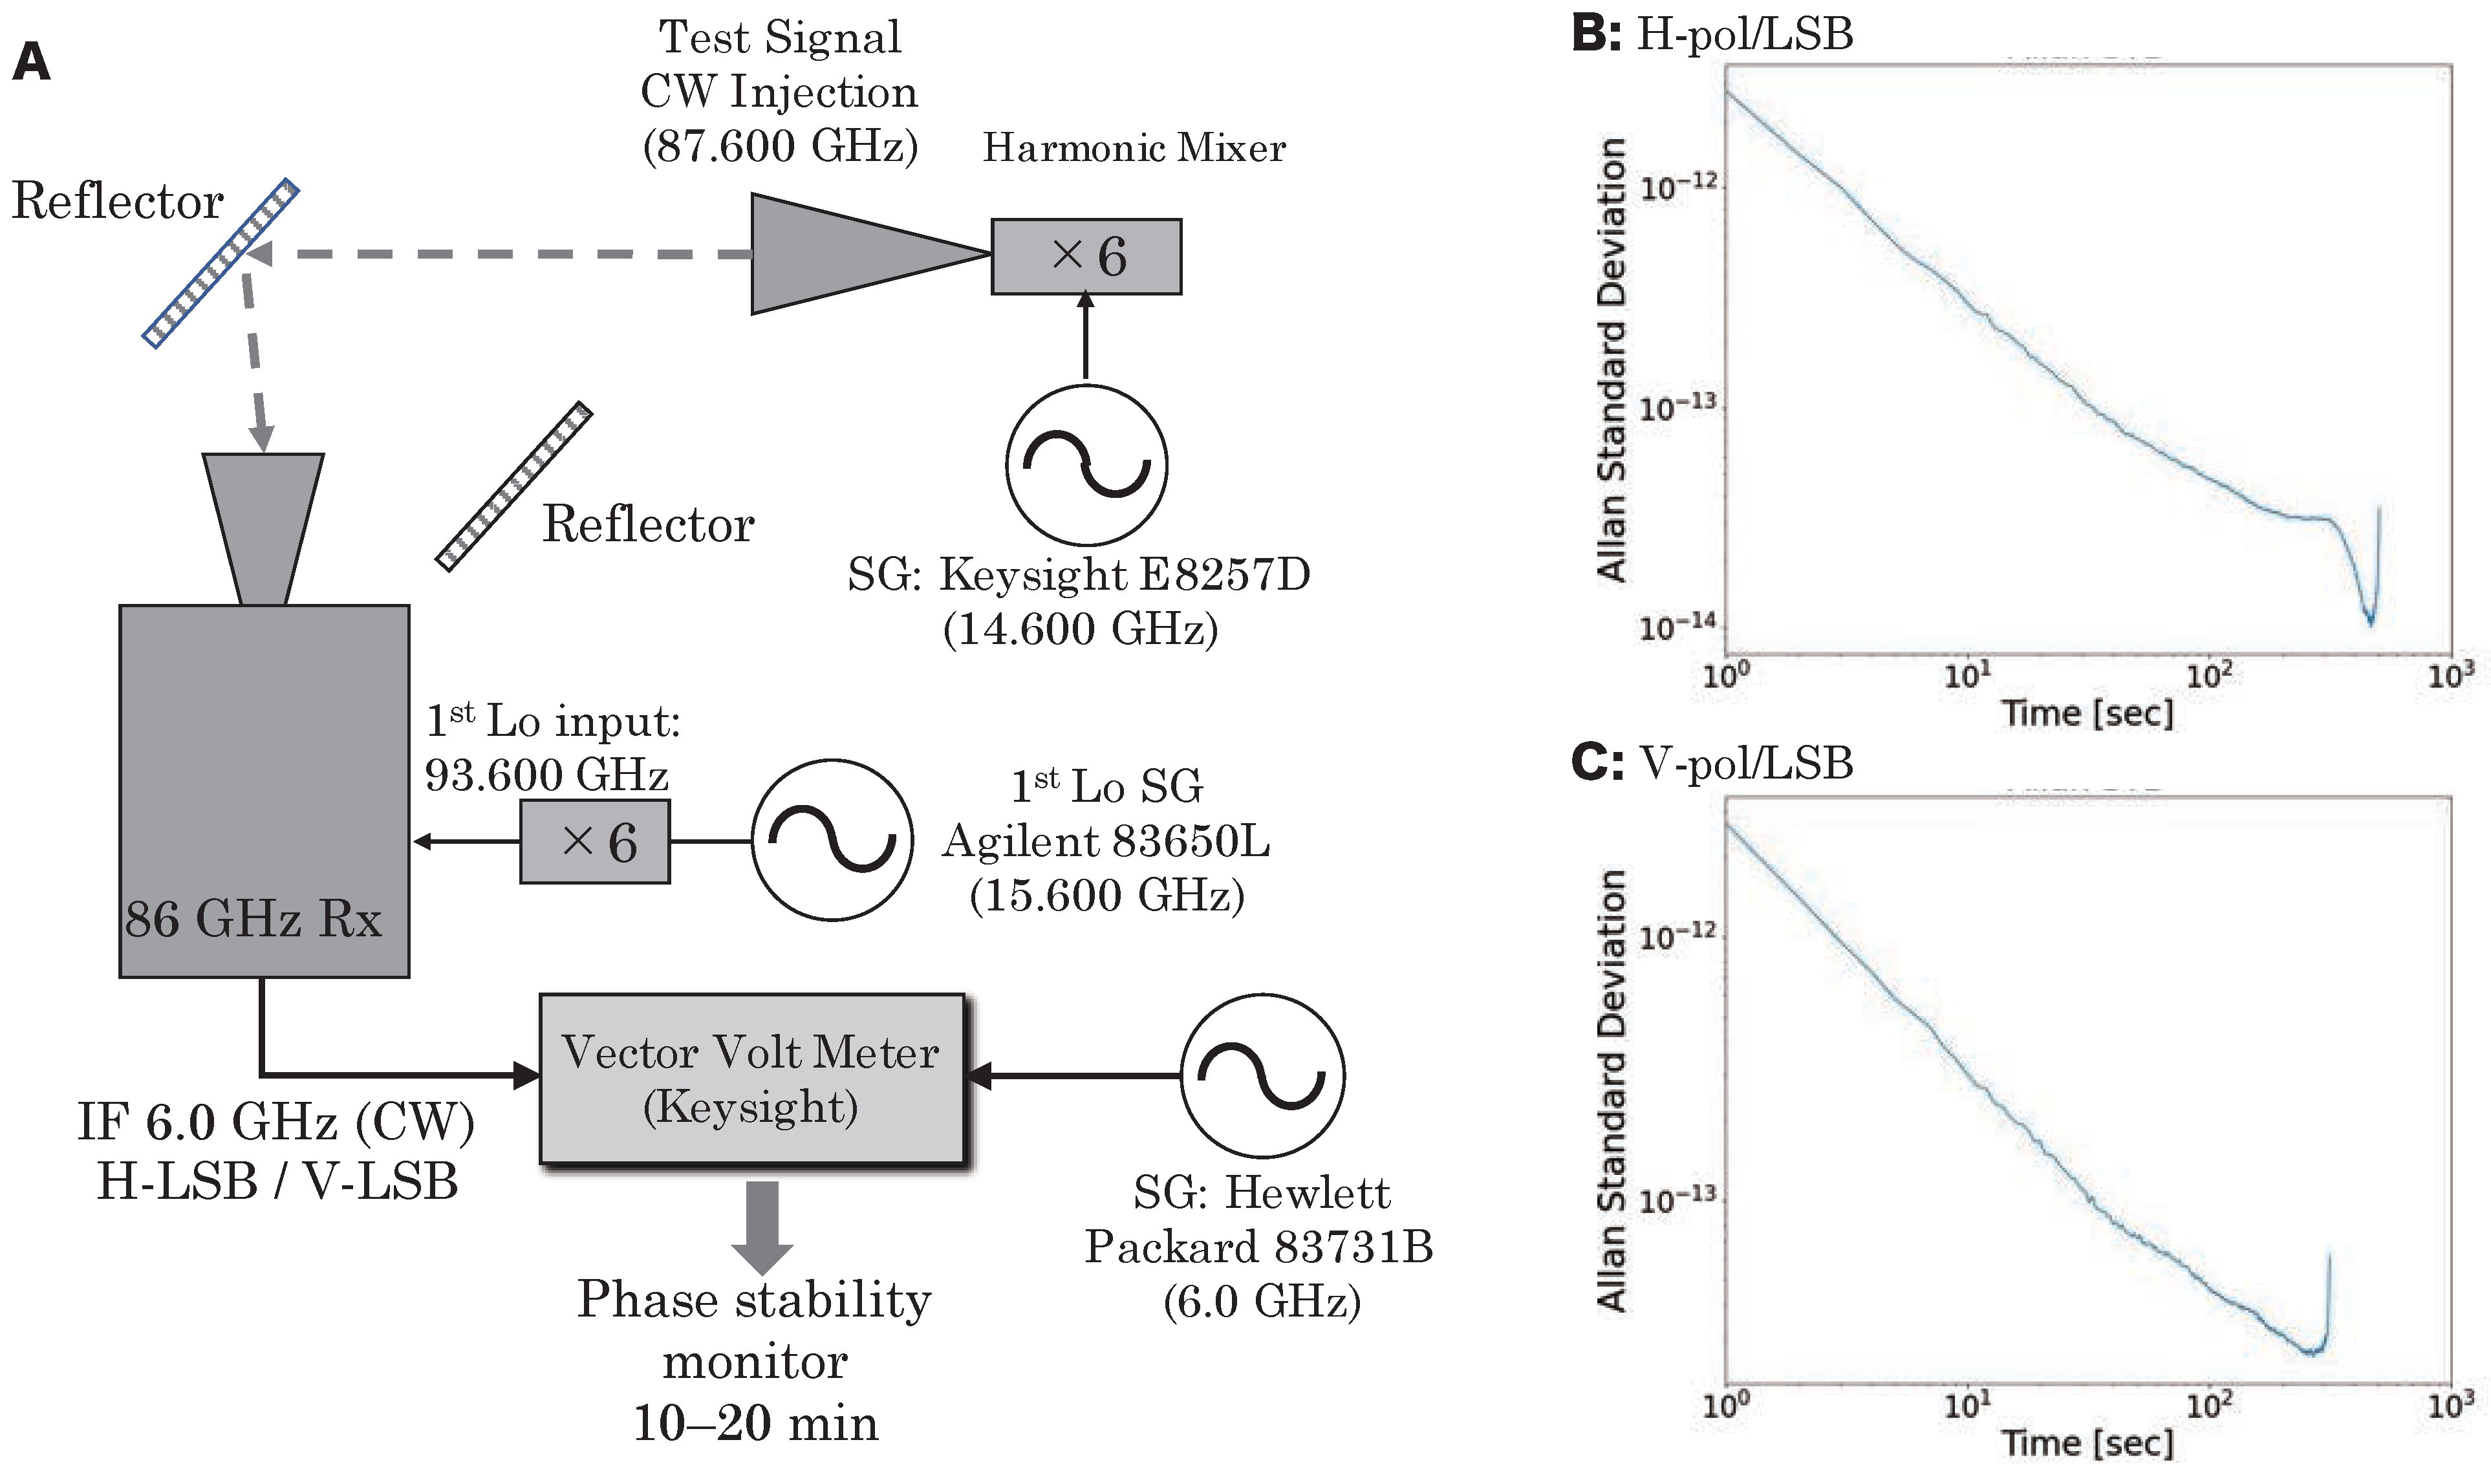
4.3. Phase Stability of 86 GHz Observing System for VLBI Observation

The phase stability of the receiving system is one of the most important performance measures in determining whether VLBI observation is possible with this system. In order to evaluate the phase stability of the 86-GHz receiving system, monitoring of the phase between the IF signal and the standard signal for both polarizations was conducted on 31 March 2020 using the measurement system shown in Figure 8A; the Allan standard deviation (ASD) was calculated as well (Figure 8B,C). In the measurement of the phase stability of this receiving system, high-precision signal generators were used for both signal input to receiving system and the standard signal compared with the IF-signal.
The ASD calculated from the monitored phase for both horizontal and vertical polarization signals continued to decrease over several hundreds of seconds, eventually reaching around 10 14 . This result suggests that the phase of the receiving system is sufficiently stable with respect to the phase of the signal output from the high-precision signal generator. Considering that the typical coherence of the zenith atmosphere in short (millimeter-length) wavelengths is a few tens of seconds (e.g., [19]), we can conclude that the phase stability of the receiving system shows sufficient performance for 86-GHz VLBI observation.

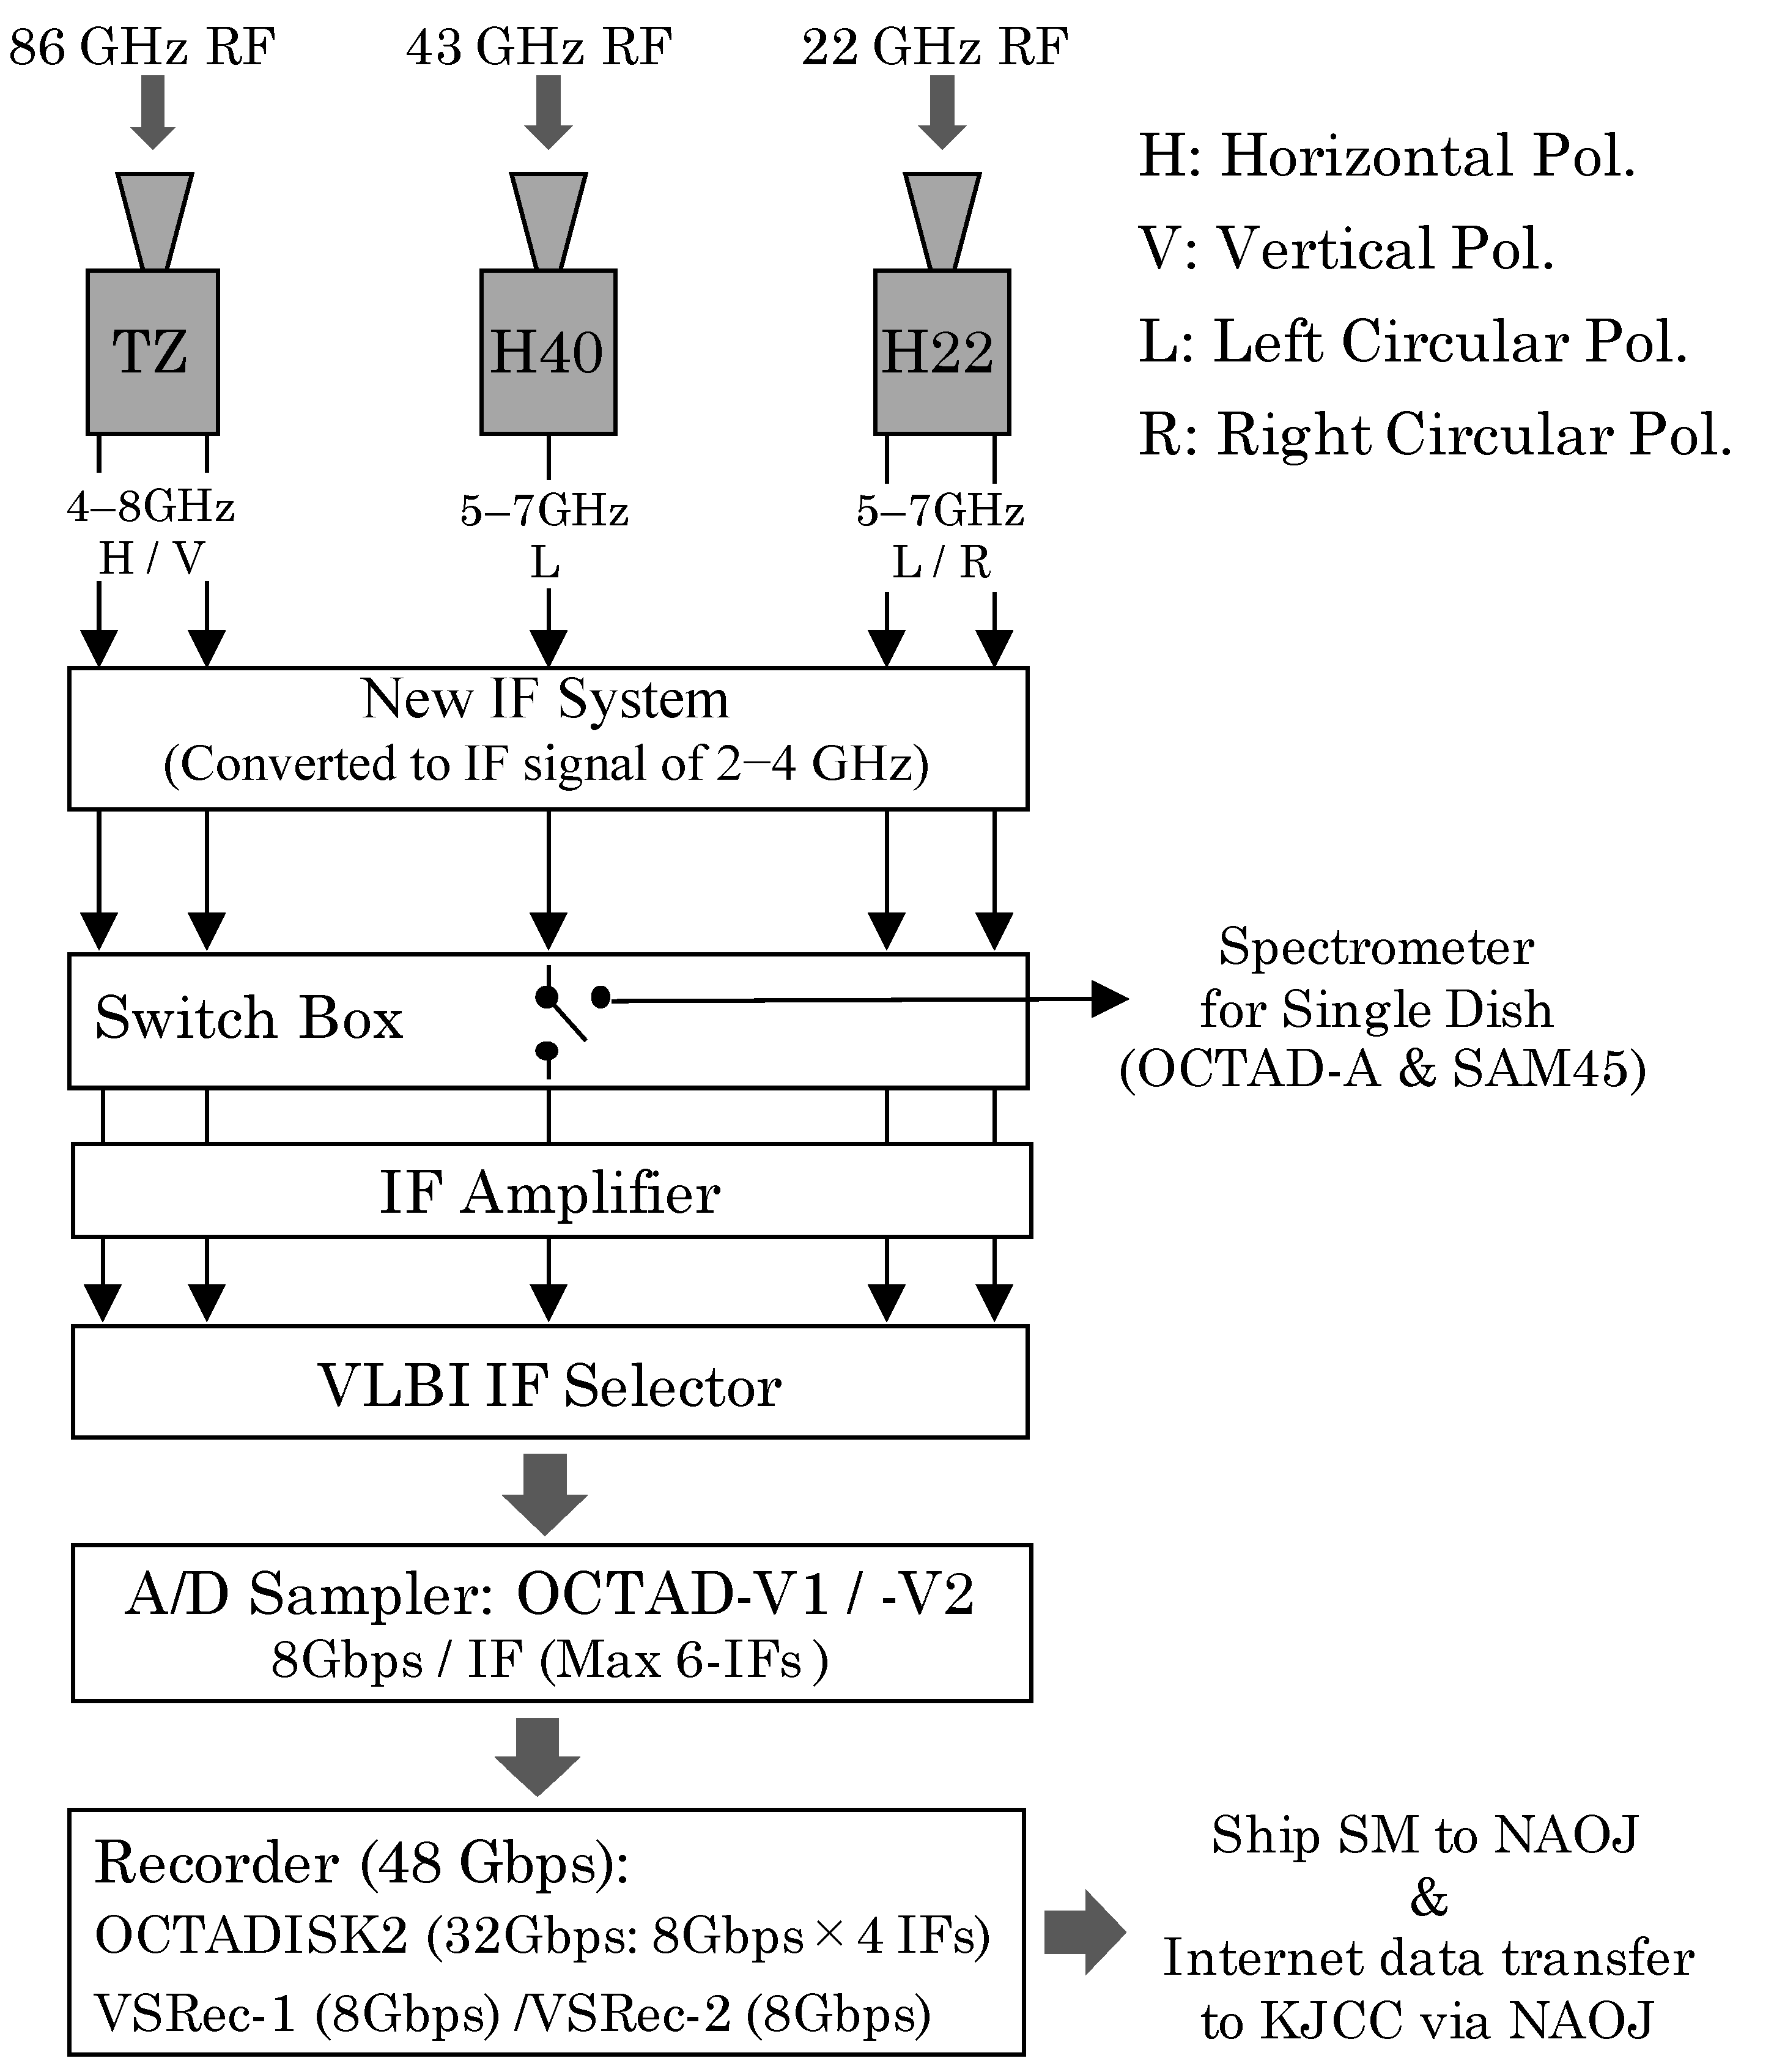
5. VLBI Back-End System for Triple-Band Simultaneous Observation

Figure 9 shows the system block diagram after the receivers. A total of five analog IF signals are provided, including the IF signals of 5–7 GHz band for the left and right circular polarization outputs from the H22 receiver, the 5–7 GHz band for the left circular polarization output from the H40 receiver, and the 4–8 GHz band for the outputs of the two orthogonal polarizations from the TZ receiver. After the IF signals are converted to 2–4GHz band outputs from the “New IF system”, they pass the switch box. The switch box can select the output direction, choosing between the HINOTORI VLBI data acquisition system (HINOTORI DAS) and the single-dish backend. The IF signals to the HINOTORI DAS pass through the IF amplifier and IF selector, are digitally sampled with OCTAD [20], then finally recorded using a high-speed broadband data recording system called OCTADISK2 developed by Elecs Industry Co., Ltd.2 and VDIF Software Recorder (VSREC) developed by Mizusawa VLBI Observatory, NAOJ.
The analog-to-digital (A/D) sampler consists of two OCTAD systems. Because each OCTAD allows 24-Gbps sampling (=8 Gbps/IF × 3 inputs) to be conducted, HINOTORI DAS has the ability to sample up to 48 Gbps (=8 Gbps/IF × 6 inputs or 2 GHz bandwidth/IF × 6 inputs). The recording system consists of OCTADISK2 and two units of VSREC. Because OCTADISK2 allows for recording of up to 32 Gbps (=8 Gbps × 4 inputs), and each VSREC can record up to 8 Gbps, a total of 48 Gbps for simultaneous recording is provided by this system. In other words, it is possible to record all analog output from the current receiving systems of the triple-band simultaneous observation mode installed in the NRO45. Furthermore, with the current 43-GHz receiving system using the H40 receiver (which can receive only left-circular polarization), even if dual-polarization observation becomes available in the future this new back-end system has the ability to handle all of the data output by the three receiving systems. The data correlation procedure is to be performed by the Daejeong Hardware Correlator, located at the Korea–Japan Correlation Center (KJCC) at KASI, after the storage module (SM) of the OCTADISK2/VSREC storing the NRO45 data is shipped to Mizusawa VLBI Observatory; the data will then be transferred to KJCC via the internet.
Here, we have performed the commissioning of the NRO45 VLBI system by carrying out VLBI test observations at 22/43/86 GHz for realizing the regular operation of simultaneous triple-band VLBI with the baselines between the NRO45 and KVN stations. In addition, although the priority is currently on launching a wide-band VLBI observation mode, we have plans to launch a narrow-band VLBI observation mode, which has not been tested at this time because OCTAD is equipped with a digital base band converter (DBBC). Data conversion from linear to circular polarizations is another issue for 3 mm-VLBI, and will be conducted via software after data correlation or OCTAD in real time.

6. Future Prospects

The HINOTORI project aims to launch the simultaneous triple-band observation mode at mm wavelengths and a VLBI observation system using this mode in the NRO45. To date, the launch of the simultaneous 22/43/86 GHz receiving system has been completed. In November 2019, the simultaneous triple-band test observation with the NRO45 single dish was performed for a 22 GHz water maser and 43/86 GHz SiO masers emitted from the evolved star R Cassiopeia, and all of maser lines were successfully detected simultaneously3. In order to realize regular VLBI operation with this mode in the framework of EAVN, including KVN-NRO45 baselines, as soon as possible, we plan to continue VLBI test observations.
The NRO45 is one of the highest-sensitivity radio telescopes, especially at mm-wavelengths, and its location in the world is quite unique. Therefore, the NRO45 is expected to play a crucial role in both the current framework of the EAVN and in the future East Asia 3-mm VLBI Network (see Figure 10) involving the Greenland Telescope (GLT) operated by the Academia Sinica Institute of Astronomy and Astrophysics (ASIAA) and the James Clerk Maxwell Telescope (JCMT) operated by the East Asia Observatory (EAO). KVN has been able to realize regular operation of simultaneous multi-frequency VLBI observation at millimeter wavelengths, promoting a variety of unique research. However, the performance and accuracy of amplitude calibration and angular resolution in VLBI observations are quite limited, as the array consists of only three antennas and the baseline lengths are several hundred kilometers. Therefore, the scientific benefits of realizing simultaneous multi-frequency VLBI observations with the NRO45 should be significant. Furthermore, if the 3 mm VLBI Network consisting of KVN+NRO45 array, JCMT, and GLT is realized in the East Asia region, this will allow high-sensitivity imaging observations to be conducted with very high angular resolution thanks to baselines of several thousands of kilometers. Figure 11 shows uv-coverages and synthesized beams achieved by the KVN+NRO45 array (panels A and B) and KVN+NRO45+GLT+JCMT array (panels C and D) at 86 GHz.
The simultaneous triple-band VLBI observation with the KVN+NRO45 array can promote unique scientific cases from the perspective of sensitivity, frequencies, baseline, etc. For example, this array achieves a longer baseline of >1000 km in the east–west direction. Therefore, VLBI observation with this array at 86 GHz can achieve an angular resolution of 0.4 milli-arcsecond (mas), corresponding to <100 Schwarzschild radii ( R s ) for M87 along its de-projected jet direction. Here, we have assumed that the mass of the SMBH is M BH = 6.5 × 10 9 M [21], its distance from us is D = 16.7 Mpc , and the jet viewing angle is θ = 35 . In fact, the uv-coverage obtained by KVN+NRO45 is essential for studying the velocity field of the relativistic jet ejected from M87 (e.g., [22,23,24]), as shown in Figure 11A,B. Furthermore, the accuracy of amplitude calibration can be highly improved by utilizing the better visibility obtained with four stations and six baselines. Additionally, because the VLBI operation system between Japan and Korea is maturing through the operation of KaVA, which performs VLBI observations year-round, a high-cadence VLBI imaging monitor with simultaneous multi-frequency mode is expected to become available. These capabilities, especially for the relativistic jet of M87, will allow a wide range of velocity fields to be accurately measured, from the vicinity of the SMBH (< 100 R s ) to well downstream of the relativistic jet (several thousands of R s ).
We note that the frequency band of 86 GHz is crucial, allowing us to see the emissions from upstream of the jet, as it avoids the effect of opacity structure (e.g., [3]) and can achieve a higher angular resolution. This transparency, along with the very high angular resolution of approximately a hundred micro-arcseconds ( μ as) achieved by the East Asia 86 GHz VLBI observations with the array consisting of KVN+NRO45+JCMT+GLT (shown in Figure 11D), result in a promising level of ability to investigate the vicinity of the SMBH, both for M87 and for high-energy (HE) blazars more generally. The upstream area of the relativistic jet in HE blazars is thought to be a key site for revealing the production mechanism of HE emissions. Because the jet emission at higher frequencies coming from the upstream end is expected to be optically thin against the synchrotron photons, there is a possibility that our understanding of the HE emission mechanism can be improved. For one of the most nearby TeV blazars, Markarian 421 ( z = 0.031 ), 100 μ as corresponds to 0.062 pc, which in turn corresponds to a linear distance of 1.8 × 10 3 R s and de-projected distance of 2.1 × 10 4 R s (under the assumption of an SMBH mass of M BH 3.6 × 10 8 M sun [25] and jet viewing angle of θ = 5 ). It is well known that radio emissions from HE blazars, including Markarian 421, are typically faint at mm wavelengths; compared to other types of blazars, there are only a few cases in which VLBI observation of HE blazars has been performed. Therefore, rthe participation of NRO45 is essential for realizing high-sensitivity VLBI observations at 3 mm.
Furthermore, this simultaneous multi-frequency observation mode enables the detection of much fainter sources, even for the NRO45 baselines at 86 GHz, by the band-to-band phase transfer technique (e.g., [7,8,9]). Therefore, in addition to VLBI observation at 86 GHz, HINOTORI can enhance various other VLBI science cases in the East Asia region.

Author Contributions

The corresponding author (K.N. (Kotaro Niinuma)) wrote the manuscript. H.I. and K.N. (Kotaro Niinuma) led the HINOTORI project as PI and Co-I, respectively. T.T., R.A., Y.S., H.O., T.A., S.S.-S., and K.N. (Keisuke Nakashima) led the installation and established the triple-band receiving system. T.O. led the establishment of the digital backend system. A.N., C.M., and H.K. supported all measurements and developments related to the HINOTORI project. All authors have read and agreed to the published version of the manuscript.

Funding

This work was funded by JSPS Grants-in Aid for Scientific Research (KAKENHI) (A) 16H02167 (H.I.), 18H03721 (K.Niinuma), and 21H04524 (H.I.).

Data Availability Statement

The data presented in this study are available on request from the corresponding author. The data are not publicly available because this data were obtained for the purpose of performance evaluation and is not in a format that can be analyzed by general-purpose software.

Acknowledgments

We thank all the staff of the Nobeyama Radio Observatory, the Mizusawa VLBI Observatory of National Astronomical Observatory of Japan (NAOJ), and the Korean VLBI Network (KVN) group of the Korea Astronomy and Space Science Institute (KASI), who have kindly supported this project.

Conflicts of Interest

The authors declare no conflict of interest.

Notes

1
For example, the results correspond to the TZ2 information described in the measured performance list as of 2016; see https://www.nro.nao.ac.jp/%7Enro45mrt/html/prop/eff/eff2015.html (10 February 2023).
2
3

References

  1. Yang, H.; Cho, S.-H.; Yun, Y.; Yoon, D.H.; Kim, D.J.; Kim, H.; Yoon, S.C.; Dodson, R.; Rioja, M.J.; Imai, H. Asymmetric distributions of H2O and SiO masers towards V627 Cas. Mon. Not. R. Astron. Soc. 2020, 495, 1284. [Google Scholar] [CrossRef]
  2. Sawada-Satoh, S.; Byun, D.-Y.; Lee, S.-S.; Oh, S.J.; Roh, D.G.; Kameno, S.; Yeom, J.H.; Jung, D.K.; Oh, C.; Kim, H.R.; et al. A Broad HCO+ Absorption Line Associated with the Circumnuclear Torus of NGC 1052. Astrophys. J. Lett. 2019, 872, L21. [Google Scholar] [CrossRef]
  3. Hada, K.; Doi, A.; Kino, M.; Nagai, H.; Hagiwara, Y.; Kawaguchi, N. An origin of the radio jet in M87 at the location of the central black hole. Nature 2011, 477, 185. [Google Scholar] [CrossRef]
  4. Lee, S.-S.; Petrov, L.; Byun, D.-Y.; Kim, J.; Jung, T.; Song, M.G.; Oh, C.S.; Roh, D.G.; Je, D.H.; Wi, S.O.; et al. Early Science with the Korean VLBI Network: Evaluation of System Performance. Astron. J. 2014, 147, 77. [Google Scholar] [CrossRef]
  5. Han, S.-T.; Lee, J.-W.; Kang, J.; Je, D.H.; Chung, M.H.; Wi, S.O.; Sasao, T.; Wylde, R. Millimeter-wave Receiver Optics for Korean VLBI Network. Int. J. Infrared Millim. Waves 2008, 29, 69–78. [Google Scholar] [CrossRef]
  6. Han, S.-T.; Lee, J.-W.; Kang, J.; Oh, C.S.; Byun, D.Y.; Je, D.H.; Chung, M.H.; Wi, S.O.; Song, M.; Kang, Y.W.; et al. Korean VLBI Network Receiver Optics for Simultaneous Multifrequency Observation: Evaluation. Publ. Astron. Soc. Pac. 2013, 125, 539–547. [Google Scholar] [CrossRef]
  7. Rioja, M.; Dodson, R. High-precision Astrometric Millimeter Very Long Baseline Interferometry Using a New Method for Atmospheric Calibration. Astron. J. 2011, 141, 114. [Google Scholar] [CrossRef]
  8. Algaba, J.-C.; Zhao, G.-Y.; Lee, S.-S.; Byun, D.Y.; Kang, S.C.; Kim, D.W.; Kim, J.Y.; Kim, J.S.; Kim, S.W.; Kino, M.; et al. Interferometric Monitoring of Gamma–ray Bright Active Galactic Nuclei II: Frequency Phase Transfer. J. Korean Astron. Soc. 2015, 48, 237. [Google Scholar] [CrossRef]
  9. Zhao, G.-Y.; Algaba, J.C.; Lee, S.S.; Jung, T.; Dodson, R.; Rioja, M.; Byun, D.Y.; Hodgson, J.; Kang, S.; Kim, D.W.; et al. The Power of Simultaneous Multi-frequency Observations for mm-VLBI: Beyond Frequency Phase Transfer. Astron. J. 2018, 155, 26. [Google Scholar] [CrossRef]
  10. Akabane, K. A large millimeter wave antenna. Int. J. Infrared Milli. Waves 1983, 4, 793. [Google Scholar] [CrossRef]
  11. Shibata, K.M.; Chung, H.-S.; Kameno, S.; Roh, D.G.; Umemoto, T.; Kim, K.D.; Asada, K.; Han, S.T.; Mochizuki, N.; Cho, S.H.; et al. First mm-VLBI Observations between the TRAO 14-m and the NRO 45-m Telescopes: Observations of 86 GHz SiO Masers in VY Canis Majoris. Publ. Astron. Soc. Jpn. 2004, 56, 475–480. [Google Scholar] [CrossRef]
  12. Kobayashi, H.; Sasao, T.; Kawaguchi, N.; Manabe, S.; Omodaka, T.; Kameya, O.; Shibata, K.M.; Miyaji, T.; Honma, M.; Tamura, Y.; et al. VERA: A New VLBI Instrument Free from the Atmosphere. In New Technologies in VLBI, Proceedings of a Symposium of the International VLBI Service for Geodesy and Astrometry, Gyeong-ju, Republic of Korea, 5–8 November 2002; Astronomical Society of the Pacific Conference Series; Astronomical Society of the Pacific: San Francisco, CA, USA, 2003; Volume 306, pp. 367–371. [Google Scholar]
  13. Niinuma, K.; Lee, S.-S.; Kino, M.; Sohn, B.W.; Akiyama, K.; Zhao, G.Y.; Sawada-Satoh, S.; Trippe, S.; Hada, K.; Jung, T.; et al. VLBI observations of bright AGN jets with the KVN and VERA Array (KaVA): Evaluation of imaging capability. Publ. Astron. Soc. Jpn. 2014, 66, 103. [Google Scholar] [CrossRef]
  14. Cui, Y.-Z.; Hada, K.; Kino, M.; Sohn, B.W.; Park, J.; Ro, H.W.; Sawada-Satoh, S.; Jiang, W.; Cui, L.; Honma, M.; et al. East Asian VLBI Network observations of active galactic nuclei jets: Imaging with KaVA+Tianma+Nanshan. Res. Astron. Astrophys. 2021, 21, 205. [Google Scholar] [CrossRef]
  15. Okada, N.; Matsumoto, T.; Kondo, H.; Takashima, T.; Masui, S.; Ueda, S.; Nishimura, A.; Manabe, T.; Onishi, T.; Ogawa, H.; et al. Development of the multi-band simultaneous observation system of the Nobeyama 45-m Telescope in HINOTORI (Hybrid Installation project in NObeyama, Triple-band ORIented). In Millimeter, Submillimeter, and Far-Infrared Detectors and Instrumentation for Astronomy X; SPIE: Bellingham, WA, USA, 2020; Volume 11453, p. 1145349. [Google Scholar]
  16. Okada, N.; Hashimoto, I.; Kimura, K.; Manabe, T.; Tokuda, K.; Onishi, T.; Ogawa, H.; Imai, H.; Minamidani, T. Development of a 22/43 GHz-band quasi-optical perforated plate and dual-band observation system of the Nobeyama 45 m telescope. Publ. Astron. Soc. Jpn. 2020, 72, 7. [Google Scholar] [CrossRef]
  17. Nakajima, T.; Kimura, K.; Nishimura, A.; Iwashita, H.; Miyazawa, C.; Sakai, T.; Iono, D.; Kohno, K.; Kawabe, R.; Kuno, N.; et al. A New 100-GHz Band Two-Beam Sideband-Separating SIS Receiver for Z-Machine on the NRO 45-m Radio Telescope. Publ. Astron. Soc. Pacific. 2013, 125, 252. [Google Scholar] [CrossRef]
  18. Wilson, T.L.; Rohlfs, K.; Hüttemeister, S. (Eds.) Tools of Radio Astronomy, 5th ed.; Fizmatlit: Moscow, Russia, 2012; pp. 97–99. [Google Scholar]
  19. Thompson, A.R.; Moran, J.M.; Swenson, G.W. (Eds.) Interferometry and Synthesis in Radio Astronomy, 3rd ed.; Springer: Cham, Switzerland, 2017; pp. 391–483. [Google Scholar]
  20. Oyama, T.; Kono, Y.; Suzuki, S.; Kanaguchi, M.; Nishikawa, T.; Kawaguchi, N.; Hirota, T.; Nagayama, T.; Kobayashi, H.; Imai, H.; et al. The first simultaneous mapping of four 7 mm SiO maser lines using the OCTAVE system. Publ. Astron. Soc. Jpn. 2016, 68, 105. [Google Scholar] [CrossRef]
  21. Event Horizon Telescope Collaboration; Akiyama, K.; Alberdi, A.; Alef, W.; Asada, K.; Azulay, R.; Baczko, A.K.; Ball, D.; Baloković, M.; Barrett, J.; et al. First M87 Event Horizon Telescope Results. I. The Shadow of the Supermassive Black Hole. Astrophys. J. Lett. 2019, 875, L1. [Google Scholar]
  22. Hada, K.; Park, J.H.; Kino, M.; Niinuma, K.; Sohn, B.W.; Ro, H.W.; Jung, T.; Algaba, J.C.; Zhao, G.Y.; Lee, S.S.; et al. Pilot KaVA monitoring on the M 87 jet: Confirming the inner jet structure and superluminal motions at sub-pc scales. Publ. Astron. Soc. Jpn. 2017, 69, 71. [Google Scholar] [CrossRef]
  23. Nakamura, M.; Asada, K.; Hada, K.; Pu, H.Y.; Noble, S.; Tseng, C.; Toma, K.; Kino, M.; Nagai, H.; Takahashi, K.; et al. Parabolic Jets from the Spinning Black Hole in M87. Astrophys. J. 2018, 868, 146. [Google Scholar] [CrossRef]
  24. Park, J.; Hada, K.; Kino, M.; Nakamura, M.; Hodgson, J.; Ro, H.; Cui, Y.; Asada, K.; Algaba, J.C.; Sawada-Satoh, S.; et al. Kinematics of the M87 Jet in the Collimation Zone: Gradual Acceleration and Velocity Stratification. Astrophys. J. 2019, 887, 147. [Google Scholar] [CrossRef]
  25. Wagner, R.M. Synoptic studies of 17 blazars detected in very high-energy γ-rays. Mon. Not. R. Astron. Soc. 2008, 385, 119. [Google Scholar] [CrossRef] [Green Version]
Figure 1. Schematic diagram of triple-band optics in the NRO45 developed by HINOTORI. The RF signal comes from the direction labeled “RF signal”.
Galaxies 11 00030 g001
Figure 2. The block diagram of the refurbished TZ receiver.“FAC” is the FA (factory automation) controller used to monitor the SIS-Bias, measurement instruments, etc., while “×2” and “×3” represent frequency multipliers used for up-conversion to a higher frequency.
Galaxies 11 00030 g002
Figure 3. Results of search for optimal values of SIS-Bias yielding low T rx : (A,B) show the T rx maps of the two respective orthogonal polarizations without the frequency separation filter. Both the horizontal and vertical axes show the search range of the optimal bias for the SIS mixer. The color indicates the T rx obtained with each combination of SIS-Bias 1 and 2.
Galaxies 11 00030 g003
Figure 4. Schematic diagram for measurement of the Image Rejection Ratio.
Galaxies 11 00030 g004
Figure 5. Result of search for the optimal values of SIS-Bias yielding high IRRs: (A,B) show the IRR maps of the horizontal and the vertical polarizations, respectively. Both horizontal and vertical axes show the search range of optimal bias for the SIS mixer. The color indicates the IRR obtained with each combination of SIS-Biases 1 and 2.
Galaxies 11 00030 g005
Figure 6. Variation in the pointing offset against the elevation between the H40 (43 GHz) and TZ (86 GHz) receiving systems after removal of the beam squint effect.
Galaxies 11 00030 g006
Figure 7. Beam pattern for vertical polarization obtained with the 86-GHz receiver system. No significant beam distortion was seen in either the Az or El direction, both with (panel A) and without (panel B) the frequency separation filter. The contours indicate 5, 10, 20, 30, 40, 50, 60, 70, 80, and 90% of the peak intensity.
Galaxies 11 00030 g007
Figure 8. Schematic diagram of the measurement system for measuring the phase stability of the-86 GHz receiving system established by HINOTORI (A), along with the ASD measured for the horizontal polarization (B) and vertical polarization (C).
Galaxies 11 00030 g008
Figure 9. Schematic diagram of the HINOTORI VLBI data acquisition system (HINOTORI DAS).
Galaxies 11 00030 g009
Figure 10. East Asia 3 mm VLBI Network.
Galaxies 11 00030 g010
Figure 11. (A): The u v -coverage for M87 (declination δ of ∼ 12 ) expected by the observation with 8-hr tracks using the NRO45 and KVN baselines. The solid red line indicates the NRO45 baselines. (B): The synthesized beam expected to be achieved by the NRO45 and KVN baselines for M87. (C): The u v -coverage for Mrk 421 (declination δ of ∼ 38 ) expected by the observation with 8-hr tracks using the NRO45, KVN, GLT, and JCMT baselines. The solid red line indicates the GLT and JCMT-related baselines. (D): The synthesized beam expected to be achieved by the NRO45, KVN, GLT, and JCMT baselines for Mrk 421.
Galaxies 11 00030 g011
Table 1. Relation between combination of frequency separation filters/mirrors and observation mode.
Observation#8#8#9#9
ModeMirrorFilterMirrorFilter
22 GHzx x
43 GHzx
86 GHz
22/43 GHzx x
22/86 GHz xx
43/86 GHz x
22/43/86 GHz x x
“x” indicates that the Mirror and/or Filter are used for selecting the single-band or multi-band mode listed in the leftmost column.
Table 2. Optimal SIS–Bias values of LSB for the lowest T rx without and with frequency separation filter.
Horizontal PolarizatonVertical Polarization
T rx
Through(K) 77 ± 4 87 ± 1
Filter at #8(K) 125 ± 9 129 ± 5
Optimal Bias
SIS-Bias 1(mV)6.56.9
SIS-Bias 2(mV)7.46.5
Table 3. Search ranges of SIS-Bias for measurement of IRR.
Horizontal PolarizationVertical Polarization
SIS-Bias 1SIS-Bias 2SIS-Bias 1SIS-Bias 2
(mV)(mV)(mV)(mV)
6.1–6.77.1–7.76.5–7.16.3–6.9
Table 4. Summary and result of beam squint measurement in 86-GHz observing system.
Throughwith Filters at #8 & #9
Date of measurement (UT) 23 June 20209–21 November 2019
Target S CrBR Cnc, R Leo, R Cas
(SiO maser)(SiO maser)
T sys (K)∼260 K at 43 GHz∼170 K at 43 GHz
∼500 K at 86 GHz∼250 K at 86 GHz
d A z (") 2.6 ± 1.9 1.1 ± 1.5
d E l (") 0.1 ± 1.2 0.5 ± 1.8
Table 5. Beam sizes for vertical polarization obtained with 86-GHz observing system.
ThroughFilter at #8 & #9
Date of measurement (UT) 24 June 202024 June 2020
Target T Cep (SiO maser)T Cep (SiO maser)
T sys (K)∼500∼400
EL during measurement(deg)43.7–48.438.6–43.6
Beam size ( A z )(") 20.2 ± 1.3 18.8 ± 1.3
Beam size ( E l )(") 17.8 ± 1.0 22.6 ± 1.0
Table 6. Summary and results of η mb and η a measurements in the 86-GHz observing system.
ThroughFilter at #8 & #9
Date of measurement (UT) 8 December 201930 June 2020
Target Mars (continuum)Mars (continuum)
T sys (K)not measurednot measured
EL during measurement(deg)35.8–39.141.1–51.2
η mb (%) 51 ± 5 43 ± 4
η a (%) 43 ± 4 32 ± 2
Disclaimer/Publisher’s Note: The statements, opinions and data contained in all publications are solely those of the individual author(s) and contributor(s) and not of MDPI and/or the editor(s). MDPI and/or the editor(s) disclaim responsibility for any injury to people or property resulting from any ideas, methods, instructions or products referred to in the content.

