1. Introduction
VLBI observations at 230 GHz have delivered the first images of supermassive black holes. These results highlight the unique science accessible with high observing frequencies [
1,
2], and the interest for observations at even higher frequencies and higher angular resolutions. Nevertheless the relentless push of the upper frequency threshold in VLBI observations faces increasing challenges. The fast tropospheric phase fluctuations limit the length of time over which the signal can be coherently integrated (i.e., the coherence time) and prevent the application of standard phase referencing techniques applicable in the centimeter regime to extend this time. This propagation effect poses the main challenge in VLBI observations at high frequencies, which combined with intrinsically weaker source fluxes in general, higher instrumental noise and atmospheric opacity limit the observations to the strongest target sources, despite many advances in imaging algorithms (see [
3]). It also prevents astrometric measurements.
Next-generation calibration methods and technologies have the potential to overcome these limitations. Using trans-frequency calibration, which relies on the non-dispersive nature of tropospheric fluctuations (i.e., that the tropospheric phase fluctuations are proportional to observing frequency) has a long history (e.g., [
4,
5,
6]). It has only fairly recently begun to deliver on its promise for mm-VLBI [
7] with the development of a suite of strategies hereafter grouped under the generic term ‘frequency phase transfer methods’, which share a common ground in requiring multi-frequency observations. At heart these rely on transferring the VLBI-observable solutions (for phase, delay and rate) measured at a lower frequency to correct the residuals in the analysis of simultaneous observations of the same source at a higher frequency, after scaling the phase by the frequency ratio. Encouraged by the observational success of these techniques that have been demonstrated at frequencies up to 130 GHz (e.g., [
8] with the KVN) we propose to expand the application to ngEHT frequencies, where one would expect it to continue to function at two-hundred and three-hundred GHz.
The design specifications for the ngEHT observing frequencies are under revision in light of the possible benefits from the addition of a lower frequency. The proposed change to the system design is to add a 85 GHz band to the original dual-frequency system at 230 and 340-GHz. This paper is concerned with the prospects for ngEHT observations using frequency phase transfer methods and simultaneous multi-frequency receivers, with a focus on comparative performance. The methods are described in
Section 2 and the simulation studies with accurate models for atmospheric propagation effects in
Section 3. The results and discussions in
Section 4 present the demonstrated effectiveness, the limitations, optimal configurations and some of the enabled scientific capabilities. These include the extension of effective coherence time at three-hundred GHz to hours, the array configuration requirements from the case study of SgrA* as a highly scatter-broadened source, and the astrometric measurements that could be made from such a configuration.
Section 5 are the conclusions. The frequency phase transfer benefits are applicable to many different science goals, so this report stands alongside the partner reports on [
9,
10].
2. The Methods
The so-called frequency phase transfer paradigm encompasses a family of calibration methods that have in common the reliance of using observations at a lower reference frequency () to infer the corrections at the higher target frequency (). Because observations at lower frequencies are more amenable, these make possible successful outcomes where single-frequency observations at the higher frequency alone are impossible. Moreover, they enhance the technical and scientific capabilities of the array.
Empirical demonstrations up to 130 GHz, detailed formulations of the methods, comprehensive error analysis, guidelines for scheduling and requirements have been presented in Rioja and Dodson [
7], Rioja et al. [
8], Rioja and Dodson [
11] along with considerations for optimum performance in continuum and spectral line studies. For example, we strongly recommend an integer frequency ratio between the different frequency bands for robust and optimum use of these techniques, but see Dodson et al. [
12] for an application when the target science requires otherwise. Here we include a brief description of these methods to support the comparative studies presented here, relevant to ngEHT.
The Frequency Phase Transfer (hereafter FPT) calibration method relies on transferring the VLBI-observable solutions (for phase, delay and rate) measured at a lower frequency,
, with a temporal sampling
, to the analysis of simultaneous observations of the same source at a higher frequency,
, after scaling the phase by the frequency ratio. This is correct to address residual non-dispersive effects (i.e., frequency independent excess path length corrections), which are precisely calibrated out at the high frequency; these arise, for example, from unaccounted tropospheric contributions. On the other hand, residual dispersive effects are amplified; these arise mainly from unaccounted ionospheric and instrumental contributions (and if left uncorrected limit the functionality). The result of the precise tropospheric calibration is that the effective coherence time at the higher frequency is extended, allowing the detection of weaker sources than would be possible if using single-frequency observations. The remaining dispersive residual terms can impose limitations on the lengthened coherence time, depending on their magnitude, and additionally prevent precise astrometry. An FPT schedule consists of simultaneous multi-frequency observations of the target source. This corresponds to the observational set up used for the simulation studies presented in
Section 3.
The Source/Frequency Phase Referencing (hereafter SFPR) calibration method provides a breakthrough for ultra precise mm-VLBI astrometry, beyond the scope of application of phase referencing methods, and unlimited effective coherence time. The SFPR calibration strategy comprises two steps, the first one being the FPT described above. The second step assumes that the remaining dispersive residuals can be eliminated using interleaving observations of a second calibration source. Since those terms are slowly varying, slow telescope source switching is possible, and the sources can be widely separated. Using SFPR is equivalent to carrying out observations from an excellent site and with a perfect instrument; it boosts the sensitivity by reducing coherence losses, and also provides a precise astrometric registration of the images at the two frequencies. The SFPR comprehensive astrometric error analysis in Rioja and Dodson [
7] informs the astrometry estimates presented in
Section 4.6.
Multi Frequency Phase Referencing (MFPR) [
13] is a technique that builds on SFPR and delivers high precision astrometric measurements in the high frequency regime using observations of the target source only. Dedicated ionospheric calibration blocks (ICE-blocks) are interleaved with the simultaneous pair of dual-frequency observations at mm-wavelengths; its implementation requires an instrument with great frequency agility and wide frequency coverage, thus will be more relevant to the ngVLA.
FPT-square [
14] is a technique that builds on the FPT method described above and allows for a further increase of coherence time. It uses observations of three frequency bands to form two pairs of simultaneous dual-frequency observations at mm-wavelengths and applies the scaled-correction twice to allow for the cancellation of the ionospheric contribution. As with FPT, FPT-square is not suitable for astrometric measurements in general.
All of these methods are widely applicable with no known upper frequency limit, if the instrument has the required simultaneous multi-frequency capability. These have been demonstrated for continuum and spectral line VLBI with ground observations up to 130 GHz, and at integer and non-integer frequency ratios. Furthermore they are potentially applicable in the space VLBI domain [
15], improving the outcomes by calibrating out satellite orbit errors which have a non-dispersive nature, just as for the tropospheric errors.
3. Simulations for Coherence and Astrometric Studies at ngEHT Frequencies
We have carried out comparative simulation studies along with astrometric error propagation to quantify the benefits of FPT and SFPR multi-frequency techniques applied to ngEHT observing frequencies (ie bands around 85, 230 and 340 GHz). We focus on their power to overcome the dominant challenge imposed by the fast tropospheric phase fluctuations, which severely limit the coherence time and prevent astrometric measurements.
We have used ARIS [
16] as our simulation tool to generate synthetic datasets. ARIS was designed explicitly for astrometric studies and includes realistic semi-analytical models of the so-called static and dynamic terms to mimic the troposphere and the ionosphere atmospheric propagation effects. The latter are implemented as moving phase screens assuming Kolmogorov turbulence characterized by a constant scale factor given by the C
coefficient, with higher values indicative of stronger fluctuations, as expected from worsening weather conditions and/or lower quality sites. The output comprises two files, one for the target and another for the reference dataset. These can refer to observations along different lines of sight at the same frequency, as in phase referencing, or to simultaneous observations at different frequencies along the same line of sight, for the multi-frequency studies presented here. The output data files are in IDI-FITS format suitable for processing in most data reduction packages.
The studies presented here focus on the dominant atmospheric propagation effects. The simulations include four antenna sites, namely Owens Valley, Mauna Kea, KVN Yonsei and the Large Millimeter Telescope, which result in a range of baselines up to 6000 km. The target was selected to be a point source at a declination of +59°, allowing tracking for hours with Zenith angles less than 70° for all antennas. The simulations are for the strong signal regime, that is they do not include thermal noise. The atmospheric weather is imposed without regard for the nominal site, that is the actual antenna locations play an arbitrary role. The explored parameter space of atmospheric propagation effects are simulated using a dynamic turbulent tropospheric phase screen that is scaled by a range of values equal to 0.5, 1 and 2. Best weather conditions are dubbed V for Very Good, with C of 0.5 and doubling for so called Good (dubbed G), and Tolerable (dubbed T) weather conditions. The static contributions use randomly determined values with standard deviations for the tropospheric excess path delay (i.e., ) of 3 cm and the ionospheric residual electron content (i.e., TEC) of 6 TECU, at each VLBI station. The set of observing frequencies correspond to the originally planned 230 and 340 GHz bands, plus the new proposed 85 and 255 GHz bands. The latter is for testing the impact of frequency ratios being integer or not. We generated a complete set of synthetic single-frequency and simultaneous dual-frequency datasets, for all frequency and frequency pairs, and for all weather conditions.
The analysis of all the datasets was carried out with AIPS, using FPT calibration techniques for the dual-frequency datasets. It comprised of a self-calibration at the reference frequency (
) with a range of solution intervals given by
equal to 8, 15, 30 and 60 s, which are used to stabilise the phases at the target frequency
. This was followed up with a second calibration at the target frequency with a much longer solution interval, given by
equal to 1, 3, 10 and 60 min. These are very different scales as
is related to the atmospheric-coherence time and
corresponds to the FPT-coherence time, that is, after conditioning with FPT calibration. For the single-frequency datasets we use standard calibration. In all cases, following calibration, we measured the peak flux density in the images. Our preferred approach to calculate the coherence is to use the fractional peak flux recovery (FFR) quantity, calculated from the peak flux density value divided by the model point source intensity, as indicative of the coherence losses resulting from the calibration strategy. Another approach consists of measuring the baseline coherence over various timescales (e.g., using the AIPS task UVRMS). The former is closer, we feel, to what is required to characterize the quality of the image recovery. For example, the baseline coherence can be 100% whilst the FFR is zero, if the baselines are out of phase. Thus, all figures on coherence measurements use FFR, except for
Figure 1.
Finally, we use the SFPR astrometric propagation error formulation in Rioja and Dodson [
7] to calculate the accuracy in astrometric measurements enabled with the simultaneous dual-frequency observations at ngEHT frequencies.
4. Results and Discussion
4.1. Verification of Weather Models in ARIS
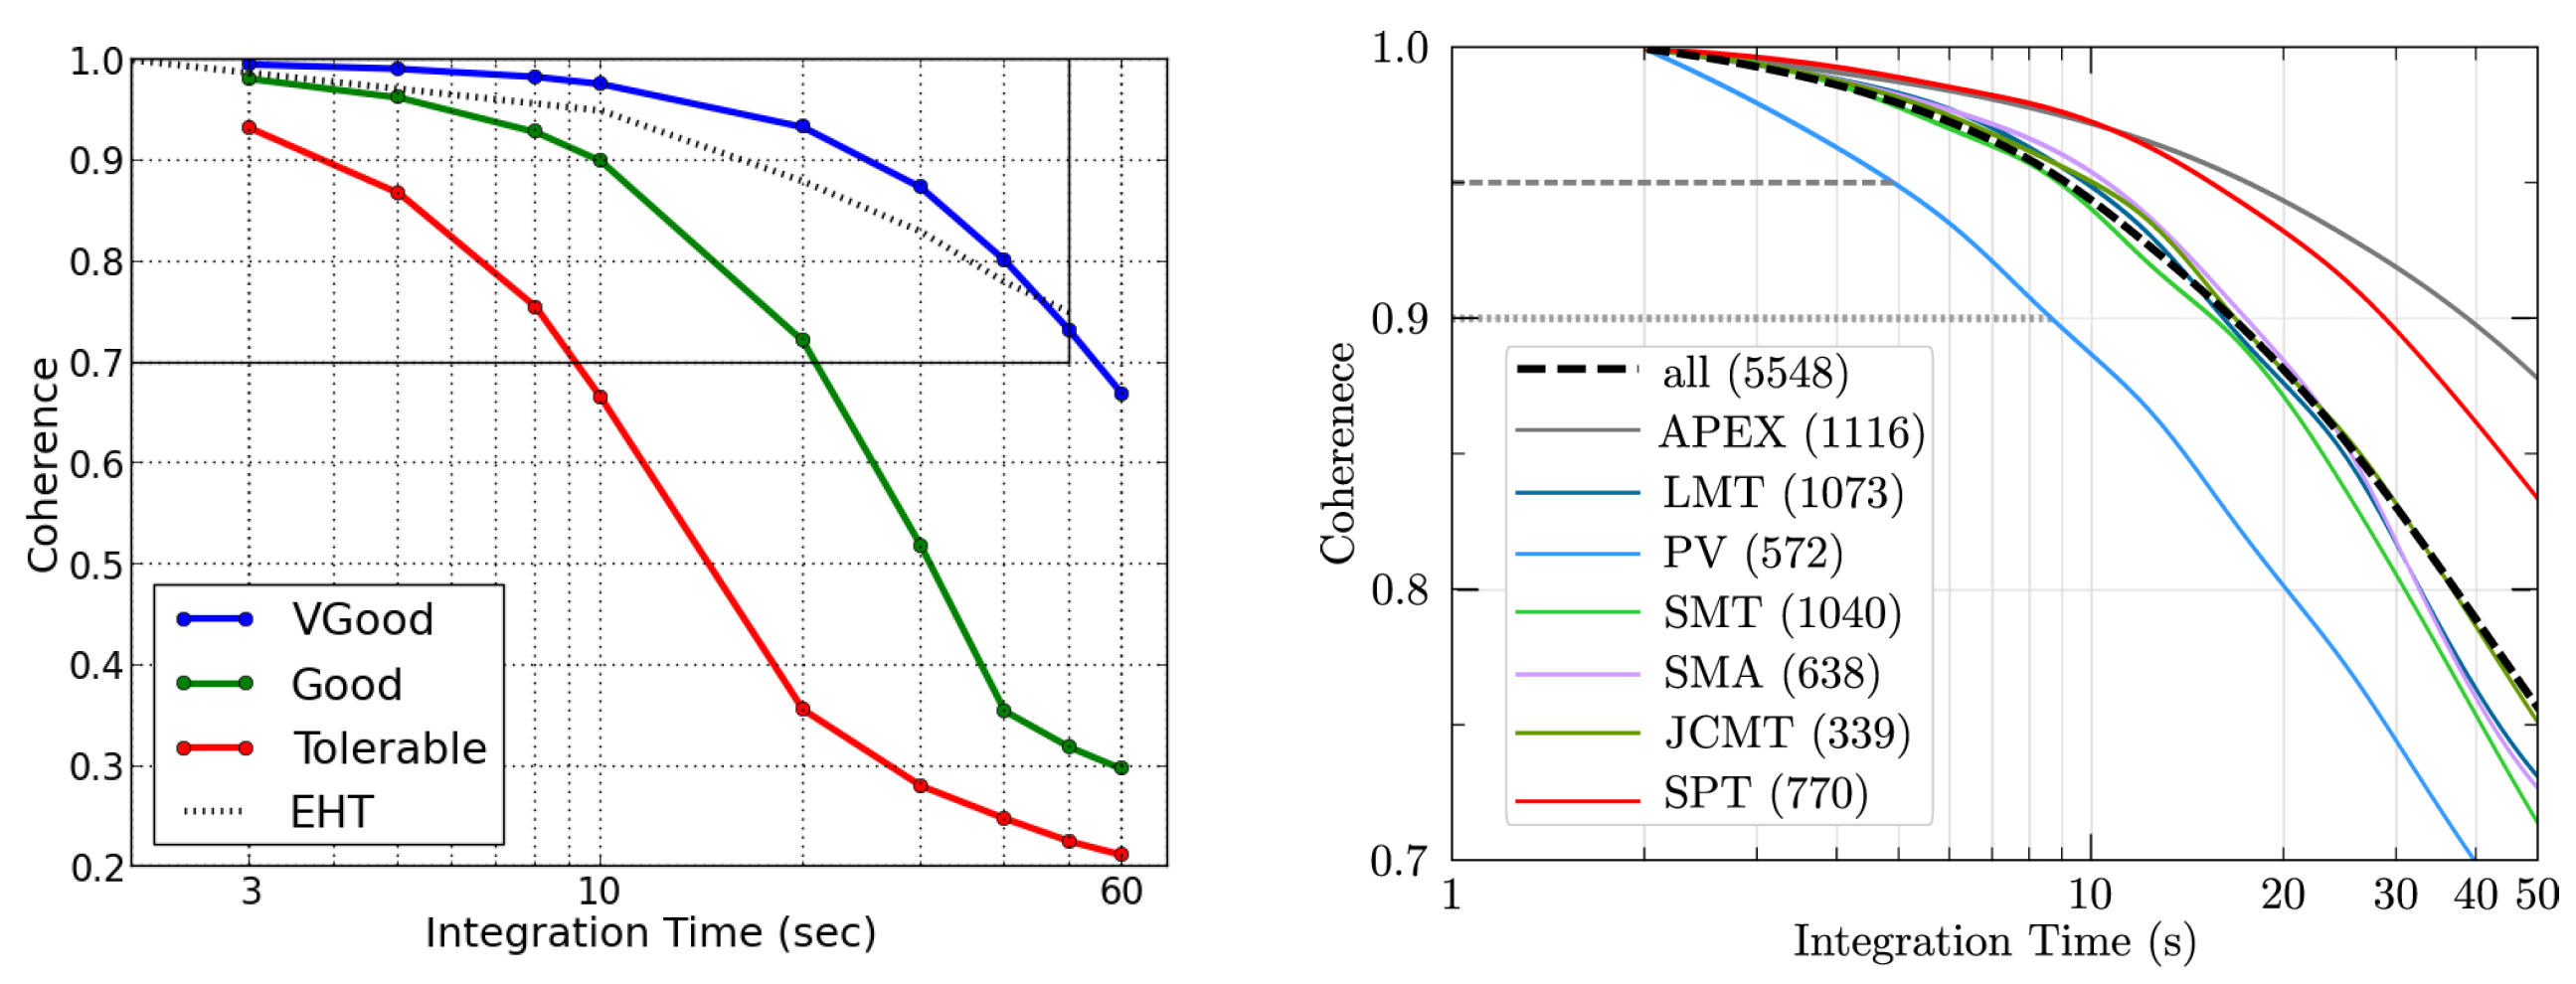
We use the comparison between outcomes from the empirical EHT observations at 230 GHz and our synthetic datasets, to confirm the correspondence of the ARIS tropospheric models with the real weather conditions at EHT sites.
Figure 1 (left) shows the 1st quartile baseline atmospheric coherence calculated with the AIPS task UVRMS as a function of integration time for our simulations under a range of weather conditions, shown with solid lines with different colors. Overplotted with a dotted line are the results measured from EHT observations as shown in the EHT data paper [
17]. We conclude that the EHT empirical results match those of Very Good weather in our simulations, which corresponds to typical weather conditions at the ALMA site (without WVR corrections). This step is a fundamental check of the validity of the simulation studies and the conclusions extracted.
4.2. FPT Coherence at 340 GHz Using 230 GHz as the Reference Frequency
Here we present the prospects for the original system design which encompasses a dual-frequency receiver covering the 230 and 340-GHz bands.
Figure 2 plots the FPT coherence at 340 GHz (
) as a function of calibration timescales (
), for a range of values between 1 and 60 min, after FPT calibration using simultaneous 230 GHz (
) observations. Shown are performances under Very Good (V,
left) and Good (G,
right) weather conditions. Different colors correspond to different calibration timescales at 230 GHz (
), ranging between 8 and 60 s. The coherence corresponds to the FFR quantity obtained as described in
Section 3. We find similar results for the 255-GHz and 340-GHz frequency pair.
Under V weather conditions the results show very high coherence ≫0.9 at 340 GHz, for solution intervals up to an hour and beyond, using
15 s. Longer
, ∼30 s, achieves a coherence of 0.9 at 340 GHz for solution intervals
up to 3 min; longer solution intervals result in larger coherence losses (e.g., 10 min results in 20% loss). The performance deteriorates under G weather, but high coherence of ≫0.9 at 340 GHz can be obtained for up to 10 min with a sufficiently short
of ∼8 s. The degradation of performance is mainly due to the non-integer frequency ratio (
), as discussed in
Section 4.4.
We conclude that using 230-GHz as the reference frequency and under Very Good weather conditions leads to acceptable results at 340-GHz. Furthermore acceptable results are possible under Good weather conditions, with the more stringent constraint that is sufficiently fast. We remind the reader that for FPT a direct detection at within is a fundamental requirement. With equal to 230 GHz this will limit the number of possible targets. For example, only approximately 20% of the ALMA calibrator source list would be detectable by ngEHT with a of 8 s. This is, of course, significantly better than the percentage of that list which would be directly detected with single frequency observations at 340-GHz, which is about 8%.
4.3. FPT Coherence at 340 GHz Using 85 GHz as the Reference Frequency
With the reference frequency at 85 GHz, the target frequencies at 255- and 340-GHz can be integer frequency ratios (3 and 4, respectively), thus the solutions are more robust and coherence is not lost.
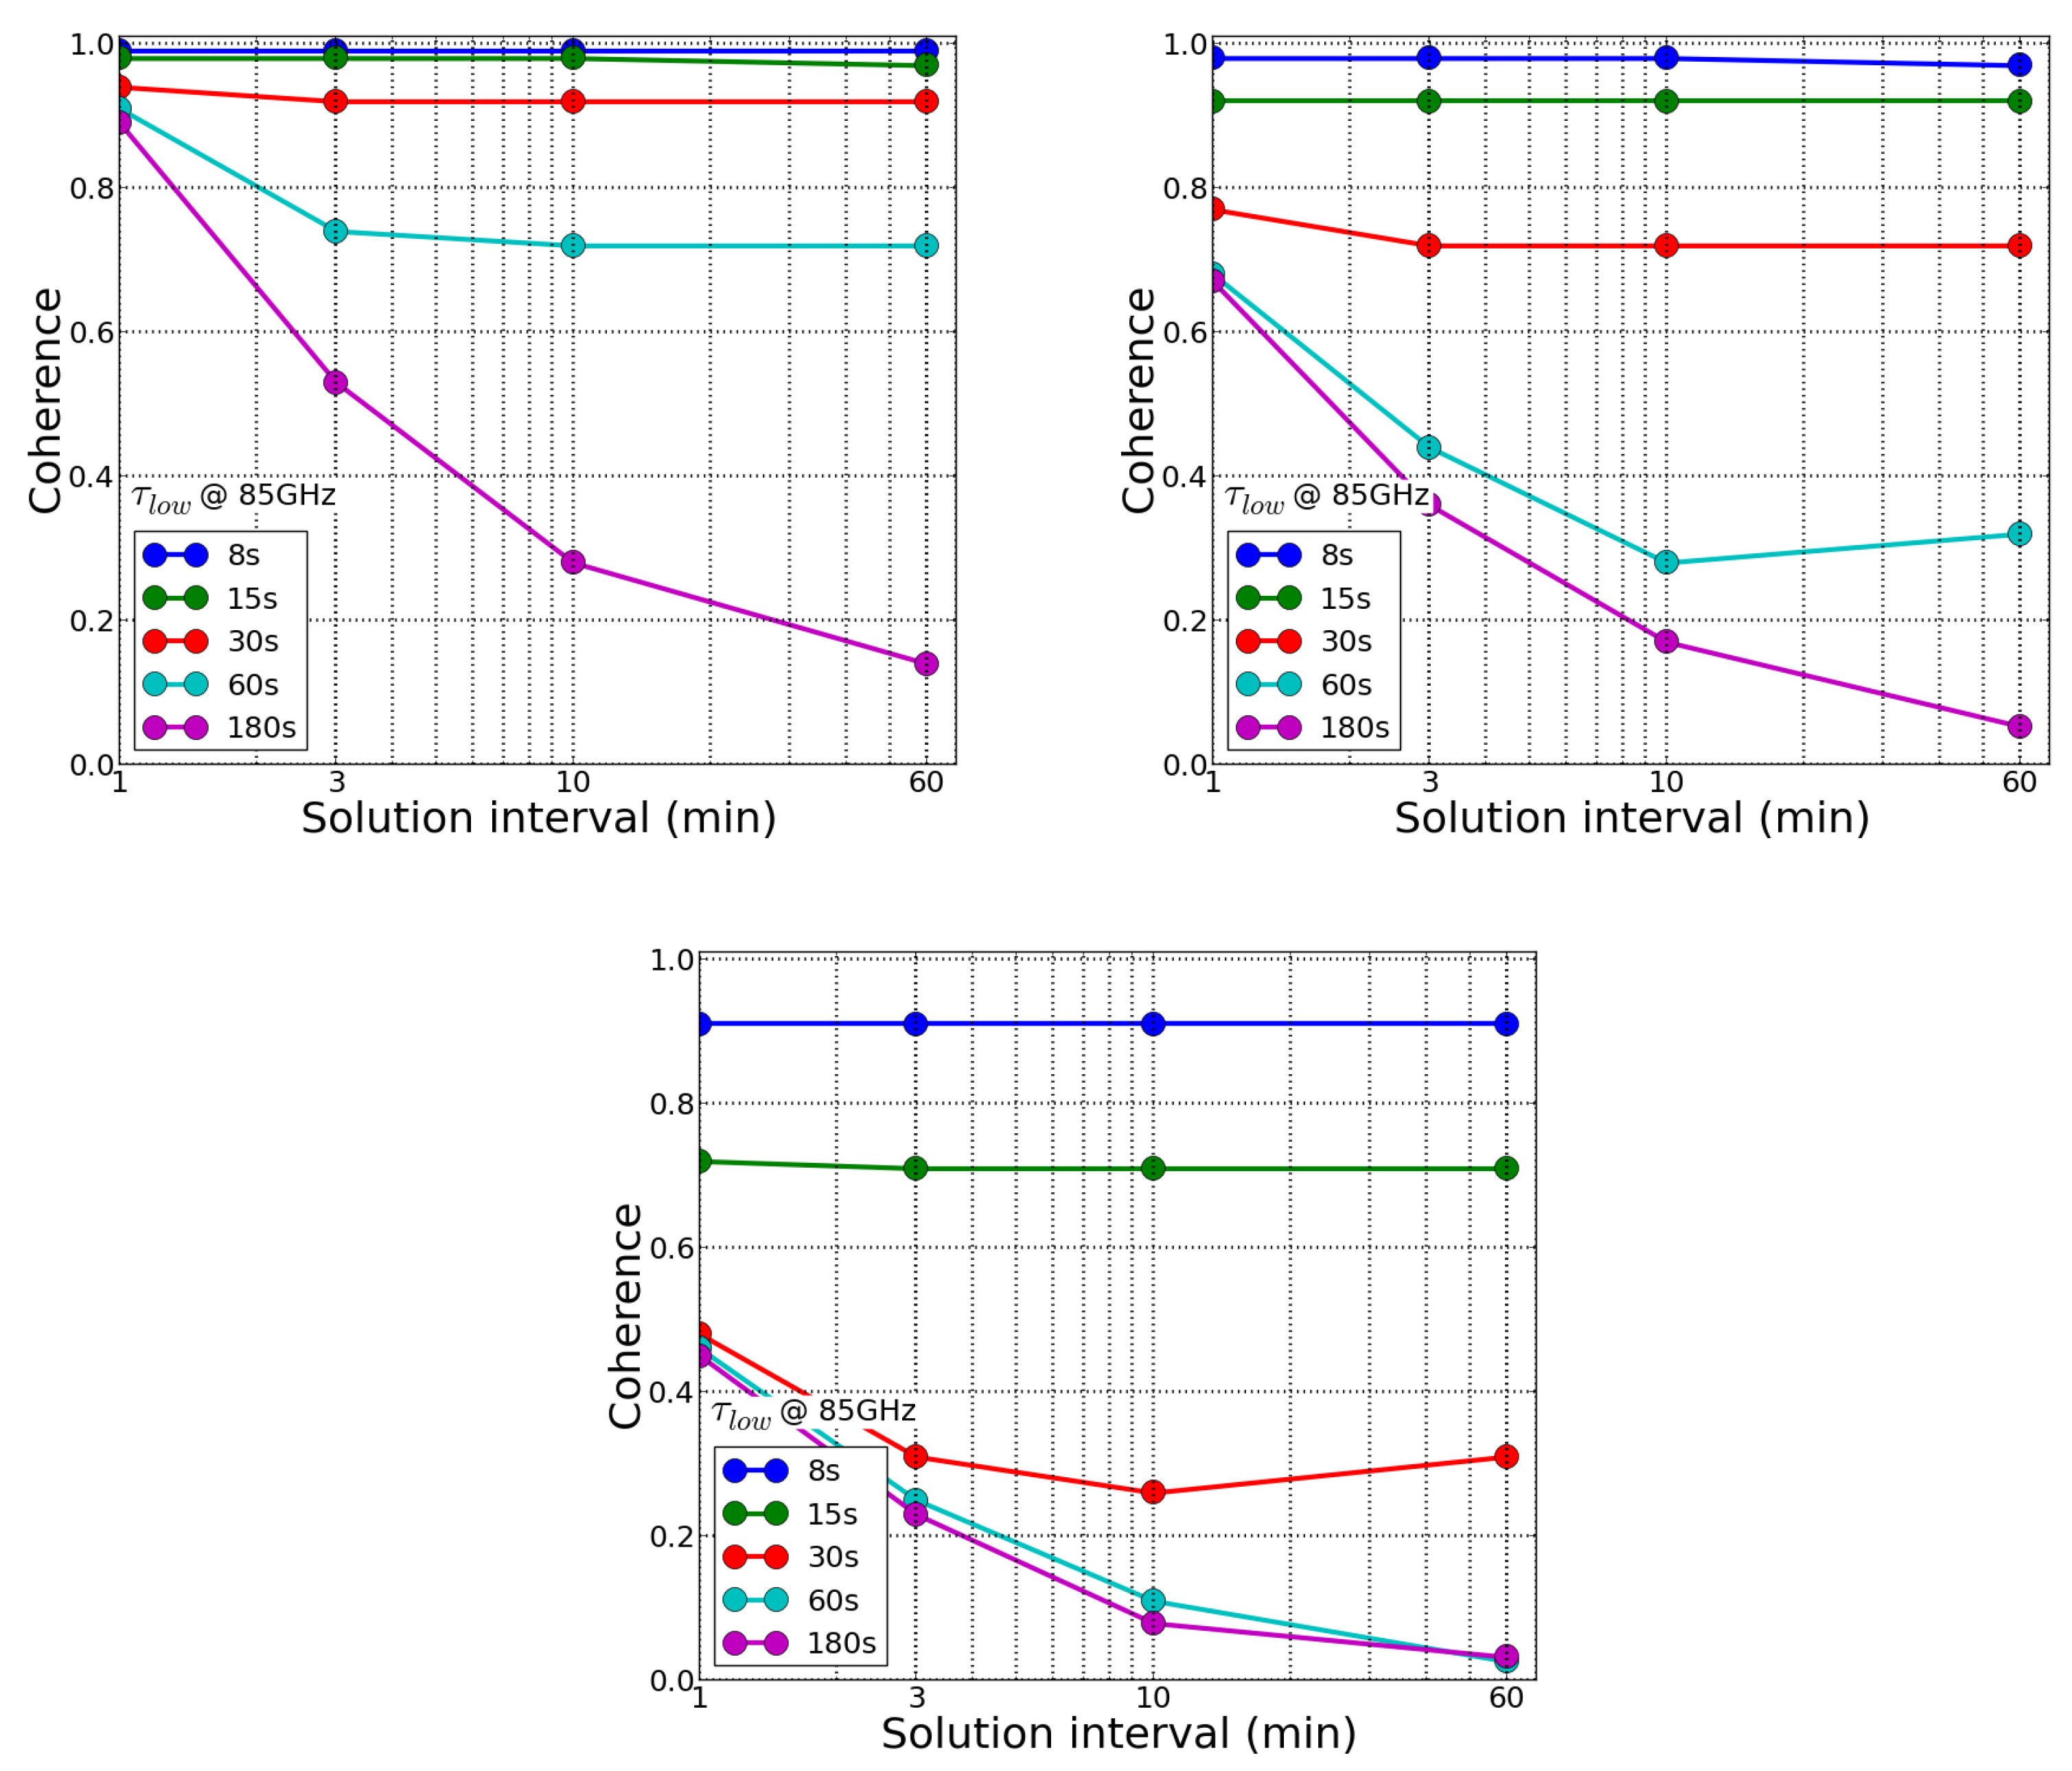
Figure 3 plots the FPT coherence at 340 GHz (
) as a function of calibration timescales (
), for a range of values between 1 and 60 min, under Very Good (V,
left), Good (G,
right) and Tolerable (T,
bottom) weather conditions, after FPT calibration using simultaneous 85 GHz (
) observations. Different colors correspond to different calibration timescales (
) at 85 GHz, ranging between 8 and 180 s.
Under V, G and T weather conditions we obtain very high coherence ≫0.9 at 340 GHz, for solution intervals up to an hour and beyond, using 30, 15 and 8 s, respectively. Even with double these limits, long term coherence greater than 0.7 is maintained for an hour and beyond, as the frequency ratio is integer and phase ambiguity issues have no impact.
We conclude that using 85-GHz as the reference frequency and in Very Good and Good weather conditions, superior results are possible at 340-GHz, and with longer calibration time scales compared to using 230-GHz as the reference. Furthermore, acceptable results are possible under Tolerable weather conditions, with the more stringent constraint that is sufficiently fast. Approximately 90% of the ALMA calibrator source list would be detectable by ngEHT at 85 GHz with of 15 s. Thus, using 85-GHz as the reference frequency will dramatically increase the number of viable targets, allowing for demographic studies at 340-GHz.
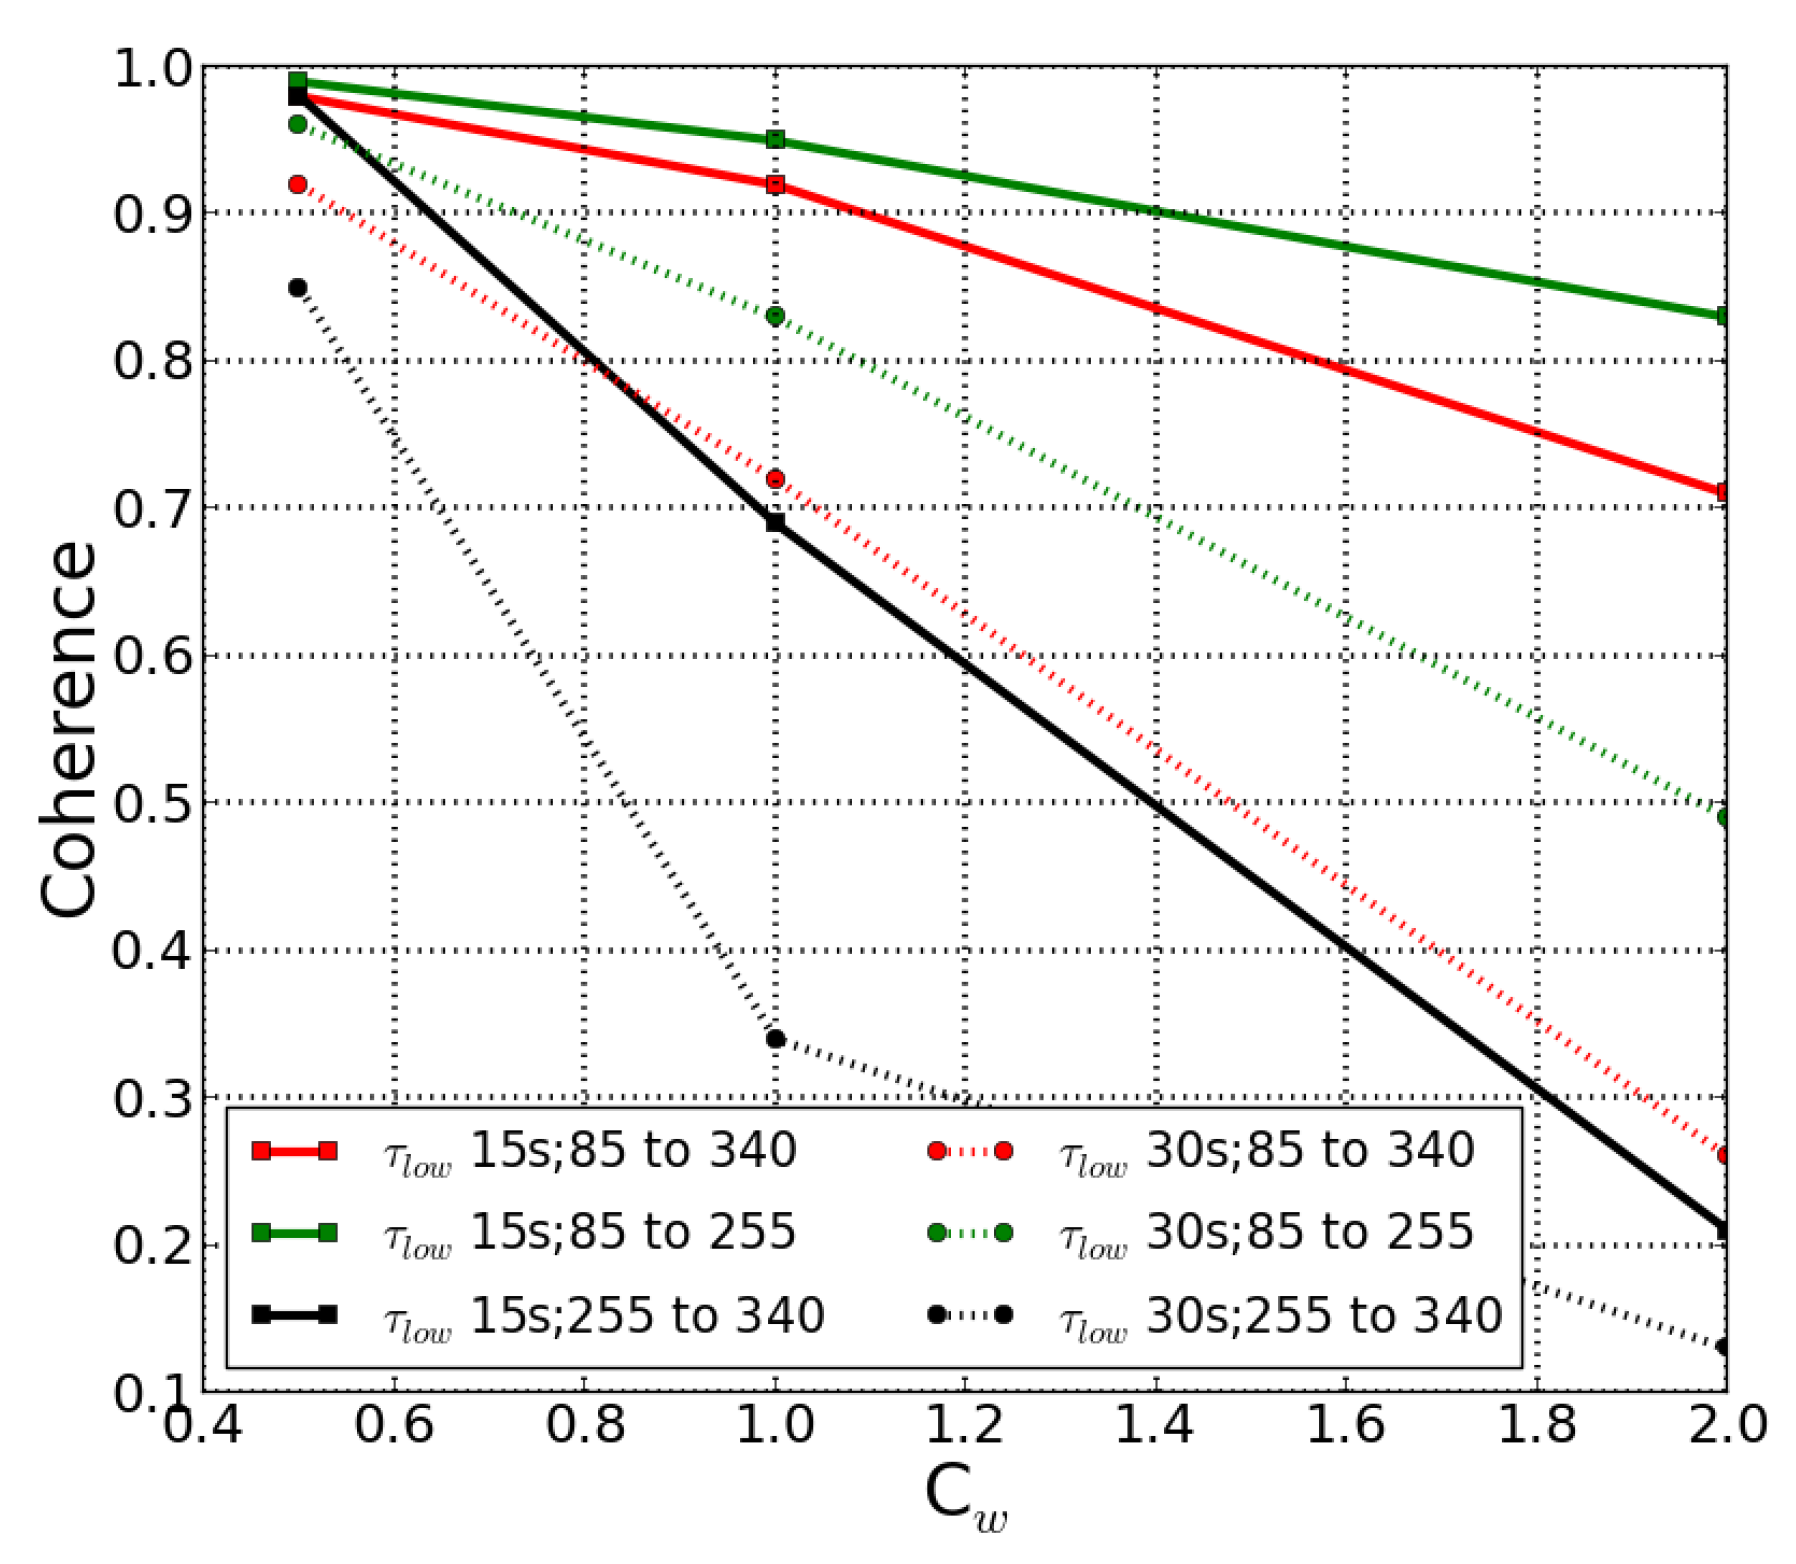
Figure 4 shows a compendia of the results on FPT coherence for
of 10 min for three frequency pairs (85→340 GHz, 85→255 GHz and 255→340 GHz) and two
values (15 s and 30 s), as a function of the weather conditions, given by the
parameter (i.e., values 0.5, 1 and 2 for V, G and T, respectively).
Figure 4 allows us to draw some general conclusions: (
a) worsening weather conditions lead to degradation in the phase coherence, (
b) that, for a given pair of frequencies, the coherence gets worse faster as
is longer, (
c) that, for a given
, the higher
the faster the degradation and (
d) that fastest degradation is for a non-integer frequency ratio.
FPT can achieve increased effective sensitivity at (sub)mm-VLBI because it enables extended integration times, which allows the detection of sources that were otherwise too weak to be detected within the atmospheric coherence time with single-frequency observations. Our results suggest that the best performance at 340-GHz is achieved using 85-GHz as the reference frequency, compared to 230-GHz. We conclude this based on the following reasons. This approach provides superior calibration at 340-GHz, that is higher coherence and for longer integration times. Additionally, observations at 340- referenced to 85 GHz will be more robust, as they will work under a wider range of weather conditions massively expanding the observational window and/or increasing the number of suitable sites. This is partially because the analysis of data with integer frequency ratios is more straight-forward. Furthermore, direct detections at 85 GHz will be both more numerous and have higher SNR, due to the sources being intrinsically brighter, system noise being lower and
being longer. This translates into wide applicability as more targets will be observable. Finally, 85-GHz provides a path to ultra-precise relative astrometry at 340-GHz, as discussed in
Section 4.6.
Using a lower reference frequency, for example 43 GHz, results in doubling the scaling factor (given by the frequency ratio) and therefore increasing the propagation of the phase observable errors to the higher frequency. Additionally, the residual FPT ionospheric errors are larger using 43 GHz, compared to 85 GHz (see [
7] for details on the impact of the frequency ratio). Lastly, 85 GHz band offers important benefits for observations of SgrA*, a main EHT target, as discussed in
Section 4.5. We conclude that 85-GHz is the reference frequency of choice for ngEHT.
4.4. Impact of Non-Integer Frequency Ratios
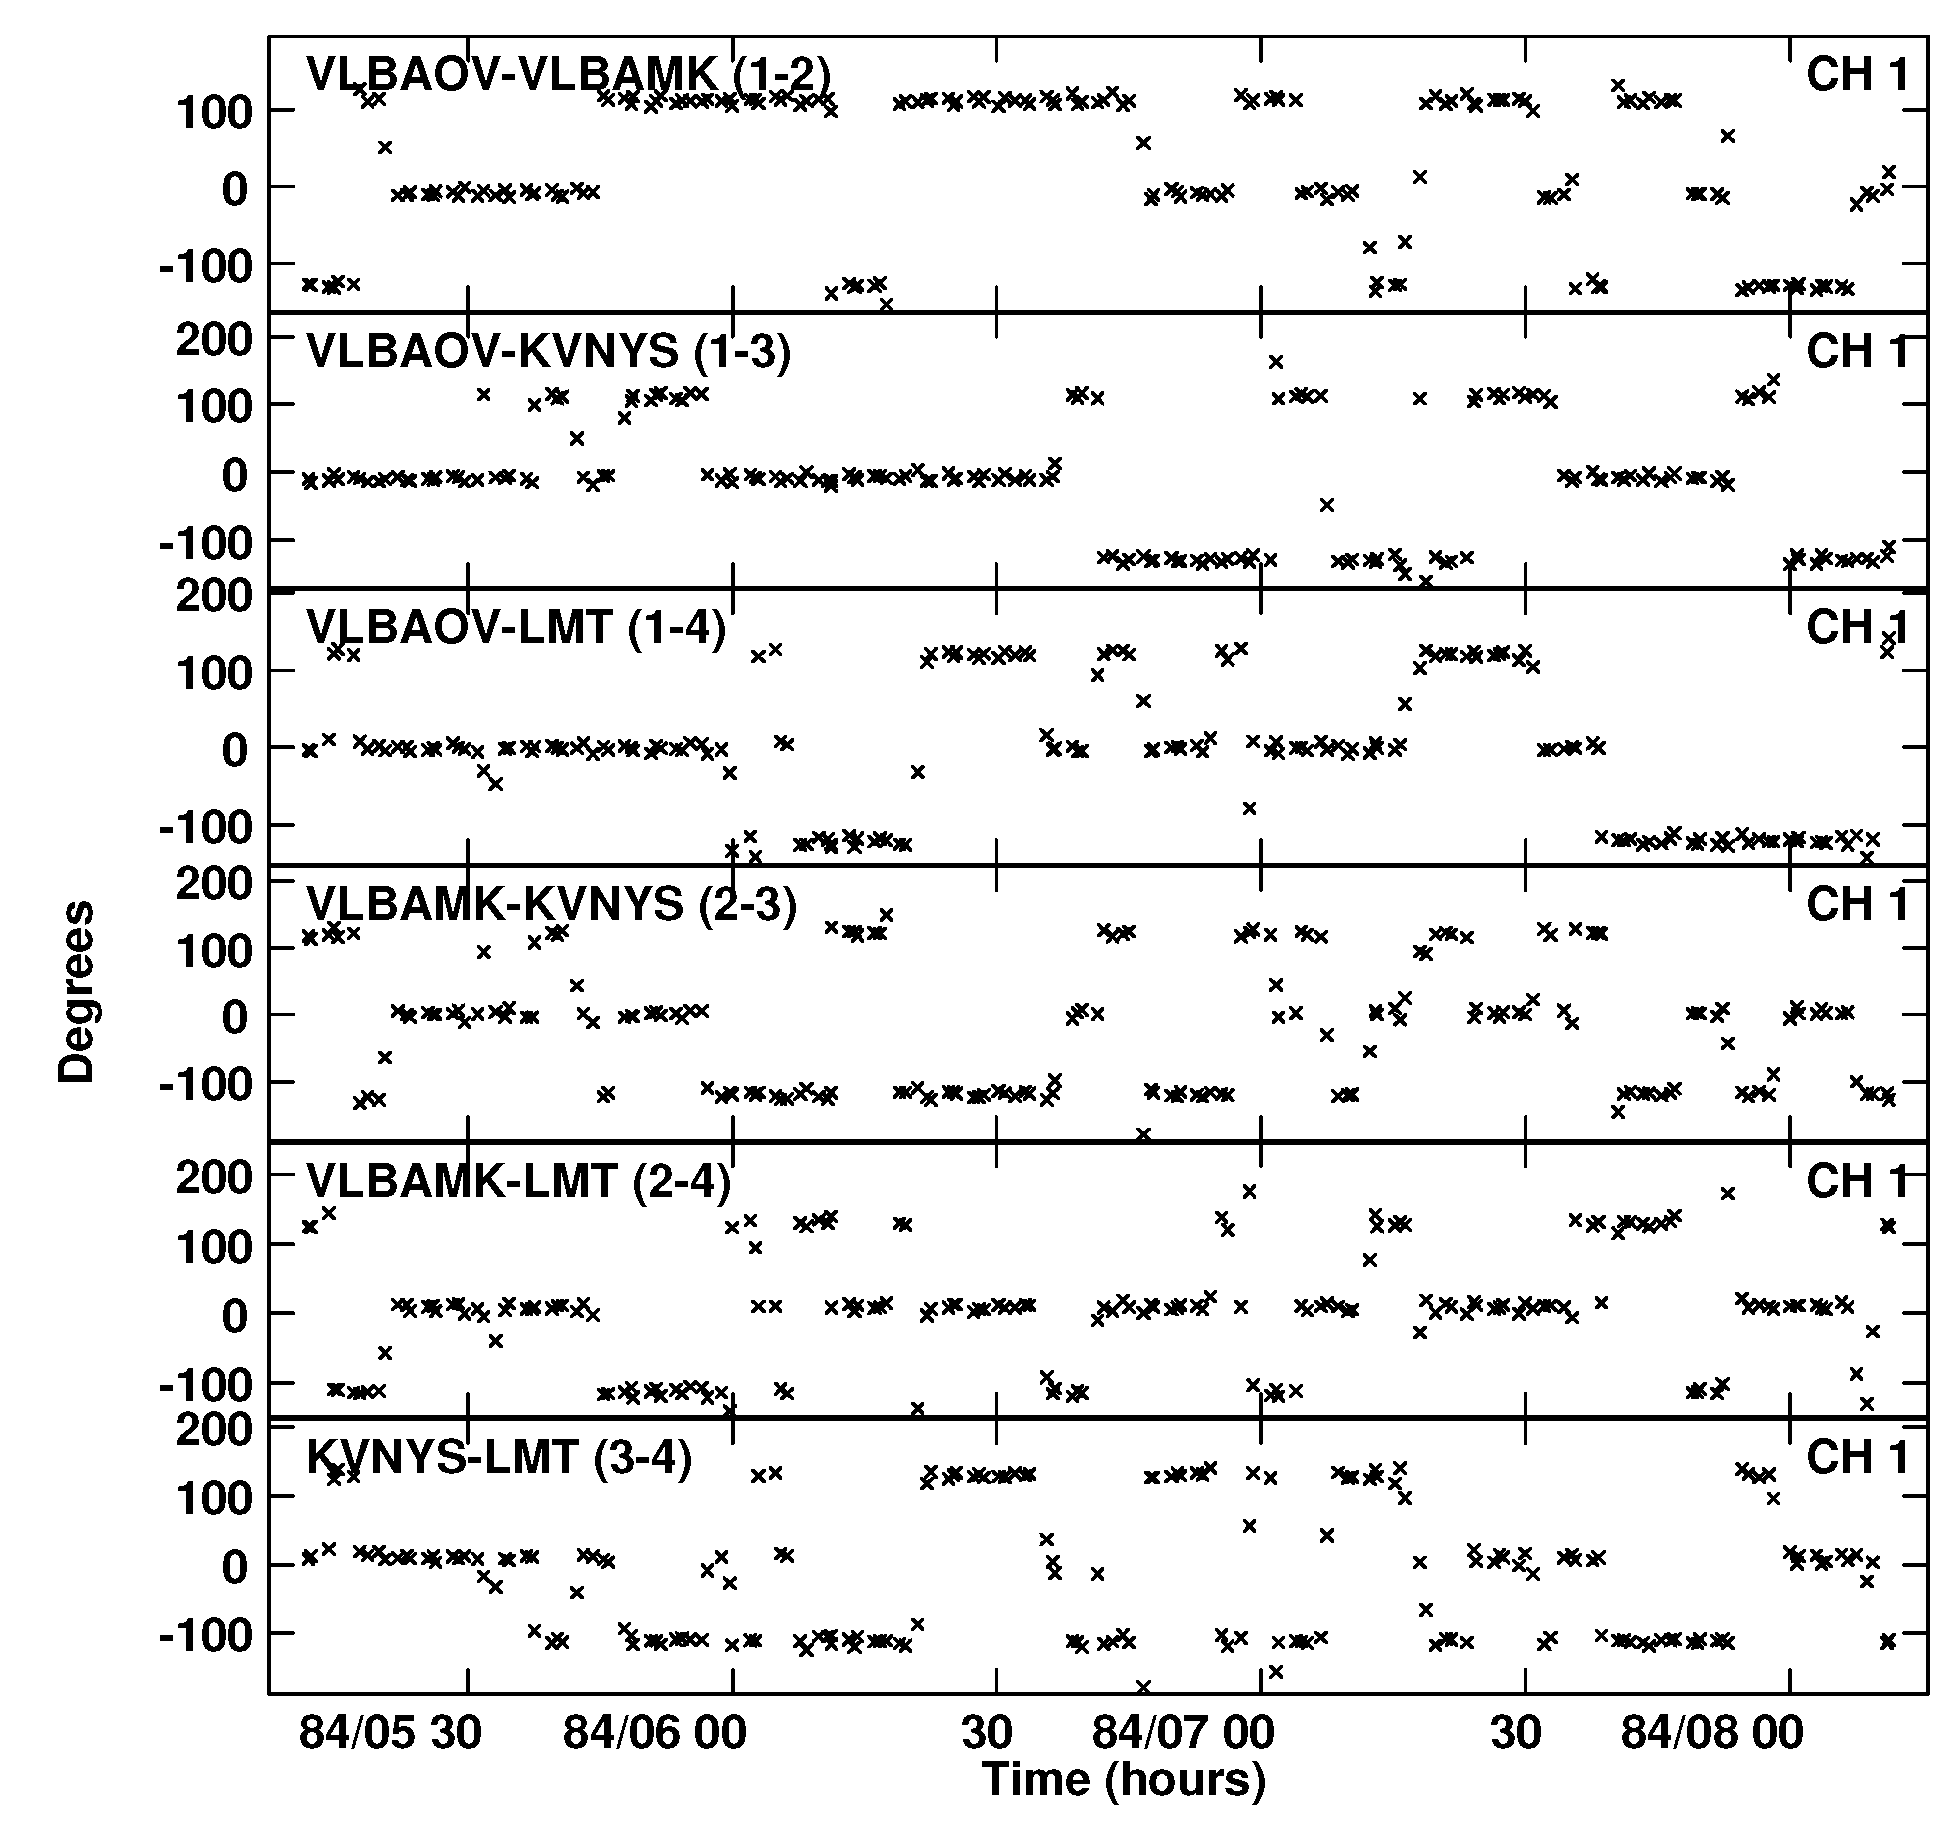
In frequency phase transfer-based methods the frequency ratio is used to scale the phase measured at the low frequency. Therefore, for a non-integer frequency ratio the failure to track intrinsic
phase ambiguities introduces offsets and jumps in the calibrated phases at the high frequency. These jumps have a significant impact in the FPT-coherence, namely, that the phase does not change smoothly, but falls on multiple levels.
Figure 5 shows the synthetic thermal-noise free residual visibility phases at 340 GHz after FPT calibration with 255 GHz simultaneous observations. Here the frequency ratio is 340/255 and thus the phase jump is MOD(340.0/255.0,1), i.e., exactly 1/3 of a turn, or ±120°. Self-calibration on this data on longer timescales will introduce losses, as one would average over multiple levels. These losses are avoided if the ratio is integer, so that no phase jump is introduced, or in the non-integer case if no ambiguities are lost, which can be achieved under Very Good weather conditions (i.e., C
1) or with very short solution intervals on the lower frequency
).
We note that observations are performed over wide bandwidths, rather than at a single frequency. The frequency reference points are selectable and these are all that need to have an integer ratio; these can in principle be outside the observed bandwidth (e.g., [
12]). We would not recommend extrapolating too far from the observed frequency band to reach the reference point; we suggest no further than the spanned bandwidth. We strongly recommend using integer frequency ratios that enable a robust performance and applicability, optimizing the coherence achieved under all weather conditions, allowing for increased sensitivity because of the possibility of longer
and enabling unambiguous bona-fide astrometry.
4.5. Simulations of SgrA* Observations, a Case Study for Scattered Sources
A successful application of frequency phase transfer techniques requires a direct detection, within
(related to the atmospheric coherence time), of the target source at the reference or lower frequency. In the presence of strong scatter-broadening the counter-intuitive situation can arise where the source resolves at the lower frequency whilst at the higher frequency it does not, because the scattering is so much less. This is the case for SgrA*, a main target for EHT and ngEHT studies, with an apparent size of 230 × 140
as at 86 GHz [
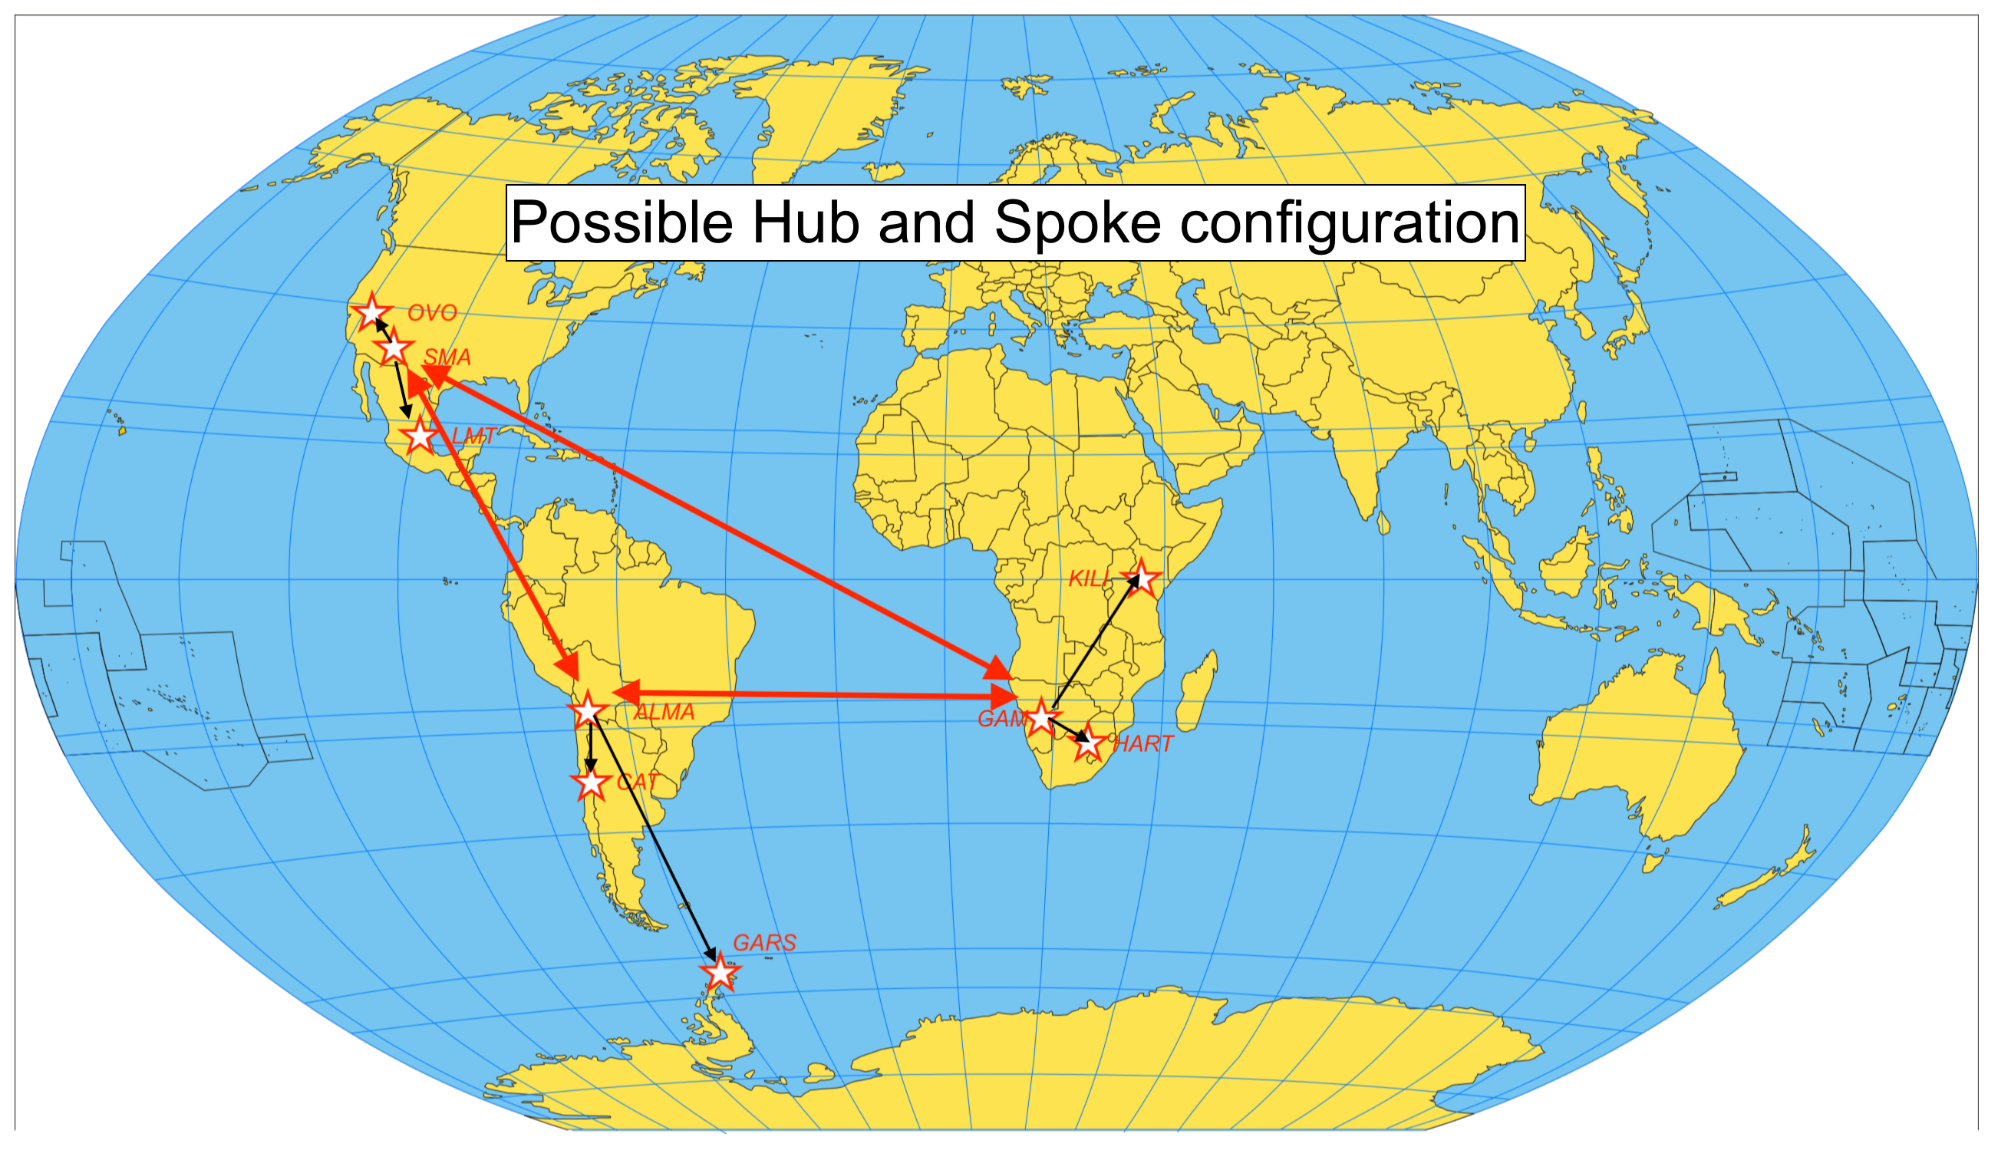
18]. This challenges the FPT approach, but does not make it impossible. In essence what is required is that the array configuration consists of multiple highly sensitive hubs, surrounded by ‘spokes’ to multiple smaller antennas that have shorter baselines, as shown in
Figure 6. We thus did further ARIS simulations with Gaussian source models and a dense network of possible antenna sites. These allow for the formation of hub-and-spoke facets that, in addition to being highly sensitive, then can be phase connected as the separation between the edges of the facets are less than the uv-range limit. Given the size of the scattered source at 86 GHz, this is still difficult; baselines longer than 2250 km would be hard to use in the calibration. Therefore SgrA* is a strong driver for the requirement of the 85 GHz band to cover 115-GHz, which would still be an integer ratio to the 230- and 345-GHz frequencies. At 115-GHz the source size is 140 × 115
as and baselines out to 1.5 G
have correlated fluxes greater than 0.1 Jy.
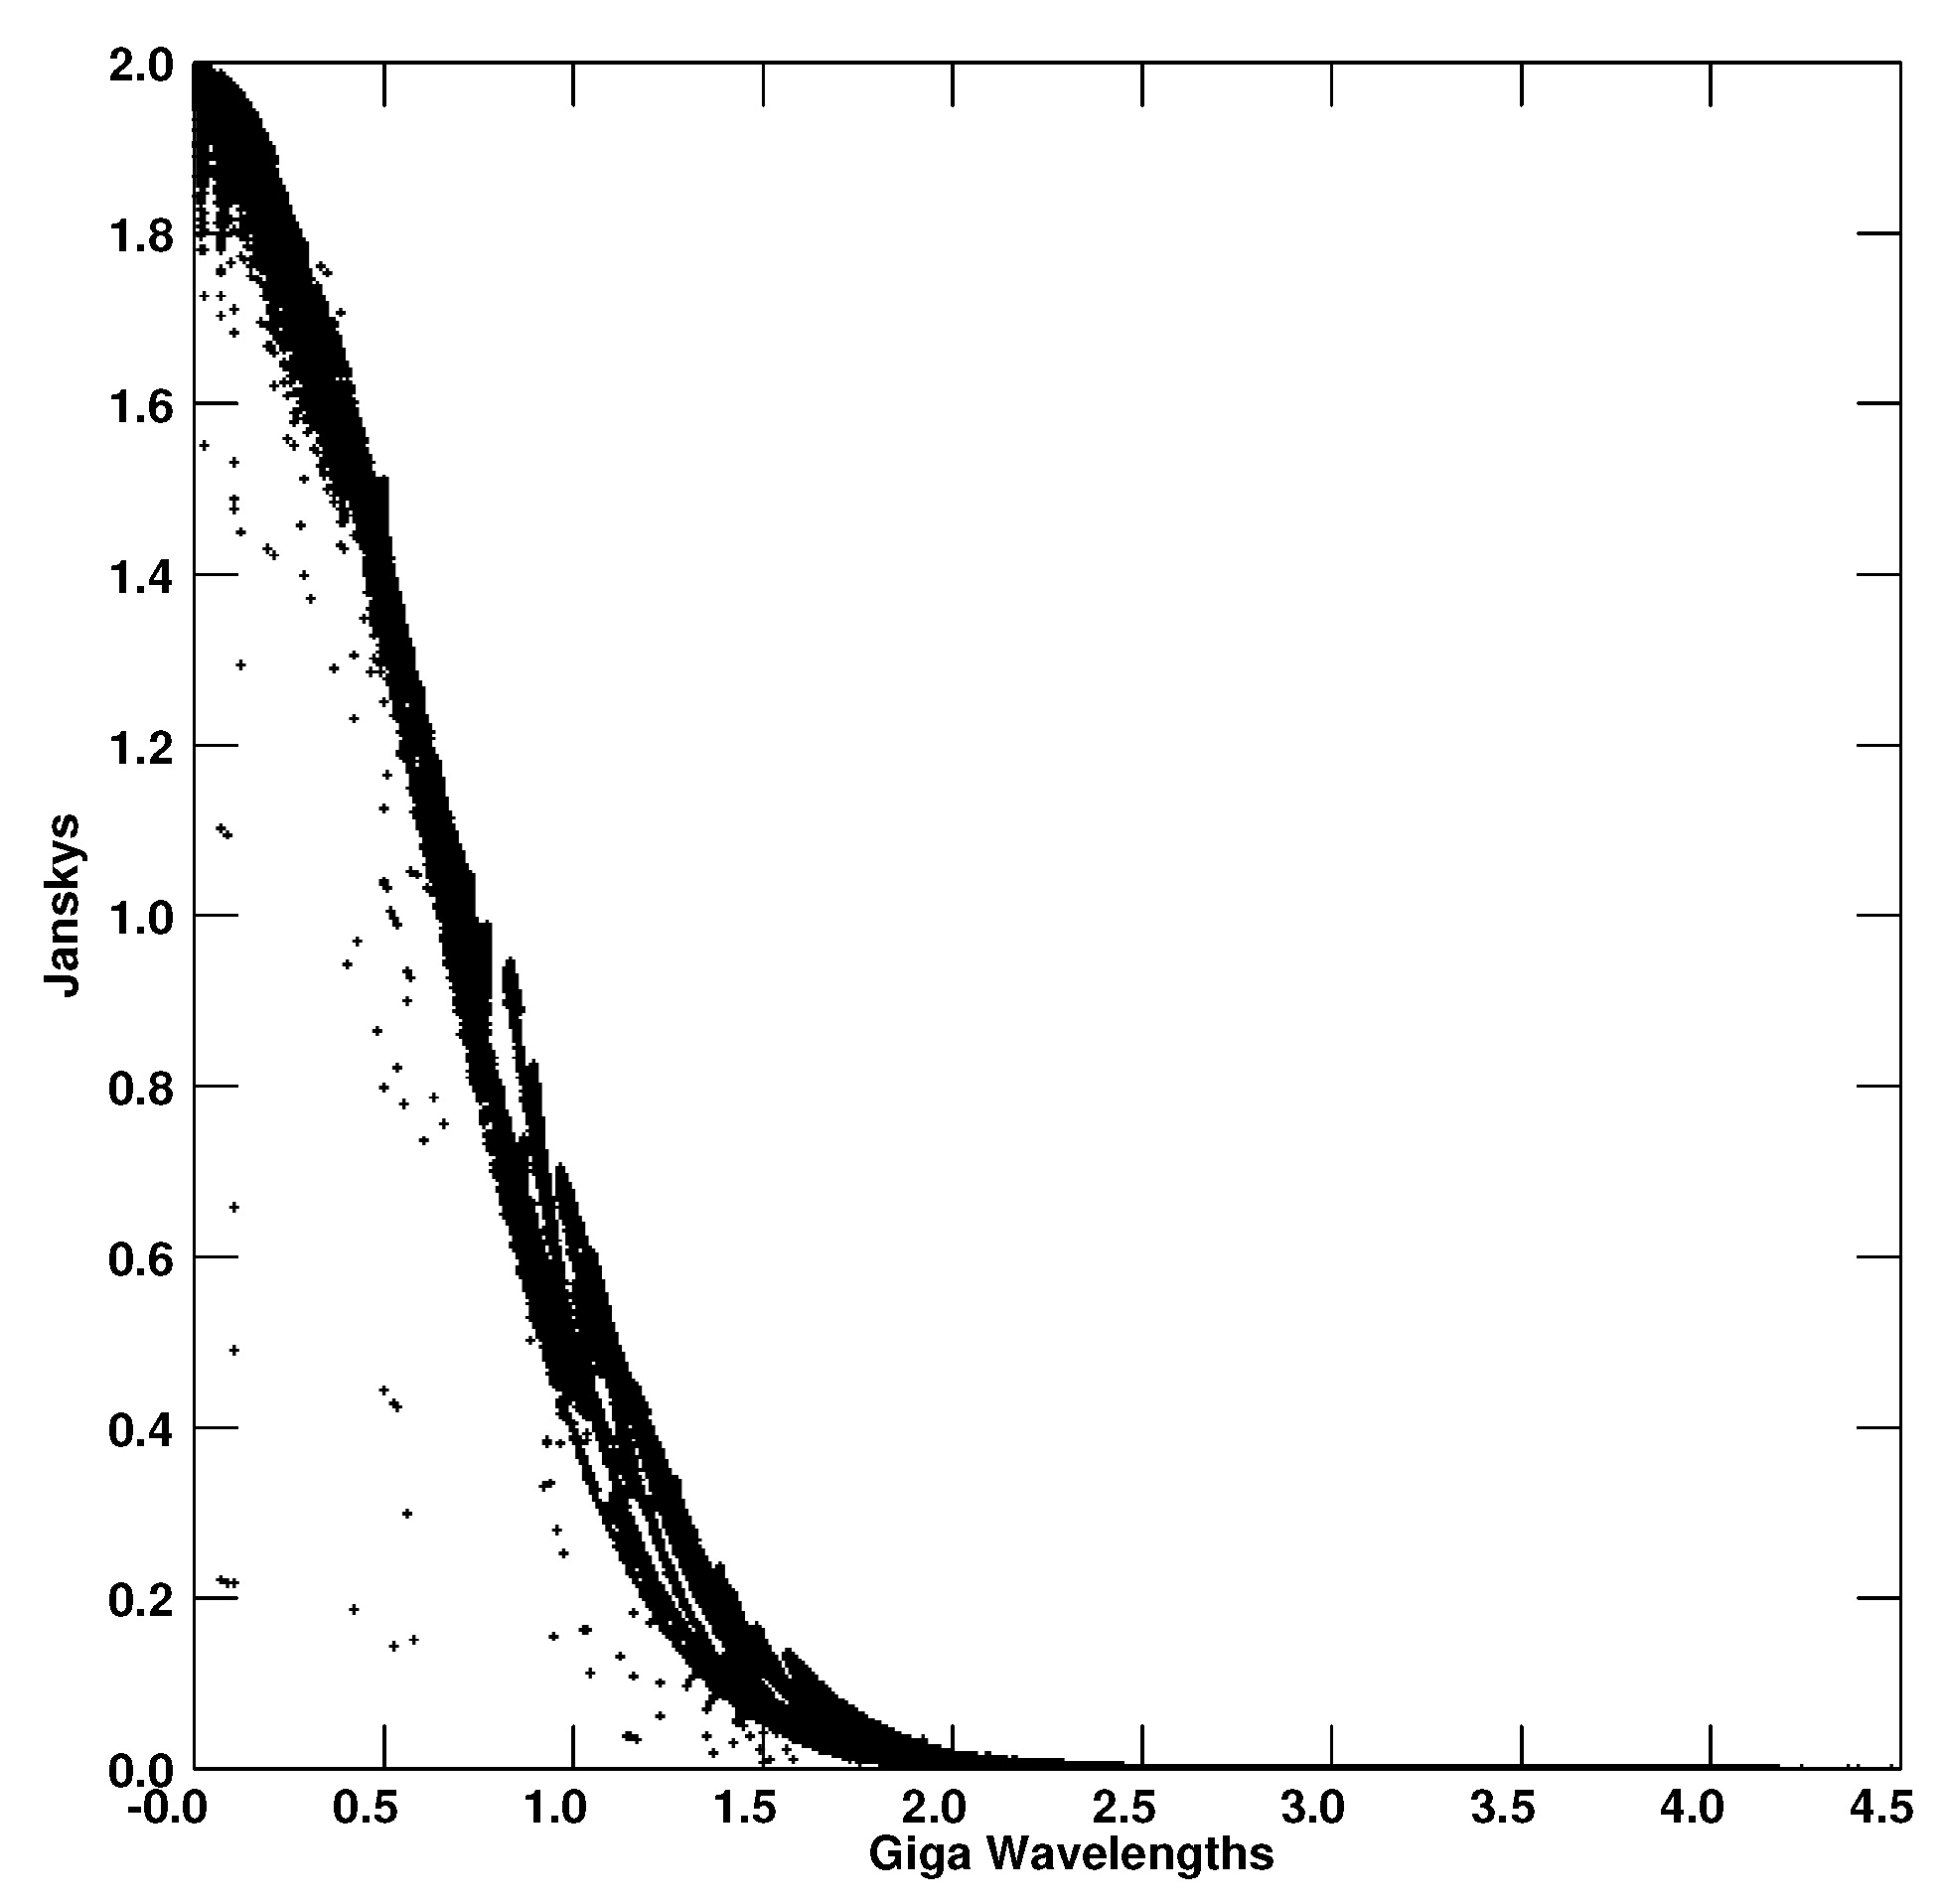
Figure 7 shows the uv-amplitude plot of the simulated data with this model at 115 GHz in the direction of SgrA*. In this case baselines out to ∼4000 km can be used in the calibration. Facets based in the Americas, Europe and Africa can then be connected. Identification of suitable candidate hub sites in S. America, N. America, Africa and Europe should be undertaken; the main candidates are obvious and
Figure 6 provides an example.
4.6. Paths to Astrometry at Sub-mm Wavelengths
A triple band receiver system and an array configuration with multiple antennas on a limited number of ‘hub’ sites could enable various flavours of innovative astrometric measurements with the ngEHT array that would be impossible to achieve with single frequency observations, which we will discuss here. The first flavour is ‘-Astrometry’, which provides a precise bona-fide registration of the images at different frequencies. The second flavour is ‘conventional’ or relative astrometry, which provides a precise bona-fide measurement of the relative angular separation between a target and a reference source(s) at a given frequency.
4.6.1. -Astrometry
We have estimated the astrometric accuracy at 255- or 340-GHz using the formulae for SFPR systematic astrometric error propagation in Rioja and Dodson [
7], using 85-GHz as the reference frequency, with a source pair angular separation of 10°, baseline lengths up to 6000 km and source switching times up to 10 min. In this case the astrometric precision is predicted to be about 3
as and is dominated by the static ionospheric residuals and the large angular separation.
Source/Frequency Phase Referencing (SFPR) is a well demonstrated astrometric method and has been performed in the frequency range between 43 and to 130-GHz [
8]. The performance and ease of use was excellent, even though this was a three-fold increase over the previous frequency limit for astrometry. Thus, we expect it to work at ngEHT frequencies, i.e., from 85 to 340 GHz, and SFPR should be straight forward with the current proposed array equipped with tri-band receivers. On the other hand, the proposed dual-frequency receiver (230 and 340 GHz) will struggle to provide
-astrometry except in exceptional weather and for strong sources.
The scientific applications of
-astrometry are extensively discussed in [
10] so further comments are not needed here. However we do point out that, once the frequency position offset is measured between 85 GHz and either of the higher bands, one would be able to connect this offset to the ICRF if relative astrometry was performed at the lower frequency. This has been demonstrated at much lower frequencies in Dodson et al. [
12], for example. The application of MultiView to provide this is considered below.
4.6.2. Relative Astrometry
MultiView [
19] with simultaneous observations of multiple sources has the potential to provide a precise astrometry at 85 GHz using ngEHT. We note this is a regime beyond the scope of application of conventional phase referencing techniques. MultiView relies on the observations of multiple calibrators for a precise elimination of the dominant propagation errors from the observations, enabling ultra-precise relative astrometric measurements. It would provide bona-fide astrometry between sources, allowing registered dynamical measurements over time, to make movies of high impact individual sources or carry out statistical surveys of cosmological parallaxes.
MultiView has been demonstrated to provide precise corrections for the atmosphere at 1.4 [
19] and 8 GHz [
20], with on-going investigations at 43 GHz. The calibrator solutions can be spatially interpolated to provide the atmospheric contributions at the target line of sight, which results in an effective angular separation equal to zero degrees. The residual systematic astrometric errors are estimated to be ∼1
as (see the formulae in [
11]).
One would require four (or more) antennas at each astrometric site to perform MultiView at 85 GHz, to provide simultaneous observations of the target and three calibrator sources. ALMA would be able to perform this role when sub-arraying is implemented.
This configuration seems possible for ngEHT and would enable astrometric measurements as a stand-alone instrument. Furthermore, the capability is definitely included in the ngVLA long baseline array planning [
21]. A possible scenario is to perform combined measurements of the relative astrometry with the ngVLA at 85 GHz with the
-astrometry between 85 and 340 GHz with the ngEHT; this would provide relative astrometry at 340 GHz.
4.7. Fundamental Implications on Network Specifications
Frequency phase transfer techniques result in a big boost of the sensitivity at 340 GHz, compared to single-frequency observations, by increasing the coherence time. An increase in effective coherence time from 10 s to 60 min translates to a ∼20-fold decrease in the flux density threshold of detectable sources and a much larger source population within reach. The FPT sensitivity is equivalent to single-frequency 340 GHz observations with an array having a 400-fold increase of bandwidth or a 4-fold increase in antenna diameter.
FPT techniques relax the constraints for suitable sites and/or weather conditions for (sub)mm-VLBI observations, with optimum outcomes having
equal to 85-GHz. This opens the possibilities for more ngEHT sites, which would provide better uv-coverage and better image fidelity. Fewer constrains on the weather will provide extended windows of opportunity for observations, more observing time and improved temporal monitoring.
Figure 8 follows Figure 13.18 of Thompson et al. [
22], showing the empirical relationship between the altitude and the RMS phase fluctuations for a number of well-known telescope sites. Based on this and the RMS path-length values for the weather models used in our simulations we overplot the estimated altitudes corresponding to V, G and T weather conditions. For the best performance with 85 GHz as the reference frequency, site altitudes greater than 2000 m are acceptable, based on the discussions in
Section 4.3. For comparison, with 230 GHz as the reference frequency, site altitudes greater than 4000 m are desired, based on the discussions in
Section 4.2.
Another interesting outcome from the frequency phase transfer-group of calibration methods is that they enable space VLBI at ngEHT frequencies, for highest angular resolution imaging with enhanced sensitivity and ultra precise astrometry. Orbit errors, like tropospheric errors, are non-dispersive hence FPT and SFPR methods will resolve these [
15].
4.8. Requirements & Guidelines
The requirements for the application of frequency phase transfer techniques have been discussed at length in Section 4 of [
7]. Here we summarise the points particularly relevant to ngEHT.
Simultaneous observations at the multiple frequencies is an absolute key requirement, as this is the only way to fully sample the fast tropospheric fluctuations at ngEHT frequencies.
Direct detections at the reference frequency within the relatively short calibration timescale, , is a fundamental requirement; the upper bound for sits between the atmospheric coherence time of the two frequencies ( and ). Note that, since phase errors are also scaled, it is important to optimise the SNR of the dectections. Having 85-GHz as the reference frequency alleviates this requirement with the lower system noise and longer values, and in-general larger source flux densities, compared to 230-GHz.
We strongly recommended that the and frequencies have an integer ratio to avoid phase-ambiguity-related problems in the analysis. Note that it is sufficient that the selected frequency reference points are within or close to the recorded frequency bands. Non-integer frequency ratios will, in general, introduce phase offsets and jumps which would have to be addressed separately.
SgrA* requires observations at 115 GHz and a hub-and-spoke array configuration, so that all stations have sufficiently short sensitive baselines for detections.
We recommend a tri-band receiver system with 85-, 230- and 340-GHz bands. The recorded bandwidth of the 85-GHz system should cover 115 GHz. Care should be taken to ensure that integer frequency ratios are possible within the recorded bands.
Instrumental effects should be less than the residual atmospheric effects post frequency phase transfer analysis. For optimum performance it is required that instrumental effects, including between bands, must be measurable and stable to be better than the equivalent of 1 as or 5 picoseconds. Larger residual instrumental effects might result in these being the dominant source of errors and limit the performance, where not thermally limited.
MultiView will require a small number of ‘hub’ sites, able to carry out simultaneous observations along different lines of sight. This would be sub-arraying for ALMA and for multiple-antenna sites the requirement is for four antennas.
5. Summary and Conclusions
Frequency phase transfer techniques hold the potential to revolutionise (sub)mm-VLBI observations with ngEHT, making possible observations at 340 GHz where single-frequency observations are impossible. FPT and SFPR enable an adaptive phase-based calibration of the tropospheric fluctuations at the target frequency, using simultaneous observations at a reference frequency, of a common source. The best outcomes are expected from the proposed tri-band receiver, which encompass the addition of a 85-GHz band to the original system design of a dual-frequency receiver covering the 230 and 340-GHz bands. Our conclusions are based on the explorations of comparative ngEHT performance at 340 GHz presented in this paper.
Our metrics are primarily the quality of the FPT calibration at 340 GHz, testing the improvements of phase stability and coherence, and the lengths of time over which this is sustained. This FPT-coherence is orders of magnitude longer than the atmospheric-coherence time at the higher ngEHT frequencies. This results in reduced flux-detection limits and increased dynamic range and effective angular resolution in the images.
We show that using 85 GHz as reference in frequency phase transfer methods provides for robust operations of the ngEHT array at 340 GHz under a wider range of weather conditions and from sites that would be marginal for single-frequency 340-GHz VLBI observations. This means that observations at the highest frequencies with ngEHT will be routinely viable over the whole year, for source monitoring and movies of interesting sources. Success using 230 GHz as the reference frequency is possible, but the constraints are more severe. That is, only under Very Good weather conditions ( equal to 0.5, or site altitudes above ∼4000 m) would 230 GHz be a reliable reference frequency, whereas 85 GHz would be reliable even under Good weather conditions ( equal to 1, or site altitudes above ∼2000 m).
A fundamental requirement is for direct detections of the target source at the reference frequency within the timescale. This poses a more severe constraint at 230 GHz, compared to 85 GHz. Based on the ALMA calibrator list, 20% of sources are detectable by ngEHT at 230-GHz whereas 90% are detectable at 85-GHz.
Including the 85-GHz band allows for a richer range of astrometric observations. SFPR provides for -as bona-fide astrometry, for cross-band image registration (-astrometry) between the three bands, and potentially for relative astrometry up to 340 GHz, where not thermally limited. The latter requires four antennas co-observing at a subgroup of sites to perform MultiView astrometry at 85 GHz with -as precision.
For observing highly scatter-broaden sources such as SgrA* with frequency phase transfer methods we recommend a hub-and-spoke configuration for the array, and reference observations at a frequency of 115 GHz.
The benefits of frequency phase transfer techniques extend to the (sub)mm space VLBI regime, where the increase in spatial resolution by orders of magnitude and capacity for ultra precise astrometry will be a game changer.
Finally, a stable and well calibrated multi-frequency instrument is required, with control systems in place to reduce the level of instrumental errors to less than the residuals from the frequency phase transfer methods. We provide specifications such that they do not become the dominant source of errors and limit the performance.
Based on all of the above we conclude that the tri-band system will have a critical impact on the ngEHT scientific outcomes. Frequency phase transfer techniques will enable for (sub)mm VLBI the full range of functionalities available for the cm-VLBI regime, with -as resolution. That is: high sensitivity, high fidelity images, ultra-precise astrometric measurements, routinely-viable year-round imaging and using ground or space VLBI observations. These provide the basis for carrying out monitoring, making movies and performing supermassive black-hole demographic studies, which are key scientific drivers for ngEHT.
Adaptive phase-based FPT and SFPR methods overcome the challenge introduced by fast tropospheric fluctuations and the severe limitations imposed by them at ngEHT frequencies. Its application will provide a transformational impact in the ngEHT array capabilities, changing the (sub)mm-VLBI world. Therefore, we strongly recommend that establishing this capability should be an area of highest priority for the ngEHT.


