Article

Association of Diabetes Mellitus with All-Cause and Cause-Specific Mortality among Patients with Metabolic-Dysfunction-Associated Fatty Liver Disease: A Longitudinal Cohort Study

1
Department of Infectious Diseases, Nanjing Drum Tower Hospital, Clinical College of Nanjing Medical University, Nanjing 210008, China
2
Center of Portal Hypertension, Department of Radiology, Zhongda Hospital, Medical School, Southeast University, Nanjing 210009, China
3
Department of Infectious Diseases, Nanjing Drum Tower Hospital Clinical College of Traditional Chinese and Western Medicine, Nanjing University of Chinese Medicine, Nanjing 210023, China
4
Department of Infectious Diseases, The Affiliated Drum Tower Hospital of Medical School of Nanjing University, Nanjing 210008, China
5
Department of Gerontology, The Affiliated Drum Tower Hospital of Medical School of Nanjing University, Nanjing 210008, China
6
Department of Medicine, The University of Hong Kong, Hong Kong
7
State Key Laboratory of Liver Research, The University of Hong Kong, Hong Kong
8
Department of Pathology, The Affiliated Drum Tower Hospital of Medical School of Nanjing University, Nanjing 210008, China
9
Institute of Viruses and Infectious Diseases, Nanjing University, Nanjing 210093, China
*
Authors to whom correspondence should be addressed.
These authors contributed equally to this work.
J. Pers. Med. 2023, 13(3), 554; https://doi.org/10.3390/jpm13030554
Submission received: 16 February 2023 / Revised: 9 March 2023 / Accepted: 10 March 2023 / Published: 20 March 2023
(This article belongs to the Section Mechanisms of Diseases)

Abstract

:
Background: Diabetes mellitus (DM) is a comorbidity commonly presenting with metabolic-dysfunction-associated fatty liver disease (MAFLD); however, few tests for interaction have been reported. Our target was to evaluate the prognostic implications of DM in patients with different forms of MAFLD. Methods: Using data from the Third National Health and Nutrition Examination Survey (NHANES III) in the United States, we screened 14,797 participants aged 20–74 who received ultrasound examinations from 1988–1994. Among them, 4599 patients met the diagnosis of MAFLD, and we defined mortality as the outcome event. Survival analysis of competitive risk events was performed using Cox regression and sub-distributed risk ratio (SHR). Results: During 21.1 years of follow-up, cardiovascular diseases seemed to be the most common cause of death among MAFLD patients. Of them, DM was present in 25.48% and was independently associated with increased risk of all-cause mortality (HRs: 1.427, 95% CIs: 1.256–1.621, p < 0.001) and cause-specific mortality (cardiovascular-related mortality (HRs: 1.458, 95% CIs: 1.117–1.902, p = 0.005), non-cardiovascular-related mortality (HRs: 1.423, 95% CIs: 1.229–1.647, p < 0.001), and non-cancer-related mortality (HRs: 1.584, 95% CIs: 1.368–1.835, p < 0.001), respectively). Surprisingly, this association was more significant for young patients (p-value for interaction <0.001). Moreover, DM had a greater risk of all-cause and cause-specific mortality among overweight and obese MAFLD patients (p-value for interaction <0.001). Conclusions: DM increased the risk of all-cause and cause-specific mortality (cardiovascular-related, non-cardiovascular-related, and non-cancer-related) in MAFLD patients, especially in younger patients with excess obesity.

1. Introduction

Metabolic-dysfunction-associated fatty liver disease (MAFLD), once known as non-alcoholic fatty liver disease (NAFLD), has emerged as the most prevalent liver disease in the world, impacting over 30% of the general population [1,2]. MAFLD includes a spectrum of liver histological progressions ranging from simple steatosis to varying degrees of fibrosis with infiltration of inflammatory cells. Compared with NAFLD patients, MAFLD patients are more at risk of having broad metabolic traits and higher fibrosis levels [3,4]. Like other chronic liver diseases, it can develop into cirrhosis if fibrosis progresses [5]. In addition, hepatocellular carcinoma (HCC) may happen irrespective of any significant fibrosis or cirrhosis [6].
Although hepatic steatosis progresses slowly in the short term, patients with MAFLD often have metabolic diseases such as hypertension, hyperlipidemia, obesity, and diabetes mellitus (DM) [7]. There were 32 million diabetics aged 20–79 in the United States in 2021, and it as is estimated that 4 million people were undiagnosed, the number of patients with fatty liver complicated with diabetes may be more than reported [8]. Numerous studies have shown a strong association between DM and NAFLD [9]. A 2020 meta-analysis of 22 studies from 16 cohorts showed that DM tripled the risk of severe liver disease, while other metabolic factors were less hazardous than DM [10]. DM seems to be the most powerful predictor of adverse clinical outcomes among these comorbidities [11,12,13]. Compared with NAFLD patients, MAFLD patients had a higher risk of diabetes comorbidities due to more glucose metabolism-related disorders [14]. However, studies on the long-term prognosis of patients classified as MAFLD are minimal. The association between DM and mortality risk from various causes and specific causes in different forms of MAFLD patients is unclear.
Our study used extensive, single, population-based data from the Third National Health and Nutrition Examination Survey (NHANES III) and characterized participants based on the MAFLD definition. We aimed to identify DM with all causes and specific causes of mortality in MAFLD patients.

2. Materials and Methods

2.1. Data Collection and Study Setting

We used data from the Third National Health and Nutrition Examination Survey (NHANES III), which was conducted by the National Center for Health Statistics (NCHS) of the Centers for Disease Control (CDC) of the United States. All surveys used a complex, multi-stage, stratified subset of non-institutional civilian participants from 1988 to 1994. The NCHS of the CDC provided a link to mortality data, as of 31 December 2015, from the nationwide death index. The study was based on the Declaration of Helsinki. The NHANES protocol was approved by the National Center for Health Statistics Research Ethics Review Board.

2.2. Study Variable Measurement

The ultrasound examinations were performed on 14,797 adults aged 20–74 years who were examined in NHANES III during 1988–1994. This study used a DVD-VHS videocassette recorder system to digitize videotapes of ultrasounds, and a board-certified radiologist trained three ultrasound readers to evaluate hepatic steatosis. Excluding missing and ungradable images, the following five ultrasonographic findings were used to evaluate the extent of steatosis: liver-to-kidney contrast, parenchymal brightening, deep beam attenuation, vessel walls, and gallbladder wall. Professionals classified hepatic steatosis into ordinary, mild, moderate, and severe. DM may be diagnosed if any of the following conditions are met: (1) self-reported medical history of DM, (2) fasting plasma glucose (FPG) ≥ 126 mg/dL (7.0 mmol/L), (3) 2 h plasma glucose (2 h PG) ≥ 200 mg/dL (11.1 mmol/L) during OGTT, and (4) HbA1c ≥ 6.5% [15]. Several new diagnostic criteria have been proposed for MAFLD based on evidence of hepatic steatosis (detected either by imaging techniques, blood biomarkers/scores, or by liver histology) as well as at least one of the following three conditions: overweight/obesity (BMI ≥ 25 kg/m2), the presence of DM, and lean/normal body weight with signs of metabolic dysregulation [16]. Finally, 4599 MAFLD patients were screened out.

2.3. Clinical and Laboratory Assessments

We obtained the following data from the dataset: demographic indicators regarding age, gender, ethnicity, BMI, and poverty income ratio (PIR). The definition of hypertension is a blood pressure value ≥ 140/90 mmHg or current antihypertensive medication use [17]. The serological parameters retrieved from the database and studied included alanine aminotransferase (ALT), aspartate aminotransferase (AST), C-reactive protein (CRP), alkaline phosphatase (ALP), total cholesterol (TC), high-density lipoprotein cholesterol (HDL-C), total triglyceride (TG), serum ferritin (SF), vitamin A, vitamin C, vitamin E, serum selenium, platelet (PLT), uric acid (UA), total protein, albumin (ALB), serum creatinine (SCR), HOMA-IR, and estimated glomerular filtration rate (eGFR). The presence of hepatic fibrosis was assessed using the fibrosis score 4 (FIB-4) and non-invasive NAFLD fibrosis score (NFS), as these scores may provide the best diagnostic yield for detecting advanced fibrosis [18]. The specific calculation methods of the above formulas have been elaborated in previous studies and will not be repeated here [19,20,21,22].

3. Results

3.1. Baseline Characteristics of the Included Population

Figure 1 depicts the patient characteristics in the current study. We screened 14,797 participants between 20 and 74, including 4599 patients with MAFLD. Of them, 25.5% of patients were diagnosed with DM. Compared to the non-DM group, the DM patients were older (median age: 60 vs. 42, p < 0.001) and more frequently female (55.6% vs. 48.8%, p < 0.001) (Supplementary Table S2).
PSM yielded 1172 pairs of DM-MAFLD and non-DM MAFLD patients with balanced characteristics (age and gender). Table 1 shows that DM was less common in non-Hispanic Whites (33.3%) but more common in Mexican Americans (39.2%, p < 0.001). Patients with DM were more commonly obese (54.9% vs. 42.2%, p < 0.001) and had a lower poverty income ratio (PIR < median, 56.2% vs. 43.7%, p < 0.001). In terms of serological indicators, DM patients had higher levels of liver enzymes (ATL: 18 (13, 27) vs. 16 (12, 24), ALP: 95 (77, 117) vs. 86 (71, 103), p < 0.001), a worse metabolic profile (TG: 2.07 (1.5, 3.08) vs. 1.64 (1.15, 2.36), HDL-C: 1.1 (0.93, 1.34) vs. 1.22 (1.01, 1.45), p < 0.001), and poorer liver function (ALB: 41 (38, 43) vs. 41 (39, 44), PLT: 263 (220, 315.5) vs. 271 (228, 320.5), p < 0.05). Moreover, DM patients showed more severe hepatic steatosis (27.8% vs. 18.3%, p < 0.001) and higher noninvasive liver fibrosis scores (NFS ≥ 0.676, 20.2% vs. 8.1%; FIB-4 ≥ 2.67, 4.4% vs. 3.6%, p < 0.001).

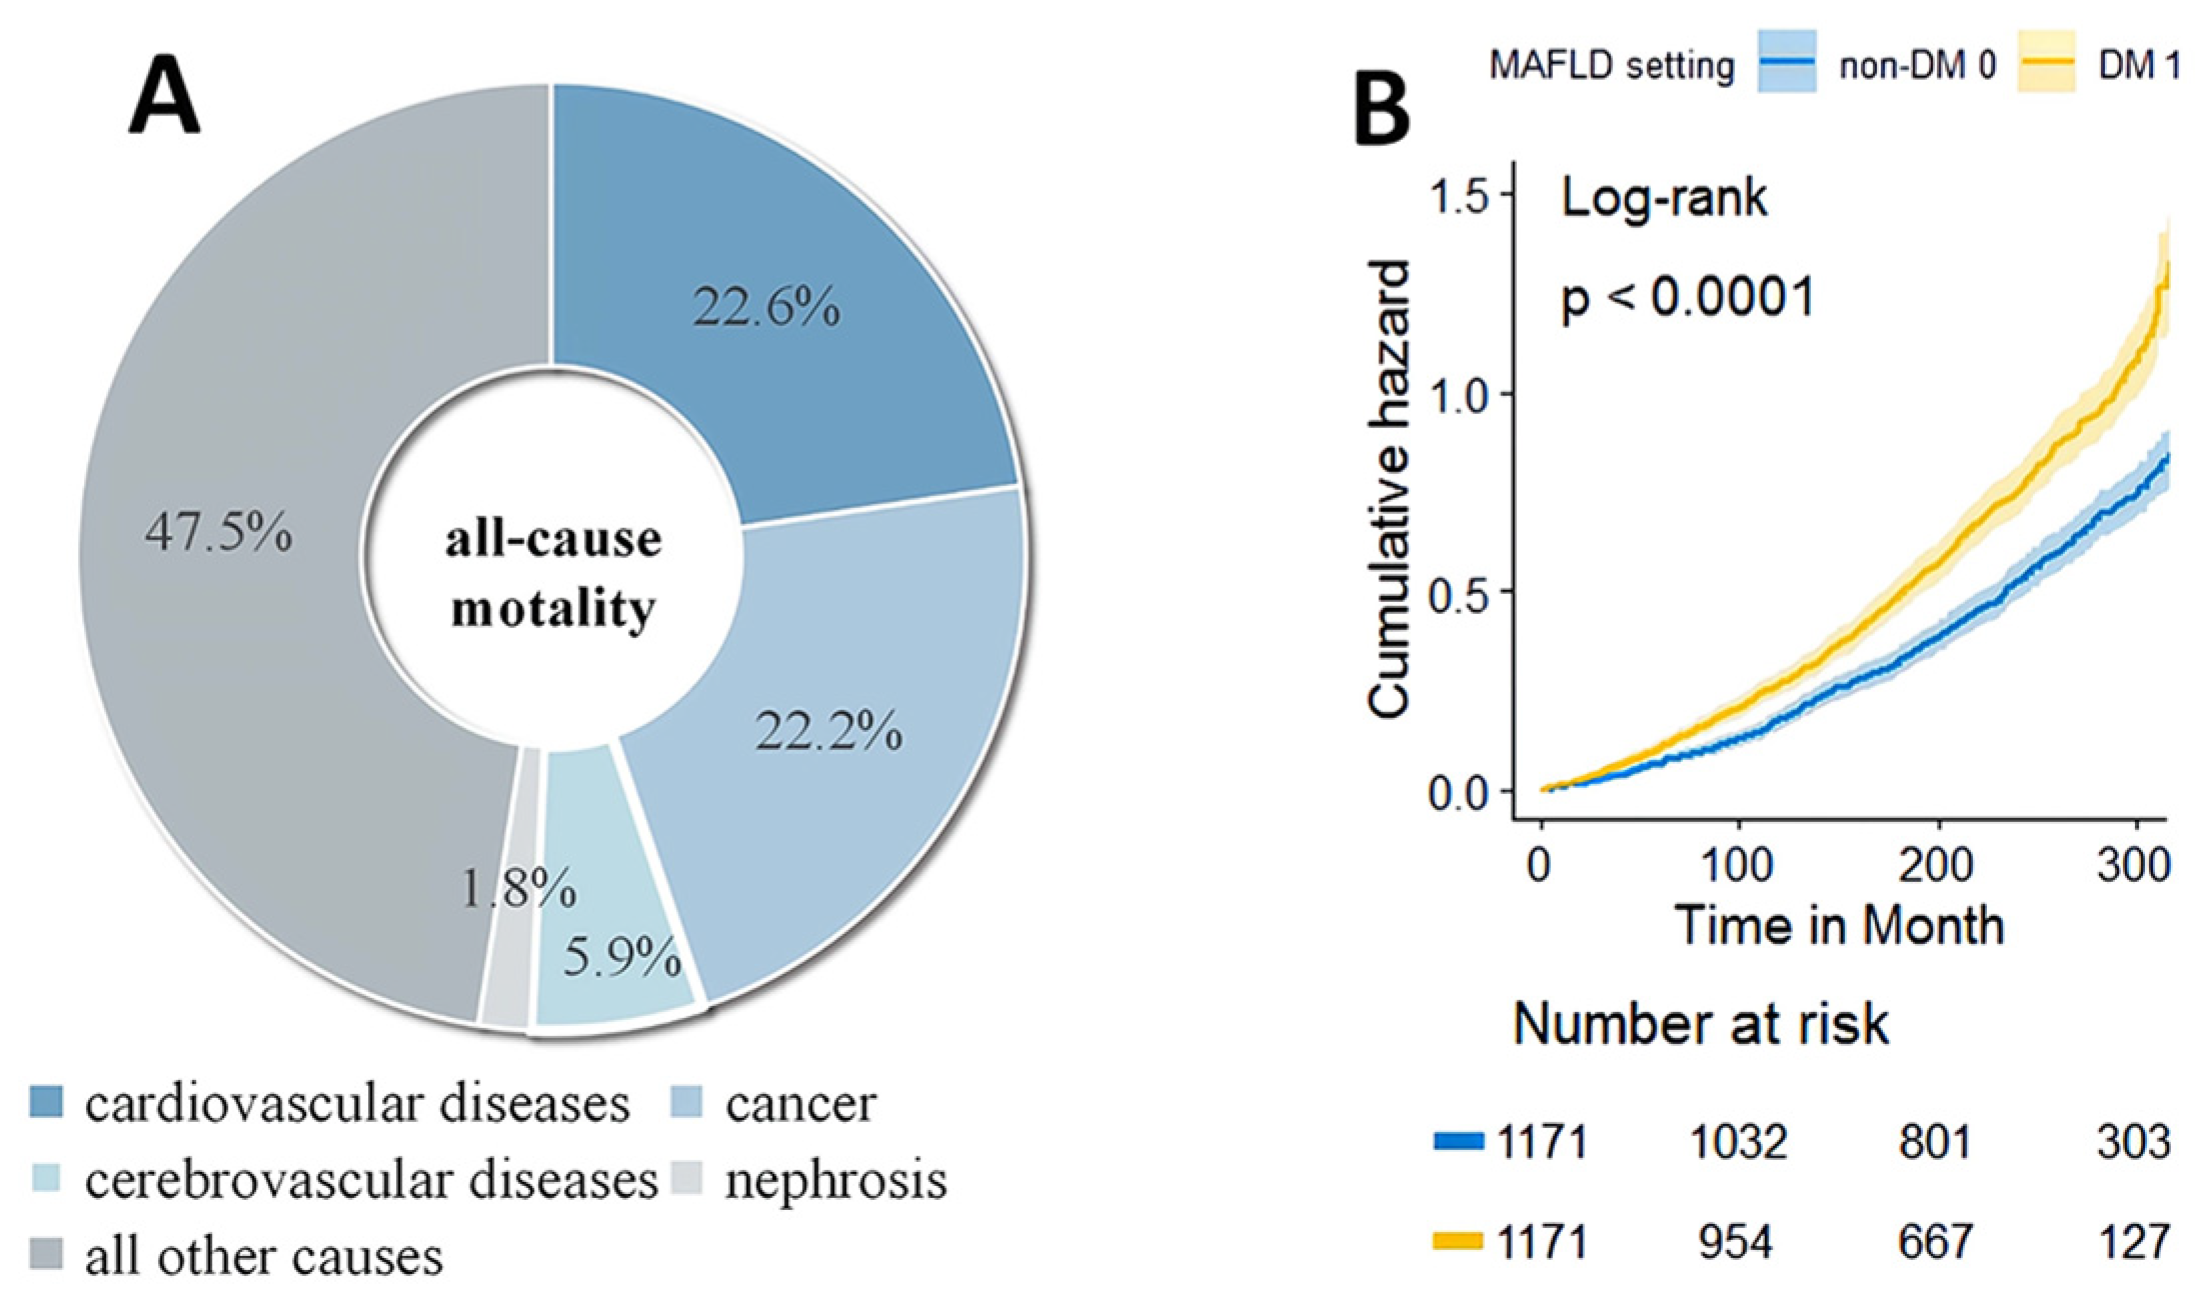
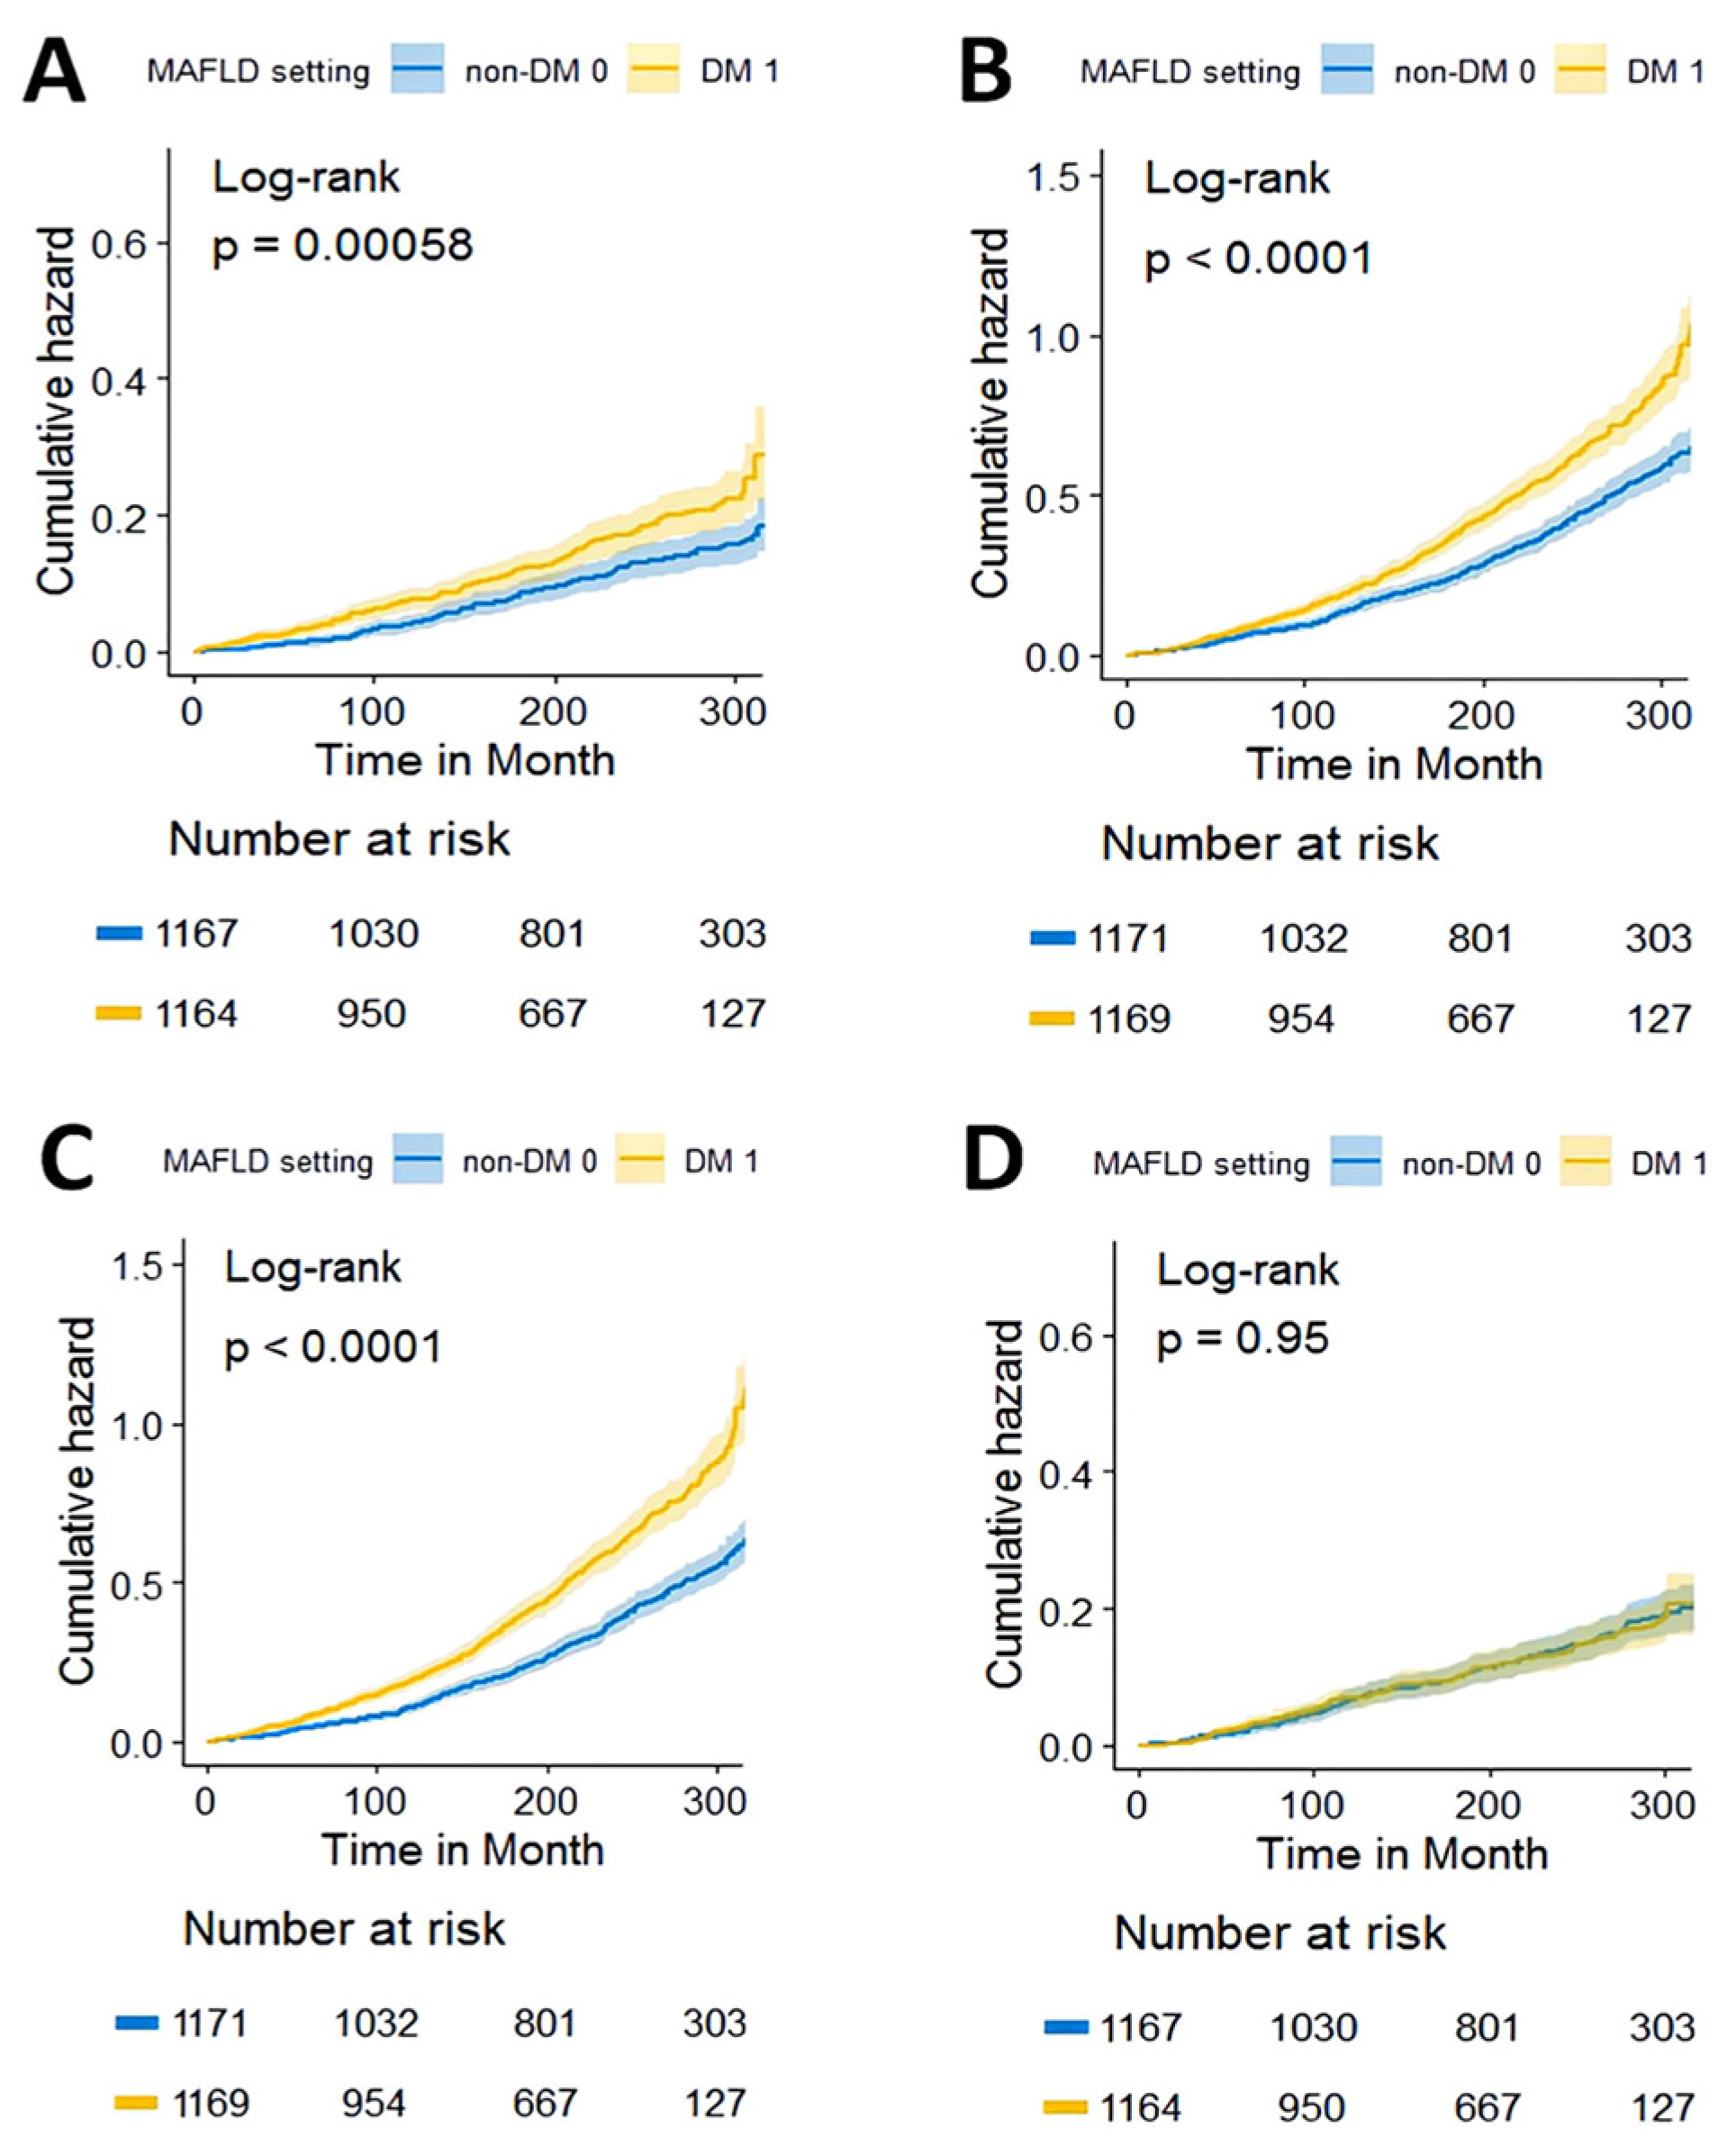
3.2. Relationship between DM and Overall and Specific Causes of Mortality in MAFLD Patients

With death as the outcome, age, gender, ethnicity, PIR, hypertension, DM, vitamin C, ALP, ALB, SCR, and NFS scores were finally selected for further adjustment using LASSO regulation. By univariate as well as multifactorial Cox regression, our study confirmed DM as an independent risk factor for death in MAFLD patients (Supplementary Table S3). There were 1366 reported deaths during the median 21.1-year follow-up period. Regarding cause-specific mortality, cardiovascular disease accounted for 308 deaths, and cancer accounted for 302 deaths. The most common cause of death in MAFLD patients appeared to be cardiovascular disease (Figure 2A).
In patients with MAFLD, DM was associated with a higher risk of all-cause mortality (Figure 2B, HRs: 1.459, 95% CIs: 1.31–1.623). The conclusion persisted in the full age group and across BMI levels (Supplementary Figure S1). Relative to non-DM patients, DM patients had a higher risk of cardiovascular-related mortality (Figure 3A, HRs: 1.475, 95% CIs: 1.176–1.849), non-cardiovascular-related mortality (Figure 3B, HRs: 1.446, 95% CIs: 1.280–1.634), and non-cancer-related mortality (Figure 3C, HRs: 1.622, 95% CIs: 1.435–1.834) (Table 2). However, we found no differences in cancer-related mortality between DM and non-DM patients (Figure 3D, Table 2).
After considering known demographic variables (model 1: adjusted by age, gender, ethnicity, PIR) and traditional risk factors (model 2: model 1+ adjusted by hypertension and BMI), the association of DM with mortality for all causes and specific causes remained significantly higher (Table 2). In fully adjusted models (model 3: model 2 + adjusted by vitamin C, ALP, ALB, SCR, and NFS scores), those with diabetes had a 42.7% (HRs: 1.427, 95% CIs: 1.256–1.621, p < 0.001), 45.8% (HRs: 1.458, 95% CIs: 1.117–1.902, p = 0.005), 42.3% (HRs: 1.423, 95% CIs: 1.229–1.647, p < 0.001), and 58.4% (HRs: 1.584, 95% CIs: 1.368–1.835, p < 0.001) higher risk of all-cause mortality, cardiovascular mortality, non-cardiovascular-related mortality, and non-cancer-related mortality, respectively, than patients DM. Similarly, the association of DM with cancer-related mortality remained nonsignificant after adjustment for covariates in all models (Table 2).

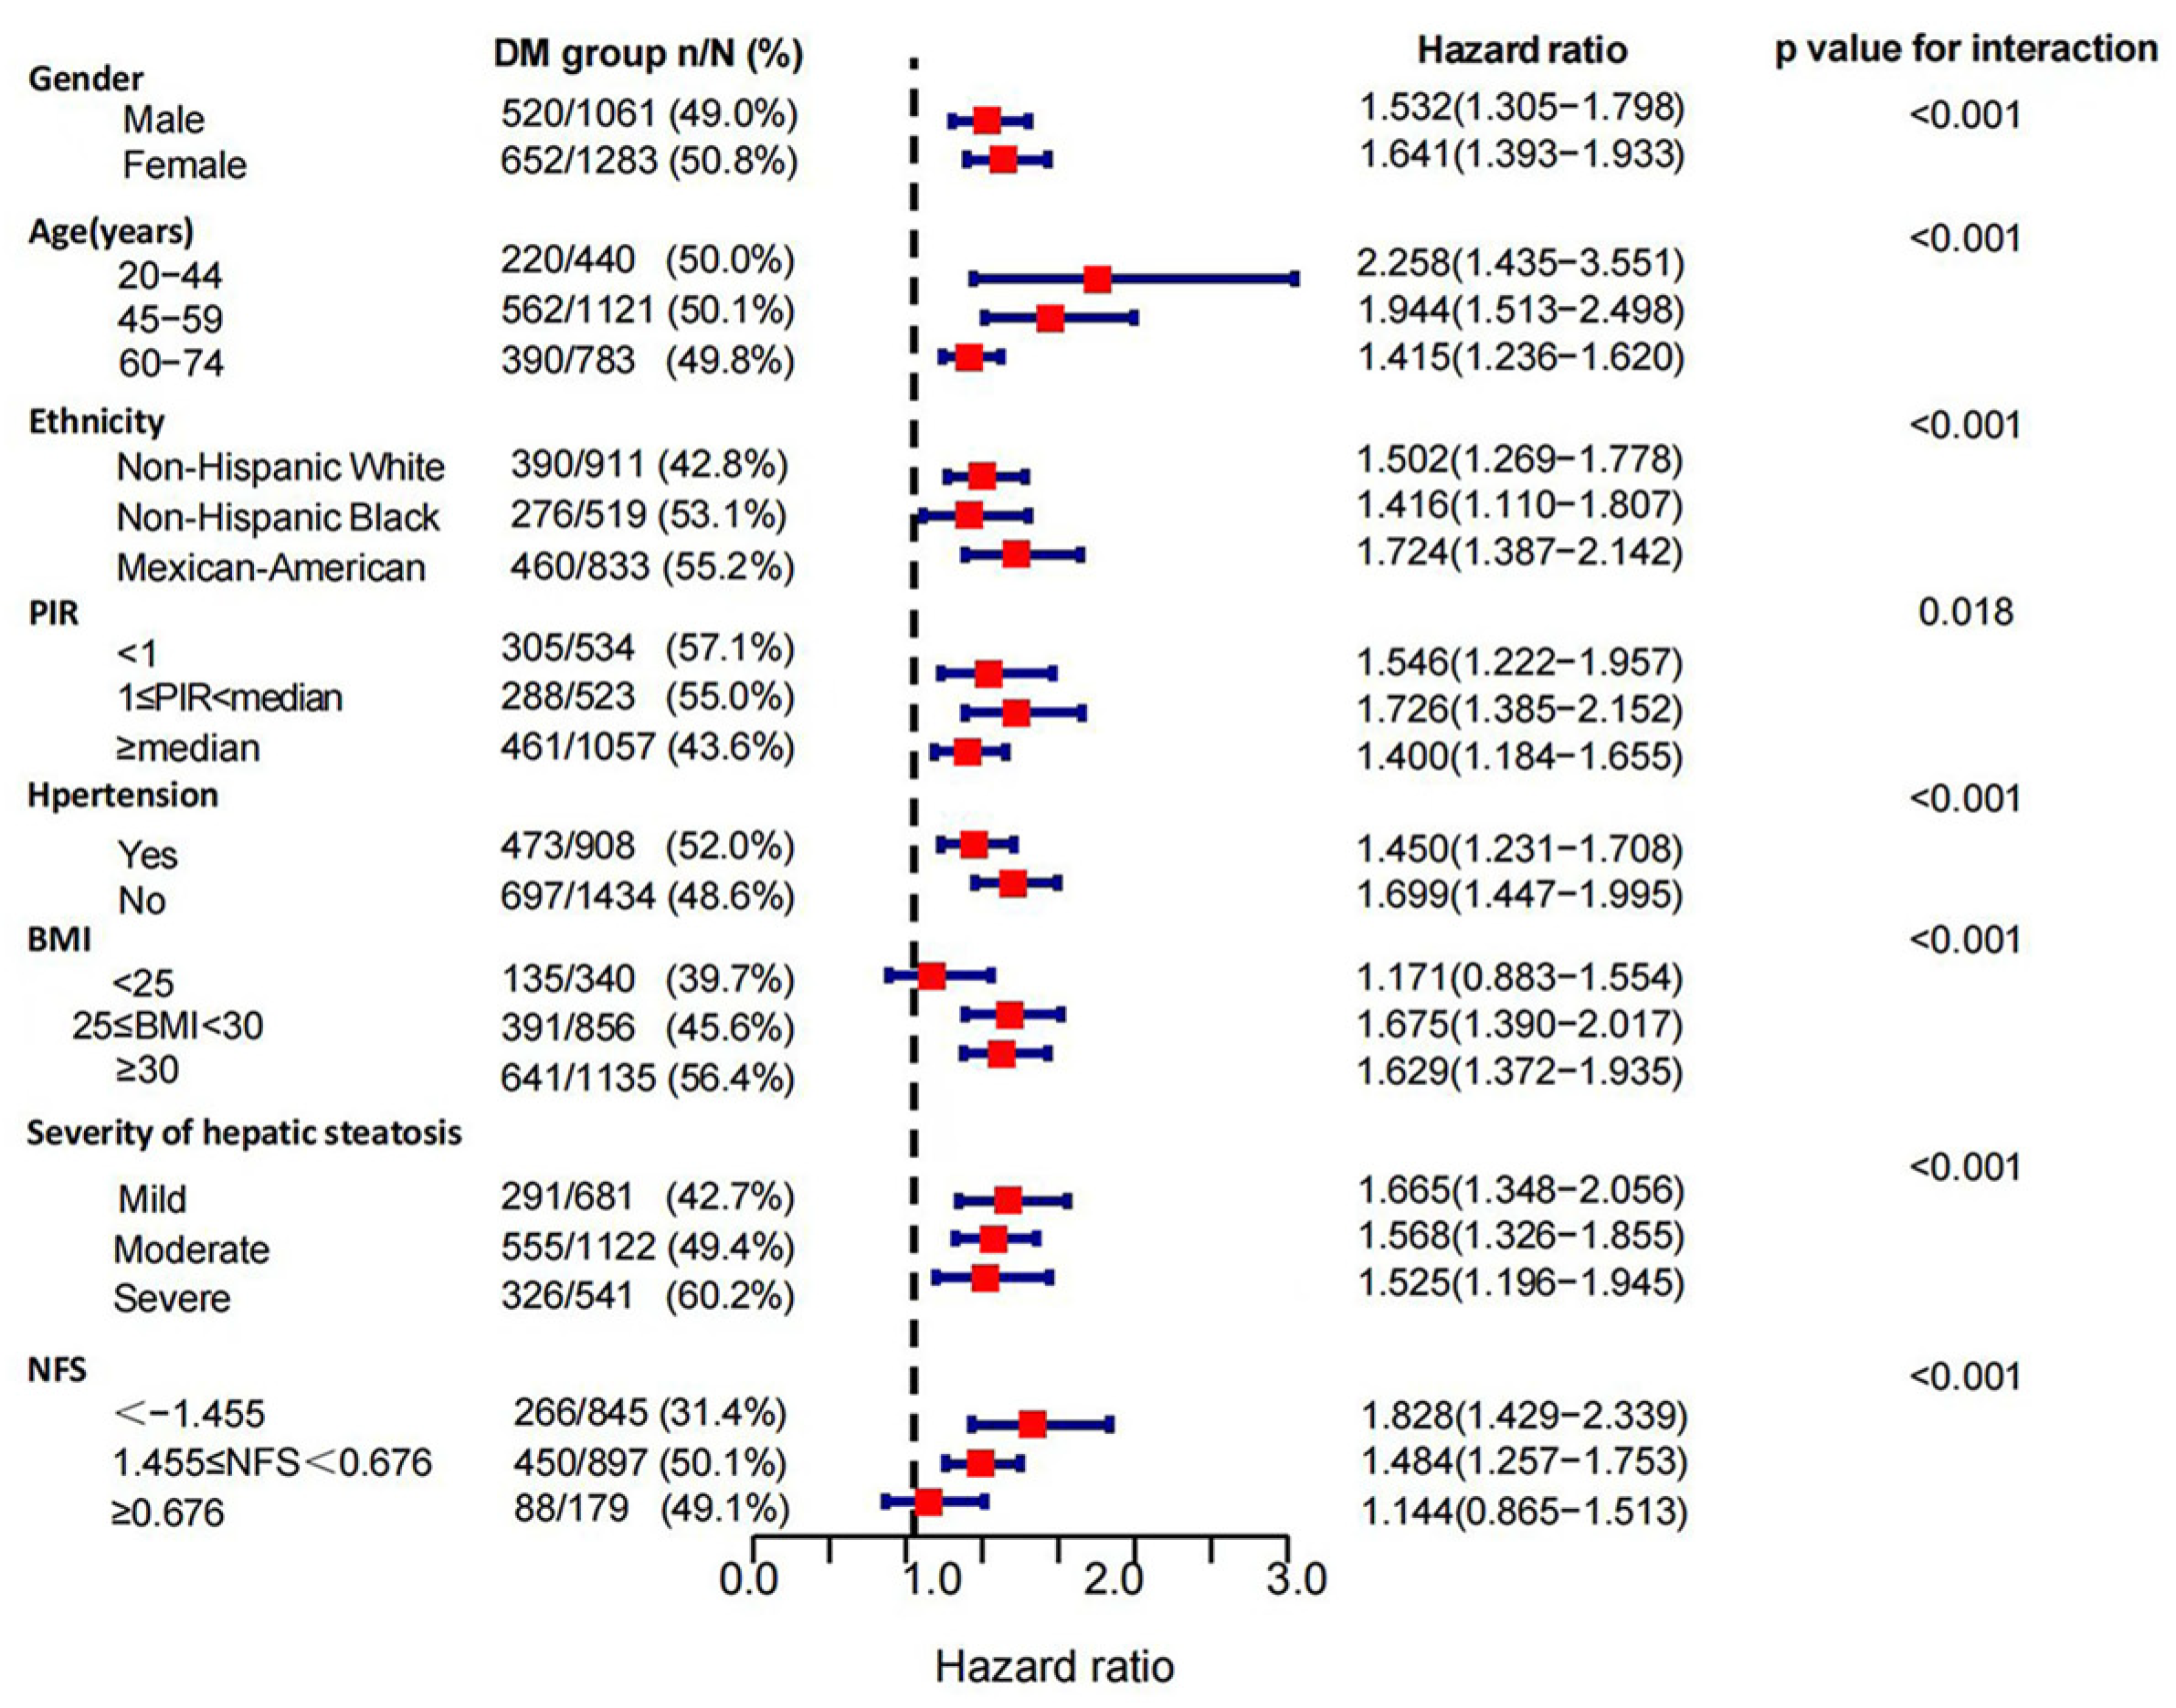
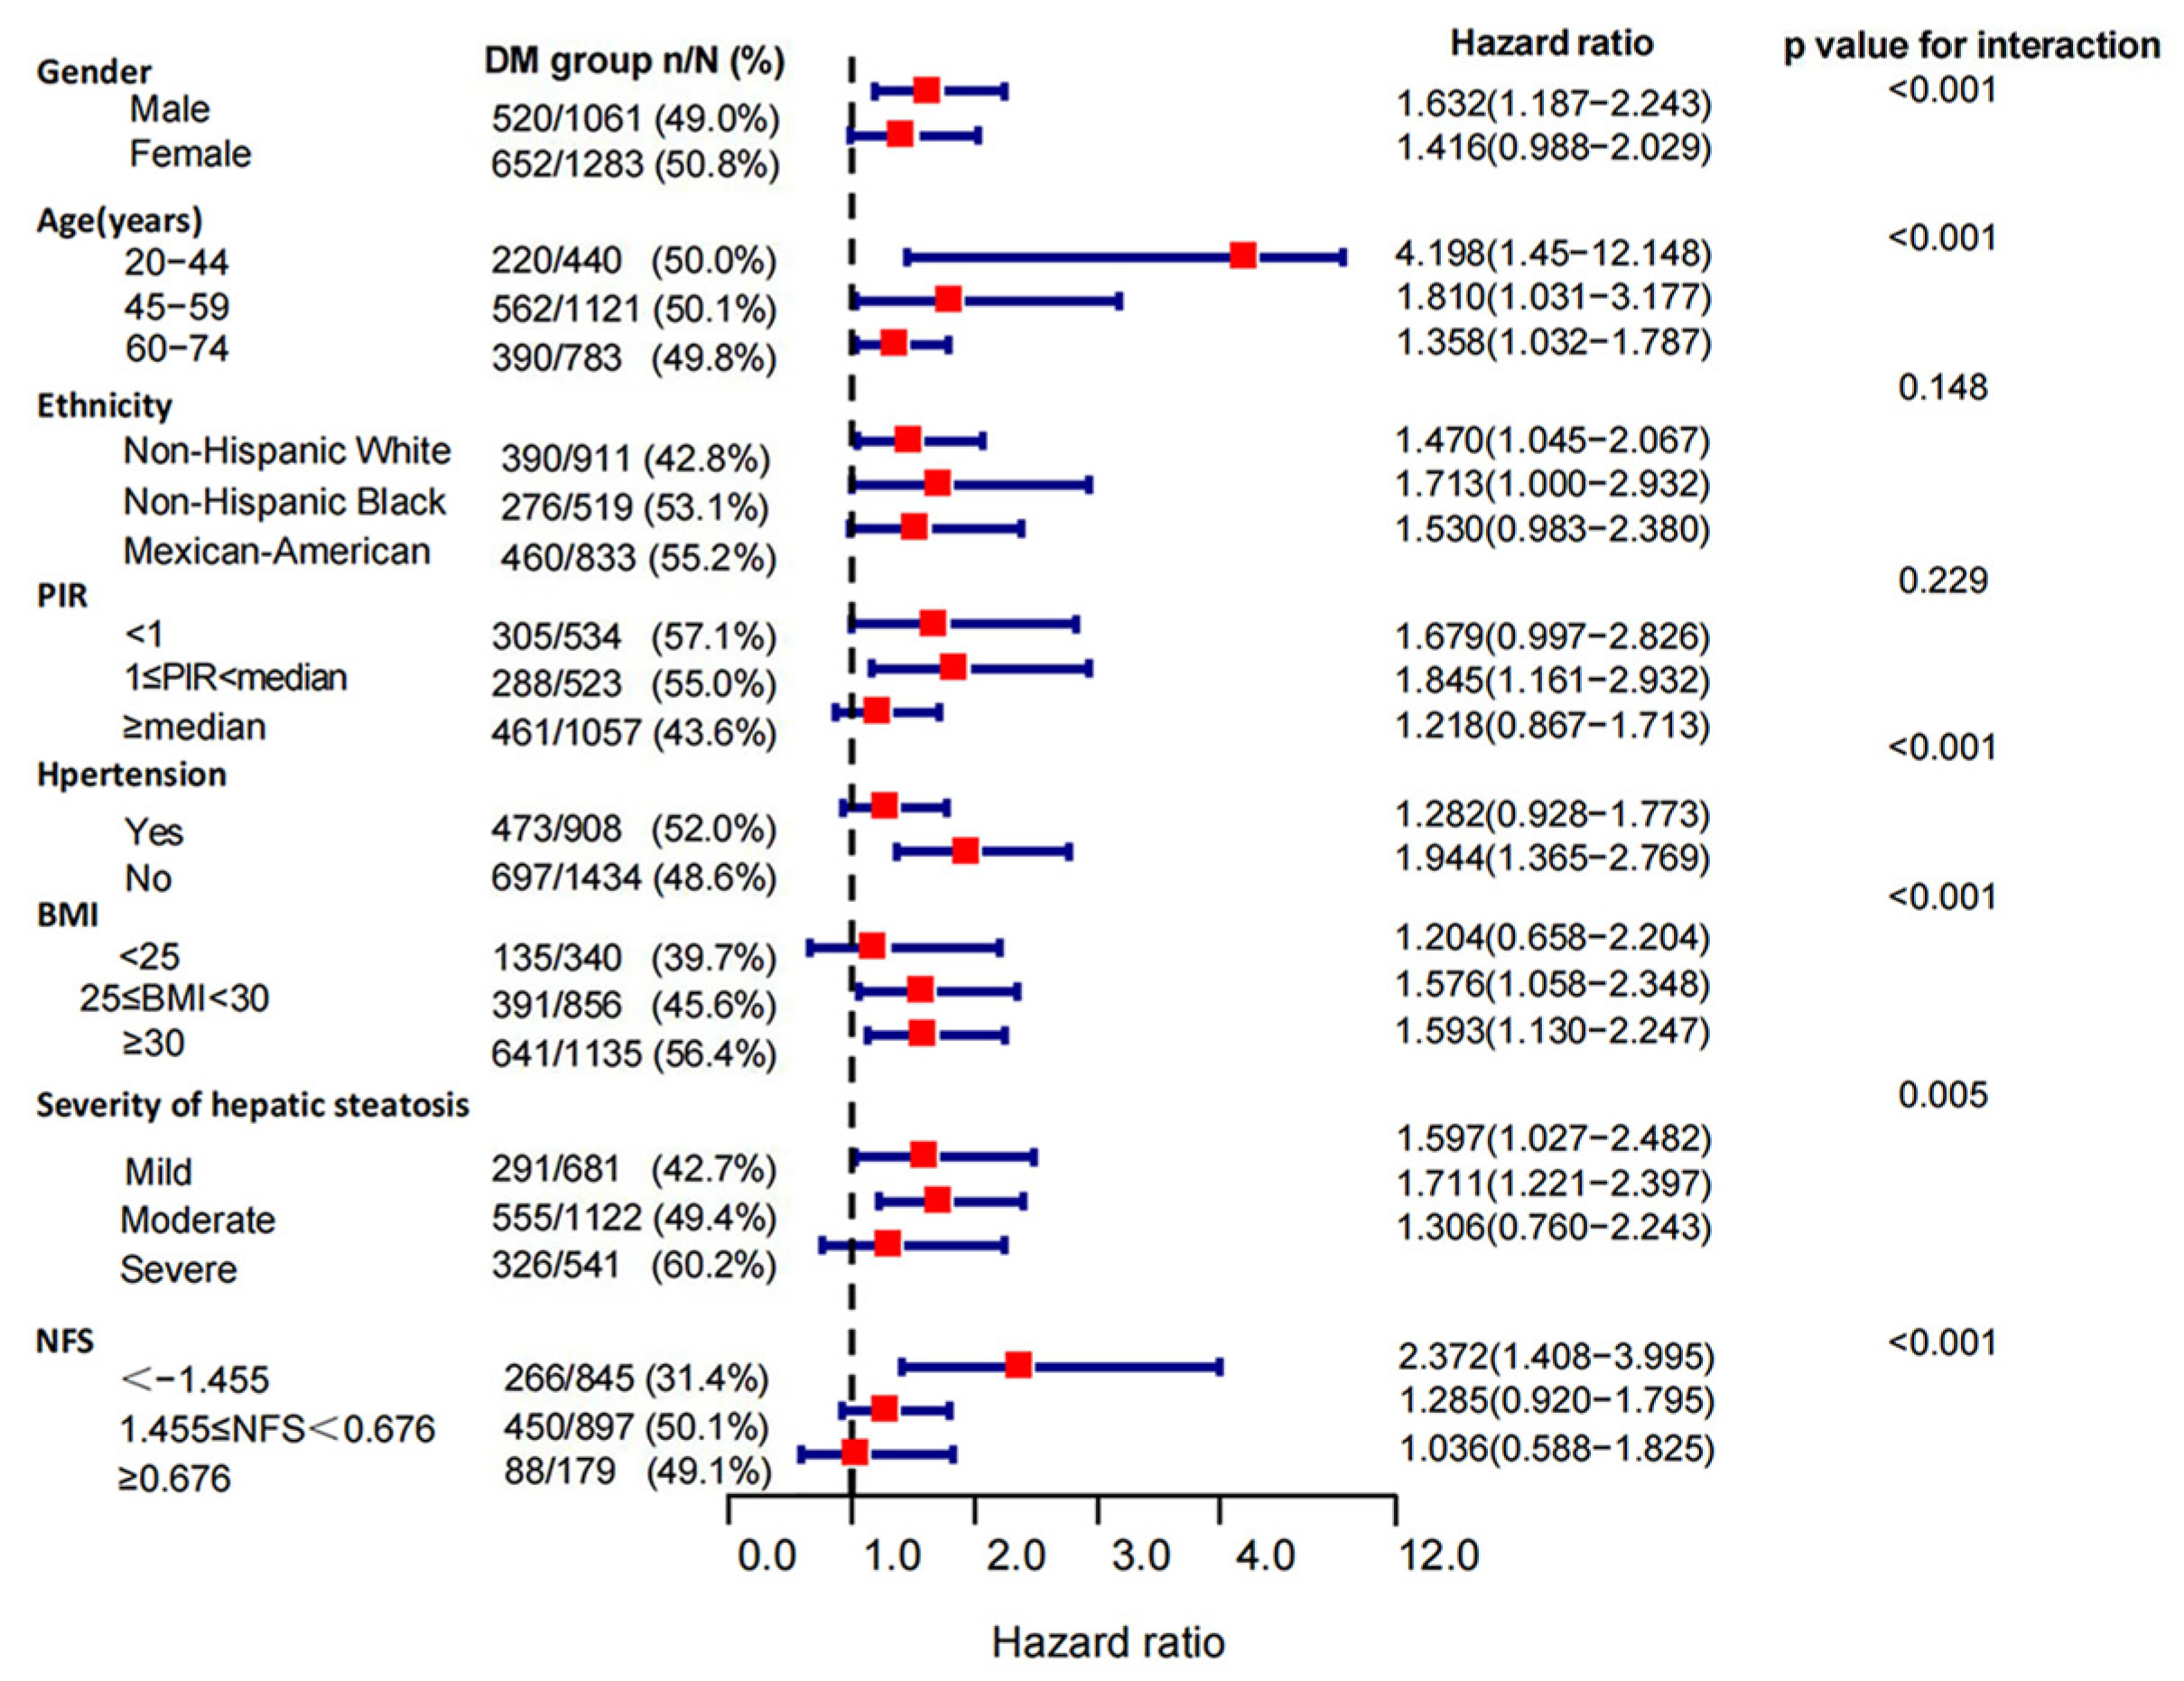
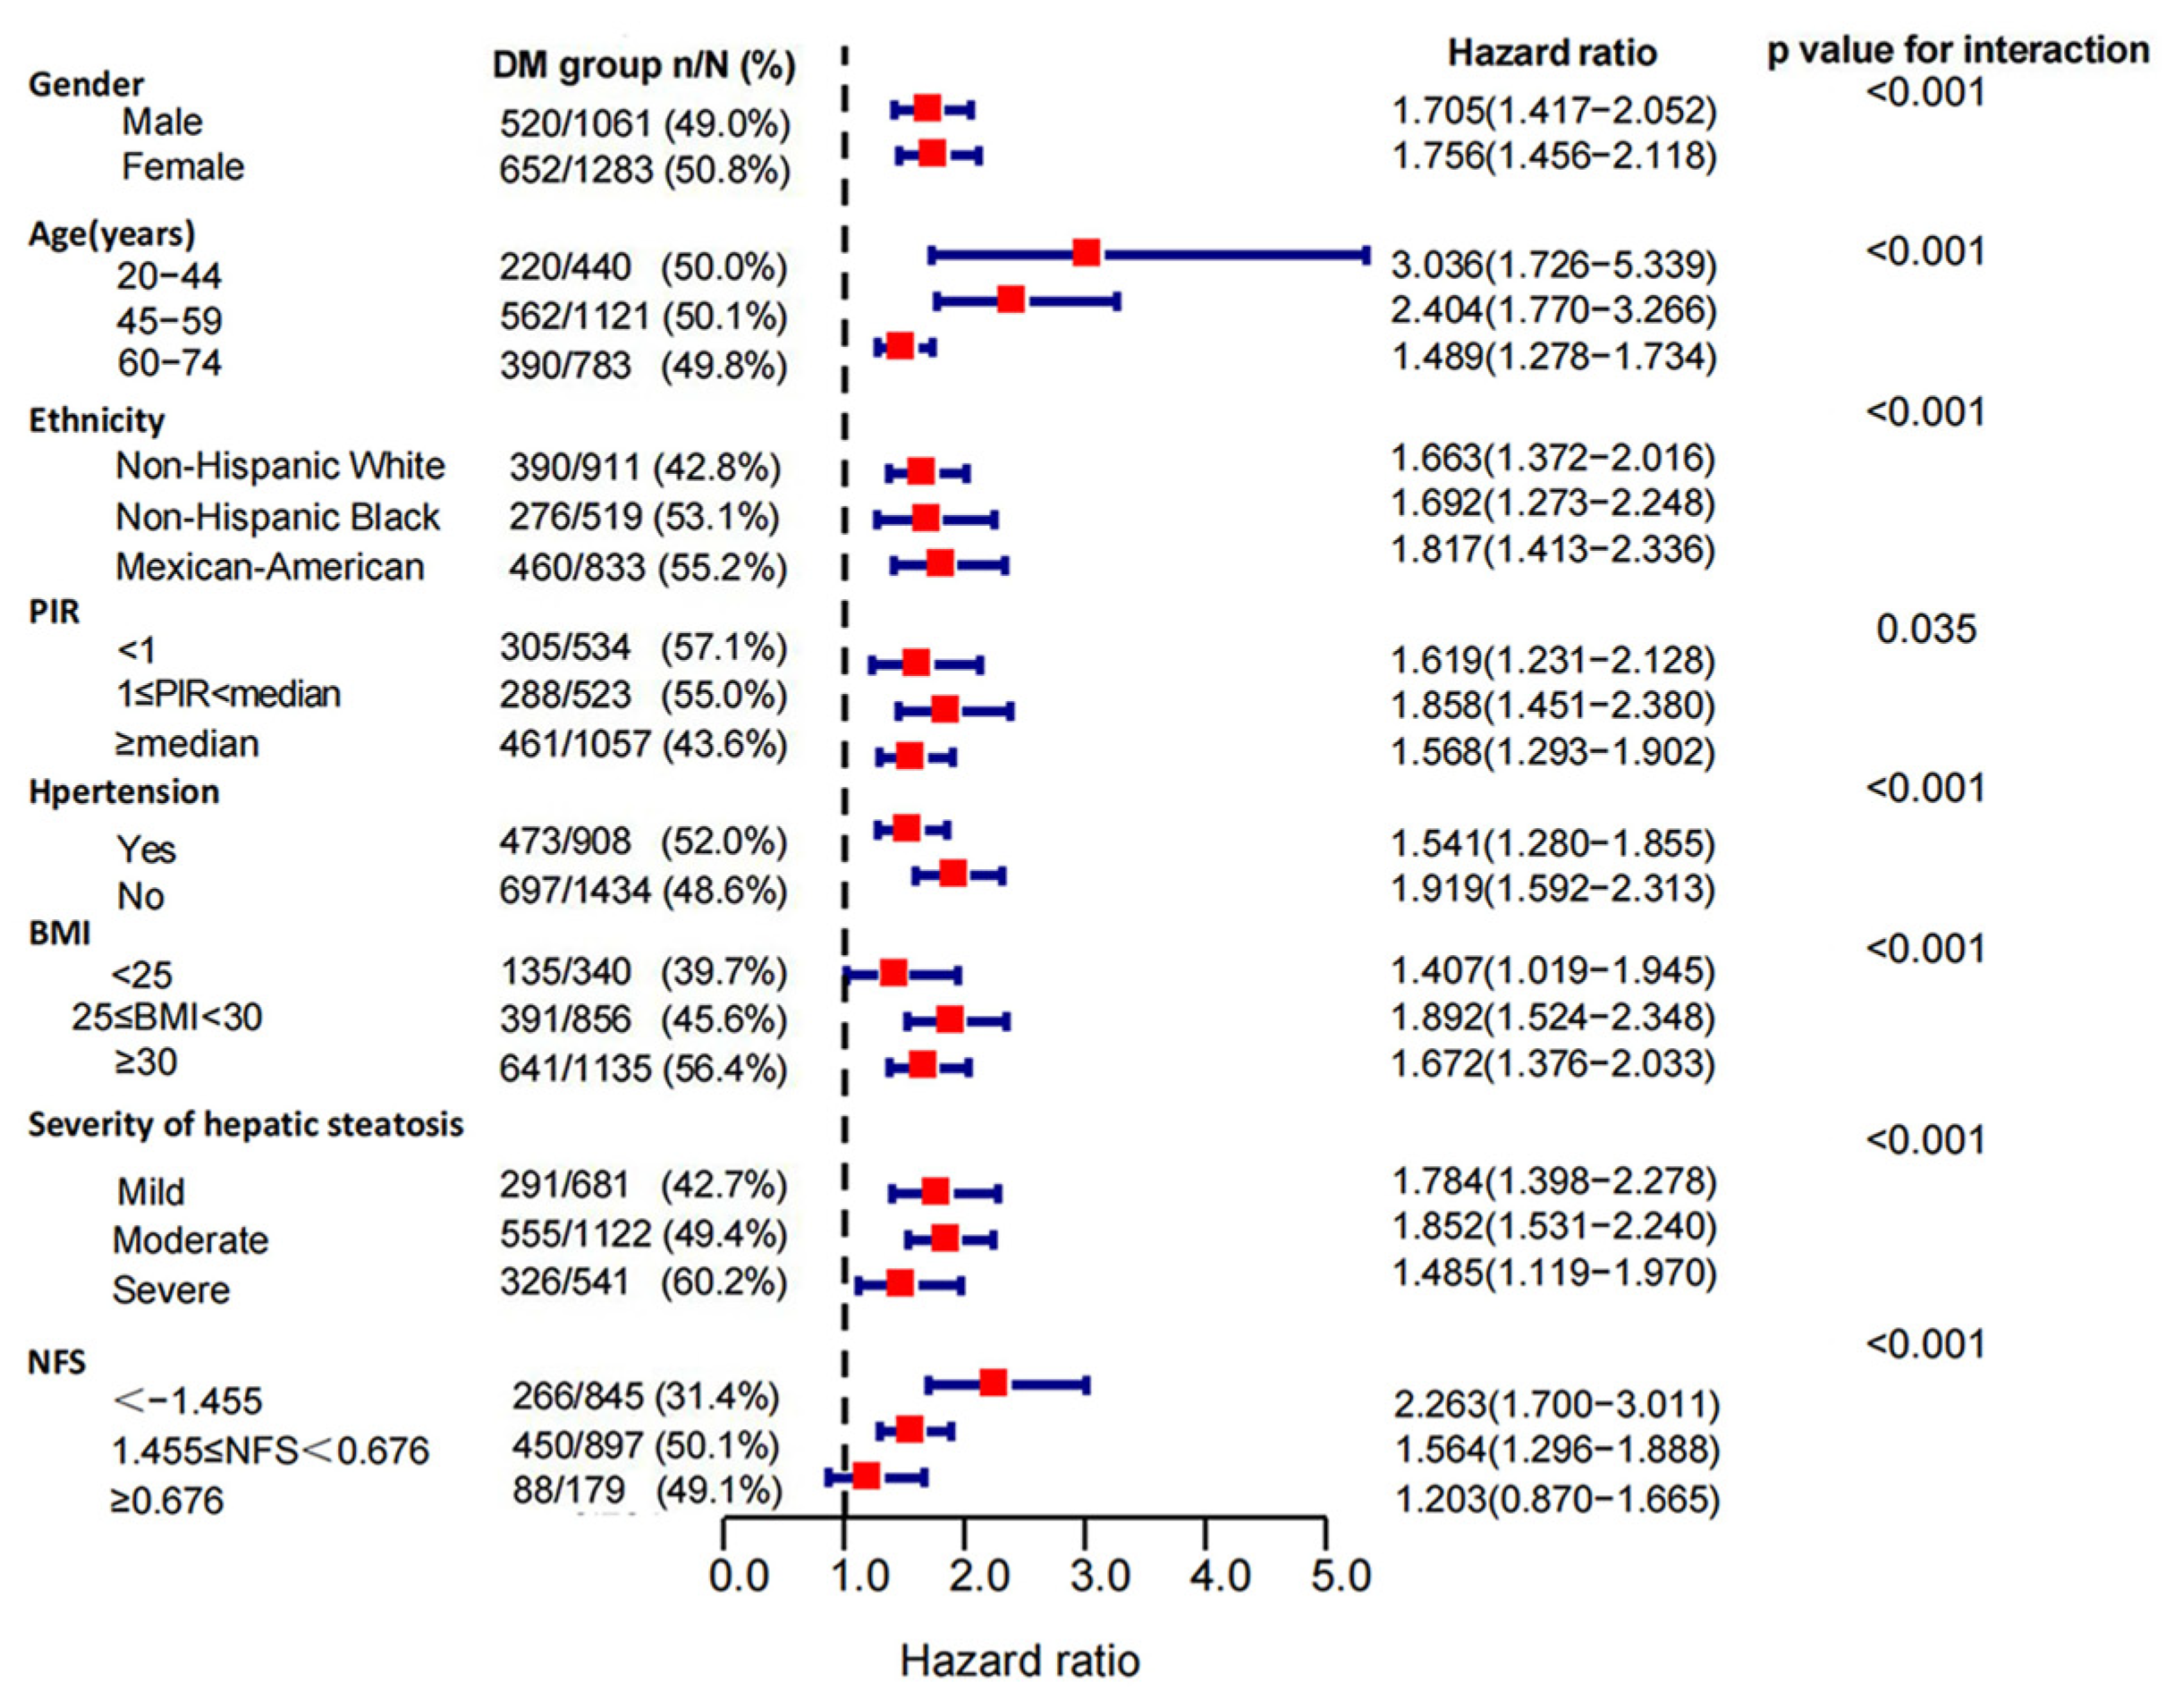
3.3. Subgroup Analysis of the Association of DM with Mortality in MAFLD Patients

In the stratified analyses, the risks of DM for all-cause mortality differed across subgroups of age, gender, ethnicity, PIR, hypertension, BMI, NFS scores, and severities of hepatic steatosis (p-value for interaction < 0.05). The DM group had higher risks of all-cause mortality in females (HRs: 1.641 (1.393, 1.933) vs. 1.532 (1.305, 1.798)) and Mexican-American patients (HRs:1.724 (1.387, 2.142) vs. 1.502 (1.269, 1.778) vs. 1.416 (1.110, 1.807)) with middle income (1 ≤ PIR < median, HRs: 1.726 (1.387, 2.142) vs. 1.546 (1.222, 1.957 vs. 1.400 (1.184, 1.655)). We also identified a remarkable variation in the effect of DM on mortality at different baseline ages (p-value for interaction < 0.001), and this correlation was much stronger in patients under 45 years of age than in those over 59 years (HRs: 2.258 (1.435, 3.551) vs. 1.415 (1.236, 1.620)). When we classified cohorts according to BMI (p-value for interaction < 0.001), DM was associated with higher all-cause mortality in overweight (25 ≤ BMI < 30 kg/m2, HRs: 1.675, 95% CIs: 1.390–2.017, p < 0.001) and obese (BMI ≥ 30 kg/m2, HRs: 1.629, 95% CIs: 1.372–1.935, p < 0.001) patients with MAFLD, while this association was not demonstrated in normal and lean patients (BMI < 25 kg/m2, p = 0.273). With the increasing NFS scores, the mortality risk of DM decreased (NFS ≥ 0.676, p = 0.346) (Figure 4). When restricted to cause-specific mortality, we observed similar patterns of results in subgroups with age, BMI, and NFS scores. Among patients with hypertension (p = 0.132) and severe hepatic steatosis (p = 0.334), the association between DM and cardiovascular mortality turned null (Figure 5). The association between DM and cancer-related mortality remained insignificant in all subgroups except in patients with severe liver steatosis (HRs: 1.63, 95% CIs: 1.008–2.637, p = 0.046) (Supplementary Figure S2). Death outcomes from non-cancer-related mortality (Figure 6) and non-cardiovascular-related mortality (Supplementary Figure S3) were similar to those for all-cause mortality.

4. Discussion

This large prospective study of U.S. adults aged 20–74 years evaluated mortality outcomes in individuals with MAFLD. First, our analysis indicated that DM increased mortality risk by 40–60% in patients with MAFLD while having no significant effect on cancer-related mortality. Especially in younger patients (individuals aged < 45 years) with excess weight (BMI ≥ 25 kg/m2), DM showed a more significant relationship with increased mortality risk. Second, cardiovascular diseases seemed to be the most common cause of death among MAFLD patients. Furthermore, compared to non-diabetic groups, diabetics were older, mostly female, and had a higher metabolic burden on the hepatic system. Overall, DM patients were more likely to go on to “severe MAFLD” [23].
We confirmed that DM was an independent risk factor for death among patients with MAFLD, increasing the risk of all-cause mortality by 42.7%. DM often co-exists with MAFLD, and an intimate association has been demonstrated [24]. The link between DM and fatty liver disease is more complex than previously appreciated and appears to be bidirectional [25]. MAFLD increases the risk for the development of DM, and DM is an aggravating factor for MAFLD. A common potential risk factor is insulin resistance, resulting in the accumulation of steatosis [26]. Our study expands the results of other studies. Similar to what has been indicated in studies of NAFLD, devastating macrovascular complications and microvascular complications of DM, such as coronary artery disease and diabetic nephropathy, can significantly increase all-cause mortality in patients with MAFLD, especially cardiovascular-related mortality [27]. Considering the strong association between MAFLD and cardiovascular risk factors including abdominal obesity, hypertension, atherogenic dyslipidemia, and insulin resistance, the result is not surprising [28]. Therefore, the clinical emphasis should shift from MAFLD as a single-organ entity to a multisystemic disease [29].
Epidemiological data suggest that DM increases morbidity and mortality from many cancers [30]. However, the results may differ depending on which denominator population (MAFLD or whole population) is used. Although our study did not find an independent association between DM and cancer-related mortality in all MAFLD patients, we still acknowledge that the presence of DM promotes the development of advanced liver disease [31,32,33]. In addition, we found that with increasing NFS fibrosis scores, the association of diabetes with mortality decreases. In our study, the fibrosis stage was found to be the strongest predictor of hepatocellular carcinoma, while the role of DM appears to be overshadowed due to competing risks [34]. Other metabolic factors such as obesity have also been proven to be risk factors for cancer development [35]. However, site-specific cancer mortality data are not available, and more research is needed to examine the relationship between DM (or other metabolic factors) and MAFLD-related cancer risk.
In addition to the strong association between DM and mortality, we also found that DM’s impact on all cause-related deaths is more pronounced in female and Mexican-American patients with middle income. Many lifestyle and environmental factors may affect blood glucose and mortality risk in a gender-specific manner. Low education, occupation, and income may largely contribute to unhealthy lifestyle behaviors and are therefore related to a high risk of obesity, especially in female patients [36]. In addition, regarding racial differences in DM, our findings were similar to those of previous epidemiological studies, with Mexican Americans having poor glycemic control and a higher incidence of diabetes-related complications [37]. Comparable data from low- and middle-income patients are indeed lacking, but similar findings have been confirmed in high-income patients [38]. The effect of DM on mortality in high-income patients may be influenced by improved food availability (including fat composition, fresh fruits, and vegetables), pharmacotherapy, and better prevention strategies [39]. Concurrent comparison of ethnicity, gender, and socioeconomic discrepancies in parallel may better account for the impact of DM on specific populations such as MAFLD, which we believe is critical for targeted public-health decision making.
Traditionally, DM has been regarded as a disease of middle-aged and elderly individuals, while the situation in young patients seems even less optimistic. In an epidemiologic analysis from 1985 to 2015 in the USA, the rate of all-cause mortality due to diabetes was reported to be decreasing. However, this positive pattern was not observed in younger adults (20 to 44) [40]. Our findings demonstrated that younger age at DM diagnosis was associated with more significant mortality [41,42]. Similarly, among patients with NASH, a meta-analysis of 80 studies from 20 countries suggested that patients with DM are much younger [9]. The progression of DM to liver inflammation may start at a young age and follow a progressive course. Regarding the mechanisms, researchers found more rapid deterioration in β-cell function in those with early-onset DM [43]. Additionally, in our study, young patients with DM had a higher BMI level than older patients, which is consistent with the previous studies [44], suggesting that obesity-related mechanisms may also be a key player. Being one of the three defining criteria for MAFLD, excess weight is as critical a determinant of adverse clinical outcomes such as DM [45,46]. However, the evidence regarding the relationship between BMI and mortality remains inconclusive. A 2016 meta-analysis of 21 studies suggested a non-linear relationship between the two in the diabetic population, with the lowest risk of approximately 33 kg/m2 [47]. However, we have not found this obesity paradox in our study, and DM significantly correlated with the mortality risk in MAFLD patients suffering from overweight and obesity. The results emphasized the value of managing blood glucose and weight while controlling the progression of hepatic steatosis. Special attention to preventing or screening for DM in younger MAFLD patients could be particularly beneficial.
Despite the large sample size, long follow-up period, and comprehensive analysis of the role of DM mortality outcomes in general and different types of MAFLD, it is important to note the following limitations. First, the baseline data for this cohort were derived from 1988–1994, and the prevalence of DM in patients with MAFLD might not reflect its contemporary extent. Second, all covariates were available only at baseline, so we could not capture changes in possible confounders over time, including glycemic control, during follow-up. Third, due to the restricted nature of these data, there were no follow-up data on liver-related events, which prevented us from distinguishing between liver-related and all-cause mortality. Additional studies should investigate whether the simultaneous presence of MAFLD and DM synergistically increases the risk of liver-related adverse outcomes.

5. Conclusions

In conclusion, DM increased the risks of all-cause, cardiovascular-related, non-cardiovascular-related, and non-cancer-related mortality by 40–60% among patients with MAFLD. Especially in younger patients with excess weight, DM showed a more significant relationship with increased mortality risk.

Supplementary Materials

The following supporting information is available for download at: https://www.mdpi.com/article/10.3390/jpm13030554/s1, Table S1: Serological parameters not penalized to zero by the LASSO model; Table S2: Demographics and clinical characteristics in MAFLD patients by diabetes status; Table S3: Cox survival analysis of risk factors for mortality in MAFLD patients; Figure S1: Association of DM with all-cause mortality in MAFLD of different (A) ages and (B) BMI; Figure S2: Subgroup analysis of cancer-related mortality in MAFLD patients; Figure S3: Subgroup analysis of non-cardiovascular-related mortality in MAFLD patients.

Author Contributions

Study concept and design, J.L. (Jie Li) and Y.Z.; acquisition of data, Y.Z. and X.X.; the statistical analysis and interpretation of data, Y.Z., C.L., X.M., J.L. (Jiacheng Liu), Z.Z. and F.L.; drafting of the manuscript, Y.Z., C.L., Z.F. and X.X.; critical revision of the manuscript for important intellectual content, J.L. (Jie Li), X.Q., C.W., D.K.-H.W. and C.L. All of the authors contributed to this study at different levels of detail. All authors have read and agreed to the published version of the manuscript.

Funding

This research was funded by [The National Natural Science Foundation of China] grant number [No.81970545; No.82170609; No.82170592; No.81700554], [Natural Science Foundation of Shandong Province (Major Project)] grant number [No.ZR2020KH006], [Ji’nan Science and Technology Development Project] grant number [No.2020190790], [Medical Science and technology development Foundation, Nanjing Department of Health (Key Project)] grant number [NO.YKK20065], [The Nanjing Municipal Administration of Health and Human Services] grant number [NO.YKK17061], [The Fundamental Research Funds for Central Universities] grant number [NO.021414380323], and [The Research and Practice Innovation Project of Nanjing University] grant number [No.CX10284].

Institutional Review Board Statement

The study was conducted in accordance with the Declaration of Helsinki. Institutional Review Board (IRB) approval and documented consent was obtained from participants.

Informed Consent Statement

The National Center for Health Statistics reviewed and approved human participant studies for inclusion in this review. Written informed consent for participation in this study was obtained from patients/participants. The next of kin/legal guardian for the necessary participants (adults and minors, respectively) provided written informed consent for the publication of any images or potentially identifiable data included in this article. Informed consent was obtained from all subjects who participated in the study.

Data Availability Statement

The datasets presented in this study are available in online repositories (https://www.cdc.gov/nchs/nhanes/index.htm (accessed on 1 May 2022).

Conflicts of Interest

The authors declare no conflict of interest.

References

  1. Le, M.H.; Yeo, Y.H.; Li, X.; Li, J.; Zou, B.; Wu, Y.; Ye, Q.; Huang, D.Q.; Zhao, C.; Zhang, J.; et al. 2019 Global NAFLD Prevalence: A Systematic Review and Meta-analysis. Clin. Gastroenterol. Hepatol. 2021, 20, 2809–2817.e28. [Google Scholar] [CrossRef] [PubMed]
  2. Li, J.; Zou, B.; Yeo, Y.H.; Feng, Y.; Xie, X.; Lee, D.H.; Fujii, H.; Wu, Y.; Kam, L.Y.; Ji, F.; et al. Prevalence, incidence, and outcome of non-alcoholic fatty liver disease in Asia, 1999-2019: A systematic review and meta-analysis. Lancet Gastroenterol. Hepatol. 2019, 4, 389–398. [Google Scholar] [CrossRef] [PubMed]
  3. Rui, F.; Yang, H.; Hu, X.; Xue, Q.; Xu, Y.; Shi, J.; Li, J. Renaming NAFLD to MAFLD: Advantages and Potential Changes in Diagnosis, Pathophysiology, Treatment, and Management. Infect. Microbes Dis. 2022, 4, 49–55. [Google Scholar] [CrossRef]
  4. Nguyen, V.H.; Le, M.H.; Cheung, R.C.; Nguyen, M.H. Differential Clinical Characteristics and Mortality Outcomes in Persons With NAFLD and/or MAFLD. Clin. Gastroenterol. Hepatol. 2021, 19, 2172–2181.e2176. [Google Scholar] [CrossRef]
  5. Matteoni, C.A.; Younossi, Z.M.; Gramlich, T.; Boparai, N.; Liu, Y.C.; McCullough, A.J. Nonalcoholic fatty liver disease: A spectrum of clinical and pathological severity. Gastroenterology 1999, 116, 1413–1419. [Google Scholar] [CrossRef]
  6. Margini, C.; Dufour, J.F. The story of HCC in NAFLD: From epidemiology, across pathogenesis, to prevention and treatment. Liver Int. 2016, 36, 317–324. [Google Scholar] [CrossRef] [Green Version]
  7. Byrne, C.D.; Targher, G. NAFLD: A multisystem disease. J. Hepatol. 2015, 62, S47–S64. [Google Scholar] [CrossRef] [Green Version]
  8. Sun, H.; Saeedi, P.; Karuranga, S.; Pinkepank, M.; Ogurtsova, K.; Duncan, B.B.; Stein, C.; Basit, A.; Chan, J.C.N.; Mbanya, J.C.; et al. IDF Diabetes Atlas: Global, regional and country-level diabetes prevalence estimates for 2021 and projections for 2045. Diabetes Res. Clin. Pract. 2022, 183, 109119. [Google Scholar] [CrossRef]
  9. Younossi, Z.M.; Golabi, P.; de Avila, L.; Paik, J.M.; Srishord, M.; Fukui, N.; Qiu, Y.; Burns, L.; Afendy, A.; Nader, F. The global epidemiology of NAFLD and NASH in patients with type 2 diabetes: A systematic review and meta-analysis. J. Hepatol. 2019, 71, 793–801. [Google Scholar] [CrossRef]
  10. Jarvis, H.; Craig, D.; Barker, R.; Spiers, G.; Stow, D.; Anstee, Q.M.; Hanratty, B. Metabolic risk factors and incident advanced liver disease in non-alcoholic fatty liver disease (NAFLD): A systematic review and meta-analysis of population-based observational studies. PLoS Med. 2020, 17, e1003100. [Google Scholar] [CrossRef]
  11. Suzuki, A.; Angulo, P.; Lymp, J.; St Sauver, J.; Muto, A.; Okada, T.; Lindor, K. Chronological development of elevated aminotransferases in a nonalcoholic population. Hepatology 2005, 41, 64–71. [Google Scholar] [CrossRef] [PubMed]
  12. Stepanova, M.; Rafiq, N.; Makhlouf, H.; Agrawal, R.; Kaur, I.; Younoszai, Z.; McCullough, A.; Goodman, Z.; Younossi, Z.M. Predictors of all-cause mortality and liver-related mortality in patients with non-alcoholic fatty liver disease (NAFLD). Dig. Dis. Sci. 2013, 58, 3017–3023. [Google Scholar] [CrossRef] [PubMed]
  13. Fracanzani, A.L.; Valenti, L.; Bugianesi, E.; Andreoletti, M.; Colli, A.; Vanni, E.; Bertelli, C.; Fatta, E.; Bignamini, D.; Marchesini, G.; et al. Risk of severe liver disease in nonalcoholic fatty liver disease with normal aminotransferase levels: A role for insulin resistance and diabetes. Hepatology 2008, 48, 792–798. [Google Scholar] [CrossRef] [PubMed]
  14. Lin, S.; Huang, J.; Wang, M.; Kumar, R.; Liu, Y.; Liu, S.; Wu, Y.; Wang, X.; Zhu, Y. Comparison of MAFLD and NAFLD diagnostic criteria in real world. Liver Int. 2020, 40, 2082–2089. [Google Scholar] [CrossRef] [PubMed]
  15. American Diabetes Association. 2. Classification and Diagnosis of Diabetes: Standards of Medical Care in Diabetes-2020. Diabetes Care 2020, 43, S14–S31. [Google Scholar] [CrossRef] [PubMed] [Green Version]
  16. Eslam, M.; Newsome, P.N.; Sarin, S.K.; Anstee, Q.M.; Targher, G.; Romero-Gomez, M.; Zelber-Sagi, S.; Wai-Sun Wong, V.; Dufour, J.F.; Schattenberg, J.M.; et al. A new definition for metabolic dysfunction-associated fatty liver disease: An international expert consensus statement. J. Hepatol. 2020, 73, 202–209. [Google Scholar] [CrossRef]
  17. Williams, B.; Mancia, G.; Spiering, W.; Agabiti Rosei, E.; Azizi, M.; Burnier, M.; Clement, D.L.; Coca, A.; de Simone, G.; Dominiczak, A.; et al. 2018 ESC/ESH Guidelines for the management of arterial hypertension: The Task Force for the management of arterial hypertension of the European Society of Cardiology and the European Society of Hypertension: The Task Force for the management of arterial hypertension of the European Society of Cardiology and the European Society of Hypertension. J. Hypertens. 2018, 36, 1953–2041. [Google Scholar] [CrossRef] [Green Version]
  18. Xiao, G.; Zhu, S.; Xiao, X.; Yan, L.; Yang, J.; Wu, G. Comparison of laboratory tests, ultrasound, or magnetic resonance elastography to detect fibrosis in patients with nonalcoholic fatty liver disease: A meta-analysis. Hepatology 2017, 66, 1486–1501. [Google Scholar] [CrossRef] [Green Version]
  19. Levey, A.S.; Stevens, L.A.; Schmid, C.H.; Zhang, Y.L.; Castro, A.F., 3rd; Feldman, H.I.; Kusek, J.W.; Eggers, P.; Van Lente, F.; Greene, T.; et al. A new equation to estimate glomerular filtration rate. Ann. Intern. Med. 2009, 150, 604–612. [Google Scholar] [CrossRef]
  20. Angulo, P.; Hui, J.M.; Marchesini, G.; Bugianesi, E.; George, J.; Farrell, G.C.; Enders, F.; Saksena, S.; Burt, A.D.; Bida, J.P.; et al. The NAFLD fibrosis score: A noninvasive system that identifies liver fibrosis in patients with NAFLD. Hepatology 2007, 45, 846–854. [Google Scholar] [CrossRef]
  21. Sterling, R.K.; Lissen, E.; Clumeck, N.; Sola, R.; Correa, M.C.; Montaner, J.; Sulkowski, M.S.; Torriani, F.J.; Dieterich, D.T.; Thomas, D.L.; et al. Development of a simple noninvasive index to predict significant fibrosis in patients with HIV/HCV coinfection. Hepatology 2006, 43, 1317–1325. [Google Scholar] [CrossRef]
  22. Matthews, D.R.; Hosker, J.P.; Rudenski, A.S.; Naylor, B.A.; Treacher, D.F.; Turner, R.C. Homeostasis model assessment: Insulin resistance and beta-cell function from fasting plasma glucose and insulin concentrations in man. Diabetologia 1985, 28, 412–419. [Google Scholar] [CrossRef] [PubMed] [Green Version]
  23. Mantovani, A.; Petracca, G.; Beatrice, G.; Tilg, H.; Byrne, C.D.; Targher, G. Non-alcoholic fatty liver disease and risk of incident diabetes mellitus: An updated meta-analysis of 501 022 adult individuals. Gut 2021, 70, 962–969. [Google Scholar] [CrossRef] [PubMed]
  24. Arrese, M.; Barrera, F.; Triantafilo, N.; Arab, J.P. Concurrent nonalcoholic fatty liver disease and type 2 diabetes: Diagnostic and therapeutic considerations. Expert Rev. Gastroenterol. Hepatol. 2019, 13, 849–866. [Google Scholar] [CrossRef] [PubMed]
  25. Lonardo, A.; Nascimbeni, F.; Mantovani, A.; Targher, G. Hypertension, diabetes, atherosclerosis and NASH: Cause or consequence? J. Hepatol. 2018, 68, 335–352. [Google Scholar] [CrossRef] [PubMed]
  26. Stefan, N.; Häring, H.U.; Cusi, K. Non-alcoholic fatty liver disease: Causes, diagnosis, cardiometabolic consequences, and treatment strategies. Lancet Diabetes Endocrinol. 2019, 7, 313–324. [Google Scholar] [CrossRef]
  27. Strain, W.D.; Paldánius, P.M. Diabetes, cardiovascular disease and the microcirculation. Cardiovasc. Diabetol. 2018, 17, 57. [Google Scholar] [CrossRef] [Green Version]
  28. Adams, L.A.; Anstee, Q.M.; Tilg, H.; Targher, G. Non-alcoholic fatty liver disease and its relationship with cardiovascular disease and other extrahepatic diseases. Gut 2017, 66, 1138–1153. [Google Scholar] [CrossRef] [Green Version]
  29. Armstrong, M.J.; Haydon, G.; Syn, W.K. Beyond the liver in patients with non-alcoholic fatty liver disease (NAFLD)-cause for concern? Hepatobiliary Surg. Nutr. 2018, 7, 138–142. [Google Scholar] [CrossRef] [Green Version]
  30. Shlomai, G.; Neel, B.; LeRoith, D.; Gallagher, E.J. Type 2 Diabetes Mellitus and Cancer: The Role of Pharmacotherapy. J. Clin. Oncol. 2016, 34, 4261–4269. [Google Scholar] [CrossRef] [Green Version]
  31. Huang, D.Q.; El-Serag, H.B.; Loomba, R. Global epidemiology of NAFLD-related HCC: Trends, predictions, risk factors and prevention. Nat. Rev. Gastroenterol. Hepatol. 2021, 18, 223–238. [Google Scholar] [CrossRef] [PubMed]
  32. Yang, J.D.; Ahmed, F.; Mara, K.C.; Addissie, B.D.; Allen, A.M.; Gores, G.J.; Roberts, L.R. Diabetes Is Associated With Increased Risk of Hepatocellular Carcinoma in Patients With Cirrhosis From Nonalcoholic Fatty Liver Disease. Hepatology 2020, 71, 907–916. [Google Scholar] [CrossRef] [PubMed]
  33. Johnston, M.P.; Patel, J.; Byrne, C.D. Diabetes is associated with increased risk of hepatocellular carcinoma in non-alcoholic steatohepatitis with cirrhosis-implications for surveillance and future pharmacotherapy. Hepatobiliary Surg. Nutr. 2020, 9, 230–234. [Google Scholar] [CrossRef] [PubMed]
  34. Taylor, R.S.; Taylor, R.J.; Bayliss, S.; Hagström, H.; Nasr, P.; Schattenberg, J.M.; Ishigami, M.; Toyoda, H.; Wai-Sun Wong, V.; Peleg, N.; et al. Association Between Fibrosis Stage and Outcomes of Patients With Nonalcoholic Fatty Liver Disease: A Systematic Review and Meta-Analysis. Gastroenterology 2020, 158, 1611–1625.e1612. [Google Scholar] [CrossRef] [Green Version]
  35. Hopkins, B.D.; Goncalves, M.D.; Cantley, L.C. Obesity and Cancer Mechanisms: Cancer Metabolism. J. Clin. Oncol. 2016, 34, 4277–4283. [Google Scholar] [CrossRef] [Green Version]
  36. Kautzky-Willer, A.; Harreiter, J.; Pacini, G. Sex and Gender Differences in Risk, Pathophysiology and Complications of Type 2 Diabetes Mellitus. Endocr. Rev. 2016, 37, 278–316. [Google Scholar] [CrossRef] [Green Version]
  37. Spanakis, E.K.; Golden, S.H. Race/ethnic difference in diabetes and diabetic complications. Curr. Diab. Rep. 2013, 13, 814–823. [Google Scholar] [CrossRef] [Green Version]
  38. Levi, F.; Lucchini, F.; Negri, E.; La Vecchia, C. Trends in mortality from cardiovascular and cerebrovascular diseases in Europe and other areas of the world. Heart 2002, 88, 119–124. [Google Scholar] [CrossRef]
  39. Harding, J.L.; Pavkov, M.E.; Magliano, D.J.; Shaw, J.E.; Gregg, E.W. Global trends in diabetes complications: A review of current evidence. Diabetologia 2019, 62, 3–16. [Google Scholar] [CrossRef] [Green Version]
  40. Gregg, E.W.; Cheng, Y.J.; Srinivasan, M.; Lin, J.; Geiss, L.S.; Albright, A.L.; Imperatore, G. Trends in cause-specific mortality among adults with and without diagnosed diabetes in the USA: An epidemiological analysis of linked national survey and vital statistics data. Lancet 2018, 391, 2430–2440. [Google Scholar] [CrossRef]
  41. Huo, L.; Magliano, D.J.; Rancière, F.; Harding, J.L.; Nanayakkara, N.; Shaw, J.E.; Carstensen, B. Impact of age at diagnosis and duration of type 2 diabetes on mortality in Australia 1997–2011. Diabetologia 2018, 61, 1055–1063. [Google Scholar] [CrossRef] [PubMed] [Green Version]
  42. Færch, K.; Carstensen, B.; Almdal, T.P.; Jørgensen, M.E. Improved survival among patients with complicated type 2 diabetes in Denmark: A prospective study (2002–2010). J. Clin. Endocrinol. Metab. 2014, 99, E642–E646. [Google Scholar] [CrossRef] [Green Version]
  43. Viner, R.; White, B.; Christie, D. Type 2 diabetes in adolescents: A severe phenotype posing major clinical challenges and public health burden. Lancet 2017, 389, 2252–2260. [Google Scholar] [CrossRef] [PubMed]
  44. Magliano, D.J.; Sacre, J.W.; Harding, J.L.; Gregg, E.W.; Zimmet, P.Z.; Shaw, J.E. Young-onset type 2 diabetes mellitus—Implications for morbidity and mortality. Nat. Rev. Endocrinol. 2020, 16, 321–331. [Google Scholar] [CrossRef] [PubMed]
  45. Bhaskaran, K.; Dos-Santos-Silva, I.; Leon, D.A.; Douglas, I.J.; Smeeth, L. Association of BMI with overall and cause-specific mortality: A population-based cohort study of 3·6 million adults in the UK. Lancet Diabetes Endocrinol. 2018, 6, 944–953. [Google Scholar] [CrossRef] [PubMed] [Green Version]
  46. Aune, D.; Sen, A.; Prasad, M.; Norat, T.; Janszky, I.; Tonstad, S.; Romundstad, P.; Vatten, L.J. BMI and all cause mortality: Systematic review and non-linear dose-response meta-analysis of 230 cohort studies with 3.74 million deaths among 30.3 million participants. BMJ 2016, 353, i2156. [Google Scholar] [CrossRef] [PubMed] [Green Version]
  47. Zaccardi, F.; Dhalwani, N.N.; Papamargaritis, D.; Webb, D.R.; Murphy, G.J.; Davies, M.J.; Khunti, K. Nonlinear association of BMI with all-cause and cardiovascular mortality in type 2 diabetes mellitus: A systematic review and meta-analysis of 414,587 participants in prospective studies. Diabetologia 2017, 60, 240–248. [Google Scholar] [CrossRef] [Green Version]
Figure 1. Flow-chart of the study participants.
Jpm 13 00554 g001
Figure 2. Composition and survival analysis of all-cause mortality. (A) Leading cause of death among all-cause mortality. (B) Kaplan–Meier estimation of all-cause mortality.
Jpm 13 00554 g002
Figure 3. Kaplan–Meier estimations of cause-specific mortality. (A) Cardiovascular-related mortality, (B) non-cardiovascular-related mortality, (C) non-cancer-related mortality, and (D) cancer-related mortality.
Jpm 13 00554 g003
Figure 4. Subgroup analysis of all-cause mortality in MAFLD patients. Patients with diabetes compared to non-diabetics. The association between DM and mortality risk from all causes was stratified by baseline age, gender, ethnicity, PIR (poverty to income ratio), hypertension, BMI, the severity of hepatic steatosis, and NFS scores in MAFLD patients. Models were adjusted for age (not for the age subgroup), gender (not for the gender subgroup), ethnicity (not for the ethnicity subgroup), PIR (not for the PIR subgroup), hypertension (not for the hypertension subgroup), and BMI (not for the BMI subgroup).
Jpm 13 00554 g004
Figure 5. Subgroup analysis of cardiovascular mortality in MAFLD patients. Patients with diabetes compared to non-diabetics. The association between DM and mortality risk from cardiovascular causes was stratified by baseline age, gender, ethnicity, PIR (poverty to income ratio), hypertension, BMI, the severity of hepatic steatosis, and NFS scores in MAFLD patients. Models were adjusted for age (not for the age subgroup), gender (not for the gender subgroup), ethnicity (not for the ethnicity subgroup), PIR (not for the PIR subgroup), hypertension (not for the hypertension subgroup), and BMI (not for the BMI subgroup).
Jpm 13 00554 g005
Figure 6. Subgroup analysis of non-cancer-related mortality in MAFLD patients. Patients with diabetes compared to non-diabetics. The association between DM and mortality risk from non-cancer related causes was stratified by baseline age, gender, ethnicity, PIR (poverty to income ratio), hypertension, BMI, the severity of hepatic steatosis, and NFS scores in MAFLD patients. Models were adjusted for age (not for the age subgroup), gender (not for the gender subgroup), ethnicity (not for the ethnicity subgroup), PIR (not for the PIR subgroup), hypertension (not for the hypertension subgroup), and BMI (not for the BMI subgroup).
Jpm 13 00554 g006
Table 1. Demographics and clinical characteristics in MAFLD patients stratified by diabetes status.
Overall Cohort
(n = 2344)
Non-DM Cohort
(n = 1172)
DM Cohort
(n = 1172)
p-Value
Male, gender (%)1061 (45.3)541 (46.2)520 (44.4)0.384
Age, years.60 (48.67)60 (48.67)60 (48.67)0.995
Ethnicity (%) <0.001
Non-Hispanic White 911 (38.9)521 (44.5)390 (33.3)
Non-Hispanic Black 519 (22.1)243 (20.7)276 (23.5)
Mexican American833 (35.5)373 (31.9)460 (39.2)
Other81 (3.5)35 (3.0)46 (3.9)
PIR <0.001
<1533 (25.2)228 (21.5)305 (28.9)
1 ≤ PIR < median523 (24.7)235 (22.2)288 (27.3)
≥median1058 (50.0)597 (56.3)461 (43.7)
Hypertension (%)908 (38.8)435 (37.1)473 (40.4)0.1
BMI <0.001
<25341 (14.6)206 (17.7)135 (11.6)
25 ≤ BMI < 30856 (36.7)465 (39.9)391 (33.5)
≥301134 (48.6)493 (42.4)641 (54.9)
ALT (U/L)16 (12, 24)15 (11, 21)18 (13, 27)<0.001
AST (U/L)20 (17, 27)20 (17, 26)20 (17, 27)0.45
ALP (U/L)90 (74, 110)86 (71, 103)95 (77, 117)<0.001
CRP (mg/dL)0.3 (0.2, 0.7)0.2 (0.2, 0.6)0.4 (0.2, 0.9)<0.001
FRP (ng/mL)127 (65, 243)110 (55, 196)153 (77, 285)<0.001
Vitamin A (umol/L)2.0 (1.7, 2.4)2.1 (1.8, 2.5)2.0 (1.6, 2.4)<0.001
Vitamin C (umol/L)36.9 (18.2, 53.4)38.0 (17.0, 55.6)35.8 (18.7, 51.7)0.105
Vitamin E (umol/L)26.8 (21.6, 33.6)26.5 (21.5, 32.6)27.17 (21.6, 35.0)0.011
Serum selenium (nmol/L)1.6 (1.4, 1.7)1.6 (1.4, 1.7)1.6 (1.5, 1.7)<0.001
PLT (* 109/L)267.0 (224.5, 318.3)271.0 (228.0, 320.5)263.0 (220.0, 315.5)0.023
TC (mmol/L)5.6 (4.9, 6.4)5.6 (4.9, 6.27)5.6 (4.9, 6.5)0.078
TG (mmol/L)1.9 (1.3, 2.7)1.6 (1.15, 2.36)2.1 (1.5, 3.1)<0.001
HDL-C (mmol/L)1.2 (1.0, 1.4)1.2 (1.0, 1.5)1.1 (0.9, 1.3)<0.001
Total protein (g/L)74 (71, 77)73 (71, 77)75 (72, 78)<0.001
Albumin (g/L)41 (39, 43)41 (39, 44)41 (38, 43)<0.001
UA (umol/L)333.1 (273.6, 392.6)339 (284.0, 398.5)327.1 (261.7, 392.6)0.001
Scr (mg/dL)1.0 (0.9, 1.2)1.1 (0.9, 1.2)1.0 (0.9, 1.2)0.008
eGFR category (%) <0.001
≥90 (Stage 1 CKD)337 (14.9)135 (12.1)202 (17.7)
60 ≤ eGFR < 90 (Stage 2 CKD)1349 (59.8)693 (62.0)656 (57.6)
30 ≤ eGFR < 60 (Stage 3 CKD)550 (24.4)283 (25.3)267 (23.4)
<30 (Stage 4–5 CKD)20 (0.9)6 (0.5)14 (1.2)
FIB-4 category (%) 0.042
<1.31394 (62.7)666 (60.7)728 (64.6)
1.3 ≤ FIB-4 < 2.67742 (33.3)393 (35.8)349 (31.0)
≥2.6789 (4.0)39 (3.6)50 (4.4)
NFS category (%) <0.001
<−1.455846 (37.5)580 (51.9)266 (23.4)
−1.455 ≤ NFS < 0.6761090 (48.3)447 (40.0)643 (56.5)
≥0.676321 (14.2)91 (8.1)230 (20.2)
Severity of hepatic steatosis (%) <0.001
Mild681 (29.1)390 (33.3)291 (24.8)
Moderate1122 (47.9)567 (48.4)555 (47.4)
Severe541 (23.1)215 (18.3)326 (27.8)0.384
* Continuous values are presented as median (interquartile range) and categorical variables as count (percentage). DM, diabetes mellitus; Non-DM, patients without diabetes mellitus; PIR, poverty income ratio; BMI, body mass index; ALT, alanine transaminase; AST, aspartate transaminase; ALP, alkaline phosphatase; PLT, serum selenium, platelet; TC, total cholesterol; TG, total triglyceride; HDL-C, high-density lipoprotein cholesterol; ALB, total protein, albumin; UA, uric acid; Scr, serum creatinine; eGFR, estimated glomerular filtration rate; NFS, NAFLD fibrosis score; FIB-4, Fibrosis-4 index.
Table 2. Cox regression models for the relationship between DM and mortality in MAFLD patients.
Model 1Model 2Model 3
Unadjusted HRHR (95% Cl)p-ValueHR (95% Cl)p-ValueHR (95% Cl)p-Value
All-cause mortality1.459
(1.310, 1.623)
1.546
(1.381, 1.732)
<0.0011.564
(1.395, 1.753)
<0.0011.428
(1.257, 1.623)
<0.001
Cardiovascular mortality1.482
(1.183, 1.858)
1.546
(1.221, 2.230)
<0.0011.526
(1.204, 1.935)
<0.0011.464
(1.122, 1.909)
0.005
Cancer mortality0.993
(0.791, 1.246)
1.143
(0.903, 1.447)
0.2671.173
(0.924, 1.489)
0.1891.026
(0.787, 1.336)
0.851
Non-cardiovascular-related mortality1.448
(1.282, 1.637)
1.546
(1.358, 1.760)
<0.0011.575
(1.382, 1.796)
<0.0011.423
(1.229, 1.647)
<0.001
Non-cancer-related mortality1.627
(1.439, 1.840)
1.696
(1.489, 1.932)
<0.0011.709
(1.499, 1.948)
<0.0011.587
(1.370, 1.838)
<0.001
The results were obtained with Cox proportional hazards analysis and are given as HR with 95% Cl. Model 1: adjusted by age, gender, ethnicity, and poverty income ratio (PIR). Model 2: model 1 + adjusted by hypertension and BMI. Model 3: model 2 + adjusted by vitamin C, ALP, ALB, SCR, and NFS scores.
Disclaimer/Publisher’s Note: The statements, opinions and data contained in all publications are solely those of the individual author(s) and contributor(s) and not of MDPI and/or the editor(s). MDPI and/or the editor(s) disclaim responsibility for any injury to people or property resulting from any ideas, methods, instructions or products referred to in the content.

